An Optimized Cross-Slot Flow Geometry for Microfluidic ...
16
1 An Optimized Cross-Slot Flow Geometry for Microfluidic Extensional Rheometry Simon J Haward 1 , Mónica SN Oliveira 2 , Manuel A Alves 3 and Gareth H McKinley 1 1 Hatsopoulos Microfluids Laboratory, Department of Mechanical Engineering, Massachusetts Institute of Technology, Cambridge, MA 02139, USA 2 Department of Mechanical and Aerospace Engineering, University of Strathclyde, Glasgow G1 1XJ, United Kingdom 3 Faculdade de Engenharia da Universidade do Porto, Centro de Estudos de Fenómenos de Transporte, Rua Dr. Roberto Frias, 4200-465, Porto, Portugal Abstract: A precision-machined cross-slot flow geometry with a shape that has been optimized by numerical simulation of the fluid kinematics is fabricated and used to measure the extensional viscosity of a dilute polymer solution. Full-field birefringence microscopy is used to monitor the evolution and growth of macromolecular anisotropy along the stagnation point streamline, and we observe the formation of a strong and uniform birefringent strand when the dimensionless flow strength exceeds a critical Weissenberg number, Wi ≈ 0.5. Birefringence and bulk pressure drop measurements provide self-consistent estimates of the planar extensional viscosity of the fluid over a wide range of deformation rates -1 -1 (26 s 435 s ) ε ≤ ≤ and are also in close agreement with numerical simulations performed using a finitely extensible non-linear elastic (FENE) dumbbell model. PACS numbers: 47.57.Qk, 83.85.Rx, 47.80.Jk, 78.20.hb
Transcript of An Optimized Cross-Slot Flow Geometry for Microfluidic ...

1
An Optimized Cross-Slot Flow Geometry for Microfluidic Extensional Rheometry
Simon J Haward1, Mónica SN Oliveira2, Manuel A Alves3 and Gareth H McKinley1
1 Hatsopoulos Microfluids Laboratory, Department of Mechanical Engineering, Massachusetts
Institute of Technology, Cambridge, MA 02139, USA
2 Department of Mechanical and Aerospace Engineering, University of Strathclyde, Glasgow
G1 1XJ, United Kingdom
3 Faculdade de Engenharia da Universidade do Porto, Centro de Estudos de Fenómenos de
Transporte, Rua Dr. Roberto Frias, 4200-465, Porto, Portugal
Abstract: A precision-machined cross-slot flow geometry with a shape that has been optimized
by numerical simulation of the fluid kinematics is fabricated and used to measure the extensional
viscosity of a dilute polymer solution. Full-field birefringence microscopy is used to monitor the
evolution and growth of macromolecular anisotropy along the stagnation point streamline, and
we observe the formation of a strong and uniform birefringent strand when the dimensionless
flow strength exceeds a critical Weissenberg number, Wi ≈ 0.5. Birefringence and bulk pressure
drop measurements provide self-consistent estimates of the planar extensional viscosity of the
fluid over a wide range of deformation rates -1 -1(26 s 435 s )ε≤ ≤ and are also in close
agreement with numerical simulations performed using a finitely extensible non-linear elastic
(FENE) dumbbell model.
PACS numbers: 47.57.Qk, 83.85.Rx, 47.80.Jk, 78.20.hb

2
Since its first use in the study of drag-reducing polymer solutions [1], the cross-slot
device has played a central role in enhancing our understanding of macromolecular dynamics
and non-linear effects in complex fluids undergoing strongly extensional flows [2-4]. Cross-slot
flow geometries consist of perpendicular, bisecting channels with opposing inlets and outlets
(half-width H), Fig. 1(a). The symmetry of the flow field results in a stagnation point at the
center of the cross (defined as the coordinate origin). At this singular hyperbolic point, the flow
velocity is zero but the velocity gradient is finite, and an elongational flow is generated along the
streamlines flowing outwards along the x-direction. In polymer solutions, macromolecules
become trapped at the stagnation point for (in principle) infinite time and can accumulate
significant macromolecular strain provided the velocity gradient (ε ) exceeds one-half of the
relaxation rate (1 2λ ) of the polymer [5, 6], such that the Weissenberg number, Wi 0.5ελ= > .
Such behavior has been confirmed in stagnation point flow experiments involving both point-
wise birefringence measurements [2, 7] and direct observations of unraveling fluorescently-
labeled DNA [3, 8, 9]. Perhaps the most important consequence of the stretching of polymer
molecules in extensional flows is the associated non-linear increase in the tensile stress
difference ( xx yyτ τ− ) or equivalently in the extensional viscosity ( ( )E xx yyη τ τ ε= − ), which has
applications ranging from enhanced oil recovery [10, 11] to turbulent drag reduction [12, 13]. In
the cross-slot device the extensional viscosity enhancement is manifested as an excess pressure
drop across the geometry, which suggests the potential of such devices as extensional rheometers
for complex fluids [14]. However, in traditional cross-slot devices the extension rate is only
well-defined at the stagnation point itself and decays rapidly with distance along the flow axes
[15]. To circumvent this limitation, Alves [16] proposed a numerical method to design an
optimized cross-slot geometry that would result in a constant, homogeneous extension rate along
3
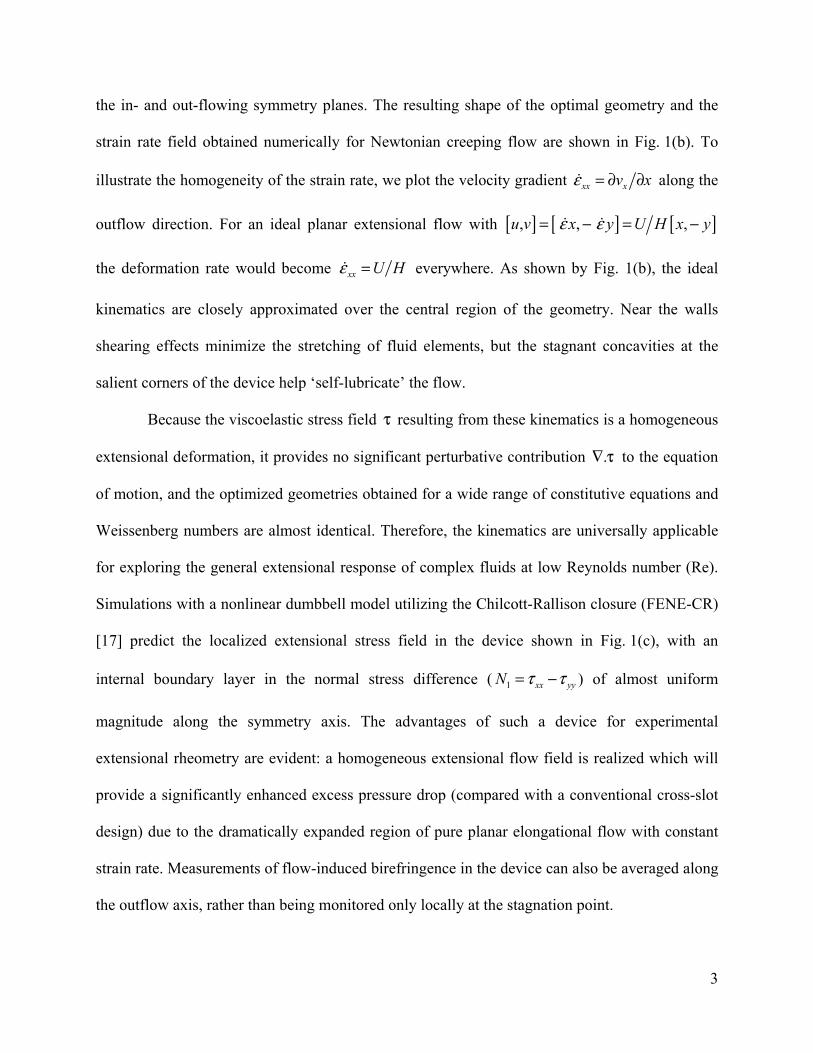
the in- and out-flowing symmetry planes. The resulting shape of the optimal geometry and the
strain rate field obtained numerically for Newtonian creeping flow are shown in Fig. 1(b). To
illustrate the homogeneity of the strain rate, we plot the velocity gradient xx xv xε = ∂ ∂ along the
outflow direction. For an ideal planar extensional flow with [ ] [ ] [ ] , , ,u v x y U H x yε ε= − = −
the deformation rate would become xx U Hε = everywhere. As shown by Fig. 1(b), the ideal
kinematics are closely approximated over the central region of the geometry. Near the walls
shearing effects minimize the stretching of fluid elements, but the stagnant concavities at the
salient corners of the device help ‘self-lubricate’ the flow.
Because the viscoelastic stress field τ resulting from these kinematics is a homogeneous
extensional deformation, it provides no significant perturbative contribution .∇ τ to the equation
of motion, and the optimized geometries obtained for a wide range of constitutive equations and
Weissenberg numbers are almost identical. Therefore, the kinematics are universally applicable
for exploring the general extensional response of complex fluids at low Reynolds number (Re).
Simulations with a nonlinear dumbbell model utilizing the Chilcott-Rallison closure (FENE-CR)
[17] predict the localized extensional stress field in the device shown in Fig. 1(c), with an
internal boundary layer in the normal stress difference ( 1 xx yyN τ τ= − ) of almost uniform
magnitude along the symmetry axis. The advantages of such a device for experimental
extensional rheometry are evident: a homogeneous extensional flow field is realized which will
provide a significantly enhanced excess pressure drop (compared with a conventional cross-slot
design) due to the dramatically expanded region of pure planar elongational flow with constant
strain rate. Measurements of flow-induced birefringence in the device can also be averaged along
the outflow axis, rather than being monitored only locally at the stagnation point.

4
In this Letter, we describe the fabrication of an Optimized Shape Cross-slot Extensional
Rheometer (OSCER, see Fig. 1(d)) and its application to test the steady extensional response of a
dilute flexible polymer solution over a wide range of extension rates. The device imposes the
optimized flow field determined from numerical calculation and provides spatially-resolved
flow-induced birefringence and global pressure drop data that are used to compute self-consistent
estimates of the extensional viscosity of the fluid. The experimental results are in quantitative
agreement with the predictions of the FENE-CR model.
The device shown in Fig. 1(d) is fabricated from stainless steel by the technique of wire-
electrical discharge machining. The inlet and outlet channels are initially parallel (half-width
H = 100 μm) over a distance of 1.4 mm (14H) in the up- and downstream sections. The
optimized shape is located over the central 3 mm of the device (15H either side of the stagnation
point). The device has a depth of d = 2.10 mm (aspect ratio, α = 10.5), hence the flow is
approximately 2D. The flexible, linear polymer is a high molecular weight poly(ethylene oxide)
(PEO, MW = 1 MDa) dissolved to a concentration c = 0.05 wt% in 66 wt% aqueous glycerol
(solvent viscosity sη = 0.0129 Pa s at 25°C). The PEO solution has a low-shear rate viscosity of
η = 0.0141 Pa s which remains almost constant up to shear rates γ > 2500 s-1. The intrinsic
viscosity of the PEO solution was calculated to be [ ]η ≈ 370 mL g-1 [18], indicating an overlap
concentration of * 0.27 wt%c = . Hence the fluid is dilute (c/c* < 0.2). The PEO radius of
gyration is gR ≈ 53 nm, and the equilibrium end-end distance, 1 22
0 6 129 nmgr R= ≈ . The
repeat unit mass of 42 Da and length of 0.278 nm [19], defines the contour length of CL ≈
6.6 μm, hence the maximum attainable macromolecular strain is 1 22
0 50CL L r= ≈ . The
relaxation time of the fluid is λ = 6.5 ms, determined using capillary breakup extensional

5
rheometry (CaBER) [20]. The computed extensibility parameter (L2 = 2500) and measured
relaxation time were used in the FENE-CR simulations along with the solvent viscosity ( sη ) and
the polymer viscosity contribution, p sη η η= − = 0.0012 Pa s. We define the Reynolds number
Re 2= UHρ η , where the fluid density ρ = 1157 kg m-3 and 2UH is the flow rate per unit depth
in the upstream and downstream parallel sections of channel.
In Fig. 2 we quantify the flow field within the OSCER device by performing particle
image velocimetry (PIV) on fluid seeded with 1 μm diameter fluorescent tracer particles. At
moderate flow rates, Fig. 2(a), the dilute PEO solution exhibits a highly symmetric and
Newtonian-like flow field, with circular regions of constant velocity around a central stagnation
point. As the flow rate is increased above the coil-stretch transition, Fig. 2(b), the stagnation
region becomes elongated along the x-direction and the outflow velocity profile ( )xv y becomes
weakly non-monotonic near the exit channels. Such non-monotonic flow profiles can be
reproduced numerically by treating an elastic birefringent strand located along the outflow axis
as an internal stress boundary layer within the flow field [21]. Plotting the PIV data for ( )xv x ,
measured along the y = 0 axis, illustrates the linearity of the flow velocity (Fig. 2(c)) and the
constancy of the extension rate ( )xx xv xε = ∂ ∂ for x < 1.5 mm. At low flow rates the velocity
profile closely matches the Newtonian result (as well as the numerical prediction, not shown).
For x > 1.5 mm the normalized velocity xv U ≈ 1.6, as expected for Poiseuille flow of a
constant viscosity fluid in a rectangular channel with α = 10.5. Fig. 2(d) shows the velocity
gradient (ε ) measured along the outflow axis for the viscoelastic PEO solution over a range of
flow rates, compared with the Newtonian result. The Newtonian velocity gradient increases
linearly with flow rate ( 1066Uε ≈ , with U in m s-1), as expected for this optimized geometrical

6
configuration. For the dilute PEO solution at low flow rates, ε follows the Newtonian trend;
however, above the coil-stretch transition the perturbation of the velocity field due to the elastic
tensile stresses in the stretching fluid elements results in a weak decrease of the expected strain
rate, which is well described as 2.11066 528U Uε ≈ − .
The modification of the flow field along the outflowing symmetry axis results from the
orientation and stretching of polymer molecules in the high velocity gradient. Consequently
flow-induced optical anisotropy (birefringence) develops, as shown in Fig. 3(a)-(d) for a range of
extension rates. The experiments are performed using a polarizing microscope (ABRIO, CRi
Inc.) to measure the point-wise retardation R(x,y) with a spatial resolution of approximately
2 μm/pixel. The retardation is related to the birefringence ( nΔ ) by / 2
/ 2
dd
d
R n z−
= Δ∫ (or R d n= Δ ,
assuming two-dimensional flow). The birefringent elastic strands resulting from the localized
macromolecular orientation generate high tensile stress differences and cause an increase in the
local extensional viscosity of the fluid. This feeds back on the flow field, causing the reduction in
the local flow velocity and modifying the local velocity gradient [7, 21], as noted in the PIV
experiments described above. In fluids of sufficient elasticity, flow modification effects can lead
to the onset of purely-elastic flow asymmetries [4, 22, 23].
The variation in the measured retardance along the x = 0 axis, Fig. 3(e), shows the
extreme localization of stretching along the outflow axis. The localization results from the high
strains and extension rates that are required to substantially stretch the flexible macromolecules.
Such conditions are only realized along streamlines that pass very close to the stagnation point,
where the residence time is maximal. The full-width at half-maximum of the strands scales with
Wi in the form predicted by Becherer et al. [24] (Fig. 3(e), insert). The intensity of the retardance

7
along the lengths of the strands remains essentially constant across the entire field of view in x
(Fig. 3(f)). In Fig. 3(g) we plot the intensity of the birefringence measured on the y = 0 axis as a
function of ε , showing the standard deviation as error bars. The birefringence (Δn) first becomes
measurable at ε ≈ 100 s-1 and then increases approximately linearly with ε . The birefringence
can be related to the viscoelastic tensile stress difference in the stretching fluid through the
stress-optical rule, n C τΔ = Δ , where C is the stress-optical coefficient. Using an experimentally
determined value of C = 0.44 × 10⁻⁹ Pa-1 (see discussion below) to convert from computed
normal stress difference to birefringence, the FENE-CR model accurately predicts the
birefringence in the PEO solution (reduced chi-squared value, 2 0.83redχ = ).
The measured birefringence can also be used to estimate the average extension ratio of
the PEO chains 1 22
Cr Lβ = , where 1 22r is the ensemble-average end-end distance at a
given extension rate. The model of Treloar relates the birefringence to the extension ratio
through an approximation to the inverse Langevin function [25]. As shown by the insert in
Fig. 3(g), the ensemble-average extension ratio first increases at Wi 0.5crit ≈ and rises
monotonically to β ≈ 0.3 at Wi ≈ 2.8. Numerical simulations and previous stagnation point
experiments at low Re (e.g. [3, 7]) suggest that β would continue to increase beyond this value
if the extension rate (or Wi) were increased further. However, for this low viscosity aqueous
solution, further increases in flow rate result in an inertio-elastic instability
(Re 7.7, Wi 2.8)crit crit≈ ≈ that distorts the birefringent strand. The corresponding critical value of
the strain rate critε could be extended by increasing the solvent viscosity of the test fluid or by
reducing the characteristic dimension, H.

8
In Fig. 4, we evaluate the steady-state extensional viscosity of the dilute PEO test
solution using both bulk pressure drop measurements and local birefringence data obtained in the
OSCER device. The pressure drop is evaluated in two steps, see Fig. 4(a). The first measurement
( totalPΔ ) is obtained with flow into both opposing inlets and out of both opposing outlets, so that
the stagnation point is present and a birefringent strand is formed. Subsequently, valves are shut
on one of the inlets and one of the outlets and the pressure drop is measured for steady shearing
flow around one corner of the device ( shearPΔ ). Because of the homogeneity of the extensional
flow in this geometry, a simple subtraction allows a first order estimate of the extensional stress
carried by the stretching fluid, excess total shearP P PτΔ ≈ Δ = Δ − Δ . In the insert of Fig. 4(a) we show
excessPΔ as a function of ε . In Fig. 4(b), we present two measurements of the extensional
viscosity and the dimensionless Trouton ratio, Tr Eη η= , as a function of ε . The hollow circles
represent E excessPη ε= Δ determined from the bulk pressure drop data and the solid squares
represent E n Cη ε= Δ determined from the local birefringence measurements. The stress-optic
coefficient of C = 0.44 × 10⁻⁹ Pa-1 is found from a linear regression through the origin of the nΔ
versus excessPΔ plot (Fig. 4(b) insert). For this dilute polymer solution, we measure Trouton ratios
of Tr 400≈ at Wi 3≈ . The solid line in Fig. 4(b) shows the prediction of the FENE-CR model,
in excellent agreement with the experiments.
We have shown that computational optimization techniques can be used to design
idealized microfluidic flow geometries for applications in complex fluid rheometry. We
optimized the shape of the canonical cross-slot geometry in order to provide a nominally
constant extension rate over a greatly extended spatial domain (~30H) of the inlet and outlet
channels. The optimized kinematic design was confirmed using PIV measurements with a

9
Newtonian solvent and a dilute solution of flexible linear macromolecules. Extensional viscosity
results for a dilute PEO solution, based on both bulk pressure drop and local birefringence
measurements, are self-consistent and in excellent agreement with the predictions of a non-linear
elastic dumbbell model in which the molecular parameters are based directly on the measured
viscometric properties and the known chain characteristics of PEO. This is the first time that a
microfluidic rheometric device has been fully designed using computational optimization tools,
and the performance has subsequently been validated experimentally. The homogeneity of the
extensional flow field obtained in the OSCER device offers tremendous potential as the basis for
the next generation of cross-slot geometries for measuring the true extensional rheology of
complex fluids over a wide range of deformation rates.
Acknowledgements: SJH and GHM gratefully acknowledge NASA Microgravity Fluid
Sciences (Code UG) for support of this research under grant NNX09AV99G. MSNO and MAA
acknowledge the financial support from Fundação para a Ciência e a Tecnologia, FEDER and
COMPETE through project PTDC/EQU-FTT/118716/2010.

10
References
[1] O. Scrivener, C. Berner, R. Cressely, R. Hocquart, R. Sellin, and N.S. Vlachos, J. Non-Newtonian Fluid Mech. 5, 475 (1979).
[2] J.A. Odell and A. Keller, J. Polym. Sci. Pol. Phys. 24, 1889 (1986).
[3] T.T. Perkins, D.E. Smith, and S. Chu, Science 276, 2016 (1997).
[4] P.E. Arratia, C.C. Thomas, J. Diorio, and J.P. Gollub, Phys. Rev. Lett. 96, 144502 (2006).
[5] P.G. De Gennes, J. Chem. Phys. 60, 5030 (1974).
[6] R.G. Larson and J.J. Magda, Macromolecules 22, 3004 (1989).
[7] S.J. Haward, J.A. Odell, Z. Li, and X.-F. Yuan, Rheol. Acta 49, 633 (2010).
[8] C.M. Schroeder, H.P. Babcock, E.S.G. Shaqfeh, and S. Chu, Science 301, 1515 (2003).
[9] D.E. Smith and S. Chu, Science 281, 1335 (1998).
[10] D.F. James and J.H. Saringer, J. Fluid Mech. 97, 655 (1980).
[11] V. Yamakov and A. Milchev, Phys. Rev. E 56, 7043 (1997).
[12] J.K. Bhattacharjee and D. Thirumalai, Phys. Rev. Lett. 67, 196 (1991).
[13] A. Roy, A. Morozov, W. van Saarloos, and R.G. Larson, Phys. Rev. Lett. 97, 234501 (2006).
[14] J.A. Odell and S.P. Carrington, J. Non-Newtonian Fluid Mech. 137, 110 (2006).
[15] S.J. Haward, T.J. Ober, M.S.N. Oliveira, M.A. Alves, and G.H. McKinley, Soft Matter 8, 536 (2012)
[16] M.A. Alves, in The XVth International Congress on Rheology, edited by L.G. Leal, R.H. Colby, and A.J. Giacomin (American Institute of Physics, Monterey, 2008).
[17] M.D. Chilcott and J.M. Rallison, J. Non-Newtonian Fluid Mech. 29, 381 (1988).
[18] L.E. Rodd, J.J. Cooper-White, D.V. Boger, and G.H. McKinley, J. Non-Newtonian Fluid Mech. 143, 170 (2007).
[19] H. Tadokoro, Structure of Crystalline Polymers (Robert E. Krieger Pub. Co., Malabar, FL, 1990).
[20] S.L. Anna and G.H. McKinley, J. Rheol. 45, 115 (2001).

11
[21] O.G. Harlen, J.M. Rallison, and M.D. Chilcott, J. Non-Newtonian Fluid Mech. 34, 319 (1990).
[22] R.J. Poole, M.A. Alves, and P.J. Oliveira, Phys. Rev. Lett. 99, 164503 (2007).
[23] S.J. Haward and G.H. McKinley, Phys. Rev. E 85, 031502 (2012).
[24] P. Becherer, A.N. Morozov, and W. van Saarloos, J. Non-Newtonian Fluid Mech. 153, 183 (2008).
[25] L.K.G. Treloar, The Physics of Rubber Elasticity (Clarendon Press, Oxford, 1975).

12
FIGURE CAPTIONS
FIG 1. (a) Schematic representation of a cross-slot geometry, showing the coordinate
system and characteristic dimension (H). (b) Strain rate field for numerically simulated
Newtonian creeping flow in the optimized cross-slot geometry. (c) Computed normal stress
difference, N1(x,y), for flow of a FENE-CR fluid in the optimized geometry at ε = 400 s-1. (d)
Optical micrograph of the OSCER geometry. The ideal profile obtained by numerical
optimization is superimposed in green.
FIG 2. (a) Experimentally measured velocity field (with superimposed streamlines) for a
dilute PEO solution in the OSCER at a superficial flow velocity U = 0.08 m s-1, Wi = 0.56. (b)
Velocity field for flow of the same PEO solution at U = 0.4 m s -1, Wi = 2.25. (c) Dimensionless
measured velocity profiles along the y = 0 (outflow) axis for the dilute PEO solution over a range
of flow rates, along with the Newtonian result. (d) Extension rate as a function of the flow
velocity in the OSCER for the dilute PEO solution, also showing the corresponding Newtonian
result for comparison.
FIG 3. (a)-(d) Birefringence images of the dilute PEO solution in the OSCER over a
range of flow rates. (e) Retardation profiles R(y) across the birefringent strands (along x = 0).
Insert shows the full-width at half-maximum as a function of Wi, fitted with an equation of the
form predicted by Becherer et al. [24]. (f) Intensity profiles along the length of the birefringent
strands (y = 0). (g) Peak birefringence intensity as a function of the extension rate, compared
with the prediction of the FENE-CR model. The insert shows the ensemble-averaged extension
ratio (β) as a function of Wi.
FIG 4. (a) Pressure drop measured in shear (ΔPshear) and extension (ΔPtotal) for flow of the
dilute PEO solution in the OSCER. The insert shows the excess pressure drop (ΔPexcess = ΔPtotal
- ΔPshear) as a function of ε . (b) Extensional viscosity and Trouton ratio as a function of ε ,
determined from both bulk excess pressure drop and local birefringence measurements and
compared with the prediction of the FENE-CR model. The insert plot shows Δn versus ΔPexcess,
used to determine the stress optical coefficient (C = 0.44 × 10⁻⁹ Pa-1).