An open data repository and a data processing software ...
9
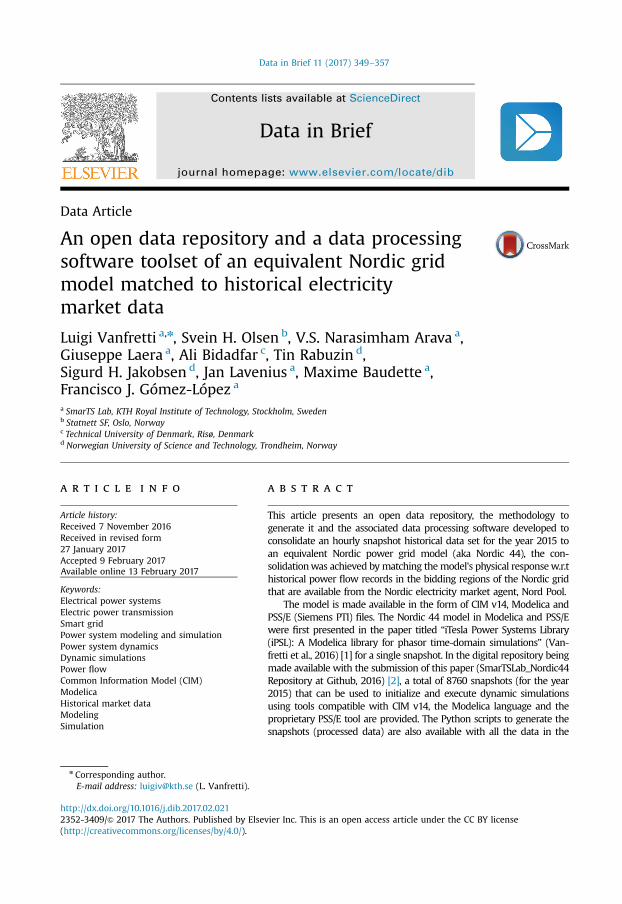
Data Article An open data repository and a data processing software toolset of an equivalent Nordic grid model matched to historical electricity market data Luigi Vanfretti a,n , Svein H. Olsen b , V.S. Narasimham Arava a , Giuseppe Laera a , Ali Bidadfar c , Tin Rabuzin d , Sigurd H. Jakobsen d , Jan Lavenius a , Maxime Baudette a , Francisco J. Gómez-López a a SmarTS Lab, KTH Royal Institute of Technology, Stockholm, Sweden b Statnett SF, Oslo, Norway c Technical University of Denmark, Risø, Denmark d Norwegian University of Science and Technology, Trondheim, Norway article info Article history: Received 7 November 2016 Received in revised form 27 January 2017 Accepted 9 February 2017 Available online 13 February 2017 Keywords: Electrical power systems Electric power transmission Smart grid Power system modeling and simulation Power system dynamics Dynamic simulations Power flow Common Information Model (CIM) Modelica Historical market data Modeling Simulation abstract This article presents an open data repository, the methodology to generate it and the associated data processing software developed to consolidate an hourly snapshot historical data set for the year 2015 to an equivalent Nordic power grid model (aka Nordic 44), the con- solidation was achieved by matching the model's physical response w.r.t historical power flow records in the bidding regions of the Nordic grid that are available from the Nordic electricity market agent, Nord Pool. The model is made available in the form of CIM v14, Modelica and PSS/E (Siemens PTI) files. The Nordic 44 model in Modelica and PSS/E were first presented in the paper titled “iTesla Power Systems Library (iPSL): A Modelica library for phasor time-domain simulations” (Van- fretti et al., 2016) [1] for a single snapshot. In the digital repository being made available with the submission of this paper (SmarTSLab_Nordic44 Repository at Github, 2016) [2], a total of 8760 snapshots (for the year 2015) that can be used to initialize and execute dynamic simulations using tools compatible with CIM v14, the Modelica language and the proprietary PSS/E tool are provided. The Python scripts to generate the snapshots (processed data) are also available with all the data in the Contents lists available at ScienceDirect journal homepage: www.elsevier.com/locate/dib Data in Brief http://dx.doi.org/10.1016/j.dib.2017.02.021 2352-3409/& 2017 The Authors. Published by Elsevier Inc. This is an open access article under the CC BY license (http://creativecommons.org/licenses/by/4.0/). n Corresponding author. E-mail address: [email protected] (L. Vanfretti). Data in Brief 11 (2017) 349–357
Transcript of An open data repository and a data processing software ...
Contents lists available at ScienceDirect
Data in Brief
Data in Brief 11 (2017) 349–357
http://d2352-34(http://c
n CorrE-m
journal homepage: www.elsevier.com/locate/dib
Data Article
An open data repository and a data processingsoftware toolset of an equivalent Nordic gridmodel matched to historical electricitymarket data
Luigi Vanfretti a,n, Svein H. Olsen b, V.S. Narasimham Arava a,Giuseppe Laera a, Ali Bidadfar c, Tin Rabuzin d,Sigurd H. Jakobsen d, Jan Lavenius a, Maxime Baudette a,Francisco J. Gómez-López a
a SmarTS Lab, KTH Royal Institute of Technology, Stockholm, Swedenb Statnett SF, Oslo, Norwayc Technical University of Denmark, Risø, Denmarkd Norwegian University of Science and Technology, Trondheim, Norway
a r t i c l e i n f o
Article history:Received 7 November 2016Received in revised form27 January 2017Accepted 9 February 2017Available online 13 February 2017
Keywords:Electrical power systemsElectric power transmissionSmart gridPower system modeling and simulationPower system dynamicsDynamic simulationsPower flowCommon Information Model (CIM)ModelicaHistorical market dataModelingSimulation
x.doi.org/10.1016/j.dib.2017.02.02109/& 2017 The Authors. Published by Elsereativecommons.org/licenses/by/4.0/).
esponding author.ail address: [email protected] (L. Vanfretti).
a b s t r a c t
This article presents an open data repository, the methodology togenerate it and the associated data processing software developed toconsolidate an hourly snapshot historical data set for the year 2015 toan equivalent Nordic power grid model (aka Nordic 44), the con-solidationwas achieved bymatching themodel's physical responsew.r.thistorical power flow records in the bidding regions of the Nordic gridthat are available from the Nordic electricity market agent, Nord Pool.
The model is made available in the form of CIM v14, Modelica andPSS/E (Siemens PTI) files. The Nordic 44 model in Modelica and PSS/Ewere first presented in the paper titled “iTesla Power Systems Library(iPSL): A Modelica library for phasor time-domain simulations” (Van-fretti et al., 2016) [1] for a single snapshot. In the digital repository beingmade available with the submission of this paper (SmarTSLab_Nordic44Repository at Github, 2016) [2], a total of 8760 snapshots (for the year2015) that can be used to initialize and execute dynamic simulationsusing tools compatible with CIM v14, the Modelica language and theproprietary PSS/E tool are provided. The Python scripts to generate thesnapshots (processed data) are also available with all the data in the
vier Inc. This is an open access article under the CC BY license
SM
TH
DE
E
D
D
L. Vanfretti et al. / Data in Brief 11 (2017) 349–357350
GitHub repository (SmarTSLab_Nordic44 Repository at Github, 2016) [2].This Nordic 44 equivalent model was also used in iTesla project
(iTesla) [3] to carry out simulations within a dynamic security assess-ment toolset (iTesla, 2016) [4], and has been further enhanced duringthe ITEA3 OpenCPS project (iTEA3) [5]. The raw, processed data andoutput models utilized within the iTesla platform (iTesla, 2016) [4] arealso available in the repository. The CIM and Modelica snapshots of the“Nordic 44”model for the year 2015 are available in a Zenodo repository.& 2017 The Authors. Published by Elsevier Inc. This is an open access
article under the CC BY license(http://creativecommons.org/licenses/by/4.0/).
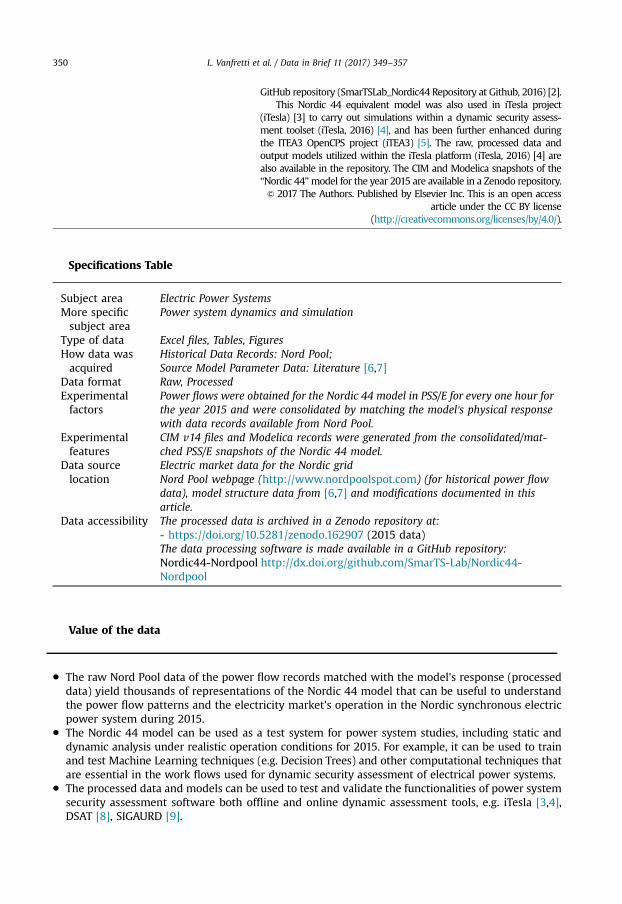
Specifications Table
ubject area
Electric Power Systems ore specificsubject areaPower system dynamics and simulation
ype of data
Excel files, Tables, Figures ow data wasacquiredHistorical Data Records: Nord Pool;Source Model Parameter Data: Literature [6,7]
ata format
Raw, Processed xperimentalfactorsPower flows were obtained for the Nordic 44 model in PSS/E for every one hour forthe year 2015 and were consolidated by matching the model's physical responsewith data records available from Nord Pool.
xperimentalfeatures
CIM v14 files and Modelica records were generated from the consolidated/mat-ched PSS/E snapshots of the Nordic 44 model.
ata sourcelocation
Electric market data for the Nordic gridNord Pool webpage (http://www.nordpoolspot.com) (for historical power flowdata), model structure data from [6,7] and modifications documented in thisarticle.
ata accessibility
The processed data is archived in a Zenodo repository at:- https://doi.org/10.5281/zenodo.162907 (2015 data)The data processing software is made available in a GitHub repository:Nordic44-Nordpool http://dx.doi.org/github.com/SmarTS-Lab/Nordic44-NordpoolValue of the data
� The raw Nord Pool data of the power flow records matched with the model's response (processeddata) yield thousands of representations of the Nordic 44 model that can be useful to understandthe power flow patterns and the electricity market's operation in the Nordic synchronous electricpower system during 2015.
� The Nordic 44 model can be used as a test system for power system studies, including static anddynamic analysis under realistic operation conditions for 2015. For example, it can be used to trainand test Machine Learning techniques (e.g. Decision Trees) and other computational techniques thatare essential in the work flows used for dynamic security assessment of electrical power systems.
� The processed data and models can be used to test and validate the functionalities of power systemsecurity assessment software both offline and online dynamic assessment tools, e.g. iTesla [3,4],DSAT [8], SIGAURD [9].

L. Vanfretti et al. / Data in Brief 11 (2017) 349–357 351
� The data provided using the CIM v14 standard can be used to test the functional layer of appli-cations in Smart Grid Architectures and most importantly, to quantitatively assess the interoper-ability of power system simulation tools that adopt CIM.
� The data and models provided in Modelica can be used with any Modelica compliant software toolto perform power system dynamic simulations and studies. When using OpenModelica [10], thisprovides researchers with a fully open source software environment for dynamic simulation.
1. Data
1.1. Matching historical market data
Raw data from Nord Pool was consolidated with a physical model representation of the Nordic gridby matching the measurement records to the model's power flow results (processed data). This hasresulted in thousands of representations of the “Nordic 44” model for the year 2015 that are madeavailable in the GitHub repository with the submission of this article.
These snapshots are provided in the form of CIM v14, Modelica and PSS/E (Siemens PTI) files. ThePython scripts (i.e. software toolset) used to generate these snapshots (CIM v14, Modelica and PSS/E)are also made available in the repository.
1.2. Historical market data
The pre-processed (raw) data was downloaded from Nord Pool webpage. For each hour, therecords contain the active power production and consumption data in the bidding regions of theNordic grid and the active power exchange between them. These records were matched to an elec-trical grid model steady-state response, as explained next.
Fig. 1. SmarTS Lab Nordic 44 Equivalent Model Mapped to the bidding zones of the Nordic grid used in Nord Pool for 2015.

L. Vanfretti et al. / Data in Brief 11 (2017) 349–357352
1.3. Model parameter and structure data
To match and consolidate the historical market data to a physical description of the power network, theNordic 44 model was developed. Note that the aim here was to set a “base case”, from which multiplesnapshots of actual measurements records could be mapped to the quantitative response from computa-tions on a physical model of the grid that included both steady-state and dynamic analysis features.
The development of this source model/“data” consisted of (a) obtaining editable files in the PSS/E formto, (b) extend the model to represent better the Norwegian portions of the Nordic grid and to adapt it tomodeling limitations in both the iTesla platform and the iPSL library (i.e. lack of HVDC link models).
Step (a) used source files which was stripped from user defined models and other equipment, andother additional modifications carried out by Emil Hillberg of STRI on behalf of Statnett SF. Theresulting model of this step is archived in Models.zip in respective Zenodo repositories.Note that the starting model is an extension itself of the Nordic 23 bus model developed at SINTEFEnergy Research in several steps [6]. The Nordic 23 bus model was developed from a 15 bus Nordicpower system model developed at NTNU and the details of this model are explained in [7].Step (b) included the assignment of bus bar names, grouping of busses according to the actualbidding region, and numerous other changes as described in the documentation available in./…/SmarTSLab_Nordic44/00_Documentation/N44_changes.docx.
The model developed in Step (b) is used throughout the historical data matching and consolidationprocess to create snapshots of the actual operational conditions of the Nordic Grid for 2015. This base casecan be found in the repository in the GitHub repository at./nordic44/models/ and archived in Models.zip inrespective Zenodo repositories.
2. Experimental design, materials and methods
2.1. Pre-processed data
The pre-processed (raw) data was downloaded from Nord Pool webpage as MS-Excel files (Con-sumption_xx.xlsx, Exchange_xx.xlsx, and Production_xx.xlsx) were saved in a folder with
Fig. 2. Matching and consolidation of historical data with the Nordic 44 grid model.

L. Vanfretti et al. / Data in Brief 11 (2017) 349–357 353
corresponding date (e.g. N44_20150401 refers to the folder containing the hourly snapshots of the 1st
April 2015). The MS-Excel files (Production_xx.xlsx and Consumption_xx.xlsx) contain the activepower production and consumption data in the bidding regions of the Nordic grid for every hour asshown in Fig. 1. The MS-Excel file (Exchange_xx.xlsx) contains the active power exchange databetween the bidding regions of the Nordic grid for every hour. Now, the toolset was updated toautomatically download the data from the Nord Pool ftp server, inspired by the work in [11]. The rawdata is stored in a Python dictionary allowing for easy data manipulation in Python and integrationwith PSS/e through psspy. It is still possible to save the data to excel and to load in excel files to thedictionary ensuring both forward and backward compatibility.
2.2. Data processing method
For each hour, an equivalent Nordic power system model (Nordic 44) was created, matched andconsolidated with the load generation balance in the bidding regions and the active power exchangebetween the bidding regions. The buses in the Nordic 44 model were named according to the closestcity or town corresponding to both the geographical location and the detailed grid structure availableto Statnett SF. The work flow used to create the PSS/E snapshots is shown below in Fig. 2.
The major steps of the data processing workflow include:
(1) The raw data for the year 2015 was downloaded from Nord Pool (http://www.nordpoolspot.com)to MS-Excel files through manual queries to the Nord Pool database. This procedure wasautomated by implementing a Python class for connecting to the Nord Pool ftp server andhandling the Nord Pool data. An example on how to use the Python code to generate the cases is
Fig. 3. Screenshot of the MS-Excel file PSSE_in_out.xlsx.
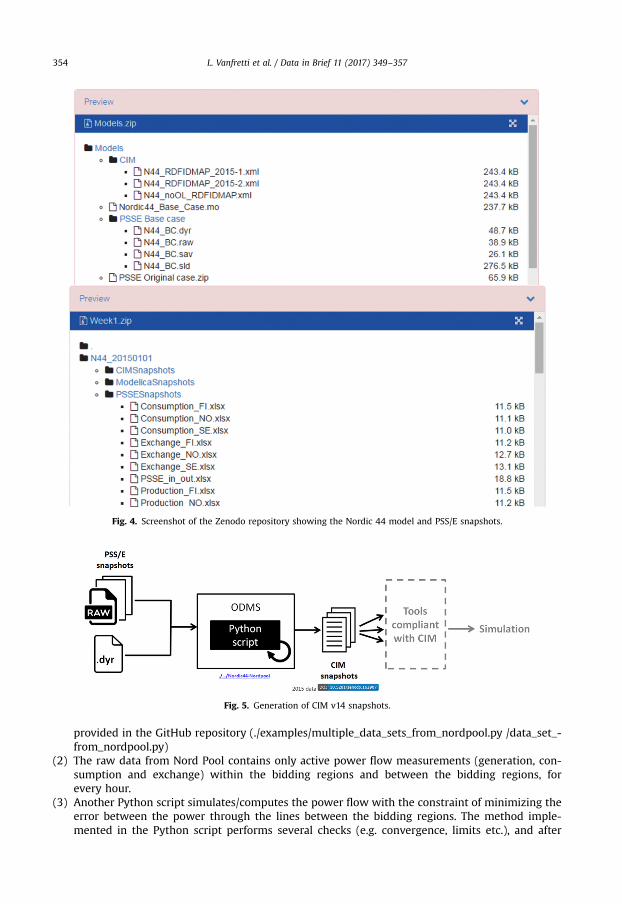
Fig. 4. Screenshot of the Zenodo repository showing the Nordic 44 model and PSS/E snapshots.
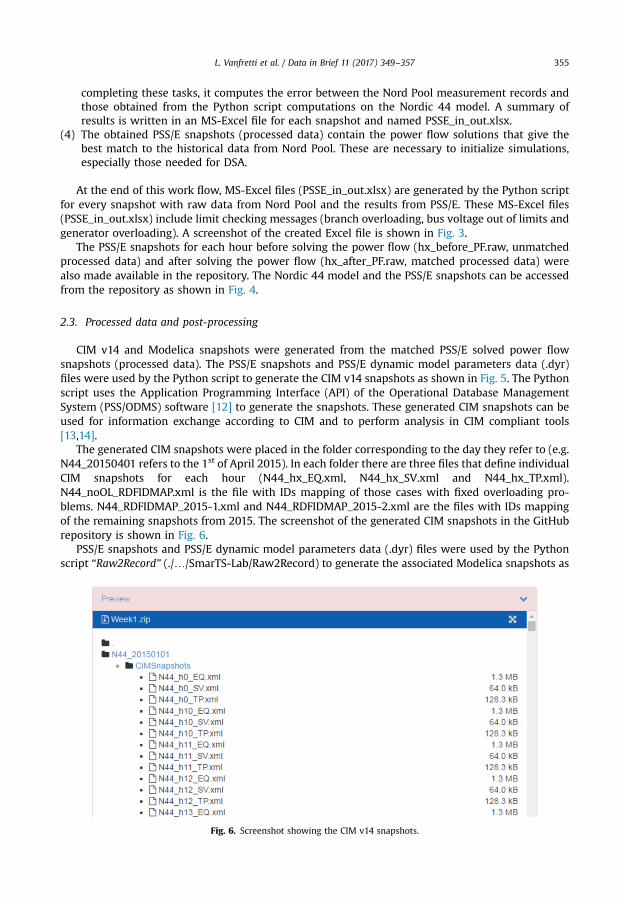
Fig. 5. Generation of CIM v14 snapshots.
L. Vanfretti et al. / Data in Brief 11 (2017) 349–357354
provided in the GitHub repository (./examples/multiple_data_sets_from_nordpool.py /data_set_-from_nordpool.py)
(2) The raw data from Nord Pool contains only active power flow measurements (generation, con-sumption and exchange) within the bidding regions and between the bidding regions, forevery hour.
(3) Another Python script simulates/computes the power flow with the constraint of minimizing theerror between the power through the lines between the bidding regions. The method imple-mented in the Python script performs several checks (e.g. convergence, limits etc.), and after
L. Vanfretti et al. / Data in Brief 11 (2017) 349–357 355
completing these tasks, it computes the error between the Nord Pool measurement records andthose obtained from the Python script computations on the Nordic 44 model. A summary ofresults is written in an MS-Excel file for each snapshot and named PSSE_in_out.xlsx.
(4) The obtained PSS/E snapshots (processed data) contain the power flow solutions that give thebest match to the historical data from Nord Pool. These are necessary to initialize simulations,especially those needed for DSA.
At the end of this work flow, MS-Excel files (PSSE_in_out.xlsx) are generated by the Python scriptfor every snapshot with raw data from Nord Pool and the results from PSS/E. These MS-Excel files(PSSE_in_out.xlsx) include limit checking messages (branch overloading, bus voltage out of limits andgenerator overloading). A screenshot of the created Excel file is shown in Fig. 3.
The PSS/E snapshots for each hour before solving the power flow (hx_before_PF.raw, unmatchedprocessed data) and after solving the power flow (hx_after_PF.raw, matched processed data) werealso made available in the repository. The Nordic 44 model and the PSS/E snapshots can be accessedfrom the repository as shown in Fig. 4.
2.3. Processed data and post-processing
CIM v14 and Modelica snapshots were generated from the matched PSS/E solved power flowsnapshots (processed data). The PSS/E snapshots and PSS/E dynamic model parameters data (.dyr)files were used by the Python script to generate the CIM v14 snapshots as shown in Fig. 5. The Pythonscript uses the Application Programming Interface (API) of the Operational Database ManagementSystem (PSS/ODMS) software [12] to generate the snapshots. These generated CIM snapshots can beused for information exchange according to CIM and to perform analysis in CIM compliant tools[13,14].
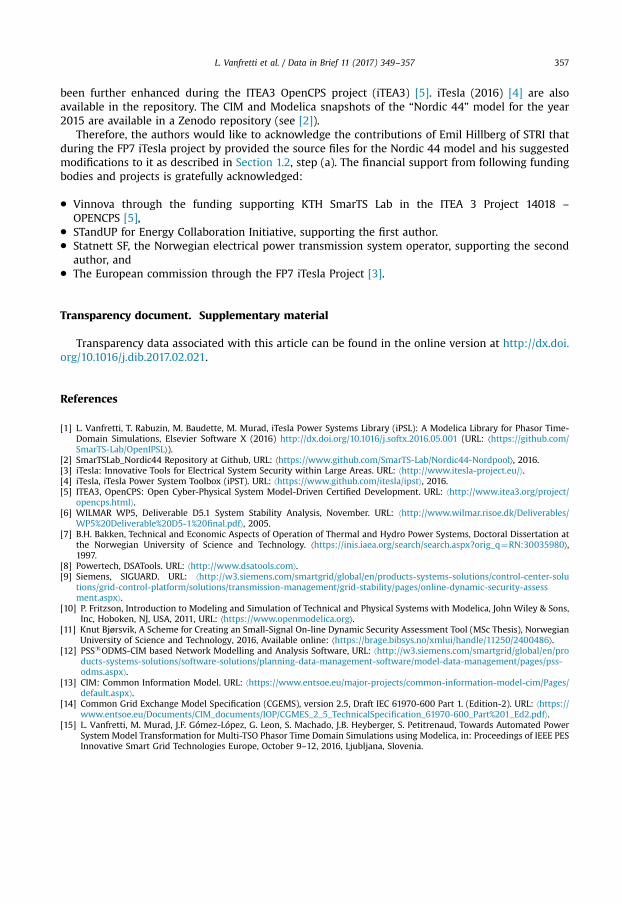
The generated CIM snapshots were placed in the folder corresponding to the day they refer to (e.g.N44_20150401 refers to the 1st of April 2015). In each folder there are three files that define individualCIM snapshots for each hour (N44_hx_EQ.xml, N44_hx_SV.xml and N44_hx_TP.xml).N44_noOL_RDFIDMAP.xml is the file with IDs mapping of those cases with fixed overloading pro-blems. N44_RDFIDMAP_2015-1.xml and N44_RDFIDMAP_2015-2.xml are the files with IDs mappingof the remaining snapshots from 2015. The screenshot of the generated CIM snapshots in the GitHubrepository is shown in Fig. 6.
PSS/E snapshots and PSS/E dynamic model parameters data (.dyr) files were used by the Pythonscript “Raw2Record” (./…/SmarTS-Lab/Raw2Record) to generate the associated Modelica snapshots as
Fig. 6. Screenshot showing the CIM v14 snapshots.

Fig. 7. Generating Modelica snapshots.
Fig. 8. Screenshot to access Modelica snapshots.
L. Vanfretti et al. / Data in Brief 11 (2017) 349–357356
shown in Fig. 7. These generated Modelica snapshots together with the OpenIPSL library can be usedfor simulation in the Modelica compliant tools. The generation of the record files using the pythonscript is illustrated with an example (./examples/multiple_data_sets_from_nordpool.py /data_set_-from_nordpool.py) and is provided in the GitHub repository.
During the iTesla project, another methodology to generate Modelica model snapshots using theiTesla platform [3] was attempted. Note that these snapshots were created using a different meth-odology reported in [15]. The resulting snapshots available for this approach cover only from April 1,2015 to July 31, 2015 and are archived in iTesla_Platform.zip in the Zenodo repository. This archivecontains both the snapshot models together with the appropriate version of the iPSL library.
The data records are stored in the /ModelicaSnapshots/ sub-folder of the Zenodo archive. Theyrequire the Modelica model that was manually implemented for Nordic 44 reported in [1] with therecord structures corresponding to the PSS/E snapshots. The Python script (“torecord”) used togenerate Modelica snapshots from PSS/E snapshots as described in Fig. 7. The OpenIPSL library usedin generation of these snapshots can be found in./…/SmarTS-Lab/OpenIPSL (Fig. 8).
The CIM and Modelica snapshots (processed data) of the “Nordic 44” model for the year 2015 areavailable the aforementioned Zenodo repository (see [2]).
Acknowledgements
The Nordic44 data and model reported in this paper were used in the iTesla project (iTesla) [3] tocarry out simulations within a dynamic security assessment toolset (iTesla, 2016) [4]. The raw, pro-cessed data and output models utilized within the iTesla platform [4]. The Modelica modeling has
L. Vanfretti et al. / Data in Brief 11 (2017) 349–357 357
been further enhanced during the ITEA3 OpenCPS project (iTEA3) [5]. iTesla (2016) [4] are alsoavailable in the repository. The CIM and Modelica snapshots of the “Nordic 44” model for the year2015 are available in a Zenodo repository (see [2]).
Therefore, the authors would like to acknowledge the contributions of Emil Hillberg of STRI thatduring the FP7 iTesla project by provided the source files for the Nordic 44 model and his suggestedmodifications to it as described in Section 1.2, step (a). The financial support from following fundingbodies and projects is gratefully acknowledged:
� Vinnova through the funding supporting KTH SmarTS Lab in the ITEA 3 Project 14018 –
OPENCPS [5],� STandUP for Energy Collaboration Initiative, supporting the first author.� Statnett SF, the Norwegian electrical power transmission system operator, supporting the second
author, and� The European commission through the FP7 iTesla Project [3].
Transparency document. Supplementary material
Transparency data associated with this article can be found in the online version at http://dx.doi.org/10.1016/j.dib.2017.02.021.
References
[1] L. Vanfretti, T. Rabuzin, M. Baudette, M. Murad, iTesla Power Systems Library (iPSL): A Modelica Library for Phasor Time-Domain Simulations, Elsevier Software X (2016) http://dx.doi.org/10.1016/j.softx.2016.05.001 (URL: ⟨https://github.com/SmarTS-Lab/OpenIPSL⟩).
[2] SmarTSLab_Nordic44 Repository at Github, URL: ⟨https://www.github.com/SmarTS-Lab/Nordic44-Nordpool⟩, 2016.[3] iTesla: Innovative Tools for Electrical System Security within Large Areas. URL: ⟨http://www.itesla-project.eu/⟩.[4] iTesla, iTesla Power System Toolbox (iPST). URL: ⟨https://www.github.com/itesla/ipst⟩, 2016.[5] ITEA3, OpenCPS: Open Cyber-Physical System Model-Driven Certified Development. URL: ⟨http://www.itea3.org/project/
opencps.html⟩.[6] WILMAR WP5, Deliverable D5.1 System Stability Analysis, November. URL: ⟨http://www.wilmar.risoe.dk/Deliverables/
WP5%20Deliverable%20D5-1%20final.pdf⟩, 2005.[7] B.H. Bakken, Technical and Economic Aspects of Operation of Thermal and Hydro Power Systems, Doctoral Dissertation at
the Norwegian University of Science and Technology. ⟨https://inis.iaea.org/search/search.aspx?orig_q¼RN:30035980⟩,1997.
[8] Powertech, DSATools. URL: ⟨http://www.dsatools.com⟩.[9] Siemens, SIGUARD. URL: ⟨http://w3.siemens.com/smartgrid/global/en/products-systems-solutions/control-center-solu
tions/grid-control-platform/solutions/transmission-management/grid-stability/pages/online-dynamic-security-assessment.aspx⟩.
[10] P. Fritzson, Introduction to Modeling and Simulation of Technical and Physical Systems with Modelica, John Wiley & Sons,Inc, Hoboken, NJ, USA, 2011, URL: ⟨https://www.openmodelica.org⟩.
[11] Knut Bjørsvik, A Scheme for Creating an Small-Signal On-line Dynamic Security Assessment Tool (MSc Thesis), NorwegianUniversity of Science and Technology, 2016, Available online: ⟨https://brage.bibsys.no/xmlui/handle/11250/2400486⟩.
[12] PSSsODMS-CIM based Network Modelling and Analysis Software, URL: ⟨http://w3.siemens.com/smartgrid/global/en/products-systems-solutions/software-solutions/planning-data-management-software/model-data-management/pages/pss-odms.aspx⟩.
[13] CIM: Common Information Model. URL: ⟨https://www.entsoe.eu/major-projects/common-information-model-cim/Pages/default.aspx⟩.
[14] Common Grid Exchange Model Specification (CGEMS), version 2.5, Draft IEC 61970-600 Part 1. (Edition-2). URL: ⟨https://www.entsoe.eu/Documents/CIM_documents/IOP/CGMES_2_5_TechnicalSpecification_61970-600_Part%201_Ed2.pdf⟩.
[15] L. Vanfretti, M. Murad, J.F. Gómez-López, G. Leon, S. Machado, J.B. Heyberger, S. Petitrenaud, Towards Automated PowerSystem Model Transformation for Multi-TSO Phasor Time Domain Simulations using Modelica, in: Proceedings of IEEE PESInnovative Smart Grid Technologies Europe, October 9–12, 2016, Ljubljana, Slovenia.