An Observational Examination of Long-Lived Supercells ... · An Observational Examination of...
26
An Observational Examination of Long-Lived Supercells. Part II: Environmental Conditions and Forecasting MATTHEW J. BUNKERS,JEFFREY S. JOHNSON, AND LEE J. CZEPYHA NOAA/National Weather Service, Rapid City, South Dakota JASON M. GRZYWACZ NOAA/National Weather Service, Dodge City, Kansas BRIAN A. KLIMOWSKI NOAA/National Weather Service, Bellemont, Arizona MARK R. HJELMFELT South Dakota School of Mines and Technology, Rapid City, South Dakota (Manuscript received 26 August 2005, in final form 15 January 2006) ABSTRACT The local and larger-scale environments of 184 long-lived supercell events (containing one or more supercells with lifetimes 4 h; see Part I of this paper) are investigated and subsequently compared with those from 137 moderate-lived events (average supercell lifetime 2–4 h) and 119 short-lived events (average supercell lifetime 2 h) to better anticipate supercell longevity in the operational setting. Consistent with many previous studies, long-lived supercells occur in environments with much stronger 0–8-km bulk wind shear than what is observed for short-lived supercells; this strong shear leads to significant storm-relative winds in the mid- to upper levels for the longest-lived supercells. Additionally, the bulk Richardson number falls into a relatively narrow range for the longest-lived supercells—ranging mostly from 5 to 45. The mesoscale to synoptic-scale environment can also predispose a supercell to be long or short lived, somewhat independent of the local environment. For example, long-lived supercells may occur when supercells travel within a broad warm sector or else in close proximity to mesoscale or larger-scale boundaries (e.g., along or near a warm front, an old outflow boundary, or a moisture/buoyancy axis), even if the deep-layer shear is suboptimal. By way of contrast, strong atmospheric forcing can result in linear convection (and thus shorter-lived supercells) in a strongly sheared environment that would otherwise favor discrete, long-lived supercells. 1. Introduction In Bunkers et al. (2006, hereafter Part I) it was shown that long-lived supercells (defined as supercells persist- ing for 4 h) are considerably more isolated 1 and dis- crete than short-lived supercells (defined as supercells with a lifetime 2 h), and they also produce notably more F2–F5 tornadoes than do short-lived supercells. Several regional variations in the long-lived supercell properties were documented across the United States, most prominently between the north-central United States (NCNTRL) and the Southeast. Because these longest-lived supercells present an operational forecast- ing concern and challenge—as well as a significant weather hazard to society—attention is now turned to the environmental conditions attending these supercell environments. Through this process, the goal is to gain a better awareness of the supercell longevity spectrum, especially with respect to operational forecasting appli- cations. a. Previous research on long-lived supercell environments The fact that supercells are longer lived than nonsu- percell thunderstorms derives from both a supercell’s 1 A supercell was considered isolated if it was separated from nearby cells by at least one storm diameter for 75% of its life- time. This diameter was taken as the average diameter of the 35-dBZ echo. Furthermore, the convective mode of each long- and short-lived supercell event was classified as linear, discrete, or mixed (according to a supercell’s relationship to linear convective features). Refer to Part I for more specific information regarding these definitions. Corresponding author address: Dr. Matthew J. Bunkers, Na- tional Weather Service, 300 E. Signal Dr., Rapid City, SD 57701. E-mail: [email protected] OCTOBER 2006 BUNKERS ET AL. 689 © 2006 American Meteorological Society WAF952
Transcript of An Observational Examination of Long-Lived Supercells ... · An Observational Examination of...
An Observational Examination of Long-Lived Supercells. Part II:Environmental Conditions and Forecasting
MATTHEW J. BUNKERS, JEFFREY S. JOHNSON, AND LEE J. CZEPYHA
NOAA/National Weather Service, Rapid City, South Dakota
JASON M. GRZYWACZ
NOAA/National Weather Service, Dodge City, Kansas
BRIAN A. KLIMOWSKI
NOAA/National Weather Service, Bellemont, Arizona
MARK R. HJELMFELT
South Dakota School of Mines and Technology, Rapid City, South Dakota
(Manuscript received 26 August 2005, in final form 15 January 2006)
ABSTRACT
The local and larger-scale environments of 184 long-lived supercell events (containing one or moresupercells with lifetimes �4 h; see Part I of this paper) are investigated and subsequently compared withthose from 137 moderate-lived events (average supercell lifetime 2–4 h) and 119 short-lived events (averagesupercell lifetime �2 h) to better anticipate supercell longevity in the operational setting. Consistent withmany previous studies, long-lived supercells occur in environments with much stronger 0–8-km bulk windshear than what is observed for short-lived supercells; this strong shear leads to significant storm-relativewinds in the mid- to upper levels for the longest-lived supercells. Additionally, the bulk Richardson numberfalls into a relatively narrow range for the longest-lived supercells—ranging mostly from 5 to 45. Themesoscale to synoptic-scale environment can also predispose a supercell to be long or short lived, somewhatindependent of the local environment. For example, long-lived supercells may occur when supercells travelwithin a broad warm sector or else in close proximity to mesoscale or larger-scale boundaries (e.g., along or neara warm front, an old outflow boundary, or a moisture/buoyancy axis), even if the deep-layer shear is suboptimal.By way of contrast, strong atmospheric forcing can result in linear convection (and thus shorter-livedsupercells) in a strongly sheared environment that would otherwise favor discrete, long-lived supercells.
1. Introduction
In Bunkers et al. (2006, hereafter Part I) it was shownthat long-lived supercells (defined as supercells persist-ing for �4 h) are considerably more isolated1 and dis-crete than short-lived supercells (defined as supercells
with a lifetime �2 h), and they also produce notablymore F2–F5 tornadoes than do short-lived supercells.Several regional variations in the long-lived supercellproperties were documented across the United States,most prominently between the north-central UnitedStates (NCNTRL) and the Southeast. Because theselongest-lived supercells present an operational forecast-ing concern and challenge—as well as a significantweather hazard to society—attention is now turned tothe environmental conditions attending these supercellenvironments. Through this process, the goal is to gaina better awareness of the supercell longevity spectrum,especially with respect to operational forecasting appli-cations.
a. Previous research on long-lived supercellenvironments
The fact that supercells are longer lived than nonsu-percell thunderstorms derives from both a supercell’s
1 A supercell was considered isolated if it was separated fromnearby cells by at least one storm diameter for �75% of its life-time. This diameter was taken as the average diameter of the35-dBZ echo. Furthermore, the convective mode of each long-and short-lived supercell event was classified as linear, discrete, ormixed (according to a supercell’s relationship to linear convectivefeatures). Refer to Part I for more specific information regardingthese definitions.
Corresponding author address: Dr. Matthew J. Bunkers, Na-tional Weather Service, 300 E. Signal Dr., Rapid City, SD 57701.E-mail: [email protected]
OCTOBER 2006 B U N K E R S E T A L . 689
© 2006 American Meteorological Society
WAF952

persistent rotating updraft, which enhances vertical mo-tion, as well as an updraft–downdraft configuration,which generally prevents precipitation from fallingthrough the updraft (Marwitz 1972; Browning 1977;Lemon 1980; Weisman and Klemp 1986)—both ofwhich, in turn, are dependent on the vertical windshear. Indeed, several observational studies have showna positive relationship between vertical wind shear andsupercell occurrence (e.g., Chisholm and Renick 1972;Marwitz 1972; Fankhauser and Mohr 1977).
Corresponding to the above-mentioned observa-tional studies, a plethora of numerical storm modelingstudies has shown a similar relationship between verti-cal wind shear and supercell occurrence and longevity(e.g., Wilhelmson and Klemp 1978; Weisman andKlemp 1982; Droegemeier et al. 1993; Brooks et al.1994a,b). Even though these studies have made it clearthat supercell occurrence and persistence become moreprobable when the deep-layer vertical wind shear isstrong (in the presence of conditional instability), theyhave not addressed quantitatively the relationship be-tween supercell lifetime and vertical wind shear (orother parameters).
Storm-relative helicity (SRH) has been theorized tosuppress turbulent dissipation, thus enabling supercellupdrafts to be stable and long lived (Lilly 1986; Droege-meier et al. 1993). Because SRH is positively correlatedwith vertical wind shear, this theoretical claim is con-sistent with the observational and modeling results dis-cussed above. However, SRH is almost always calcu-lated in the lower atmosphere (over a layer �3 kmAGL), and its importance to supercell longevity, rela-tive to the vertical wind shear in the mid- and upperlevels of the atmosphere, is not well understood. Nev-ertheless, observational studies have shown that SRH,on average, is larger in supercell environments than innonsupercell environments (e.g., Rasmussen and Blan-chard 1998; Thompson et al. 2003).
In addition to vertical wind shear, the lifted conden-sation level (LCL), and to a lesser extent the level offree convection (LFC), may also affect supercell lon-gevity (McCaul and Cohen 2002). Through a combina-tion of numerical modeling studies, McCaul and Cohendiscussed that as the LCL height increased, strongersurface cold pools were produced, and thus multicellsor squall lines tended to result instead of supercells (orelse supercells experienced a premature2 demise). Con-versely, supercells tended to exhibit greater longevity
when their downdraft strength and associated surfacecold pools were minimized, as was the case in simula-tions with low-LCL–intermediate-LFC environments.Most observational documentation of LCL heights insupercell environments has pertained to tornadic versusnontornadic supercells (e.g., Rasmussen and Blanchard1998; Markowski et al. 2002), and not to short- versuslong-lived supercells.
In another numerical modeling study, Gilmore andWicker (1998) showed that environmental relative hu-midity in the midtroposphere can have a significant im-pact on supercell evolution and longevity via modula-tion of the low-level outflow. For simulations with arelatively dry midtroposphere they found that evapo-ratively cooled downdrafts led to outflow that surgedahead of the storm (cutting off inflow), eventually caus-ing the updraft and storm circulation to weaken pre-maturely. However, when the vertical wind shear wasincreased or the dry air was placed at a higher altitude,the outflow was not as strong and thus the supercellpersisted for a longer period of time. Although McCauland Cohen (2002) and Gilmore and Wicker (1998) dis-cussed somewhat separate topics, they both addressedthe critical role of evaporatively driven downdrafts inmodulating the strength of the surface cold pool, whichsubsequently affects supercell evolution and longevity.
In addition to these near-storm environmental con-siderations, synoptic- and subsynoptic-scale featurescan also act to either enhance or limit the lifetime of asupercell. For example, Maddox et al. (1980) observedthat tornadic storms crossing a thermal boundary tendto be shorter lived than tornadic storms moving parallelto a thermal boundary. Atkins et al. (1999) found mod-eled supercells were strongest and longest lived whenthey traveled along3 preexisting boundaries or else to-ward the warm side, in contrast to storms initialized ina homogeneous environment or storms that traversed aboundary toward the cold side. Furthermore, they sug-gested storm motion, relative to boundary orientation,plays a key role in supercell evolution. Finally, Wilsonand Megenhardt (1997) noted that storms moving in adirection opposite to a boundary layer convergence line(i.e., toward the cool side of the boundary) are unlikely
2 The meaning of “premature” in this context is used to conveythe idea that supercells will live longer if these detrimental influ-ences are not present; this usage applies throughout the remain-der of this paper. Clearly, it is very difficult to ascertain how much
longer a supercell might live in the absence of these detrimentalconditions—a problem also akin to understanding tornadic versusnontornadic environments [e.g., see discussion by Doswell et al.(2002, p. 938)].
3 The meaning of “along” in this context does not necessarilysuggest storms moved exactly along a boundary. It can also betaken to mean that a storm paralleled a boundary for most of itslifetime, but may have been within only 10s of kilometers of theboundary. This usage of along with respect to supercell motionapplies throughout the remainder of this paper.
690 W E A T H E R A N D F O R E C A S T I N G VOLUME 21
to persist, but storms with a velocity that nearlymatches that of a boundary can persist for a relativelylong duration.
Additional large-scale controls on supercell longevityinclude the strength and velocity of the forcing mecha-nisms as well as the orientation of forcing mechanismsrelative to the vertical wind shear and mean wind (e.g.,LaDue 1998; Bluestein and Weisman 2000; Roebber etal. 2002), which ultimately relates to the convectivemode (Dial and Racy 2004). In a numerical simulationof the 3 May 1999 tornado outbreak, Roebber et al.(2002) found weak-to-moderate forcing favored theproduction of discrete long-lived supercells, but strongforcing resulted in a trend toward linear mesoscale con-vective systems (MCSs) in an environment with weakconvective inhibition. Bluestein and Weisman (2000)modeled convection with different orientations of thevertical wind shear with respect to the line of forcing(e.g., cold fronts, drylines, etc.), and found this relation-ship can exert a significant influence on whether rela-tively isolated long-lived supercells develop or a squallline results. When the shear vector is aligned with asurface forcing mechanism, linear convection becomeslikely (Dial and Racy 2004).
b. The present study
Although the above review provides some generalguidance on the environments of long-lived supercells,much of it was based on numerical simulations ratherthan observations, and thus a thorough observationalstudy that can be applied in the operational forecastingarena does not exist. Several important questions werealso raised in Part I that cannot be answered based onprevious research, especially with respect to the re-gional differences in long-lived supercell properties.Moreover, supercell motion and longevity may be in-terconnected, and this has yet to be thoroughly ex-plored. In light of this, the present study takes the con-vective forecasting process described by McNulty(1995) one step further by asking the following: If su-percells develop, will any be long lived, and what willthe expected supercell lifetime be?
The overarching goal of this work is to develop animproved understanding of the relationships among1) supercell lifetime, 2) supercell motion, and 3) thelocal and larger-scale environment, with a specific em-phasis on helping the operational forecaster better an-ticipate supercell lifetime on any given day. It is hy-pothesized that supercell motion, which can be reason-ably predicted when based on shear-relative techniques(Bunkers et al. 2000; Zeitler and Bunkers 2005), playsa key role in modulating supercell longevity (e.g., seeKlimowski and Bunkers 2002, p. 1117). A consequence
of this is that a supercell traveling with a similar velocityas a surface boundary or midlevel trough4 may livelonger than a supercell traveling differently than thesefeatures.
To accomplish the goal set forth above, the environ-ments of 184 long-lived (LL; at least one supercell witha lifetime � 4 h), 137 moderate-lived (ML; averagesupercell lifetime 2–4 h), and 113 short-lived (SL; av-erage supercell lifetime � 2 h) supercell events are ex-amined; the definitions and acquisition of these super-cell events were detailed in Part I. After describing thedata and methods (section 2), results pertaining to theenvironments of the supercell events, including geo-graphical variations across the United States, are dis-cussed in section 3. In section 4 the implications of theseresults are summarized, and a conceptual model forforecasting long-lived supercells is presented.
2. Data and methods
Observed sounding information was collected, if pos-sible, for each of the long-, moderate-, and short-livedsupercell events from Part I. The following two criteriawere required for at least 1 h of each event: (i) super-cells occurred within 185 km (100 n mi) of the corre-sponding sounding location and (ii) supercells occurredwithin 3 h of the sounding valid time. Each observedsounding was screened for “representativeness” of theair mass in which the supercells occurred. This usuallymeant the sounding was valid for locations in the likelyinflow region of a supercell, and was not contaminatedby outflow from nearby thunderstorms, which wouldchange the thermodynamic and kinematic structure ofthe boundary layer. These criteria are in general agree-ment with other observational studies (e.g., Brooks etal. 1994a; Rasmussen and Blanchard 1998; Bunkers etal. 2000; Evans and Doswell 2001).
In some cases a supercell event occurred in betweentwo or more candidate sounding locations. Therefore,the sounding parameters (described below) were calcu-lated for each of the sounding sites and then interpo-lated for the given event. This occurred for 12%–18%of all events (Table 1). Moreover, because of the in-completeness or unavailability of these observedsoundings at times (e.g., the supercells were not close intime/space to a sounding site, or the low levels of a
4 Note that the scale of vertical motion associated with a surfaceboundary (approximately 10 cm s�1–1 m s�1) is far different thanthat associated with a midlevel trough (approximately 1–10cm s�1). As such, the relatively small values associated with amidlevel trough make it insufficient to initiate deep moist convec-tion; rather, it serves to condition the background environment(Doswell 1987).
OCTOBER 2006 B U N K E R S E T A L . 691

sounding were convectively contaminated), there weresome occasions when the following data were utilized,based on availability: (i) Rapid Update Cycle (RUC)model analysis soundings (Thompson et al. 2003; Ben-jamin et al. 2004), (ii) National Oceanic and Atmo-spheric Administration (NOAA) Profiler Network(NPN) wind profiles, or (iii) surface data and WeatherSurveillance Radar-1988 Doppler (WSR-88D) windprofiles for the boundary layer, with observed sound-ings above the boundary layer (Table 1). However, themajority (66%–74%) of the soundings consisted ofsingle unmodified observations from the NOAA radio-sonde network, and most (84%–86%) consisted only ofradiosonde observations. Note that only kinematic pro-files can be derived from the NPN data source, so smallpercentages (3%–8%) of the supercell events do nothave any concurrent thermodynamic profiles (Table 1).
The mean-layer (ML) parcel in the lowest 1000 mand the virtual temperature correction (Doswell andRasmussen 1994) were used to calculate sounding ther-modynamic parameters. The ML parcel is believed tobe more robust than the surface-based parcel (Bunkerset al. 2002; Craven et al. 2002) and is consistent with nu-merical modeling studies (e.g., Weisman and Klemp 1982).Calculated parameters included ML convective avail-able potential energy (MLCAPE), ML convective inhi-bition (MLCIN), ML bulk Richardson number (MLBRN;Weisman and Klemp 1982), ML lifted condensationlevel (MLLCL), ML level of free convection (MLLFC),precipitable water from the surface to 300 hPa(PWAT), mean relative humidity from the surface to700 hPa (RH7), mean relative humidity from 700 to 300hPa (RH3), bulk and total wind shear for three differ-ent layers (Bulkx–ykm and Totalx–ykm: 0–4, 0–8, and 4–8km), bulk Richardson number shear (BRNSHR), SRHfor two different layers (SRHx–ykm: 0–1 and 0–3 km),and storm-relative winds for five different layers or lev-els (SRWx–ykm: 0–1, 0–3, 5, 8, and 7–10 km). The storm-relative winds were averaged over the respective layersat 500-m intervals, and observed supercell motionswere used to calculate all storm-relative parameters.
A second environmental consideration for the long-and short-lived supercell events was the strength of the
synoptic-scale forcing. This was evaluated in a mannersimilar to that done by Evans and Doswell (2001, p. 331;see their Fig. 1). A qualitative approach categorizedthese events into (i) strong forcing (SF), (ii) mediumforcing (MF), or (iii) weak forcing (WF). The ampli-tude and/or strength of midlevel short-wave troughs,300-hPa jets, and surface frontal systems carried themost weight in this taxonomy. Generally speaking, theSF events exhibited large-amplitude midlevel short-wave troughs, 300-hPa isotach maxima of �36 m s�1
(70 kt), and/or surface frontal boundaries with horizon-tal temperature gradients �5°C (100 km)�1. The WFevents were just the opposite, with 300-hPa isotachmaxima generally �26 m s�1 (50 kt) and surface hori-zontal temperature gradients �2.5°C (100 km)�1. Thistask was accomplished by consulting surface maps at3-h intervals, mandatory-level pressure charts at 1200and 0000 UTC, and Geostationary Operational Envi-ronmental Satellite imagery when available (mostly the6.7-�m channel). Exceptions to the above guidelinesincluded the following: (i) for cases with a strong baro-clinic zone in the lower troposphere, but only a weaktrough in the midlevels, the event was categorized asSF; and (ii) for cases with a 300-hPa isotach maximumof 26–36 m s�1 (50–70 kt), but no amplification to themidlevel flow and weak surface to lower-troposphericfeatures, the event was categorized as WF. Althoughthis is a subjective procedure, any biases present in thedataset should be consistent between the long- andshort-lived events, and therefore a relative comparisonbetween the two supercell classifications is still ex-pected to yield useful information.
As noted in section 1b, it is hypothesized that super-cell motion and longevity are intertwined. Therefore,mesoscale to synoptic-scale data (i.e., surface, satellite,radar, and upper air) were used to characterize the mo-tion of the long-lived supercells with respect to surfaceboundaries (e.g., fronts, outflow boundaries, anddrylines), moisture/buoyancy axes, broad air masses,and mid- to upper-level forcing mechanisms [similar toMaddox et al. (1980)]. Subsequently, each long-livedsupercell was grouped into one of six different catego-ries based on this procedure:
TABLE 1. Sounding sources for the LL, ML, and SL supercell events. The total number of supercell events with sounding data for eachclassification is indicated in parentheses in the leftmost column. Under each column heading in the first row, the first (second) valueindicates the number (percentage) of soundings for the corresponding classification. The radiosonde (raob) and RUC sources containboth thermodynamic and kinematic information; the NPN and WSR-88D sources contain kinematic information only.
Single raob Multiple raob Single NPN 0-h RUC Raob/WSR-88D/surface
LL (174) 115 (66.1%) 32 (18.4%) 6 (3.4%) 12 (6.9%) 9 (5.2%)ML (137) 102 (74.4%) 16 (11.7%) 9 (6.6%) 8 (5.8%) 2 (1.5%)SL (119) 87 (73.1%) 14 (11.8%) 9 (7.5%) 4 (3.4%) 5 (4.2%)
692 W E A T H E R A N D F O R E C A S T I N G VOLUME 21
1) Along: Supercell motion was either along a bound-ary (see footnote 3) or within 15° of a moisture/buoyancy axis, or at a similar velocity as a mid- toupper-level forcing mechanism.
2) Warm sector: The supercell remained within abroad, warm, and buoyant region.
3) Toward more buoyant: Supercell motion was at anangle (15°–90°) to a boundary or moisture/buoyancyaxis, which directed the supercell toward increas-ingly moist/buoyant air.
4) Toward less buoyant: Supercell motion was at anangle (15°–60°) to a boundary or moisture/buoyancyaxis, which directed the supercell toward increas-ingly dry/less buoyant air.
5) Quickly less buoyant: Supercell motion was at alarge angle (�60°) to a boundary or moisture/buoyancy axis, which “quickly” directed the super-cell toward increasingly dry/less buoyant air. Therewas no accounting for speed in differentiating be-tween categories 4 and 5.
6) Cold/Overtaken: The supercell either remained inthe cold sector of an extratropical cyclone, or else itwas overtaken by a frontal boundary, prefrontalsquall line, or mid- to upper-level forcing mecha-nism.
The first three categories are considered to be favor-able for continued supercell survival, whereas the lastthree categories are believed to potentially limit super-cell lifetime.
3. Results and discussion
a. Environments of the supercell events
1) SOUNDING PARAMETERS
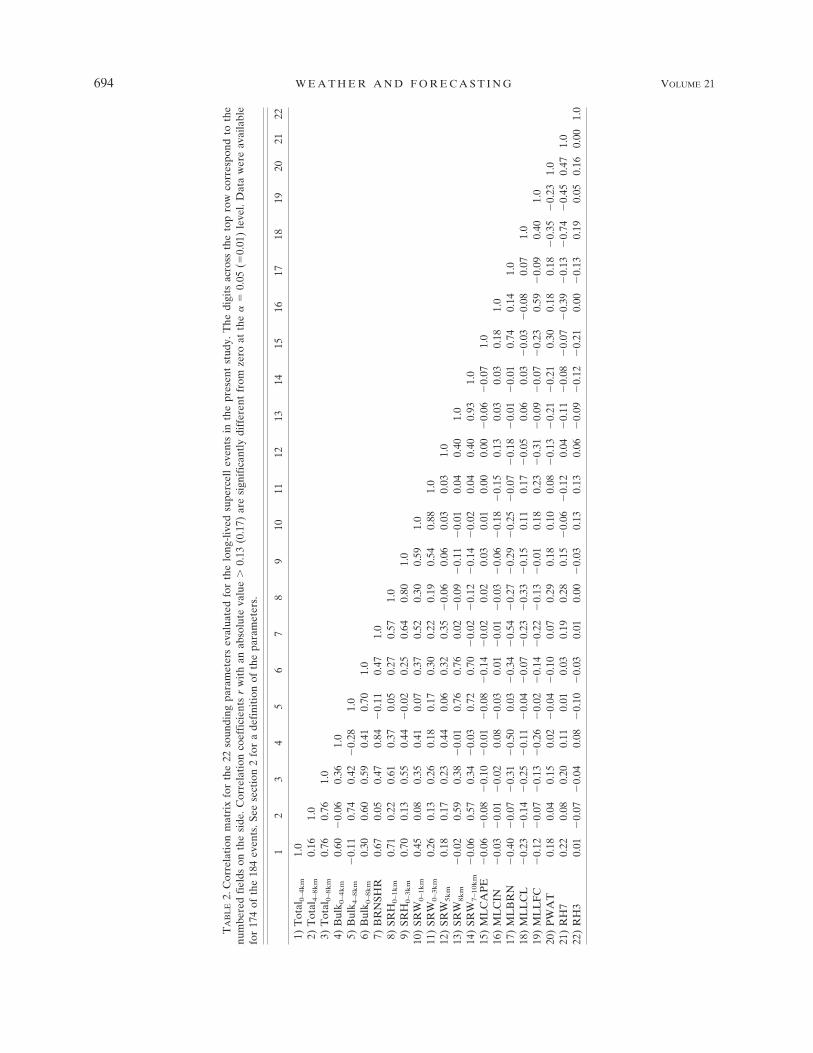
A correlation matrix was constructed for the 22 pa-rameters outlined in section 2, using the sounding datafor the long-lived supercell events (Table 2). Overall,RH3 has the weakest correlation coefficients—and thusthe greatest degree of independence—among all of theparameters, with the strongest value of �0.21 associ-ated with MLCAPE. PWAT has low correlation coef-ficients as well; the largest value is only 0.47 in relationto RH7. On the other hand, several of the shear pa-rameters have rather large values, indicating substantialinterdependence. For example, the correlation coeffi-cient between Bulk0–4km and BRNSHR is 0.84, withtheir coefficients in relation to the other parametersnearly approximating one another. After review of thecorrelation matrix, 14 parameters were considered forfurther investigation based on their relative degrees ofindependence: Total0–8km, Bulk0–8km, BRNSHR,
SRH0–3km, SRW0–3km, SRW5km, SRW8km, MLCAPE,MLCIN, MLBRN, MLLCL, MLLFC, PWAT, andRH3.
Use of box-and-whisker plots (Wilks 1995) helpedfurther reduce the parameters from 14 to 8 (Fig. 1),based in part on the least interquartile overlap acrosscategories of supercellular lifespan. Several of these pa-rameters revealed a gradual shift in the distributionsacross the supercell longevity spectrum, but Bulk0–8km
displayed the largest and most significant differenceswith no overlap of the interquartile ranges for the threesupercell classifications (Fig. 1, top left-hand plot;Table 3a). This agrees well with the previous observa-tional and modeling studies outlined in section 1a, andfurthermore, it helps quantify the heretofore nebulousrelationship between supercell longevity and deep-layer shear; as Bulk0–8km strengthens above 26 m s�1
(50 kt), long-lived supercells become increasinglylikely. The BRNSHR plot resembles that of Bulk0–8km,but there is more overlap in the distributions forBRNSHR (Fig. 1) and, thus, smaller Student’s t teststatistics (Table 3a). Note that the more traditionalBulk0–6km and Bulk0–3km were also tested, but the re-sults were inferior to Bulk0–8km (Table 3), with an over-lap in the box-and-whisker plots (not shown) similar tothat for BRNSHR. These results make it apparent thata deeper measure of the vertical wind shear (i.e., �0–6km) is most appropriate when evaluating the potentialfor long-lived supercells, which is consistent with thefindings of Thompson et al. (2004).
Another relatively strong signal is evident in theSRW8km distribution (Fig. 1, top right-hand plot), withSRW8km �17 m s�1 (33 kt) for 75% of the long-livedsupercell events, and �16 m s�1 (31 kt) for 75% of theshort-lived supercell events. This is consistent with theresults for Bulk0–8km, albeit the signal is not as strong(Table 3a). Rasmussen and Straka (1998) found theupper-level storm-relative flow was weakest, on aver-age, in the environments of high-precipitation super-cells. A scatterplot of Bulk0–8km versus SRW8km (Fig. 2)reveals the propensity for long-lived supercell events tooccur with increasing values of each parameter (recallr � 0.76 between the two variables; Table 2).
The MLBRN (i.e., MLCAPE/BRNSHR) shows lim-ited potential for forecasting supercell longevity, withprogressively smaller values favoring long-lived super-cell events (Fig. 1). The range of MLBRN for long-livedsupercell events is rather narrow, 6–36 for the inner80% of the distribution, and 5–46 for the inner 90%,which is in very good agreement with the seminal workby Weisman and Klemp (1982) as well as the ensemblecloud modeling study by Elmore et al. (2002; see theirFig. 13). Despite the statistically significant difference
OCTOBER 2006 B U N K E R S E T A L . 693
TA
BL
E2.
Cor
rela
tion
mat
rix
for
the
22so
undi
ngpa
ram
eter
sev
alua
ted
for
the
long
-liv
edsu
perc
ell
even
tsin
the
pres
ent
stud
y.T
hedi
gits
acro
ssth
eto
pro
wco
rres
pond
toth
enu
mbe
red
fiel
dson
the
side
.Cor
rela
tion
coef
fici
ents
rw
ith
anab
solu
teva
lue
�0.
13(0
.17)
are
sign
ific
antl
ydi
ffer
ent
from
zero
atth
e�
�0.
05(�
0.01
)le
vel.
Dat
aw
ere
avai
labl
efo
r17
4of
the
184
even
ts.S
eese
ctio
n2
for
ade
fini
tion
ofth
epa
ram
eter
s.
12
34
56
78
910
1112
1314
1516
1718
1920
2122
1)T
otal
0–
4k
m1.
02)
Tot
al4
–8
km
0.16
1.0
3)T
otal
0–
8k
m0.
760.
761.
04)
Bul
k 0–
4k
m0.
60�
0.06
0.36
1.0
5)B
ulk 4
–8
km
�0.
110.
740.
42�
0.28
1.0
6)B
ulk 0
–8
km
0.30
0.60
0.59
0.41
0.70
1.0
7)B
RN
SHR
0.67
0.05
0.47
0.84
�0.
110.
471.
08)
SRH
0–
1k
m0.
710.
220.
610.
370.
050.
270.
571.
09)
SRH
0–
3k
m0.
700.
130.
550.
44�
0.02
0.25
0.64
0.80
1.0
10)
SRW
0–
1k
m0.
450.
080.
350.
410.
070.
370.
520.
300.
591.
011
)SR
W0
–3
km
0.26
0.13
0.26
0.18
0.17
0.30
0.22
0.19
0.54
0.88
1.0
12)
SRW
5k
m0.
180.
170.
230.
440.
060.
320.
35�
0.06
0.06
0.03
0.03
1.0
13)
SRW
8k
m�
0.02
0.59
0.38
�0.
010.
760.
760.
02�
0.09
�0.
11�
0.01
0.04
0.40
1.0
14)
SRW
7–
10
km
�0.
060.
570.
34�
0.03
0.72
0.70
�0.
02�
0.12
�0.
14�
0.02
0.04
0.40
0.93
1.0
15)
ML
CA
PE
�0.
06�
0.08
�0.
10�
0.01
�0.
08�
0.14
�0.
020.
020.
030.
010.
000.
00�
0.06
�0.
071.
016
)M
LC
IN�
0.03
�0.
01�
0.02
0.08
�0.
030.
01�
0.01
�0.
03�
0.06
�0.
18�
0.15
0.13
0.03
0.03
0.18
1.0
17)
ML
BR
N�
0.40
�0.
07�
0.31
�0.
500.
03�
0.34
�0.
54�
0.27
�0.
29�
0.25
�0.
07�
0.18
�0.
01�
0.01
0.74
0.14
1.0
18)
ML
LC
L�
0.23
�0.
14�
0.25
�0.
11�
0.04
�0.
07�
0.23
�0.
33�
0.15
0.11
0.17
�0.
050.
060.
03�
0.03
�0.
080.
071.
019
)M
LL
FC
�0.
12�
0.07
�0.
13�
0.26
�0.
02�
0.14
�0.
22�
0.13
�0.
010.
180.
23�
0.31
�0.
09�
0.07
�0.
230.
59�
0.09
0.40
1.0
20)
PW
AT
0.18
0.04
0.15
0.02
�0.
04�
0.10
0.07
0.29
0.18
0.10
0.08
�0.
13�
0.21
�0.
210.
300.
180.
18�
0.35
�0.
231.
021
)R
H7
0.22
0.08
0.20
0.11
0.01
0.03
0.19
0.28
0.15
�0.
06�
0.12
0.04
�0.
11�
0.08
�0.
07�
0.39
�0.
13�
0.74
�0.
450.
471.
022
)R
H3
0.01
�0.
07�
0.04
0.08
�0.
10�
0.03
0.01
0.00
�0.
030.
130.
130.
06�
0.09
�0.
12�
0.21
0.00
�0.
130.
190.
050.
160.
001.
0
694 W E A T H E R A N D F O R E C A S T I N G VOLUME 21

FIG. 1. Box-and-whisker plots (Wilks 1995) for the LL, ML, and SL supercell events using the sounding databaseand parameters described in section 2. For each individual plot, the middle 50% of the distribution is contained withinthe box, the horizontal line in the middle of the box represents the median value, the asterisk represents the meanvalue, the short horizontal dash on the upper (lower) whisker represents the 90th (10th) percentile, and the top(bottom) of the whisker represents the maximum (minimum) value. In a few cases the maximum/minimum values aretruncated for display purposes.
OCTOBER 2006 B U N K E R S E T A L . 695

in means (Table 3a), there is considerable overlap inthe MLBRN distributions for all three supercell classi-fications with virtually no practical ability to distinguishbetween long- and moderate-lived supercell events.This is not surprising because MLBRN is more of asupercell versus multicell predictor than it is a long-lived versus shorter-lived supercell predictor. Never-
theless, MLBRN may be useful as a filter for long-livedsupercell events (i.e., if the MLBRN is �5 or �45, long-lived supercells become unlikely), but it should not beused as a sole predictor. When MLBRN is viewed inconjunction with Bulk0–8km (Fig. 3), it appears that ifMLBRN � 40, then Bulk0–8km must be relatively largefor long-lived supercells to occur, and if MLBRN � 40,long-lived supercells can occur with relatively smallerBulk0–8km. This implies that deep-layer shear is not ascritical to long-lived supercells when buoyancy is sub-par. Finally, the short-lived supercell events corre-sponding exclusively to small MLBRN (�5) environ-ments were associated with very low MLCAPE (aver-age of 233 J kg�1)—compared with 611 J kg�1 for thelong-lived events with MLBRN � 5. This suggests therewas not enough buoyancy to sustain these short-livedsupercells, which were in the presence of relativelystrong wind shear.
Most of the thermodynamic parameters were not asuseful as the shear parameters in discriminating amongthe supercell classifications. The only one that appearsreasonably effective is the MLLCL, which suggestslong-lived supercell events are more probable asMLLCL heights, and hence cloud bases, decrease (Fig.1, bottom left-hand plot; Table 3a). Generally speaking,the values of MLLCL range from 300 to 700 m lowerfor the long-lived supercell events when compared withthe other two classifications. The scatterplot of Bulk0–8km
versus MLLCL (Fig. 4) demonstrates the greatest abil-ity to discriminate between long- and short-lived super-cell events when compared with the other parameter
FIG. 2. Scatterplot of Bulk0–8km vs SRW8km for the three super-cell classifications in the present study. A line has been drawn todiscriminate between the long- and short-lived supercell events soas to minimize the number of misclassified events, and the equa-tion for the line is also given.
TABLE 3. (a) Student’s t test statistics for differences in meansbased on the eight parameters given in Fig. 1 for the variouscombinations of LL, ML, and SL supercell events. (b) Same as (a)but for ancillary parameters of interest not included in Fig. 1.Absolute values � 1.65 (�2.34) indicate significance at the � �0.05 (�0.01) level. See section 2 for a definition of the parameters.
(a)
LL/SL LL/ML ML/SL
Bulk0–8km 20.47 10.26 11.51SRW8km 13.20 6.76 7.37BRNSHR 11.91 6.61 5.76MLBRN �7.45 �4.14 �4.52SRW0–3km 5.07 2.77 2.51SRH0–3km 7.11 3.93 2.94MLLCL �7.63 �5.62 �2.10RH3 �4.63 �3.00 �1.72
(b)
Bulk0–6km 15.01 7.93 7.64Bulk0–3km 10.43 5.06 5.25Bulk0–1km 5.68 4.89 0.80SRH0–1km 7.28 7.93 1.75
FIG. 3. Same as in Fig. 2 but for Bulk0–8km vs MLBRN. Thereare six (nine) fewer long-lived (short lived) cases in this figurethan in Fig. 2 because of missing thermodynamic data.
696 W E A T H E R A N D F O R E C A S T I N G VOLUME 21

combinations; this may be a result of r � �0.07 forBulk0–8km and MLLCL, indicating the independence ofthe two variables. Indeed, only 10 long-lived events areleft of the line in the plot, while 12 short-lived eventsfall to the right. It can be seen that Bulk0–8km may besuboptimal for long-lived events provided MLLCLheights are low. These findings are congruent with thenumerical modeling results of McCaul and Cohen(2002; discussed in section 1a), and they also concurwith the findings of Part I, Rasmussen and Blanchard(1998), and Thompson et al. (2003). Namely, long-livedsupercells and significantly tornadic supercells are as-sociated with lower MLLCL heights, on average, thanare short-lived supercells and weakly tornadic or non-tornadic supercells, respectively. Despite the benefits ofviewing the MCLCL/Bulk0–8km parameter space, op-erational forecasters are cautioned against using this asa “cure-all” for forecasting supercell longevity.
Interestingly, RH3 displays a gradual decrease as onegoes from short-lived to long-lived supercell events(Fig. 1, bottom right-hand plot), although the overlapamong the three distributions is considerable. This mayinitially seem at odds with Gilmore and Wicker (1998),but recall that relatively large Bulk0–8km values corre-spond to this midtropospheric dryness for the long-lived events, which helps mitigate against strong low-level outflow, according to their study. Furthermore,the altitude of the RH3 layer aligns more closely withthe “high altitude” dry air placement in Gilmore andWicker (i.e., 3.5 instead of 2.3 km), which has less of aneffect on the strength of a storm’s low-level outflow
when compared with dry air at lower levels. Be awarethat the above results that are dependent on relativehumidity (i.e., RH3, MLLCL, and to a lesser extentMLBRN) should be viewed with a bit of caution be-cause of the approximate 5% dry bias in radiosonderelative humidity profiles (Turner et al. 2003), whichcan amount to a 0.5 g kg�1 dry bias in the mixing ratiothroughout the boundary layer.
Given the widespread operational use of SRH0–3km
as it pertains to severe local storms, and especially su-percells, its efficacy with respect to supercell longevitywas evaluated. In agreement with the modeling resultsof Droegemeier et al. (1993), average SRH0–3km waslargest for the long-lived supercell events (Fig. 1), withjust over 75% (50%) of the values �150 m2 s�2 (225m2 s�2). Davies-Jones et al. (1990) proposed using 150m2 s�2 as a rough lower threshold for mesocyclone for-mation, which appears too high given the present re-sults (assuming representativeness of kinematic sound-ing data to actual near-storm environments); 45% ofthe moderate-lived supercell events were associated withSRH0–3km below this value. Droegemeier et al. (1993)revised this general threshold upward to 250 m2 s�2,which also is too high based on Fig. 1; over half of thelong-lived supercell events had SRH0–3km � 250 m2 s�2.Therefore, given this information, plus the overlap inthe SRH0–3km distributions, SRH0–3km clearly cannot beused alone as a discriminator of supercell longevity. Forcompleteness, Student’s t test statistics for differencesof means were also computed for Bulk0–3km (Table 3b),and the results suggest SRH0–3km is slightly inferior toBulk0–3km when discriminating among the supercellclasses. Last, SRW0–3km, an integral part of SRH0–3km,was �7–8 m s�1 for 90% of all three of the supercellclassifications (Fig. 1), which is in general support of theclaim that this value should be at least 10 m s�1 forsupercell storms (Droegemeier et al. 1993).
The relevance of Bulk0–8km versus SRH0–3km is quan-tified further by way of contingency tables. Statistics forthe short- and moderate-lived supercell events wereamalgamated, and then compared as a whole to thelong-lived supercell events. The best discriminator be-tween the long-lived and “other” supercell events wasdetermined for both Bulk0–8km (i.e., 30 m s�1) andSRH0–3km (i.e., 215 m2 s�2), and then the probability ofdetection (POD), false alarm ratio (FAR), true skillscore (TSS), and Heidke skill score (HSS) were calcu-lated for each. The TSS approaches the POD when theforecast contingency table is dominated by correct nulls(Doswell et al. 1990), which is not true in the presentstudy despite the large number of them; the HSS cir-cumvents the null-dominance problem of the TSS andmaintains most of its robustness. Expectedly, the POD
FIG. 4. Same as in Fig. 2 but for Bulk0–8km vs MLLCL. There aresix (nine) fewer long-lived (short lived) cases in this figure than inFig. 2 because of missing thermodynamic data.
OCTOBER 2006 B U N K E R S E T A L . 697

was 26% higher and the FAR was 12% lower for Bulk0–8km
versus SRH0–3km when discriminating between thelong-lived and other supercell events (Table 4). More-over, the TSS and HSS for Bulk0–8km were both aboutdouble the values for SRH0–3km (unity indicates a per-fect score). These results are in good agreement withTable 3.
A synthesis of the above results supports the ideathat deep-layer shear and upper-level storm-relativewinds are more appropriate than low-level shear/SRHwhen evaluating the potential for long-lived supercells(also see Weisman and Rotunno 2000). Even with largeSRH0–3km, if the storm-relative winds and shear are notstrong enough in the mid- to upper levels, more pre-cipitation falls near the updraft, potentially creating anintense downdraft and strong low-level outflow(Brooks et al. 1994b; Rasmussen and Straka 1998), thusshortening the supercell lifetime. For example, numeri-cal modeling results (e.g., UCAR 2005; cf. their D2 andM2 simulations) provide evidence of longer-lived su-percells in environments with greater Bulk0–8km andSRW8km, but much less SRH0–3km (e.g., D2), than forsimulations portraying shorter-lived supercells (e.g.,M2). The importance of strong shear over a deep layerfor long-lived supercell events is also evinced in thecomposite hodographs for the three classifications inthe present study (Fig. 5). The long-lived compositehodograph curves by �90° in the lowest 1 km andthen displays strong unidirectional shear. Indeed, the
4–8-km bulk shear for the long-lived compositehodograph is nearly as strong as the 0–4-km bulk shearfor the short-lived composite, reiterating the signifi-cance of mid- to upper-level shear.
Given the usefulness of SRH0–1km in distinguishingbetween significantly tornadic supercells and weaklytornadic or nontornadic supercells (Rasmussen 2003;Thompson et al. 2003), and also because of the appar-ent connection between supercell longevity and signifi-cant tornadoes (Part I), this parameter is investigatedfurther here. Based on the box-and-whisker plots thereis substantial overlap of the moderate- and short-liveddistributions (Fig. 6), and the differences in the meansare not significant at the � � 0.01 level (Table 3b).However, the long-lived distribution for SRH0–1km issignificantly different than both the moderate- andshort-lived distributions (Fig. 6; Table 3b)—even moreso than for SRH0–3km and Bulk0–1km. Rasmussen andBlanchard (1998), Rasmussen (2003), and Thompson etal. (2003) found that SRH0–1km is highest and MLLCLis lowest, on average, in the environments of signifi-cantly tornadic supercells. Thus, the combination of
TABLE 4. Contingency tables for the LL supercell events vs thecombination of ML and SL supercell events using (a) Bulk0–8km
with 30 m s�1 as a discriminator and (b) SRH0–3km with 215 m2 s�2
as a discriminator. Statistical measures were calculated as inDoswell et al. (1990). “Perfect” scores for the four measures arePOD � 100%, FAR � 0%, TSS � 1.0, and HSS � 1.0.
(a)
LL event observed
Yes No Tot
LL event forecast Yes 147 53 200No 27 203 230Tot 174 256 430POD � 84% FAR � 27%TSS � 0.64 HSS � 0.62
(b)
LL event observed
Yes No Tot
LL event forecast Yes 101 64 165No 73 192 265Tot 174 256 430POD � 58% FAR � 39%TSS � 0.33 HSS � 0.33
FIG. 5. Composite 0–10-km hodographs and observed stormmotions (m s�1) for the long-lived (solid circles), moderate-lived(plus signs), and short-lived (gray circles) supercell events. Priorto averaging, individual hodographs were translated such that the0–0.5- to 5.5–6-km shear vector was positively aligned with the xaxis, and the 0–0.5-km wind was at the origin. After averaging ofthe individual hodographs, the resulting composite hodographswere readjusted by adding back the composite mean wind andaligning with the composite 0–0.5- to 5.5–6-km shear vector (bothobtained prior to the initial translation/averaging process) foreach of the individual classifications. Data are plotted every 500m, but markers are only given at 1-km intervals.
698 W E A T H E R A N D F O R E C A S T I N G VOLUME 21
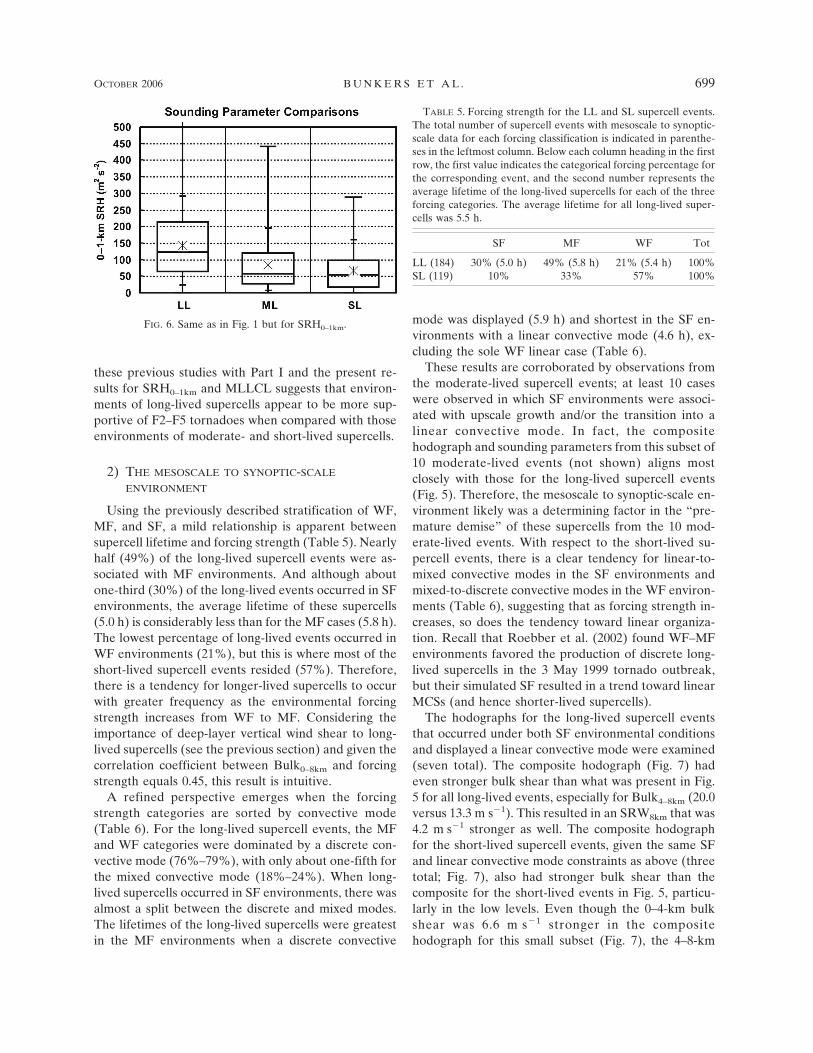
these previous studies with Part I and the present re-sults for SRH0–1km and MLLCL suggests that environ-ments of long-lived supercells appear to be more sup-portive of F2–F5 tornadoes when compared with thoseenvironments of moderate- and short-lived supercells.
2) THE MESOSCALE TO SYNOPTIC-SCALE
ENVIRONMENT
Using the previously described stratification of WF,MF, and SF, a mild relationship is apparent betweensupercell lifetime and forcing strength (Table 5). Nearlyhalf (49%) of the long-lived supercell events were as-sociated with MF environments. And although aboutone-third (30%) of the long-lived events occurred in SFenvironments, the average lifetime of these supercells(5.0 h) is considerably less than for the MF cases (5.8 h).The lowest percentage of long-lived events occurred inWF environments (21%), but this is where most of theshort-lived supercell events resided (57%). Therefore,there is a tendency for longer-lived supercells to occurwith greater frequency as the environmental forcingstrength increases from WF to MF. Considering theimportance of deep-layer vertical wind shear to long-lived supercells (see the previous section) and given thecorrelation coefficient between Bulk0–8km and forcingstrength equals 0.45, this result is intuitive.
A refined perspective emerges when the forcingstrength categories are sorted by convective mode(Table 6). For the long-lived supercell events, the MFand WF categories were dominated by a discrete con-vective mode (76%–79%), with only about one-fifth forthe mixed convective mode (18%–24%). When long-lived supercells occurred in SF environments, there wasalmost a split between the discrete and mixed modes.The lifetimes of the long-lived supercells were greatestin the MF environments when a discrete convective
mode was displayed (5.9 h) and shortest in the SF en-vironments with a linear convective mode (4.6 h), ex-cluding the sole WF linear case (Table 6).
These results are corroborated by observations fromthe moderate-lived supercell events; at least 10 caseswere observed in which SF environments were associ-ated with upscale growth and/or the transition into alinear convective mode. In fact, the compositehodograph and sounding parameters from this subset of10 moderate-lived events (not shown) aligns mostclosely with those for the long-lived supercell events(Fig. 5). Therefore, the mesoscale to synoptic-scale en-vironment likely was a determining factor in the “pre-mature demise” of these supercells from the 10 mod-erate-lived events. With respect to the short-lived su-percell events, there is a clear tendency for linear-to-mixed convective modes in the SF environments andmixed-to-discrete convective modes in the WF environ-ments (Table 6), suggesting that as forcing strength in-creases, so does the tendency toward linear organiza-tion. Recall that Roebber et al. (2002) found WF–MFenvironments favored the production of discrete long-lived supercells in the 3 May 1999 tornado outbreak,but their simulated SF resulted in a trend toward linearMCSs (and hence shorter-lived supercells).
The hodographs for the long-lived supercell eventsthat occurred under both SF environmental conditionsand displayed a linear convective mode were examined(seven total). The composite hodograph (Fig. 7) hadeven stronger bulk shear than what was present in Fig.5 for all long-lived events, especially for Bulk4–8km (20.0versus 13.3 m s�1). This resulted in an SRW8km that was4.2 m s�1 stronger as well. The composite hodographfor the short-lived supercell events, given the same SFand linear convective mode constraints as above (threetotal; Fig. 7), also had stronger bulk shear than thecomposite for the short-lived events in Fig. 5, particu-larly in the low levels. Even though the 0–4-km bulkshear was 6.6 m s�1 stronger in the compositehodograph for this small subset (Fig. 7), the 4–8-km
FIG. 6. Same as in Fig. 1 but for SRH0–1km.
TABLE 5. Forcing strength for the LL and SL supercell events.The total number of supercell events with mesoscale to synoptic-scale data for each forcing classification is indicated in parenthe-ses in the leftmost column. Below each column heading in the firstrow, the first value indicates the categorical forcing percentage forthe corresponding event, and the second number represents theaverage lifetime of the long-lived supercells for each of the threeforcing categories. The average lifetime for all long-lived super-cells was 5.5 h.
SF MF WF Tot
LL (184) 30% (5.0 h) 49% (5.8 h) 21% (5.4 h) 100%SL (119) 10% 33% 57% 100%
OCTOBER 2006 B U N K E R S E T A L . 699

bulk shear was almost identical between this subset andthe full short-lived composite, producing only a 1.8m s�1 difference in SRW8km (slightly stronger, on aver-age, for these three cases). Once again, these results(although only based on a single-digit sample size)highlight the importance of the upper-level shear andstorm-relative winds in supporting long-lived super-cells, which appears progressively more critical whenthe forcing strength becomes strong and a linear con-vective mode is present.
Not only is the forcing strength germane to supercelllongevity and the convective mode, but the velocity ofvarious forcing mechanisms, with respect to supercell
motion, can be just as important. In at least 14 (or 8%)of the 184 long-lived supercell events, supercells wereeither overtaken by forcing mechanisms of varyingscale (i.e., fronts or short-wave troughs; note the caveatin footnote 4), or else they gradually fell behind in thecold sector of an extratropical cyclone. The averagelifetime of these supercells was 4.4 h, which is signifi-cantly less than the 5.5-h average for all long-lived su-percells (see Part I). Thus, it is plausible that theseforcing mechanisms of varying scale (i) made the envi-ronments that the long-lived supercells were travelingthrough unfavorable and/or (ii) helped to organize andstrengthen the outflow boundaries (or other mesoscaleboundaries) such that the supercells grew upscale intoMCSs. Indeed, it may be that the longest-lived super-cells are a result of the storm maintaining a similarvelocity as its attendant forcing mechanism (i.e., notoutrunning the forcing and not being overtaken by it).
The hypothesis that supercell motion is one determi-nant of supercell longevity was further tested as out-lined in section 2. The most prominent finding from thisevaluation is that just over half (51%) of all long-livedsupercells had a significant component of their motionsomewhat parallel to a boundary or moisture/buoyancyaxis, or else at a similar speed as a mid- to upper-levelforcing mechanism (Fig. 8). The average lifetime ofthese supercells was 5.9 h, or 0.4 h more than the av-erage for the entire long-lived dataset. A much smallerfraction of long-lived supercells occurred in the warmsector away from discernable boundaries (18%), butthese also had a correspondingly high average lifetime(6.0 h). The long-lived supercells with the greatest av-erage lifetime (6.3 h) were the ones that gradually trav-eled toward increasingly moist/buoyant air. These su-percells may have crossed a boundary, or they mayhave formed upstream of a moisture/buoyancy axis andthen gradually moved toward it.
FIG. 7. Composite 0–10-km hodographs and observed stormmotions (m s�1) for the long-lived (solid circles) and short-lived(gray circles) supercell events that both occurred in SF environ-ments and also displayed a linear convective mode. Otherwise thesame as in Fig. 5.
TABLE 6. Forcing strength for the LL and SL supercell events sorted by convective mode. Percentages are given for each combinationof convective mode and forcing strength, and the average lifetime of the long-lived supercells for each combination is also given. Thetotal number of supercell events for the various classifications is indicated in parentheses. The average lifetime for all long-livedsupercells was 5.5 h.
Convective mode SF (57) MF (88) WF (39)
LL (8) Linear 13%/4.6 h (7) — 3%/4.0 h (1)LL (52) Mixed 41%/4.9 h (23) 24%/5.7 h (22) 18%/5.9 h (7)LL (124) Discrete 46%/5.3 h (26) 76%/5.9 h (68) 79%/5.4 h (30)Tot (184) 100% 100% 100%
SF (12) MF (39) WF (66)
SL (15) Linear 25% (3) 23% (9) 5% (3)SL (59) Mixed 67% (8) 49% (19) 48% (32)SL (43) Discrete 8% (1) 28% (11) 47% (31)Tot (117) 100% 100% 100%
700 W E A T H E R A N D F O R E C A S T I N G VOLUME 21
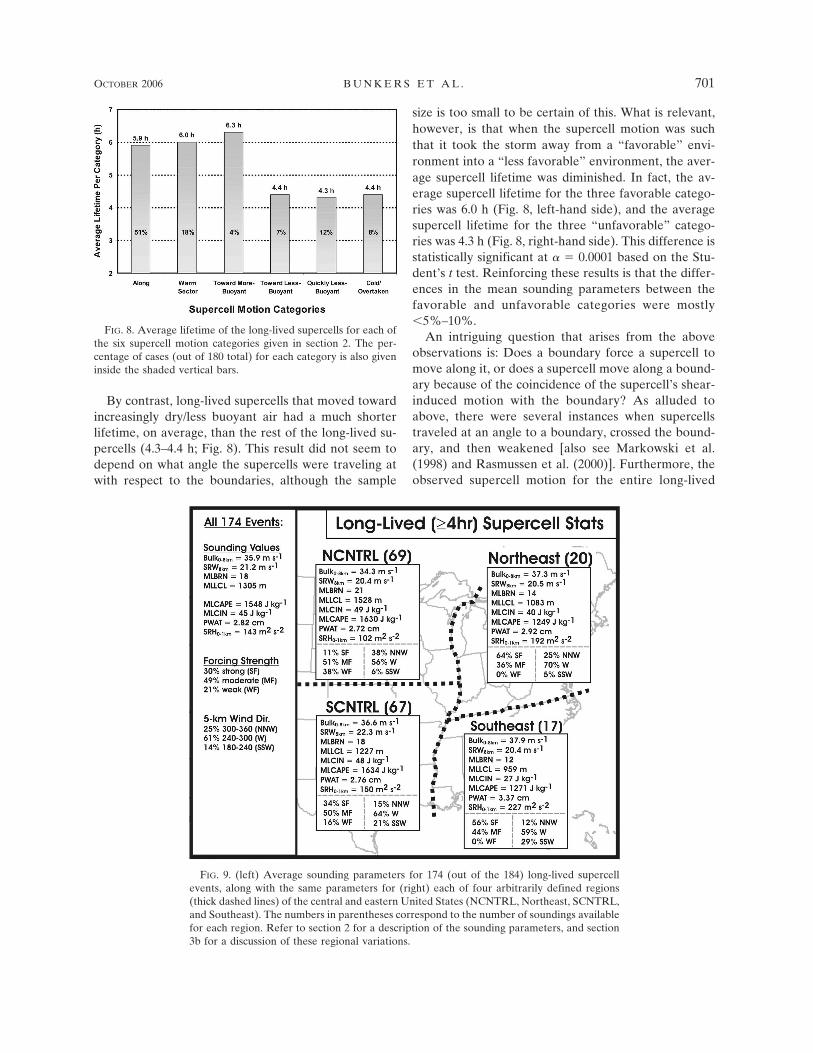
By contrast, long-lived supercells that moved towardincreasingly dry/less buoyant air had a much shorterlifetime, on average, than the rest of the long-lived su-percells (4.3–4.4 h; Fig. 8). This result did not seem todepend on what angle the supercells were traveling atwith respect to the boundaries, although the sample
size is too small to be certain of this. What is relevant,however, is that when the supercell motion was suchthat it took the storm away from a “favorable” envi-ronment into a “less favorable” environment, the aver-age supercell lifetime was diminished. In fact, the av-erage supercell lifetime for the three favorable catego-ries was 6.0 h (Fig. 8, left-hand side), and the averagesupercell lifetime for the three “unfavorable” catego-ries was 4.3 h (Fig. 8, right-hand side). This difference isstatistically significant at � � 0.0001 based on the Stu-dent’s t test. Reinforcing these results is that the differ-ences in the mean sounding parameters between thefavorable and unfavorable categories were mostly�5%–10%.
An intriguing question that arises from the aboveobservations is: Does a boundary force a supercell tomove along it, or does a supercell move along a bound-ary because of the coincidence of the supercell’s shear-induced motion with the boundary? As alluded toabove, there were several instances when supercellstraveled at an angle to a boundary, crossed the bound-ary, and then weakened [also see Markowski et al.(1998) and Rasmussen et al. (2000)]. Furthermore, theobserved supercell motion for the entire long-lived
FIG. 9. (left) Average sounding parameters for 174 (out of the 184) long-lived supercellevents, along with the same parameters for (right) each of four arbitrarily defined regions(thick dashed lines) of the central and eastern United States (NCNTRL, Northeast, SCNTRL,and Southeast). The numbers in parentheses correspond to the number of soundings availablefor each region. Refer to section 2 for a description of the sounding parameters, and section3b for a discussion of these regional variations.
FIG. 8. Average lifetime of the long-lived supercells for each ofthe six supercell motion categories given in section 2. The per-centage of cases (out of 180 total) for each category is also giveninside the shaded vertical bars.
OCTOBER 2006 B U N K E R S E T A L . 701

dataset was in good agreement with the predicted su-percell motion (i.e., 3.5 m s�1 mean absolute error) us-ing the shear-relative method of Bunkers et al. (2000),indicating there was nothing “unusual” needed to ex-plain why some storms traveled along boundaries. Al-though this question will not be solved by the presentstudy, the evidence strongly suggests that when the ver-tical wind shear profile engenders a supercell motionthat is closely aligned with a boundary, the probabilityof supercells being long lived is enhanced (i.e., Fig. 8).Hopefully, additional observational and modeling stud-ies will help provide quantitative guidance to betteranswer this question.
b. Regional variations of the long-lived supercellenvironments
The regional breakdown of sounding parametersand forcing strength categories helps explain some ofthe regional differences in supercell properties noted
in Part I. Not surprisingly, PWAT was highest, on av-erage, for the long-lived supercell events across theSoutheast when compared with the other three re-gions, especially the NCNTRL (3.37 versus 2.72 cm;Fig. 9). This translated into lower cloud-base heights(MLLCL � 959 versus 1528 m) and less convectiveinhibition (MLCIN � 27 versus 49 J kg�1) for theSoutheast versus the NCNTRL. Given the increasedmoisture, lower cloud bases, and less convective inhi-bition across the Southeast, the result should be an in-creased coverage of thunderstorms. Therefore, it is un-derstandable why the long-lived supercells were lessisolated in the Southeast versus the other regions (andespecially the NCNTRL).
In terms of atmospheric forcing for the long-livedevents, SF environments were much more common inthe Southeast (56%) and Northeast (64%) when com-pared with the NCNTRL and south-central UnitedStates (SCNTRL; 11% and 34%, respectively; Fig. 9).
FIG. 10. Composite 0–10-km hodographs and observed storm motions (m s�1) for thelong-lived supercell events for each of four regions of the central and eastern United States.The numbers in parentheses correspond to the number of soundings available for each region.Otherwise the same as in Fig. 5.
702 W E A T H E R A N D F O R E C A S T I N G VOLUME 21
The majority of the long-lived supercell events acrossthe Southeast occurred during the cold season when SFenvironments are expected to be most prevalent. Thecombination of the SF environments, high PWAT, andrelatively low MLCIN in the Southeast can further helpto explain the small degree of isolation of supercells inthis region, as well as the tendency toward linear con-vection (50% mixed and 11% linear; Part I).
The MF environments were most common across theNCNTRL and SCNTRL during long-lived supercellevents (50%–51%; Fig. 9), and WF environments wereof secondary importance across the NCNTRL (38%;Fig. 9). These results agree favorably with Roebber etal.’s (2002) numerical modeling study. Nevertheless,
there appears to be various combinations of atmo-spheric forcing strength and local environmental char-acteristics that can engender long-lived supercells (evi-dent in the differences between the central and easternUnited States).
Overall, the deep-layer shear and upper-level storm-relative winds in the long-lived supercell environmentswere similar among the four regions (cf. Bulk0–8km andSRW8km in Fig. 9). Most of the differences, though mi-nor, were confined to the 4–8-km layer. Synopticallyspeaking, west-to-northwest flow in the middle to up-per troposphere was most common across the northernUnited States, while there was a greater tendency forwest-to-southwest flow across the southern UnitedStates (Figs. 9 and 10). The Southeast had the strongestsoutherly component out of all four regions (Fig. 10).
Examination of the regional hodographs and sound-ing parameters provides several clues regarding the re-gional differences in F2–F5 tornado production by thelong-lived supercells. First, the strong 0–1-km shear inthe composite hodograph for the Southeast (Fig. 10) isa characteristic feature of hodographs associated withsupercells that produce strong and violent tornadoes(Markowski et al. 2003). The composite hodograph forthe NCNTRL is generally linear above 1 km, and con-tains the least amount of bulk shear from the surface to1 km (Fig. 10). One measure of this shear, SRH0–1km,
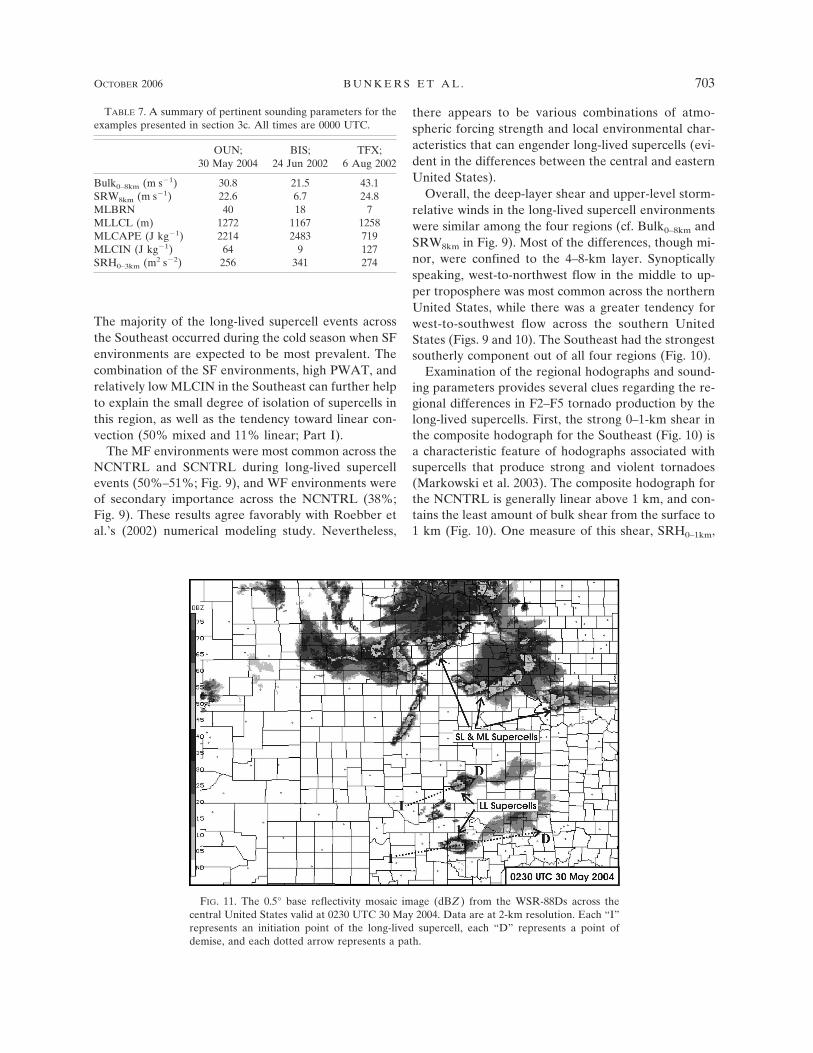
FIG. 11. The 0.5° base reflectivity mosaic image (dBZ ) from the WSR-88Ds across thecentral United States valid at 0230 UTC 30 May 2004. Data are at 2-km resolution. Each “I”represents an initiation point of the long-lived supercell, each “D” represents a point ofdemise, and each dotted arrow represents a path.
TABLE 7. A summary of pertinent sounding parameters for theexamples presented in section 3c. All times are 0000 UTC.
OUN;30 May 2004
BIS;24 Jun 2002
TFX;6 Aug 2002
Bulk0–8km (m s�1) 30.8 21.5 43.1SRW8km (m s�1) 22.6 6.7 24.8MLBRN 40 18 7MLLCL (m) 1272 1167 1258MLCAPE (J kg�1) 2214 2483 719MLCIN (J kg�1) 64 9 127SRH0–3km (m2 s�2) 256 341 274
OCTOBER 2006 B U N K E R S E T A L . 703

was over twice as large in the Southeast versus theNCNTRL (227 versus 102 m2 s�2; Fig. 9).5 Second, theMLLCL, which on average is lower in environmentswhere supercells produce F2–F5 tornadoes (Rasmussenand Blanchard 1998; Thompson et al. 2003), was over600 m lower in the Southeast versus the NCNTRL (959versus 1528 m; Fig. 9). Third, the MLCIN was strongest
over the NCNTRL, possibly reducing the potential forstretching of low-level updrafts and, thus, limitingsignificant tornadoes (e.g., Davies 2004). Therefore,considering the relatively strong SRH0–1km and lowMLLCL heights for long-lived events across the South-east, combined with only modest convective inhibition,it should be expected that the probability of F2–F5tornadoes is greater in the Southeast than it is in theNCNTRL. Using these same arguments, further inspec-tion of Figs. 9 and 10 also supports the higher incidenceof F2–F5 tornadoes in the Northeast and SCNTRLwhen compared with the NCNTRL.
A final noteworthy difference in supercell propertiesamong the four regions is that about one-third of thesupercells over the central United States evolved into
5 SRH0–1km averaged 143 m2 s�2 for the entire long-lived super-cell dataset, versus 83 and 66 m2 s�2 for the moderate- and short-lived supercell events, respectively (Fig. 6). Recall from Part I thelong-lived supercell events produced 2–3 times the number ofstrong and violent tornadoes per hour when compared to theshort-lived events, which is consistent with the higher values ofSRH0–1km for the long-lived events (Markowski et al. 2003; Ras-mussen 2003).
FIG. 12. RUC 0-h analysis valid at 0000 UTC 30 May 2004: (a) Bulk0–8km (solid, �20 m s�1) and SRW8km
(dashed; �10 m s�1), (b) MLCAPE (solid; �1000 J kg�1) and MLCIN (dashed; absolute value � 40 J kg�1),(c) MLBRN (solid; �5) and MLLCL (dashed; �5000 m), and (d) mean sea level pressure (solid; 4-hPa contourinterval), surface �E (dashed; 8-K contour interval), and predicted right-moving supercell motion vectors [m s�1 1.94 (kt); Bunkers et al. (2000)]. The boldface arrows indicate the paths of the two long-lived supercells.
704 W E A T H E R A N D F O R E C A S T I N G VOLUME 21

another form of convection at their demise (e.g., bowecho or squall line; Part I), but only 4% of the eventsacross the eastern United States did so. Given the en-vironmental parameters (Fig. 9), it is possible that thehigher MLLCL heights across the central United Statescontributed to this evolution. These higher cloud basesmight have allowed for stronger downdrafts and surfaceoutflow, potentially favoring evolution from supercellsto bow echoes or squall lines.
c. Examples and forecasting of supercell longevity
In this section the results from the foregoing discus-sion are combined with three case studies to illustratehow they may be applied in an operational setting. Per-tinent sounding parameters from these three examplesare summarized in Table 7.
1) 29 MAY 2004: MULTIPLE SUPERCELL EVENTS
IN THE CENTRAL UNITED STATES
The convection on 29 May 2004, which resulted in 87tornado reports across the central United States, is oneof the more obvious examples of supercell longevity. Along-lived supercell event occurred over Oklahoma andfar southern Kansas (Fig. 11). The Oklahoma supercelllasted 8.25 h (2300–0715 UTC) while the Kansas super-cell lasted 4.5 h (2230–0300 UTC); the supercellsreached their demise by way of dissipation. Both ofthese supercells were quite isolated, associated with adiscrete convective mode, and produced F2–F3 torna-does and hail �5.1 cm (�2 in.). Farther to the north, amixture of short- and moderate-lived supercells oc-curred across northeastern Kansas, southeastern Ne-braska, and northwestern Missouri (Fig. 11). At timesthese supercells were accompanied by nearby storms,and the convective mode evolved from discrete to lin-ear throughout the event. Two of the moderate-livedsupercells also produced a few significant tornadoes.Short-lived supercells were predominant even fartherto the north over northeastern Nebraska and easternSouth Dakota (from which only weak tornadoes werereported).
The long-lived supercell event across the SCNTRLoccurred in an environment associated with MF (i.e.,modest upper-level flow and a surface dryline); themoderate- and short-lived supercell events to the northoccurred under SF conditions (i.e., amplified upper-level flow and a surface cold front). A buoyancy axis atthe surface was oriented north–south across the centralUnited States with the long-lived supercells occurringin a broad warm sector (Figs. 12b and 12d). Bulk0–8km,SRW8km, MLBRN, and MLLCL were favorable forlong-lived supercells across much of Oklahoma andsouthern Kansas (Figs. 12a, 12c, and 13; also see Table
7), whereas Bulk0–8km, SRW8km, and MLBRN indicatedshort-lived supercells from northeastern Nebraskathrough eastern South Dakota (Figs. 12a and 12c). Theconvective inhibition from the Norman, Oklahoma
FIG. 13. (a) Observed 0–10-km hodograph (m s�1) for Norman,OK, valid at 0000 UTC 30 May 2004. Here, Vobs is the observedsupercell motion, VRM-fcst is the predicted right-moving supercellmotion (Bunkers et al. 2000), the dashed line represents the 0–0.5-to 5.5–6-km shear vector, and the square is the surface–6-kmmean wind. Data are plotted every 500 m, but markers are givenonly at 1-km intervals. (b) Observed skew T–logp sounding forNorman valid 0000 UTC 30 May 2004. The ascent path for the1000-m mean-layer parcel is indicated by the dashed line. ML-CAPE is shaded in light gray, and MLCIN is cross-hatched.
OCTOBER 2006 B U N K E R S E T A L . 705
(OUN), sounding also partially explains the isolatednature of the southernmost supercells (Fig. 13b;MLCIN � 64 J kg�1).
In summary, the long-lived supercells fit the proto-typical model of being isolated, discrete, and producersof significant tornadoes. All of the parameters werefavorable for long-lived supercells in Oklahoma andsouthern Kansas, and the larger-scale environment alsofavored the occurrence of long-lived supercells. Con-vection transitioned to shorter-lived supercells fromsouth to north across the central and northern plains asSF was encountered, the convection became less iso-lated, and the strength of the deep-layer shear de-creased. The SF and nonisolated storms in this northernarea led to a relatively rapid upscale growth to linearconvection.
2) 23 JUNE 2002: LONG-LIVED SUPERCELL EVENT
IN NORTH DAKOTA
The 23 June 2002 long-lived supercell event in centralNorth Dakota was a complex scenario involving the
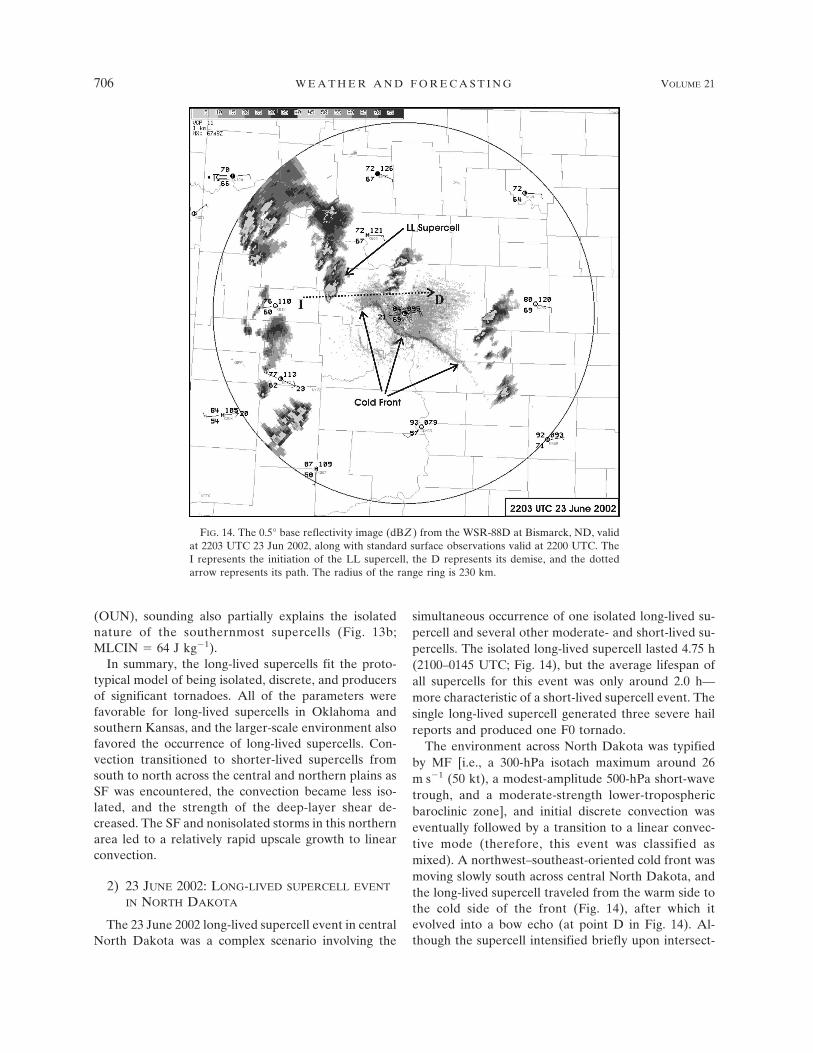
simultaneous occurrence of one isolated long-lived su-percell and several other moderate- and short-lived su-percells. The isolated long-lived supercell lasted 4.75 h(2100–0145 UTC; Fig. 14), but the average lifespan ofall supercells for this event was only around 2.0 h—more characteristic of a short-lived supercell event. Thesingle long-lived supercell generated three severe hailreports and produced one F0 tornado.
The environment across North Dakota was typifiedby MF [i.e., a 300-hPa isotach maximum around 26m s�1 (50 kt), a modest-amplitude 500-hPa short-wavetrough, and a moderate-strength lower-troposphericbaroclinic zone], and initial discrete convection waseventually followed by a transition to a linear convec-tive mode (therefore, this event was classified asmixed). A northwest–southeast-oriented cold front wasmoving slowly south across central North Dakota, andthe long-lived supercell traveled from the warm side tothe cold side of the front (Fig. 14), after which itevolved into a bow echo (at point D in Fig. 14). Al-though the supercell intensified briefly upon intersect-
FIG. 14. The 0.5° base reflectivity image (dBZ ) from the WSR-88D at Bismarck, ND, validat 2203 UTC 23 Jun 2002, along with standard surface observations valid at 2200 UTC. TheI represents the initiation of the LL supercell, the D represents its demise, and the dottedarrow represents its path. The radius of the range ring is 230 km.
706 W E A T H E R A N D F O R E C A S T I N G VOLUME 21

ing the boundary, it maintained its due east directionand did not deviate along the boundary. The F0 tor-nado was produced 85 min after the supercell crossedthe boundary, and 39 km toward the cold side (e.g.,Markowski et al. 1998).
Sounding parameters provided mixed signals for thiscase. Values of Bulk0–8km and SRW8km were in rangesconsidered favorable for short-lived supercells (cf. Figs.15a and 16a with Figs. 1 and 2; also see Table 7). How-ever, the MLBRN and MLLCL were in ranges condu-cive to the occurrence of moderate- and long-lived su-percells (cf. Figs. 15c and 16b with Figs. 1, 3, and 4). Thetrack of the long-lived supercell gradually took it to-ward slightly less buoyant air (Figs. 15b and 15d), but it
did stay near the frontal boundary for the first half of itslifetime. It is difficult to say why this one supercell waslong lived, and the others were not, but it may havebeen related to its close proximity to the front; theother supercells did not have as long of a residence timenear this boundary. Perhaps if the vertical wind shearprofile would have better supported a southeast mo-tion, the supercell would have remained nearer to thefront and lived even longer. Rasmussen et al. (2000)also provided documentation of long-, moderate-, andshort-lived supercells occurring in close proximity toone another, and a mesoscale boundary appeared toplay a key role in the storm evolution.
In summary, this case study shows that long-lived
FIG. 15. RUC 0-h analysis valid at 2200 UTC 23 Jun 2002: (a) Bulk0–8km (solid; �20 m s�1) and SRW8km (dashed;�10 m s�1), (b) MLCAPE (solid; �1000 J kg�1) and MLCIN (dashed; absolute value � 40 J kg�1), (c) MLBRN(solid; �5) and MLLCL (dashed; �3000 m), and (d) mean sea level pressure (solid; 2-hPa contour interval),surface �E (dashed; 4-K contour interval), and predicted right-moving supercell motion vectors [m s�1 1.94 (kt);Bunkers et al. (2000)]. The boldface arrow indicates the path of the long-lived supercell.
OCTOBER 2006 B U N K E R S E T A L . 707
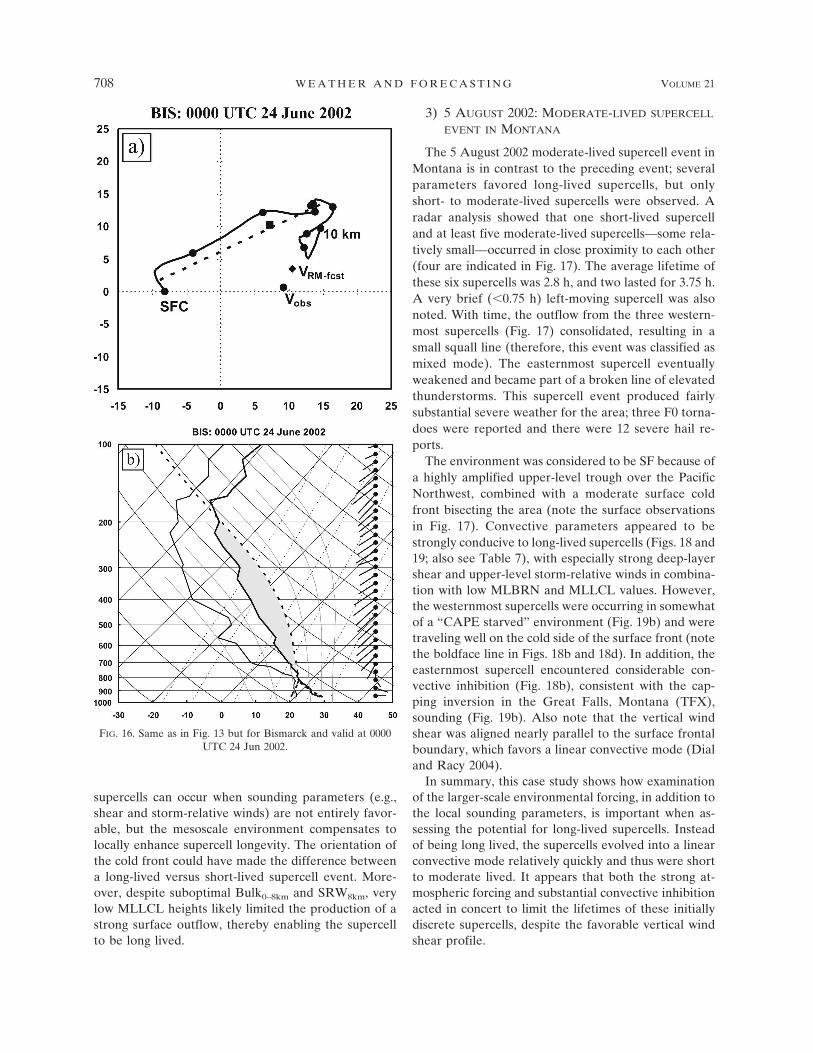
supercells can occur when sounding parameters (e.g.,shear and storm-relative winds) are not entirely favor-able, but the mesoscale environment compensates tolocally enhance supercell longevity. The orientation ofthe cold front could have made the difference betweena long-lived versus short-lived supercell event. More-over, despite suboptimal Bulk0–8km and SRW8km, verylow MLLCL heights likely limited the production of astrong surface outflow, thereby enabling the supercellto be long lived.
3) 5 AUGUST 2002: MODERATE-LIVED SUPERCELL
EVENT IN MONTANA
The 5 August 2002 moderate-lived supercell event inMontana is in contrast to the preceding event; severalparameters favored long-lived supercells, but onlyshort- to moderate-lived supercells were observed. Aradar analysis showed that one short-lived supercelland at least five moderate-lived supercells—some rela-tively small—occurred in close proximity to each other(four are indicated in Fig. 17). The average lifetime ofthese six supercells was 2.8 h, and two lasted for 3.75 h.A very brief (�0.75 h) left-moving supercell was alsonoted. With time, the outflow from the three western-most supercells (Fig. 17) consolidated, resulting in asmall squall line (therefore, this event was classified asmixed mode). The easternmost supercell eventuallyweakened and became part of a broken line of elevatedthunderstorms. This supercell event produced fairlysubstantial severe weather for the area; three F0 torna-does were reported and there were 12 severe hail re-ports.
The environment was considered to be SF because ofa highly amplified upper-level trough over the PacificNorthwest, combined with a moderate surface coldfront bisecting the area (note the surface observationsin Fig. 17). Convective parameters appeared to bestrongly conducive to long-lived supercells (Figs. 18 and19; also see Table 7), with especially strong deep-layershear and upper-level storm-relative winds in combina-tion with low MLBRN and MLLCL values. However,the westernmost supercells were occurring in somewhatof a “CAPE starved” environment (Fig. 19b) and weretraveling well on the cold side of the surface front (notethe boldface line in Figs. 18b and 18d). In addition, theeasternmost supercell encountered considerable con-vective inhibition (Fig. 18b), consistent with the cap-ping inversion in the Great Falls, Montana (TFX),sounding (Fig. 19b). Also note that the vertical windshear was aligned nearly parallel to the surface frontalboundary, which favors a linear convective mode (Dialand Racy 2004).
In summary, this case study shows how examinationof the larger-scale environmental forcing, in addition tothe local sounding parameters, is important when as-sessing the potential for long-lived supercells. Insteadof being long lived, the supercells evolved into a linearconvective mode relatively quickly and thus were shortto moderate lived. It appears that both the strong at-mospheric forcing and substantial convective inhibitionacted in concert to limit the lifetimes of these initiallydiscrete supercells, despite the favorable vertical windshear profile.
FIG. 16. Same as in Fig. 13 but for Bismarck and valid at 0000UTC 24 Jun 2002.
708 W E A T H E R A N D F O R E C A S T I N G VOLUME 21

4) OTHER CASES
Several additional examples could be used to illus-trate the dependence of supercell longevity on supercellmotion. For example, the tornado outbreak on 4 May2003 (NOAA 2005) featured several supercells thatwere traveling at a large angle (�60°) to a relativelynarrow ridge of equivalent potential temperature.Sounding parameters were highly conducive to long-lived supercells within this swath of favorable moistureand buoyancy. And although one long-lived supercellwas observed, most supercells were short to moderatelived with an average lifespan of around 3.0 h for thesupercells in eastern Kansas, eastern Oklahoma, Mis-souri, and northern Arkansas. The shortest-lived super-cells occurred where the width of the moisture–buoyancy ridge was the smallest.
Last, the fifth-longest-lived supercell in the presentdataset (9.5 h), and also the costliest hailstorm on rec-ord (Changnon and Burroughs 2003), traveled nearlyparallel to a stationary front and within a large regionof favorable moisture and buoyancy for its entire life-time. All of the sounding parameters were favorable for
long-lived supercells in this region (i.e., this was one ofthe more obvious events). Therefore, the local andlarger-scale environments appeared to act synergisti-cally in this case to produce an extremely long-livedsupercell.
4. Conclusions and summary
The environments of long-lived supercells were com-pared with those of moderate- and short-lived super-cells in an attempt to improve our understanding ofthese significant storms. Emphasis was placed both onlocal sounding parameters as well as overviews of themesoscale to synoptic-scale settings. Moreover, re-gional variations of these environmental conditionswere explored to address some of the questions raisedin Part I. Three case studies illustrated how these re-sults may be applied in an operational setting, and theyalso indicated the complexity that can be associatedwith these supercell events. Based on the above analy-ses, the primary conclusions are grouped into three cat-egories.
FIG. 17. The 0.5° base reflectivity image (dBZ ) from the WSR-88D at Great Falls, MT, validat 0138 UTC 6 Aug 2002, along with standard surface observations valid at 0200 UTC. Theradius of the range ring is 230 km.
OCTOBER 2006 B U N K E R S E T A L . 709

1) The near-storm environment:• The 0–8-km bulk wind shear is much stronger in
the environments of long-lived supercells whencompared with short-lived supercells, leading tostronger 8-km storm-relative winds. These factorssupport increased updraft strength via enhancedrotation and decreased downdraft strength viacurtailed outflow production.
• A balance between buoyancy and vertical windshear exists in long-lived supercell environments,such that the MLBRN displays a relatively narrowrange mostly from 5 to 45. As the MLBRN in-creases above 50, buoyancy becomes dominant
relative to the shear and such an environment isassociated with shorter-lived supercells.
• Long-lived supercells form in environments thatare typically more conducive to producing strongand violent tornadoes (i.e., lower MLLCL heightsand stronger SRH0–1km) than the environments ofshort-lived supercells, reinforcing the notion fromPart I that there is a connection between supercelllongevity and the production of F2–F5 tornadoes.
2) The mesoscale to synoptic-scale environment:• Overall, long-lived supercells are most common in
MF environments, and short-lived supercells aremost common in WF environments; the stronger
FIG. 18. RUC 0-h analysis valid at 0200 UTC 6 Aug 2002: (a) Bulk0–8km (solid; �20 m s�1) and SRW8km (dashed;�10 m s�1), (b) MLCAPE (solid; �500 J kg�1) and MLCIN (dashed; absolute value � 40 J kg�1), (c) MLBRN(solid; �5) and MLLCL (dashed; �3000 m), and (d) mean sea level pressure (solid; 2-hPa contour interval),surface �E (dashed; 8-K contour interval), and predicted right-moving supercell motion vectors [m s�1 1.94 (kt);Bunkers et al. (2000)]. The short boldface line indicates the location where three moderate-lived supercells joinedto form a line, and the boldface arrow indicates the path of a fourth moderate-lived supercell.
710 W E A T H E R A N D F O R E C A S T I N G VOLUME 21

the forcing strength, the greater the likelihood oflinear and mixed convective modes.
• Supercell motion and longevity are intertwined.Supercell motion somewhat along a boundary ormoisture/buoyancy axis, toward increasing mois-ture and MLCAPE, or within a broad warm sec-tor, is most favorable for long-lived supercells.
3) For the regional comparisons:• Increased precipitable water, lower cloud-base
heights, decreased convective inhibition, and SFenvironments are associated with the lower fre-
quency of isolated and discrete supercells in theSoutheast versus the NCNTRL.
• The MF environments are most common for thelong-lived supercell events across the centralUnited States, and SF environments are mostcommon across the eastern United States.
• Cloud-base heights and low-level shear are leastfavorable for F2–F5 tornadoes in long-lived super-cell environments across the NCNTRL—relativeto the rest of the central and eastern UnitedStates.
The combination of strong deep-layer shear, strongstorm-relative winds, small MLBRN, and low MLLCLheights seems to optimize the potential for the longest-lived supercells. First and foremost, strong vertical windshear both supports updraft rotation and inhibits rela-tively weak convection, potentially reducing the totalnumber of storms while enhancing the development ofthe stronger ones (Pastushkov 1975; Weisman andKlemp 1986). Long-lived supercells, therefore, aremore isolated and discrete than short-lived supercells.Second, the upper-level storm-relative winds operate tocarry hydrometeors away from the updraft, and lowMLLCL heights help to reduce subcloud evaporation.Together, these two factors can limit the strength of thedowndraft and thus prevent the surface gust front fromadvancing too far ahead of the updraft. The end resultis a strongly rotating storm that has limited interferencebetween the updraft and downdraft and therefore acurtailed outflow production, which enhances the prob-ability for a long lifespan. Finally, the examples re-vealed that when one of the above parameters is sub-optimal, others can partially compensate to aid long-lived supercells (e.g., low MLLCL heights can make upfor a lack of deep-layer shear).
Perhaps most noteworthy, supercell motion—withrespect to boundaries, moisture/buoyancy axes, andmid- to upper-level forcing mechanisms—has the abil-ity to enhance or limit the longevity of a supercell,which is congruent with the findings of Maddox et al.(1980; their Fig. 1), Wilson and Megenhardt (1997), andAtkins et al. (1999). This relationship may be just assignificant as is the near-storm environment in deter-mining supercell longevity. Accordingly, long-lived su-percells can exist (be absent) even in environments withweak-to-moderate (strong) shear.
The results of the present study have been synthe-sized into a simple and highly generalized conceptualmodel that may be useful as an operational guide whenforecasting supercell longevity (Fig. 20). This is notmeant to represent all configurations under which long-lived supercells can occur; rather, it should serve as a
FIG. 19. Same as in Fig. 13 but for Great Falls and valid at 0000UTC 6 Aug 2002.
OCTOBER 2006 B U N K E R S E T A L . 711

reminder of the important processes (on both the localand larger scales) leading to long-lived supercells. Forexample, at times the surface equivalent potential tem-perature (�E) ridge may be narrower than shown in Fig.20, and supercells that travel perpendicular to this maynot be long lived. In other circumstances, the buoyancyaxis may be oriented north–south with supercell motionright along the axis—a favorable scenario for long-livedsupercells. Also note from Fig. 20 that there is typicallya spectrum of atmospheric forcing on a given day, sup-porting a range of convective modes and supercell life-
times; two upper-level jets need not be present. Theleft-moving supercell labeled Quickly Less-Buoyantserves as a reminder that elevated supercells can traveltoward the cold side of a boundary and still persist forseveral hours if sufficient buoyancy is present above thefrontal zone. The “dryline” supercell labeled TowardMore-Buoyant demonstrates that some of these poten-tially long-lived supercells die prematurely as the stormencounters progressively increasing MLCIN (despitemoving into more buoyancy). Last, because supercellmotion can influence supercell longevity, we recom-
FIG. 20. A highly generalized conceptual model of supercell longevity with guideline valuesfor optimal favorability of long-lived supercells. The synoptic pattern in any specific situationmay vary from that shown here; for example, there may not be two jets, the frontal patternmay be different, or the �E ridge may have a different orientation. The percentages within theicons represent the relative frequency of long-lived supercells in that particular category asdepicted in Fig. 8, and arrows indicate general supercell motions. The mean lifespan for theicons in the legend represents the average duration of all long-lived supercells correspondingto that particular shading. See the end of section 2 for a description of the categories, and referto sections 3a(2) and 3a(4) for an explanation of the conceptual model.
712 W E A T H E R A N D F O R E C A S T I N G VOLUME 21

mend overlaying forecast supercell motion vectors onradar/satellite imagery, surface analyses, topographicdisplays, and even model-derived synoptic fields, whichis implied in Fig. 20.
As a final thought, it is tempting to develop a param-eter or index of supercell longevity using the resultsherein as depicted in Fig. 20. However, there are atleast two reasons why this might not be prudent. First,a supercell longevity parameter would potentially maskthe information gained from looking at the individualparameter fields (e.g., Figs. 12, 15, and 18). Second, asingle parameter belies the importance of all other po-tentially relevant characteristics of the mesoscale tosynoptic-scale environment, and could possibly misleada forecaster into making an incorrect assessment of su-percell longevity. Therefore, in order to understand andforecast supercell longevity, we advocate viewing dis-plays similar to those shown in the examples in section3c. We also note it is imperative to perform a carefulsubjective analysis of surface and upper-air observa-tions, followed by a careful environmental diagnosis,both of which are vitally important to the forecast pro-cess.
In closing, forecasting supercell longevity can becomplex at times. But with a basic understanding of thekey parameters and environmental conditions, it be-comes an achievable goal.
Acknowledgments. We thank (i) the NOAA CentralLibrary, which supplied many of the references perti-nent to this study; (ii) Andrew Detwiler, Roger Ed-wards, Paul Smith, Dennis Todey, and one anonymousreviewer whose comments helped to greatly improvethe manuscript; and (iii) David Carpenter, meteorolo-gist-in-charge, at the NWS in Rapid City, South Da-kota, for supporting this work.
REFERENCES
Atkins, N. T., M. L. Weisman, and L. J. Wicker, 1999: The influ-ence of preexisting boundaries on supercell evolution. Mon.Wea. Rev., 127, 2910–2927.
Benjamin, S. G., and Coauthors, 2004: An hourly assimilation–forecast cycle: The RUC. Mon. Wea. Rev., 132, 495–518.
Bluestein, H. B., and M. L. Weisman, 2000: The interaction ofnumerically simulated supercells initiated along lines. Mon.Wea. Rev., 128, 3128–3149.
Brooks, H. E., C. A. Doswell III, and J. Cooper, 1994a: On theenvironments of tornadic and nontornadic mesocyclones.Wea. Forecasting, 9, 606–618.
——, ——, and R. B. Wilhelmson, 1994b: The role of midtropo-spheric winds in the evolution and maintenance of low-levelmesocyclones. Mon. Wea. Rev., 122, 126–136.
Browning, K. A., 1977: The structure and mechanisms of hail-storms. Hail: A Review of Hail Science and Hail Suppression,Meteor. Monogr., No. 38, Amer. Meteor. Soc., 1–43.
Bunkers, M. J., B. A. Klimowski, J. W. Zeitler, R. L. Thompson,and M. L. Weisman, 2000: Predicting supercell motion usinga new hodograph technique. Wea. Forecasting, 15, 61–79.
——, ——, and ——, 2002: The importance of parcel choice andthe measure of vertical wind shear in evaluating the convec-tive environment. Preprints, 21st Conf. on Severe LocalStorms, San Antonio, TX, Amer. Meteor. Soc., 379–382.
——, M. R. Hjelmfelt, and P. L. Smith, 2006: An observationalexamination of long-lived supercells. Part I: Characteristics,evolution, and demise. Wea. Forecasting, 21, 673–688.
Changnon, S. A., and J. Burroughs, 2003: The tristate hailstorm:The most costly on record. Mon. Wea. Rev., 131, 1734–1739.
Chisholm, A. J., and J. H. Renick, 1972: The kinematics of mul-ticell and supercell Alberta hailstorms. Alberta Hail Studies,Research Council of Alberta Hail Studies Rep. 72-2, 24–31.
Craven, J. P., R. E. Jewell, and H. E. Brooks, 2002: Comparisonbetween observed convective cloud-base heights and liftingcondensation level for two different lifted parcels. Wea. Fore-casting, 17, 885–890.
Davies, J. M., 2004: Estimations of CIN and LFC associated withtornadic and nontornadic supercells. Wea. Forecasting, 19,714–726.
Davies-Jones, R., D. Burgess, and M. Foster, 1990: Test of helicityas a tornado forecast parameter. Preprints, 16th Conf. onSevere Local Storms, Kananaskis Park, AB, Canada, Amer.Meteor. Soc., 588–592.
Dial, G. L., and J. P. Racy, 2004: Forecasting short term convec-tive mode and evolution for severe storms initiated alongsynoptic boundaries. Preprints, 22d Conf. on Severe LocalStorms, Hyannis, MA, Amer. Meteor. Soc., CD-ROM,11A.2.
Doswell, C. A., III, 1987: The distinction between large-scale andmesoscale contribution to severe convection: A case studyexample. Wea. Forecasting, 2, 3–16.
——, and E. N. Rasmussen, 1994: The effect of neglecting thevirtual temperature correction on CAPE calculations. Wea.Forecasting, 9, 625–629.
——, R. Davies-Jones, and D. L. Keller, 1990: On summary mea-sures of skill in rare event forecasting based on contingencytables. Wea. Forecasting, 5, 576–585.
——, D. V. Baker, and C. A. Liles, 2002: Recognition of negativemesoscale factors for severe-weather potential: A case study.Wea. Forecasting, 17, 937–954.
Droegemeier, K. K., S. M. Lazarus, and R. Davies-Jones, 1993:The influence of helicity on numerically simulated convectivestorms. Mon. Wea. Rev., 121, 2005–2029.
Elmore, K. L., D. J. Stensrud, and K. C. Crawford, 2002: En-semble cloud model applications to forecasting thunder-storms. J. Appl. Meteor., 41, 363–383.
Evans, J. S., and C. A. Doswell III, 2001: Examination of derechoenvironments using proximity soundings. Wea. Forecasting,16, 329–342.
Fankhauser, J. C., and C. G. Mohr, 1977: Some correlations be-tween various sounding parameters and hailstorm character-istics in northeast Colorado. Preprints, 10th Conf. on SevereLocal Storms, Omaha, NE, Amer. Meteor. Soc., 218–225.
Gilmore, M. S., and L. J. Wicker, 1998: The influence of midtro-pospheric dryness on supercell morphology and evolution.Mon. Wea. Rev., 126, 943–958.
Klimowski, B. A., and M. J. Bunkers, 2002: Comments on “Sat-ellite observations of a severe supercell thunderstorm on 24
OCTOBER 2006 B U N K E R S E T A L . 713

July 2000 made during the GOES-11 science test.” Wea.Forecasting, 17, 1111–1117.
LaDue, J. G., 1998: The influence of two cold fronts on stormmorphology. Preprints, 19th Conf. on Severe Local Storms,Minneapolis, MN, Amer. Meteor. Soc., 324–327.
Lemon, L. R., 1980: Severe thunderstorm radar identificationtechniques and warning criteria. NOAA Tech. Memo. NWSNSSFC-3, 60 pp. [Available from NOAA Central Library,1315 East–West Highway, Silver Spring, MD 20910.]
Lilly, D. K., 1986: The structure, energetics, and propagation ofrotating convective storms. Part II: Helicity and storm stabi-lization. J. Atmos. Sci., 43, 126–140.
Maddox, R. A., L. R. Hoxit, and C. F. Chappell, 1980: A study oftornadic thunderstorm interactions with thermal boundaries.Mon. Wea. Rev., 108, 322–336.
Markowski, P. M., E. N. Rasmussen, and J. M. Straka, 1998: Theoccurrence of tornadoes in supercells interacting with bound-aries during VORTEX-95. Wea. Forecasting, 13, 852–859.
——, J. M. Straka, and E. N. Rasmussen, 2002: Direct surfacethermodynamic observations within the rear-flank down-drafts of nontornadic and tornadic supercells. Mon. Wea.Rev., 130, 1692–1721.
——, C. Hannon, J. Frame, E. Lancaster, A. Pietrycha, R. Ed-wards, and R. L. Thompson, 2003: Characteristics of verticalwind profiles near supercells obtained from the Rapid Up-date Cycle. Wea. Forecasting, 18, 1262–1272.
Marwitz, J. D., 1972: The structure and motion of severe hail-storms. Part III: Severely sheared storms. J. Appl. Meteor.,11, 189–201.
McCaul, E. W., Jr., and C. Cohen, 2002: The impact on simulatedstorm structure and intensity of variations in the mixed layerand moist layer depths. Mon. Wea. Rev., 130, 1722–1748.
McNulty, R. P., 1995: Severe and convective weather: A CentralRegion forecasting challenge. Wea. Forecasting, 10, 187–202.
NOAA, cited 2005: Record tornado outbreaks of May 4–10, 2003.NOAA/NWS Service Assessment. [Available online at http://www.nws.noaa.gov/om/assessments/ pdfs/record-may.pdf.]
Pastushkov, R. S., 1975: The effects of vertical wind shear on theevolution of convective clouds. Quart. J. Roy. Meteor. Soc.,101, 281–291.
Rasmussen, E. N., 2003: Refined supercell and tornado forecastparameters. Wea. Forecasting, 18, 530–535.
——, and D. O. Blanchard, 1998: A baseline climatology ofsounding-derived supercell and tornado forecast parameters.Wea. Forecasting, 13, 1148–1164.
——, and J. M. Straka, 1998: Variations in supercell morphology.
Part I: Observations of the role of upper-level storm-relativeflow. Mon. Wea. Rev., 126, 2406–2421.
——, S. Richardson, J. M. Straka, P. M. Markowski, and D. O.Blanchard, 2000: The association of significant tornadoeswith a baroclinic boundary on 2 June 1995. Mon. Wea. Rev.,128, 174–191.
Roebber, P. J., D. M. Schultz, and R. Romero, 2002: Synopticregulation of the 3 May 1999 tornado outbreak. Wea. Fore-casting, 17, 399–429.
Thompson, R. L., R. Edwards, J. A. Hart, K. L. Elmore, and P.Markowski, 2003: Close proximity soundings within supercellenvironments obtained from the Rapid Update Cycle. Wea.Forecasting, 18, 1243–1261.
——, C. M. Mead, and R. Edwards, 2004: Effective bulk shear insupercell thunderstorm environments. Preprints, 22d Conf.on Severe Local Storms, Hyannis, MA, Amer. Meteor. Soc.,CD-ROM, P1.1.
Turner, D. D., B. M. Lesht, S. A. Clough, J. C. Liljegren, H. E.Revercomb, and D. C. Tobin, 2003: Dry bias and variabilityin Vaisala RS80-H radiosondes: The ARM experience. J. At-mos. Oceanic Technol., 20, 117–132.
UCAR, cited 2005: A convective storm matrix: Buoyancy/sheardependencies. Cooperative Program for Operational Meteo-rology, Education, and Training, Boulder, CO. [Availableonline at http://meted.ucar.edu/convectn/csmatrix/.]
Weisman, M. L., and J. B. Klemp, 1982: The dependence of nu-merically simulated convective storms on vertical wind shearand buoyancy. Mon. Wea. Rev., 110, 504–520.
——, and ——, 1986: Characteristics of isolated convectivestorms. Mesoscale Meteorology and Forecasting, P. S. Ray,Ed., Amer. Meteor. Soc., 331–358.
——, and R. Rotunno, 2000: The use of vertical wind shear versushelicity in interpreting supercell dynamics. J. Atmos. Sci., 57,1452–1472.
Wilhelmson, R. B., and J. B. Klemp, 1978: A numerical study ofstorm splitting that leads to long-lived storms. J. Atmos. Sci.,35, 1974–1986.
Wilks, D. S., 1995: Statistical Methods in the Atmospheric Sciences.Academic Press, 467 pp.
Wilson, J. W., and D. L. Megenhardt, 1997: Thunderstorm initia-tion, organization, and lifetime associated with Floridaboundary layer convergence lines. Mon. Wea. Rev., 125,1507–1525.
Zeitler, J. W., and M. J. Bunkers, 2005: Operational forecasting ofsupercell motion: Review and case studies using multipledatasets. Natl. Wea. Dig., 29, 81–97.
714 W E A T H E R A N D F O R E C A S T I N G VOLUME 21