An Isotopic Analysis of the Diet of the Greenland Norse -...
26
Introduction Our understanding of the Norse dietary adapta- tions to their Greenlandic home comes primarily from sparse historical records, from what is known of the Norse dietary economy in other North Atlantic lands, and from zooarchaeological examinations of the animal bones found in the various excavations of Norse Greenlandic sites which have taken place over the past century (a detailed review of this in- formation is given by Arneborg et al. 2012a [this volume]). There are very de¿nite limitations to the information provided by all these sources. In par- ticular, it is dif¿cult to advance from qualitative to quantitative dietary reconstruction and it is impos- sible to obtain information on the diets of individu- als. However a limited, early study has revealed the potential of isotopic analysis of human bone in this respect (Arneborg et al. 1999, Lynnerup 1998). We know the Greenlandic Norse could not routinely, if at all, grow cereal crops for bread or even for beer; that they had available to them enormous amounts of wild game (e.g., the migrating seals); and that they raised cattle, sheep, goats, horses, and even pigs which they had imported from their homelands (Arneborg et al. 2012a [this volume]). What we don't know is the extent to which these animals played a role in the basic Norse dietary economy. Was their diet based on agrarian pastoralism supplemented by hunting wild animals, or was it hunting supple- mented by the traditional foods provided by their domestic animals? Did this differ from site to site or from person to person? It is quantitative questions of this sort that one can hope to address through the use of isotopic dietary analysis. In circumstances in which the alternative dietary reservoirs can be characterized by their stable isotope values, it may be possible to analyze the remnant tissues of a hu- man consumer and thus obtain direct information of the relative importance of the two reservoirs to that human’s diet. These concepts have been widely used for dietary reconstruction of medieval populations (e.g., Bocherens et al. 1991; Herrscher et al. 2001; Mays 1997; Müldner and Richards 2005, 2007; Polet and Katzenberg 2003; Richards et al.1998, 2006; Rutgers et al. 2009; Salamon et al. 2008) as well as Stone Age populations (e.g., Olsen and Heinemeier 2007, Olsen et al. 2010), and described in the archae- ological and scienti¿c literature (cf. Ambrose 1993, Ambrose and Katzenberg 2000, Bourbou et al. 2011, Hedges and Reynard 2007, Kelly 2000, Lidén 1995, Richards and Hedges 1999, Robbins et al. 2010, Schoeninger and DeNiro 1984, Schoeninger and Moore 1992, Wada et al. 1991) and in other papers in this volume (e.g., Nelson et al. 2012a). So there is no need here for a further repetition of the principles and methodology, as it is covered by numerous reviews (e.g., Grupe and Peters 2007, Katzenberg 2007, Lee-Thorp 2008). Even so, before we proceed An Isotopic Analysis of the Diet of the Greenland Norse D. Erle Nelson 1 , Jan Heinemeier 2 , Niels Lynnerup 3 , Árný E. Sveinbjörnsdóttir 6 , and Jette Arneborg 4,5,* Abstract - Our understanding of the Norse dietary adaptations to their Greenlandic home comes primarily from sparse historical records, from what is known of the Norse dietary economy in other North Atlantic lands, and from zooarchaeo- logical examinations of the animal bones found in the various excavations of Norse Greenlandic sites which have taken place over the past century. To obtain more detailed information on the diets of the Norse settlers in Greenland, measures of the stable carbon (į 13 C) and nitrogen (į 15 N) values of human bone collagen have been made for 80 individuals from an existing collection of Norse skeletal material. The material is from ¿ve churchyards in the Norse Eastern Settlement and two churchyards in the Western Settlement. These data are interpreted with the aid of similar data obtained for the wild fauna of Greenland, for the Norse domestic animals and for a number of Thule Culture individuals of about the same time period. It is clear that application of the isotopic dietary method to Greenland is complex, but even so, it can provide very useful information. It is also clear that the isotopic method provides reliable information on Greenlandic diet even at the level of the individual. For the two Norse settlements taken as a whole, the basic dietary economy was based about as much on hunting as it was on their domestic animals. We see no evidence for real differences between the diets of men and women or between individuals of different ages. The large individual differences are then likely connected to status or circumstance, but not to sex or age. Special Volume 3:93–118 Greenland Isotope Project: Diet in Norse Greenland AD 1000–AD 1450 Journal of the North Atlantic 1 FRSC Professor Emeritus, Simon Fraser University, Department of Archaeology. Burnaby, BC, Canada. 2 AMS 14 C Dat- ing Centre, Department of Physics and Astronomy, Aarhus University, Ny Munkegade 120, DK-8000 Aarhus C, Denmark. 3 Laboratory of Biological Anthropology, Section of Forensic Pathology, University of Copenhagen, Copenhagen, Denmark. 4 Danish Middle Ages and Renaissance, Research and Exhibitions, The National Museum of Denmark Frederiksholms Ka- nal 12, DK-1220 Copenhagen. 5 Institute of Geography, School of GeoSciences, University of Edinburgh, Scotland, UK. 6 Institute of Earth Science, University of Iceland, Sturlugate 7, S-101, Reykjavík, Iceland. * Corresponding author - Jette. [email protected]. 2012
Transcript of An Isotopic Analysis of the Diet of the Greenland Norse -...

D.E. Nelson, J. Heinemeier, N. Lynnerup, Á.E. Sveinbjörnsdóttir, and J. Arneborg2012 93
Introduction
Our understanding of the Norse dietary adapta-tions to their Greenlandic home comes primarily from sparse historical records, from what is known of the Norse dietary economy in other North Atlantic lands, and from zooarchaeological examinations of the animal bones found in the various excavations of Norse Greenlandic sites which have taken place over the past century (a detailed review of this in-formation is given by Arneborg et al. 2012a [this volume]). There are very de nite limitations to the information provided by all these sources. In par-ticular, it is dif cult to advance from qualitative to quantitative dietary reconstruction and it is impos-sible to obtain information on the diets of individu-als. However a limited, early study has revealed the potential of isotopic analysis of human bone in this respect (Arneborg et al. 1999, Lynnerup 1998). We know the Greenlandic Norse could not routinely, if at all, grow cereal crops for bread or even for beer; that they had available to them enormous amounts of wild game (e.g., the migrating seals); and that they raised cattle, sheep, goats, horses, and even pigs which they had imported from their homelands (Arneborg et al. 2012a [this volume]). What we don't know is the extent to which these animals played a role in the basic Norse dietary economy. Was their diet based on agrarian pastoralism supplemented by hunting wild animals, or was it hunting supple-
mented by the traditional foods provided by their domestic animals? Did this differ from site to site or from person to person? It is quantitative questions of this sort that one can hope to address through the use of isotopic dietary analysis. In circumstances in which the alternative dietary reservoirs can be characterized by their stable isotope values, it may be possible to analyze the remnant tissues of a hu-man consumer and thus obtain direct information of the relative importance of the two reservoirs to that human’s diet. These concepts have been widely used for dietary reconstruction of medieval populations (e.g., Bocherens et al. 1991; Herrscher et al. 2001; Mays 1997; Müldner and Richards 2005, 2007; Polet and Katzenberg 2003; Richards et al.1998, 2006; Rutgers et al. 2009; Salamon et al. 2008) as well as Stone Age populations (e.g., Olsen and Heinemeier 2007, Olsen et al. 2010), and described in the archae-ological and scienti c literature (cf. Ambrose 1993, Ambrose and Katzenberg 2000, Bourbou et al. 2011, Hedges and Reynard 2007, Kelly 2000, Lidén 1995, Richards and Hedges 1999, Robbins et al. 2010, Schoeninger and DeNiro 1984, Schoeninger and Moore 1992, Wada et al. 1991) and in other papers in this volume (e.g., Nelson et al. 2012a). So there is no need here for a further repetition of the principles and methodology, as it is covered by numerous reviews (e.g., Grupe and Peters 2007, Katzenberg 2007, Lee-Thorp 2008). Even so, before we proceed
An Isotopic Analysis of the Diet of the Greenland Norse
D. Erle Nelson1, Jan Heinemeier2, Niels Lynnerup3, Árný E. Sveinbjörnsdóttir6, and Jette Arneborg4,5,*
Abstract - Our understanding of the Norse dietary adaptations to their Greenlandic home comes primarily from sparse historical records, from what is known of the Norse dietary economy in other North Atlantic lands, and from zooarchaeo-logical examinations of the animal bones found in the various excavations of Norse Greenlandic sites which have taken place over the past century. To obtain more detailed information on the diets of the Norse settlers in Greenland, measures of the stable carbon ( 13C) and nitrogen ( 15N) values of human bone collagen have been made for 80 individuals from an existing collection of Norse skeletal material. The material is from ve churchyards in the Norse Eastern Settlement and two churchyards in the Western Settlement. These data are interpreted with the aid of similar data obtained for the wild fauna of Greenland, for the Norse domestic animals and for a number of Thule Culture individuals of about the same time period. It is clear that application of the isotopic dietary method to Greenland is complex, but even so, it can provide very useful information. It is also clear that the isotopic method provides reliable information on Greenlandic diet even at the level of the individual. For the two Norse settlements taken as a whole, the basic dietary economy was based about as much on hunting as it was on their domestic animals. We see no evidence for real differences between the diets of men and women or between individuals of different ages. The large individual differences are then likely connected to status or circumstance, but not to sex or age.
Special Volume 3:93–118Greenland Isotope Project: Diet in Norse Greenland AD 1000–AD 1450
Journal of the North Atlantic
1FRSC Professor Emeritus, Simon Fraser University, Department of Archaeology. Burnaby, BC, Canada. 2AMS 14C Dat-ing Centre, Department of Physics and Astronomy, Aarhus University, Ny Munkegade 120, DK-8000 Aarhus C, Denmark. 3Laboratory of Biological Anthropology, Section of Forensic Pathology, University of Copenhagen, Copenhagen, Denmark. 4Danish Middle Ages and Renaissance, Research and Exhibitions, The National Museum of Denmark Frederiksholms Ka-nal 12, DK-1220 Copenhagen. 5Institute of Geography, School of GeoSciences, University of Edinburgh, Scotland, UK. 6Institute of Earth Science, University of Iceland, Sturlugate 7, S-101, Reykjavík, Iceland. *Corresponding author - [email protected].
2012

Journal of the North Atlantic Special Volume 394
to these analyses, we should explicitly examine just what it is that we may be able to determine from these isotopic analyses. In Greenland, the Norse dietary possibilities fall neatly into general categories that are known to have characteristic isotopic signatures: the ter-restrial and the marine biospheres (Arneborg et al. 1999). As grain agriculture was not possible and as there were no wild plant food resources that could play a primary role in human diet, the Norse diet was based on meat and fat from the terrestrial and marine reservoirs. A little carbohydrate would have come from the milk products of their domestic animals and perhaps a very little more from wild berries and a few plants, but animal protein and fat provided essentially all human dietary energy requirements (Arneborg et al. 2012a [this volume]). In such dietary situations, the protein consumed far exceeds that needed for human tissue replacement, and there is no need for the body to synthesize even nonessential amino acids (cf Hedges 2004). Since fat plays no direct role in protein construction, hu-man bone collagen is then directly produced from the protein in the diet, and the isotopic signatures of the meat consumed are directly re ected in that of the bone collagen (Ambrose 1993, Ambrose and Norr 1993, Hedges 2004, Tieszen and Fagre 1993). This is a quantitative observation, in that consump-tion of protein from two isotopically different reser-voirs will result in bone collagen isotopic signatures scaled linearly between those of the two reservoirs (e.g., Arneborg et al. 1999, Fischer et al. 2007). Isotopic measurement of the bone collagen of an individual human will then provide direct informa-tion on the relative amounts of protein from the two food reservoirs that have contributed to the forma-tion of that bone collagen. Bone growth takes place rapidly during the rst decade of human life, slows a little, and then spurts again during the second decade (e.g., Hedges et al. 2007). After maturation, the turn-over time of the collagen in compact (cortical) bone is slow. The isotopic values for the collagen mea-sured are the end result of this formation process. They thus re ect long-term protein consumption, especially that in the rst two decades of life, with a very gradual change thereafter as the collagen is gradually renewed (Geyh 2001, Hedges and Reynard 2007, Hedges et al. 2007, Wild et al. 2000). By con-trast, collagen from non-compact (trabecular) bone from adult humans represents the average diet over a much shorter period, about four years (Martin et al. 1998) These considerations need to be borne in mind when interpreting bone collagen isotopic data. It is the protein consumed that is followed and in par-ticular that consumed when the collagen is formed or replaced. The consequence for dietary reconstruc-
tion is that we can obtain direct information on the primary foodstuffs which supported Norse existence in Greenland. That is not to say that other foods were unimportant; if all the complex requirements of diet (e.g., vitamins and minerals) cannot be routinely met, human society cannot exist. Consumption of these other necessities is not re ected in the colla-gen isotopic values, nor are foods consumed during times of scarcity. While emergency foods may main-tain life, they are not the basis for a sustainable di-etary economy and they won’t be represented in the bone collagen signature. In times of food scarcity, protein will be channeled to energy production and not to bone collagen synthesis. The isotopic method, if applicable in Greenland, seems ideally suited to direct examination of the fundamental basis of the Norse diet without confusion from the subsidiary aspects. With these considerations in mind, we can then pose the questions we would hope to be able to ad-dress with this form of analysis, beginning with the technical one:
1) Are the isotopic signatures of the two food reservoirs of interest here (the terrestrial and marine biospheres) suf ciently characteris-tic to provide reliable information on Norse diet? 2) To what extent did the Norse community as a whole rely on the terrestrial reservoir (in effect, their agriculture) and to what extent on hunting the marine mammals?3) Were there differences between the two Norse settlements in this reliance?4) Were there differences between sites in the same settlement? Is there any evidence for specialization?5) Were their differences between individu-als? Can any such differences be correlated with age, sex, or status?6) Can we learn anything about the nature of the food consumed?
In the previous parts of this over-all study, we have examined in detail the isotopic signatures of the domestic and wild animals which formed the ba-sis of Norse subsistence (Nelson et al. 2012a, 2012c [this volume]). This approach was extended to a detailed analysis of Greenlandic Thule Culture diet, both as a test of the isotopic method in Greenland and of our understanding of their dietary economy (Gulløv 2012 [this volume], Nelson et al. 2012b [this volume]). Here, we use this accumulated informa-tion together with the isotopic data obtained on the remains of the Norse themselves to address, to the extent possible, the questions posed above. As in the study of the Thule Culture population, we make no attempt in this paper to integrate these results

D.E. Nelson, J. Heinemeier, N. Lynnerup, Á.E. Sveinbjörnsdóttir, and J. Arneborg2012 95
into the extensive literature on Norse adaptation in Greenland; this integration will be done in the last paper of this volume (Arneborg et al. 2012b [this volume]). We choose to let the isotopic results and interpretations stand on their own, using only the general faunal lists from archaeological excavation as a guide (e.g., McGovern 1985). Evaluation of the utility of this method can then be made separately, without the confusion of technical detail; again, this contextual evaluation will be done in the last paper of this special volume (Arneborg et al. 2012b [this volume]).
Samples and Methods
As discussed in the introductory review of this project (Arneborg et al. 2012a [this volume]), excava-tions over the past century have uncovered the remains of more than 400 Norse individuals from cem-eteries associated with the Christian churches in the two settlements. No pagan graves are known. Con-sequences of importance here are that little information on status or chronology are available from the
graves and that the Norse diet would probably not have included their horses; Christian burial did not include grave goods, and consumption of horse meat was associated with pagan ritual and hence forbid-den by the new religion (Egardt 1981). Table 1 summarizes the detailed descriptions of the sites of importance here (see also Figs. 1, 2). As the examination in Arneborg et al. (2012a [this volume]) shows, most excavations included in the study were undertaken in times during which archae-ological excavation and curatorial methods were
Table 1. The sites from where the samples of this study were collected. All sites are thoroughly described in Arneborg et al. 2012a. [this volume]. In Column 1, the Danish National Museum site ID’s are reported together with the Norse names (in italics) and the modern Greenlandic names. Site GR refers to the Greenland National Museum Ancient Monument number. Excavators refer to the excavator responsible for the excavations. Year is year of excavation.
Site Site GR Excavators Year
Eastern Settlement Ø 66, Igaliku kujalleq 60V2–IV–611 Aa. Roussell 1926 Ø 47, Gardar, Igaliku 60V2-IV-621 P. Nørlund & Aa. Roussell 1926 Ø 111, Herjolfsnes, Ikigaat 59V1–IV–502 P. Nørlund 1921 Ø 149, Narsarsuaq 60V2–IV–504 C.L. Vebæk 1945 Ø 29a, Brattahlid, Qassiarsuk 61V3-III-539 J. Meldgaard & K.J. Krogh 1961
Western Settlement V 51, Sandnes, Kilaarsar k 64V2-III-511 P. Nørlund & Aa. Roussell 1930 V 7 , Anavik, Ujarassuit 64V2–IV-515 Aa. Roussell & E. Knuth 1932 H.C. Kapel & J. Arneborg 1982
Figure 1. Map of the Eastern Settlement with the sites included in the study. White is the inland ice, blue is the sea, and yellow is the land. The individual sites are described in detail in Arneborg et al. 2012a (this volume).

Journal of the North Atlantic Special Volume 396
very different from those of the present, a factor that certainly has impacted this study. While a potential population sample size of several hundred human individuals is large for an isotopic dietary study, it was only possible to include some 80, as most remains were found to be unsuitable for isotopic measurement. Much of the bone material was badly degraded, and as will be seen, that caused great dif- culties in project execution and placed limitations
on the outcome. In particular, it was evident at the project outset that some bones had previously been treated with a consolidating or preservative substance. This treat-ment was immediately obvious in a few cases, but the full extent of the issue only gradually became clear. It eventually became evident that a visual examination of the bone itself was inadequate, and that it was necessary to use a microscope to exam-ine both the bone and even the material removed for measurement. Preservatives were thus seen to have been applied to bones from the sites Ø111 Her-jolfsnes, Ø47 Gardar, Ø66, V7 Anavik, and Ø29a Brattahlid. There may also be preservative on a few bones each from V51 Sandnes and Ø149. The time sequence of excavation (see Table 1) suggests that this method of bone consolidation was passed from
one archaeologist to the next. Despite considerable effort, it proved impossible to obtain information on the method or on the nature of the material applied. No records of it could be found, and various dis-cussions yielded con icting information. A casual conversation (P. Bennike, Laboratory of Biological Anthropology, Section of Forensic Pathology, Uni-versity of Copenhagen, Denmark, pers. comm.) did reveal that at some time long after excavation, some bones had been consolidated in the laboratory with Bedacryl. Bedacryl is the trade name for an acrylic used for a time in the latter part of the 20th century for bone consolidation. This commercial product would not have been available to the earlier excava-tors, except for the excavators of the Tjodhilde Ø29a churchyard. Since we could deduce that, at least in some instances, a preservative was applied to the bone during excavation, some other substance must also have been used. As the extent of the preservative issue grew evident, it became important to identify these substance(s). A side study was made on samples of the preservative material that could clearly be removed from a few of the bones without including any of the bone itself (Takahashi et al. 2002). As well, for a few long bones with thick cortexes cov-
Figure 2. Map of the Western Settlement with the sites included in the study. White is the inland ice, blue is the sea, and yellow is the land. The individual sites are described in detail in Arneborg et al. 2012a (this volume).

D.E. Nelson, J. Heinemeier, N. Lynnerup, Á.E. Sveinbjörnsdóttir, and J. Arneborg2012 97
ered with preservative, samples of the preservative itself were taken, the bone surface was then removed by milling, and two samples of bone were then taken from successive milled layers in attempts to physi-cally reach bone at a depth to which the preservative had not penetrated. Because of the nature of the collection and the problems with preservatives, there was little chance to choose speci c bone elements for measurement. Since different bones develop and mature at differ-ent stages of human growth, any dietary change that occurs during this period will be re ected. In a few cases, it was possible to test the magnitude of this possible effect as both the cranium (the predominant element in the collections, re ecting the collection preferences of decades past) and one or more long bones were present for the same individual. No other sampling strategies were employed; we simply measured every individual for which a suit-able sample could be obtained. Table 2 gives a de-scription of all samples taken from each site, includ-ing information on the sex and age of the individual as determined in another study (Lynnerup 1998). Table 2 also includes some samples of the preserva-tive itself as taken for the preservative study. It should be noted that the samples labeled #1 to #28 are remnant bone material from the earlier study (Arneborg et al. 1999). On close inspection, some of these showed signs of preservative treatment, a potential source of problems for isotopic analysis. In a few cases, it was possible to obtain fresh samples from better bones of the same individuals. The bone selected for measurement was sam-pled with small, slow-speed drills and mills. To the extent possible, samples were taken from a compact cortical portion of the bone. Typically, the bone surface was milled to remove material to a depth of about 1 mm, and then 2-mm-diameter holes were drilled to remove about 50–100 mg of bone as drill-ings, which constituted the sample. These were col-lected as drilled on clean Al foil and transferred to baked glass vials for shipment to the isotope labo-ratory at Simon Fraser University. There, the high molecular-weight remnant collagen was extracted using the usual SFU procedures as described in Takahashi and Nelson (Appendix 1 [this volume]). At various steps in this extraction procedure, it is possible to qualitatively assess the suitability of the sample for measurement. The extract yield is a fur-ther quantitative measure. When the weight of col-lagen extract falls below a few percent (3–4%) of the weight of the bone processed, that is evidence for serious collagen degradation, and such samples are not regarded as reliable. A further quantita-tive test is provided by measurement of the carbon and nitrogen concentrations in the extract, as these should have the characteristic values of collagen
(Van Klinken 1999). In particular, a measured C/N ratio (by weight) of between about 2.8 and 3.2 is taken as a requirement for reliable measurement (e.g., DeNiro 1985). The extracts were submitted for analysis to the isotopic facility of the University of British Colum-bia Oceanographic Institute, where measures of the carbon and nitrogen concentrations and the 13C and
15N values were made. For the rst measures (#1 to #28), only the C/N ratio was recorded; after that, the absolute concentrations of C and N were also noted. Much experience with this stable isotope mea-surement procedure has shown that the measure-ment precision (one standard deviation) for the same extract is typically about ±0.1‰ for 13C and ±0.2‰ for 15N. Also, the comparison mentioned in the following section of 13C data with results from the same samples in the earlier study (Arneborg et al. 1999) indicates precision and accuracy of this order. A more direct indication of the precision of the stable isotopic data can be seen in the study of the Norse domestic animals (Nelson et al. 2012c [this volume]). We reproduce in Table 3 a summary of the isotopic results for the domestic and wild animals of interest here (thus horses, dogs, and pigs are not included) (cf. Nelson et al. 2012a, 2012c [this volume]). (We also require these values for in-terpretive purposes later.) These data were obtained from measurements of very many animals, and so the observed range includes both measurement un-certainty and individual variation. As seen in Table 3, variabilities (at one standard deviation) for 13C of 0.5‰ and for 15N of 1‰ describe all species. To a good approximation then, we can conclude that carbon isotopic differences 0.5‰ and nitrogen dif-ferences of 1‰ re ect real dietary differences at the level of the individual animal. As humans are higher on the food chain and have a longer lifetime, one would expect that a hypothetical human popula-tion which consumed an entirely monotonous diet would have an even smaller variation.
Results
A complete list of the data obtained is given in Table 4. As can be seen, many of the samples listed in Table 2 proved potentially problematic for reliable isotopic measurement. Preservative was detected in many, some even from bone and in drillings that to the naked eye seemed to be free of it. Others had very low extract yields, indicative of extensive deg-radation of the bone collagen. For those that did pass these tests, the carbon and nitrogen elemental con-centrations of the extracted collagen, the ratio of the two, and the yield of collagen extract indicate that the material satis es the requirements for reliable stable

Journal of the North Atlantic Special Volume 398
Table 2. Description of all samples included in the study taken from each site. Site DK = Danish National Museum ID’s, the Norse name (italics), and the modern Greenland name. KAL numbers identify the individuals in the collection at the Laboratory for Biological Anthro-pology, University of Copenhagen. Project No. = sample number in the study.
KAL Project Individual’s Bone element Sampling Site DK no. no. Sex age or material comments
Eastern Settlement Ø29a, Bratthalid, Qassiarsuk CLA–1 #12 M >18 Clavicle Remnant sample from previous study. CLA–2 #11 M >18 Clavicle Remnant sample from previous study. 1029 #186 Preservative on bone Suf cient presevative to sample separately. " #187 F 20–25 Test bone material Bone covered by above. 1041 #25 F 35–40 Vertebrae Remnant sample from previous study. 1043 #26 F 35–40 Remnant sample from previous study. 1054 #28 F 25–30 Vertebrae Remnant sample from previous study. 1059 #27 F >35 Vertebrae Remnant sample from previous study. 1060 #16 F >18 Remnant sample from previous study. 1070 #164 Preservative on bone Suf cient presevative to sample separately. " #165 - 15–20 Long bone Bone covered by above. 1180 #18 M >35 Long bone Remnant sample from previous study. 1789 #19 M 50–55 Remnant sample from previous study. 1794 #188 Preservative on bone Suf cient presevative to sample separately. " #189 M 30–35 Femur Bone covered by above.
Ø66, Igaliku kujalleq 919 #23 F 25–30 Vertebrae Remnant sample from previous study. 920 #24 M 30–35 Cranium Remnant sample from previous study.
Ø47, Gardar, Igaliku 915 #20 M 30–35 Cranium Remnant sample from previous study. 916 #21 F 18/20–35 Cranium Remnant sample from previous study. 1118 #22 M >18 Remnant sample from previous study.
Ø111, Herjolfsnes, Ikigaat 903 #201 F 35–40 Femur 905 #202 F 20–25 Cranium 906 #13 F 20–25 Remnant sample from previous study. 907 #203 F 25–30 Femur 1105 #14 F 45–50 Remnant sample from previous study. 1106 #15 - 10–15 Remnant sample from previous study. 1108 #204 - 15–20 Foot bone? 1110 #205 - >18 Tibia ? 1111 #206 M 45–50 Femur 1120 #207 F 25–30 Femur 1121 #208 - 15–20 Femur 1146 #209 M 20–25 Mandibula 1676 #210 F >18 Femur 1677 #211 F 15–20 Femur
Ø149, Narsarsuaq 995 #212 F 18/20–35 Cranium 996 #213 - 18/20–35 Cranium 997 #214 - 18/20–35 Cranium 998 #215 F 18/20–35 Cranium 999 #10 - 15–20 Cranium Remnant sample from previous study. " #216 - 15–20 Cranium Re–sampling of individual above. 1000 #7 M 25–30 Cranium Remnant sample from previous study. " #217 M 25–30 Cranium Re–sampling of individual above. 1001 #8 M 18/20–35 Cranium/scapula Remnant sample from previous study. " #218 M 18/20–35 Cranium Re–sampling of individual above. 1002 #9 F 35–40 Vertebrae Remnant sample from previous study. " #219 F 35–40 Cranium Re–sampling of individual above. 1003 #220 M 18/20–35 Cranium 1004 #222 F 18/20–35 Cranium 1005 #223 F 18/20–35 Cranium 1006 #224 M >35 Cranium 1007 #225 F 18/20–35 Cranium 1008 #226 – 05–10 Cranium 1009 #221 F >35 Cranium 1010 #227 – >35 Cranium 1011 #228 F 20-25 Cranium 1012 #229 F 20-25 Cranium

D.E. Nelson, J. Heinemeier, N. Lynnerup, Á.E. Sveinbjörnsdóttir, and J. Arneborg2012 99
Table 2, continued.
KAL Project Individual’s Bone element Sampling Site DK no. no. Sex age or material comments
1013 #232 - 18/20–35 Pelvis 1014 #230 F 20–25 Cranium 1017 #235 F 20–25 Cranium 1018 #231 M 35–40 Cranium 1021 #234 - 35–40 Cranium 1022 #233 - 15–20 Cranium 1023 #236 - 18/20–35 Cranium 1141 #237 - >18 Cranium
Western Settlement V7, Anavik, Ujarassuit 990 #166 - Preservative on bone Suf cient presevative to sample separately. " #167 M 30–35 Cranium (outer) Bone covered by above, rst sample. " #168 M 30–35 Cranium (inner) Bone covered by above, second sample. 991 #169 - Preservative on bone Suf cient presevative to sample separately. " #170 F 35–40 Cranium (outer) Bone covered by above, rst sample . " #171 F 35–40 Cranium (inner) Bone covered by above, second sample. 992 #174 F 25–30 Cranium 993 #172 F 25–30 Cranium 994 #173 F 35–40 Cranium 1578 #199 M 35–40 Cranium 1639 #200 F >18 Femur 1644 #175 M >18 Femur
V51, Sandnes, Kilaarsar k 922 #178 M 35–40 Cranium 923 #179 F 40–45 Cranium 924 #180 F 20–25 Cranium 925 #245 – 05–10 Femur 926 #181 F 25–30 Cranium Element comparison. " #182 F 25–30 Femur See above. 927 #183 F 35–40 Cranium 928 #2 F 20–25 Remnant sample from previous study. 929 #1 M 35–40 Humerus Remnant sample from previous study. 930 #184 F 30–35 Cranium 931 #185 M 30–35 Cranium 932 #190 F 20–25 Cranium 933 #191 M 40–45 Cranium 934 #193 M 35–40 Cranium 935 #194 M 20–25 Cranium 936 #195 F 25–30 Cranium 937 #196 F 25–30 Cranium 938 #197 F 35–40 Cranium 944 #238 F 40–45 Cranium 945 #239 M 40–45 Cranium 947 #240 F 30–35 Cranium 957 #258 F 20–25 Humerus Element comparison. " #259 F 20–25 Cranium See above. 958 #254 F 30–35 Femur Element comparison. " #255 F 30–35 Cranium See above. 959 #5 F 40–45 Remnant sample from previous study. 960 #3 F 40–45 Remnant sample from previous study. 961 #4 F 20–25 Remnant sample from previous study. 963 #241 - 05–10 Cranium Reproducibility and element comparison. " #256 - 05–10 Femur See above. " #257 - 05–10 Cranium See above. 964 #6 F 25–30 Remnant sample from previous study. 966 #244 - 10–15 Femur 968 #243 M 35–40 Cranium Element comparison. " #251 M 35–40 Femur See above. 969 #242 F 40–45 Cranium Element comparison. " #253 F 40–45 Femur See above. 1123 #249 F 20–25 Femur 1126 #248 - 05–10 Femur 1128 #252 F 45–50 Femur 1131 #250 - 10–15 Femur 1612 #247 M 15–20 Femur 1679 #246 - 05–10 Femur

Journal of the North Atlantic Special Volume 3100
Further, we have no certainty that these are the only two preservatives that have been applied to these bones. Because of these problems, we report here two classes of data: 1) robust data obtained from bone samples for which we are reasonably certain that no consolidants had been applied and which meet the criteria described above, and 2) provisional data obtained from samples for which we believe we have eliminated the possibility of preservative con-tamination. We note in this context that all the 13C data from the Arneborg et al. 1999 study (shown in Table 4), where only standard precautions against possible preservatives were taken, are in good agreement with those of the present study, including some provisional and problematic samples. Thus, the mean difference between 13C values in the 1999 study compared to the present provisional or suspect samples is -0.14‰ with a standard deviation of 0.18‰ (n = 9), while the corresponding difference from the samples deemed good in the present study are 0.06‰ (mean) and 0.22‰ (standard deviation), respectively (n = 11). This agreement is both a con- rmation of the reliability of provisional results and
the precision and accuracy of the 13C measurements in general. Other samples reported in Table 2 have been eliminated from further consideration here. For con-venience, the suite of data which we will use for fur-ther analysis is given in Table 5. Analysis of this ex-tensive data set is complicated. Here, we must both test the applicability and limitations of the method and at the same time attempt to derive information of value to archaeological interpretation. We begin this analysis by examining the human data using only the most basic, rmly established considerations, derive the empirical information possible at that level, and then proceed to more complex quantitative analyses. This procedure will inevitably lead to repetition, as the same data can be examined at different levels.
Interpretations
Empirical considerations It is immediately evident from a simple perusal of the data in Table 5 that the ranges of isotopic values far exceed those determined for any one of the domestic or wild animal species (Nelson et al. 2012a, 2012c [this volume]). Comparison with the data for the West Coast Greenlan-dic Thule Culture (Gulløv 2012 [this volume], Nelson et al. 2012b [this volume]) gives the same conclusion:
isotopic measurement. For some bones, the yields were actually higher than expected. This condition was also noted for some of the animal samples, and it is an indication that the collagen in the bone was sometimes well preserved although the bone mineral was under diagenetic attack. Personal observations by E. Nelson made during a subsequent excavation of a Norse midden in the Eastern Settlement support this conclusion, in that objects such as bits of leather were sometimes extremely well preserved, while bone was sometimes exible and leathery. As described above, at least two types of preser-vative were identi ed. One was old-fashioned glue, the so-called hide glue used by wood-workers. From the isotopic analyst’s viewpoint, the excavators could not have chosen a worse material. This glue is made of collagen extracted from the hides, bones, and hooves of animals (usually cattle and horses), and so it is the identical chemical substance we wish to separate from the human bones for isotopic mea-surement. In particular, the tests discussed above for determining collagen extract purity will be useless. As one could predict, this preservative was found to have the stable isotopic signatures of terrestrial herbivores, which will certainly confuse analysis. One preservative sample had the characteristics expected for an acrylic, and so may have been the Bedacryl that was apparently used in the laboratory many years after the excavation. Some bones from the earlier excavations may then have been treated with more than one type of preservative. A separate study of the properties of hide glue (Takahashi et al. 2002) showed that it is possible in sample preparation for stable isotope analysis to separate adequately the autochthonous bone colla-gen from hide glue smeared onto the bone. As well, one would not expect that the carbon in the acrylic (there is no nitrogen) would survive the collagen extraction process. However, it is not clear what the impact of both would have on the isotopic results.
Table 3. The animal data: bone collagen means with standard deviations (standard error in brack-ets). The domestic and wild animal data are taken from Nelson et al. (2012c [this volume]) and Nelson et al. (2012a [this volume]), respectively. The Western Settlement cattle show much greater variation (Nelson et al. (2012c [this volume]), but for the purpose, effective mean domestic values are assumed to be the same as for the Eastern Settlement (see text).
13C (‰) 15N (‰) n
Eastern Settlement Domestic animals -20.01 ± 0.57 (0.06) 4.0 ± 1.0 (0.1) 17–22 cattle, 23–32 sheep/goats Harp seal -14.7 ± 0.6 (0.3) 14.1 ± 0.5 (0.3) 3–4 Hooded seal -13.6 ± 0.5 (0.2) 15.8 ± 1.0 (0.3) 11–12
Western Settlement Domestic animals -20.01 4.0 * Caribou -18.2 ± 0.4 (0.1) 2.0 ± 0.7 (0.2) 16–20 Harp seal -14.1 ± 0.4 (0.2) 14.7 ± 0.8 (0.3) 6–9 Harbor seal -12.6 ± 0.3 (0.1) 17.0 ± 0.9 (0.3) 8–9
* Eastern Settlement values assumed.
D.E. Nelson, J. Heinemeier, N. Lynnerup, Á.E. Sveinbjörnsdóttir, and J. Arneborg2012 101
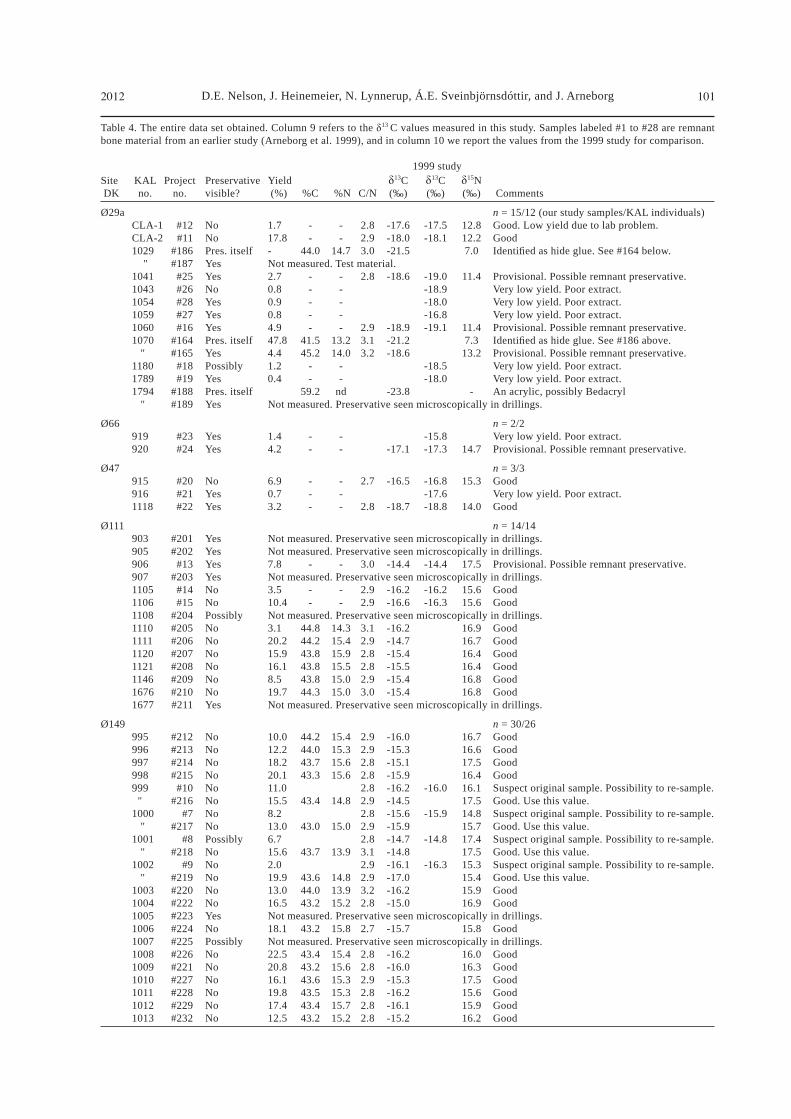
Table 4. The entire data set obtained. Column 9 refers to the 13 C values measured in this study. Samples labeled #1 to #28 are remnant bone material from an earlier study (Arneborg et al. 1999), and in column 10 we report the values from the 1999 study for comparison.
1999 studySite KAL Project Preservative Yield 13C 13C 15N DK no. no. visible? (%) %C %N C/N (‰) (‰) (‰) Comments
Ø29a n = 15/12 (our study samples/KAL individuals) CLA-1 #12 No 1.7 - - 2.8 -17.6 -17.5 12.8 Good. Low yield due to lab problem. CLA-2 #11 No 17.8 - - 2.9 -18.0 -18.1 12.2 Good 1029 #186 Pres. itself - 44.0 14.7 3.0 -21.5 7.0 Identi ed as hide glue. See #164 below. " #187 Yes Not measured. Test material. 1041 #25 Yes 2.7 - - 2.8 -18.6 -19.0 11.4 Provisional. Possible remnant preservative. 1043 #26 No 0.8 - - -18.9 Very low yield. Poor extract. 1054 #28 Yes 0.9 - - -18.0 Very low yield. Poor extract. 1059 #27 Yes 0.8 - - -16.8 Very low yield. Poor extract. 1060 #16 Yes 4.9 - - 2.9 -18.9 -19.1 11.4 Provisional. Possible remnant preservative. 1070 #164 Pres. itself 47.8 41.5 13.2 3.1 -21.2 7.3 Identi ed as hide glue. See #186 above. " #165 Yes 4.4 45.2 14.0 3.2 -18.6 13.2 Provisional. Possible remnant preservative. 1180 #18 Possibly 1.2 - - -18.5 Very low yield. Poor extract. 1789 #19 Yes 0.4 - - -18.0 Very low yield. Poor extract. 1794 #188 Pres. itself 59.2 nd -23.8 - An acrylic, possibly Bedacryl " #189 Yes Not measured. Preservative seen microscopically in drillings.
Ø66 n = 2/2 919 #23 Yes 1.4 - - -15.8 Very low yield. Poor extract. 920 #24 Yes 4.2 - - -17.1 -17.3 14.7 Provisional. Possible remnant preservative.
Ø47 n = 3/3 915 #20 No 6.9 - - 2.7 -16.5 -16.8 15.3 Good 916 #21 Yes 0.7 - - -17.6 Very low yield. Poor extract. 1118 #22 Yes 3.2 - - 2.8 -18.7 -18.8 14.0 Good
Ø111 n = 14/14 903 #201 Yes Not measured. Preservative seen microscopically in drillings. 905 #202 Yes Not measured. Preservative seen microscopically in drillings. 906 #13 Yes 7.8 - - 3.0 -14.4 -14.4 17.5 Provisional. Possible remnant preservative. 907 #203 Yes Not measured. Preservative seen microscopically in drillings. 1105 #14 No 3.5 - - 2.9 -16.2 -16.2 15.6 Good 1106 #15 No 10.4 - - 2.9 -16.6 -16.3 15.6 Good 1108 #204 Possibly Not measured. Preservative seen microscopically in drillings. 1110 #205 No 3.1 44.8 14.3 3.1 -16.2 16.9 Good 1111 #206 No 20.2 44.2 15.4 2.9 -14.7 16.7 Good 1120 #207 No 15.9 43.8 15.9 2.8 -15.4 16.4 Good 1121 #208 No 16.1 43.8 15.5 2.8 -15.5 16.4 Good 1146 #209 No 8.5 43.8 15.0 2.9 -15.4 16.8 Good 1676 #210 No 19.7 44.3 15.0 3.0 -15.4 16.8 Good 1677 #211 Yes Not measured. Preservative seen microscopically in drillings.
Ø149 n = 30/26 995 #212 No 10.0 44.2 15.4 2.9 -16.0 16.7 Good 996 #213 No 12.2 44.0 15.3 2.9 -15.3 16.6 Good 997 #214 No 18.2 43.7 15.6 2.8 -15.1 17.5 Good 998 #215 No 20.1 43.3 15.6 2.8 -15.9 16.4 Good 999 #10 No 11.0 2.8 -16.2 -16.0 16.1 Suspect original sample. Possibility to re-sample. " #216 No 15.5 43.4 14.8 2.9 -14.5 17.5 Good. Use this value. 1000 #7 No 8.2 2.8 -15.6 -15.9 14.8 Suspect original sample. Possibility to re-sample. " #217 No 13.0 43.0 15.0 2.9 -15.9 15.7 Good. Use this value. 1001 #8 Possibly 6.7 2.8 -14.7 -14.8 17.4 Suspect original sample. Possibility to re-sample. " #218 No 15.6 43.7 13.9 3.1 -14.8 17.5 Good. Use this value. 1002 #9 No 2.0 2.9 -16.1 -16.3 15.3 Suspect original sample. Possibility to re-sample. " #219 No 19.9 43.6 14.8 2.9 -17.0 15.4 Good. Use this value. 1003 #220 No 13.0 44.0 13.9 3.2 -16.2 15.9 Good 1004 #222 No 16.5 43.2 15.2 2.8 -15.0 16.9 Good 1005 #223 Yes Not measured. Preservative seen microscopically in drillings. 1006 #224 No 18.1 43.2 15.8 2.7 -15.7 15.8 Good 1007 #225 Possibly Not measured. Preservative seen microscopically in drillings. 1008 #226 No 22.5 43.4 15.4 2.8 -16.2 16.0 Good 1009 #221 No 20.8 43.2 15.6 2.8 -16.0 16.3 Good 1010 #227 No 16.1 43.6 15.3 2.9 -15.3 17.5 Good 1011 #228 No 19.8 43.5 15.3 2.8 -16.2 15.6 Good 1012 #229 No 17.4 43.4 15.7 2.8 -16.1 15.9 Good 1013 #232 No 12.5 43.2 15.2 2.8 -15.2 16.2 Good
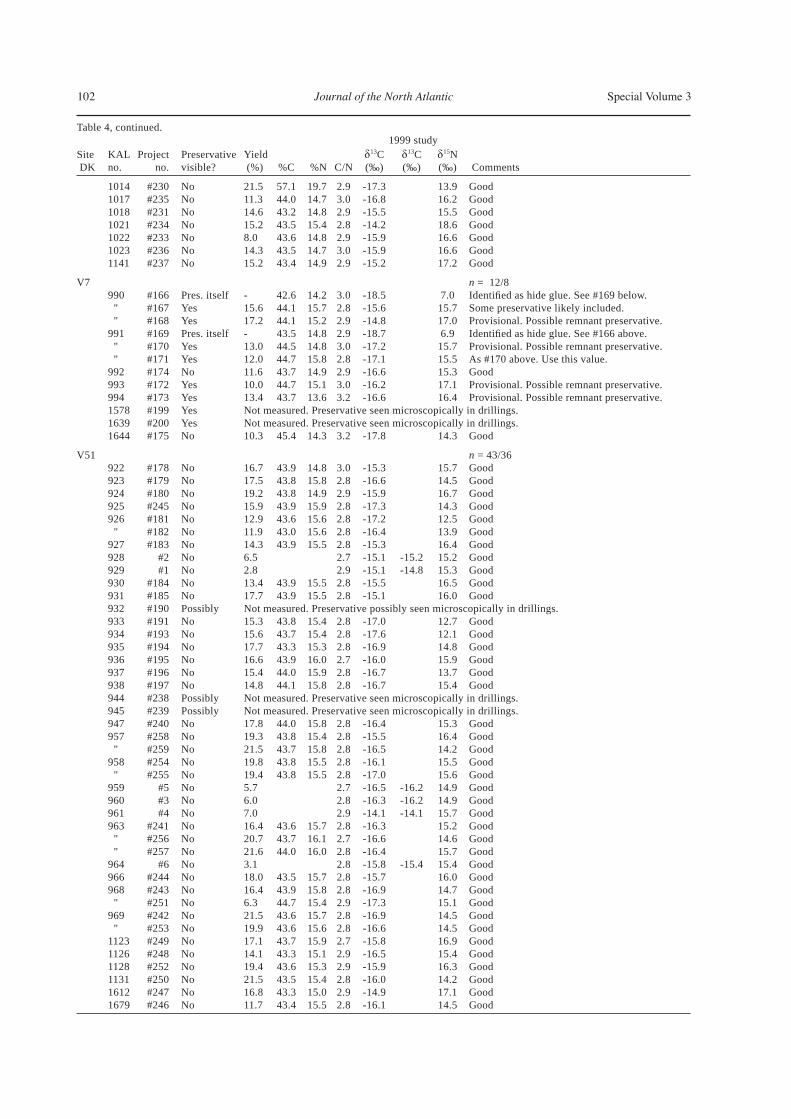
Journal of the North Atlantic Special Volume 3102
Table 4, continued. 1999 studySite KAL Project Preservative Yield 13C 13C 15N DK no. no. visible? (%) %C %N C/N (‰) (‰) (‰) Comments
1014 #230 No 21.5 57.1 19.7 2.9 -17.3 13.9 Good 1017 #235 No 11.3 44.0 14.7 3.0 -16.8 16.2 Good 1018 #231 No 14.6 43.2 14.8 2.9 -15.5 15.5 Good 1021 #234 No 15.2 43.5 15.4 2.8 -14.2 18.6 Good 1022 #233 No 8.0 43.6 14.8 2.9 -15.9 16.6 Good 1023 #236 No 14.3 43.5 14.7 3.0 -15.9 16.6 Good 1141 #237 No 15.2 43.4 14.9 2.9 -15.2 17.2 Good
V7 n = 12/8 990 #166 Pres. itself - 42.6 14.2 3.0 -18.5 7.0 Identi ed as hide glue. See #169 below. " #167 Yes 15.6 44.1 15.7 2.8 -15.6 15.7 Some preservative likely included. " #168 Yes 17.2 44.1 15.2 2.9 -14.8 17.0 Provisional. Possible remnant preservative. 991 #169 Pres. itself - 43.5 14.8 2.9 -18.7 6.9 Identi ed as hide glue. See #166 above. " #170 Yes 13.0 44.5 14.8 3.0 -17.2 15.7 Provisional. Possible remnant preservative. " #171 Yes 12.0 44.7 15.8 2.8 -17.1 15.5 As #170 above. Use this value. 992 #174 No 11.6 43.7 14.9 2.9 -16.6 15.3 Good 993 #172 Yes 10.0 44.7 15.1 3.0 -16.2 17.1 Provisional. Possible remnant preservative. 994 #173 Yes 13.4 43.7 13.6 3.2 -16.6 16.4 Provisional. Possible remnant preservative. 1578 #199 Yes Not measured. Preservative seen microscopically in drillings. 1639 #200 Yes Not measured. Preservative seen microscopically in drillings. 1644 #175 No 10.3 45.4 14.3 3.2 -17.8 14.3 Good
V51 n = 43/36 922 #178 No 16.7 43.9 14.8 3.0 -15.3 15.7 Good 923 #179 No 17.5 43.8 15.8 2.8 -16.6 14.5 Good 924 #180 No 19.2 43.8 14.9 2.9 -15.9 16.7 Good 925 #245 No 15.9 43.9 15.9 2.8 -17.3 14.3 Good 926 #181 No 12.9 43.6 15.6 2.8 -17.2 12.5 Good " #182 No 11.9 43.0 15.6 2.8 -16.4 13.9 Good 927 #183 No 14.3 43.9 15.5 2.8 -15.3 16.4 Good 928 #2 No 6.5 2.7 -15.1 -15.2 15.2 Good 929 #1 No 2.8 2.9 -15.1 -14.8 15.3 Good 930 #184 No 13.4 43.9 15.5 2.8 -15.5 16.5 Good 931 #185 No 17.7 43.9 15.5 2.8 -15.1 16.0 Good 932 #190 Possibly Not measured. Preservative possibly seen microscopically in drillings. 933 #191 No 15.3 43.8 15.4 2.8 -17.0 12.7 Good 934 #193 No 15.6 43.7 15.4 2.8 -17.6 12.1 Good 935 #194 No 17.7 43.3 15.3 2.8 -16.9 14.8 Good 936 #195 No 16.6 43.9 16.0 2.7 -16.0 15.9 Good 937 #196 No 15.4 44.0 15.9 2.8 -16.7 13.7 Good 938 #197 No 14.8 44.1 15.8 2.8 -16.7 15.4 Good 944 #238 Possibly Not measured. Preservative seen microscopically in drillings. 945 #239 Possibly Not measured. Preservative seen microscopically in drillings. 947 #240 No 17.8 44.0 15.8 2.8 -16.4 15.3 Good 957 #258 No 19.3 43.8 15.4 2.8 -15.5 16.4 Good " #259 No 21.5 43.7 15.8 2.8 -16.5 14.2 Good 958 #254 No 19.8 43.8 15.5 2.8 -16.1 15.5 Good " #255 No 19.4 43.8 15.5 2.8 -17.0 15.6 Good 959 #5 No 5.7 2.7 -16.5 -16.2 14.9 Good 960 #3 No 6.0 2.8 -16.3 -16.2 14.9 Good 961 #4 No 7.0 2.9 -14.1 -14.1 15.7 Good 963 #241 No 16.4 43.6 15.7 2.8 -16.3 15.2 Good " #256 No 20.7 43.7 16.1 2.7 -16.6 14.6 Good " #257 No 21.6 44.0 16.0 2.8 -16.4 15.7 Good 964 #6 No 3.1 2.8 -15.8 -15.4 15.4 Good 966 #244 No 18.0 43.5 15.7 2.8 -15.7 16.0 Good 968 #243 No 16.4 43.9 15.8 2.8 -16.9 14.7 Good " #251 No 6.3 44.7 15.4 2.9 -17.3 15.1 Good 969 #242 No 21.5 43.6 15.7 2.8 -16.9 14.5 Good " #253 No 19.9 43.6 15.6 2.8 -16.6 14.5 Good 1123 #249 No 17.1 43.7 15.9 2.7 -15.8 16.9 Good 1126 #248 No 14.1 43.3 15.1 2.9 -16.5 15.4 Good 1128 #252 No 19.4 43.6 15.3 2.9 -15.9 16.3 Good 1131 #250 No 21.5 43.5 15.4 2.8 -16.0 14.2 Good 1612 #247 No 16.8 43.3 15.0 2.9 -14.9 17.1 Good 1679 #246 No 11.7 43.4 15.5 2.8 -16.1 14.5 Good
D.E. Nelson, J. Heinemeier, N. Lynnerup, Á.E. Sveinbjörnsdóttir, and J. Arneborg2012 103
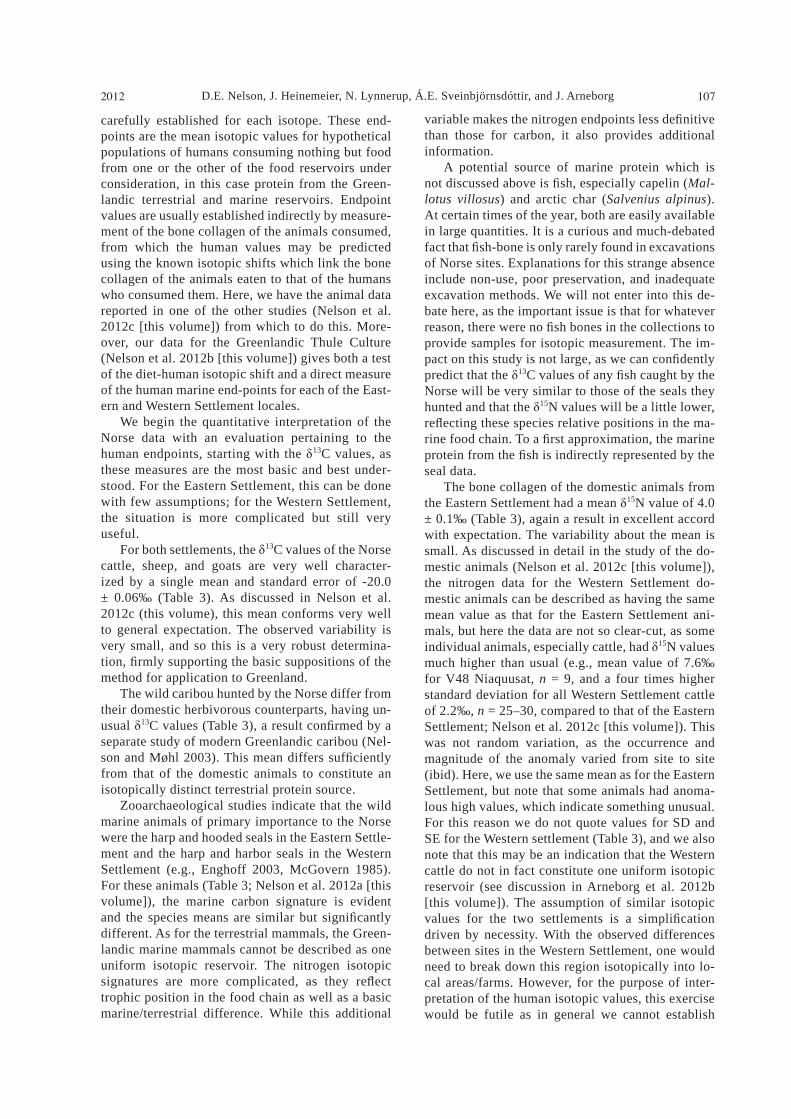
The well-established fact that both carbon and nitrogen isotopic values are much higher for marine protein than for terrestrial protein is certainly con- rmed in Greenland, and so any empirical deduc-
tions we can make on that basis will be solid. For this qualitative examination, Figure 3 plots all the Norse human data given in Table 4 coded for settlement (color) and site (shape of symbol). Mean values are used where there are multiple determinations for the same individual. In this plot, as in all others present-ed in this series, consumers of marine protein will have isotopic values to the upper right, and those of terrestrial protein to the lower left. Those people consuming a mixture should be found on the straight
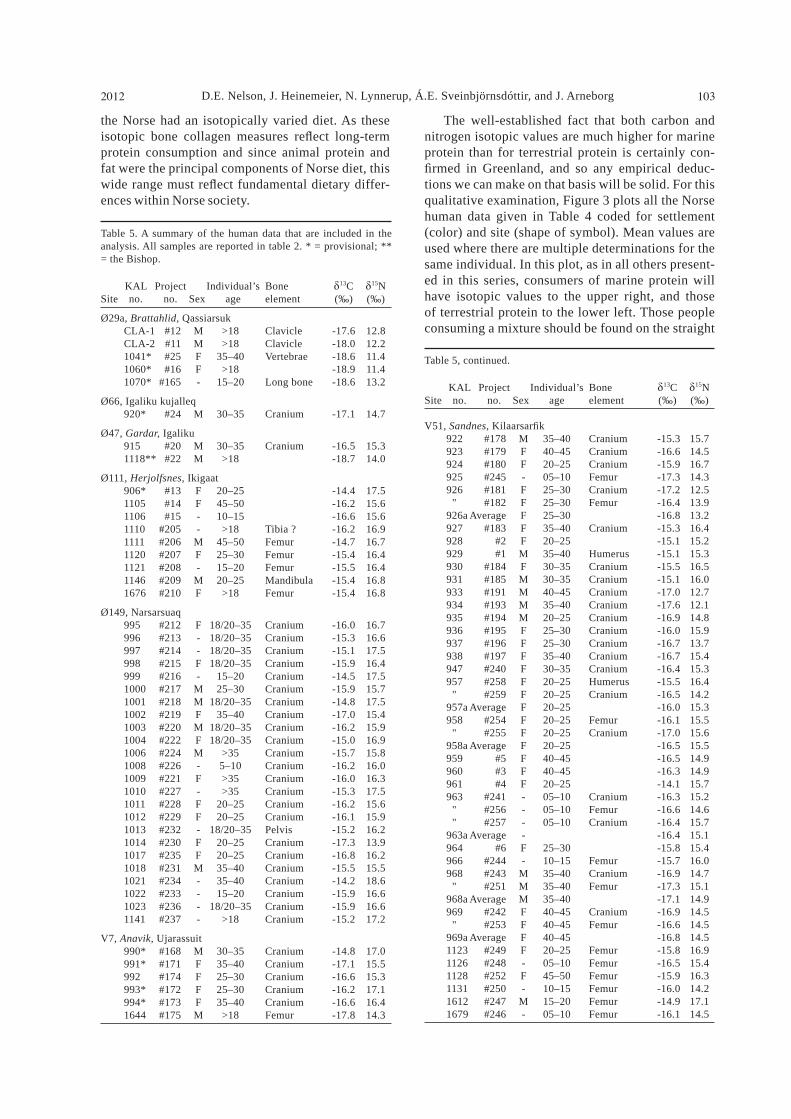
Table 5. A summary of the human data that are included in the analysis. All samples are reported in table 2. * = provisional; ** = the Bishop.
KAL Project Individual’s Bone 13C 15NSite no. no. Sex age element (‰) (‰)
Ø29a, Brattahlid, Qassiarsuk CLA-1 #12 M >18 Clavicle -17.6 12.8 CLA-2 #11 M >18 Clavicle -18.0 12.2 1041* #25 F 35–40 Vertebrae -18.6 11.4 1060* #16 F >18 -18.9 11.4 1070* #165 - 15–20 Long bone -18.6 13.2
Ø66, Igaliku kujalleq 920* #24 M 30–35 Cranium -17.1 14.7
Ø47, Gardar, Igaliku 915 #20 M 30–35 Cranium -16.5 15.3 1118** #22 M >18 -18.7 14.0
Ø111, Herjolfsnes, Ikigaat 906* #13 F 20–25 -14.4 17.5 1105 #14 F 45–50 -16.2 15.6 1106 #15 - 10–15 -16.6 15.6 1110 #205 - >18 Tibia ? -16.2 16.9 1111 #206 M 45–50 Femur -14.7 16.7 1120 #207 F 25–30 Femur -15.4 16.4 1121 #208 - 15–20 Femur -15.5 16.4 1146 #209 M 20–25 Mandibula -15.4 16.8 1676 #210 F >18 Femur -15.4 16.8
Ø149, Narsarsuaq 995 #212 F 18/20–35 Cranium -16.0 16.7 996 #213 - 18/20–35 Cranium -15.3 16.6 997 #214 - 18/20–35 Cranium -15.1 17.5 998 #215 F 18/20–35 Cranium -15.9 16.4 999 #216 - 15–20 Cranium -14.5 17.5 1000 #217 M 25–30 Cranium -15.9 15.7 1001 #218 M 18/20–35 Cranium -14.8 17.5 1002 #219 F 35–40 Cranium -17.0 15.4 1003 #220 M 18/20–35 Cranium -16.2 15.9 1004 #222 F 18/20–35 Cranium -15.0 16.9 1006 #224 M >35 Cranium -15.7 15.8 1008 #226 - 5–10 Cranium -16.2 16.0 1009 #221 F >35 Cranium -16.0 16.3 1010 #227 - >35 Cranium -15.3 17.5 1011 #228 F 20–25 Cranium -16.2 15.6 1012 #229 F 20–25 Cranium -16.1 15.9 1013 #232 - 18/20–35 Pelvis -15.2 16.2 1014 #230 F 20–25 Cranium -17.3 13.9 1017 #235 F 20–25 Cranium -16.8 16.2 1018 #231 M 35–40 Cranium -15.5 15.5 1021 #234 - 35–40 Cranium -14.2 18.6 1022 #233 - 15–20 Cranium -15.9 16.6 1023 #236 - 18/20–35 Cranium -15.9 16.6 1141 #237 - >18 Cranium -15.2 17.2
V7, Anavik, Ujarassuit 990* #168 M 30–35 Cranium -14.8 17.0 991* #171 F 35–40 Cranium -17.1 15.5 992 #174 F 25–30 Cranium -16.6 15.3 993* #172 F 25–30 Cranium -16.2 17.1 994* #173 F 35–40 Cranium -16.6 16.4 1644 #175 M >18 Femur -17.8 14.3
Table 5, continued.
KAL Project Individual’s Bone 13C 15NSite no. no. Sex age element (‰) (‰)
V51, Sandnes, Kilaarsar k 922 #178 M 35–40 Cranium -15.3 15.7 923 #179 F 40–45 Cranium -16.6 14.5 924 #180 F 20–25 Cranium -15.9 16.7 925 #245 - 05–10 Femur -17.3 14.3 926 #181 F 25–30 Cranium -17.2 12.5 " #182 F 25–30 Femur -16.4 13.9 926a Average F 25–30 -16.8 13.2 927 #183 F 35–40 Cranium -15.3 16.4 928 #2 F 20–25 -15.1 15.2 929 #1 M 35–40 Humerus -15.1 15.3 930 #184 F 30–35 Cranium -15.5 16.5 931 #185 M 30–35 Cranium -15.1 16.0 933 #191 M 40–45 Cranium -17.0 12.7 934 #193 M 35–40 Cranium -17.6 12.1 935 #194 M 20–25 Cranium -16.9 14.8 936 #195 F 25–30 Cranium -16.0 15.9 937 #196 F 25–30 Cranium -16.7 13.7 938 #197 F 35–40 Cranium -16.7 15.4 947 #240 F 30–35 Cranium -16.4 15.3 957 #258 F 20–25 Humerus -15.5 16.4 " #259 F 20–25 Cranium -16.5 14.2 957a Average F 20–25 -16.0 15.3 958 #254 F 20–25 Femur -16.1 15.5 " #255 F 20–25 Cranium -17.0 15.6 958a Average F 20–25 -16.5 15.5 959 #5 F 40–45 -16.5 14.9 960 #3 F 40–45 -16.3 14.9 961 #4 F 20–25 -14.1 15.7 963 #241 - 05–10 Cranium -16.3 15.2 " #256 - 05–10 Femur -16.6 14.6 " #257 - 05–10 Cranium -16.4 15.7 963a Average - -16.4 15.1 964 #6 F 25–30 -15.8 15.4 966 #244 - 10–15 Femur -15.7 16.0 968 #243 M 35–40 Cranium -16.9 14.7 " #251 M 35–40 Femur -17.3 15.1 968a Average M 35–40 -17.1 14.9 969 #242 F 40–45 Cranium -16.9 14.5 " #253 F 40–45 Femur -16.6 14.5 969a Average F 40–45 -16.8 14.5 1123 #249 F 20–25 Femur -15.8 16.9 1126 #248 - 05–10 Femur -16.5 15.4 1128 #252 F 45–50 Femur -15.9 16.3 1131 #250 - 10–15 Femur -16.0 14.2 1612 #247 M 15–20 Femur -14.9 17.1 1679 #246 - 05–10 Femur -16.1 14.5
the Norse had an isotopically varied diet. As these isotopic bone collagen measures re ect long-term protein consumption and since animal protein and fat were the principal components of Norse diet, this wide range must re ect fundamental dietary differ-ences within Norse society.

Journal of the North Atlantic Special Volume 3104
line between the two. While the nature of this mixing line is sometimes complex in circumstances of low dietary protein, that is not a consideration here. The linear pattern evident in Figure 3 provides qualita-tive con rmation that the data are meaningful at the level of the individual and that the general assump-tions underlying the method can be applied. Since our measures could not always be taken on the same bone element, we must establish the differences to be expected for bones from the same individual before we can compare values between in-dividuals. Table 6 gives the measured values for the cranium and a long bone for each of 6 people from the Sandnes site: one young child and ve adults. For the child, two measures of the cranium differ in
13C by 0.1‰ and the femur differs by 0.3‰. The cranium data are within estimated measurement un-certainty, and the femur data a very little different, as one might expect for a young child whose bones are growing at different times. The child’s nitrogen
data provide the same information. Some of the ve adults have slightly greater differences between bone elements, with 13C values differing by 1‰ and
15N values by 2.2‰. We noted above that 13C dif-ferences of 0.5‰ and 15N differences of 1‰ were likely due to real dietary differences. Some of these adults may thus have experienced dietary changes within their lifetimes; we note that those with the largest differences are young women. In any case, these changes are small, especially in comparison to the range of values shown in Figure 3. That the data provide useful information at the individual level is further con rmed by a direct test. Our measurements include those for a man who must have migrated to Greenland as an adult (Arneborg 1991, Arneborg et al. 1999). In Table 5, the indi-vidual KAL-1118 (sample # 22) was a Bishop ex-cavated at Ø47 (Gardar Cathedral). This man would not have been a native Greenlander, but a senior Church of cial sent to Greenland as an adult. As his
bone collagen will pri-marily re ect his diet as a younger man in Nor-way due to slow carbon turnover (e.g., Hedges et al. 2007), his isotopic values should be differ-ent from those of native Norse Greenlanders (cf. Arneborg et al. 1999, Lynnerup 1998). Unlike the situation in Green-land, cereal grains were a basic part of medieval diet in the Scandinavian homelands. The Bishop should then be isotopi-cally more terrestrial than his Greenlandic charges. A comparison of the data seen in Table 4 and in Figure 3 shows the Bishop standing well apart at the ter-restrial end of the scale. While it might be inter-esting to compare his isotopic data with those of others in contempo-rary Scandinavia, that is not relevant here. This Bishop was not a native Greenlander and so can-not provide information on the Greenlandic diet. This same argu-ment can be extended to
Figure 3. Human isotopic data for Eastern (red) and Western (black) Settlements. In the plot, all the Norse human data given in Table 4 are coded for settlement (color) and site (shape of symbol). Mean values are used where there are multiple determinations for the same indi-vidual. In this plot, consumers of marine protein will have isotopic values to the upper right, and those of terrestrial protein to the lower left. Those people consuming a mixture should be found on the straight line between the two. The linear pattern evident in the gure provides qualitative con rmation that the data are meaningful at the level of the individual and that the general assumptions underlying the method can be applied.

D.E. Nelson, J. Heinemeier, N. Lynnerup, Á.E. Sveinbjörnsdóttir, and J. Arneborg2012 105
chaeological interpretation, along with AMS dates, makes it possible that some Greenland-born humans were buried in the churchyard (Arneborg et al. 2012b [this volume]). The two men for whom the measure-ments are robust (CLA–1, sample #12, and CLA–2, sample #11) are unusual in another sense, in that they probably met violent deaths together with sev-eral others and were interred in a mass grave (Krogh 1982, Lynnerup 1998). Compared to the other Norse cemeteries, the isotopic data for the ve individuals at Ø29a are unusual, and we can again conclude that the isotopic data do provide useful information at the individual level. As well, for the purpose of the present methodological food-consumer isotopic re-lationship study, we eliminate the Ø29a individuals from further consideration here. Since we cannot be certain that these individuals are native Greenlandic Norse, they cannot provide de nitive information on the Greenlandic diet, although the question of whether they were of external origin or were locally born who tried to make the “European” life-style work in the early settlement phase is of great archae-ological interest and will be discussed in Arneborg et al. (2012b [this volume]). If values for individuals are meaningful, com-parisons of groups will be reliable. Table 7 gives the isotopic data means for the two settlements as a whole (lower part) and for the various sites (upper part). The settlement means (lower part of Table 7) do not include data for the Bishop or the provisional data, but does include “good” data from the small data sets Ø29a and Ø47. The numbers of individu-als at each settlement for which there are robust determinations are almost identical (36 for the East-ern Settlement and 35 for the Western Settlement). Both the 13C and the 15N means are lower for the Western Settlement than for the Eastern Settlement, indicating greater relative consumption of marine protein in the Eastern Settlement. However, the difference is small compared to the intra-group vari-ability, and also, the Eastern-Western Settlement comparison may not be meaningful without consid-ering the chronological distribution of individuals in relation to the temporal development of dietary hab-its observed in Arneborg et al. (1999) and Arneborg et al. (2012b [this volume]). Table 7 (upper part) gives the means for the sites at which there are at least 5 individuals. Here, we include the means for V7 Anavik, which are calculated primarily on provisional data (2 reliable and 4 provisional). In the Eastern Settlement, the means for Ø111 Herjolfsnes and Ø149 are identical. In the Western Settlement, we have reliable data for >5 individuals only from V51 Sandnes, but the carbon data from V7 Anavik falls in the same range, although the nitrogen values are slightly, but not signi cantly, higher considering the standard error
certain other individuals, but here we are less certain of the archaeological information against which we test the isotopes. It is argued that the little church excavated at the present settlement Qassiarsuk (Ø29a) is the one described in the sagas as having been established at Brattahlid by the founding settler Tjodhilde, wife of Erik the Red (Meldgaard 1982). The samples measured here as Ø29a individuals (Table 4, Fig. 1) were from the cemetery associated with this church. Whether or not this identi cation is accurate is not an issue here, as the nature of the little church and cemetery indicates that it was a very early Christian church which was eventually superseded by larger ones as the new colony and the new religion became established (Arneborg 2010, Arneborg et al. 2012a [this volume], Krogh 1982). The consequence of importance to this study is that some of the people buried there could be the original immigrants who would have isotopic values in large part characteristic of the lands they left. They could thus be expected to have values different from those of individuals found at the later cemeteries in Norse Greenland. Unfortunately, the poor preservation of the bones from Ø29a and the presence of the consoli-dant on them meant that only a few measures were made, but even so, the data are unusually terrestrial, perhaps in keeping with the presumption that they are immigrants. Even though there is no duplication of samples between the two studies, this conclusion could support the results of an earlier isotopic study of the 18O values of the teeth of these individuals, which also suggested that they were immigrants to Greenland (Fricke et al. 1995). However, the ar-
Table 6. Bone pair test: Measured 13 C and 15 N values for the cranium and a long bone for each of 6 individuals from the Sandnes site V51 in the Western Settlement.
KAL Project Individual’s Bone 13C 15NNo. No. Sex age element (‰) (‰)
926 #181 F 25–30 Cranium -17.2 12.5 #182 Femur -16.4 13.9 Difference -0.8 -1.4
957 #259 F 20–25 Cranium -16.5 14.2 #258 Humerus -15.5 16.4 Difference -1.0 -2.2
958 #255 F 30–35 Cranium -17.0 15.6 #254 Femur -16.1 15.5 Difference -0.9 0.1
963 #241 - 05–10 Cranium -16.3 15.2 #257 Cranium -16.4 15.7 #256 Femur -16.6 14.6 Difference 0.3 0.9
968 #243 M 35–40 Cranium -16.9 14.7 #251 Femur -17.3 15.1 Difference 0.4 -0.4
969 #242 F 40–45 Cranium -16.9 14.5 #253 Femur -16.6 14.5 Difference -0.3 0.0

Journal of the North Atlantic Special Volume 3106
the values for individuals at a given site, and so Norse diet was not homogeneous;4) it is clear that marine protein played a ma-jor role in the diets at both settlements; and 5) to the extent that our observations allow, we could not detect differences correlated to sex or age. Since the data set (Table 5) contains a wide range of values and some individuals seem to stand out as unusual at a site, there must be other factors involved. These could include personal movement, or status, or changing diet over time.
Quantitative interpretations More detailed deductions can be made by plac-ing these data on a quantitative consumption scale. Quantitative determinations of the relative amounts of marine and terrestrial food in the diets of indi-viduals require that the human endpoint values be
of the means (0.2 and 0.5‰, respectively). For both settlements, the observed range for individuals at each cemetery is much larger than the differences in the means. Table 8 gives the mean values for the females and males at the cemeteries Ø149 and Ø111 Herjolfsnes in the Eastern Settlement as well as for V51 Sandnes and V7 Anavik in the Western Settlement. Of these, there are suf cient reliable data from Ø149 and V51 Sandnes to provide group comparisons. At Ø149, the mean for the ve males is very slightly more marine than that for the 8 females, while the opposite seems true at V51 Sandnes. These differences are very small in comparison to the range of individual values, and given the measurement uncertainties and the numbers of individuals, they do not have any interpretive signi cance. The means for the smaller numbers of people at Ø111 Herjolfsnes (of which one measure is provisional) and V7 Anavik (4 of the 6 measures are provisional) provide the same information. In short, there is no isotopic evidence for sex-linked dietary differences. The same general observation can be made in comparing the data (Table 5) for the different age groups. Again, considering the limited number of sex-categorized individuals and the crude age esti-mates, there is no obvious systematic correlation of isotopic value and the age of the individual. We can then use these basic qualitative observa-tions to conclude that:
1) the isotopic data are useful at the individu-al level, and can identify unusual people;2) in comparison to all other cemeteries, the humans buried at Ø29a Brattahlid are isotopi-cally unusual;3) with the exception of Ø29a Brattahlid, there are considerable differences between
Table 7. Statistics for major sampling sites and for the two settlement totals: settlement area (lower part of table) and site averages (upper part of table). The analysis is based on the data in Table 4, and the number of individuals included from each settlement is indicated (n). Except for Anavik, all provisional data are excluded.
Eastern Settlement Western Settlement
13C (‰) 15N (‰) 13C (‰) 15N (‰)
Ø149, Narsarsuaq (n = 24) V51 Sandnes, Kilaarsar k (n = 33) Mean -15.7 16.4 Mean -16.1 15.2 St. deviation 0.7 1.0 St. deviation 0.8 1.1 St. error 0.2 0.2 St. error 0.1 0.2
Ø111 Herjolfsnes, Ikigaat (n = 8) V7 Anavik, Ujarassuit (n = 6, of which 4 are provisional measures) Mean -15.7 16.4 Mean -16.5 15.9 St. deviation 0.6 0.5 St. deviation 1.0 1.1 St. error 0.2 0.2 St. error 0.4 0.5
Eastern Settlement averages (n = 36)* Western Settlement averages (n = 35)** Mean -15.87 16.11 Mean -16.17 15.14 St. deviation 0.85 1.26 St. deviation 0.81 1.11 St. error 0.14 0.21 St. error 0.14 0.19
*All provisional values and the Bishop are excluded. Included **All provisional values are excluded. are 2 “good” samples from Ø29a and 2 from Ø47
Table 8. The mean 13C and 15N values for the females and males at the cemeteries Ø149 and Ø111 Herjolfsnes in the East-ern Settlement as well as for V51 Sandnes and V7 Anavik in the Western Settlement.
Number of Averages
Site Sex individuals 13C (‰) 15N (‰)
Ø149, Narsarsuaq F 8 -16.2 ± 0.7 15.9 ± 0.9 M 5 -15.6 ± 0.5 16.1 ± 0.8
Ø111, Herjolfsnes, Ikigaat F 4 -15.3 ± 0.7 16.6 ± 0.8 M 2 -15.0 ± 0.5 16.8 ± 0.1
V51, Sandnes, Kilaarsar k F 19 -16.0 ± 0.7 15.4 ± 1.0 M 8 -16.1 ± 1.1 14.8 ± 1.7
V7, Anavik, Ujarassuit F 4 -16.6 ± 0.4 16.1 ± 0.8 M 2 -16.3 ± 2.1 15.6 ± 1.9
D.E. Nelson, J. Heinemeier, N. Lynnerup, Á.E. Sveinbjörnsdóttir, and J. Arneborg2012 107
carefully established for each isotope. These end-points are the mean isotopic values for hypothetical populations of humans consuming nothing but food from one or the other of the food reservoirs under consideration, in this case protein from the Green-landic terrestrial and marine reservoirs. Endpoint values are usually established indirectly by measure-ment of the bone collagen of the animals consumed, from which the human values may be predicted using the known isotopic shifts which link the bone collagen of the animals eaten to that of the humans who consumed them. Here, we have the animal data reported in one of the other studies (Nelson et al. 2012c [this volume]) from which to do this. More-over, our data for the Greenlandic Thule Culture (Nelson et al. 2012b [this volume]) gives both a test of the diet-human isotopic shift and a direct measure of the human marine end-points for each of the East-ern and Western Settlement locales. We begin the quantitative interpretation of the Norse data with an evaluation pertaining to the human endpoints, starting with the 13C values, as these measures are the most basic and best under-stood. For the Eastern Settlement, this can be done with few assumptions; for the Western Settlement, the situation is more complicated but still very useful. For both settlements, the 13C values of the Norse cattle, sheep, and goats are very well character-ized by a single mean and standard error of -20.0 ± 0.06‰ (Table 3). As discussed in Nelson et al. 2012c (this volume), this mean conforms very well to general expectation. The observed variability is very small, and so this is a very robust determina-tion, rmly supporting the basic suppositions of the method for application to Greenland. The wild caribou hunted by the Norse differ from their domestic herbivorous counterparts, having un-usual 13C values (Table 3), a result con rmed by a separate study of modern Greenlandic caribou (Nel-son and Møhl 2003). This mean differs suf ciently from that of the domestic animals to constitute an isotopically distinct terrestrial protein source. Zooarchaeological studies indicate that the wild marine animals of primary importance to the Norse were the harp and hooded seals in the Eastern Settle-ment and the harp and harbor seals in the Western Settlement (e.g., Enghoff 2003, McGovern 1985). For these animals (Table 3; Nelson et al. 2012a [this volume]), the marine carbon signature is evident and the species means are similar but signi cantly different. As for the terrestrial mammals, the Green-landic marine mammals cannot be described as one uniform isotopic reservoir. The nitrogen isotopic signatures are more complicated, as they re ect trophic position in the food chain as well as a basic marine/terrestrial difference. While this additional
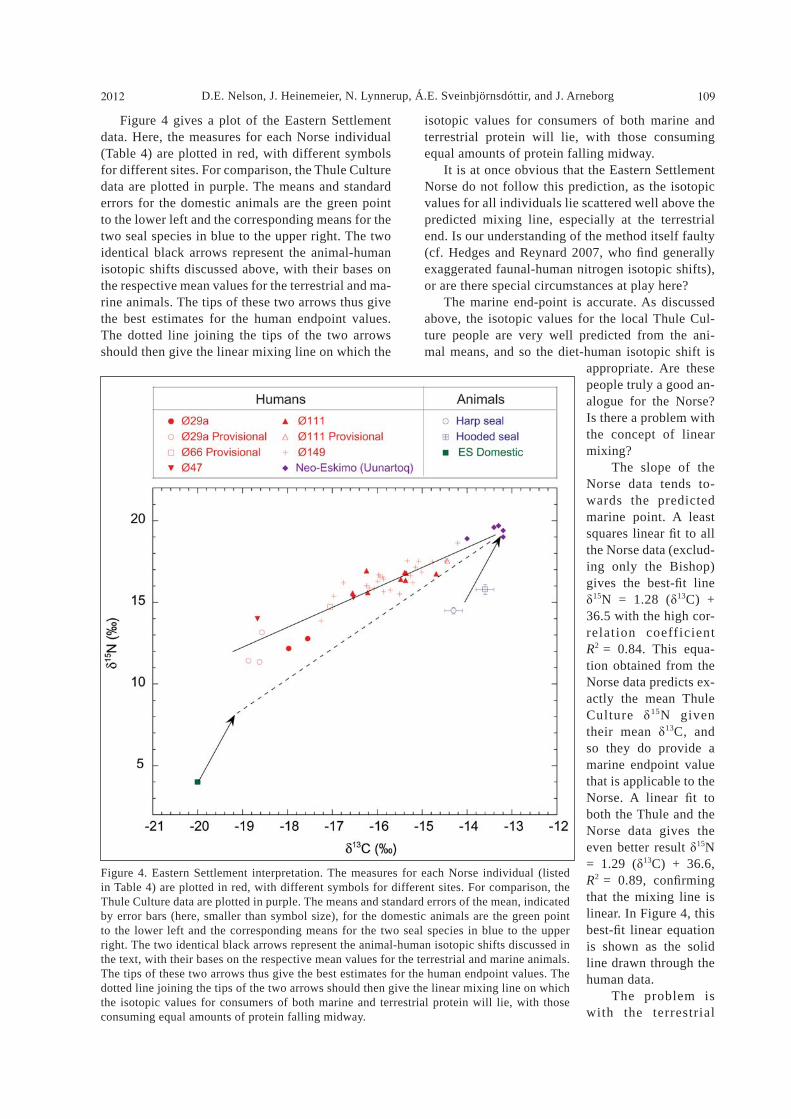
variable makes the nitrogen endpoints less de nitive than those for carbon, it also provides additional information. A potential source of marine protein which is not discussed above is sh, especially capelin (Mal-lotus villosus) and arctic char (Salvenius alpinus). At certain times of the year, both are easily available in large quantities. It is a curious and much-debated fact that sh-bone is only rarely found in excavations of Norse sites. Explanations for this strange absence include non-use, poor preservation, and inadequate excavation methods. We will not enter into this de-bate here, as the important issue is that for whatever reason, there were no sh bones in the collections to provide samples for isotopic measurement. The im-pact on this study is not large, as we can con dently predict that the 13C values of any sh caught by the Norse will be very similar to those of the seals they hunted and that the 15N values will be a little lower, re ecting these species relative positions in the ma-rine food chain. To a rst approximation, the marine protein from the sh is indirectly represented by the seal data. The bone collagen of the domestic animals from the Eastern Settlement had a mean 15N value of 4.0 ± 0.1‰ (Table 3), again a result in excellent accord with expectation. The variability about the mean is small. As discussed in detail in the study of the do-mestic animals (Nelson et al. 2012c [this volume]), the nitrogen data for the Western Settlement do-mestic animals can be described as having the same mean value as that for the Eastern Settlement ani-mals, but here the data are not so clear-cut, as some individual animals, especially cattle, had 15N values much higher than usual (e.g., mean value of 7.6‰ for V48 Niaquusat, n = 9, and a four times higher standard deviation for all Western Settlement cattle of 2.2‰, n = 25–30, compared to that of the Eastern Settlement; Nelson et al. 2012c [this volume]). This was not random variation, as the occurrence and magnitude of the anomaly varied from site to site (ibid). Here, we use the same mean as for the Eastern Settlement, but note that some animals had anoma-lous high values, which indicate something unusual. For this reason we do not quote values for SD and SE for the Western settlement (Table 3), and we also note that this may be an indication that the Western cattle do not in fact constitute one uniform isotopic reservoir (see discussion in Arneborg et al. 2012b [this volume]). The assumption of similar isotopic values for the two settlements is a simpli cation driven by necessity. With the observed differences between sites in the Western Settlement, one would need to break down this region isotopically into lo-cal areas/farms. However, for the purpose of inter-pretation of the human isotopic values, this exercise would be futile as in general we cannot establish
Journal of the North Atlantic Special Volume 3108
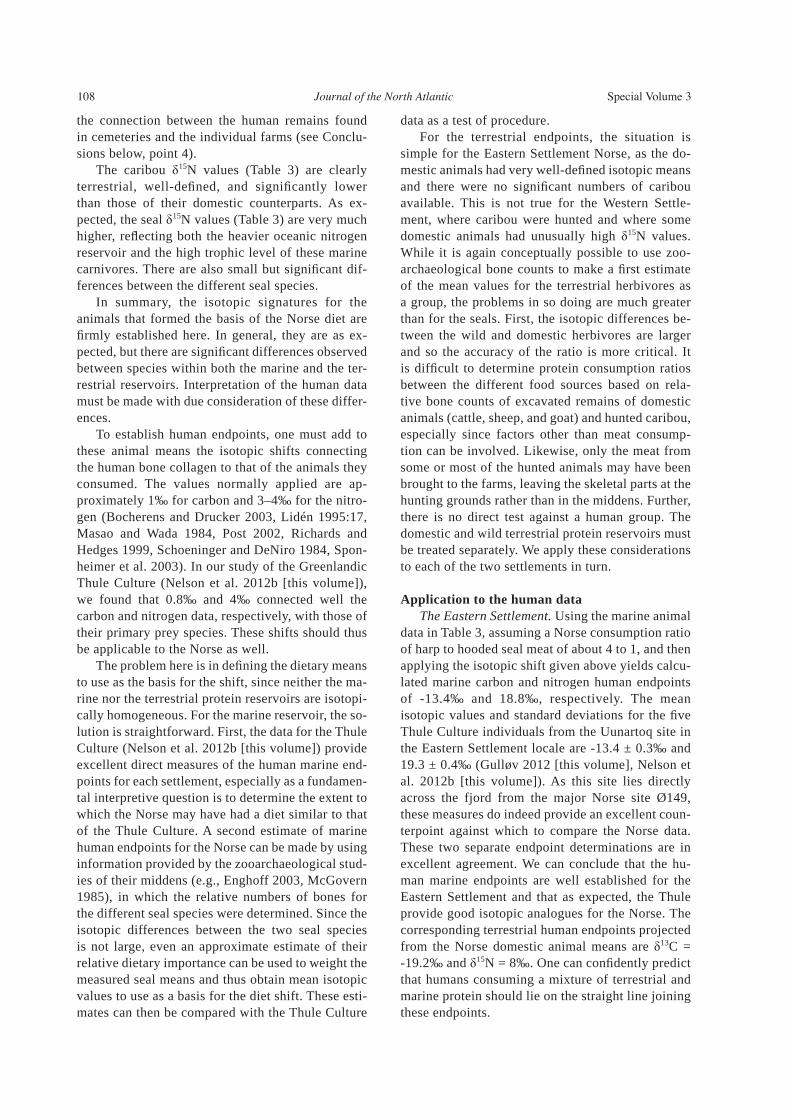
the connection between the human remains found in cemeteries and the individual farms (see Conclu-sions below, point 4). The caribou 15N values (Table 3) are clearly terrestrial, well-de ned, and signi cantly lower than those of their domestic counterparts. As ex-pected, the seal 15N values (Table 3) are very much higher, re ecting both the heavier oceanic nitrogen reservoir and the high trophic level of these marine carnivores. There are also small but signi cant dif-ferences between the different seal species. In summary, the isotopic signatures for the animals that formed the basis of the Norse diet are rmly established here. In general, they are as ex-
pected, but there are signi cant differences observed between species within both the marine and the ter-restrial reservoirs. Interpretation of the human data must be made with due consideration of these differ-ences. To establish human endpoints, one must add to these animal means the isotopic shifts connecting the human bone collagen to that of the animals they consumed. The values normally applied are ap-proximately 1‰ for carbon and 3–4‰ for the nitro-gen (Bocherens and Drucker 2003, Lidén 1995:17, Masao and Wada 1984, Post 2002, Richards and Hedges 1999, Schoeninger and DeNiro 1984, Spon-heimer et al. 2003). In our study of the Greenlandic Thule Culture (Nelson et al. 2012b [this volume]), we found that 0.8‰ and 4‰ connected well the carbon and nitrogen data, respectively, with those of their primary prey species. These shifts should thus be applicable to the Norse as well. The problem here is in de ning the dietary means to use as the basis for the shift, since neither the ma-rine nor the terrestrial protein reservoirs are isotopi-cally homogeneous. For the marine reservoir, the so-lution is straightforward. First, the data for the Thule Culture (Nelson et al. 2012b [this volume]) provide excellent direct measures of the human marine end-points for each settlement, especially as a fundamen-tal interpretive question is to determine the extent to which the Norse may have had a diet similar to that of the Thule Culture. A second estimate of marine human endpoints for the Norse can be made by using information provided by the zooarchaeological stud-ies of their middens (e.g., Enghoff 2003, McGovern 1985), in which the relative numbers of bones for the different seal species were determined. Since the isotopic differences between the two seal species is not large, even an approximate estimate of their relative dietary importance can be used to weight the measured seal means and thus obtain mean isotopic values to use as a basis for the diet shift. These esti-mates can then be compared with the Thule Culture
data as a test of procedure. For the terrestrial endpoints, the situation is simple for the Eastern Settlement Norse, as the do-mestic animals had very well-de ned isotopic means and there were no signi cant numbers of caribou available. This is not true for the Western Settle-ment, where caribou were hunted and where some domestic animals had unusually high 15N values. While it is again conceptually possible to use zoo-archaeological bone counts to make a rst estimate of the mean values for the terrestrial herbivores as a group, the problems in so doing are much greater than for the seals. First, the isotopic differences be-tween the wild and domestic herbivores are larger and so the accuracy of the ratio is more critical. It is dif cult to determine protein consumption ratios between the different food sources based on rela-tive bone counts of excavated remains of domestic animals (cattle, sheep, and goat) and hunted caribou, especially since factors other than meat consump-tion can be involved. Likewise, only the meat from some or most of the hunted animals may have been brought to the farms, leaving the skeletal parts at the hunting grounds rather than in the middens. Further, there is no direct test against a human group. The domestic and wild terrestrial protein reservoirs must be treated separately. We apply these considerations to each of the two settlements in turn. Application to the human data The Eastern Settlement. Using the marine animal data in Table 3, assuming a Norse consumption ratio of harp to hooded seal meat of about 4 to 1, and then applying the isotopic shift given above yields calcu-lated marine carbon and nitrogen human endpoints of -13.4‰ and 18.8‰, respectively. The mean isotopic values and standard deviations for the ve Thule Culture individuals from the Uunartoq site in the Eastern Settlement locale are -13.4 ± 0.3‰ and 19.3 ± 0.4‰ (Gulløv 2012 [this volume], Nelson et al. 2012b [this volume]). As this site lies directly across the fjord from the major Norse site Ø149, these measures do indeed provide an excellent coun-terpoint against which to compare the Norse data. These two separate endpoint determinations are in excellent agreement. We can conclude that the hu-man marine endpoints are well established for the Eastern Settlement and that as expected, the Thule provide good isotopic analogues for the Norse. The corresponding terrestrial human endpoints projected from the Norse domestic animal means are 13C = -19.2‰ and 15N = 8‰. One can con dently predict that humans consuming a mixture of terrestrial and marine protein should lie on the straight line joining these endpoints.
D.E. Nelson, J. Heinemeier, N. Lynnerup, Á.E. Sveinbjörnsdóttir, and J. Arneborg2012 109
isotopic values for consumers of both marine and terrestrial protein will lie, with those consuming equal amounts of protein falling midway. It is at once obvious that the Eastern Settlement Norse do not follow this prediction, as the isotopic values for all individuals lie scattered well above the predicted mixing line, especially at the terrestrial end. Is our understanding of the method itself faulty (cf. Hedges and Reynard 2007, who nd generally exaggerated faunal-human nitrogen isotopic shifts), or are there special circumstances at play here? The marine end-point is accurate. As discussed above, the isotopic values for the local Thule Cul-ture people are very well predicted from the ani-mal means, and so the diet-human isotopic shift is
appropriate. Are these people truly a good an-alogue for the Norse? Is there a problem with the concept of linear mixing? The slope of the Norse data tends to-wards the predicted marine point. A least squares linear t to all the Norse data (exclud-ing only the Bishop) gives the best- t line
15N = 1.28 ( 13C) + 36.5 with the high cor-relation coefficient R2 = 0.84. This equa-tion obtained from the Norse data predicts ex-actly the mean Thule Culture 15N given their mean 13C, and so they do provide a marine endpoint value that is applicable to the Norse. A linear t to both the Thule and the Norse data gives the even better result 15N = 1.29 ( 13C) + 36.6, R2 = 0.89, con rming that the mixing line is linear. In Figure 4, this best- t linear equation is shown as the solid line drawn through the human data. The problem is with the terrestrial
Figure 4 gives a plot of the Eastern Settlement data. Here, the measures for each Norse individual (Table 4) are plotted in red, with different symbols for different sites. For comparison, the Thule Culture data are plotted in purple. The means and standard errors for the domestic animals are the green point to the lower left and the corresponding means for the two seal species in blue to the upper right. The two identical black arrows represent the animal-human isotopic shifts discussed above, with their bases on the respective mean values for the terrestrial and ma-rine animals. The tips of these two arrows thus give the best estimates for the human endpoint values. The dotted line joining the tips of the two arrows should then give the linear mixing line on which the
Figure 4. Eastern Settlement interpretation. The measures for each Norse individual (listed in Table 4) are plotted in red, with different symbols for different sites. For comparison, the Thule Culture data are plotted in purple. The means and standard errors of the mean, indicated by error bars (here, smaller than symbol size), for the domestic animals are the green point to the lower left and the corresponding means for the two seal species in blue to the upper right. The two identical black arrows represent the animal-human isotopic shifts discussed in the text, with their bases on the respective mean values for the terrestrial and marine animals. The tips of these two arrows thus give the best estimates for the human endpoint values. The dotted line joining the tips of the two arrows should then give the linear mixing line on which the isotopic values for consumers of both marine and terrestrial protein will lie, with those consuming equal amounts of protein falling midway.

Journal of the North Atlantic Special Volume 3110
2012c [this volume]), but unfortunately we cannot link the human bone samples from the later church-yards to individual farms and their cattle. Also, bone analyses indicate a fairly high proportion of juvenile to adult cattle bone in the middens (Enghoff 2003:70 ff., McGovern 1985), possibly indicative of prefer-ential veal consumption. There may be an additional “step” in the domestic food chain which could be considered. Recent stable isotopic studies of modern dairy products might be considered here. To quote, “organic fertilizers and intensive farming methods increase the level of 15N in the soil and consequently in the plants, in milk, and in cheese” (Pillonel et al. 2003). We can extend this list to meat and the people who consume the meat, milk, and cheese. The high nitrogen values observed for the Greenlandic Norse are consistent with this observation (see also Bogaard et al. 2007), and we can speculate that these values re ect Norse eld management methods (see, e.g., Buckland et
al. 2009, Commisso and Nelson 2010 and references therein). One might speculate whether consumption of dairy products as such could have contributed in particular to the observed discrepancy between the human data and the animal bone collagen data. However, while dairy products were certainly a fun-damental part of Norse agriculture (Arneborg et al. 2012a [this volume], McGovern 1985), there is no evidence that 15N can distinguish dairy from other animal products—on the contrary, all available data support the assumption that dairy and meat products from the same animal are isotopically the same (see, e.g., O’Connell and Hedges 1999:63, Privat et al. 2005). Given the present data for the Eastern Settle-ment, an empirical increase of the predicted terres-trial human nitrogen endpoint by an extra 4‰ (a sec-ond trophic level) ts the observed human data very well, yielding endpoints of 13C = -19.2‰ and 15N = 12‰. As discussed above, the corresponding ma-rine endpoints are well established at 13C = -13.4‰ and 15N = 19‰. Due to the nature of the data un-derlying these conclusions, it is dif cult to provide an analytical determination of the uncertainty for each of these values, but we can make an estimate: It would be dif cult to change these 13C endpoints by more than 0.3‰ or the 15N endpoints by more than 1‰ and still satisfy all the data. In summary, the 13C domestic-marine consumption scale is well established for the Eastern Settlement, and we have interesting independent information provided by the nitrogen data, discussed in more detail below in the next section. Western Settlement. For the Western Settle-ment population, the marine species of primary
end-points. Can we argue that the isotopic shifts between food and consumer are different for con-sumers of terrestrial herbivore protein than they are for those of marine carnivore protein? The dif-ferences required to fit the Norse data are large. There is abundant data in the literature for human terrestrial consumers in a C3-plant environment that place their carbon endpoint values within the range of about -20 ± 1‰. Greenland is a C3 environment and the human 13C endpoint predicted from the Norse domestic animal data is -19.2‰, well within the range of expected values. The carbon endpoint cannot provide an explanation for the discrepancy. The nitrogen shift used here is 4‰, which is at the upper end of the range (3 to 4‰) usually found in isotopic diet studies and which is seen to work very well at the marine end of the scale. Given the precisely determined mean nitrogen value (< 15N> = 4.0 ± 0.1‰) for the domestic animals, the human terrestrial nitrogen endpoint should be within the range of 15N = 8 ± 1‰ as shown by the arrow tip. In comparison, at the endpoint value 13C = -19.2‰, the best- t line drawn through the human data in Figure 4 has 15N = 12‰. This analysis in-dicates a diet-consumer shift for nitrogen as large as that usually attributed to more than two trophic levels of consumption. This shift is too large to be acceptable, especially given the good t at the ma-rine end of the scale. Even so, the explanation must lie with the nitrogen isotopes, as the carbon values are too well constrained. What could cause an apparent 15N shift as large as two trophic levels? Firstly, we note that similarly high trophic level shifts are not uncommon in other Medieval/Later Medieval populations (e.g., Müld-ner and Richards 2007). Secondly, it is well known that the nitrogen isotopic values of suckling animals are 3 to 4‰ above those of their mothers (cf. Kelly 2000). The Norse data could thus be explained by the presumption that the terrestrial protein in their diets came entirely from suckling veal, lamb, and kid. However, the 15N values of the bones of very young animals from Norse middens in the Eastern Settlement (Nelson et al. 2012c [this volume]) do not show evidence for such a large shift. This is an unlikely explanation. On the other hand, the extreme isotopic variability observed in the West-ern Settlement cattle and their high 15N values in juveniles (Nelson et al. 2012c [this volume]) raise the general question of the representativeness of our cattle samples in relation to their Norse consumers. In the Western Settlement, the isotopically extreme cattle samples are from an individual farm (V48 Niaquusat) with challenging conditions for farming (Arneborg et al. 2012a [this volume], Nelson et al.
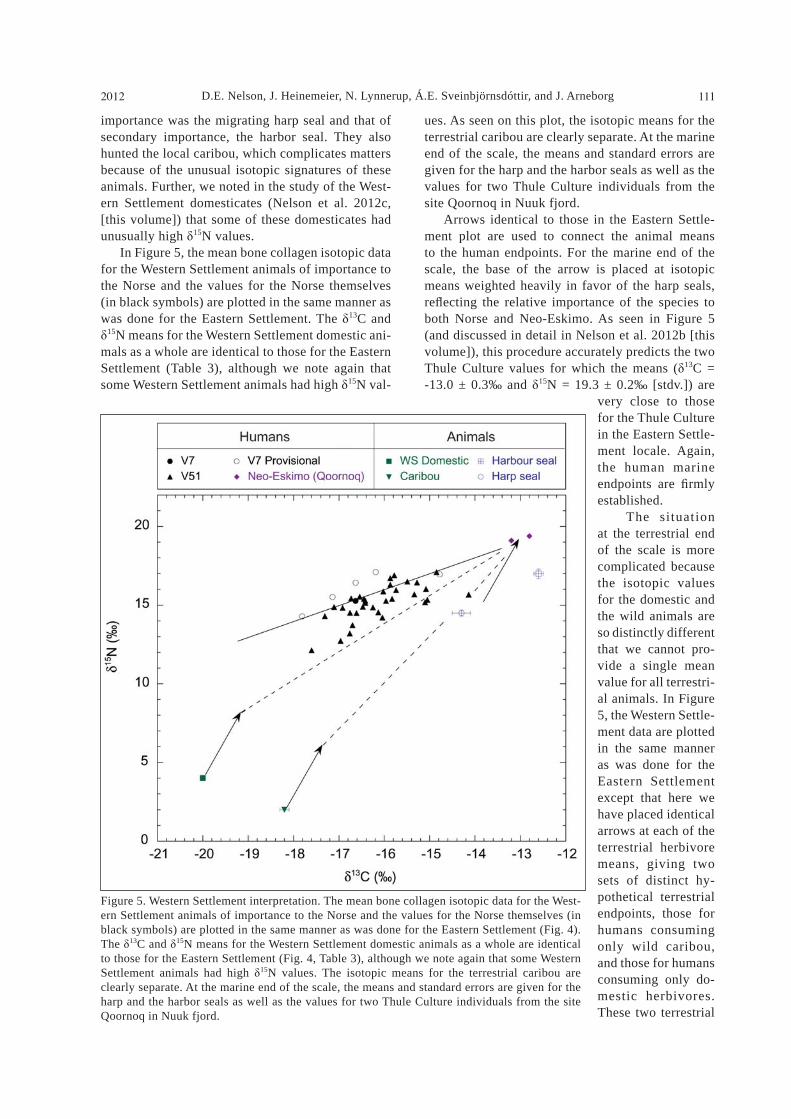
D.E. Nelson, J. Heinemeier, N. Lynnerup, Á.E. Sveinbjörnsdóttir, and J. Arneborg2012 111
ues. As seen on this plot, the isotopic means for the terrestrial caribou are clearly separate. At the marine end of the scale, the means and standard errors are given for the harp and the harbor seals as well as the values for two Thule Culture individuals from the site Qoornoq in Nuuk fjord. Arrows identical to those in the Eastern Settle-ment plot are used to connect the animal means to the human endpoints. For the marine end of the scale, the base of the arrow is placed at isotopic means weighted heavily in favor of the harp seals, re ecting the relative importance of the species to both Norse and Neo-Eskimo. As seen in Figure 5 (and discussed in detail in Nelson et al. 2012b [this volume]), this procedure accurately predicts the two Thule Culture values for which the means ( 13C = -13.0 ± 0.3‰ and 15N = 19.3 ± 0.2‰ [stdv.]) are
very close to those for the Thule Culture in the Eastern Settle-ment locale. Again, the human marine endpoints are rmly established. The situation at the terrestrial end of the scale is more complicated because the isotopic values for the domestic and the wild animals are so distinctly different that we cannot pro-vide a single mean value for all terrestri-al animals. In Figure 5, the Western Settle-ment data are plotted in the same manner as was done for the Eastern Settlement except that here we have placed identical arrows at each of the terrestrial herbivore means, giving two sets of distinct hy-pothetical terrestrial endpoints, those for humans consuming only wild caribou, and those for humans consuming only do-mestic herbivores. These two terrestrial
importance was the migrating harp seal and that of secondary importance, the harbor seal. They also hunted the local caribou, which complicates matters because of the unusual isotopic signatures of these animals. Further, we noted in the study of the West-ern Settlement domesticates (Nelson et al. 2012c, [this volume]) that some of these domesticates had unusually high 15N values. In Figure 5, the mean bone collagen isotopic data for the Western Settlement animals of importance to the Norse and the values for the Norse themselves (in black symbols) are plotted in the same manner as was done for the Eastern Settlement. The 13C and
15N means for the Western Settlement domestic ani-mals as a whole are identical to those for the Eastern Settlement (Table 3), although we note again that some Western Settlement animals had high 15N val-
Figure 5. Western Settlement interpretation. The mean bone collagen isotopic data for the West-ern Settlement animals of importance to the Norse and the values for the Norse themselves (in black symbols) are plotted in the same manner as was done for the Eastern Settlement (Fig. 4). The 13C and 15N means for the Western Settlement domestic animals as a whole are identical to those for the Eastern Settlement (Fig. 4, Table 3), although we note again that some Western Settlement animals had high 15N values. The isotopic means for the terrestrial caribou are clearly separate. At the marine end of the scale, the means and standard errors are given for the harp and the harbor seals as well as the values for two Thule Culture individuals from the site Qoornoq in Nuuk fjord.

Journal of the North Atlantic Special Volume 3112
can use the three sets of endpoints in simple mass-balance calculations to predict possible results from different relative consumptions from the three reser-voirs, and then compare the predictions to the human data. No individuals have values that are consistent with more than 25% caribou protein in the diet. The actual values will likely be much less. We must, however, emphasize the uncertainties in such attempted reconstructions for the Western Settlement, where the high cattle 15N values might be more representative for the human diet than as-sumed. In that case, the “extra” 4‰ nitrogen shift would not be required to arrive at a terrestrial (domestic)-marine mixing line which would t the human isotope data (Fig. 5) without assumption of any caribou component.
Archaeological Interpretations
The data permit quantitative dietary analyses, especially for the Eastern Settlement inhabitants. Even though the terrestrial nitrogen endpoints are speculative, the carbon endpoints are firmly estab-lished at -19.2‰ and -13.4‰, respectively, for the terrestrial and marine protein reservoirs. Further, there is direct evidence that the mixing line scales linearly, as predicted. The midpoint value at 13C = -16.3‰ is thus a good estimate for those obtain-ing half their protein from their domestic animals and half from the marine mammals, while those consuming 25% marine protein will have 13C = -17.8‰ and those consuming about 75% marine protein will have 13C = -14.9‰. Using this scale, we can translate the Norse mean data previously presented (Table 7) into quantitative estimates for the relative amounts of marine and terrestrial protein consumed. The mean 13C value for the Eastern Settlement as a whole and for each of the two sites Ø149 and Ø111 Herjolfsnes individually is -15.7‰, indicating a relative consumption of marine protein of 60%. On average then, between one-half and two-thirds of the protein consumed by the people buried at the two sites was obtained from the sea. Means hide individual detail. The upper plot in Figure 6 gives the distribution of 13C values for the Eastern Settlement sites. (Again, the Ø29a Brattahlid data and the Bishop are omitted as ir-relevant.) At the top is drawn the scale represent-ing the relative consumption of marine protein as based on the carbon scale. Only 5 of the 33 individuals obtained more of their protein from the terrestrial than from the marine reservoir. Of these, the three with highest terrestrial consump-tion are two younger and an older adult woman
endpoints are each connected by a dotted line to the marine endpoint, and so the isotopic values of in-dividuals consuming protein from all three sources will lie scattered somewhere between these two lines. It will not be possible to provide unique deter-minations of the relative amounts from each source without further information. At rst glance, that does not appear to be nec-essary, as with only one signi cant exception, the Norse human data lie at or above the domestic-marine line, as was found for the Eastern Settlement Norse. It is then tempting to conclude that we can simply ignore the caribou as a basic food source, but that would be incorrect. We know from the Eastern Settlement data that some factor raises the human nitrogen values for consumers of domestic protein over those expected from the bone collagen of the animals consumed. While the Western Settlement Norse data do trend towards the well- xed marine endpoint, the correlation between the carbon and nitrogen isotopes is not nearly so strong as in the Eastern Settlement data. A least squares linear t to the Western Settlement human data yields an R2 value of only 0.38. Obviously, more factors are at play than was the case for the Eastern Settlement, and we must include the caribou. What can be said with certainty? First, as noted above, the marine endpoints for both carbon and nitrogen are well established. Next, both carbon and nitrogen endpoints for the hypothetical con-sumers of caribou are equally well fixed, as is the carbon value for the domesticates. As was seen in the Eastern Settlement data, the human nitrogen endpoint predicted from the domesticate mean is far too low. As a purely empirical approach, we can tenta-tively apply the assumption that the same 4‰ extra nitrogen shift applies here as in the much more straight forward case of the Eastern Settlement. The solid line in Figure 5 gives the resulting domestic-human mixing line. It is almost identical to that de-rived from the empirical t to the Eastern Settlement human data. Humans with values falling at or above this line are unlikely to have had much caribou in their diet. Signi cant consumption of caribou will shift the human values below the line and will cause the human 13C values to be shifted towards the marine end of the scale. That is fortunate, as a pri-mary goal is to determine the relative contributions of the domestic and wild animals to the Norse diet. Any caribou consumption will thus tend to move the carbon data to the “wild side” of the 13C scale, i.e., towards caribou and seal. Without other information, it is not possible to determine the contribution of caribou protein. One

D.E. Nelson, J. Heinemeier, N. Lynnerup, Á.E. Sveinbjörnsdóttir, and J. Arneborg2012 113
nificantly different from those of a Thule Culture woman from the same locale. (This observation prompted a re-examination of the crania from which the samples were taken, as a Thule Culture person buried in a Norse cemetery would be most interesting. There were no mistakes in either sam-ple taking or racial affiliation.) For most people in the Eastern Settlement then, without any consideration of chronology, the marine animals played a greater role in their protein diet than did their domestic animals, and for a few, do-mestic protein was almost absent as a substantial di-
etary element. It seems that the sea was a more fundamental protein re-source for the people in the Eastern Settlement than was their agricul-ture. Note, however, as seen from the map in Figure 1, the human bones in Figure 4 are all from coastal sites (Ø111 and Ø149), except for one (Ø47) (Arneborg et al. 2012a [this vol-ume]). As noted, deriv-ing quantitative con-sumption estimates for the Western Settlement is confused by the pres-ence of the isotopically anomalous caribou. Even so, we can pro-vide solid interpreta-tions. While we could attempt to use the ni-trogen data to estimate the impact of caribou consumption, a more conservative approach is to simply apply the
13C scale based on the carbon endpoint for the domestic animals and on the well-established marine endpoint. Those people who consumed significant amounts of caribou protein will have had their mea-sures shifted towards the marine (or, put in another way, the hunt-
from Ø149. Another (sample # 20 from Ø47) is an adult male, and the fifth is a young person in his/her early teens (sample # 15) from Ø111 Herjolfsnes. Again, there is no apparent correla-tion with age or sex. The remaining 28 individuals are scattered at or below 50% terrestrial protein consumption. Most (24) of them obtained between 50% and 75% of their protein from the sea. The remaining 4 had diets containing more than 75% marine protein. One of these latter (sample # 234, KAL–1021, an adult of unknown sex from the cemetery at Ø149) has isotopic values not sig-
Figure 6. Marine protein consumption estimates for Eastern and Western Settlements.
Journal of the North Atlantic Special Volume 3114
ing) end of the scale. The results obtained will then be maximum values for consumption of marine protein. The mean 13C value for the Western Settle-ment as a whole is -16.2‰, corresponding to a maximum marine protein intake of a little less than 50%. If these data are representative, and again without any considerations of chronology, the people of the Western Settlement would appear to be less reliant on the marine reservoir than their neighbors to the south. However, this observation is hardly archaeologically significant in view of the small numerical isotopic difference ( 0.3‰ or approximately twice the observed standard error of 0.14‰ within the two settlements; see Table 7) and the issue of representativeness regarding coast/inland site location within both settlements repre-sented in Figure 6. Thus, as discussed above, the Eastern Settlements samples have a clear coastal bias, while the Western Settlement samples are from one single churchyard (V51 Sandnes) only, except for two (V7 Anavik) (Fig. 2). As before, the observed mean masks more interesting details. The lower portion of Figure 6 gives the distribution of
13C measures for the Western Settlement individu-als. Again, no provisional data are plotted. Here, the consumption ratio scale is very slightly dif-ferent from that for the Eastern Settlement, as the best estimate for the marine endpoint is -13.0‰, while the same domestic endpoint applies. Note again that the estimate of the relative marine con-sumption is a maximum value. The distribution of human data is different from that in the Eastern Settlement, where the majority was more strongly dependent on marine protein. Here, more than half the individuals (19 of 35) have 13C values consistent with a maximum marine protein intake of 50%. The greatest terrestrial consumer is an adult male from V7 Anavik, one of the two secure measures from that site. Three V51 Sandnes indi-viduals with 13C < -17‰ are those of a child and two adult males. At the other end of the scale, nine individuals had 13C values > -15.5‰, and were thus heavily reliant on protein from the marine animals. One of these, a young adult woman from V51 Sandnes (sample # 4, KAL–961) also has an unusually low 15N value, which places her exactly on the predicted mixing line (Fig. 5) expected for a consumer of about 25% caribou and 75% seal meat. No protein from the domestic animals is iso-topically required in her diet. In summary, there is a wide range of consumption, ranging from those who obtained at most 1/4 of their protein from the sea, to those whose protein intake was almost en-tirely from the wild animals.
In the analyses above, no quantitative use has been made of the nitrogen data, as the calculated terrestrial nitrogen endpoint does not predict the measured human data for either settlement. Future work must seek explanations for this discrepancy, especially as there is such a high linear correlation between the carbon and nitrogen isotopes for the Eastern Settlement population as a whole. For the Western Settlement, the addition of the caribou means that we cannot use the nitrogen scale to provide more than estimates of minimum domestic protein consumption. Here, the low correlation between carbon and nitrogen isotopes may then indicate that those individuals whose 15N values fall well below the solid line in Figure 5 have con-sumed more caribou. Several individuals stand out in this respect. In all these considerations, we have seen no cor-relations between diet and the age or sex of the indi-vidual. We do not have the requisite archaeological information to correlate diet and individual status. From these data alone, then, the wide range of di-etary differences between individuals could re ect status, circumstance, or changes over time.
Conclusions
Despite the complexity of interpreting these data, this application of the isotopic dietary meth-od to analysis of the Greenland Norse dietary economy does provide responses to the questions posed at the outset. The extent to which this new information is useful to current archaeological reconstruction will be a topic of the final paper in this project series (Arneborg et al. 2012b [this vol-ume]). Below, we respond to the questions one by one:
1) Are the isotopic signatures of the two food res-ervoirs of interest here (the terrestrial and marine biospheres) suf ciently characteristic to provide reliable information on Norse diet? The simple answer to this question is yes. We can use the animal data to predict the bone colla-gen isotopic values for the humans who consumed them. At the marine end of the scale, the accuracy of this prediction could be tested and was con-firmed directly by measurement of Thule hunters from sites in each of the two settlements. All in all, the data underlying the interpretations are sol-id and can provide reliable dietary information. In particular, the carbon data are sufficiently distinct and well understood that quantitative consumption ratios for individuals can be determined, as was confirmed by the unusual isotopic values for the immigrant Bishop.

D.E. Nelson, J. Heinemeier, N. Lynnerup, Á.E. Sveinbjörnsdóttir, and J. Arneborg2012 115
It is clear that the isotopic method provides reli-able information on Greenlandic diet even at the level of the individual.
2) To what extent did the Greenlandic Norse com-munity as a whole rely on the terrestrial reservoir (in effect, their agriculture) and to what extent on hunting the marine mammals? For the two Norse settlements taken as a whole, the basic dietary economy was based about as much on hunting as it was on their domestic animals. This general statement encompasses 80 individuals from 7 different cemeteries in the two settlements, but it is a broad generalization that masks much interesting detail.
3) Were there differences between the two settle-ments in this reliance? To the extent that the individuals measured are indeed representative of the populations in each of the settlements, it would appear that there were dif-ferences. For the people from the Eastern Settlement as a whole, the mean 13C value indicates that they obtained about 60% of their protein from the marine reservoir. Interpreting the Western Settlement data is much more complicated because of the isotopically distinct caribou and the unusual nitrogen isotopic values for some of the domestic animals. At a maxi-mum, the people on average obtained 50% of their protein from marine sources. On the basis of the present isotopic evidence then, the people in the Eastern Settlement on aver-age had a higher reliance on marine protein than did those in the Western Settlement. However, the mean isotopic values do not take into account the increas-ing marine consumption over time, which means a high mean marine signature for the Eastern Settle-ment as it was populated about 100 years longer than the Western Settlement.
4) Were there differences between sites in the same settlement? Is there any evidence for specialization? We cannot address this question in detail be-cause of the nature of the samples. Except for the samples from Ø29a Tjodhilde’s Church, all were taken from cemeteries connected to what we un-derstand as communal churches, and so we can-not know which of the burials are people from the farm at which the cemetery was located, and which from another farm in the area served by the church. Specialization at the farm level is thus beyond the reach of these data.
5) Were there differences between individuals? Can any such differences be correlated with age, sex, or status? For the rst of these questions, the isotopic data provide an unequivocal answer: there were great
dietary differences between individuals. In each settlement, some people consumed more terrestrial than marine protein, some consumed about equal amounts, and the diets of others were based more on the sea than on land animals. In both settlements, there are a few individuals who were heavily reliant on marine protein; in both, there was one individual whose isotopic values are consistent with a diet ob-tained entirely through hunting. In the present data set, we see no evidence for real differences between the diets of men and women or between individuals of different ages. The large individual differences are then likely connected to status or circumstance, but not to sex or age.
6) Can we learn anything about the nature of the food consumed? The high 15N values for the humans at the ter-restrial (domestic) end of the scale are anomalous, given the observed values for the bone collagen of the domestic animals and for the caribou. This finding is especially clear in the Eastern Settle-ment, where there were no anomalous values for the domestic animals, and where no significant numbers of caribou were hunted. The most likely explanation would seem to be that the anoma-lously high human nitrogen values reflect either a general weakness in the method itself (cf. Hedges and Reynard 2007) or somehow reflect Norse field management.
Literature Cited
Ambrose, S.H. 1993. Isotopic analysis of paleodiets: Methodological and interpretive considerations. Pp. 59–130, In M.K. Sandford (Ed.). Investigations of An-cient Human Tissue: Chemical Analyses in Archaeol-ogy. Gordon and Breach, Pennsylvania. 431 pp.
Ambrose, S.H., and A. Katzenberg (Eds.). 2000. Bio-geochemical Approaches to Paleodietary Analysis. Advances in Archaeological and Museum Science Volume 5. Kluwer Academic/Plenum Publishers, New York, NY, USA. 269 pp.
Ambrose, S.H., and L. Norr. 1993. Experimental evidence for the relationship of the carbon isotope ratios of whole diet and dietary protein to those of bone col-lagen and carbonate. Pp. 1–37, In J.B. Lambert and G. Grupe (Eds.). Prehistoric Human Bone. Springer-Verlag, Berlin, Germany. 313 pp.
Arneborg, J. 1991. The Roman Church in Norse Green-land. Acta Archaeologica 61:142–150.
Arneborg, J. 2010. Brattahlids beliggenhed. Grønland 4:320–328.
Arneborg, J., J. Heinemeier, N. Lynnerup, H.L. Nielsen, N. Rud, and Á.E. Sveinbjörndóttir. 1999. Change of diet of the Greenland Vikings determined from stable carbon isotope analysis and 14C dating of their bones. Radiocarbon 41:157–168.
Journal of the North Atlantic Special Volume 3116
Arneborg, J., N. Lynnerup, J. Heinemeier, J.Møhl, N. Rud, and Á.E. Sveinbjörnsdóttir. 2012a [this volume]. Norse Greenland dietary economy ca. AD 980–ca. AD 1450: Introduction. Journal of the North Atlantic Special Volume 3:1–39.
Arneborg, J., N. Lynnerup, and J. Heinemeier. 2012b [this volume]. Human diet and subsistence patterns in Norse Greenland AD ca. 980–AD ca. 1450: Ar-chaelogical interpretations. Journal of the North At-lantic Special Volume 3:119–133.
Bocherens, H., and D. Drucker. 2003. Trophic level iso-topic enrichment of carbon and nitrogen in bone col-lagen: Case studies from recent and ancient terrestrial ecosystems. International Journal of Osteoarchaeol-ogy 13:46–53.
Bocherens, H., M. Fizet, A. Mariotti, C. Olive, G. Bellon, and D. Billiou. 1991. Application de la biogéochimie isotopique (13C, 15N) á la determination du régime alimentaire des populations humaines et animales durant les périodes antique et médiévale. Arch Sci 44:329–340.
Bogaard, A., T. Heaton, P. Poulton, and I. Merbach. 2007. The impact of manuring on nitrogen isotope ratios in cereals: Archaeological implications for reconstruc-tion of diet and crop management practices. Journal of Archaeological Science 34:335–43.
Bourbou ,C, B.T. Fuller, S.J. Garvie-Lok, and M.P. Rich-ards. 2011. Reconstructing the diets of Greek Byzan-tine populations (6th–15th centuries AD) using carbon and nitrogen stable isotope ratios. American Journal of Physical Anthropology 146(4):569–81.
Buckland, P.C., K.J. Edwards, E. Panagiotakopulu, and J.E. Scho eld. 2009. Palaeoecological and historical evidence for manuring and irrigation at Gardar (Iga-liku), Norse Eastern Settlement, Greenland. The Holo-cene 19:105–16.
Commisso, R.G., and D.E. Nelson. 2010. Stable nitrogen isotopic examination of Norse sites in the Western settlement of Greenland. Journal of Archaeological Science 37:1233–40.
De Niro, M.J. 1985. Postmortem preservation and altera-tion of in vivo bone collagen isotope ratios in relation to dietary reconstruction. Nature 317:806.
Edwards, K.J., J.E. Scho eld, and J. Arneborg. 2010. Was Erik the Red’s Brattahlið located at Qinngua Kangilleq? A dissenting view. Viking and Medieval Scandinavia 6:83–99.
Egardt, B. 1981. Hästkött. Kulturhistorisk Leksikon for Nordisk Middelalder 7:280–281.
Enghoff, I.B. 2003. Hunting, shing, and animal husband-ry at The Farm Beneath The Sand, Western Greenland. Meddelelser om Grønland, Man and Society 28:1–104.
Fischer, A., J. Olsen, M. Richard, J. Heinemeier, Á.E. Sveinbjörnsdottir, and P. Bennike. 2007. Coast-inland mobility and diet in the Danish Mesolithic and Neo-lithic: Evidence from stable isotope values of humans and dogs. Journal of Archaeological Science 34: 2125–50.
Fricke, H.C., J.R. O’Neil, and N. Lynnerup. 1995. Oxy-gen isotope composition of human tooth enamel from medieval Greenland: Linking climate and society. Geology 23:869–872.
Geyh, M.A. 2001. Bomb radiocarbon dating of animal tis-sue and hair. Radiocarbon 43:723–730.
Grupe, G., and J. Peters. 2007. Molecular biological methods applied to Neolithic bioarchaeological re-mains: Research potential, problems, and pitfalls. Pp. 275–306, In L. Larsson, F. Lüth, and T. Terberger (Eds.). Innovation and Continuity: Non-Megalithic Mortuary Practices in the Baltic. Workshop Schwerin 24–25 April 2006. Berichte der Römisch-Germanisch-en-Kommission 88(2009), Mainz, Germany. 603 pp.
Gulløv, H.C. 2012. [this volume]. Archaeological Com-mentary on the Isotopic Study of the Greenland Thule Culture. Journal of the North Atlantic Special Volume 3:65–76.
Hedges, R.E.M. 2004. Isotope and red herrings: Com-ments on Milner et al. and Líden et al. Antiquity 78:34–37.
Hedges, R.E.M., and L.M. Reynard 2007. Nitrogen iso-topes and the trophic level of humans in archaeology. Journal of Archaeological Science 34:1240–51.
Hedges, R.E.M., J.G. Clement, C.D.L. Thomas, and T.C. O’Connell. 2007. Collagen turnover in the adult femoral mid-shaft: Modelled from anthropogenic ra-diocarbon tracer measurements. American Journal of Physical Anthropology 133:808–16.
Herrscher, E., H. Bocherens, F. Valentin, and R. Co-lardelle. 2001. Dietary behaviour of the medieval pe-riod in Grenoble: Isotopic biogeochemistry of Saint-Laurent cemetery (XIIIth-XVth AD, Isere, France) (in French). Comptes Rendus De L Academie Des Sciences Serie Iii-Sciences De La Vie-Life Sciences 324(5):479–87.
Katzenberg, MA. 2007. Stable Isotope Analysis: A Tool for Studying Past Diet, Demography, and Life His-tory. Biological Anthropology of the Human Skeleton. John Wiley and Sons, Inc., Hoboken, NJ, USA. Pp. 411–441.
Kelly, J.F. 2000. Stable isotopes of carbon and nitrogen in the study of avian and mammalian trophic ecology. Canadian Journal of Zoology 78:1–27.
Krogh, K.J. 1982. Erik den Rødes Grønland. Nationalmu-seet, København, Denmark. 266 pp.
Lee-Thorp, J.A. 2008. On isotopes and old bones. Archae-ometry 50:925–50.
Lidén, K. 1995. Prehistoric Diet Transition. Theses and Papers in Scienti c Archaeology 1. Archaeological Research Laboratory, Stockholm University, Stock-holm, Sweden. 41 pp.
Lynnerup, N. 1998. The Greenland Norse: A biological anthropological study. Meddelelser om Grønland, Man and Society 24:1–149.
Martin, P.B., D.B. Burr, and N.A. Sharkey. 1998. Skeletal Tissue Mechanics. Springer, New York, NY, USA. 395 pp.

D.E. Nelson, J. Heinemeier, N. Lynnerup, Á.E. Sveinbjörnsdóttir, and J. Arneborg2012 117
Masao, M., and E. Wada. 1984. Stepwise enrichment of 15N along food chains: Further evidence and the re-lation between 15N and animal age. Geochimica et Cosmochimica Acta 48:1135–1140.
Mays, S.A. 1997. Carbon stable isotope ratios in mediae-val and later human skeletons from northern England. Journal of Archaeological Science 24(6):561–8.
McGovern, T.H. 1985. Contribution to paleoeconomy of Norse Greenland. Acta Archaeologica 54:73–122.
Meldgaard, J. 1982. Tjodhildes Kirke—den første fundbe-retning. Grønland 5-6-7:151–162.
Müldner, G., and M.P. Richards. 2005. Fast or feast: Re-constructing diet in later medieval England by stable isotope analysis. Journal of Archaeological Science 32(1):39–48.
Müldner, G., and M.P. Richards. 2007. Diet and diversity at Later Medieval Fishergate: The isotopic evidence. American Journal of Physical anthropology 134:134–174.
Nelson, D.E., and J. Møhl. 2003. Radiocarbon dating caribou antler and bone. Are they different? Arctic 56:262–265.
Nelson, D.E., J. Møhl, J. Heinemeier, and J. Arneborg. 2012a [this volume]. Stable carbon and nitrogen isotopic measurements of the wild animals hunted by the Norse and the Neo-Eskimo people of Greenland. Journal of the North Atlantic Special Volume 3:40–50.
Nelson, D.E., N. Lynnerup, and J. Arneborg. 2012b [this volume]. A rst isotopic dietary study of the Green-landic Thule Culture. Journal of the North Atlantic Special Volume 3:51–64.
Nelson, D.E., J. Heinemeier, J. Møhl, and J. Arneborg. 2012c [this volume]. Isotopic analysis of the domestic animals of Norse Greenland. Journal of the North At-lantic Special Volume 3:77–92.
O’Connell, T.C., and R.E.M. Hedges. 1999. Investigations into the effect of diet on modern human hair isotopic values. American Journal of Physical Anthropology 108:409–25.
Olsen, J., and J. Heinemeier. 2007. AMS dating of human bone from the Ostorf cemetery in the light of new information on dietary habits and freshwater reservoir effects. Pp. 339–352, In L. Larsson, F. Lüth, and T. Terberger. (Eds.). Innovation and Continuity. Non-Megalithic Mortuary Practices in the Baltic. Workshop Schwerin 24–25 April 2006. Berichte der Römisch-Germanischen-Kommission 88(2009), Mainz, Ger-many.. 603 pp.
Olsen J., J. Heinemeier, H. Lübke, F. Lüth, and T. Ter-berger 2010. Dietary habits and freshwater reservoir effects in bones from a Neolithic NE German cem-etery. Radiocarbon 52(2–3):635–44.
Pillonel, L., R. Badertscher, P. Froidevaux, G. Haber-hauer, S. Holzl, P. Horn, A. Jakob, E. Pfammatter, U. Piantini, A. Rossmannj, R. Tabacchi, and J.O. Bosset. 2003. Stable isotope ratios: Major trace and radioac-tive elements in emmental cheeses of different ori-gins. Lebensmittels -Wissenschaft und -Technologie 36:614–623.
Polet, C., and M.A. Katzenberg. 2003. Reconstruction of the diet in a mediaeval monastic community from the coast of Belgium. Journal of Archaeological Science 30(5):525–33.
Post, D.M. 2002. Using stable isotopes to estimate trophic position: Models, methods, and assumptions. Ecology 83:703–18.
Privat, K., T.C. Connell, K. Neal, and R.E.M. Hedges 2005. Fermented dairy product analysis and palaeodi-etary repercussions. Pp. 60–66, In J. Mulville and A. Outram (Eds.). The Zooarchaeology of Fats, Oils, Milk, and Dairying. Proceedings of the 9th Conference of the International Council of Archaeozoology, Dur-ham, UK. August 2002. Oxbow, Oxford, UK. 208 pp.
Richards, M.P., and R.E.M. Hedges. 1999. Stable isotope evidence for similarities in the types of marine foods used by late mesolithic humans at sites along the Atlantic coast of Europe. Journal of Archaeological Science 26:717–22.
Richards, M.P., R.E.M. Hedges, T.I. Molleson, and J.C Vogel. 1998. Stable isotope analysis reveals variations in human diet at the Poundbury Camp cemetery site. Journal of Archaeological Science 25(12):1247–52.
Richards, M.P., B.T. Fuller, and T.I. Molleson. 2006. Sta-ble isotope palaeodietary study of humans and fauna from the multi-period (Iron Age, Viking, and Late Medieval) site of Newark Bay, Orkney. Journal of Archaeological Science 33(1):122–31.
Robbins, C.T., L.A. Felicetti, and S.T. Florin. 2010. The impact of protein quality on stable nitrogen isotope ratio discrimination and assimilated diet estimation. Oecologia 162:571–9.
Rutgers, L.V., M. van Strydonck, M. Boudin, and C. van der Linde. 2009. Stable isotope data from the early Christian catacombs of ancient Rome: New insights into the dietary habits of Rome’s early Christians. Journal of Archaeological Science 36(5):1127–34.
Salamon, M., A. Coppa, M. McCormick, M. Rubini, R. Vargiu, and N. Tuross. 2008. The consilience of his-torical and isotopic approaches in reconstructing the medieval Mediterranean diet. Journal of Archaeologi-cal Science 35(6):1667–1672.
Schoeninger, M.J., and M.J. DeNiro. 1984. Nitrogen and carbon isotopic composition of bone collagen from marine and terrestrial animals. Geochimica et Cosmo-chimica Acta 48:625–39.
Schoeninger, M.J., and K. Moore. 1992. Bone stable iso-tope studies in archaeology. Journal of World Prehis-tory 6:247–296.
Sponheimer, M., T. Robinson, L. Ayliffe, B. Roeder, J. Hammer, B. Passey, A. West, T. Cerling, D. Dear-ing, and J. Ehleringer. 2003. Nitrogen isotopes in mammalian herbivores: Hair delta N-15 values from a controlled feeding study. International Journal of Osteoarchaeology 13:80–87.
Takahashi, C.M., D.E. Nelson, and J.S. Southon. 2002. Radiocarbon and stable isotope analyses of archaeo-logical bone consolidated with hide glue. Radiocarbon 44:59–62.

Journal of the North Atlantic Special Volume 3118
Tieszen, L.L., and T. Fagre. 1993. Effect of diet qual-ity and composition on the isotopic composition of respiratory CO2, bone collagen, bioapatite, and soft tissues. Pp. 121–155, In J.B. Lambert and G. Grupe (Eds.). Prehistoric Human Bone: Archaeology at the Molecular Level. Springer-Verlag, New York, NY, USA. 322 pp.
Van Klinken, G.J. 1999. Bone collagen quality indica-tors for palaeodietary and radiocarbon measurements. Journal of Archaeological Science 26:687–95.
Wada, E., H. Mizutani, and M. Minagawa.1991. The use of stable isotopes for food-web analysis. Critical Reviews in Food Science and Nutrition. Taylor and Francis 30(4):361–71.
Wild, E.M., K.A. Arlamovsky, R. Golser, W. Kutschera, A. Priller, S. Puchegger, W. Rom, P. Steier, and W. Vycudilik 2000. 14C dating with the bomb peak: An application to forensic medicine. Nuclear Instruments and Methods B172:944–950.