AN INVESTIGATION OF PRIVATE MIDDLE SCHOOL STUDENTS’...
163
AN INVESTIGATION OF PRIVATE MIDDLE SCHOOL STUDENTS’ COMMON ERRORS IN THE DOMAIN OF AREA AND PERIMETER AND THE RELATIONSHIP BETWEEN THEIR GEOMETRY SELF-EFFICACY BELIEFS AND BASIC PROCEDURAL AND CONCEPTUAL KNOWLEDGE OF AREA AND PERIMETER A THESIS SUBMITTED TO THE GRADUATE SCHOOL OF SOCIAL SCIENCES OF MIDDLE EAST TECHNICAL UNIVERSITY BY NAGEHAN ORHAN IN PARTIAL FULFILLMENT OF THE REQUIREMENTS FOR THE DEGREE OF MASTER OF SCIENCE IN THE DEPARTMENT OFELEMENTARY EDUCATION JULY 2013
Transcript of AN INVESTIGATION OF PRIVATE MIDDLE SCHOOL STUDENTS’...
AN INVESTIGATION OF PRIVATE MIDDLE SCHOOL
STUDENTS’ COMMON ERRORS IN THE DOMAIN OF AREA AND
PERIMETER AND THE RELATIONSHIP BETWEEN THEIR GEOMETRY
SELF-EFFICACY BELIEFS AND BASIC PROCEDURAL AND CONCEPTUAL
KNOWLEDGE OF AREA AND PERIMETER
A THESIS SUBMITTED TO
THE GRADUATE SCHOOL OF SOCIAL SCIENCES
OF
MIDDLE EAST TECHNICAL UNIVERSITY
BY
NAGEHAN ORHAN
IN PARTIAL FULFILLMENT OF THE REQUIREMENTS
FOR
THE DEGREE OF MASTER OF SCIENCE
IN
THE DEPARTMENT OFELEMENTARY EDUCATION
JULY 2013

Approval of the Graduate School of Social Sciences
Prof. Dr. Meliha ALTUNIŞIK
Director
I certify that this thesis satisfies all the requirements as a thesis for the degree of
Master of Science.
Prof. Dr. Jale ÇAKIROĞLU
Head of Department
This is to certify that we have read this thesis and that in our opinion it is fully
adequate, in scope and quality, as a thesis for the degree of Master of Science.
Assoc. Prof. Dr. Mine IŞIKSAL BOSTAN Assist. Prof. Dr. Çiğdem HASER
Co-Supervisor Supervisor
Examining Committee Members
Assist. Prof. Dr. Elvan ŞAHİN (METU,ELE)
Assist. Prof. Dr. Çiğdem HASER(METU,ELE)
Assoc. Prof. Dr. Mine IŞIKSAL BOSTAN(METU,ELE)
Assist. Prof. Dr. Didem AKYÜZ (METU,ELE)
Assist. Prof. Dr. Gönül KURT (BAŞKENT UNIV.,ELE)

iii
I hereby declare that all information in this document has been obtained and
presented in accordance with academic rules and ethical conduct. I also declare
that, as required by these rules and conduct, I have fully cited and referenced
all material and results that are not original to this work.
Name, Last name: Nagehan ORHAN
Signature:
iv
ABSTRACT
AN INVESTIGATION OF PRIVATE MIDDLE SCHOOL
STUDENTS’ COMMON ERRORS IN THE DOMAIN OF AREA AND
PERIMETER AND THE RELATIONSHIP BETWEEN THEIR GEOMETRY
SELF-EFFICACY BELIEFS AND BASIC PROCEDURAL AND CONCEPTUAL
KNOWLEDGE OF AREA AND PERIMETER
Orhan, Nagehan
M.S., Department of Elementary Science and Mathematics Education
Supervisor: Assist. Prof. Dr. Çiğdem HASER
Co-Supervisor: Assoc. Prof. Dr. Mine IŞIKSAL BOSTAN
July 2013, 143 pages
The purposes of the present study were to investigate private middle school
students’ procedural and conceptual knowledge in the domain of area and perimeter
of geometric figures and to examine the most common errors in their knowledge.
Private middle school students’ geometry self-efficacy throughout the grade levels
was also investigated. The other specific interest of the study was to examine how
students’ conceptual and procedural knowledge aspects of area and perimeter of
geometric figures changed with respect to their geometry self-efficacy.
The study was conducted during the second semester of the academic year
2011-2012. The sample was consisted of 111 private middle school students from a
v
private elementary school in Çayyolu district in Ankara. Data were collected through
procedural and conceptual knowledge tests prepared by the researcher and geometry
self-efficacy scale developed in a previous research. In order to examine the
relationship between geometry self-efficacy beliefs of students and their procedural
and conceptual knowledge, Pearson product-moment correlation analyses were run.
One-way ANOVA was used to investigate how self-efficacy, procedural knowledge,
and conceptual knowledge changed according to grade levels separately.
The results of data analysis indicated that private middle school students had
common errors and misconceptions about area and perimeter concepts. ANOVA
results revealed that there were no statistically significant differences in private
middle school students’ procedural knowledge and self-efficacy belief scores in
terms of grade levels. However, there was a significant difference in conceptual
knowledge scores of private middle school students. Moreover, according to Pearson
Product Moments Correlation results, there was significant correlation among
students’ procedural knowledge, conceptual knowledge and self-efficacy belief
scores.
Keywords: Procedural Knowledge, Conceptual Knowledge, Self-Efficacy, Area,
Perimeter, Error
vi
ÖZ
ÖZEL ORTAOKUL ÖĞRENCİLERİNİN ALAN VE ÇEVRE KONUSUNDAKİ
TİPİK HATALARININ VE GEOMETRİYE YÖNELİK ÖZ-YETERLİK
İNANIŞLARI İLE ALAN VE ÇEVRE KONUSUNDAKİ İŞLEMSEL VE
KAVRAMSAL BİLGİLERİ ARASINDAKİ İLİŞKİNİN İNCELENMESİ
Orhan, Nagehan
Yüksek Lisans, İlköğretim Fen ve Matematik Alanları Eğitimi Bölümü
Tez Yöneticisi: Yrd. Doç. Dr. Çiğdem HASER
Ortak Tez Yöneticisi: Doç. Dr. Mine IŞIKSAL BOSTAN
Temmuz 2013, 143 sayfa
Bu çalışmanın temel amacı ortaokul 6., 7. ve 8. sınıf öğrencilerinin geometrik
şekillerin alanı ve çevresi konusundaki işlemsel ve kavramsal bilgilerinin ne düzeyde
olduğunu araştırmak ve bu bilgileri ölçen testlerdeki tipik hatalarını incelemektir.
Ayrıca, öğrencilerin geometriye yönelik öz-yeterlikleri de sınıf seviyesine göre
incelenmiştir. Bu çalışmanın diğer bir amacı da, öğrencilerin alan ve çevre
konusundaki işlemsel ve kavramsal bilgilerinin geometriye yönelik öz-yeterliklerine
göre nasıl değiştiğinin incelenmesidir.
Bu çalışma 2011-2012 öğretim yılının 2. döneminde gerçekleştirilmiştir.
Çalışmaya Ankara ilinin Çayyolu semtinde bulunan özel bir ortaokuldan 111

vii
ortaokul 6.,7. ve 8. sınıf öğrencisi katılmıştır. Veriler, alan ve çevre konusundaki
işlemsel ve kavramsal bilgileri ölçen başarı testleri ve geometriye yönelik öz-yeterlik
inanışlar testi ile toplanmıştır. Öğrencilerin geometriye yönelik öz-yeterlik inanışları
ile işlemsel ve kavramsal testlerdeki başarıları arasındaki ilişkiyi incelemek amacıyla
Pearson çarpım-moment korelasyon analizi kullanılmıştır. Öğrencilerin geometriye
yönelik öz-yeterlik inanışlarının, alan ve çevre konusundaki işlemsel ve kavramsal
bilgilerinin sınıf seviyesine göre nasıl değiştiğini incelemek amacıyla da tek yönlü
varyans analizi kullanılmıştır.
Veri analizi sonuçlarına göre, 6., 7. ve 8. sınıf öğrencilerinin alan ve çevre
konusunda bir takım hatalara ve kavram yanılgılarına sahip oldukları görülmüştür.
Öğrencilerin işlemsel bilgipuanları ve geometriye yönelik öz-yeterlikinanış
puanlarının sınıf seviyesine göre anlamlı bir şekilde değişmediği ancak kavramsal
bilgi puanlarının değiştiği bulunmuştur. Bunun yanında yapılan korelasyon analiz
sonuçları 6., 7. ve 8. sınıf öğrencilerinin geometriye yönelik öz-yeterlik inanış
puanları, işlemsel bilgileri ve kavramsal bilgileri arasında anlamlı ve pozitif yönde
bir ilişki bulunduğu görülmüştür.
Anahtar Kelimeler: İşlemsel Bilgi, Kavramsal Bilgi, Öz-Yeterlik, Alan, Çevre, Hata

viii
To My Father, Mother, Brother and Husband

ix
ACKNOWLEDGMENTS
I would like to express my deepest gratitude to my advisors Assist. Prof. Dr.
Çiğdem Haser and Assoc. Prof. Dr. Mine IŞIKSAL for their scientific guidance,
wisdom and encouragement throughout this research. Through the entire process of
the study, they showed great patience to me and welcomed all my questions. Their
insightful comments and suggestions have shaped my thesis work. Therefore I am
very grateful and thankful to them.
I sincerely thank to my committee members Assist. Prof. Dr. Didem AKYÜZ,
Assist. Prof. Dr. Elvan ŞAHİN and Assist. Prof. Dr. Gönül KURT for their
invaluable contributions for my study.
I would also like to thank to my dearest family. They always believe in me in
my undergraduate and graduate studies. My mother Birsen ORHAN, my father
Ertuğrul ORHAN and my brother Cihan ORHAN, I want to express my deepest
gratitude, love and thanks for your patience, moral support and encouragement.
I really appreciate and thank to my husband, Çağrı SÜZENER for his love,
everlasting patience and support. I extend my sincere thanks to SÜZENERs family
for their support.
Further, I sincerely thank to Rukiye AYAN who helped me very much while
finalizing this thesis and her contributions for the study. She has been a special friend
for me in my hardest and happiest. I would also like to express my thanks to my
friends Ayşe YOLCU, Rezzan DOKTOROĞLU, Bilal ÖZÇAKIR, Münevver
İLGÜN, Esra DEMİRAY and Halime SAMUR for their help and support for this
study.
Finally, I would also thank to Reyhan TEKİN SİTRAVA and Gözde Nur
ŞAHİN for their motivation, moral support and encouragement they showed to me. I
also thank to all my students, colleagues, friends, and relatives for their support.
x
TABLE OF CONTENT
PLAGIARISM ............................................................................................................ iii
ABSTRACT ................................................................................................................ iv
ÖZ ................................................................................................................................ vi
ACKNOWLEDGMENTS ........................................................................................... ix
TABLE OF CONTENT ............................................................................................... x
LIST OF TABLES .................................................................................................... xiv
LIST OF FIGURES ................................................................................................. xviii
LIST OF ABBREVIATIONS ................................................................................... xix
CHAPTER .................................................................................................................... 1
INTRODUCTION ........................................................................................................ 1
1.1. Purpose of the Study ......................................................................................... 5
1.2. Research Questions .......................................................................................... 5
1.3. Significance of the Study.................................................................................. 7
1.4. My Motivation for the Study ............................................................................ 8
1.5. Definitions of the Important Terms .................................................................. 9
LITERATURE REVIEW ........................................................................................... 11
2.1. Procedural and Conceptual Knowledge .......................................................... 11
2.1.1. Definitions of Procedural and Conceptual Knowledge ............................ 12
2.1.2. Connection between Procedural and Conceptual Knowledge .................. 13
2.2. Misconception and Error ................................................................................. 16
2.3. Errors in Area and Perimeter ........................................................................... 18
2.4. Self-Efficacy Beliefs ........................................................................................ 21
2.5. Summary of the Literature Review ................................................................ 24
METHOD ................................................................................................................... 27
3.1. Design of the Study ......................................................................................... 27
3.2. Population and Sample .................................................................................... 28
3.3. Data Collection Methods and Instruments ...................................................... 29
3.3.1. Procedural and Conceptual Knowledge Tests .......................................... 29
xi
3.3.1.1 Procedural Knowledge Test ................................................................ 29
3.3.1.2. Conceptual Knowledge Test .............................................................. 31
3.3.2. Geometry Self - Efficacy Scale ................................................................ 33
3.4. Pilot Study ....................................................................................................... 34
3.5 Data Collection Procedure ................................................................................ 35
3.6. Data Analysis .................................................................................................. 35
3.7. Validity and Reliability of the Instruments ..................................................... 36
3.8. Assumptions and Limitations .......................................................................... 38
3.9. Internal and External Validity ......................................................................... 39
3.9.1. Internal Validity ........................................................................................ 39
3.9.2. External Validity ....................................................................................... 40
RESULTS .................................................................................................................. 42
4.1. Analysis of Private middle school Students’ Procedural Knowledge about
Area and Perimeter of Geometric Shapes .............................................................. 43
4.1.1. Descriptive Statistics about Procedural Knowledge Test ......................... 43
4.1.2. The Difference in Procedural Knowledge of Private middle school
Students in terms of Grade Level ....................................................................... 44
4.1.2.1. Assumptions of one way ANOVA ..................................................... 44
4.1.2.2. Results of one - way ANOVA for Procedural Knowledge Test ........ 46
4.1.3. The Analysis of the Correct and Most Common Errors in the Procedural
Knowledge Test .................................................................................................. 46
4.1.3.1. Perimeter of the square, rectangle and parallelogram ........................ 46
4.1.3.2. Perimeter of the irregular figures ....................................................... 51
4.1.3.3. Area of the square, rectangle and parallelogram ................................ 53
4.1.3.4. Area of the polygon which is the combination of regular geometric
shapes .............................................................................................................. 65
4.1.5. Summary of the results the perimeter concept in procedural knowledge
test ....................................................................................................................... 67
4.1.6. Summary of the results about the area concept in the procedural test ...... 68
4.2. Analysis of Private middle school Students’ Conceptual Knowledge about
Area and Perimeter of Geometric Shapes .............................................................. 69
4.2.1. Descriptive Statistics about Conceptual Knowledge Test ........................ 69

xii
4.2.2. The Difference in Conceptual Knowledge of Private middle school
Students in terms of Grade Level ........................................................................ 70
4.2.2.1. Assumptions of one way ANOVA for Conceptual Knowledge Test . 70
4.2.2.2. Results of one-way ANOVA for Conceptual Knowledge Test ......... 71
4.2.3. The Analysis of the Correct, Incorrect and Empty Answers and Most
Common Errors in the Conceptual Knowledge Test .......................................... 72
4.2.3.1. Area of Irregular Geometric Shapes ................................................... 72
4.2.3.2. Surface Area ....................................................................................... 75
4.2.3.3. Area and Perimeter ............................................................................. 78
4.3. Summary of the results about conceptual knowledge test ............................... 92
4.4. Analysis of Private middle school Students’ Self-Efficacy towards Geometry
Test Scores .............................................................................................................. 93
4.4.1. Descriptive Statistics about Self Efficacy towards Geometry Test .......... 93
4.4.2. The Difference in Geometry Self-Efficacy of Private middle school
Students in terms of Grade Level ........................................................................ 94
4.4.2.1. Assumptions of one way ANOVA ..................................................... 94
4.4.2.2. Results of one-way ANOVA for Self-Efficacy toward Geometry Test
......................................................................................................................... 96
4.5. Correlation among Geometry Self-Efficacy, Procedural Knowledge and
Conceptual Knowledge ........................................................................................... 96
4.5.1. Assumptions of Pearson-Product Moment Correlation ............................ 96
4.5.2. Correlation between Geometry Self-Efficacy and Procedural Knowledge
........................................................................................................................... 101
4.5.3. Correlation between Geometry Self-Efficacy and Conceptual Knowledge
........................................................................................................................... 101
4.5.4. Correlation between Procedural Knowledge and Conceptual Knowledge ...
101
4.5.5. Summary of the Inferential Statistics ...................................................... 102
DISCUSSION .......................................................................................................... 103
5.1. Students’ Procedural Knowledge about Area and Perimeter of Geometric
Shapes ................................................................................................................... 103
5.2. Students’ Conceptual Knowledge about Area and Perimeter of Geometric
Shapes ................................................................................................................... 107
5.3. Students’ Self-Efficacy towards Geometry ................................................... 111
xiii
5.4 Implications and Recommendations for Further Research ............................ 112
5.5. Last words ..................................................................................................... 115
REFERENCES ......................................................................................................... 116
APPENDICES ......................................................................................................... 125
APPENDIX A .......................................................................................................... 125
APPENDIX B .......................................................................................................... 128
APPENDIX C .......................................................................................................... 134
APPENDIX D .......................................................................................................... 136
APPENDIX E .......................................................................................................... 138
APPENDIX F ........................................................................................................... 139
APPENDIX G .......................................................................................................... 142
APPENDIX H .......................................................................................................... 143

xiv
LIST OF TABLES
TABLES
Table 3. 1: Numbers of students in terms of grade level ............................................ 28
Table 3 2: Questions for area and perimeter concepts and content domains in the
Procedural Knowledge Test (PKT) ............................................................................ 30
Table 3. 3: Table of specifications for Procedural Knowledge Test(PKT) based on
objectives .................................................................................................................... 30
Table 3. 5: Table of specifications for Conceptual Knowledge Test (CKT) based
on objectives ............................................................................................................... 32
Table 3. 4: Questions for area and perimeter concepts and content domains in the
Conceptual Knowledge Test (CKT) ........................................................................... 31
Table 3. 6: Sample items of GSE Scale sub-dimensions ........................................... 33
Table 3 7: The research questions and data gathering instruments ............................ 34
Table 3. 8: Cronbach alpha values ............................................................................. 38
Table 4. 1: Descriptive statistics of private middle school students’ scores of
Procedural Knowledge Test(PKT) ............................................................................. 43
Table 4. 2: Skewness and kurtosis values of Procedural Knowledge Test(PKT)
scores for each grade level ......................................................................................... 45
Table 4. 3: The frequency of correct answers, empty answers and incorrect answers
in the part related to perimeter in the 1st
question with respect to grade levels .......... 47
Table 4. 4: The frequency of correct answers, empty answers and incorrect
answers in the 7th
question with respect to grade levels .............................................. 49
Table 4. 5: The frequency of the most common incorrect answer for the 7th
question in the Procedural Knowledge Test(PKT) .................................................... 50
Table 4. 6: The frequency of correct answers, empty answers and incorrect answers
in the part related to perimeter of the rectangle in the 9th
question with respect to
grade levels ................................................................................................................. 51
Table 4. 7: The frequency of correct answers, empty answers and incorrect
nswers in the 5th
question with respect to grade levels .............................................. 52

xv
Table 4. 8: The frequency of the most common incorrect answer for the 5th
question in the Procedural Knowledge Test(PKT) .................................................... 53
Table 4. 9: The frequency of correct answers, empty answers and incorrect
answers in the part related to area in the 1st question with respect to grade levels .... 54
Table 4. 10: The frequency of the most common incorrect answer for the
1st question in the Procedural Knowledge Test(PKT)................................................ 55
Table 4. 11: The frequency of correct answers, empty answers and incorrect
answers in the 6th
question in the Procedural Knowledge Test (PKT)with respect
to grade levels ........................................................................................................... 56
Table 4. 12: The frequency of correct answers and incorrect answers in the 6th
question for squares and rectangles separately in the Procedural Knowledge
Test(PKT) with respect to grade levels ...................................................................... 57
Table 4. 13: The frequency of correct answers, empty answers and incorrect
answers in the 8th
question with respect to grade levels ............................................. 58
Table 4. 14: The frequency of correct answers, empty answers and incorrect
answers in the part related to area of the rectangle in the 9th
question with
respect to grade levels ................................................................................................ 59
Table 4. 15: The frequency of correct answers, empty answers and incorrect
answers in the 10th
question with respect to grade levels .......................................... 61
Table 4. 16: The frequency of correct answers, empty answers and incorrect
answers in the 3rd
question with respect to grade levels ............................................ 62
Table 4. 17: The frequency of the most common error in the 3rd
question in the
Procedural Knowledge Test (PKT)with respect to the grade levels .......................... 63
Table 4. 18: The frequency of correct answers, empty answers and incorrect
answers in the 2nd
question with respect to grade levels ............................................. 64
Table 4. 19: The frequency of the most common incorrect answer for the
2nd
question in the Procedural Knowledge Test(PKT) ............................................... 65
Table 4. 20: The frequency of correct answers, empty answers and incorrect
answers in the 4th
question with respect to grade levels ............................................ 66
Table 4. 21: Descriptive statistics of private middle school grade students’
scores of Conceptual Knowledge Test(CKT) ............................................................ 69

xvi
Table 4. 23: Multiple comparison for post- hoc results for Conceptual Knowledge
Test (CKT) ................................................................................................................. 71
Table 4. 22: Skewness and kurtosis values of Conceptual Knowledge Test (CKT)
scores for each grade level ......................................................................................... 71
Table 4. 24: The frequency of students’ answers for the 1st question in the
Conceptual Knowledge Test (CKT) with respect to the different grade levels ......... 73
Table 4. 25: The frequency of the most common incorrect answer for the 9th
question in the Conceptual Knowledge Test (CKT) .................................................. 74
Table 4. 26: The frequency of students’ answers for the 9th
question in the
Conceptual Knowledge Test (CKT) with respect to the different grade levels ......... 74
Table 4. 27: The frequency of students’ answers for the 2nd
question in the
Conceptual Knowledge Test (CKT) with respect to the different grade levels ......... 76
Table 4. 28: The frequency of the most common incorrect answer for the
nd question in the Conceptual Knowledge Test (CKT) .............................................. 77
Table 4. 29: The frequency of students’ answers for the 3rd
question in the
Conceptual Knowledge Test (CKT) with respect to the different grade levels ......... 78
Table 4. 30: The frequency of students’ answers for the 4th
question in the
Conceptual Knowledge Test (CKT) with respect to the different grade levels ......... 80
Table 4. 31: The frequency of the most common incorrect answer for the
perimeter part of the 4th
question in the Conceptual Knowledge Test (CKT) ............ 82
Table 4. 32: The frequency of students’ answers for the 6th
question in the
Conceptual Knowledge Test (CKT) with respect to the different grade levels ......... 83
Table 4. 33: The frequency of students’ answers for the 5th
question in the
Conceptual Knowledge Test (CKT) with respect to the different grade levels ......... 85
Table 4. 34: The frequency of students’ answers for the 7th
question in the
Conceptual Knowledge Test (CKT) ........................................................................... 87
Table 4. 35: The frequency of the most common incorrect answer for the
7th
question in the Conceptual Knowledge Test (CKT) ............................................. 88
Table 4. 36: The frequency of students’ answers for the 8th
question in the
Conceptual Knowledge Test (CKT) with respect to the different grade levels ......... 89
Table 4. 37: The frequency of students’ answers for the 10th
question in the
Conceptual Knowledge Test (CKT) with respect to the different grade levels ......... 91

xvii
Table 4. 38: The frequency of the most common incorrect explanation for
choice A in the 10th
question in the Conceptual Knowledge Test (CKT) .................. 91
Table 4. 39: Descriptive statistics of private middle school students’ scores of
self efficacy towards geometry (out of 125) .............................................................. 93
Table 4. 40: Skewness and kurtosis values of self-efficacy towards geometry test
scores for each grade level ......................................................................................... 95
Table 4 41: Skewness and kurtosis values of PKT, CKT and STG test scores ......... 97
xviii
LIST OF FIGURES
FIGURES
Figure 4. 1: The PKT Scores of 6th
, 7th
and 8th
Grade Students ................................. 46
Figure 4. 2: The First Question in the Procedural Test .............................................. 47
Figure 4. 3: The Seventh Question in the PKT .......................................................... 48
Figure 4. 4: The Ninth Question in the PKT .............................................................. 50
Figure 4. 5: The Fifth Question in the PKT ............................................................... 52
Figure 4. 6: The First Question in the PKT (Area Part) ............................................. 54
Figure 4. 7: The Sixth Question in the PKT ............................................................... 56
Figure 4. 8: The Eighth Question in PKT .................................................................. 58
Figure 4. 9: The Ninth Question in the PKT (Area Part) ........................................... 59
Figure 4. 10: The Tenth Question in the PKT ............................................................ 60
Figure 4. 11: The Third Question in the PKT ............................................................ 62
Figure 4. 12: The Second Question in the PKT ......................................................... 64
Figure 4. 13: The Fourth Question in PKT ................................................................ 66
Figure 4. 14: The CKT scores of 6th,
7th
and 8th
grade students ................................. 72
Figure 4. 15: The First and Ninth Questions in the CKT ........................................... 73
Figure 4. 16: The Second Question in the CKT ......................................................... 75
Figure 4. 17: The Third Question in the CKT ............................................................ 77
Figure 4. 18: The Fourth Question in the CKT .......................................................... 79
Figure 4. 19: The Sixth Question in the CKT ............................................................ 82
Figure 4. 20: The Fifth Question in the CKT ............................................................. 84
Figure 4. 21: The Seventh Question in the CKT ........................................................ 86
Figure 4. 22: The Eighth Question in the CKT .......................................................... 88
Figure 4. 23: The Tenth Question in the c CKT ......................................................... 90
Figure 4. 24: STG Test Scores for the 6th
, 7th
and 8th
Grade Students ....................... 96
Figure 4. 25: Scatter plot of PKT Mean Scores and STG Test Mean Scores ............ 98
Figure 4. 26: Scatter plot of CKT Mean Scores and STG Test Mean Scores ............ 99
Figure 4. 27: Scatter plot of PKT Mean Scores and CKT Mean Scores .................. 100

xix
LIST OF ABBREVIATIONS
ANOVA: Analysis of Variance
CKT: Conceptual Knowledge Test
GSE: Geometry Self-efficacy
M: Mean
MAX: Maximum
MIN: Minimum
MoNE: Ministry of National Education
N: Number of participants
NAEP:The National Assessment of Educational Progress
NCTM: National Council of Teachers of Mathematics
PASW: Predictive Analytics SoftWare
PISA:Programme for International Student Assessment
PKT: Procedural Knowledge Test
SD: Standard Deviation
STG: Self-efficacy Towards Geometry
TIMMS: Trends in International Mathematics and Science Study


1
CHAPTER 1
INTRODUCTION
Mathematics is important in the education of children since it forms a base for
science and technology (MoNE, 2005) and a tool which gives opportunity and
options for people’s futures (NCTM,2000). It is important to learn mathematics with
understanding (Hiebert & Carpenter, 1992).Understanding mathematics is not only
gaining some basic skills or concepts, but also building relationships between them.
This is a highly complex process which is possible when proper ideas exist and new
connections are formed (Lehrer, 1999 as cited in Van De Walle, 2007). Therefore,
when a new mathematical knowledge is understood, this knowledge provides a base
for the new learning and can be implemented in different areas. In this respect,
knowledge types are important in mathematics education.
Hiebert (1986) referred knowledge types in mathematics as conceptual and
procedural knowledge. Hiebert and Lefevre (1986) described conceptual knowledge
as “rich relationships and web of ideas”, whereas procedural knowledge was
described as “rules and step-by-step procedures used in doing mathematical tasks and
symbolism used to represent mathematics” (p.3). Hiebert and Lefevre (1986) argued
that these two types of knowledge cannot be totally separated from each other.
Linking procedural and conceptual knowledge has been the main goal of mathematics
education. As a result of this, several studies were conducted about types of
knowledge.
Studies have addressed conceptual and procedural knowledge in different
aspects such as the relationship between them, the interaction between them, their
development, and their importance (Hapaasalo & Kadijevich, 2000; Rittle-Johnson &
Siegler, 1998; Siegler, 1991; Siegler & Crowley, 1994; Star, 2005). Researchers have
claimed that procedural and conceptual knowledge, which are important elements in
2
mathematical understanding, are positively correlated (Hiebert & Lefevre, 1986;
Rittle-Johnson & Siegler, 1998). The knowledge of the mathematical concepts
depends on the context and topics and the development of the knowledge types and
the interaction between them (Johnson & Siegler, 1998). Therefore, it is more
meaningful to investigate the development of knowledge types on basis of topics.
Considering the mathematical strands, “geometry” and “measurement” have
an important place in mathematics curriculum (Tan, 2010). Geometric figures are
mostly seen in peoples’ life, in everywhere as separate or combined figures (Özsoy,
2003). Geometry is important in mathematics education because geometric objects
are in real life and geometry is used in science and technology, in mathematical
modeling, and problem solving (Aksu, 2006). Similarly, measurement is significant
because of its well-known importance in quantifying the word (Hart, 1984), in
science, and in everyday experience (Lehrer, 2003).
Besides its considerable involvement in the daily life, measurement supports
learning opportunities for students in domains such as, operations, functions,
statistics, fractions, and geometry (NCTM, 2000). Therefore it is seen as a bridge
across mathematical strands (Clements & Battista, 2001). Most specifically, it
connects two main areas of mathematics: geometry and numbers (Clements, 1999;
Kilpatrick, et al., 2001).
Considering the relationship between measurement and geometry, Van De
Walle (2012) claims that measurement is important for the development and
understanding of perimeter, area, and volume formulas since they require an
understanding of the shapes and relationships. The prosperities of geometric shapes
and the relationships between them can be examined in two dimensions: (i) together
with measure, called as “measurable geometry”; and (ii) without a measure, called as
“non-measurable geometry” (Kültür & Kaplan, 2002). Since measure is used in the
concepts of perimeter, area, and volume, these are accepted in the dimension of
measurable geometry (Dağlı, 2010).For example; the proof of the area of the triangle
is a non-measurable geometric activity although the application of this formula is a
measurable geometric activity (Altun, 2008). Since measurement and geometry
3
involve several concepts, it is probable that students might have misunderstandings
in these topics as shown in many studies.
In mathematics education, several terms have been used to express students’
problems in mathematics learning. For example, “difficulty” was the most
comprehensive one and it addressed the general problems in learning (Bingölbali &
Özmantar, 2009). However, this term seems to be most general to understand
students’ learning problems. Therefore, the terms “error” and “misconception” was
used to express students’ difficulties in more detail.
According to Luneta and Makonye (2010), an error is a mistake or inaccuracy
and a deviation from accuracy. There are unsystematic errors which are unintended
and producing non-recurring incorrect answers (e.g. while calculating the perimeter
of a square whose one side is 6 cm, finding the answer as 25)and there are systematic
errors which produce current incorrect answers (Riccomini, 2005).It was pointed out
that misconceptions are students’ conceptions that produce systematic errors (Smith,
diSessa & Roschelle, 1993). Misconception (e.g. the thought that when the two
figures are combined, the perimeter of the combined figure is equal to the sum of the
perimeters of figures separately) means “the perception of concepts by students in a
different way than their scientifically accepted definitions” (Keşan & Kaya, 2007, p.
27). In this respect, error and misconception are related, but they are different. Errors
can be seen from learners’ products; however misconceptions can be hidden even in
correct answers. Therefore error could be regarded as the conclusion of the
misconception (Keşan & Kaya, 2007). According to Eryılmaz and Sürmeli (2002) all
misconceptions could be accepted as errors; however not all errors could be accepted
as misconceptions.
Students have common misconceptions and errors in certain mathematics
topics and area and perimeter is one of them. Comparison and assessment studies
such as TIMMS and NAEP showed that students performed poorer in understanding
of area and perimeter concepts than in any other topic in the curriculum (Thamson &
Preston, 2004). In the literature most studies investigated that area and perimeter of
geometric figures are the most problematic topics in which students have more
4
difficulties and problems than any other topic(Chappell & Thompson, 1999;
Woodward & Byrd, 1983).Specifically, students seemed to have difficulty in
understanding and relating measurement to geometry concepts and utilizing them in
solving non-routine problems since they memorized rules and the formulas for the
area and perimeter of the geometric shapes (Dağlı, 2010; Kennedy & Lindquist,
2000).Middle school students, regardless of grade level, have been reported to have
lack of conceptual and procedural knowledge about area and perimeter concepts
(Kidman & Cooper, 1997). Seventh grade students have confused the perimeter and
area concepts and have thought that there was a linear relationship between them
(Moreira& Contente, 1997). Similarly, middle school students in Turkey have been
deduced to have errors and misconceptions especially in perimeter and area concepts
and their formulas (Emekli, 2001; Tan Şişman & Aksu, 2009).
It is important to support procedural knowledge with conceptual knowledge
for a deeper understanding of mathematics (Aksu, 1994; Noss & Baki, 1996). There
are several concepts in the study of measurement in geometric shapes (e.g. perimeter,
surface area). Therefore, it is significant to gain both procedural and conceptual
knowledge in the scope of measurement and geometry. Considering the previous
findings, one of the aims of this study is to investigate students’ procedural and
conceptual knowledge in the domain of area and perimeter in order to have a better
picture of their understanding of these concepts.
The other concern of this study is students’ self-efficacy. Self-efficacy is
defined as, “people’s judgments of their capabilities to organize and execute courses
of action required to attain designated types of performances” (Bandura, 1986, p.
391). In the literature, there are several studies concerning the relationship between
self-efficacy and mathematical knowledge, self-efficacy and mathematics self-
efficacy or geometry self-efficacy. In some studies, it is suggested that self-efficacy
is primarily a domain-specific (which means performing specific tasks, e.g. a
geometry task) construct (Pajares, 1996). As a result of this, Schunk (2008) reported
that “it is important to mention about self-efficacy for concluding from solving
fractions, equations, geometry problems and so on” (p. 106). Therefore, in the
present study, self-efficacy will be investigated in terms of geometry with a specific

5
task in the domain of area and perimeter. There is no study in the accessible literature
investigating the relationship between self-efficacy and mathematical knowledge or
geometry knowledge in terms of conceptual knowledge and procedural knowledge.
As stated previously, since mathematical knowledge consists of both procedural and
conceptual understanding and since self-efficacy and mathematical knowledge is
mostly related, it is important to examine students’ procedural and conceptual
knowledge in relation to their self-efficacy.
1.1.Purpose of the Study
The main purpose of this study was to investigate the relationship between
private middle school students’ geometry self-efficacy and their basic procedural and
conceptual knowledge in the domain of area and perimeter. Moreover, their common
errors in area and perimeter tasks were also investigated. One specific interest of this
study was to examine how students’ performance in conceptual and procedural
aspects of area and perimeter changes with respect to their geometry self-efficacy.
1.2.Research Questions
1. What is private middle school students’ (6th
, 7th
and 8th
grade) performance on
the conceptual and procedural knowledge tests about area and perimeter?
2. How does private middle school students’ (6th
, 7th
and 8th
grades) basic
procedural and conceptual knowledge in the domain of area and perimeter
change through the grade levels?
3. What are the most common errors of private middle school students (6th
, 7th
and
8th
grades) in the domain of area and perimeter?
3.1.What are the most common errors of private middle school students (6th
, 7th
and 8th
grades) about area and perimeter in procedural knowledge test?
3.1.1. What are the most common errors of private middle school (6th
, 7th
and 8th
grades) about perimeter of the square, rectangle and
parallelogram?
3.1.2. What are the most common errors of private middle school (6th
, 7th
and 8th
grades) about perimeter of the irregular figures?
6
3.1.3. What are the most common errors of private middle school students
(6th
, 7th
and 8th
grades) about area of square, rectangle and
parallelogram?
3.1.4. What are the most common errors of private middle school students
(6th
, 7th
and 8th
grades) about area of the polygon which is the
combination of regular geometric shapes?
3.2.What are the most common errors of private middle school students (6th
, 7th
and 8th
grades) about area and perimeter in conceptual knowledge test?
3.2.1. What are the most common errors of private middle school students
(6th
, 7th
and 8th
grades) about area of irregular geometric shapes?
3.2.2. What are the most common errors of private middle school students
(6th
, 7th
and 8th
grades) about surface area?
3.2.3. What are the most common errors of private middle school students
(6th
, 7th
and 8th
grades) about area and perimeter of geometric shapes?
4. What is the geometry self-efficacy belief level of private middle school students?
5. How do private middle school students’ (6th
, 7th
and 8th
grades) geometry self-
efficacy belief levels change through the grade level?
6. Is there a significant relationship between private middle school students’ (6th
, 7th
and 8th
grades) geometry self-efficacy beliefs, and their basic procedural and
conceptual knowledge in the domain of area and perimeter?
6.1. Is there a significant relationship between private middle school (6th
, 7th
and
8th
grades) students’ geometry self-efficacy and their basic procedural knowledge in
the domain of area and perimeter?
6.2. Is there a significant relationship between private middle school (6th
, 7th
and
8th
grades) students’ geometry self-efficacy and their basic conceptual knowledge in
the domain of area and perimeter?
6.3. Is there a significant relationship between private middle school (6th
, 7th
and
8th
grades) students’ basic procedural knowledge and basic conceptual knowledge in
the domain of area and perimeter?

7
1.3.Significance of the Study
It is important in mathematics education that students build relationships
between the mathematical concepts and related arithmetic skills (MoNE, 2013).
From this respect, there have been several studies conducted in terms of conceptual
and procedural knowledge in different subject domains. However, not many studies
examined the nature of conceptual and procedural knowledge on the same concept in
different grade levels and its change through the grade levels in private middle
school schools in Turkey. Therefore, this is the one of the main significance for the
present study.
Geometry and measurement are one of the important learning areas in the
elementary mathematics curriculum (Dağlı, 2010; Tan, 2010). It is important to pay
more attention to geometry and measurement in schools (NCTM, 2000 as cited in
Smith, Silver & Stein, 2005). Although there are several studies about geometry and
measurement concepts such as perimeter, area, volume, angle, time in the
literature(i.e. Tan, 2010), it is important to examine the extent to which students’
procedural and conceptual knowledge are changed in the domain of area and
perimeter as in the present study. Several studies have been conducted on students’
understanding of area and perimeter; however, not many studies have examined
students’ basic conceptual and procedural knowledge in elementary grades at once.
Therefore, the present study addresses these as main concerns.
Students’ self-efficacy beliefs have been investigated in various academic
areas, including mathematics (Hacket, 1985; Hackett & Betz, 1989; Pajares& Miller,
1994, 1995). Relationships between mathematics self-efficacy beliefs and
mathematics performance, geometry performance, and attitudes toward mathematics,
have been studied by several researchers. However, as in the present study, there has
not been a specific study examining the relationship between self-efficacy and
conceptual and procedural knowledge in the domain of area and perimeter separately
in the accessible literature. Specifically, the extent of students’ performance in
conceptual and procedural aspects of area and perimeter concepts in relation to their
self-efficacy beliefs has not been investigated much. Therefore, this is the one of the

8
main concern of the present study. From this respect, carrying out the present study
might be beneficial for teachers in order to design conceptually or procedurally
oriented lessons in terms of different subject matters and according to their students’
self-efficacy beliefs.
In the light of the mentioned gaps in the mathematics education research
literature, investigation of private middle school students’ main conceptual and
procedural knowledge in area and perimeter concepts and the relationship between
geometry self-efficacy beliefs and conceptual and procedural knowledge is likely to
provide an initial attempt in understanding the nature of this aspect of mathematics
education.
1.4.My Motivation for the Study
I have been working as a private middle school mathematics teacher in a
private school in Ankara. Although this is my third year as a mathematics teacher, I
had a chance to see students in all grade levels from 4th
grade to 8th
grade. While I
was teaching the concept “area and perimeter” in different grade levels, I realized
that most students had difficulty in these concepts in line with the literature. They
had problem with formulas. I have realized that they had memorized all formulas
related to area and perimeter of geometric figures without constructing any meaning.
Although they were aware that they knew only formulas but not meaning of the area
and perimeter, they ignored this fact. Therefore, I wanted to examine how the
knowledge of these common concepts changes in private middle school students as
they progress through the grades. I think this study will help me and other teachers in
designing lessons more carefully for each grade level based on the knowledge that
should be strengthened. In my opinion it might also provide several viewpoints for
curriculum developers.
Moreover, I have realized that students feel themselves good at mathematics
if they know all the formulas about the concepts. For example, one of my students
told me that she did not believe that she was good at mathematics although she got
high points from mathematics examinations. When I asked her the reason, she said

9
that when she knew the formulas and the other things that could be memorized; she
got high points from the mathematics examinations. She thought that her
mathematics was not good if she could not make connections between concepts. At
that time I thought that a study which examined how students’ performance in
conceptual and procedural aspects of area and perimeter changed with respect to
their geometry self-efficacy could help teachers to observe students more carefully
and design more thorough lessons. In my opinion, understanding students’
performance in conceptual and procedural aspects of area and perimeter with respect
to their geometry self-efficacy may help in organizing well-communicated lessons
and meaningful experiences for students.
1.5.Definitions of the Important Terms
The constitutive and operational definitions of the important terms in research
questions are given below.
Procedural knowledge was defined by Hiebert and Lefevre (1986) as “the
knowledge which contains rules and step-by-step procedures used in doing
mathematical tasks and symbolism used to represent mathematics” (p. 25). In this
study, the term procedural knowledge was used as the knowledge type that helped in
applying the formulas to calculate area and perimeter of given figures successfully.
Conceptual knowledge was defined by Hiebert and Lefevre (1986) as “the
knowledge which contains rich relationships and web of ideas” (p. 25). In this study,
the term conceptual knowledge was used as building relationships between area and
perimeter of given figures and stating ideas related to the meaning of area and
perimeter.
Basic conceptual and procedural knowledge was defined specific to the study
as the procedural and conceptual knowledge in area and perimeter of regular and
irregular shapes, rectangular, square, triangle, and parallelogram. This knowledge
was measured by the Procedural Knowledge Test (PKT) and Conceptual Knowledge
Test (CKT) developed by the researcher based on the literature and previously
designed instruments.
10
Self-efficacy was defined by Bandura (1986) as, “People’s judgments of their
capabilities to organize and execute courses of action required to attain designated
types of performances” (p. 391). In this study, geometry self-efficacy has been the
focus and it was defined as students’ evaluations of their capabilities to organize and
perform certain actions required to manage specific geometric tasks or problems
successfully(Dursun,2010).In this study, geometry self-efficacy scores of participants
were measured by Geometry Self-Efficacy (GSE) Scale which was developed by
Cantürk-Günhan and Başer (2007).
Private middle school students were the students who were in 6th
, 7th
and
8th
grades in a private school.
Area was defined as “the two dimensional space inside a region” (Van De
Walle, 2007, p. 383).
Perimeter was defined as the “the distance around a region” (Van De Walle,
2012, p. 380).
Error was defined as “a mistake or inaccuracy and a deviation from
accuracy” (Luneta & Makonye, 2010).In this study the term error was used as the
incorrect answers made as a result of having the lack of knowledge or probable
misconceptions.

11
CHAPTER 2
LITERATURE REVIEW
The purpose of the present study was to investigate private middle school
students’ procedural and conceptual knowledge in the domain of area and perimeter
and to examine most common errors in their knowledge. The other specific interest
of the study was to examine how students’ conceptual and procedural knowledge
aspects of area and perimeter changes with respect to their geometry self-efficacy.
Moreover, private middle school students’ procedural knowledge, conceptual
knowledge and geometry self-efficacy throughout the grade levels was also
investigated.
In the following part, the literature review of the present study is presented.
Based on the content and main objectives of the study, this chapter is classified into
four sections: related studies on definitions about procedural and conceptual
knowledge and relationships between them, area and perimeter and most common
errors in these concepts, self- efficacy toward geometry, and a summary of the
literature review.
2.1. Procedural and Conceptual Knowledge
Procedural and conceptual knowledge of mathematics has been debated
through the years among mathematics researchers (Hiebert, 1986). Several learning
theories have shown the importance of understanding the role of knowledge in
learning process (Rittle-Johnson, 1999). Schneider and Stern (2006) state that there
are two types of knowledge which shape understanding. The first one is knowledge
of concepts; the second one is knowledge of procedures in a domain. Linking and
developing knowledge of procedures and concepts are required for gaining
mathematical competence (Bisanz & Lefevre, 1992). Hiebert and Carpenter (1992, as
12
cited in Tan, 2010) explain the importance of connection and relationship between
kinds of knowledge as:
A mathematical idea or procedure or fact is understood if it is part of an
internal network…The degree of understanding is determined by the number
and the strength of the connections. A mathematical idea, procedure, or a fact
is understood thoroughly if it is linked to existing networks with stronger or
more numerous connections (p.67).
Similarly, Van De Walle (2007) addresses that conceptual and procedural knowledge
should be taught in relation to each other since when one is missing, the rest would
result in errors and lack of enjoyment for students.
2.1.1. Definitions of Procedural and Conceptual Knowledge
As stated in the previous chapter, knowledge types have become one of the
important issues in learning process over the years and different terminologies have
been used by several researchers. For example Resnick (1982) mentioned about
“semantics” and “synax”.Shulman (1986) named the knowledge as “knowing that”
and “knowing why”, whereas Anderson (1983) addressed “knowing that” as
“declarative knowledge” and “knowing why” as “procedural knowledge”. Piaget
(1978) labeled the knowledge as “conceptual understanding” and “successful
action”. Gelman and Meck (1983) called knowledge as “conceptual competence
(knowledge of principles)” and “procedural competence (procedure
performance)”.Finally, as used in the present study, Hiebert and Lefevre (1986)
categorized as “conceptual knowledge” and “procedural knowledge”.
Hiebert and Lefevre (1986) defined the conceptual knowledge as connected
web of ideas which addressed relationships and connections between ideas.
According to Hiebert and Lefevre (1986) the quality of the conceptual understanding
depends on the creations of new connections and relationships of these connections
with existing ideas. As a support to this idea, Broody et al. (2007) stated that when a
new idea was assimilated into existing schemas, development of conceptual
knowledge was enhanced. Moreover, Kilpatrick et al., (2001, as cited in Tan, 2010)
13
argued that a conceptual mathematical understanding required knowing the
importance of a mathematical idea, applying the idea in different contexts and
making an organization between the existing and new ideas. Furthermore, Schneider
and Stern (2004, p.2) addressed conceptual knowledge as “the knowledge of the core
concepts and principles and their interrelations in a certain domain.” They see
conceptual knowledge as the knowledge which can be generalized for several types
of problems in a domain.
Procedural knowledge, on the other hand, was defined as the knowledge of
rules and step-by-step procedures used in performing mathematical tasks and the
symbols used to represent mathematics by Hiebert and Levefre (1986). They
categorized procedural knowledge in two parts. First one is the familiarity with the
symbolic representations of mathematics or being aware of the mathematical
symbols and the rules, whereas second one is the use of algorithms and rules.
Furthermore, in contrast to Schneider and Stern’s (2004) perception of conceptual
knowledge mentioned above, they held procedural knowledge as “the knowledge of
operators and the conditions under which these can be used to reach certain goals”
(p.2). As a result of this, procedural knowledge is seen as tied to specific problem
types. Although procedural and conceptual knowledge is defined separately, their
importance for each other was discussed in most studies.
2.1.2. Connection between Procedural and Conceptual Knowledge
Star (2000) asserts that since the conceptual knowledge required a more
meaningful and deep thinking process, it is accepted as more important in the field of
mathematics education. On the other hand, Van de Walle (2007) stated the
importance of procedures as “Computational procedures offer opportunity to see how
understanding differs from one child to another” (p. 25). However, Star (2002, as
cited in Tan, 2010) concluded that conceptual knowledge would not only address
what was known but also the ways that concepts would be known. Similarly,
procedural knowledge indicated not only what was known about procedures, but also
the ways those procedures could be known (superficially, without rich connections).
Moreover Baroody, et al., (2007) asserted that procedural knowledge could not be

14
separated from conceptual knowledge. Although Baroody, et al. and Star (2000) have
a common opinion on the characterization of knowledge types, they contradicted
with the definition of procedural knowledge. Baroody, et al. claimed that conceptual
knowledge is necessary for the procedural knowledge whereas Star (2007) claimed
that procedural understanding would not require conceptual knowledge.
Procedural knowledge of a principle together with its conceptual base enables
students to transfer their knowledge in similar problems (Hiebert & Lefevre, 1986).
To put it differently, integration of the conceptual and procedural knowledge results
in better usage of procedures (Carpenter, 1986). If procedures are given with the
conceptual base, students are able to give meaning to formulas and symbols, as a
result they gain deep understanding about what they are doing (Hiebert & Lefevre,
1986). Furthermore, Kilpatrick, et al. (2001) stated that when students learn
procedures without understanding, they are likely to have difficulty in understanding
the reasons behind the procedures. Similarly, if students do not have sufficient
procedural fluency, they may experience problems in understanding and solving
problems.
Some studies have addressed that procedural skills may develop before
conceptual understanding of the subjects (Briars & Siegler, 1987; Fuson, 1988;
Wynn, 1990). Opposite to these studies, there are researches advocated that
conceptual understanding of the subject is likely to develop before the procedural
understanding of the subject (Byrnes & Wassik, 1991; Gelman & Meck, 1992;
Greeno & Heller, 1983; Wynn, 1998). Regardless of which one is developed the first,
researchers generally agree that connections between procedures and their conceptual
bases increase understanding of mathematics (Hiebert & Lefevre, 1986; Silver 1986;
Star, 2005). In the study conducted by Alibali and Rittle-Johnson (1999) procedural
and conceptual knowledge of 4th
and 5th
graders’ in the domain of equivalence were
compared. As a result, it was seen that both kinds of knowledge developed iteratively
and procedural knowledge has an effect on the development of conceptual
knowledge and vice versa.

15
The relationship between conceptual and procedural skills has also been a
concern of the field of mathematics education (Resnick & Ford, 1981, as cited in
Hattikudur, 2011). Although most mathematics education researchers have common
opinions on the idea that both conceptual and procedural knowledge is important in
doing and learning mathematics (Hiebert & Lefevre, 1992; Hiebert & Carpenter,
1992; 1986; Star, 2000; Van De Walle, 2007), what would be the most beneficial
among them for mathematics competency andin which order they are developed have
been discussed among mathematics educator (Hiebert & Carpenter, 1992; Rittle-
Johnson & Siegler, 1998; Star, 2000).
The relationship between students’ conceptual and procedural knowledge is
also investigated in terms of different variables such as the students’ confidence
level, cognitive styles, and influences of instruction (Engelbrecht et al., 2005;
Jitendra, et al., 2002). In addition to this, Star (2000) claims that especially the topics
of fractions, decimals, counting, addition, and multiplications have been the focus on
the studies related to conceptual and procedural knowledge. For example, Bekdemir
and Işık (2007) investigated the relationship between procedural and conceptual
knowledge of 8th
grade students in the domain of algebra and compared their
knowledge in this area. Moreover, they examined most common errors and
misconceptions. Although students had higher performance in procedural test than in
the conceptual test, their performance in both of the tests was low in general.
Furthermore, it was examined that students could solve the questions required
procedural knowledge; however, they generated several errors in the procedures. In
addition to this, they could not relate and interpret the questions which required
conceptual knowledge.
Similarly, Akkuş et al. (2009) investigated the procedural and conceptual
knowledge of 7th
grade students in ratio and proportion. According to the purposive
interviews conducted by students, students’ lacked conceptual knowledge while
solving the questions which required procedural knowledge without reasoning.
Since one of the purposes of this study is to investigate the private middle
school students’ procedural and conceptual knowledge in the domain of area and

16
perimeter and most common errors in this domain, the studies related to area and
perimeter concept are given below.
2.2. Misconception and Error
Mathematics concepts are important since they build a base for procedural
and conceptual knowledge. Kaptan (1999) defined concept as the common name that
was given to the groups in which properties, ideas, and events are grouped. In terms
of concepts in mathematics, according to Sfard (1991), concept was defined as the
theoretical construct of a mathematics idea (as cited in Li, 2006). Senemoğlu(1997)
stated that concepts are the mental tools which make comprehensive information
usable. Moreover it was specified that concepts are the core of the knowledge and
people organize and classify what they have learned in a logical sequence.
Nevertheless, if students formed concepts in non-scientific and undesired ways,
misconceptions appear (Demirel, 2003).
Bingölbali and Özmantar (2009) stated that the difficulties and
misconceptions of mathematics concepts result from three main reasons. First one is
epistemological reasons which occur because of the nature and feature of the
knowledge. These obstacles are inevitable and the main part of the knowledge is
learned. Second one is the psychological reasons which are related to personal
development including biological, cognitive, and sensory dimensions. Students’
background knowledge, readiness to learn, ability, and skill affect students’ learning.
Pedagogical reasons that are resulted from teaching models, application of these
models, analogies used by the teacher, textbooks, and the concepts in these textbooks
are the third reason of the misconceptions.
Reasons of misconceptions are addressed in different ways in other studies
(Ayas & Demirbaş, 1997; Lawson & Thomson, 1988). In these studies it was stated
that the students’ wrong and deficient perception of the background knowledge,
language problems, no suitable teaching environment, no relationship between
concepts and real life, and no determination of students’ misunderstandings were the
other probable reasons of misconceptions.

17
As stated by Hiebert and Lefevre(1986) before, mathematical knowledge was
gained by learners as either procedural or conceptual knowledge. They stated that
while procedural knowledge was taught through practice and drill to be more
efficient and rapid in mathematics tasks, this efficiency and speed caused
misunderstandings for conceptual knowledge. Therefore, misconceptions and errors
could occur while passing from procedures to conceptual knowledge (Luneta &
Makonye, 2010).
In some studies errors were determined as procedurally and conceptually. A
study focusing on conceptual errors rather than procedural errors was conducted by
McGatha, Bush and Rakes (2010). In their study, they followed a group of 7th
grade
students whose teachers focused on their conceptual errors. When students came to
8th
grade in which they were tested, teachers focused on their procedural errors
instead of conceptual errors. It was examined that the growth of students’
achievement in 7th
grade was higher than the growth of students’ achievement in 8th
grade.
Students maintain concepts which do not correspond to scientific truths
(Büyükkasap & Samancı, 1998). These concepts may be defined as the obstructive
knowledge which comprise from personal experiences to avoid learning the
scientifically accepted concepts (Çakır & Yürük, 1999). They can also be defined as
misconceptions which address students’ understanding of the concept different from
its actual meaning accepted as scientific (Yağbasan & Gülçiçek, 2003). Baki (1998)
defined misconceptions as the behaviors that occur as a result of wrong beliefs and
experiences. Although these definitions are clear, the terms “misconception” and
“error” are generally used interchangeably. Smith, diSessa and Roschelle (1993)
pointed out that misconceptions were students’ conceptions that produced systematic
errors. While all misconceptions could be accepted as errors, all errors could not be
defined as misconception (Eryılmaz & Sürmeli, 2002).
In constructivism, current learning is affected by prior learning. That means
while students are learning something, they give meaning to things they have learned
before. Therefore, they construct their own knowledge (Van De Walle, 2007). In

18
learning, they are the active participants and they connect new ideas with existing
ideas (Olivier, 1989). Therefore, prior knowledge is important for students’ new
learning. The important thing is that misconceptions generally comprise prior
learning since misconceptions avoid learning of expert contents (Smith, diSessa &
Roschelle, 1993). Misconceptions are reflected in students’ conceptual structure and
they might affect the learning negatively (Olivier, 1989). Students do not come to
school as empty minds (Resnick, 1983, as cited in Mestre, 1989). Most teachers try
to fill students’ empty minds with the disciplinary concepts which are called as
expert concepts (Yağbasan & Gülçiçek, 2003). However, since students have prior
knowledge when they come to class, their conceptions might be inconsistent with the
expert concepts (Smith, diSessa & Roschelle, 1993). Therefore, misconceptions
occur.
Concerning the studies about misconceptions and errors, it was seen that
misconceptions and errors have important roles in students learning. Since one of the
aims of the present study was to examine the most common errors about area and
perimeter of geometric figures, the studies about them will be presented in the
following part.
2.3. Errors in Area and Perimeter
In the elementary mathematics program, it was aimed that students should be
able to recognize the geometric figures which they met in their lives, comprehend
their features, and gain the knowledge and skills to find their area and perimeter by
measuring and calculating (Baykul, 2000). Most students memorize the formulas
while learning the area and perimeter of geometric shapes (Maybery, 1983; as cited
in Clements & Battista, 1992).
Related literature shows that most of the students have difficulty in
understanding geometry and measurement concepts and particularly area and
perimeter (Barret& Clement, 2003; Martin & Kenney, 2002; Walter, 1970).
According to the Van Hiele (1985), students in the middle school identify and

19
compare geometric figures; however they do not understand concepts underlying
terms such as perimeter and area.
Most students try to solve the problems about perimeter and area without
understanding the concepts underlying the formulas (Mulcahy, 2007). Sherman and
Randolph (2003) conducted a study with twenty-seven 4th
grade students to
investigate the knowledge of students in the domain of area and perimeter. It was
found that students could apply formulas; however they were not aware of why they
used those formulas. Kidman and Cooper (1997) investigated how 4th
, 6th
and
8th
grade students considered about the area of quadrilaterals in terms of length and
width. About 50% of the students found the area of a quadrilateral by summing up
the length of the edges.
According to NAEP (2007), 4th
and 8th
grade students could not distinguish
area concept from the perimeter concept. They could not answer questions related to
the usage of area or perimeter in a given situation. Similarly, Malloy (1999) stated
that students tend to confuse perimeter and area concepts in his study. Furthermore, it
was examined that length measure was generally considered by young children as
area measure (Lehrer et al., 1998).
Seventh grade students were also reported to get confused the area and
perimeter concepts as they believed that there was a linear relationship between area
and perimeter of a figure (Moreira & Contente, 1997). In the study conducted by
Kami and Kysh (2006), it was found that 8th
grade students reckoned that when a
figure divided into parts, and a new shape was constructed, the area of the figure
changed.
Several studies have been conducted in order to investigate students’
understanding of area and perimeter concepts in Turkey. Emekli (2001) designed a
study to examine 7th
and 8th
grade students’ misconceptions on measurement
concepts. He found that students had significant difficulties about the concepts of
area and perimeter such as conservation of area and perimeter, and the usage of
formulas in these subjects. Moreover, Dağlı (2010) investigated the misconceptions
20
of 5th
grade students in the domain of area and perimeter and found similar results.
This study was conducted with 262 fifth grade students. According to the results of
the study, students had difficulty especially in the area subject. They also confused
area and perimeter concepts. They calculated the perimeter and area of the figure
whose length of the edges was given; however, they could not find the edge which
was not given. Besides these results, more specific results were pointed out in this
study. For example, it was observed that students could find the perimeter and area
of a square, rectangle or triangle easily. However they had difficulty in finding the
perimeter or area of a parallelogram. In addition to these results, students had
difficulty in the type of questions in which students were required to find the
remaining area of a rectangle which had small squares in it.
Students have problems in understanding of that the same quality of objects
can be compared (Zembat, 2009). Because of this misconception, students confuse
the perimeter and area of the given figures and they cannot assimilate that perimeter
is one dimensional and area is two dimensional measurements. Tan Şişman and Aksu
(2009) conducted a study with 134 seventh grade students and had similar results.
They found that students had difficulty with the formulas, they confused the
perimeter and the area of a figure, and they had problems in understanding the
unchanged area of a figure when that figure was divided into parts and then
combined in different form. They also had difficulty in the changeability of perimeter
of a figure.
In addition to those studies, Tan Şişman (2010) carried out another study
which aimed to examine 6th
grade students’ procedural and conceptual understanding
in area, length, and volume. That study was conducted with 445 sixth grade students
attending public schools in Ankara. Students were more successful in the test which
contained questions related to the length measurement than in the test which had
questions related to area and volume measurement. Moreover, students were more
successful in the procedural test rather than the conceptual test.
Küçük and Demir (2009) conducted a study in which 7th
and 8th
grade
students’ basic procedural knowledge and conceptual knowledge in mathematics

21
lesson was examined. In the study, when the questions belong to geometry learning
area, it was investigated that only 33.5% of the students could answer the question
related to parallelogram. This result corresponded to the results occurred in
Dağlı’s(2010) results that students had difficulty in solving the questions about
parallelograms.
In the study of Sherman and Randolphe (2003) what students knew and how
they knew related to area and perimeter concepts were investigated. In this study, 4th
grade students had taken mathematics lessons in which the area and perimeter
concepts were taught for about four weeks. It was examined that understanding the
difference and the relationship between area and perimeter completely made students
solve daily life problems related to area and perimeter. Moreover, it was observed
that memorizing the rules revealed temporary solutions for the problems.
Concerning the studies related to area and perimeter, it was seen that most
studies were about the misconceptions, errors, and achievement of students in the
domain of area and perimeter. Present study is also concerned with the relationship
between students’ knowledge of area and perimeter and their self-efficacy beliefs
towards geometry. Therefore, studies about self-efficacy are also presented below.
2.4. Self-Efficacy Beliefs
Self-efficacy has been studied by educational researchers for years (Hoy &
Spero, 2005). Bandura (1986) defined self-efficacy as “People’s judgments of their
capabilities to organize and execute courses of action required to attain designated
types of performances” (p. 391). Self-efficacy was also defined by Zimmerman
(1995, as cited in Dursun, 2010) as judgments of an individual about his or her own
ability to perform and accomplish a task. On the other hand, Schunk (1991) defined
academic self-efficacy as people’s beliefs about performing an academic task. Social
cognitive theorists claimed that students’ self-efficacy beliefs affected their attempts,
decisions and motivation (Işıksal & Aşkar, 2005).
Bandura (1986) asserted the sources of self-efficacy as enactive mastery
experiences, vicarious experiences, verbal persuasion and affective and
22
psychological states. First source of the self-efficacy is enactive mastery experiences
which have the most effect on self-efficacy (Bandura, 1986). According to Bandura
(1986) this source is related to peoples’ past success and failure. Bandura (1986)
claimed that while success supports self-efficacy beliefs, failure has a negative effect
on self-efficacy.
Vicarious experiences is the second source which means after peoples
observe other peoples’ performances, they regulate their self-efficacy beliefs (Usher
&Pajares, 2006). According to Bandura (1997) and Pajares (1997), if the observer
has limited experiences and he is unsure about his performances, this source becomes
most effective.
According to Usher and Pajares (2006), people sometimes want approvals of
their parents or teachers unless they make self-evaluation of their performances on
tasks which they engage in. That is called verbal persuasion. This source could have
a long term effect on individuals as well as sometimes the effect could become short
term.
The last source is affective and psychological states which encompass
feelings such as anxiety, stress, emotions, and mood. Hodges and Murphy (2009)
claimed that these feelings affected peoples’ self-efficacy beliefs. Because of these
feelings people might have misunderstandings and wrong interpretations about tasks
(Hodges & Murphy, 2009). Pajares (2007) stated that people with high self-efficacy
approached difficult tasks comfortably however, people with low self-efficacy felt
stress towards the task. As a result of this, it is seen that self-efficacy beliefs affects
peoples’ motivation and achievement. Similarly, Gawith (1995) claimed that
although people have the required ability to perform the task, unless they had self-
efficacy beliefs, they could not be successful (as cited in Cantürk-Günhan & Başer,
2007).
The importance of self-efficacy beliefs on behavior of individuals has been
widely stated. Self-efficacy beliefs have a significant influence on people’s choices
and people engage in the tasks in which they feel competent (Pajares, 1996). It was
23
examined that achievement of students in performing a task was influenced by self-
efficacy beliefs (Bandura, 1993; Pajares, 1997). For example, Schunk and Pintrich
(2008) stated that while students with low self-efficacy beliefs were reluctant to
performing tasks, the students with high self-efficacy beliefs were eager to complete
tasks. In addition to this, Schunk (1995) addressed that students with high self-
efficacy were more eager and consistent while carrying out an academic task.
Moreover, Schunk and Pajares (2002) asserted that self-efficacy beliefs could
change according to the different situations. For example, characteristics of the task,
physical conditions of the students, and physical conditions of the classrooms might
have an influence on self-efficacy beliefs (Schunk, 2008).
Research has concluded that “Self-efficacy is a domain-specific construct”
(Pajares, 1996; p. 106). Similarly self-efficacy was seen by Smith and Fouad (1999)
as a distinctive to a subject area (as cited in Schunk, 2008). In the literature, research
about self-efficacy focused on two points. One of them is the relationship between
carrier and college choices specifically in the area of science and mathematics (e.g.
Farmer, Wardrop, Anderssn & Risinger, 1995; as cited in Zarch & Kadivar, 2006).
The other one is the relationship between the self-efficacy beliefs and academic
constructs such as motivation and achievement (Zarch & Kadivar, 2006).Thorndike
(1986) claimed that self-efficacy is the important predictor of academic performance.
Similarly, it was investigated that mathematics self-efficacy is an important predictor
of problem solving and mental capability (Pajares & Kranzler, 1995).
Establishing the importance of self-efficacy in mathematics education,
NCTM stated that one of the goals for students is “that they become confident in
their ability to do mathematics” (NCTM, 1989, p. 5, as cited in Kahle, 2008).
Mathematics self-efficacy was defined as people’s judgments of their capabilities to
organize and perform a series action required to attain specific mathematics task or
problem successfully (Hackett & Betz, 1989). When the tasks are related to
geometry, this definition turns into people’s judgments of their capabilities to
organize and perform a series of actions required to attain specific geometry task or
problem successfully (Dursun, 2010).
24
Several studies were conducted about the relationship between students’
mathematics achievement and self-efficacy beliefs (Hackett & Betz, 1989; Isiksal &
Askar, 2005; Pajares & Miller, 1995). One of them is an experimental study
conducted by Işıksal and Aşkar (2005). The aim of that study was to examine the
effect of dynamic geometry software and spreadsheet on achievement and
mathematics self-efficacy of 7th
grade students. In the study mathematics self-
efficacy, computer self-efficacy scale and mathematics achievement tests were used.
According to the results it was seen that self-efficacy beliefs were not affected by
treatments.
In some researches, it was mentioned that there was no relationship between
students’ academic performances and self-efficacy beliefs (Işıksal, 2002). For
example, Cooper and Robinson (1991) conducted a study with the aim of examining
the relationship between mathematics self-efficacy beliefs and performance. Their
participants were 290 undergraduate students. The result of the study showed that
there was not a significant relationship between mathematics performance and
mathematics self-efficacy. Similarly, another study was conducted by 72 children of
9-10 ages. It was found that self-efficacy did not have an influence on mathematics
performance (Norvich, 1987; as cited in Işıksal, 2002).
A recent study conducted by Tsamir (2012) investigated the relationship
between young children’s geometric knowledge and their self- efficacy beliefs. In the
study, 141students were asked self-efficacy questions and geometry tasks were given
them. Results indicated that students had high self-efficacy and their self-efficacy
was not significantly related to their geometric knowledge.
2.5.Summary of the Literature Review
The importance of procedural and conceptual knowledge in mathematical
competence cannot be denied (Hiebert & Lefevre, 1992). Several studies were
conducted about the different aspects of knowledge types such as, relationship
between them, developmental order of them and their importance (Crowley &
Siegler, 1994; Gelman & Williams, 1998; Hapaasalo & Kadijevich, 2000; Rittle-

25
Johnson & Siegler, 1998; Siegler, 1991; Sophian, 1997; Star, 2005).Van de Walle
(2012) addresses that conceptual and procedural knowledge should be taught in
relation to each other since when one is missing, the rest would result in errors and
lack of enjoyment for students. To summarize the common results of the past
research it can be said that students have both types of knowledge, the knowledge
types are linearly correlated with each other, the improvements in one knowledge
type can result in advances in other knowledge types (Rittle-Johnson, et al.,
2001).However; since there are limited studies related to the conceptual and
procedural knowledge changes of private middle school students in the basic
objectives of a specific topic, this part of the topic will constitute as one of the main
theme of the present study.
Moreover, as stated in the related literature, geometry and measurement are
important in mathematics education curriculum. Especially in area and perimeter,
which are addressed together, students in any grade level have difficulty. Related
literature shows that most of the students have difficulty in understanding geometry
and measurement concepts and particularly area and perimeter (Barret & Clement,
2003; Martin & Kenney, 2002; Walter, 1970). There are several studies about the
students’ perceptions, misconceptions, and errors about the domain of area and
perimeter. According to NAEP (2007), private middle school students could not
distinguish area concept from the perimeter concept. Similarly, Emekli (2001) stated
that students had significant difficulties about the concepts of area and perimeter
such as conservation of area and perimeter, and the usage of formulas in these
subjects. However; studies in which basic conceptual and procedural knowledge of
students are examined in upper grades have not been accessed.
Finally, as stated above, literature have several studies about the relationship
between self-efficacy beliefs and mathematics performance. It was examined that
achievement of students in performing a task was influenced by self-efficacy beliefs
(Bandura, 1993; Pajares, 1997). For example, Schunk and Pintrich (2008) stated that
while students with low self-efficacy beliefs were reluctant to performing tasks,
students with high self-efficacy beliefs were eager to complete tasks. Moreover there
were studies about the relationship between self-efficacy beliefs and mathematics

26
achievements (Hackett & Betz, 1989; Isiksal & Askar, 2005; Pajares & Miller,
1995).However, there are limited studies about the performance in a geometry task
and geometry self-efficacy. Moreover, it has not been investigated how students with
high self-efficacy perform in a procedurally oriented or conceptually oriented task.
27
CHAPTER 3
METHOD
The purpose of the present study was to investigate private middle school
students’ procedural and conceptual knowledge in the domain of area and perimeter
and to examine most common errors in their knowledge. The other specific interest
of the study was to examine how students’ conceptual and procedural knowledge
aspects of area and perimeter changes with respect to their geometry self-efficacy.
Moreover, private middle school students’ procedural knowledge, conceptual
knowledge and geometry self-efficacy throughout the grade levels were also
investigated.
The focus of this chapter is the method employed in this study. This chapter is
devoted to information about the research design, population and sample, data
collection instruments, pilot study, validity and reliability of the study, data
collection procedure, analyses of data, assumptions, limitations, and lastly internal
and external validity of the study.
3.1. Design of the Study
In order to the investigate research questions, quantitative research methods
were used. The main purpose of this study was to investigate the relationship
between students’ procedural and conceptual knowledge, and those with their self-
efficacy beliefs towards geometry. Since this research question of the study intended
to describe an existing relationship between variables which were procedural
knowledge, conceptual knowledge, and self-efficacy towards geometry, correlational
research design was preferred (Fraenkel & Wallen, 2006).
The other purpose of the study was to examine conceptual and procedural
knowledge of private middle school students in the domain of area and perimeter and
their self-efficacy beliefs towards geometry. Due to the fact that this research
question aimed at describing some aspects and characteristics such as knowledge,

28
survey research design and particularly cross-sectional survey was preferred. The
aim of this research type was collecting data at one point of time from similar but
different populations, in terms of grade level groups in this study, selected to
describe a population (Fraenkel & Wallen, 2006). Data were analyzed through mean,
standard deviation, percentages, frequencies, Pearson Product-Moment Correlation,
and one-way ANOVA.
3.2. Population and Sample
The target population of the study was all private middle school students in
all private schools in Ankara. The private middle school students in private schools
in Çayyolu district in Ankara was the accessible population for this study. The
subjects of the study were the private middle school students (6th
, 7th
and 8th
grade) in
one private school in Ankara. Specific characteristic of the sample was that they
were educated in classrooms which included small number of students and which
were highly equipped in terms of instructional materials such as technological
devices and manipulative. Further, the school was placed in a high socio-economic
level district; and parents were mostly university graduates, and some with graduate
degree.
Convenience sampling methods was used in this study because the researcher
was a mathematics teacher in that school and she was able to reach the sample
conveniently. In convenience sampling method, researchers collect data from the
individuals who are available; however, this sample cannot be accepted as the
representative of any population because it is not randomly selected (Fraenkel &
Wallen, 2006). There were 111private middle school students in the school at the
time of the study. The number of participants of the study in terms of grade level is
given in the Table 3.1 below.
Table 3.1: Numbers of students in terms of grade level
Grade Level 6th
grade 7th
grade 8th
grade Total
Number of Students 31 35 45 111

29
3.3. Data Collection Methods and Instruments
Data for this study were collected through conceptual and procedural
knowledge tests and self-efficacy towards geometry scale. Data collection methods,
instruments, and procedures are explained below in detail.
3.3.1. Procedural and Conceptual Knowledge Tests
These tests were partially developed by the researcher. Some of the questions
were developed by the researcher and some of them were taken or adapted from the
literature. All questions in the PKT and CKT presented in the following pages were
translated by the researcher. Before preparing questions for the tests, related
literature was reviewed. It was found that conceptual tasks were generally
characterized as non-routine and novel tasks. These required the use of
understanding of underlying principles or concepts in a mathematics topic, not
necessarily involving computations. Procedural tasks were the tasks which required
the use of step-by-step solution methods, computations, algorithms, or formulas
(Hiebert & Lefevre, 1986; Kulm, 1994). After establishing this distinction, Turkish
Elementary Mathematics Curriculum (grades 1-8) was examined. Since the purpose
of this study was to examine the basic conceptual and procedural knowledge in all
upper grade levels, there was a need to develop a test suitable for all private middle
school levels. Therefore, 6th
grade mathematics objectives were taken into account to
form conceptually and procedurally oriented tests in the domain of area and
perimeter. For the final forms of the PKT and CKT, see Appendix A and B.
3.3.1.1 Procedural Knowledge Test
The main aim of the procedural knowledge test (PKT) was to measure
students’ knowledge of area and perimeter in terms of computational skills such as
using formulas to find area and perimeter of given figures. The PKT consisted of 10
questions which were developed by the researcher through consulting the textbooks,
curriculum documents, a variety of mathematics books, and the existing literature.
Content domains included in the PKT were area and perimeter of regular and
irregular geometric shapes, triangles, squares, parallelograms, and rectangles. Since
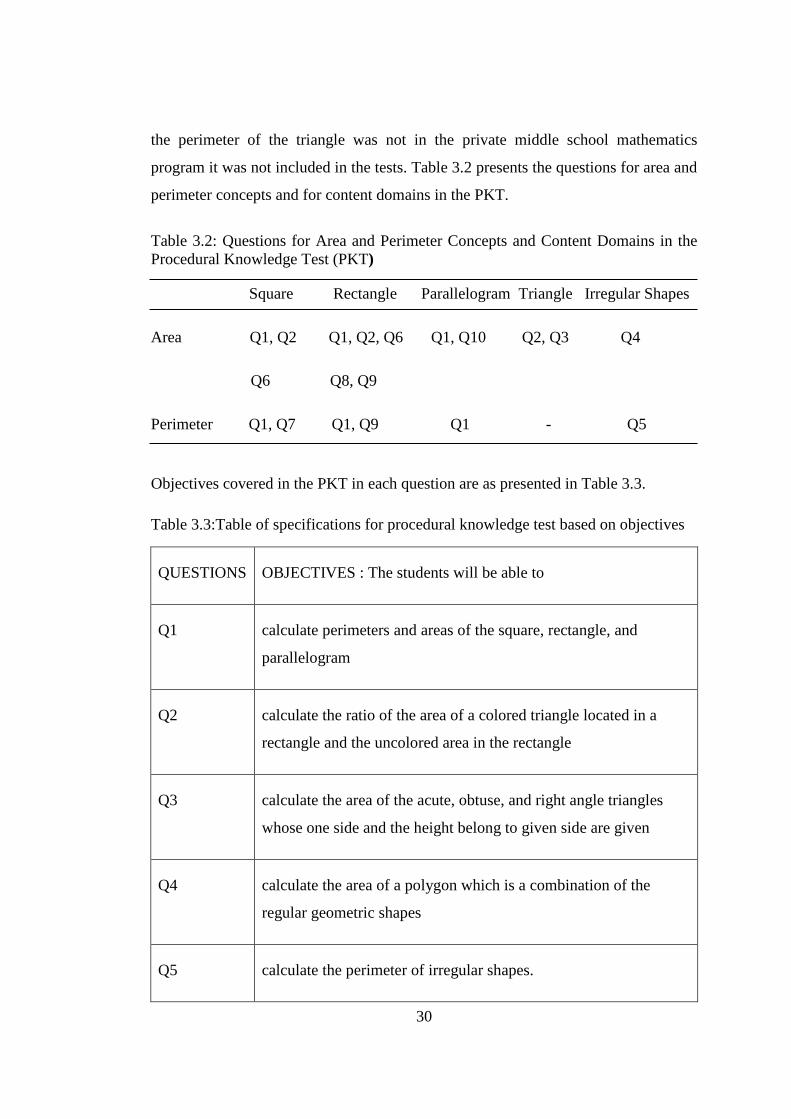
30
the perimeter of the triangle was not in the private middle school mathematics
program it was not included in the tests. Table 3.2 presents the questions for area and
perimeter concepts and for content domains in the PKT.
Table 3.2: Questions for Area and Perimeter Concepts and Content Domains in the
Procedural Knowledge Test (PKT)
Square Rectangle Parallelogram Triangle Irregular Shapes
Area Q1, Q2 Q1, Q2, Q6 Q1, Q10 Q2, Q3 Q4
Q6 Q8, Q9
Perimeter Q1, Q7 Q1, Q9 Q1 - Q5
Objectives covered in the PKT in each question are as presented in Table 3.3.
Table 3.3:Table of specifications for procedural knowledge test based on objectives
QUESTIONS OBJECTIVES : The students will be able to
Q1 calculate perimeters and areas of the square, rectangle, and
parallelogram
Q2 calculate the ratio of the area of a colored triangle located in a
rectangle and the uncolored area in the rectangle
Q3 calculate the area of the acute, obtuse, and right angle triangles
whose one side and the height belong to given side are given
Q4 calculate the area of a polygon which is a combination of the
regular geometric shapes
Q5 calculate the perimeter of irregular shapes.

31
Q6 calculate the area of the rectangle by using small and colored
squares in the rectangle
Q7 calculate the perimeter of a square whose area is given.
Q8 calculate the area of a rectangle whose perimeter and length of the
one of the sides are given.
Q9 calculate the perimeter and area of a rectangle which is formed by
squares.
Q10 calculate the height of the long side of a parallelogram whose short
side, height of the short side, and the long side are given.
*Translations are done by the researcher.
3.3.1.2. Conceptual Knowledge Test
Conceptual knowledge test (CKT) contained 10 open-ended questions. For
this test, two questions (Q1 and Q7) were taken from the PISA 2006 test. Four of the
questions (Q3, Q4a, Q5, Q8, and Q10) were chosen from an instrument designed and
used by Tan (2010). Two of the questions (Q6 and Q9) were taken from the past SBS
examinations. One question was prepared by the researcher. Table 3.4 presents the
questions for area and perimeter concepts and for content domains in the CKT.
Square Rectangle Parallelogram Triangle Irregular Shapes
Area Q2, Q3, Q4a Q3, Q5, Q6b Q4a - Q1, Q8a, Q9,
Perimeter Q4a Q6a, Q7 (4) Q4b, Q7 (2) - Q7 (1, 3), Q8b,Q10
Table 3.4: Questions for Area and Perimeter Concepts and Content Domains in the
Conceptual Knowledge Test (CKT)
Table 3.3. (Continued)

32
Objectives covered in the CKT in each question are as presented in Table 3.5.
Table 3.5: Table of specifications for conceptual knowledge test based on objectives
QUESTIONS OBJECTIVES: The students will be able to
Q1 estimate the area of an irregular geometric shape.
Q2 decide how surface area of a structure consisted of unit cubes
changes when one of the unit cubes is taken away.
Q3 decide for which kind of information will be used to calculate the
area of paper to cover a given square prism.
Q4 interpret the change in the area and circumference of a figure
obtained by breaking an initial figure into pieces and then bringing
them together in a different combination.
Q5 interpret the changes in the area of a square whose dimensions
change in a given specific ratio.
Q6 identify changes in area and perimeter of two rectangles in
different combinations.
Q7 choose the figures with the same perimeter among different
figures.
Q8 compare the perimeters and areas of two irregular shapes drawn on
dot paper.
Q9 estimate the area of an irregular geometric shape drawn on a dot
paper.
Q10 identify different irregular shapes with the same perimeter.
*Translations are done by the researcher.

33
3.3.2. Geometry Self - Efficacy Scale
The Geometry Self-Efficacy (GSE) Scale (see appendix C) was developed by
Cantürk-Günhan and Başer (2007) in order to measure private middle school
students’ self-efficacy toward geometry. The scale consisted of 25 items on a 5-point
Likert type items (1-Never, 2-Sometimes, 3-Undecided, 4-Most of the time, 5-
Always). The scale had three sub-dimensions which were positive self-efficacy
beliefs, negative self-efficacy beliefs, and beliefs on the use of geometry knowledge.
A sample item for each sub-dimension is given in Table 3.6.
Table 3.6: Sample Items of GSE Scale Sub-Dimensions
Sub-dimension Sample Item
Positive self-efficacy beliefs When I see a geometrical shape, I can
remember its properties.
Negative self-efficacy beliefs I cannot explain the relationships
between geometrical shapes.
Beliefs on the use of geometry
knowledge
I believe that if I select a job related to
the use of geometrical knowledge in the
future, I will be successful.
In this scale meant that the participants had high geometry self-efficacy.
Reliability analysis and factor analysis of GSE were employed by Cantürk-Günhan
and Başer (2007) and the scale was found to be highly reliable (r = .90) and valid. In
the present study reliability coefficient was calculated as .77 which is an appropriate
reliability coefficient. For the final form of the GSE scale, see Appendix C. Finally,
the research questions and the data gathering instruments are given in the Table 3.7
below.
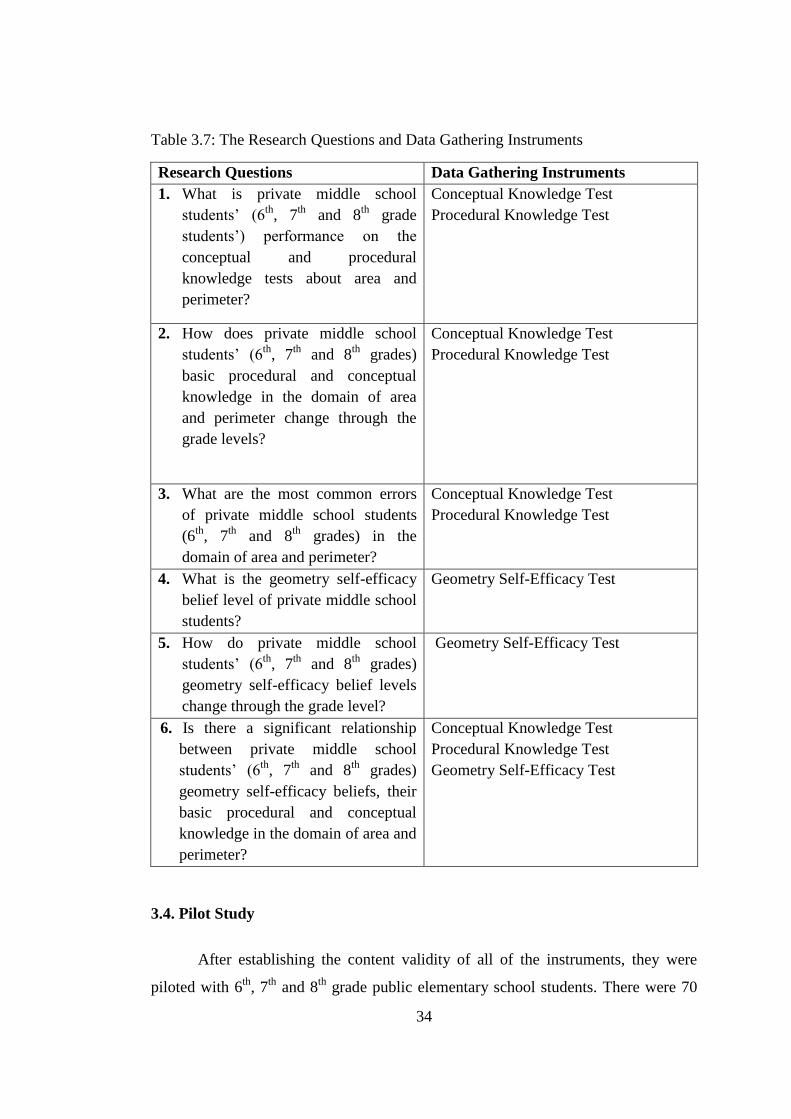
34
Table 3.7: The Research Questions and Data Gathering Instruments
Research Questions Data Gathering Instruments
1. What is private middle school
students’ (6th
, 7th
and 8th
grade
students’) performance on the
conceptual and procedural
knowledge tests about area and
perimeter?
Conceptual Knowledge Test
Procedural Knowledge Test
2. How does private middle school
students’ (6th
, 7th
and 8th
grades)
basic procedural and conceptual
knowledge in the domain of area
and perimeter change through the
grade levels?
Conceptual Knowledge Test
Procedural Knowledge Test
3. What are the most common errors
of private middle school students
(6th
, 7th
and 8th
grades) in the
domain of area and perimeter?
Conceptual Knowledge Test
Procedural Knowledge Test
4. What is the geometry self-efficacy
belief level of private middle school
students?
Geometry Self-Efficacy Test
5. How do private middle school
students’ (6th
, 7th
and 8th
grades)
geometry self-efficacy belief levels
change through the grade level?
Geometry Self-Efficacy Test
6. Is there a significant relationship
between private middle school
students’ (6th
, 7th
and 8th
grades)
geometry self-efficacy beliefs, their
basic procedural and conceptual
knowledge in the domain of area and
perimeter?
Conceptual Knowledge Test
Procedural Knowledge Test
Geometry Self-Efficacy Test
3.4. Pilot Study
After establishing the content validity of all of the instruments, they were
piloted with 6th
, 7th
and 8th
grade public elementary school students. There were 70

35
private middle school students who were taught in one public school and one private
school in Yenimahalle district in the pilot study. The aim of this implementation was
to check the comprehensiveness of items, convenience of time duration, and
difficulty of the items. For conceptual and procedural tasks, students were given 50
minutes for the tests and for the self-efficacy scale, they were given 15 minutes.
Another aim of pilot study was to determine the possible difficulties that may occur
in the actual study. After the pilot study, necessary analyses, stated in the validity and
reliability section in more detail, were conducted with data in order to check the
construct validity and reliability of instruments. In addition to this, any observed
difficulties during administration were considered and revisions were done
accordingly. In the pilot study, students could not complete the tests in 40 minutes.
Therefore, in the actual study students were given 80minutes to complete questions
in the tests and the geometry self-efficacy scale. Moreover, changes in the language
of the questions were done.
3.5 Data Collection Procedure
After the pilot study, the tests were prepared for the actual study to
implement. The study was conducted in a private school which has 111 private
middle school students (31 sixth grade students, 35 seventh grade students and 45
eighth grade students). The tests were implemented to students in their mathematics
lessons. The PKT and CKT were distributed at the same time. They had the chance
to start from the test that they wanted. STG test was distributed after they completed
the PKT and CKT. They were given two lessons time which was 80 minutes. They
had 10 minutes break after the first 40 minutes. The same teacher was in their class
for each application.
3.6. Data Analysis
In this study, data were analyzed according to the research questions which
were designed to examine the 6th
, 7th
and 8th
grade students’ procedural and
conceptual knowledge. The aim was to obtain a wider and more detailed picture
about the extent of this knowledge in the domain of area and perimeter through the
36
curriculum and how students’ performance in conceptual and procedural aspects of
area and perimeter changed with respect to their geometry self-efficacy.
First of all, all answers of students in conceptual and procedural tests were
examined separately. The frequency of correct, incorrect, and empty answers was
calculated for each question in each test. Moreover, incorrect answers were
investigated in detail. The wrong responses of students were categorized according to
the responses of the students. Then, the frequency of the most common answers was
given in tables for questions.
Second, quantitative research methodologies were used to analyze data
through a number of descriptive and inferential statistics by using PASW 18
software. A codebook was prepared and a number of data screening procedures were
carried out to run the primary data analysis. There were no missing values. Then, in
order to examine the relationship between geometry self-efficacy beliefs of students
and their scores in procedural and conceptual tests, Pearson product-moment
correlation analyses were run. In the geometry self-efficacy test, Likert type items
were scored. The negative items were reversed for the scoring.
One-way ANOVA was used to investigate how self-efficacy, procedural
knowledge, and conceptual knowledge changed according to grade levels. Prior to
running this analysis, the assumptions were checked. Eta squared was calculated to
investigate the practical significance of the results.
3.7. Validity and Reliability of the Instruments
Validity is the “appropriateness, correctness, meaningfulness and usefulness
of the inferences” (Fraenkel & Wallen, 2006, p. 151) claimed based on the results of
the study. For this reason, after questions were prepared, tests were given to the
experts who were five elementary mathematics teachers and two graduate students
and four academicians in the field of mathematics education to gain evidence for the
content validity of instruments. The aims of the tests, and coverage, and objectives of
the study were clearly explained to the experts. Table of specifications of each test
were also presented. They were asked if test items corresponded for the grade levels

37
and the aim of the tests, if the language of items was clear, and the order of the
questions were adequate. After opinions were taken, items were examined once more
and suitable changes were completed before the pilot study of the instruments.
According to their comments, language of the some questions was corrected.
Moreover, some questions were taken out from procedural test since they did not
investigate the procedural skills. Also, the number of the questions was decreased
from the tests by taking out the questions with similar objectives.
Internal consistency methods were utilized to examine the reliability of the
instruments. For the statistical analyses of the internal consistency, Cronbach’s alpha
coefficient was obtained through PASW 18 program. The reliability estimated for
scores on PKT was found as .90 and for scores on CKT as .78 in the pilot study.
Since reliability coefficient of a scale should be at least .70 (Fraenkel & Wallen,
2006) to have a reliable instrument, it could be said that PKT and CKT were reliable
instruments.
In addition to the internal consistency between items, there should be a
scoring agreement which refers to inter-rater reliability since there were open-ended
items and they were scored according to a rubric. In order to check inter-rater
reliability, the correlation coefficient was calculated for two independent scorers of
the same instrument. The correlation coefficient was calculated for PKT as .99 and
for CKT was calculated as .99. These values indicated quite high reliability between
scorers. In addition, the Pearson Product-Moment Coefficient was calculated
between two scorers. This correlation coefficient was found as .99 which indicated a
very high consistency between scorers for PKT and CKT. However, in order to
compute the total scores of students for PKT and CKT, the different scores given by
two raters (one rater was the researcher who is a mathematics teacher and the second
rater was another mathematics teacher) were examined again and the exact scores of
students were determined after both scorers agreed.
Geometry self-efficacy scale which was used in the study was developed by
Cantürk-Günhan and Başer (2007). For the reliability of GSE scale, Cantürk-Günhan
and Başer (2007) administered a pilot study on 385 elementary students. The

38
Cronbach alpha values for each sub-dimension of the scale calculated by Cantürk-
Günhan and Başer were summarized in Table 3.8:
Table 3. 8: Cronbach Alpha Values
Sub-dimensions Number of items Cronbach alpha
Positive self-efficacy beliefs 12 .88
Negative self-efficacy beliefs 6 .70
Beliefs on the use of geometry 7 .70
knowledge
General 25 .90
According to the information given in Table 6, the reliability of the GSE scale
was satisfactory (.90). Cantürk-Günhan and Başer (2007) conducted factor analysis
to check the validity of the scale. They mentioned that the items loaded in three
factors which explained the 42.4% of the variance. According to the factor analysis
results conducted by the test developers, the first factor explained 27.41 percent of
the variance with 12 items; the second factor explained 9.81 percent of the variance
with 6 items; third factor explained 5.20 percent of the variance with 7 items. For the
content-related validity of the scale, expert (two academicians, two graduate
students, and two mathematics teachers) opinions were taken into consideration.
To establish reliability of the instrument in the present study, internal
consistency methods were used. For the statistical analyses of the internal
consistency, Cronbach alpha coefficient was computed as .77 which was an
acceptable reliability.
3.8. Assumptions and Limitations
There are several assumptions of the present study as in other studies. First of
all it was assumed that procedural knowledge, conceptual knowledge and self-
39
efficacy of students can be measured adequately through the items in the in the
instruments. Second, the participants of the study were assumed to answer the
questions in the instruments sincerely and accurately. Third, it was assumed that the
instruments were completed under similar conditions. Lastly, there was no
interaction between the subjects in order not to affect the results of the study.
There were also the limitations of this study. One of them was the sampling
method. Since the participants were not selected randomly, the results of this study
could not be generalized to a larger population. The other one was the status of the
researcher who was the teacher of 8th
grade participants. Since the researcher was
their teacher, they could answer the questions based on their feelings towards their
teachers. For example, students who liked their teacher might have answered the
questions more reluctantly whereas students who did not specifically like their
teacher might not have given importance to questions. Another limitation of the
study was that results were limited with the questions in the instruments.
3.9. Internal and External Validity
3.9.1. Internal Validity
If the difference on dependent variable is caused by only independent
variables rather than unintended variables, this means that the internal validity is
established (Fraenkel & Wallen, 2006). In general, for survey studies, the possible
internal threats are location, instrumentation (instrument decay, data collector
characteristics, and data collector bias), instrument decay and mortality (Fraenkel &
Wallen, 2006). Moreover, location, testing, mortality, instrumentation and subject
characteristics are the common threats for correlation studies (Fraenkel & Wallen,
2006).
Data collector bias might be an internal threat for research studies. Data
collector might behave unconsciously to gather the desired results (Fraenken &
Wallen, 2006). However, in the present study the researcher did not communicate
with students during the implementation. Besides this, a detailed answer key was
prepared and used while scoring the answers. Since the researcher remained unbiased

40
and non-directive during the data collection and data analysis, data collector bias did
not become a threat for the present study. Moreover, since the data collector was the
same in all classes in which the implementation occurred, data collector
characteristics could not be a threat for this study. The data collection time and
scoring were scheduled so as to prevent instrument decay.
In studies, when the aim was comparing the groups, the subjects in the groups
might differ from each other in several variables. This threat was called as subjects
characteristics. In this study there were three groups which changed in grade levels,
in other words, in ages. Also, both genders were represented. However, groups were
evaluated in their grade levels for some analysis and questions in the achievement
tests were prepared from the common objectives. Also, students were assumed to
have the same mathematical experiences as they were in the same school. Therefore,
the subject characteristics threat was reduced.
In this study, location might have been a threat since the researcher would
have carried out the study in different classrooms. To eliminate this threat, the
researcher conducted the questionnaire in the mathematics classroom in the school so
that she could eliminate the effect of this threat.
The other threat for the present study might have been mortality which was
also called as loss of subjects. Some of the subjects might have been absent during
the administration time. However, during the application of the test, this problem was
not occurred.
Fraenkel and Wallen (2006) stated that testing which was referred as
influences of instruments on each other could be a threat for studies. However, in this
study this threat did not occurred since PKT, CKT and STG tests measured different
constructs.
3.9.2. External Validity
Fraenkel and Wallen (2006) defined the external validity as the degree to
which results can be generalized to the population. In order to generalize the results
41
of the study to the population, the sample should be representative of the population
in terms of nature and environmental issues. Since the sampling method was
convenience sampling and only one private school was used to collect data, the
results of this study could not be generalized to a larger population. Nonetheless, at
certain conditions, the results of this study could be generalized to a population.
Fraenkel and Wallen (2006) defined this type of generalizability as ecological
generalizability which meant “the extent to which the results of a study can be
generalized to conditions or settings other than those that prevailed in
particular study” (p. 108). There may be schools with students who have same
academic and social characteristics in other districts. Thus, the results of this study
may be generalized to a population who has the subjects having the mentioned
characteristics.
42
CHAPTER 4
RESULTS
The purpose of the current study was to examine conceptual and procedural
knowledge of private middle school students in the domain of area and perimeter of
geometric figures and their self-efficacy beliefs towards geometry. Another purpose
of the study was to investigate the relationship between students’ procedural and
conceptual knowledge, and their self-efficacy beliefs towards geometry. Moreover,
the most common errors of students in the domain of area and perimeter concepts in
procedural and conceptual tests were identified.
In this chapter, the results of the data analysis are presented in detail
according to the research questions. First of all, descriptive statistics including
minimum and maximum values mean, and standard deviation related to procedural
and conceptual tests’ scores and self-efficacy belief test scores were presented.
Second, in order to examine whether there were significant differences between the
procedural, conceptual and geometry self-efficacy test scores with respect to three
grade levels (6th
, 7th
and 8th
grade) one way ANOVA was conducted. In addition to
this, students’ answers in the procedural and conceptual tests were analyzed to
examine their performance according to the question types and their most common
errors. For this purpose, questions were categorized for procedural and conceptual
tests in terms of the domain area and perimeter. Also, sub-categorizations were done
under the area and perimeter concepts and frequencies of correct, incorrect and
empty answers were presented. Finally, in order to examine the relationship between
students’ self-efficacy beliefs towards geometry and their procedural and conceptual
knowledge separately, Pearson-product moment correlation analysis was conducted.
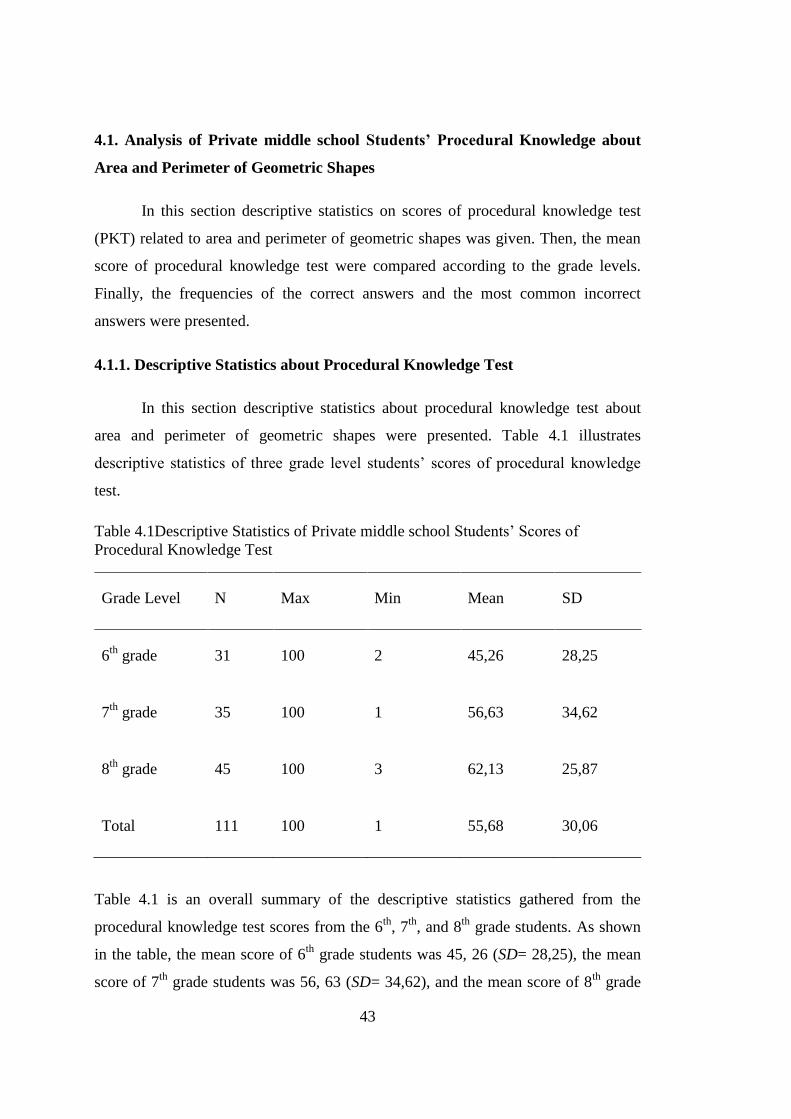
43
4.1. Analysis of Private middle school Students’ Procedural Knowledge about
Area and Perimeter of Geometric Shapes
In this section descriptive statistics on scores of procedural knowledge test
(PKT) related to area and perimeter of geometric shapes was given. Then, the mean
score of procedural knowledge test were compared according to the grade levels.
Finally, the frequencies of the correct answers and the most common incorrect
answers were presented.
4.1.1. Descriptive Statistics about Procedural Knowledge Test
In this section descriptive statistics about procedural knowledge test about
area and perimeter of geometric shapes were presented. Table 4.1 illustrates
descriptive statistics of three grade level students’ scores of procedural knowledge
test.
Table 4.1Descriptive Statistics of Private middle school Students’ Scores of
Procedural Knowledge Test
Grade Level N Max Min Mean SD
6th
grade 31 100 2 45,26 28,25
7th
grade 35 100 1 56,63 34,62
8th
grade 45 100 3 62,13 25,87
Total 111 100 1 55,68 30,06
Table 4.1 is an overall summary of the descriptive statistics gathered from the
procedural knowledge test scores from the 6th
, 7th
, and 8th
grade students. As shown
in the table, the mean score of 6th
grade students was 45, 26 (SD= 28,25), the mean
score of 7th
grade students was 56, 63 (SD= 34,62), and the mean score of 8th
grade
44
students was 62, 13 (SD= 25, 87) while the mean score of all total was 55, 68 (SD=
30, 06) in the procedural knowledge test. As a results, the procedural knowledge test
scores of the 6th
grade students was under the mean of all students’ scores, the
procedural knowledge test scores of the 7th
and 8th
grade students was above the
mean of all students’ scores. Moreover, it can be seen that the procedural test scores
of 8th
grade students was higher than the procedural test scores of 7th
grade students
and the procedural test scores of 7th
grade students was higher than the procedural
test scores of 6th
grade students.
4.1.2. The Difference in Procedural Knowledge of Private middle school
Students in terms of Grade Level
One of the aims of the present study was to examine how procedural
knowledge of private middle school students changed according to their grade level.
Therefore, mean scores of students from each grade level were compared to see
whether there was a significant mean difference between the scores of the groups. In
order to compare the mean differences between the groups, ANOVA should be used
(Pallant, 2007). Therefore, in order to examine the mean difference of procedural
knowledge test scores in terms of grade levels, one-way ANOVA was used. Prior to
running the analysis, the assumptions of one-way ANOVA were checked. In the next
sections the assumptions and analysis of results were summarized.
4.1.2.1. Assumptions of one way ANOVA
The assumptions of one-way ANOVA were level of measurement,
independence of observations, normality, and homogeneity of variance (Pallant,
2007).
The variables for one-way ANOVA were mean scores of procedural
knowledge test of 6th
, 7th
, and 8th
grade students which were continuous variable.
Hence, level of measurement assumption was ensured.
Each measurement of grade levels was not influenced by each other, since
each grade level was taken the tests in different times. It was assumed that their

45
scores did not influence one another. Therefore, level of measurement assumption
was ensured.
The other assumption to be considered before conducting one-way ANOVA
was normality. For parametric techniques, mean scores for each variable should be
normally distributed (Pallant, 2007). Since the sample sizes for all groups was large
enough (e.g. 30+), this assumption should not to cause major problems. In order to
check normality of procedural knowledge test scores for each group, histograms,
normal Q-Q plots, and skewness and kurtosis values were checked.
In addition to this, skewness and kurtosis values were checked. Since these
values are between -2 and +2 (Pallant, 2007), the normality of three groups’ scores
was assured. The values are given in the table 4.2 below.
Table 4.2 Skewness and Kurtosis Values of Procedural Knowledge Test Scores for
each grade level
Grade level Skewness Kurtosis Number
6th
grade .291 -.975 31
7th
grade -.501 -1.301 35
8th
grade -.775 -.380 45
For homogeneity of variance assumption, Pallant (2007) stated that the
variability of all groups should be similar, that is, the samples were obtained from
populations of equal variances. In this analysis, Levene’s Test of Equality of Error
Variances showed that the homogeneity of variance assumption was not assured (p =
.030). However, according to Stevens (1996), “Analysis of variance is reasonably
robust to violations of this assumption, provided the size of your groups is
reasonably similar” (as cited in Pallant, p. 207). Since in the sample, largest/smallest
< 1.5, the violation of this assumption was acceptable.

46
4.1.2.2. Results of one - way ANOVA for Procedural Knowledge Test
According to one-way ANOVA results, there was no significant mean
difference (F (2,108) = 3, 03, p>.05) among three grade levels in terms of procedural
knowledge test scores. Although 7th
and 8th
grade students’ scores were higher than
the 6th
grade students, this difference was not statistically significant. In Figure
4.1PKT scores are given according to grade levels.
4.1.3. The Analysis of the Correct and Most Common Errors in the Procedural
Knowledge Test
Before the analysis, the questions were categorized in terms of the perimeter
and area domains. Then, the perimeter part was also categorized in itself as the
perimeter of regular geometric figures (questions 1, 7 and 9), perimeter of irregular
shapes (questions 5). Similarly area part was classified as the area of regular shapes
(questions 1, 2, 3, 6, 8, 9, 10), area of the combination of regular shapes (question 4).
4.1.3.1. Perimeter of the square, rectangle and parallelogram
The objectives related to perimeter of the geometric figures were examined in
1st, 5
th, 7
th and the 9
th questions in the procedural test.
8486889092949698
100
6th grade 7th grade 8th grade
PKT Scores
PKT Scores
Figure 4. 1 The PKT Scores of 6th
, 7th
and 8th
Grade Students
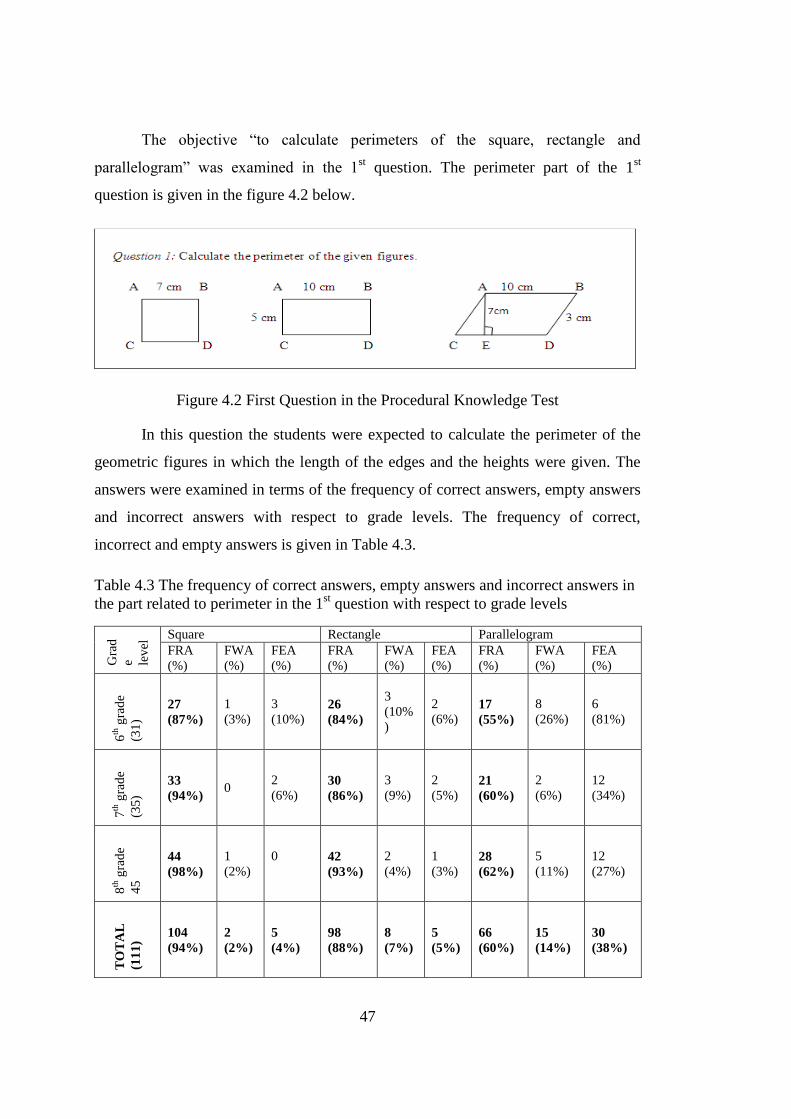
47
The objective “to calculate perimeters of the square, rectangle and
parallelogram” was examined in the 1st question. The perimeter part of the 1
st
question is given in the figure 4.2 below.
Figure 4.2 First Question in the Procedural Knowledge Test
In this question the students were expected to calculate the perimeter of the
geometric figures in which the length of the edges and the heights were given. The
answers were examined in terms of the frequency of correct answers, empty answers
and incorrect answers with respect to grade levels. The frequency of correct,
incorrect and empty answers is given in Table 4.3.
Table 4.3 The frequency of correct answers, empty answers and incorrect answers in
the part related to perimeter in the 1st question with respect to grade levels
Gra
d
e lev
el Square Rectangle Parallelogram
FRA
(%)
FWA
(%)
FEA
(%)
FRA
(%)
FWA
(%)
FEA
(%)
FRA
(%)
FWA
(%)
FEA
(%)
6th
gra
de
(31
)
27
(87%)
1
(3%)
3
(10%) 26
(84%)
3
(10%
)
2
(6%) 17
(55%)
8
(26%)
6
(81%)
7th
gra
de
(35
)
33
(94%) 0
2
(6%) 30
(86%)
3
(9%)
2
(5%) 21
(60%)
2
(6%)
12
(34%)
8th
gra
de
45
44
(98%)
1
(2%)
0
42
(93%)
2
(4%)
1
(3%) 28
(62%)
5
(11%)
12
(27%)
TO
TA
L
(11
1)
104
(94%)
2
(2%)
5
(4%)
98
(88%)
8
(7%)
5
(5%)
66
(60%)
15
(14%)
30
(38%)

48
FWA: Frequency of wrong answers
FRA: Frequency of right answers
FEA: Frequency of empty answers
According to the above table, large majority of the students gave correct
answer for the square and rectangle part of this question. The most successful group
was 8th
grade students and the 7th
grade students followed them. Sixth grade students
had lower performance than the 7th
and 8th
grade students although the success rate of
all grade levels were close to one another.
The analysis showed that students from all grade levels had lower
performance in finding the perimeter of the parallelogram. Most of the students did
not give any answers for parallelogram part noted that they forgot the perimeter
formula of parallelogram.
The objective “to calculate perimeters of the square whose area was given”
was examined in the 7th
question. The 7th
question is given in the figure 4.2.1.2
below.
Figure 4.3: Seventh Question in the PKT
In the 7th
question, students were expected to find the length of the one side of
the square and then calculate the area of the square. For this question, the answers
were analyzed in terms of the frequency of correct answer, incorrect answers, and
empty answers with respect to the grade levels. The frequency of correct, incorrect,
and empty answers is given in Table 4.4.

49
Table 4.4: The frequency of correct answers, empty answers and incorrect answers in
the 7thquestion with respect to grade levels
Grade level The frequency of
right answers (%)
The frequency of
wrong answers (%)
The frequency of
empty answers
(%)
6th
grade (31) 10 (32%) 19 (61%) 2 (7%)
7th
grade (35) 21(60%) 6(17%) 8(23%)
8th
grade (45) 35(78%) 6(13%) 4(9%)
Total (111) 66(59%) 31(28%) 14(13%)
According to the table, it was investigated that only about half of the students
gave correct answers for this question. It was seen that 8th
grade students performed
higher than the 6th
and 7th
grade students in this task. The lowest performance was
seen in 6th
grade students. Only less than 50% of the 6th
grade students gave correct
answers. Moreover, it was seen that 7th
grade students gave more empty answers
compared to the 6th
and 8th
grade students.
When the most common errors were analyzed, it was seen that there was no
problem in calculating the perimeter of the square. However, students had difficulty
when they calculated the length of the one edge of the square whose area was given.
It was seen that most students tended to divide the area of the square into four or two
to find the length of the edge of the square. This showed that in this type of question,
most common errors were resulted from this reason. The frequency of the most
common incorrect answer for this question is in Table 4.5.
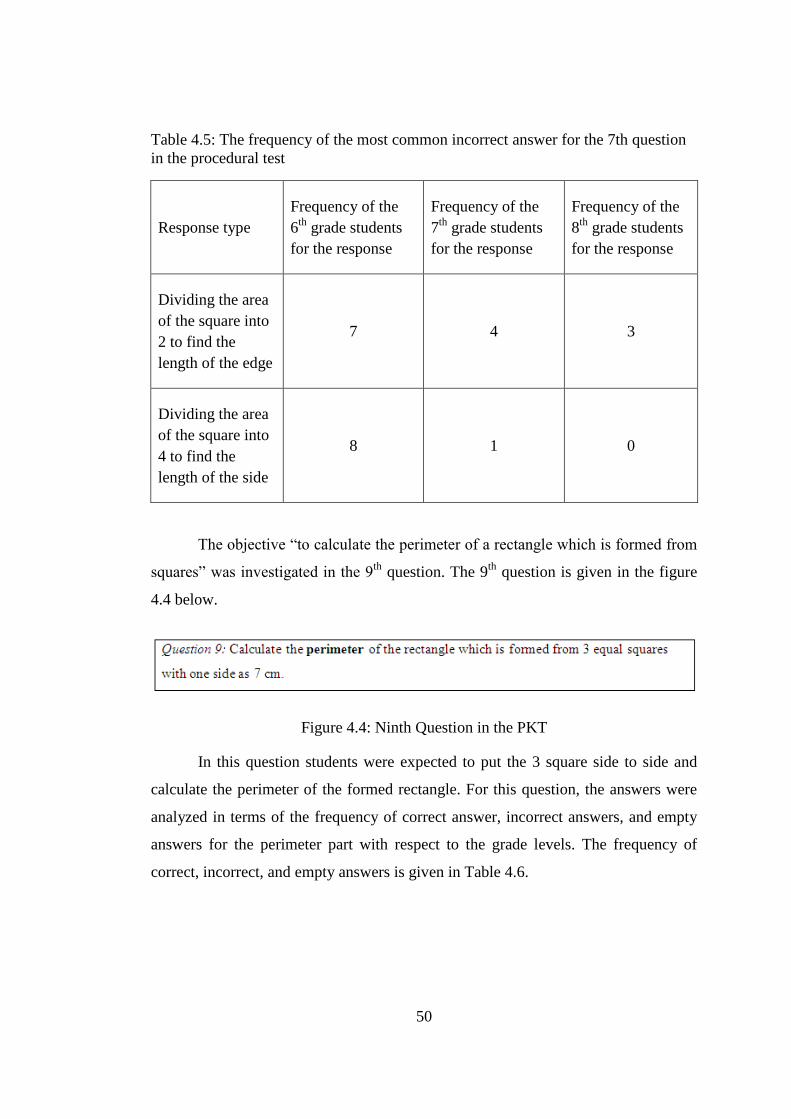
50
Table 4.5: The frequency of the most common incorrect answer for the 7th question
in the procedural test
Response type
Frequency of the
6th
grade students
for the response
Frequency of the
7th
grade students
for the response
Frequency of the
8th
grade students
for the response
Dividing the area
of the square into
2 to find the
length of the edge
7 4 3
Dividing the area
of the square into
4 to find the
length of the side
8 1 0
The objective “to calculate the perimeter of a rectangle which is formed from
squares” was investigated in the 9th
question. The 9th
question is given in the figure
4.4 below.
Figure 4.4: Ninth Question in the PKT
In this question students were expected to put the 3 square side to side and
calculate the perimeter of the formed rectangle. For this question, the answers were
analyzed in terms of the frequency of correct answer, incorrect answers, and empty
answers for the perimeter part with respect to the grade levels. The frequency of
correct, incorrect, and empty answers is given in Table 4.6.

51
Table 4.6: The frequency of correct answers, empty answers and incorrect answers in
the part related to perimeter of the rectangle in the 9th
question with respect to grade
levels.
Grade level The frequency of
right answers (%)
The frequency of
wrong answers (%)
The frequency of
empty answers
(%)
6th
grade (31) 22 (71%) 8(26%) 1 (3%)
7th
grade (35) 22(63%) 5(14%) 8(23%)
8th
grade (45) 26(58%) 15(33%) 4(9%)
Total (111) 70(63%) 28(25%) 13(12%)
According to the table, about 63% of the students gave correct answers for
the question. It was investigated that the most successful group was 6th
grade
students and the 7th
grade students followed them. Eighth grade students had lower
performance with respect to the 6th
and 7th
grade students. When the incorrect
answers were examined, it was seen that two students from 6th
grade and three
students from 8th
grade tended to calculate the perimeter of three squares separately.
4.1.3.2. Perimeter of the irregular figures
The objective “to calculate the perimeter of irregular shapes” was
investigated in the 5th
question. The 5th
question is given in the figure 4.5 below.

52
Figure 4.5: Fifth Question in the PKT
In the 5th
question in the procedural test, the students were expected to find
the other edges by the help of given edges and then calculate the perimeter of the
polygon. The answers were analyzed in terms of the correct, incorrect, and empty
answers. The frequency of the correct, incorrect, and empty answers is given in table
4.7 below.
Table 4.7: The frequency of correct answers, empty answers and incorrect answers in
the 5th question with respect to grade levels
Grade level The frequency of
right answers (%)
The frequency of
wrong answers (%)
The frequency of
empty answers
(%)
6th
grade (31) 16(52%) 12(39%) 3(9%)
7th
grade (35) 17(49%) 8(23%) 10(28%)
8th
grade (45) 28(62%) 10(22%) 7(16%)
Total (111) 61(55%) 30(27%) 20(18%)
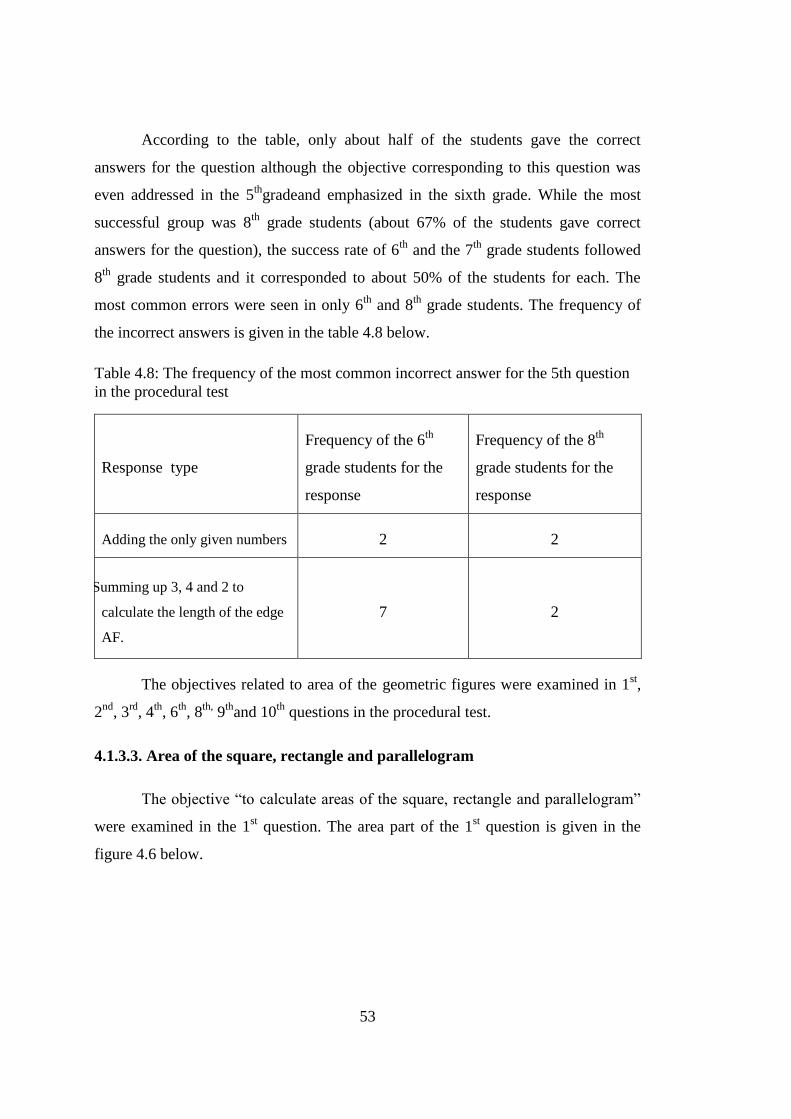
53
According to the table, only about half of the students gave the correct
answers for the question although the objective corresponding to this question was
even addressed in the 5th
gradeand emphasized in the sixth grade. While the most
successful group was 8th
grade students (about 67% of the students gave correct
answers for the question), the success rate of 6th
and the 7th
grade students followed
8th
grade students and it corresponded to about 50% of the students for each. The
most common errors were seen in only 6th
and 8th
grade students. The frequency of
the incorrect answers is given in the table 4.8 below.
Table 4.8: The frequency of the most common incorrect answer for the 5th question
in the procedural test
Response type
Frequency of the 6th
grade students for the
response
Frequency of the 8th
grade students for the
response
Adding the only given numbers 2 2
Summing up 3, 4 and 2 to
calculate the length of the edge
AF.
7 2
The objectives related to area of the geometric figures were examined in 1st,
2nd
, 3rd
, 4th
, 6th
, 8th,
9th
and 10th
questions in the procedural test.
4.1.3.3. Area of the square, rectangle and parallelogram
The objective “to calculate areas of the square, rectangle and parallelogram”
were examined in the 1st question. The area part of the 1
st question is given in the
figure 4.6 below.

54
Figure 4.6: First Question in the PKT (Area Part)
In this question students were expected to calculate the area of the geometric
figures in which the length of the sides and the heights were given. The answers were
examined in terms of the frequency of correct answers, empty answers and incorrect
answers with respect to grade levels. The frequency of correct, incorrect and empty
answers is given in Table 4.9.
Table 4.9: The frequency of correct answers, empty answers and incorrect answers in
the part related to area in the 1th question with respect to grade levels
Grade
level
Square Rectangle Parallelogram
FRA
(%)
FWA
(%)
FEA
(%)
FRA
(%)
FWA
(%)
FEA
(%)
FRA
(%)
FWA
(%)
FEA
(%)
6th
grade
(31)
20
(65%) 9 2
20
(65%) 9 2
14
(45%) 11 6
7th
grade
(35)
29
(83%) 4 2
29
(83%) 2 4
13
(37%) 6 16
8thgrade
45
42
(93%) 2 1
42
(93%) 2 1
34
(76%) 12 22
TOTAL
(111)
91
(82%)
15
(14%) 5
91
(82%)
13
(12%) 7
61
(55%)
29
(26%) 44
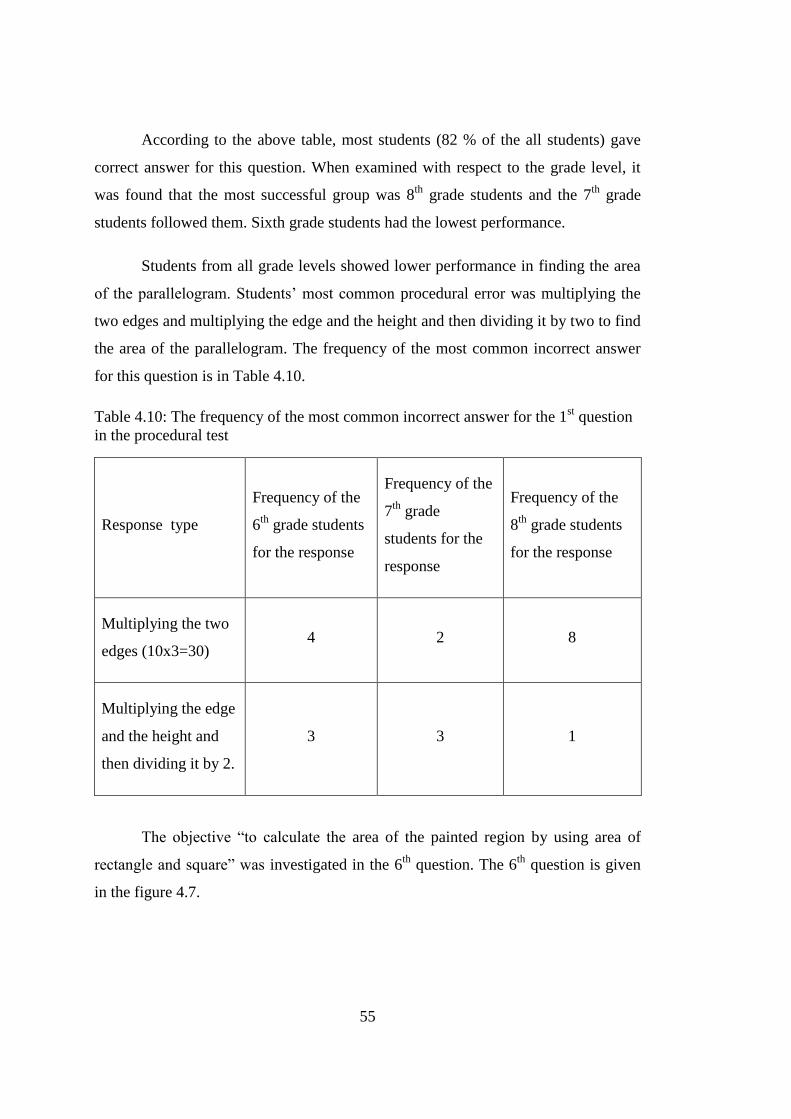
55
According to the above table, most students (82 % of the all students) gave
correct answer for this question. When examined with respect to the grade level, it
was found that the most successful group was 8th
grade students and the 7th
grade
students followed them. Sixth grade students had the lowest performance.
Students from all grade levels showed lower performance in finding the area
of the parallelogram. Students’ most common procedural error was multiplying the
two edges and multiplying the edge and the height and then dividing it by two to find
the area of the parallelogram. The frequency of the most common incorrect answer
for this question is in Table 4.10.
Table 4.10: The frequency of the most common incorrect answer for the 1st question
in the procedural test
Response type
Frequency of the
6th
grade students
for the response
Frequency of the
7th
grade
students for the
response
Frequency of the
8th
grade students
for the response
Multiplying the two
edges (10x3=30) 4 2 8
Multiplying the edge
and the height and
then dividing it by 2.
3 3 1
The objective “to calculate the area of the painted region by using area of
rectangle and square” was investigated in the 6th
question. The 6th
question is given
in the figure 4.7.

56
Figure 4.7: Sixth Question in the PKT
In this question, students were expected to calculate the painted area by
subtracting the area of squares from the area of rectangle. The answers were
examined in terms of the frequency of correct answers, empty answers and incorrect
answers for both with respect to grade levels. The frequency of correct, incorrect,
and empty answers is given in Table 4.11.
Table 4.11: The frequency of correct answers, empty answers and incorrect answers
in the 6th question in the procedural test with respect to grade levels
Grade level The frequency of
right answers (%)
The frequency of
wrong answers (%)
The frequency of
empty answers
(%)
6th
grade (31) 11(35%) 16(%) 4(%)
7th
grade (35) 17(49%) 10(%) 8(%)
8th
grade (45) 30(67%) 4(%) 11(%)
Total (111) 58(52%) 30(%) 23(%)

57
According to the table, almost only half of the students gave correct answers
for the question. However, some of these students could calculate the area of the
rectangle or the squares but they could not complete the answer. The frequency of
the correct and the incorrect answers for squares and rectangle separately with
respect to the grade levels is given in the table 4.12.
Table 4.12: The frequency of correct answers and incorrect answers in the 6th
question for squares and rectangles separately in the procedural test with respect to
grade levels
Grade level
The frequency of the
correct answers
The frequency of the in
correct answers
Squares Rectangle Squares Rectangle
6th
grade ( 31) 12(39%) 19(61%) 15 8
7th
grade (35) 18(51%) 20(57%) 9 7
8th
grade (45) 30(67%) 30(67%) 4 4
Total 60(54%) 69(62%) 28 19
According to the table the rate of the students who could only the area of the
rectangle is more than the rate of the students who could find only the area of the
squares. It was investigated that although there are four squares in the rectangle some
students calculated the area for only one square.
The objective “to calculate the area of the rectangle whose perimeter and
length of the one of the edges are given” was examined in the 8th
question. The 8th
question is given in the figure 4.8 below.

58
Figure 4.8: Eighth Question in PKT
In this question, students were expected to find the length of the unknown
edge of the rectangle and then calculate the area of the rectangle. The responses were
examined in terms of the frequency of correct answers, empty answers and incorrect
answers for each grade level. The frequency of correct, incorrect and empty answers
is given in Table 4.13.
Table 4.13: The frequency of correct answers, empty answers and incorrect answers
in the 8thquestion with respect to grade levels
Grade level The frequency of
right answers (%)
The frequency of
wrong answers (%)
The frequency of
empty answers (%)
6th
grade (31) 17(55%) 11(36%) 3(9%)
7th
grade (35) 23(66%) 5(14%) 7(20%)
8th
grade (45) 32(71%) 7(16%) 6(13%)
Total (111) 72(65%) 23(21%) 16(14%)
According to the table, it was examined that 65% of the students gave correct
answers for the questions. As the most successful group was 8th
grade students, 6th
grade students had the lowest performance in this question. When the errors were
examined, it was seen that four students from 6th
grade and one student from 8th
grade

59
divided the perimeter of the rectangle into four to find the length of the other edge as
the square. Moreover, one 6th
grade student and four 8th
grade students had errors in
arithmetic procedures.
The objective “to calculate the area of a rectangle which is formed from three
squares” was investigated in the 9th
question. The 9th
question is given in the figure
4.9 below.
Figure 4.9: Ninth Question in the PKT (Area Part)
In this question students were expected to put the 3 square side to side and
calculate the area of the formed rectangle. For this question, the answers were
analyzed in terms of the frequency of correct answer, incorrect answers, and empty
answers for the area part with respect to the grade levels. The frequency of correct,
incorrect, and empty answers is given in Table 4.14.
Table 4.14: The frequency of correct answers, empty answers and incorrect answers
in the part related to area of the rectangle in the 9th
question with respect to grade
levels
Grade level The frequency of
right answers (%)
The frequency of
wrong answers (%)
The frequency of
empty answers (%)
6th
grade (31) 16(52%) 3(10%) 12(38%)
7th
grade (35) 22(63%) 5(14%) 8(23%)
8th
grade (45) 34(76%) 9(20%) 2(4%)
Total (111) 72(65%) 17(15%) 22(20%)

60
According to the table, 65% of the students gave correct answers for the
question. It was investigated that this rate was very close to the rate related to the
perimeter part (63%) for the same question. The most successful group was 8th
grade
students while the 6th
grade students had the lowest performance. The number of the
students who gave empty answers was more than the number of students who gave
incorrect answers. However, it was seen that three students from 6th
grade and two
students from 8th
grade calculated the area of only one square.
The objective “to calculate the other height of parallelogram by the help of its
area” was investigated in the 10th
question. The 10th
question is given figure 4.10
below.
Figure 4.10: Tenth Question in the PKT
In this question, students were expected to calculate the length of the other
height of the parallelogram by the help of its area. For this question, the answers
were analyzed in terms of the frequency of correct answer, incorrect answers, and
empty answers with respect to the grade levels. The frequency of correct, incorrect,
and empty answers is given in Table 4.15.

61
Table 4.15: The frequency of correct answers, empty answers and incorrect answers
in the 10thquestion with respect to grade levels
Grade level The frequency of
right answers (%)
The frequency of
wrong answers (%)
The frequency of
empty answers (%)
6th
grade (31) 5(16%) 17(55%) 9(29%)
7th
grade (35) 10(29%) 9(26%) 16(45%)
8th
grade (45) 4(9%) 8(18%) 33(77%)
Total (111) 19(17%) 34(31%) 58 (52%)
According to the table, it was investigated that only 17% of the students gave
correct answers and about half of them gave empty answers for this question. The
most successful group was the 7th
grade students and the 6th
grade students followed
them. However, only 9% of the 8th
grade students gave correct answers for the
question. The objective related to that question was in the 6th
and 7th
grade
curriculum. Therefore, 8th
grade students might have forgotten the procedures.
When the most common errors were examined it was investigated that the
errors were changed among grade levels. For example, one6th
grade student
multiplied the two edges of the parallelogram to find its area. Three students added
the given numbers without any rationale. One student from 6th
grade and one student
from 8th
grade claimed that the length of [AK] must be equal to the length of the
other height. Moreover, six students from 8th
grade tried to find the required height
with Pythagorean Theorem.
The objective “to calculate the area of the acute, obtuse-angled and right-
angled triangles whose side and the height belong to given side” was examined in the
3rd
question. The 3rd
question is given figure 4.11 below.

62
Figure 4.11: Third Question in the PKT
In this question students were expected to calculate the area of the rectangles
by multiplying the length of the side and the length of the height and then dividing it
by two. The answers were analyzed in terms of the frequency of correct, incorrect,
empty answers and most common error. The frequency of correct, incorrect, empty
answers is given table 4.16.
Table 4.16: The frequency of correct answers, empty answers and incorrect answers
in the 3rd
question with respect to grade levels
Grade level
Acute triangle Right triangle Obtuse triangle
FRA
(%)
FWA FEA FRA
(%)
FWA FEA FRA
(%)
FWA FEA
6th
grade
(31)
17
(55%) 9 5
15
(35%) 11 5
11
(35%) 12 8
7th
grade
(35)
15
(43%) 13 7
13
(37%) 15 7
10
(29%) 16 9
8th
grade
(45)
30
(67%) 11 4
29
(64%) 12 4
18
(40%) 13 14
Total (111) 62
(57%) 33 16
57
(51%) 38 16
39
(35%) 41 31
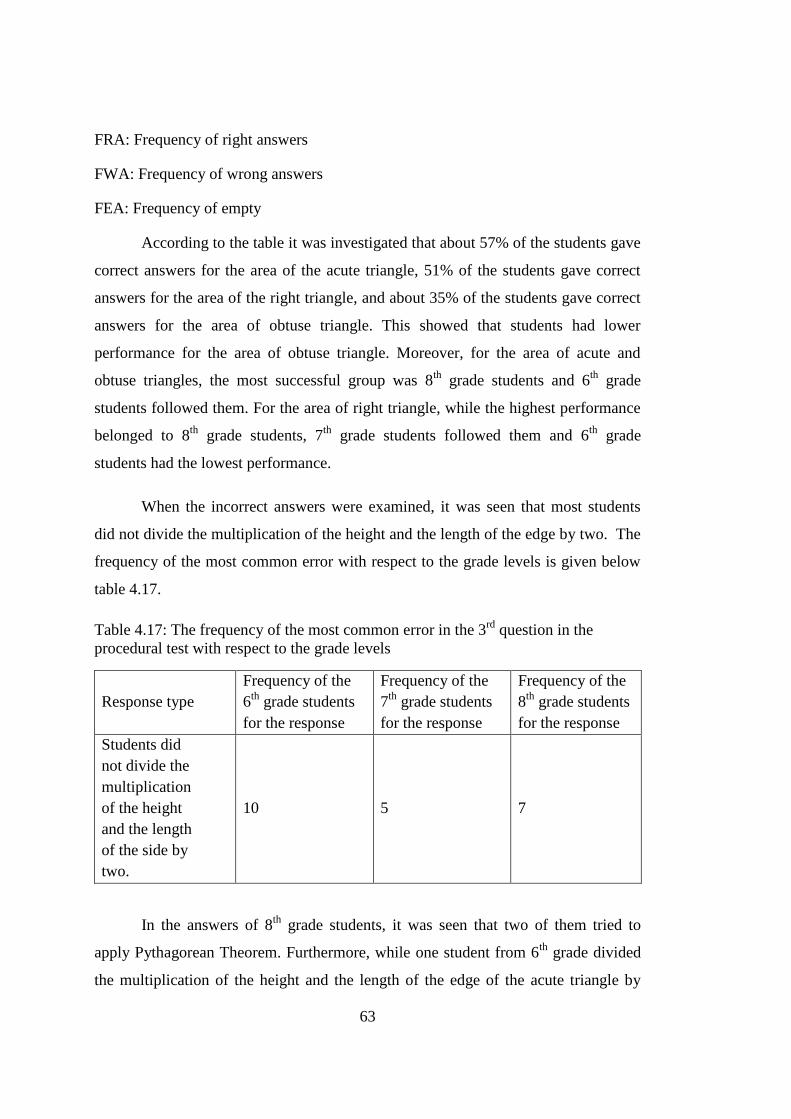
63
FRA: Frequency of right answers
FWA: Frequency of wrong answers
FEA: Frequency of empty
According to the table it was investigated that about 57% of the students gave
correct answers for the area of the acute triangle, 51% of the students gave correct
answers for the area of the right triangle, and about 35% of the students gave correct
answers for the area of obtuse triangle. This showed that students had lower
performance for the area of obtuse triangle. Moreover, for the area of acute and
obtuse triangles, the most successful group was 8th
grade students and 6th
grade
students followed them. For the area of right triangle, while the highest performance
belonged to 8th
grade students, 7th
grade students followed them and 6th
grade
students had the lowest performance.
When the incorrect answers were examined, it was seen that most students
did not divide the multiplication of the height and the length of the edge by two. The
frequency of the most common error with respect to the grade levels is given below
table 4.17.
Table 4.17: The frequency of the most common error in the 3rd
question in the
procedural test with respect to the grade levels
Response type
Frequency of the
6th
grade students
for the response
Frequency of the
7th
grade students
for the response
Frequency of the
8th
grade students
for the response
Students did
not divide the
multiplication
of the height
and the length
of the side by
two.
10 5 7
In the answers of 8th
grade students, it was seen that two of them tried to
apply Pythagorean Theorem. Furthermore, while one student from 6th
grade divided
the multiplication of the height and the length of the edge of the acute triangle by

64
two, he divided the multiplication of the height and the length of the side of the right
triangle by three and obtuse triangle by four.
The objective “to calculate the ratio of painted area to not painted area which
is formed by a rectangle and a triangle” was investigated in the 2nd
question in the
procedural test. The 2nd
question is given in the figure 4.12 below.
Figure 4.12: Second Question in the PKT
In this question students were expected to calculate the area of rectangle and
the triangle separately and then find the ration of painted area to not painted area.
The answers were analyzed in terms of the frequency of the correct, incorrect and
empty answers. The frequency of correct answers, empty answers and incorrect
answers is given table 4.18 below with respect to grade levels.
Table 4.18: The frequency of correct answers, empty answers and incorrect answers
in the 2ndquestion with respect to grade levels
Grade level The frequency of
right answers (%)
The frequency of
wrong answers (%)
The frequency of
empty answers (%)
6th
grade (31) 3(10%) 18 10
7th
grade (35) 3(9%) 16 16
8th
grade (45) 7(16%) 22 16
Total (111) 13(12%) 56(51%) 42(37%)

65
According to the table, it was seen that only 12% of the students gave correct
answers for the question. The success rate was very low with respect to the other
questions in the procedural test. Seventh grade students had the lowest performance.
The most successful group was 8th
grade students although their success rate was
also very low. However, when the incorrect answers were analyzed, it was examined
that most students calculated the ratio of area of triangle to the area of rectangle. The
frequency of that type of answers is given with respect to the grade level in table 4.19
below.
Table 4.19: The frequency of the most common incorrect answer for the 2th question
in the procedural test
Response type
Frequency of
the 6th
grade
students for
the response
Frequency of
the 7th
grade
students for
the response
Frequency of
the 8th
grade
students for
the response
Students calculated the ratio of the
area of the triangle to the
rectangle (not to the empty area)
therefore the ratio was found as
½.
5 9 11
Eleven students from 6th
grade, 10 students from 7th
grade and 14 students
from 8th
grade students were able to calculate the area of triangle correctly. Fifteen
students from 6th
grade, 12 students from 7th
grade and 14 students from 8th
grade
students were able to calculate the area of rectangle correctly. However, they did not
find the ratio.
4.1.3.4. Area of the polygon which is the combination of regular geometric
shapes
The objective “to calculate the area of a polygon which is combination of the
regular geometric shapes” was investigated in the 4th
question in the procedural test.
The 4th
question is given in the figure 4.13 below.

66
Figure 4.13: Fourth Question in PKT
In this question students were expected to calculate the area of rectangle,
square, and triangle and then sum up them. The answers were analyzed in terms of
the frequency of correct answers, empty answers and incorrect with respect to grade
levels. The frequency of the correct answers, empty answers and incorrect is given in
the table 4.20.
Table 4.20: The frequency of correct answers, empty answers and incorrect answers
in the 4th question with respect to grade levels
Grade level The frequency of
right answers (%)
The frequency of
wrong answers (%)
The frequency of
empty answers (%)
6th
grade (31) 8(26%) 14 9
7th
grade (35) 18(51%) 6 11
8th
grade (45) 26(58%) 10 9
Total (111) 52(47%) 30(27%) 29(26%)
67
According to the table, less than half of the students gave correct answers for
the question. While the 8th
grade students were most successful group, the success
rate of the 6th
grade students was very low although the related objective was in the
6th
grade program. When the errors were examined, one student from 7th
and 8th
grade and 5 students from 6th
grade tried to calculate the perimeter of the polygon
rather than the area. Moreover, it was seen that 3 eighth grade students did not
complete the answer since they could not find the area of triangle.
4.1.5. Summary of the results the perimeter concept in procedural knowledge
test
In the procedural test, the students’ procedural knowledge and most common
errors of perimeter of geometric figures were examined through different types of
questions.
In the question in which the side lengths of the figures were given, students
were wanted to calculate perimeter. In this type of questions most of the students
(about 94% of them) could give correct answers. However, it was examined that
students’ procedural knowledge was weak in calculating the perimeter of the
parallelogram. It was seen that most students who gave empty answers for the
parallelogram part said that “I forgot the formula of the perimeter of the
parallelogram.”
While the most successful group was 8th
grade students, the success rate of 6th
grade and 7th
grade students were close to each other. When students were asked to
calculate the perimeter of the square whose area was given, their success rate was
decreased. Especially 6th
grade students had very low performance compared to the
7th
and 8th
grade students while the success rate of 7th
and 8th
grade students was
close to each other. However, when the errors were examined, it was seen that the
procedural error was related to finding the length of the side of the square rather than
calculating the perimeter of the square.
In the question where students were asked to calculate the perimeter of the
rectangle which was formed from squares, 6th
grade students were more successful

68
than the 7th
and 8th
grade students. Seventh grade students followed 6th
grade
students. It was investigated that 8th
grade students had the lowest performance.
Finally, when students were required to calculate the perimeter of an irregular
shape, only about half of the students gave correct answers. While the most
successful group was 8th
grade students, 6th
grade students were the second most
successful group. Seventh grade students had the lowest performance. However, the
success rate of 6th
grade and 7th
grade students were close to each other.
4.1.6. Summary of the results about the area concept in the procedural test
When the procedural test results were examined in terms of the area concept,
it was analyzed that students had strong procedural knowledge in the area questions
in which the edges and the heights of the regular geometric shapes were given
directly. However, they had difficulty in calculating the area of parallelograms and
obtuse-angled triangle. Furthermore, it was realized that most students had problems
with the heights of these geometric figures therefore; the conception of height might
have led procedurally wrong steps. In addition to these, it was analyzed that in
questions which include parallelograms and triangles, 6th
grade students had higher
procedural performance than 7th
grade and 8th
grade students when compared to the
other type of questions.
Students had low performance in questions in which the geometric shapes
were given as a combination of different known shapes (such as questions 2 and 4).
The figures might seem considerably confusing especially for the 6th
grade students.
However, in question 2, since the right answer was related to the ratio concept,
students might have problem with the ratio rather than area.
Finally, in questions where the area of rectangle whose one side and the
perimeter were given was asked, students had difficulty to find the other length of the
edge. The same problem occurred in questions in which it was asked to find the
perimeter of the square whose area was given. Therefore, students had problems to
calculate the length of the side of the rectangle or square whose area or perimeter
was given.
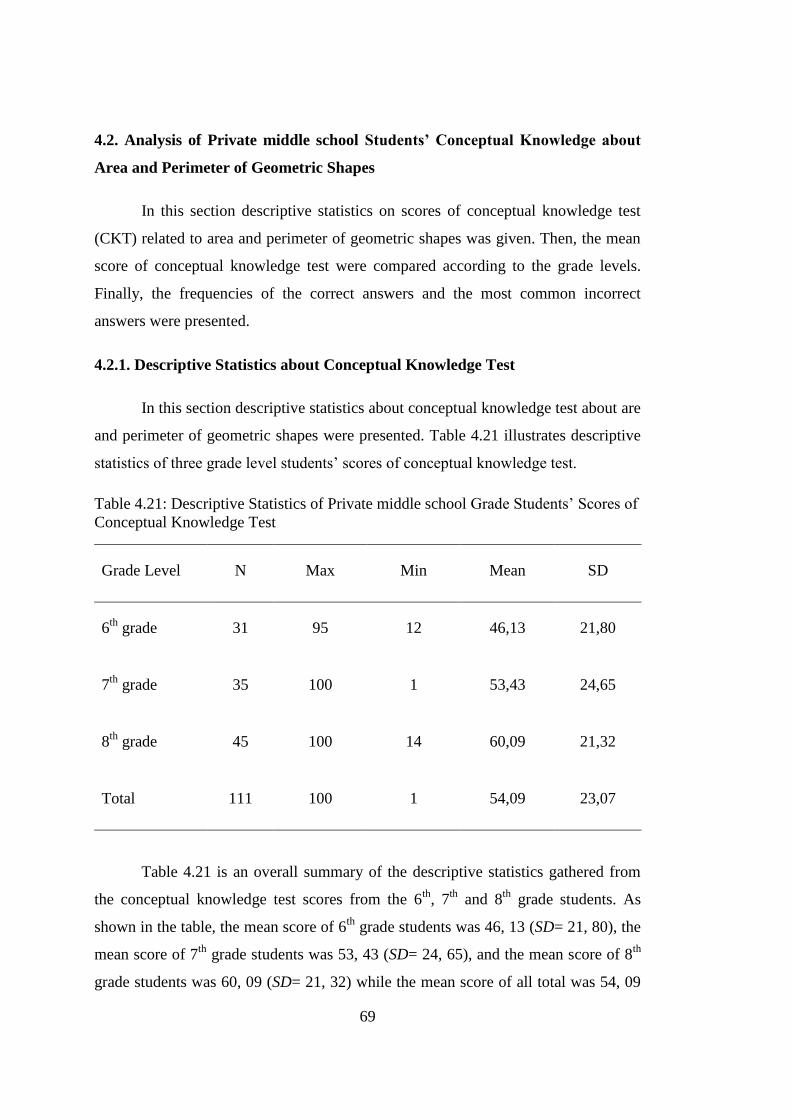
69
4.2. Analysis of Private middle school Students’ Conceptual Knowledge about
Area and Perimeter of Geometric Shapes
In this section descriptive statistics on scores of conceptual knowledge test
(CKT) related to area and perimeter of geometric shapes was given. Then, the mean
score of conceptual knowledge test were compared according to the grade levels.
Finally, the frequencies of the correct answers and the most common incorrect
answers were presented.
4.2.1. Descriptive Statistics about Conceptual Knowledge Test
In this section descriptive statistics about conceptual knowledge test about are
and perimeter of geometric shapes were presented. Table 4.21 illustrates descriptive
statistics of three grade level students’ scores of conceptual knowledge test.
Table 4.21: Descriptive Statistics of Private middle school Grade Students’ Scores of
Conceptual Knowledge Test
Grade Level N Max Min Mean SD
6th
grade 31 95 12 46,13 21,80
7th
grade 35 100 1 53,43 24,65
8th
grade 45 100 14 60,09 21,32
Total 111 100 1 54,09 23,07
Table 4.21 is an overall summary of the descriptive statistics gathered from
the conceptual knowledge test scores from the 6th
, 7th
and 8th
grade students. As
shown in the table, the mean score of 6th
grade students was 46, 13 (SD= 21, 80), the
mean score of 7th
grade students was 53, 43 (SD= 24, 65), and the mean score of 8th
grade students was 60, 09 (SD= 21, 32) while the mean score of all total was 54, 09
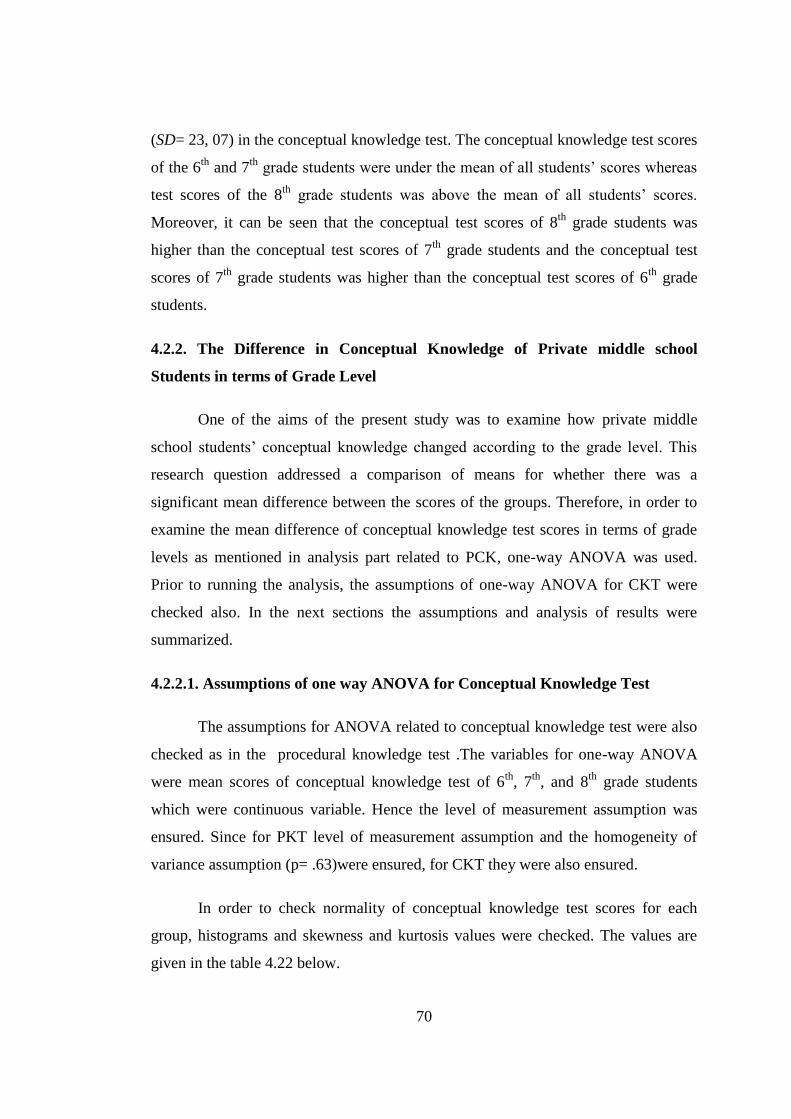
70
(SD= 23, 07) in the conceptual knowledge test. The conceptual knowledge test scores
of the 6th
and 7th
grade students were under the mean of all students’ scores whereas
test scores of the 8th
grade students was above the mean of all students’ scores.
Moreover, it can be seen that the conceptual test scores of 8th
grade students was
higher than the conceptual test scores of 7th
grade students and the conceptual test
scores of 7th
grade students was higher than the conceptual test scores of 6th
grade
students.
4.2.2. The Difference in Conceptual Knowledge of Private middle school
Students in terms of Grade Level
One of the aims of the present study was to examine how private middle
school students’ conceptual knowledge changed according to the grade level. This
research question addressed a comparison of means for whether there was a
significant mean difference between the scores of the groups. Therefore, in order to
examine the mean difference of conceptual knowledge test scores in terms of grade
levels as mentioned in analysis part related to PCK, one-way ANOVA was used.
Prior to running the analysis, the assumptions of one-way ANOVA for CKT were
checked also. In the next sections the assumptions and analysis of results were
summarized.
4.2.2.1. Assumptions of one way ANOVA for Conceptual Knowledge Test
The assumptions for ANOVA related to conceptual knowledge test were also
checked as in the procedural knowledge test .The variables for one-way ANOVA
were mean scores of conceptual knowledge test of 6th
, 7th
, and 8th
grade students
which were continuous variable. Hence the level of measurement assumption was
ensured. Since for PKT level of measurement assumption and the homogeneity of
variance assumption (p= .63)were ensured, for CKT they were also ensured.
In order to check normality of conceptual knowledge test scores for each
group, histograms and skewness and kurtosis values were checked. The values are
given in the table 4.22 below.
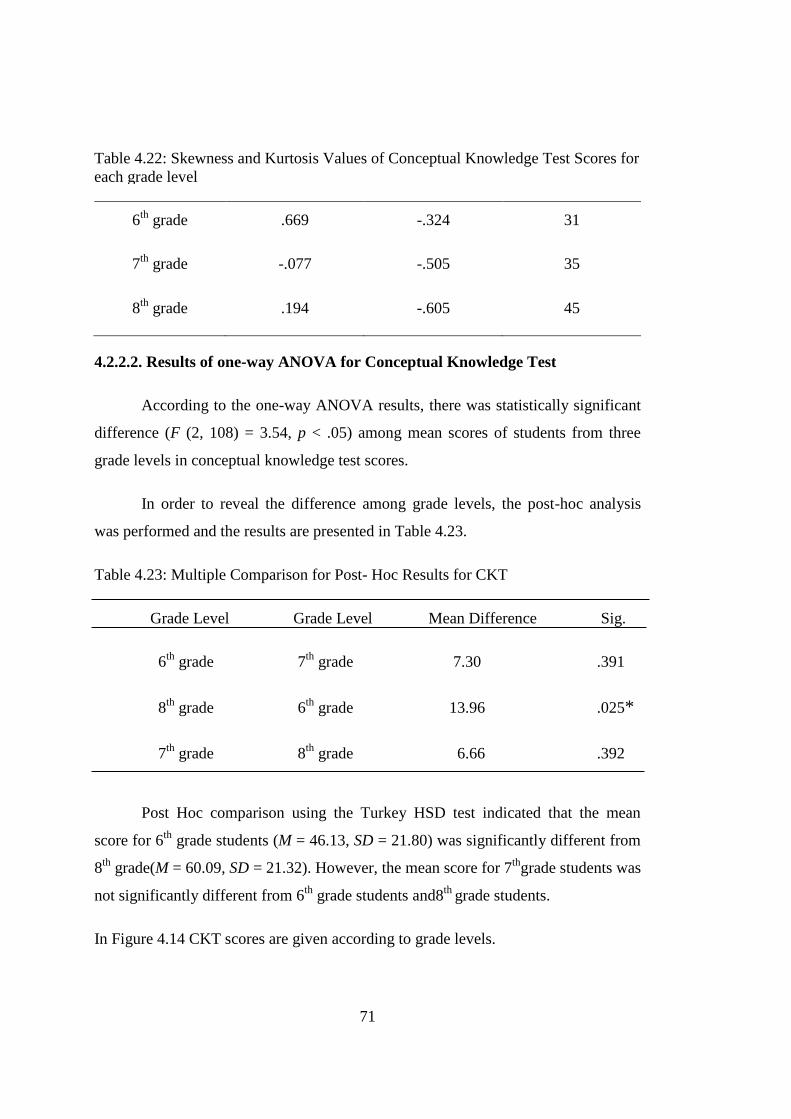
71
Grade level Skewness Kurtosis Number
6th
grade .669 -.324 31
7th
grade -.077 -.505 35
8th
grade .194 -.605 45
4.2.2.2. Results of one-way ANOVA for Conceptual Knowledge Test
According to the one-way ANOVA results, there was statistically significant
difference (F (2, 108) = 3.54, p < .05) among mean scores of students from three
grade levels in conceptual knowledge test scores.
In order to reveal the difference among grade levels, the post-hoc analysis
was performed and the results are presented in Table 4.23.
Table 4.23: Multiple Comparison for Post- Hoc Results for CKT
Grade Level Grade Level Mean Difference Sig.
6th
grade 7th
grade 7.30 .391
8th
grade 6th
grade 13.96 .025*
7th
grade 8th
grade 6.66 .392
Post Hoc comparison using the Turkey HSD test indicated that the mean
score for 6th
grade students (M = 46.13, SD = 21.80) was significantly different from
8th
grade(M = 60.09, SD = 21.32). However, the mean score for 7th
grade students was
not significantly different from 6th
grade students and8th
grade students.
In Figure 4.14 CKT scores are given according to grade levels.
Table 4.22: Skewness and Kurtosis Values of Conceptual Knowledge Test Scores for
each grade level

72
Figure 4.14: The CKT scores of 6th
, 7th
and 8th
grade students
As can be seen from the above figure, the mean score of 8th
grade students
was significantly higher than the mean score of 6th
grade students. The mean score of
7th
grade students was close to 6th
grade students’ and 8th
grade students’ mean
scores.
The effect size, eta square value, was calculated by dividing the sum of
squares between groups by the total sum of squares (Pallant, 2007). Eta squared was
found as .06which corresponded to a small effect Cohen (1988). Therefore, only 6%
of the variance in the CKT was explained by the grade level in this study.
4.2.3. The Analysis of the Correct, Incorrect and Empty Answers and Most
Common Errors in the Conceptual Knowledge Test
As in the procedural test results, in this part the questions were analyzed by
categorizing them as the area of irregular shapes (questions 1 and 9), surface area
(questions 2 and 3) and area and perimeter of regular shapes (questions 4, 5, 6, 7, 8
and 10).
4.2.3.1. Area of Irregular Geometric Shapes
The objective “compare the area of given irregular geometric shapes” was
evaluated in the 1st question and the objective “to predict the area of an irregular
geometric shape” was evaluated in the 9th
question in the conceptual test. The 1st and
9th
questions are given in Figure 4.15.
0
20
40
60
80
6th grade 7th grade 8th grade
CKT Scores
CKT Scores
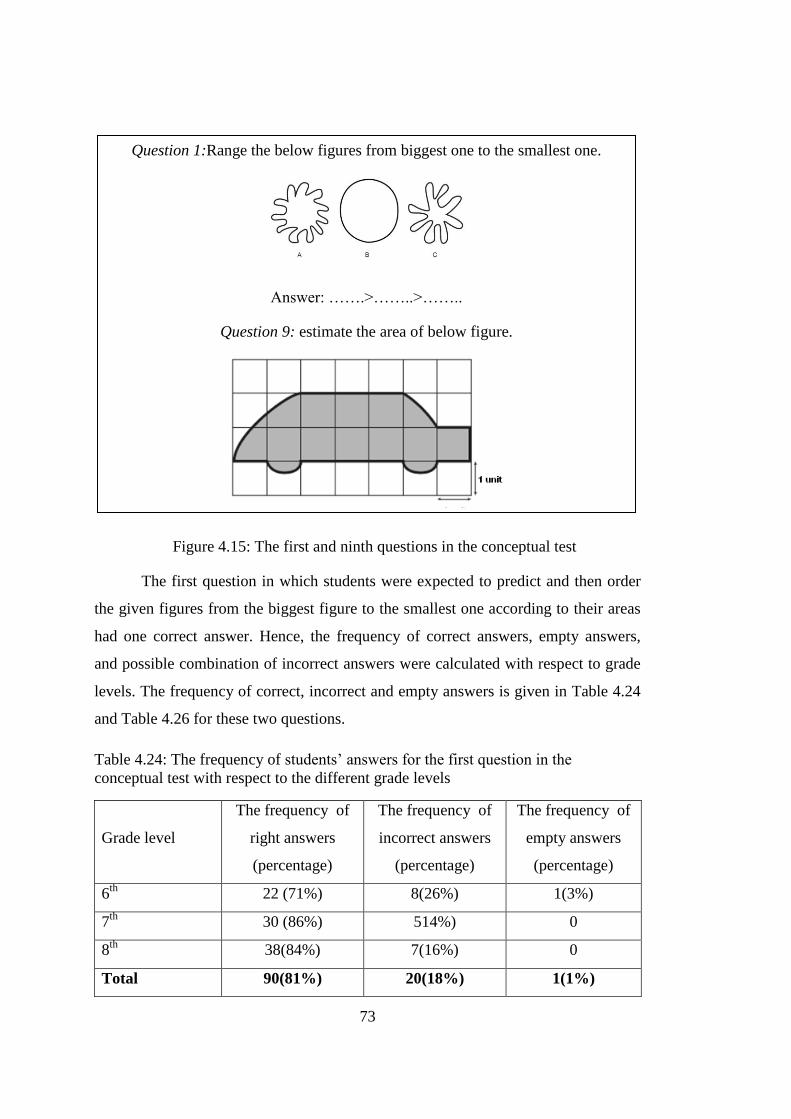
73
The first question in which students were expected to predict and then order
the given figures from the biggest figure to the smallest one according to their areas
had one correct answer. Hence, the frequency of correct answers, empty answers,
and possible combination of incorrect answers were calculated with respect to grade
levels. The frequency of correct, incorrect and empty answers is given in Table 4.24
and Table 4.26 for these two questions.
Table 4.24: The frequency of students’ answers for the first question in the
conceptual test with respect to the different grade levels
Grade level
The frequency of
right answers
(percentage)
The frequency of
incorrect answers
(percentage)
The frequency of
empty answers
(percentage)
6th
22 (71%) 8(26%) 1(3%)
7th
30 (86%) 514%) 0
8th
38(84%) 7(16%) 0
Total 90(81%) 20(18%) 1(1%)
Question 1:Range the below figures from biggest one to the smallest one.
Answer: …….>……..>……..
Question 9: estimate the area of below figure.
Figure 4.15: The first and ninth questions in the conceptual test

74
According to the above table, it was examined that 81% of the students gave
the correct answer for this question. However, with respect to the grade levels, the
most successful group was 7th
grade students and the 8th
grade students followed
them. Sixth grade students had lower performance compared to the 7th
and 8th
grade
students.
When the most common incorrect answers were examined, it was seen that
the most common answer was “A>C>B”. The frequency of the most common
incorrect answer for this question is in Table 4.25.
Table 4.25: The frequency of the most common incorrect answer for the 9th
question
in the conceptual test
Response type
Frequency of the
6th
grade students
for the response
Frequency of the
7th
grade students
for the response
Frequency of the
8th
grade students
for the response
A > C > B 5 4 2
Similarly, in the 9th
question students were expected to predict the given area.
However, this time the area was given on the squared paper. For this question, the
answer was 11, 5 units square. Hence, there were two alternative answers. The
answers“11 and 12 unit squares” were accepted as the correct answer and the others
were incorrect. The frequencies of correct, incorrect, and empty answers are given in
Table 4.26.
Table 4.26: The frequency of students’ answers for the ninth question in the
conceptual test with respect to the different grade levels
Grade level The frequency of
correct answers
(percentage)
The frequency of
incorrect answers
(percentage)
The frequency of
empty answers
(percentage)
6th
14(45%) 17 (65%) 0
7th
25(71%) 9(26%) 1(3%)
8th
37(82%) 6(13%) 2(5%)
Total 76(69%) 32(29%) 3(2%)

75
According to the above table,69% of the all students gave correct answer for
this question. When examined with respect to the grade level, it was found that 6th
grade students’ performance were lower than the 7th
and 8th
grade students’
performance. Moreover, 6th
grade students who gave correct answer for this question
were less than the 50% of the all 6th
grade students.
To sum up, 7th
and 8th
grade students performed better than the 6th
grade
students in tasks including predicting and the comparing the area of geometric
figures although related objectives were in the 6th
grade program.
4.2.3.2. Surface Area
The objective “to decide how surface area of a structure consisted of unit
cubes change when one of the stated unit cube taken away” was evaluated in the2nd
question in the conceptual knowledge test. The 2nd
question is given in Figure 4.16
below:
Question 2: Which cube should be taken away from the below structure so that the
surface area of the structure will not change? Why?
Answer:…………….
Because: ……………………………………
………………………………………………
Figure 4.16: The 2nd
question in the conceptual test
In the 2nd
question in the conceptual test, students were expected to choose
one of the cubes and explain the reasoning for their answer. Students’ answers were
analyzed in terms of the frequency of correct answer, explanation of the correct
answer, the possible combination of incorrect answers, and empty answers with
respect to the grade levels. The frequency of correct, incorrect, and empty answers is
given in Table 4.27.
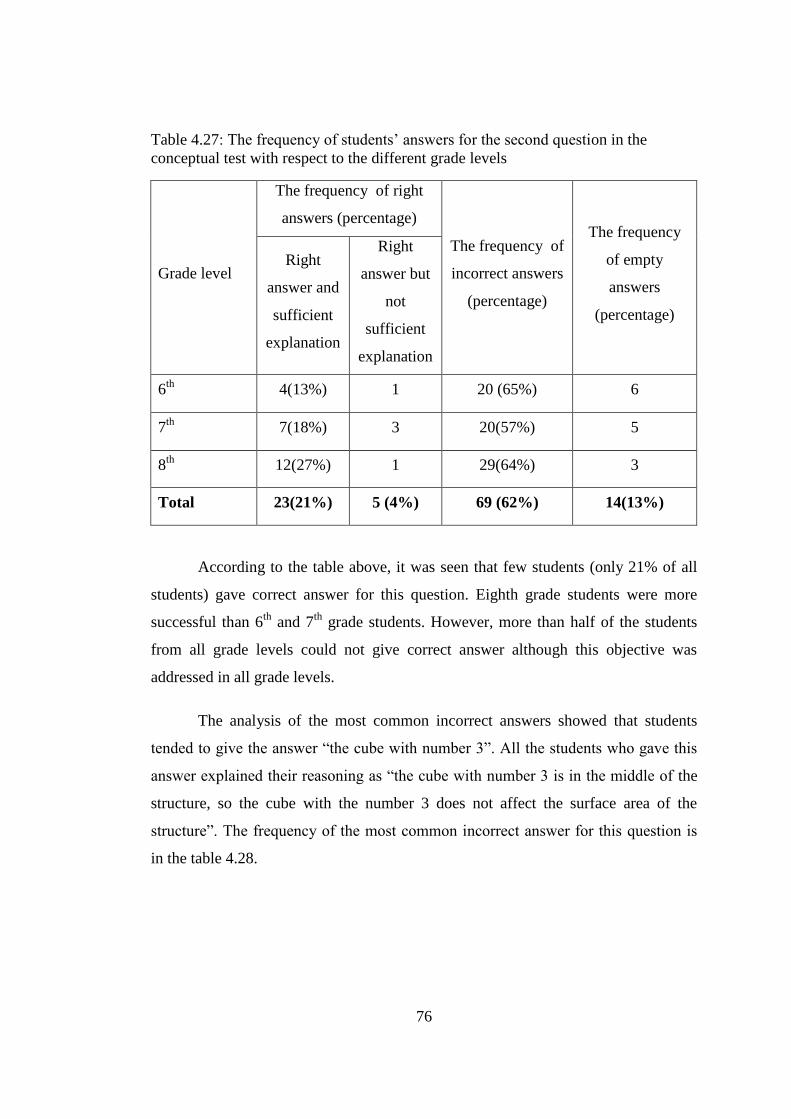
76
Table 4.27: The frequency of students’ answers for the second question in the
conceptual test with respect to the different grade levels
Grade level
The frequency of right
answers (percentage)
The frequency of
incorrect answers
(percentage)
The frequency
of empty
answers
(percentage)
Right
answer and
sufficient
explanation
Right
answer but
not
sufficient
explanation
6th
4(13%) 1 20 (65%) 6
7th
7(18%) 3 20(57%) 5
8th
12(27%) 1 29(64%) 3
Total 23(21%) 5 (4%) 69 (62%) 14(13%)
According to the table above, it was seen that few students (only 21% of all
students) gave correct answer for this question. Eighth grade students were more
successful than 6th
and 7th
grade students. However, more than half of the students
from all grade levels could not give correct answer although this objective was
addressed in all grade levels.
The analysis of the most common incorrect answers showed that students
tended to give the answer “the cube with number 3”. All the students who gave this
answer explained their reasoning as “the cube with number 3 is in the middle of the
structure, so the cube with the number 3 does not affect the surface area of the
structure”. The frequency of the most common incorrect answer for this question is
in the table 4.28.

77
Table 4.28: The frequency of the most common incorrect answer for the 2nd
question
in the conceptual test
Response type
Frequency of the
6th
grade students
for the response
Frequency of the
7th
grade students
for the response
Frequency of the
8th
grade students
for the response
Explanation: Cube
3. Because, cube 3
is in the middle so
it does not affect
the surface area.
15 12 24
Beside this most common incorrect response, eight of the 7th
grade students
and one of the 8th
grade students claimed that taking away all of the cubes change the
surface area of the structure since lack of a piece of surface affected the surface area.
The objective “to decide which kind of information will be used to cover a
given box” was evaluated in the 3rd
question. The 3rd
question is given in Figure 4.17
below:
Question 3: There is a present box below. It will be covered by present packet.
Which kind of information should be known to find the amount of packet?
A.The sum of the sides of
the box
Because;………………
…..
B.The surface area of the
box
Because;………………
…..
C.The volume of the box
Because:……………..
Figure 4.17: The 3rd
question in the conceptual test

78
In the 3rd
question in the conceptual test, the students were expected to choose
the correct answer and explain the reasoning for the answer. Students’ answers were
analyzed in terms of the frequency of correct answer, explanation of the correct
answer, the possible combination of incorrect answers, and empty answers with
respect to the grade levels. The frequency of correct, incorrect, and empty answers is
given in Table 4.29.
Table 4.29: The frequency of students’ answers for the third question in the
conceptual test with respect to the different grade levels
Grade level
The frequency of right
answers (percentage)
(choose surface area)
The frequency of
incorrect answers
(percentage)
The frequency
of empty
answers
(percentage) With right
explanation
No
explanation
Chose
sum up
the sides
Choose
volume
6th
19(61%) 1(3%) 5 5 1
7th
24(69%) 0 0 1 10
8th
32(71%) 1(2%) 7 4 1
Total 74 (67%) 2 (2%) 12(11%) 10(9%) 12(11%)
According to the above table, about 69% of the students gave correct answer
for the question. However, two of the students who gave the right answer could not
explain their reasoning. When examined according to the grade levels, more 8th
grade
students gave the right answer compared to the 6th
and 7th
grade students. It was seen
that the success rate of the 6th
grade students was almost close to the 7th
grade
students.
4.2.3.3. Area and Perimeter
The objective “to interpret the area and circumference of the figure which is
obtained by breaking the first figure into pieces and then bringing them together in a
different combination” was evaluated in the 4th
question. The 4th
question is given in
Figure 4.18 below:

79
Question 4: Examine the given table below. Then, answer the question above the
table.
Figure 1
SQUARE
Figure 2
The square is divided into
two equal pieces.
Figure 3
Then, one of the equal
pieces is divided into two
equal pieces as in the figure.
Figure 4
All pieces are brought
together.
What can be said for the perimeter of the new figure (figure 4)?
What can be said for the area of the new figure (figure 4)?
A. The perimeter of the
figure 4 is BIGGER
than the perimeter of
figure 1.
B. The perimeter of the
figure4 is SMALLER
than the perimeter of
figure 1.
C. The perimeter of the
figure 4 is EQUAL
to the perimeter of
figure 1.
A.The area of the figure
4 is BIGGER than the
area of figure 1.
B.The area of the figure
4 is SMALLER than the
area of figure 1.
C.The area of the figure
4 is EQUAL to the area
of figure 1.
Figure 4.18: The 4th
question in the conceptual knowledge test
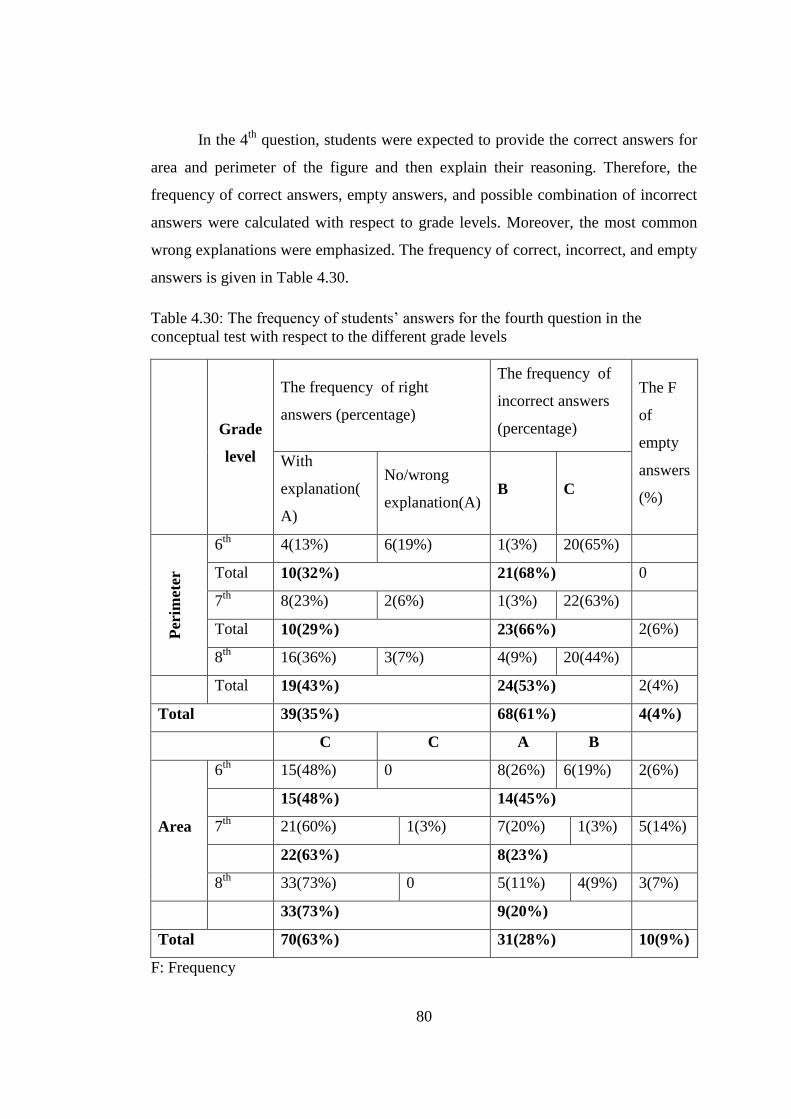
80
In the 4th
question, students were expected to provide the correct answers for
area and perimeter of the figure and then explain their reasoning. Therefore, the
frequency of correct answers, empty answers, and possible combination of incorrect
answers were calculated with respect to grade levels. Moreover, the most common
wrong explanations were emphasized. The frequency of correct, incorrect, and empty
answers is given in Table 4.30.
Table 4.30: The frequency of students’ answers for the fourth question in the
conceptual test with respect to the different grade levels
Grade
level
The frequency of right
answers (percentage)
The frequency of
incorrect answers
(percentage)
The F
of
empty
answers
(%)
With
explanation(
A)
No/wrong
explanation(A) B C
Per
imete
r
6th
4(13%) 6(19%) 1(3%) 20(65%)
Total 10(32%) 21(68%) 0
7th
8(23%) 2(6%) 1(3%) 22(63%)
Total 10(29%) 23(66%) 2(6%)
8th
16(36%) 3(7%) 4(9%) 20(44%)
Total 19(43%) 24(53%) 2(4%)
Total 39(35%) 68(61%) 4(4%)
C C A B
Area
6th
15(48%) 0 8(26%) 6(19%) 2(6%)
15(48%) 14(45%)
7th
21(60%) 1(3%) 7(20%) 1(3%) 5(14%)
22(63%) 8(23%)
8th
33(73%) 0 5(11%) 4(9%) 3(7%)
33(73%) 9(20%)
Total 70(63%) 31(28%) 10(9%)
F: Frequency
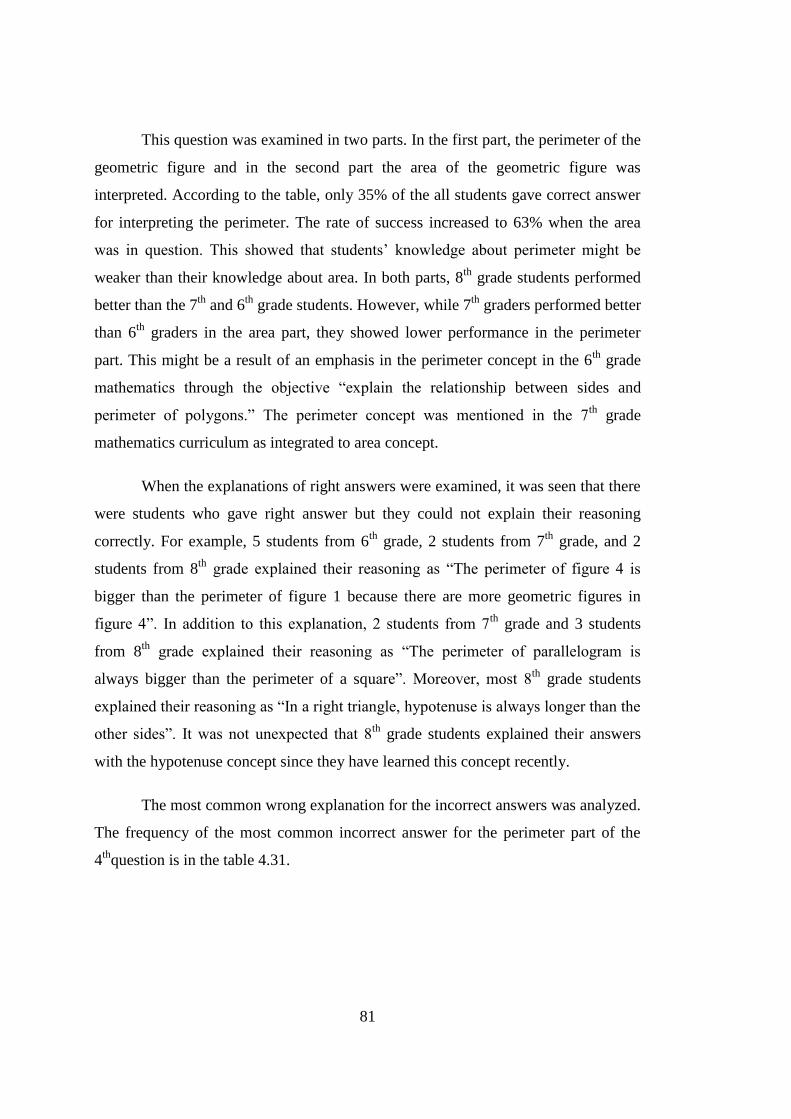
81
This question was examined in two parts. In the first part, the perimeter of the
geometric figure and in the second part the area of the geometric figure was
interpreted. According to the table, only 35% of the all students gave correct answer
for interpreting the perimeter. The rate of success increased to 63% when the area
was in question. This showed that students’ knowledge about perimeter might be
weaker than their knowledge about area. In both parts, 8th
grade students performed
better than the 7th
and 6th
grade students. However, while 7th
graders performed better
than 6th
graders in the area part, they showed lower performance in the perimeter
part. This might be a result of an emphasis in the perimeter concept in the 6th
grade
mathematics through the objective “explain the relationship between sides and
perimeter of polygons.” The perimeter concept was mentioned in the 7th
grade
mathematics curriculum as integrated to area concept.
When the explanations of right answers were examined, it was seen that there
were students who gave right answer but they could not explain their reasoning
correctly. For example, 5 students from 6th
grade, 2 students from 7th
grade, and 2
students from 8th
grade explained their reasoning as “The perimeter of figure 4 is
bigger than the perimeter of figure 1 because there are more geometric figures in
figure 4”. In addition to this explanation, 2 students from 7th
grade and 3 students
from 8th
grade explained their reasoning as “The perimeter of parallelogram is
always bigger than the perimeter of a square”. Moreover, most 8th
grade students
explained their reasoning as “In a right triangle, hypotenuse is always longer than the
other sides”. It was not unexpected that 8th
grade students explained their answers
with the hypotenuse concept since they have learned this concept recently.
The most common wrong explanation for the incorrect answers was analyzed.
The frequency of the most common incorrect answer for the perimeter part of the
4th
question is in the table 4.31.

82
Table 4.31: The frequency of the most common incorrect answer for the perimeter
part of the 4th question in the conceptual test
Response type
Frequency of the
6th
grade students
for the response
Frequency of the
7th
grade students
for the response
Frequency of the
8th
grade students
for the response
“Since the shape
does not change” 13(42%) 12(34%) 12(27%)
When the area part was examined, it was realized that more students gave
correct answers for area task compared to the perimeter task. Although there were
not many students who gave the same incorrect explanation for the incorrect answer,
it was seen that one student from each grade level explained their reasoning as “The
area of parallelograms are bigger than the area of squares.”
An objective similar to the objective in the question 4, “to identify the
changes in area and perimeter of two figures in different combinations,” was
evaluated in the 6th
question. The 6th
question is given in Figure 4.19 below:
Question 6:
A. B.
C. D.
a. There are two equal rectangular areas. In which part, the perimeter of the
combined figures is the smallest one?
b. What could be said about the areas of the combined figures?
Figure 4.19: The sixth question in the conceptual test

83
In the sixth question, students were expected to compare the area and
perimeter of the different combinations of the two identical figures and answer the
questions related to this comparison. Students’ answers were analyzed in terms of the
frequency of correct answer, the possible combination of incorrect answers, and
empty answers with respect to the grade levels. The frequency of correct, incorrect,
and empty answers is given in Table 4.32.
Table 4.32: The frequency of students’ answers for the sixth question in the
conceptual test with respect to the different grade levels
Grade
level
The frequency of
right answers
(percentage)
The frequency of
wrong answers
(percentage)
The frequency of
empty answers
(percentage)
Perimeter
6th
20(65%) 7 3
7th
28(80%) 1 6
8th
34(76%) 11 1
Total 82(74%) 19(17%) 10(9%)
Area
6th
9(29%) 15 7
7th
12(34%) 11 11
8th
26(58%) 11 8
Total 47(42%) 37(33%) 26(25%)
According to the given table above, similar result was seen as in the 4th
question. Eighth graders performed better than the 6th
and 7th
graders. Seventh
graders performed better than the 6th
graders in both perimeter and area tasks.
However, as in the fourth question, when examined totally, students showed lower

84
performance in the area part. Although there was a not common incorrect answer for
this question, one interesting answer from 6th
grade student was that he tried to
complete the figures to a regular shape. Moreover, one of the 8th
grade students
claimed that this question could not be solved without any numerical information.
To sum up, similar objectives were examined in questions 4and 6. How
perimeter and area changed when identical figures or the part of a figure reformed
was asked. It was found that for this type of tasks, 8th
graders were more successful
than the other grade levels. In general, students from all grade levels showed low
performance in the area concept.
The objective “to relate dimensions of a rectangle with its area” was
evaluated in the 5th
question. The 5th
question is given in Figure 4.20.
Question 5: If you increase the edges of a rectangle to 4 times of its current length,
how will its area change?
A. The area becomes 4 times of the first rectangle.
Because,……………………………………………………………………
B. The area does not change.
Because,……………………………………………………………………
C. The area changes, but it does not become 4 times of the first rectangle.
Because,……………………………………………………………………
Figure 4.20: The fifth question in the conceptual test
In the 5th
question, students were expected to realize in which rate the area of
rectangle changed according to the changes in the length of its sides. They were
expected to choose the right answer and then explain their reasoning. Students’
answers were analyzed in terms of the frequency of correct answer, the possible

85
combination of incorrect answers and empty answers with respect to the grade levels.
The frequency of correct, incorrect, and empty answers is given in Table 4.33.
Table 4.33: The frequency of students’ answers for the fifth question in the
conceptual test with respect to the different grade levels
The frequency of
right answers
(percentage)
(C)
The frequency of
wrong answers
(percentage)
The frequency of
empty answers
(percentage) A B
6th
12(39%) 16 1 2
17(55%)
7th
16(46%) 13 2 4
15(43%)
8th
30(67%) 13 1 2
14(31%)
Total 58(52%) 42(38%) 4(4%) 8(6%)
According to the table, only about half of the students gave correct answers
for this question although this kind of questions could be seen commonly in
elementary mathematics curriculum materials. Eighth grade students performed
higher than the 6th
and 7th
grade students in this task. Moreover, the rate of correct
answer for these questionsfor6th
graders was close to the rate of correct answers for
this question for 7th
graders. When the correct answers were analyzed, it was seen
that two 7th
grade students and 8th
grade students provided numbers to calculate the
rate of change. In the answers of students who chose A (becomes 4 times of the first
rectangle)as the right answer, the same common answer emerged. They explained
their reasoning as “The rate of increase in the area is equal to the rate of increase in
the length of sides.”
The objective “to choose the suitable figure with the perimeter with a given
length” was evaluated in the 7th
question. The 7th
question is given in Figure 4.21.

86
Question 7: A farmer has 32 – meter wire. He wants to enclose a garden with one
row of wire. Decide whether the wire is sufficient or not for the below gardens
which have different shapes.
Figure 4.21: The seventh question in the conceptual test
In the 7th
question, the students were expected to calculate or predict (for B)
the perimeter of the given figures and then decide for which ones the wire was
sufficient. For this question, the answers were analyzed under the frequency of
correct answer, incorrect answers, and empty answers for the parts separately with
respect to the grade levels. The frequency of correct, incorrect, and empty answers is
given in Table 4.34.

87
Table 4.34: The frequency of students’ answers for the seventh question in the
conceptual test
In the seventh question, students were expected to decide if the wire was
sufficient for the perimeter of each geometric shape. For the first (irregular shape),
third(irregular shape) and the fourth(rectangle)figure, the rate of correct answers of
6th
grade students was higher than the rates of 7th
and 8th
grade students’ correct
answers. However, for the second figure (parallelogram), it was realized that even
less than half of the students could not give correct answer. While the rate of correct
answers of 7th
grade students was close to the rate of correct answers of 8th
grade
students, 6th
grade students showed lowest performance in this task.
Certain common wrong explanations for students’ answers were detected.
Some students provided their answers based on the appearance of the figures. They
said that since the figures (figure 1 and 3) were irregular, their perimeters were
The frequency of right
answers (percentage)
The frequency of
wrong answers
(percentage)
The frequency of
empty answers
(percentage)
F1 F2 F3 F4 F1 F2 F3 F4 F1 F2 F3 F4
6th
23(74
%)
8(26
%)
20(65
%)
26(84
%)
6 18 7 2 2 5 4 3
7th
15(43
%)
15(43
%)
11(32
%)
24(69
%)
9 15 16 5 11 5 8 6
8th
27(60
%)
19(42
%)
22(49
%)
34(76
%)
12 16 15 6 6 10 8 5
Tota
l 65(59
%)
42(38
%)
53(48
%)
84(76
%)
27(22
%)
49(42
%)
38(34
%)
13(11
%)
19(17
%)
20(18
%)
20(18
%)
14(13
%)

88
bigger than the others (figure 2 and 4) which were more regular. The frequency of
the most common incorrect answer for this question is in the table 4.35.
Table 4.35: The frequency of the most common incorrect answer for the 7th
question
in the conceptual test
Response type
Frequency of the
6th
grade students
for the response
Frequency of the
7th
grade students
for the response
Frequency of the
8th
grade students
for the response
“Since the figures
are washboard or
plane”
2 7 5
The objective “to compare the perimeters and areas of two shapes drawn on
dot paper” was evaluated in the 8th
question. The 8th
question is given in Figure 4.22.
Question 8:There are two figures below. Give the answers for below questions
according to these figures.
Are the figures’ areas equal to each other? Why?
A.Their areas are equal to each other. B. Their areas are NOT equal to each
other.
Because;…………………………..Because;…………………………..
Are the figures’ perimeters equal to each other? Why?
C.Their areas are equal to each other.B. Their areas are NOT equal to each other.
Because;…………………………..Because;……………………….....
Figure 4.22: The eighth question in the conceptual test
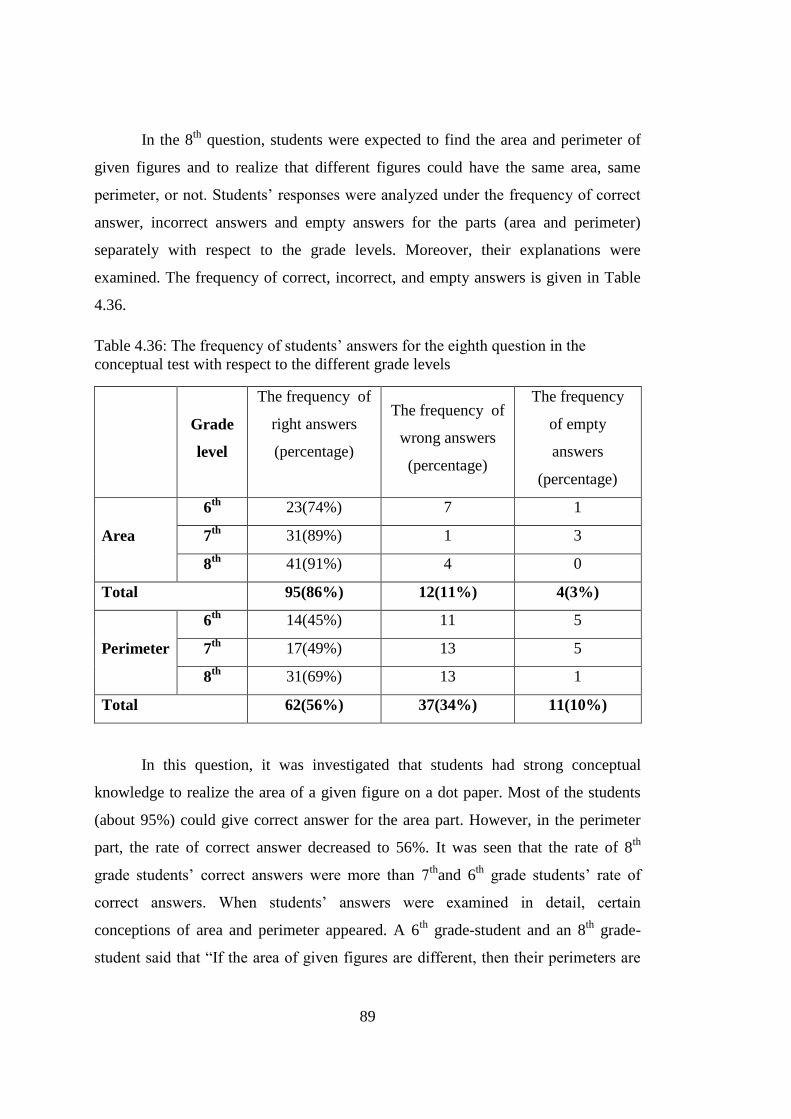
89
In the 8th
question, students were expected to find the area and perimeter of
given figures and to realize that different figures could have the same area, same
perimeter, or not. Students’ responses were analyzed under the frequency of correct
answer, incorrect answers and empty answers for the parts (area and perimeter)
separately with respect to the grade levels. Moreover, their explanations were
examined. The frequency of correct, incorrect, and empty answers is given in Table
4.36.
Table 4.36: The frequency of students’ answers for the eighth question in the
conceptual test with respect to the different grade levels
Grade
level
The frequency of
right answers
(percentage)
The frequency of
wrong answers
(percentage)
The frequency
of empty
answers
(percentage)
Area
6th
23(74%) 7 1
7th
31(89%) 1 3
8th
41(91%) 4 0
Total 95(86%) 12(11%) 4(3%)
Perimeter
6th
14(45%) 11 5
7th
17(49%) 13 5
8th
31(69%) 13 1
Total 62(56%) 37(34%) 11(10%)
In this question, it was investigated that students had strong conceptual
knowledge to realize the area of a given figure on a dot paper. Most of the students
(about 95%) could give correct answer for the area part. However, in the perimeter
part, the rate of correct answer decreased to 56%. It was seen that the rate of 8th
grade students’ correct answers were more than 7th
and 6th
grade students’ rate of
correct answers. When students’ answers were examined in detail, certain
conceptions of area and perimeter appeared. A 6th
grade-student and an 8th
grade-
student said that “If the area of given figures are different, then their perimeters are

90
also different.” Moreover, one student from each grade level said that “Since the
figures are different, the area/perimeter must be different.”
The objective “to identify the different shapes with the same perimeter” was
evaluated in the 10th
question. The 10th
question is given in Figure 4.23.
Question 10: A farmer has 4 gardens in different shapes as given below. This
farmer will enclose his gardens with wire. Therefore, he divided his wire into 4
equal parts. He did not add any piece of wire or need any wire. So, which
statement is the right?
Garden A Garden B Garden C Garden D
A. Garden D has the biggest perimeter.
B. All gardens have equal perimeter.
C. Garden B has the smallest perimeter.
D. The perimeter of garden C is bigger than the perimeter of garden A.
Why your choice is right? Explain your reasoning.
………………………………………………………………………………
Figure 4.23: The tenth question in the conceptual test
In the 10th
question, students were expected to choose the correct answer
from the given statements and then explain their reasoning. They were supposed to
realize that different shapes may have the same perimeter. The answers were
examined under the frequency of correct answers, incorrect answers and empty
answers. The explanations from incorrect answers were also investigated. The
frequency of correct, incorrect, and empty answers is given in Table 4.37.

91
Table 4.37: The frequency of students’ answers for the tenth question in the
conceptual test with respect to the different grade levels
Grade level The frequency of right
answers (percentage)
(B)
The frequency of
wrong answers
(percentage)
The frequency
of empty
answers
(percentage) With right
explanation
No
explanation
A C D
6th
10(33%) 1(3%) 11 2 6 1
7th
15(43%) 1(4%) 4 2 9 4
8th
15(33%) 2(5%) 6 5 14 3
Total 40(36%) 4(4%) 21 9 29 8
Total 44(40%) 59(53%) 8(7%)
According to the table above, it was examined that only 40% of the students
gave correct answers and sufficient explanation. In this question, the rate of correct
answers of 7th
grade students was higher than the rate of correct answers of the 6th
and 8th
grade students. Moreover, the incorrect answers were examined and common
incorrect explanations were analyzed. The frequency and the response type of
students who chose A (Garden D has the biggest perimeter) as the right answer is
shown table 4.38 below:
Table 4.38: The frequency of the most common incorrect explanation for choice A in
the 10th question in the conceptual test
Response type
Frequency of the
6th
grade students
for the response
Frequency of the
7th
grade students
for the response
Frequency of the
8th
grade students
for the response
“Because the
appearance of
garden D seems
big”.
8 4 12
It seemed that the 8th
grade students gave importance to the appearance of the
figures much more than the 6th
and 8th
grade students.

92
Students who chose D (The perimeter of garden C is bigger than the
perimeter of garden A) as the correct answer explained their reasoning as “C is more
regular than the A and the others.” Furthermore, one student from 7th
grade and one
student from 8th
grade compared the shapes by completing all the shapes to a square
or rectangle.
4.3. Summary of the results about conceptual knowledge test
In the conceptual test, the students’ conceptual knowledge of area and
perimeter of geometric figures were examined through different objectives.
According to the results; students had conceptual difficulties both in area and
perimeter tasks. While they performed better in some tasks such as predicting and
comparing the area of given figures, they had low performance in tasks related to
analyzing different geometric figures with the same perimeter. Seventh and 8th
grade
students performed better than the 6th
grade students in comparison and prediction
tasks.
Students’ conceptual knowledge was stronger in area when they were
expected to interpret the area and perimeter of the shapes which are decomposed and
formed differently. On the other hand, when they were expected to interpret
combined figures, they performed better in interpreting the perimeter. Students’
conceptual knowledge of area was also stronger compared to their conceptual
knowledge of perimeter when they were analyzing a figure on a dot paper.
The analysis indicated that students interpreted and compared the area and the
perimeter of the figures by considering their appearance. According to them, the
perimeter of the irregular shapes figures was bigger than the plane ones. It seemed
that students’ conceptual knowledge was affected by the visual evidences they had
about the geometric figures. Furthermore, it was examined that students from all
grade levels had difficulties in tasks related to the perimeter of the parallelogram.
Students had lower performance in relating the length of the edges and the
area of the given rectangle and realizing the different shapes with the same
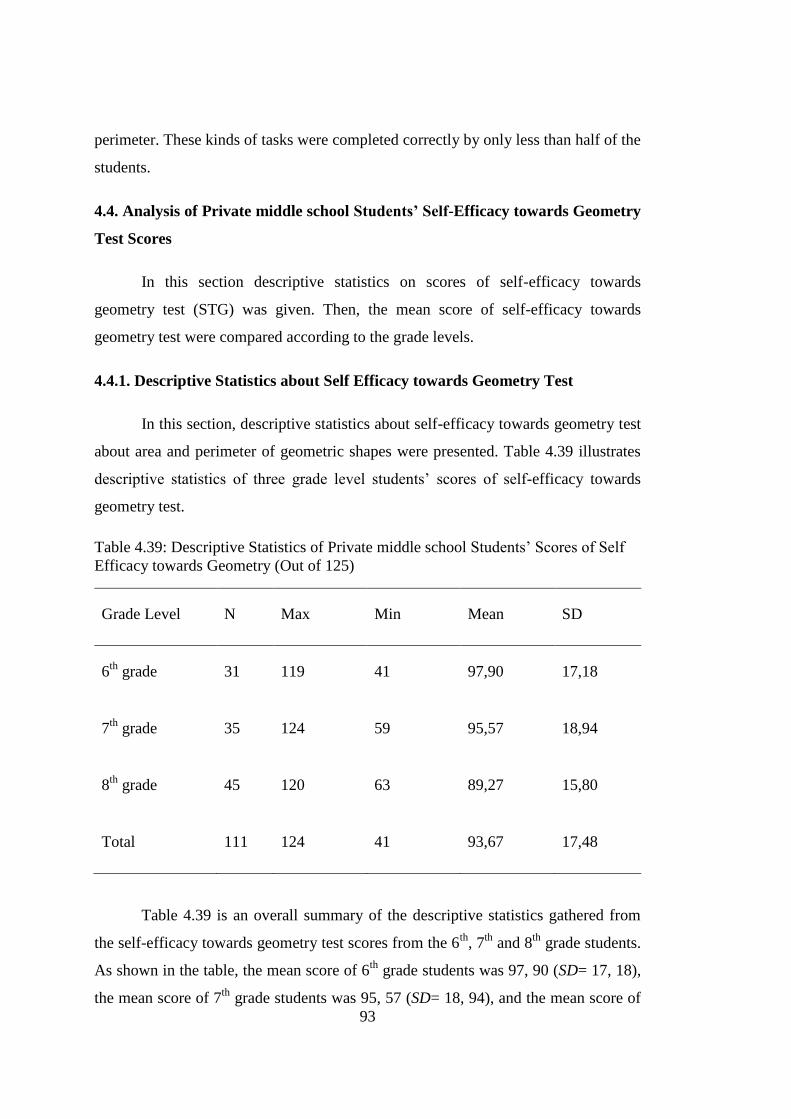
93
perimeter. These kinds of tasks were completed correctly by only less than half of the
students.
4.4. Analysis of Private middle school Students’ Self-Efficacy towards Geometry
Test Scores
In this section descriptive statistics on scores of self-efficacy towards
geometry test (STG) was given. Then, the mean score of self-efficacy towards
geometry test were compared according to the grade levels.
4.4.1. Descriptive Statistics about Self Efficacy towards Geometry Test
In this section, descriptive statistics about self-efficacy towards geometry test
about area and perimeter of geometric shapes were presented. Table 4.39 illustrates
descriptive statistics of three grade level students’ scores of self-efficacy towards
geometry test.
Table 4.39: Descriptive Statistics of Private middle school Students’ Scores of Self
Efficacy towards Geometry (Out of 125)
Grade Level N Max Min Mean SD
6th
grade 31 119 41 97,90 17,18
7th
grade 35 124 59 95,57 18,94
8th
grade 45 120 63 89,27 15,80
Total 111 124 41 93,67 17,48
Table 4.39 is an overall summary of the descriptive statistics gathered from
the self-efficacy towards geometry test scores from the 6th
, 7th
and 8th
grade students.
As shown in the table, the mean score of 6th
grade students was 97, 90 (SD= 17, 18),
the mean score of 7th
grade students was 95, 57 (SD= 18, 94), and the mean score of

94
8th
grade students was 89, 27 (SD= 15, 80) while the mean score of all total was 93,
67 (SD= 17, 47) in the self-efficacy towards geometry test. The self-efficacy towards
geometry test scores of the 6th
and 7th
grade students was above the mean of all
students’ scores, the self-efficacy towards geometry test scores of the 8th
grade
students was under the mean of all students’ scores. Moreover, it can be seen that the
self-efficacy towards geometry test scores of 6th
grade students was higher than the
self-efficacy towards geometry test scores of 7th
grade students and the self-efficacy
towards geometry test scores of 7th
grade students was higher than the self-efficacy
towards geometry test scores of 8th
grade students.
4.4.2. The Difference in Geometry Self-Efficacy of Private middle school
Students in terms of Grade Level
One of the aims of the present study was to examine how geometry self-
efficacy of private middle school grade students changed according to the grade
level. This research question also required a comparison of means and look for
whether there was a significant mean difference between the scores of the groups as
in the PCK and CKT scores. Therefore, in order to examine the mean difference of
self-efficacy towards geometry test scores in terms of grade levels, one-way
ANOVA was used. Prior to running the analysis, the assumptions of one-way
ANOVA were checked for geometry test scores. In the next sections the assumptions
and analysis of results were summarized.
4.4.2.1. Assumptions of one way ANOVA
The assumptions of one-way ANOVA were level of measurement,
independence of observations, normality and homogeneity of variance Pallant
(2007). According to the geometry self-efficacy test results, they were summarized
below.
The variables for one-way ANOVA were mean scores of self-efficacy
towards geometry test of 6th
, 7th
and 8th
grade students which were continuous
variable. Hence level of measurement assumption was ensured.
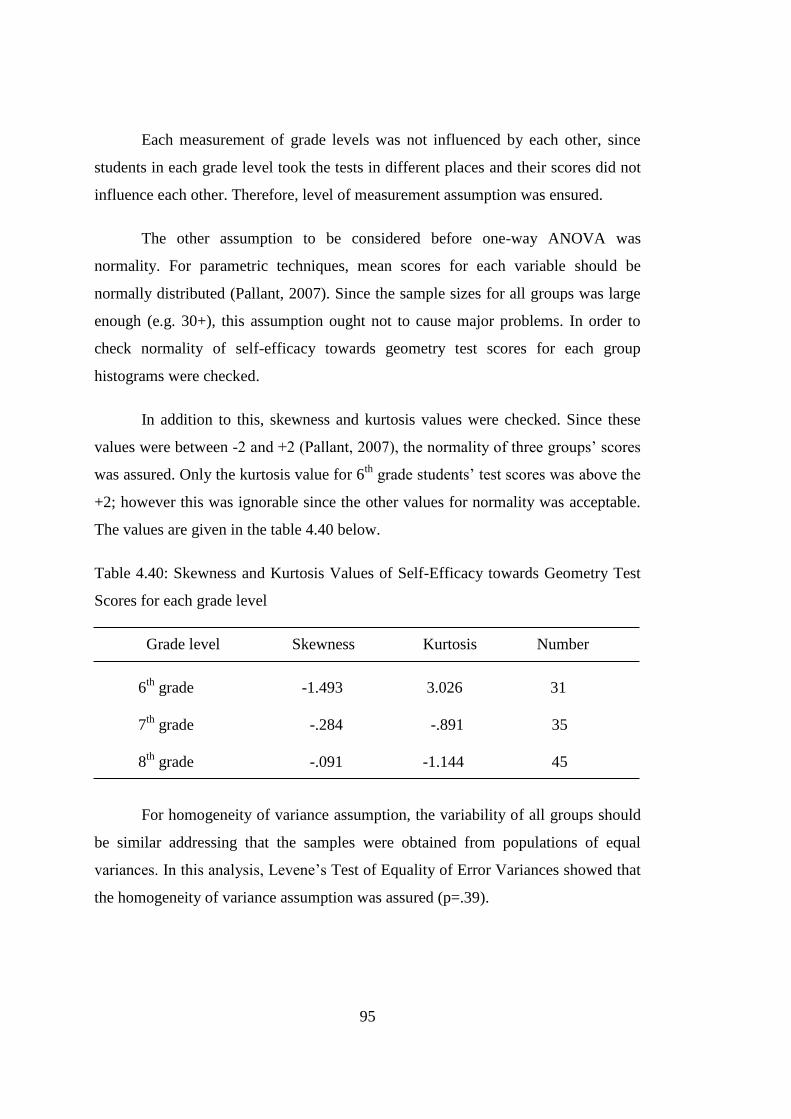
95
Each measurement of grade levels was not influenced by each other, since
students in each grade level took the tests in different places and their scores did not
influence each other. Therefore, level of measurement assumption was ensured.
The other assumption to be considered before one-way ANOVA was
normality. For parametric techniques, mean scores for each variable should be
normally distributed (Pallant, 2007). Since the sample sizes for all groups was large
enough (e.g. 30+), this assumption ought not to cause major problems. In order to
check normality of self-efficacy towards geometry test scores for each group
histograms were checked.
In addition to this, skewness and kurtosis values were checked. Since these
values were between -2 and +2 (Pallant, 2007), the normality of three groups’ scores
was assured. Only the kurtosis value for 6th
grade students’ test scores was above the
+2; however this was ignorable since the other values for normality was acceptable.
The values are given in the table 4.40 below.
Table 4.40: Skewness and Kurtosis Values of Self-Efficacy towards Geometry Test
Scores for each grade level
Grade level Skewness Kurtosis Number
6th
grade -1.493 3.026 31
7th
grade -.284 -.891 35
8th
grade -.091 -1.144 45
For homogeneity of variance assumption, the variability of all groups should
be similar addressing that the samples were obtained from populations of equal
variances. In this analysis, Levene’s Test of Equality of Error Variances showed that
the homogeneity of variance assumption was assured (p=.39).

96
4.4.2.2. Results of one-way ANOVA for Self-Efficacy toward Geometry Test
According to the one-way ANOVA results for geometry self-efficacy test
revealed that there was no statistically significant difference (F (2, 108) = 2.62, p >
.05) among three grade level in terms of geometry self-efficacy test scores. Although
there are mean difference in the scores, this mean difference is not statistically
significant. The STG test scores for each grade level were given in the figure
4.24below.
Figure 4.24: STG Test Scores for the 6th
, 7th
and 8th
grade students
4.5. Correlation among Geometry Self-Efficacy, Procedural Knowledge and
Conceptual Knowledge
One specific aim of the present study was to investigate if there was a
relationship among the scores of PKT, CKT and STG test scores. In order to examine
the strength and the direction of the relationship among these variables Pearson-
Product Moment was calculated. Before conducting the correlation analysis, the
assumptions for the analysis were checked.
4.5.1. Assumptions of Pearson-Product Moment Correlation
The assumptions of Pearson-Product Moment Correlation were level of
measurement, related pairs, independence of observations, normality and
homogeneity of variance (Pallant, 2007).
84
86
88
90
92
94
96
98
100
6th grade 7th grade 8th grade
STG Scores
STG Scores

97
In the present study, the dependent variables were PKT, CKT and STG tests
scores which were continuous variables. Therefore, level of measurement assumption
was assured.
It was important to satisfy related pairs assumption that all subjects had a
score on the variables. That assumption was also established since in the present
study all participants had the scores of PCK, CKT and STG test scores.
Independence of observations assumptions were assured since the each
measurement was not influenced by another. In addition, sample size (N= 111) was
appropriate to assure normality assumption of the study.
In order to check normality of procedural test, conceptual test and geometry
self-efficacy test scores, histograms, normal Q-Q plots, and skewness and kurtosis
values were examined. The shape of the graphs showed that variables were normally
distributed. Only the histogram for procedural test score did not seem to be normal,
however the other values showed that the distribution was normal. The skewness and
kurtosis values of PKT, CKT and STG test scores for each group is summarized in
the Table 4.41.
Table 4.41: Skewness and Kurtosis Values of PKT, CKT and STG Test Scores
Skewness Kurtosis N
PKT . 15 -. 62 111
CKT -. 38 -1. 13 111
STG -.44 -. 40 111
As indicated in the Table 4.41, the skewness and kurtosis values were placed in the
acceptable range. Therefore, there was no violation for the normality assumption.
Another assumption for the correlation studies was linearity assumption that
the relationship between variables should be linear (Pallant, 2007). In order to
examine the linearity, scatter plots for PKT, CKT and STG test mean scores were
constructed. In the figures 4.25, 4.26 and 4.27 the relationships between PKT and

98
STG test scores, CKT and STG test scores and PKT and CKT scores were shown
respectively.
Figure 4.25: Scatter plot of PKT Mean Scores and STG Test Mean Scores
The spread of the points in the scatter plot indicated that there was a
reasonable correlation between PKT and STG Test mean scores. The fit line could be
drawn, so the Pearson correlation could be used. Therefore, the assumption was
satisfied. The direction of relationship was positive since the line drawn through
points upward from left to right. That is, high scores in PKT scores were associated
with high scores in STG test scores. As a result, when geometry self-efficacy
increased, the scores in procedural knowledge test increased and the relationship
seemed to be weak.
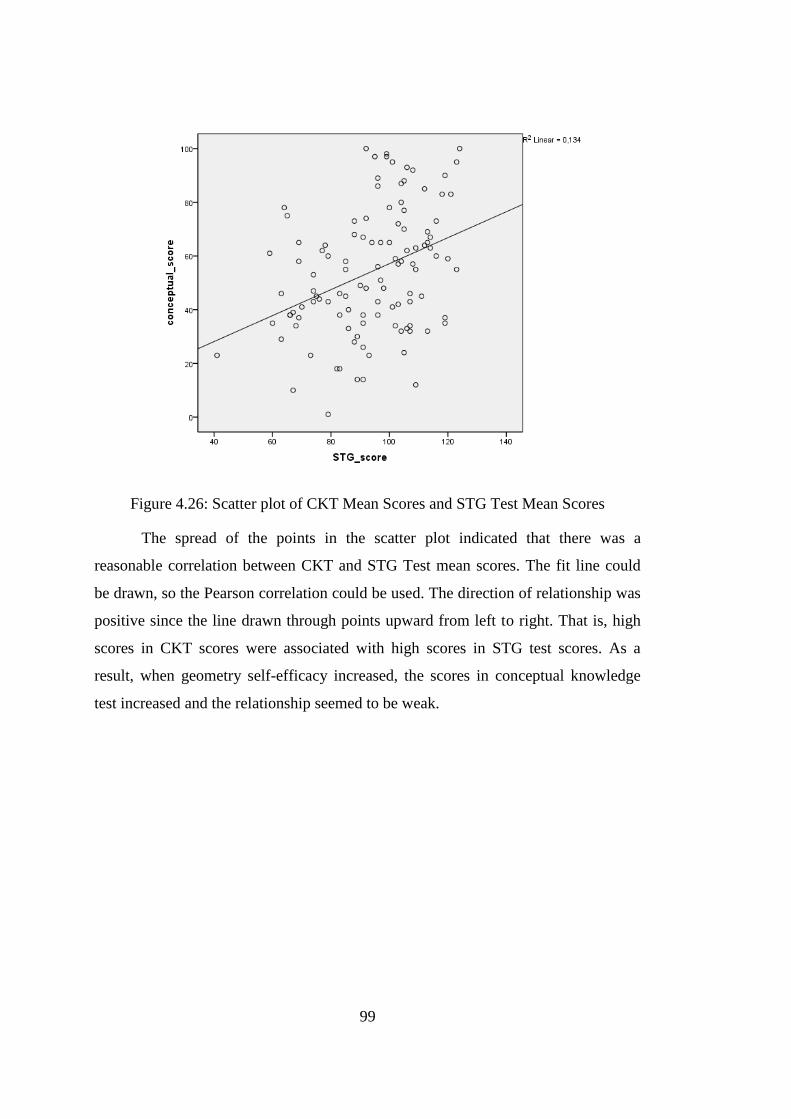
99
Figure 4.26: Scatter plot of CKT Mean Scores and STG Test Mean Scores
The spread of the points in the scatter plot indicated that there was a
reasonable correlation between CKT and STG Test mean scores. The fit line could
be drawn, so the Pearson correlation could be used. The direction of relationship was
positive since the line drawn through points upward from left to right. That is, high
scores in CKT scores were associated with high scores in STG test scores. As a
result, when geometry self-efficacy increased, the scores in conceptual knowledge
test increased and the relationship seemed to be weak.

100
Figure 4. 27: Scatter plot of PKT Mean Scores and CKT Mean Scores
The spread of the points in the scatter plot indicated that there was a
reasonable correlation between PKT and CKT mean scores. The fit line could be
drawn, so the Pearson correlation could be used. The direction of relationship was
positive since the line drawn through points upward from left to right. Thus, the
linearity assumption was assured with fit lines of scatter plots. That is, high scores in
PKT scores were associated with high scores in CKT test scores. As a result, when
procedural knowledge increased, the scores in conceptual knowledge increased and
the relationship seemed to be moderate.
When scatter plots above were examined, the homoscedasticity assumption
was assured in Figure 4.25, Figure 4.26andFigure 4.27 since there was a fairly cigar
shape in these figures. Therefore, the Pearson product-moment coefficient was used
to investigate the correlations between PKT scores and STG test scores, between
CKT scores and STG test scores, and between PKT scores and CKT scores.

101
4.5.2. Correlation between Geometry Self-Efficacy and Procedural Knowledge
Preliminary analyses were performed to ensure no violation of the
assumptions of normality, linearity, and homoscedasticity. Results indicated that
there was a significant positive relationship between geometry self-efficacy and
procedural knowledge test scores, r = .435, p< .01. This means that higher levels of
geometry self-efficacy of private middle school students were associated with higher
scores in the PKT. The strength of the relationship was considered as medium
(Cohen, 1988). The coefficient of determination was calculated as .19 which meant
there were 19 percent shared variance between PKT and STG test scores.
4.5.3. Correlation between Geometry Self-Efficacy and Conceptual Knowledge
Preliminary analyses were performed to ensure no violation of the
assumptions of normality, linearity, and homoscedasticity. Results indicated that
there was a significant positive relationship between geometry self-efficacy and
conceptual knowledge test scores, r(109)= .366, p< .01. This meant that higher levels
of geometry self-efficacy of private middle school students were associated with
higher scores in the CKT. The strength of the relationship was considered as medium
(Cohen, 1988). The coefficient of determination was calculated as .13 which meant
there were 13 percent shared variance between CKT and STG test scores.
4.5.4. Correlation between Procedural Knowledge and Conceptual Knowledge
Preliminary analyses were performed to ensure no violation of the
assumptions of normality, linearity, and homoscedasticity. Results indicated that
there was a significant positive relationship between conceptual knowledge test
scores and procedural knowledge test scores, r(109)= .697, p< .01. This meant that
higher scores in CKT were associated with higher scores in the PKT. The strength of
the relationship was considered as large (Cohen, 1988). The coefficient of
determination was calculated as .48 which meant there were 48 percent shared
variance between PKT and CKT test scores.

102
4.5.5. Summary of the Inferential Statistics
One of the purposes of the study was to investigate how procedural
knowledge and conceptual knowledge of private middle school students about area
and perimeter of geometric figures and their geometry self-efficacies change in terms
of grade level. For this aim, one- way ANOVAs were conducted. According to the
results, there were no statistically significant difference in private middle school
students’ procedural knowledge and self-efficacies in terms of grade levels.
However, there was a significant difference in conceptual knowledge of private
middle school students.
The other specific aim of the study was to investigate the relationships among
private middle school students’ procedural knowledge, conceptual knowledge and
their geometry self-efficacies. For this aim, Pearson-Product Moment Correlation
was calculated. According to the results, there was significant correlation between
students’ procedural knowledge and conceptual knowledge and geometry self-
efficacies.

103
CHAPTER 5
DISCUSSION
The purpose of the present study was to investigate private middle school
students’ procedural and conceptual knowledge in the domain of area and perimeter
of geometric figures and to examine most common errors in procedural and
conceptual knowledge tasks. The other specific interest of the study was to examine
how students’ conceptual and procedural knowledge aspects of area and perimeter of
geometric figures changed with respect to their geometry self-efficacy.
This chapter consists of the summary of the results and the discussion of the
findings of the study. Moreover, recommendations and implications for the future
studies will be presented.
5.1. Students’ Procedural Knowledge about Area and Perimeter of Geometric
Shapes
The descriptive statistics for procedural knowledge test scores of elementary
students showed that the mean of the test scores was not very high. Although 8th
grade students’ mean scores was higher than 7th
grade students’ mean scores and 7th
grade students’ mean scores on the test was higher than the 6th
grade students’ mean
scores, when their mean scores were investigated separately, it was seen that the
mean scores were below 65out of 100 for all grade levels. These results showed that
students’ procedural knowledge on area and perimeter was not sufficient. Area and
perimeter are considered to be among the mathematics topics that students have
difficulty. Related literature shows that most of the students have difficulty in
understanding geometry and measurement concepts and particularly area and
perimeter (Barret& Clement, 2003; Martin & Kenney, 2002; Walter, 1970).
The results of the one-way ANOVA have revealed that there was no
significant mean difference among three grade levels (6th
, 7th
and 8th
grades) in terms

104
of procedural knowledge test scores. Hiebert and Levefre (1986) defined procedural
knowledge as being aware of the mathematical rules and usage of algorithms and
rules. For this study it was aimed to examine the usage of the rules which helps to
calculate area and perimeter of geometric shapes. The tests used in the present study
were developed in line with the common objectives of 6th
and 7th
grade mathematics
curriculum and 8th
grades students were assumed to have already achieved the
objectives. The results showed that all students from different grade levels might
have almost the same procedural knowledge. Their procedural knowledge about area
and perimeter concepts did not change according to grade level. Since the questions
were related to the common objectives in three grade levels, students might have
practiced with the similar algorithms and rules in all grades. Moreover, since these
topics are related to several mathematics topics (Clements & Battista, 2001; NCTM,
2000), students might have familiarity with these algorithms and rules in all grade
levels.
Students were successful when they calculated the area and perimeter of a
square, rectangle, and parallelogram in general. Moreover, in both area and
perimeter, 6th
grade students had lower performance while 8th
grade students had
highest performance. As mentioned above, this result could be due to the situation
that 8th
grade students studied these topics more than 6th
and 7th
grade students.
However, in certain kind of questions, for example area of a parallelogram and
triangles, 6th
grade students were more successful. This might be resulted from the
fact that objectives related to these domains were in 6th
and 7th
grade mathematics
curriculum.
The analysis showed that students from all grade levels had lower
performance in finding the perimeter and area of the parallelogram. Most of the
students did not give any answer for parallelogram part and noted that they forgot the
perimeter and area formula of parallelogram. Their lack of experiences with
parallelogram in-and-out of mathematics classes might not have enhanced their
knowledge of parallelogram as strong as other geometric figures. Students’ most
common procedural error was multiplying the two sides and multiplying the sides
and the height and then dividing it by two to find the area of the parallelogram. The

105
reason might be students’ confusion of the area of a parallelogram with the area of a
rectangle or a triangle. Moreover, they might have problems with locating the heights
of quadrilaterals. These results showed that students did not have strong procedural
knowledge of calculating the perimeter and area of a parallelogram. The other reason
might be resulted from the fact that students rarely came across parallelograms in
their daily lives compared to squares and rectangles and they forgot the formula
easily. These results were consistent with the other studies conducted about area and
perimeter. For example, Dağlı (2010) found that students could find the perimeter
and area of a square, rectangle, or triangle easily. However, they had difficulty in
finding the perimeter or area of a parallelogram. All students had the lowest
performance when they were asked to find the height of a parallelogram by using its
area and one side. Seventh and 6th
grade students were more successful than the 8th
grade students. The objective related to parallelogram was in the 6th
and 7th
grade
curriculum. Therefore, 8th
grade students might have forgotten the procedures in the
present study.
Findings showed that students did not have much difficulty in calculating the
perimeter of a square or a rectangle. However, they experienced problems when they
calculated the length of the one side of the square or rectangle whose area or
perimeter were given. This showed that students did not have sufficient procedural
knowledge of finding the length of the side of the rectangle or square rather than the
lack of procedural knowledge in finding the area or perimeter of the square and
rectangle. This kind of error might be a result of students’ possible confusion of
perimeter and area formulas. Kidman and Cooper (1997) also reported that 4th
, 6th
and 8th
grade students tried to calculate the perimeter of given quadrilaterals by
summing up length and width instead of using area formula. Moreover, Van de
Walle stated that the biggest misconception of students was mixing the perimeter and
area (2012).
Students also had problems when they calculated the perimeter and area of
combined geometric shapes. For example, while they were able to calculate the area
or perimeter of a square separately, they had difficulty in calculating the area or
perimeter of a geometric figure which was the combination of squares. It is usually
106
assumed that calculating the perimeter and area of combined figures need high order
skills. Since it requires analyzing the figures separately and then considering the
figures as whole, students might have difficulty in dealing with combined figures.
Nevertheless, an interesting result was that 6th
grade students were more successful
in calculating the perimeter of combined figures than the 7th
and 8th
grade students.
This might be resulted from the fact that 6th
grade curriculum includes objectives
related to calculating area and perimeter of combined figures whereas that objectives
are not given place obviously in 7th
and 8th
grade curriculum. On the other hand,
results showed that 8th
grade students were more successful in calculating the area of
combined figures. The strategy used by 8th
grade students was to see the figures
separately and this strategy worked for calculating the area part. However, for
calculating perimeter it did not work. Although these kinds of figures might seem
considerably confusing especially for the 6th
grade students, 7th
and 8th
grade students
also had difficulty. This kind of procedural error might have been resulted from the
misunderstanding in the conception of the problem rather than the procedural skills.
Furthermore, some 8th
grade students tried to solve some questions by the help of
Pythagorean Theorem which was not known by 6th
and 7th
grade students. This might
have been resulted from the condition that 8th
grade students had learned the
Pythagorean Theorem just before the test was implemented. When they saw the right
triangles, they might have decided to apply the Pythagorean Theorem. It can also be
speculated that students’ lack of procedural knowledge for calculating the area and
perimeter of combined figures might be affected by students’ lack of knowledge in
different domains.
Students also had problems in calculating the area of the acute-angled,
obtuse-angled, and right-angled triangles whose one side and the height belonged to
that side was given. Among them, students had problems when they tried to calculate
the area of obtuse-angled triangle. This might be a problem related to the height of
the obtuse triangle because it was out of the triangle. Besides, another reason could
be that students were less familiar with obtuse-angled triangles than the other types
of triangles in their daily lives. One another reason might have been that, teachers do
not mention obtuse-angled triangles in their classes.
107
5.2. Students’ Conceptual Knowledge about Area and Perimeter of Geometric
Shapes
The descriptive statistics of conceptual knowledge test showed that
elementary students’ conceptual knowledge test results were not very high (below 65
out of 100) similar to the mean scores of procedural knowledge test. This shows that
students’ conceptual knowledge was not sufficient in the domain of area and
perimeter. It was examined in most studies that students from all grades might have
difficulty in area and perimeter concepts (Barret & Clement, 2003; Martin &
Kenney, 2002; Walter, 1970). Moreover, van Hiele (1985) stated that students did
not understand concepts underlying terms perimeter and area. Therefore, the results
of present study were consistent with these studies.
The mean score of private middle school students and mean scores of each
grade separately for procedural and conceptual knowledge tests were close to each
other. As in the procedural knowledge test, 8th
grade students were more successful
than 6th
and 7th
grade students in conceptual knowledge test. As they were taught
these topics, they might make sense of area and perimeter concepts more
conceptually. However, when the mean scores were examined, it was realized that
scores in all grade levels were not very high. This showed that students might lack
conceptual knowledge aspects of area and perimeter of geometric figures. This might
be because students ignored conceptual knowledge of area and perimeter and the
conceptual meaning underlying procedures and algorithms. Besides, teachers might
also emphasize procedural tasks rather than conceptual tasks in their lessons.
One specific aim of the present study was to examine how conceptual
knowledge of elementary students changed according to grade levels. Although
procedural knowledge scores of all grade students were higher than their conceptual
knowledge scores, there was a significant increase in students’ conceptual knowledge
scores by means of grade levels. The ANOVA results showed that there was a
statistically significant difference among the mean scores of students from three
grade levels in conceptual knowledge test. The mean score of 8th
grade students was
significantly higher than the mean score of 6th
grade students. However, the mean

108
score of 7th
grade students was close to 6th
grade students’ and 8th
grade students’
mean scores. As mentioned above, since the topics were taught in all grade levels in
elementary school, students’ conceptual knowledge might be improved. As a result
of this, there might be a difference between 6th
and 8th
grade students ‘conceptual
knowledge. Furthermore, this might stem from the fact that students develop a better
sense of concepts when they come to 8th
grade.
Students’ most common errors were also analyzed in the CKT. The analysis
revealed that students had conceptual difficulties both in area and perimeter tasks. In
general, the most successful group was 8th
grade, whereas 6th
grade students had the
lowest performance. However, students’ success changed according to the question
types. More specifically, it was examined that 7th
and 8th
grade students performed
better than the 6th
grade students in tasks including predicting and the comparing of
the area of geometric figures although related objectives were in the 6th
grade
program. Students have been asked to predict and compare objects since their
childhood period in their daily lives. Therefore, success in predicting and comparing
area and perimeter in higher grades might be resulted from this reason. One another
reason might be that students internalized and conceptualized the meaning of area
and perimeter. When most common errors were examined, it was realized that
students might have the conception that the geometric figures which had more curls
were bigger than the plain ones. They might have the wrong conception that if a
figure had curves, its perimeter or area is bigger than the others. Furthermore,
students had weak conceptual knowledge the fact that different shapes might have
the same perimeter. Students might have interpreted the perimeter of a figure
according to the appearance and irregularity.
In prediction and comparison area questions, while 7th
and 8th
grade students’
performance did not change when they predicted the area given on the squared paper,
it was realized that 6th
grade students’ performance was decreased from 75% to 45%.
Here, it might be concluded that 6th
grade students might have difficulty in predicting
the area of a shape with curves given in a squared paper. However, in a similar
question in which figures were given on a dot paper and students were expected to
count the unit squares to find the area of the shape, 6th
grade students’ performance

109
increased. This showed that when the figures had curves, students’ predictions skills
became weaker. Therefore, it can be said that their conceptual knowledge to predict
the area of an irregular shape which did not include the unit squares were low.
Besides this, it was seen that students tended to count square units to find its
perimeter or they tended to count lines which encircle the shape to find its area. This
showed that students confused area and perimeter as in the study conducted by Tan
(2009).
Private middle school students had the lowest performance in tasks related to
the surface area. Although this topic was covered in all grade levels in the elementary
mathematics curriculum, only 21% of all participated students gave correct answer
for questions about surface area. While related questions could be difficult for 6th
grade students, it should have been answered correctly by students who understood
surface area conceptually sufficient. Yet, 7th
and 8th
grade students’ performances
were also low in tasks about surface area. This showed that elementary students
might lack conceptual knowledge of surface area. Moreover, based on the results, it
might be concluded that when the surface area was divided into pieces, students had
difficulty to make sense of the area concept while they had better performance in
undivided surface areas.
It was seen that students had difficulty in the changeability of perimeter and
conservation of area when figures were decomposed and combined in a different
shape. Similar results were also indicated in past research studies (Emekli, 2001;
Kamii & Kysh, 2006).Furthermore, it was investigated that only 35% of the all
students gave correct answer for interpreting the perimeter in these tasks. The rate of
success increased to 63% in tasks related to area. This showed that students’
knowledge about perimeter might be weaker than their knowledge about area, as in
Tan and Aksu’s (2009) study conducted with 7th
grade students. In area and
perimeter parts, 8th
grade students performed better than the 7th
and 6th
grade
students. However, while 7th
graders performed better than 6th
graders in the area
part, they showed lower performance in the perimeter part. This might be a result of
an emphasis on the perimeter concept in the 6th
grade mathematics through the
objective “explain the relationship between sides and perimeter of polygons.” On the
110
contrary, in the 7th
grade mathematics curriculum the perimeter concept isnot the
focus but the area concept is emphasized mostly as integrated to area concept. There
were also inconsistent results with the present study in the study conducted by Tan
and Aksu (2009). For example, in their study, it was examined that 7th
grade students
had more problems about the conservation of the area than the conservation of
perimeter, unlike the findings in this study.
A relationship objective was also investigated with the different combination
of identical figures and similar results were revealed. When the change in the
perimeter and area was asked when identical figures or the part of a figure was
reformed, 8th
graders were more successful than the students in other grade levels.
This might be resulted from the fact that 8th
graders’ conceptual knowledge were
more utilized in comparing area and perimeter of different combinations of figures
compared to the other grade levels. However, students from all grade levels showed
low performance in the area concept. This might show that area concept was not
learned completely. Students had lack of conceptual knowledge about the
conservation of the area which might address that their conceptual knowledge of area
might be incomplete or inaccurate. These results were inconsistent with in the study
conducted by Kami and Kysh (2006) who found that 8th
grade students realized that
when a figure was divided into parts, and a new shape was constructed, the area of
the figure changed.
Moreira and Contente (1997) reported that seventh grade students confused
the area and perimeter concepts as they believed that there was a linear relationship
between area and perimeter of a figure. Also, in the present study, for the type of
tasks in which students were required to realize in which rate the area of the figure
changed according to the changes in the length of its edges, only about half of the
students could give correct answers, although this kind of questions could be seen
commonly in elementary mathematics curriculum materials. Although 8th
grade
students performed better than 6th
and 7th
grade students, when all grades were
examined separately, the rate of success was not high for each grade level. When the
answers were investigated, it was seen that most common error that students have
done was their thinking that the rate of increase in the area was equal to the rate of

111
increase in the length of sides. These answers might be a result of the lack of
knowledge of the relationship between the area and the length of sides of a geometric
figure. Moreover, students might have lack of conceptual knowledge of ratio rather
than area and perimeter.
Finally, in the present study, the relationship between procedural and
conceptual knowledge of elementary students was investigated. Results indicated
that there was a significant positive relationship between conceptual knowledge test
scores and procedural knowledge test scores. This meant that the students who had a
strong conceptual knowledge also had strong procedural knowledge and vice versa.
This positive relationship might result from the fact that conceptual knowledge
contain and bring about procedural knowledge. These two types of knowledge are so
interrelated that both conceptual and procedural knowledge are necessary for
complete learning of a topic. It might also be speculated that the development of
both types of knowledge influenced each other in the area and perimeter concepts.
5.3. Students’ Self-Efficacy towards Geometry
In general, descriptive statistics about geometry self-efficacy of elementary
students revealed that elementary students had high (94 out of 125) self-efficacy. The
fact that students were studying at a private school and they had several learning
opportunities might be a reason of their high self-efficacy. The one-way ANOVA
results for geometry self-efficacy test revealed that there was no statistically
significant difference among three grade level in terms of geometry self-efficacy test
scores. Nevertheless, scores of 6th
grade students was higher than 7th
grade students’
scores. Similarly, geometry self-efficacy scores of 7th
grade students were higher
than 8th
grade students’ scores. Erktin and Ader (2004) investigated that students
who had high mathematics anxiety had low self-efficacy. Since 8th
grade students
were preparing for the high school entrance examination, they might have been
anxious in general due to the examination. Because of this, 8th
grade students might
have low self-efficacy whereas 6th
grade students might have high self-efficacy
towards geometry. Also, 8th
grade students learned more geometry with respect to 6th

112
and 7th
grade students. Therefore, 6th
grade students might not be aware of their real
capability in geometry and they might overestimate their capabilities.
Results indicated that there was a significant positive relationship between
geometry self-efficacy and both procedural knowledge and conceptual knowledge
test scores. This meant that higher levels of geometry self-efficacy of private middle
school students were associated with higher scores in the PKT and CKT. In other
words, students who had high self-efficacy towards geometry performed better in
conceptual and procedural tasks in the area and perimeter concepts, confirming the
positive relationship between mathematics performance and self-efficacy found in
another studies (Erktin& Ader, 2004; Pajares & Miller, 1994; Reçber, 2011). On the
other hand, Tsamir (2012) investigated the relationship between young children’s
geometric knowledge and their self- efficacy beliefs. Results indicated that students
had high self-efficacy and their self-efficacy was not significantly related to their
geometric knowledge. Therefore, results of the present study might be considered as
inconclusive considering the previous studies.
5.4 Implications and Recommendations for Further Research
In the study the main focus was to investigate private middle school students’
procedural and conceptual knowledge in the domain of area and perimeter of
geometric figures and to examine the most common errors in these types of tests. The
other specific interest of the study was to examine how students’ conceptual and
procedural knowledge aspects of area and perimeter of geometric figures changed
with respect to their geometry self-efficacy. Based on the findings of this study,
several implications for teacher educators, teachers and curriculum developers, and
Ministry of National Education could be deduced.
First, mathematics teachers should be aware of students’ background
knowledge, possible misconceptions and errors before teaching a topic. If teachers
plan their lessons by the existing and possible future of the errors, effective teaching
could be conducted on the basis of students’ needs and the curriculum. In the study,
it was seen that students had both procedural and conceptual difficulties in the
domain of area and perimeter. If teachers enter classrooms by knowing the problems
113
of students in procedures and concepts, they might prepare well-oriented lessons. In
mathematics, both procedural and conceptual knowledge is important. Therefore,
teachers could design activities in which students could improve their procedural
skills and conceptual knowledge about the topic.
According to the specific results of the study, teachers could emphasize on
certain points in teaching area and perimeter concepts. For example, in the study it
was investigated that all students had problems with perimeter and area of the
parallelogram. Teachers can provide more meaningful activities to make students’
knowledge permanent both procedurally and conceptually on that concept. Besides
this, students’ evaluation of the figures by looking at its appearance was one of the
remarkable results of the study. Therefore, teachers should make students be engaged
with both realistic measurements and predictions. Furthermore, teachers could design
activities which prove the changeability of the perimeter and the conservation of the
area. Students should be provided with different questions which also included daily
life examples. In this way, different viewpoints should be initiated for students.
Moreover, informal activities focusing on the area and perimeter attributes of figures
rather than the formulas could be included in schools mathematics beginning from
the early years of the primary school.
Not only for area and perimeter topics, but also for other mathematics topics
starting from primary grade levels, studies focusing on students’ procedural and
conceptual knowledge should be conducted. According to the procedural and
conceptual errors, for students and teachers textbooks and teacher books could be
designed. Teachers become aware of what and how they might teach and students
become aware of the nature of the topics. As a result of these, more meaningful
teaching and learning could occur.
Faculties of education could take the findings of this study into the
consideration while training mathematics teachers. During the method courses, topics
should be investigated in detail. Especially, possible procedural and conceptual
errors should be examined for specific topics. As mentioned in most of the study,
teachers’ content knowledge is very important for teaching. As a result of this,

114
making pre-service teachers being aware of the topics and teaching of these topics is
also significant. Especially the errors that students might have and how to overcome
those difficulties should be discussed. It is recommended that method lessons should
be designed to make pre-service teachers be knowledgeable about the procedural and
conceptual errors in the mathematics topics. Articles about studies in this domain
could be recommended to not only pre-service teachers but also in-service teachers.
Moreover, factors (e.g. self-efficacy as in the study) that affect students’ performance
could be considered in pre-service and in-service training.
Curriculum developers, textbook authors, and researchers could consider the
results of the present study while preparing guidebooks for teachers. They should
design curriculum and the books by taking into consideration of students’ possible
errors in the area and perimeter domain. The density of the part of the topic for each
grade level could be considered. Also, Ministry of National Education should use the
findings of the present study. The detailed information related to students procedural
and conceptual errors in the domain of perimeter in all grade levels might be
included in the curriculum.
The present study has limitations for generalizability. In the study, the
sampling method was convenience sampling which meant that the researcher
collected data from the individuals who were available (Fraenkel & Wallen, 2006).
In order to make generalization of the findings to the population, further research
including the randomly selected sample from the all elementary schools in Turkey
might be conducted. Moreover, 5th
grade students also could be added to sample due
to the new regulations in the education system in Turkey in order to understand the
development of procedural and conceptual knowledge across the middle school
period. Besides, a longitudinal study could be conducted to see the changes in
procedural and conceptual knowledge of elementary students. In this way, the
suitability and design of the objectives in different grade level mathematics
curriculum related to area and perimeter for grade levels could be investigated. Also,
teachers’ content knowledge in area and perimeter and process of teaching these
topics could be investigated in further research.
115
5.5. Last words
I started this study with a conversation with one of my students in my mind.
Although she was very successful in her mathematics examinations, she thought that
she was good at only memorized procedures and she thought that she sometimes was
not aware of some concepts. After this conservation, I realized that since she had low
self-efficacy at conceptual tasks, she felt this way. I understood that when students
gave meaning to concepts and when they were aware of procedures which they
solved, they relied on themselves and these students had high self-efficacy.
Moreover, I saw that the students who had high self-efficacy were more successful in
tasks.
I have realized that area and perimeter were problematic topics in all grade
levels. I am teaching 5th
grade students now and I saw similar errors also in their
tasks. However, because of the results of the present study, I taught this topic to my
5th
grade students more carefully. Because, I knew the errors that they might do and I
oriented my worksheets according to special questions in which they might have
done possible errors. Now, I am planning that as I get more experienced, I will
analyze students’ errors in all topics and I will use the results in designing my further
lessons as a middle school mathematics teacher.
Finally, I understood that as mathematics teachers, our duty is not to teach
mathematics but to teach quality mathematics. Knowing both procedural and
conceptual errors about a topic may provide teachers with the opportunity to help
their students discover the truths and errors about a topic on their own.
116
REFERENCES
Aksu, H. H. (2006). İlköğretimde aktif öğrenme modeli ile geometri öğretiminin
geometrik düşünme düzeylerine etkisi. Çukurova Üniversitesi Eğitim
Fakültesi Dergis, 3(34), 57-68.
Anderson, J. (1983). The architecture of cognition. Cambridge, MA: Harvard
University.
Ayas, A. ve Demirbaş, A. (1997). Turkish secondary students’ conception of
introductory chemistry concept. Journal of Chemical Education, 74(5), 518-
521.
Bandura, A. (1977). Self-efficacy: Toward a unifying theory of behavioral change.
Psychological Review, 84, 191-215.
Bandura, A. (1986). Social foundations of thought and action: A social cognitive
theory. Englewood Cliffs, NJ: Prentice Hall.
Baroody, A. J., Feil, Y., & Johnson, A. R. (2007). An alternative reconceptualization
of procedural and conceptual knowledge. Journal for Research in
Mathematics Education, 38(2), 115 – 131.
Barret, J. E., & Clements, D. H. (2003). Quantifying length: Children’s developing
abstractions for measures of linear quantity in one-dimensional and two-
dimensional contexts. Cognition and Instruction, 21, 475-520.
Baykul, Y. (2000). İlköğretimde matematik öğretimi 1-5. sınıflar için. Ankara:
Pegem Yayınları.
Bingölbali, E. ve Özmantar, M.F. (2009). Matematiksel zorluklar ve çözüm önerileri.
Ankara: Pegem Akademi Yayıncılık.
Bisanz, J. & Lefevre, J. A. (1992). Understanding Elementary Mathematics. In J. I.
D. Campbell (Ed.), The nature and origins of mathematical skills (pp. 113-
136). Amsterdam: Elsevier Science.

117
Briars, D. & Siegler, R., S. (1987). A featural analysis of preschoolers‘ counting
knowledge. Development Psychology, 20(4), 607-618.
Büyükkasap, E., Samancı, O. (1998). İlköğretim öğrencilerinin “Işık” hakkındaki
yanlış kavramları. Kastamonu Eğitim Dergisi, 4, 109-120.
Byrnes, J. P., & Wasik, B. A. (1991). Role of conceptual knowledge in mathematical
procedural learning. Development Psychology, 27(5), 777-786.
Cantürk-Günhan, B., & Başer, N. (2007). The development of self-efficacy scale
toward geometry. Hacettepe Üniversitesi Eğitim Fakültesi Dergisi, 33, 68-76.
Carpenter, T. P. (1986). Conceptual knowledge as a foundation for procedural
knowledge: Implications from research on the initial learning of arithmetic. In
J. Hiebert (Ed.), Conceptual and procedural knowledge: The case of
mathematics (pp. 113-132). Hillsdale, NJ: Lawrence Erlbaum Associates, Inc.
Clements, D. H., & Battista, M. T. (2001). Length, perimeter, area, and volume. In L.
S. Grinstein & S. I. Lipsey (Eds.), Encyclopedia of mathematics education
(pp. 406-410). New York: Routledge Falmer.
Crocker, L., & Algina, J. (1986). Introduction to classical and modern test theory.
Florida: Holt, Rineart and Winston, Inc.
Crowley, K. & Siegler, R. S. (1994). Constraints on learning in non-privileged
domains. Cognitive Psychology, 27, 194-227.
Çakır, S.Ö. ve Yürük, N. (1999). Oksijenli ve Oksijensiz Solunum Konusunda
Kavram Yanılgıları Teşhis Testinin Geliştirilmesi ve Uygulanması. III. Fen
Bilimleri Eğitimi Sempozyumu. M.E.B. ÖYGM
Dağlı, H. (2010). İlköğretim beşinci sınıf öğrencilerinin çevre, alan ve hacim
konularına ilişkin kavram yanılgıları. Yayımlanmamış yüksek lisans tezi,
Afyon Kocatepe Üniversitesi.
Dursun, Ö. (2010). The relationships among the preservice teachers' spatial
visualization ability, geometry self-efficacy, and spatial anxiety. Unpublished
Master Thesis, Middle East Technical University, Ankara.

118
Emekli, A. (2001). Ölçüler konusunun öğretiminde yanılgıların teşhisi ve alınması
gereken tedbirler. Yayınlanmamış Yüksek Lisans Tezi, Selçuk Üniversitesi,
Konya.
Engelbrecht, J., Harding, A. & Potgieter, M. (2005). Undergraduate students’
performance and confidence in procedural and conceptual mathematics.
International Journal of Mathematical Education in Science &
Technology,36(7), 701-712.
Eryılmaz, A., & Sürmeli, E. (2002). Üç-aşamalı sorularla öğrencilerin ısı ve sıcaklık
konularındaki kavram yanılgılarının ölçülmesi,
http://www.fedu.metu.edu.tr/ufbmek-5/, Last accessed date May 15, 2012
Fuson, K. C. (1988). Children's Counting and Concepts of Number. New York:
Springer-Verlag.
Fraenkel, J. R., & Wallen, N. E. (2006). How to design and evaluate research in
education. New York: McGraw Hill Companies, Inc.
Gawith, G. (1995). A Serious Look at Self-Efficacy: Or Waking Beebing Slooty.
http://www.theschoolquarterlycom/info_lit_archive/learning_thinking/95_g_a
slawebs.htm, Last accessed date June 20, 2012
Gelman, R., & Meck, E. (1983). Preschoolers’ counting: Principles before skill.
Cognition, 13, 343–359.
Grinstein & S. I. Lipsey (Eds.), Encyclopedia of mathematics education (pp. 406-
410). NewYork: Routledge Falmer.
Haapasalo, L. & Kadijevich, Dj. (2000). Two types of mathematical knowledge and
their relation. Journal für Mathematik-Didaktik, 21( 2), 139-157.
Hackett, G., & Betz, N. E. (1989). An exploration of the mathematics self-
efficacy/mathematics performance correspondence. Journal for Research in
Mathematics Education, 20(3), 261-273.

119
Hart, K. (1984). Which comes first - length, area, or volume? Arithmetic Teacher,
31(9), 16-18, 26-27.
Hiebert, J., & Carpenter, T. P. (1992). Learning and teaching with understanding. In
D. A. Grouws (Ed.), Handbook of research on mathematics teaching and
learning (pp. 65-97). NewYork: Mcmillan.
Hiebert, J., & Lefevre, P. (1986). Conceptual and procedural knowledge in
mathematics: An introductory analysis. In J. Hiebert (Ed.), Conceptual and
procedural knowledge: The case of mathematics (pp. 1-27). Hillsdale, NJ:
Lawrence Erlbaum Associates.
Hodges, C.B. & Murphy, P.F. (2009). Sources of self-efficacy beliefs of students in a
technology-intensive asynchronous college algebra course. The Internet and
Higher Education, 12(2), 93-97.doi:10.1016/j.iheduc.2009.06.005
Hoy A. W. & Spero R. B. (2005). Changes in teacher efficacy during the early years
of teaching: A comparison of four measures. Teaching and Teacher
Education, 21 ,343–356
Işıksal, M. (2002). The effect of spreadsheet and dynamic geometry software on the
mathematics achievement and mathematics self-efficacy of 7th grade
students.Yayımlanmamış yüksek lisans tezi. Orta Doğu Teknik Üniversitesi,
Ankara.
Işıksal, M. (2005). Pre-service teachers’ performance in their university coursework
and mathematical self-efficacy beliefs: What is the role of gender and year in
program? The Mathematics Educator, 15(2), 8-16.
Isiksal, M., & Askar, P. (2005). The effect of spreadsheet and dynamic geometry
software on the achievement and self-efficacy of 7th-grade students.
Educational Research, 47(3), 333-350.
Jitendra, A. K., DiPipi, C. M., & Perron-Jones, N. (2002). An exploratory study of
word problem-solving instruction for middle school students with learning

120
disabilities: An emphasis on conceptual and procedural understanding.
Journal of Special Education, 36(1), 23-38.
Kahle, D. K. B. (2008). How elementary school teachers’ mathematıcal self-effıcacy
and mathematıcs teachıng self-effıcacy relate to conceptually and
procedurally orıented teachıng practıces. Unpublished Doctoral Dissertation.
The Ohio State University
Kamii, C & Kysh, J. (2006). The difficulty of “length x width”: Is a square the unit
of measurement? Journal of Mathematical Behavior, 25, 105-115.
Kidman, G. & Cooper, T.J. (1997). Area integration rules for grades 4, 6, 8 students.
In E. Pehkonen (Ed.), Proceedings of the 21st Annual Conferenceof the
International Group for the Psychology of Mathematics Education, (132-
143). 3. Lahti, Finland: University of Finland.
Kilpatrick, J., Swafford, J., and Findell, B. (Eds.). (2001). Adding it up: Helping
children learn mathematics. Washington, DC: National Research Council.
Kültür, M.N., Kaplan, A. ve Kaplan, N. (2002). İlköğretim Okulları 4. ve 5.
Sınıflarda Uzunluk, Alan ve Hacim Ölçüleri Konularının Öğretiminin
Değerlendirilmesi. Kastamonu Eğitim Fak. Dergisi, 10(2), 297-308.
Lehrer, K. (1999). Justification, coherence and knowledge. Erkenntnis, 50(2-3), 243-
258.
Lehrer, R. (2003). Developing understanding of measurement. In Kilpatrick, J.,
Martin, W. G., & Schifter, D., A research companion to Principles and
Standards for school mathematics. Reston, VA: National Council of Teachers
of Mathematics.
Luneta K.& Makonye P.J. (2010). Learner errors and misconceptions in elementary
analysis: A case study of grade 12 class in South Africa. Acta Didactica
Napocensia, 3(3), 35-46.
121
Malloy, C.E. (1999). Perimeter and area through the Van Hiele model. Mathematics
Teaching in the Middle School, 5(2), 87-90.
Ministry of National Education [MoNE]. (2005). İlkögretim matematik dersi ögretim
programı 1-5. sınıflar: Ögretim programı ve kılavuzu Ankara, Turkey.
Ministry of National Education [MoNE]. (2006). İlkögretim matematik dersi ögretim
programı 6-8. sınıflar: Ögretim programı ve kılavuzu Ankara,Turkey
Ministry of National Education [MoNE]. (2013). Ortaokul Matematik dersi öğretim
programı 5-8. sınıflar. Ögretim programı ve kılavuzu Ankara,Turkey
Moreira, C. Q. & Contente, M. do R. (1997). The role of writing to foster pupil’s
learning about area. In E. Pehkonen (Ed.), Proceedings of the 21st PME
International Conference, 3, 256-263.
National Council of Teachers of Mathematics (NCTM). (2000). Principles and
standards for school mathematics: An overview. Retrieved on October 19,
2005, fromwww.nctm.org/standards/
Noss, R.& Baki, A. (1996): Liberating school mathematics from procedural view.
Journal of Hacettepe Education, 12, 179-182.
Özsoy, N. (2003). İlköğretim matematik derslerinde yaratıcı drama yönteminin
kullanılması. BAÜ Fen Bilimleri Enstitüsü Dergisi. 5(2), 112-119.
Pajares, F. (1996). Self-Efficacy Beliefs in Academic Settings. Review of
Educational Research, 66(4), 543-578.
Pajares, F., & Miller, D. (1995). Mathematics self-efficacy and mathematics
performance: The need for specificity of assessment. Journal of Counseling
Psychology, 42(2), 190-198.
Pajares, F., & Miller, M. D. (1994). The role of self-efficacy and self-concept beliefs
in mathematical problem-solving: A path analysis. Journal of Educational
Psychology, 86, 193–203.

122
Piajet, J. (1978). Success and understanding. London: Routledge and Kegan Paul.
Pintrich, P. R. (1999). The Role of Motivation in Promoting and Sustaining Self-
Regulated Learning. International Journal of Educational Research, 31, 459-
470.
Reçber, Ş.(2011). An investigation of the relationship among the seventh grade
students’ mathematics self-efficacy, mathematics anxiety, attitudes towards
mathematics and mathematics achivement regarding gender and school type.
Unpublished master’s thesis. Middle East Tecnical University, Ankara.
Riccomini, P. J. (2005). Identification and remediation of systematic error patterns in
subtraction. Learning Disability Quarterly, 28(3), 1-10.
Rittle-Johnson, B. & Alibali, M. W. (1999): Conceptual and procedural knowledge
of mathematics: Does one lead to the other? Journal of Educational
Psychology, 91, 175-189.
Rittle-Johnson, B., & Siegler, R. S. (1998). The relationship between conceptual and
procedural knowledge in learning mathematics: A review. In C. Donlan (Ed.),
The development of mathematical skills (pp. 75–110). Hove, UK: Psychology
Press.
Senemoğlu, N. (1997). Gelişim Öğrenme ve Öğretim Kuramdan Uygulamaya,
Ankara: Ertem Matbaacılık
Schunk, D. H. (1991). Self-efficacy and academic motivation. Educational
Psychologist, 26(3/4), 207-231.
Schunk, D. H. (2008). Learning Theories, Prentice hall, Third edition.
Schunk, D. H., Pintrich, P. R., & Meece, J. L. (2008). Motivation in education:
Theory, research, and applications (3rd ed.). Upper Saddle River, NJ:
Pearson Education.

123
Sfard, A.(1991). On the dual nature of mathematical conceptions: reflections on
processes and objects as different sides of the same coin. Educational Studies
in Mathematics, 22, 1-36.
Sherman, H., Randolph, T. (2003). Area and Perimeter: Which is which and how do
we know?. Research for Educational Reform. University of Missouri: St.
Louis.
Silver, E., A. (1986). Using conceptual and procedural knowledge. A focus on
relationships. In J. Hiebert (Ed.), Conceptual and procedural knowledge: The
case of mathematics (pp.181-198). Hillsdale, NJ: Lawrence Erlbaum
Associates,Inc.
Skemp, R. (1987). Relational understanding and instrumental understanding. In The
psychology of learning mathematics (pp.152-163). Mahwah, NJ: Erlbaum.
Sophian, C. (1997). Beyond competence: The significance of performance for
conceptual development. Cognitive Development, 12, 281-303
Star, J.R. (2005). Reconceptualizing procedural knowledge. Journal for Research in
Mathematics Education, 36, 404-411.
Tan Şişman, G.(2010).Sixth grade students’ conceptual and procedural knowledge
and word problem solving skills in length, area, and volume measurement.
Unpublished master’s thesis. Middle East Tecnical University, Ankara.
Tan Şişman, G. ve Aksu, M. (2009). Yedinci sınıf öğrencilerinin alan ve çevre
konularındaki başarıları. İlköğretim Online. 8(1), 243-253. [Online:
http://ilkogretim-online.org.tr].
Thompson, T. D., & Preston, R. V. (2004, May). Measurement in the middle grades:
Insights from NAEP and TIMMS. Mathematics Teaching in the Middle
School, 9, 514-519.
124
Usher, E. L., & Pajares, F. (2006). Sources of academic and self-regulatory efficacy
beliefs of entering middle school students. Contemporary Educational
Psychology, 31, 125-141.
Van de Walle, J. (2007). Elementary and Middle School Mathematics: Teaching
Developmentally (6th
ed.).Boston, MA: Pearson.
Van de Walle, J. (2012). Elementary and Middle School Mathematics: Teaching
Developmentally (7th
ed.).Boston, MA: Pearson.
Wynn, K. (1990). Children’s understanding of counting. Cognition, 36, 155-193.
Yağbasan, R. ve Gülçiçek, G. (2003). Fen öğretiminde kavram yanılgılarının
karakteristiklerinin tanımlanması. Pamukkale Üniversitesi Eğitim Fakültesi
Dergisi, 13, 110-128.
Zarch, M. K., & Kadivar, P. (2006). The role of mathematics self-efficacy and
mathematics ability in the structural model of mathematics performance.
WSEAS Transactions on Mathematics, 6, 713–720
Zimmerman, B. J. (1995). Self-efficacy and educational development. In A. Bandura,
(Ed.), Self-efficacy in changing socities. New York: Cambridge University
Press.
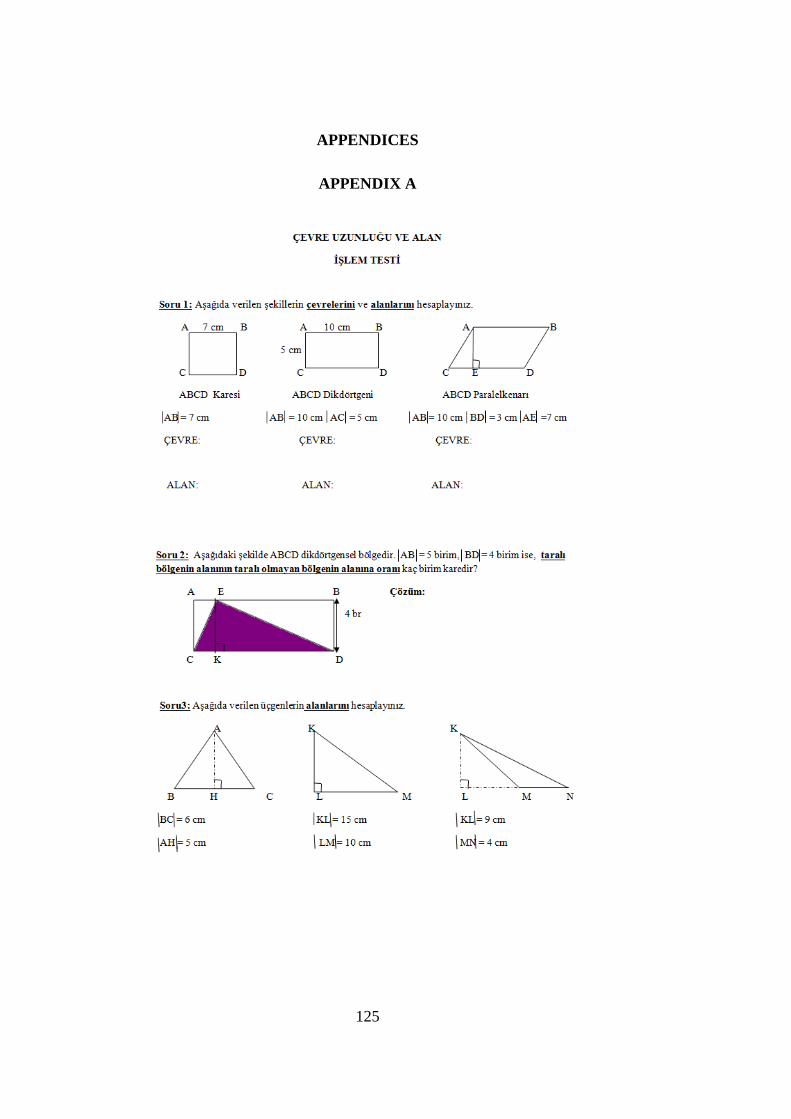
125
APPENDICES
APPENDIX A
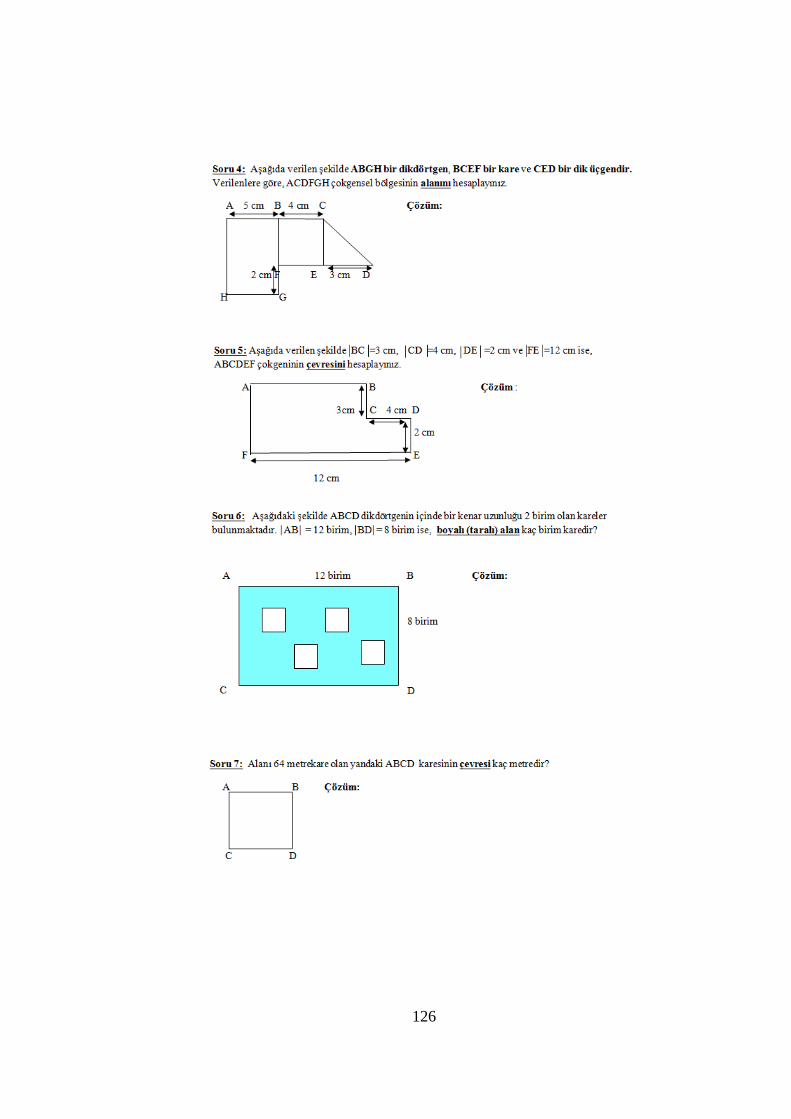
126

127

128
APPENDIX B

129

130
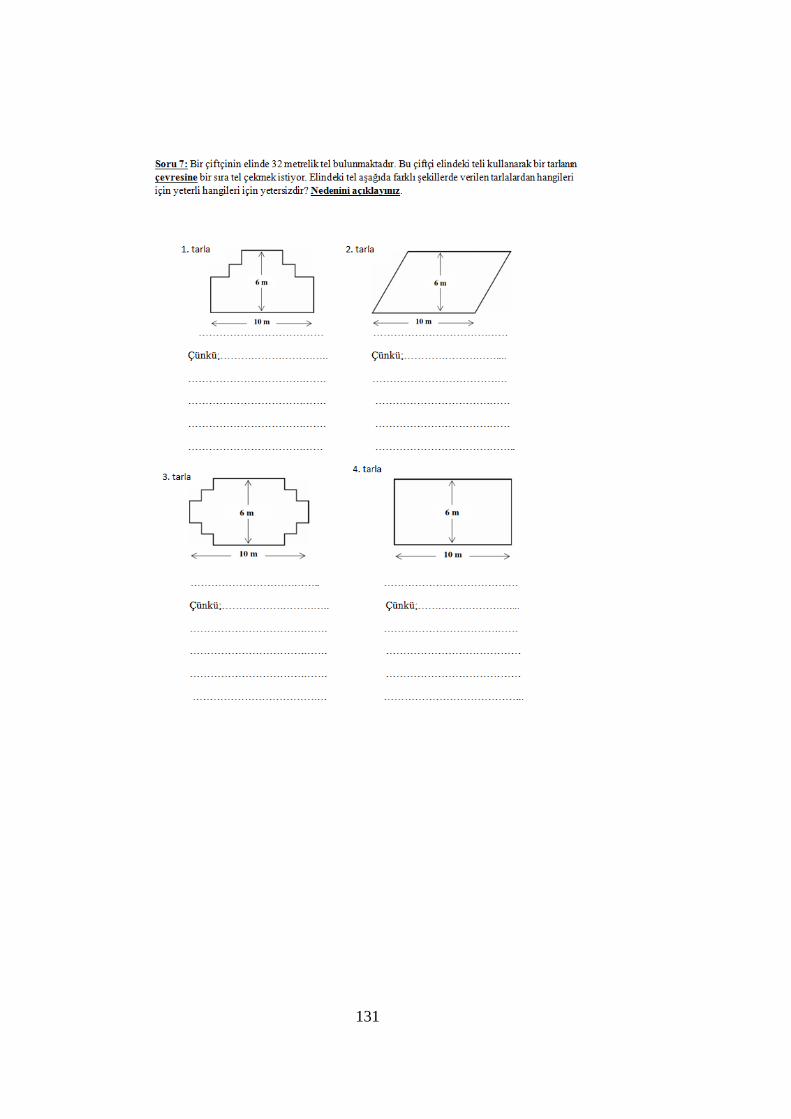
131
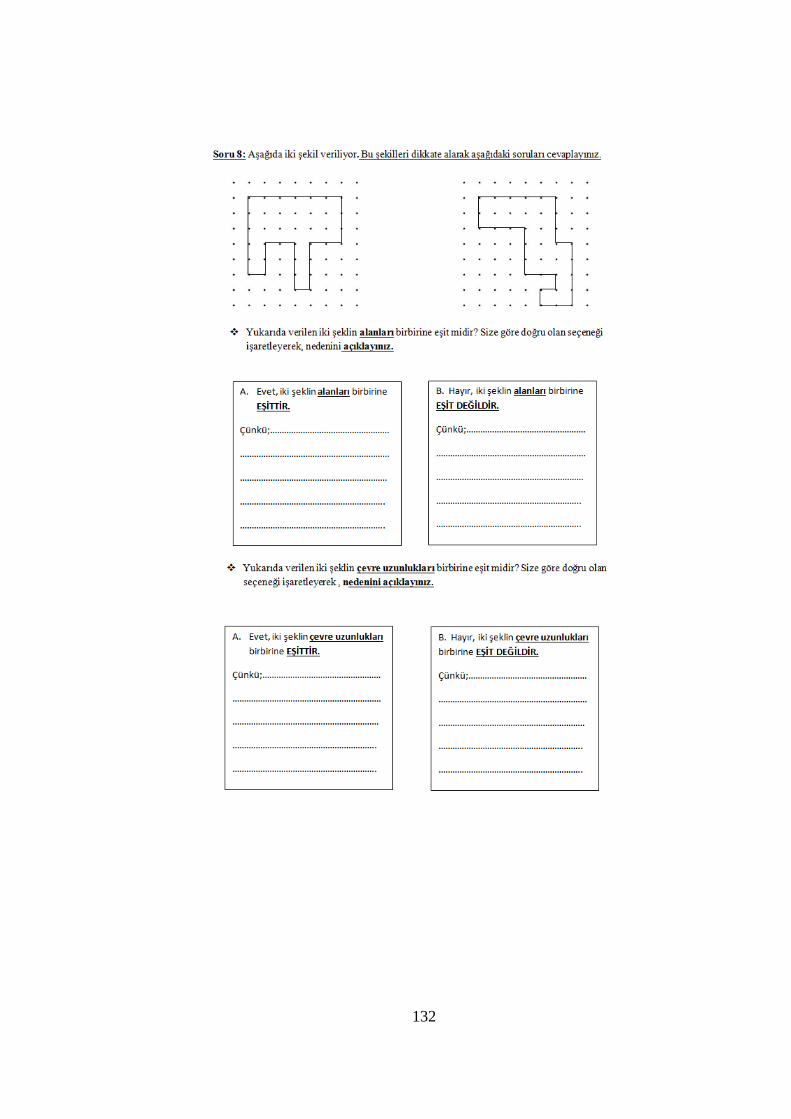
132

133
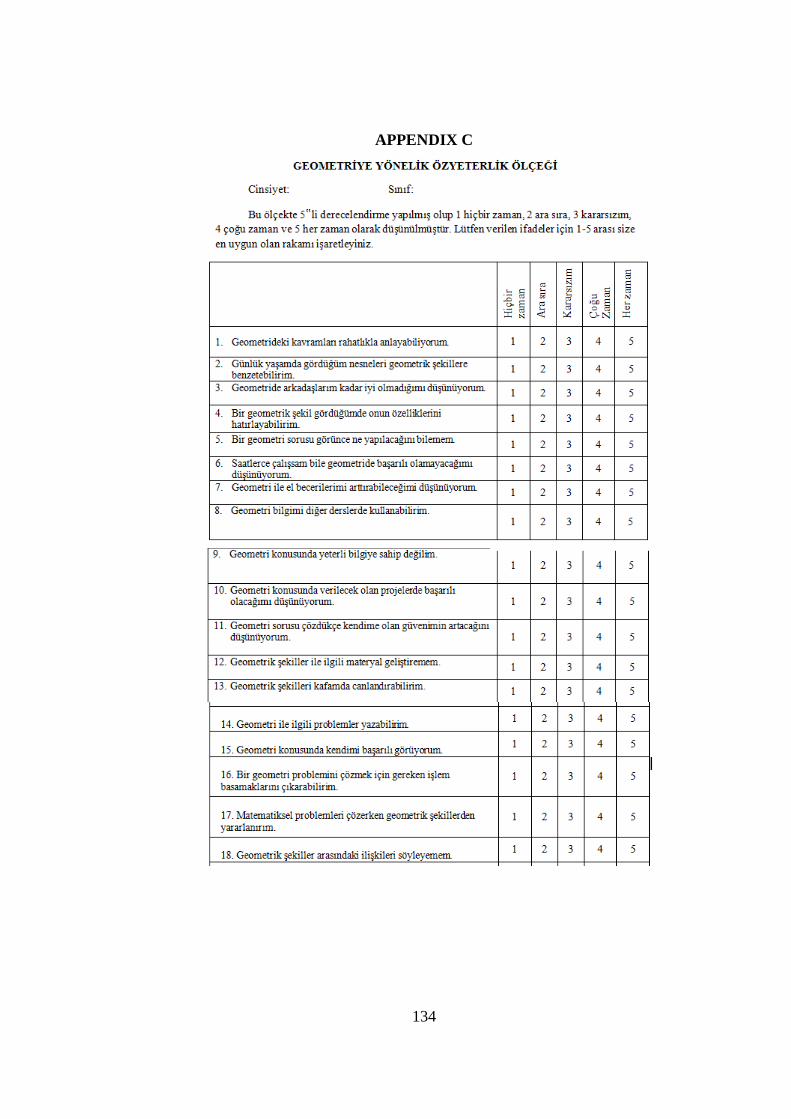
134
APPENDIX C
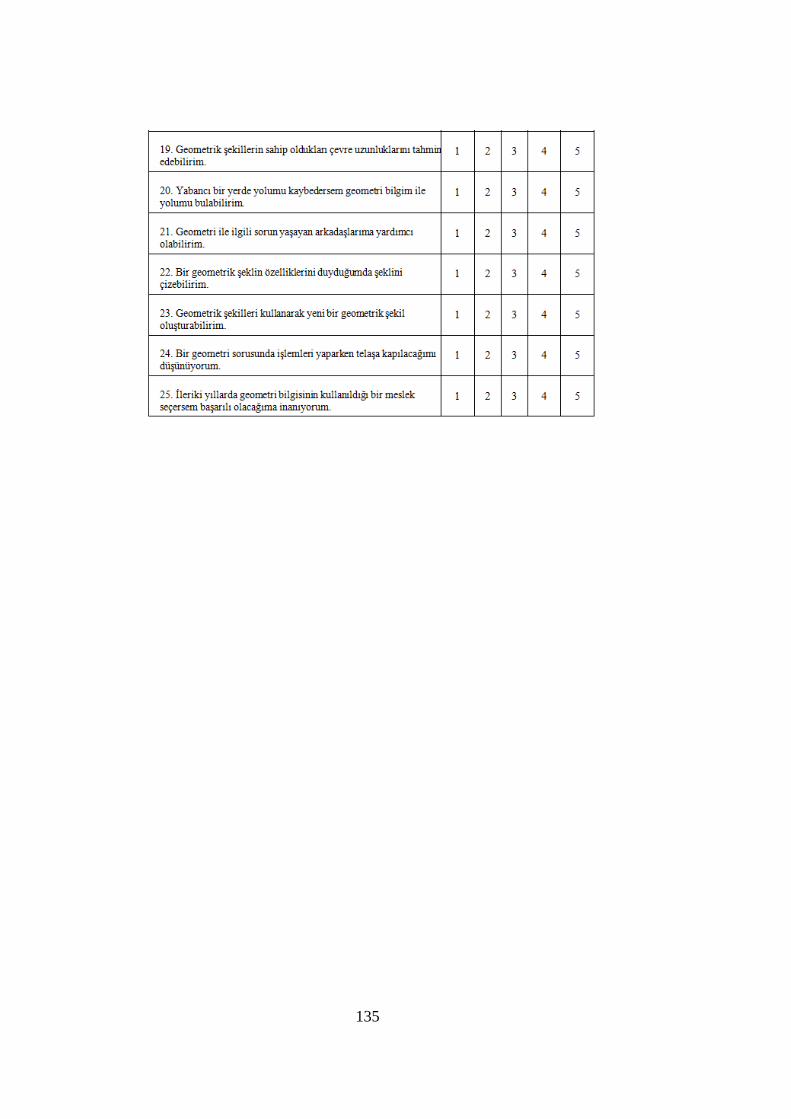
135

136
APPENDIX D
RUBRIC FOR PROCEDURAL KNOWLEDGE TEST
Q1 EXPLANATION POINTS
Finding the area and perimeter of square and
rectangle correctly
Finding the area and perimeter of parallelogram
correctly
Each computational error
1,5 points each (1,5 x
4= 6 pts)
2 points each ( 2 x 2
= 4 pts)
-1 point
Q2
Finding the area of the rectangle correctly
Finding the area of the triangle correctly
Finding the ratio correctly
Each computational error
3 points
3 points
4 points
-1 point
Q3
Finding the areas of acute-angled and right-
angled triangles correctly
Finding the area of obtuse-angled and right-
angled triangles correctly
Each computational error
3 points each (3x2= 6
pts )
4 points
-1 point
Q4
Finding the area of the rectangle correctly
Finding the area of the square correctly
Finding the area of the triangle correctly
Finding the sum
Each computational error
3 points
3 points
3 points
1 point
-1 point
Q5
Finding the perimeter of the shape correctly
Each computational error
10 points
-1 point

137
Q6
Finding the area of the small squares correctly
Finding the area of the rectangle correctly
Finding the difference
Each computational error
3,5 points
3,5 points
3 points
-1 point
Q7
Finding the side length of the square correctly
Finding the perimeter of the square correctly
Each computational error
5 points
5 points
-1 point
Q8
Finding the sum of the two adjacent side lengths
correctly
Finding the unknown side length correctly
Finding the area of the rectangle correctly
Each computational error
3 points
3 points
4 points
-1 point
Q9
Finding the area of the rectangle correctly
Finding the perimeter of the rectangle correctly
Each computational error
5 points
5 points
-1 point
Q10
Finding the area of the parallelogram correctly
Finding the length correctly
Each computational error
5 points
5 points
-1 point

138
APPENDIX E
RUBRIC FOR CONCEPTUAL KNOWLEDGE TEST
Q1 EXPLANATIONS POINTS
Correct range for three figure
Correct range for only two figure
No answer, completely irrelevant answer
10 points
3 points
0 point
Q9
For The answers 11-11,5 and 12
For the answers 10 and 13
For the answers 9 and 14
No answer, completely irrelevant answer
10 points
8 points
3 points
0 point
Q2, Q3,
Q4, Q5,
Q8, Q10
Choosing the correct answer and sufficient
explanation
Choosing the correct answer and the explanation
is close to the correct explanation but not given
exactly
Choosing the correct answer but no explanation
No answer, completely irrelevant answer
10 points
8 points
5 point
0 point
Q6 Giving correct answer for both perimeter and
area part
No answer, completely irrelevant answer
5 + 5 =10 points
0 point
Q7 Giving correct answer and correct explanation
for four figure separately
Giving correct answer but incorrect explanation
or no explanation
No answer, completely irrelevant answer
( 2,5 x4 )10 points
6 points
0 point

139
APPENDIX F
THE HISTOGRAMS SUPPORTING THE NORMALITY ASSUMPTION
FOR TEST SCORES FOR EACH GRADE LEVELS
Figure 1: Histogram of procedural knowledge test scores for 6th
grade students
Figure 2: Histogram of procedural knowledge test scores for 7th
grade students
Figure 3: Histogram of procedural knowledge test scores for 8th
grade students
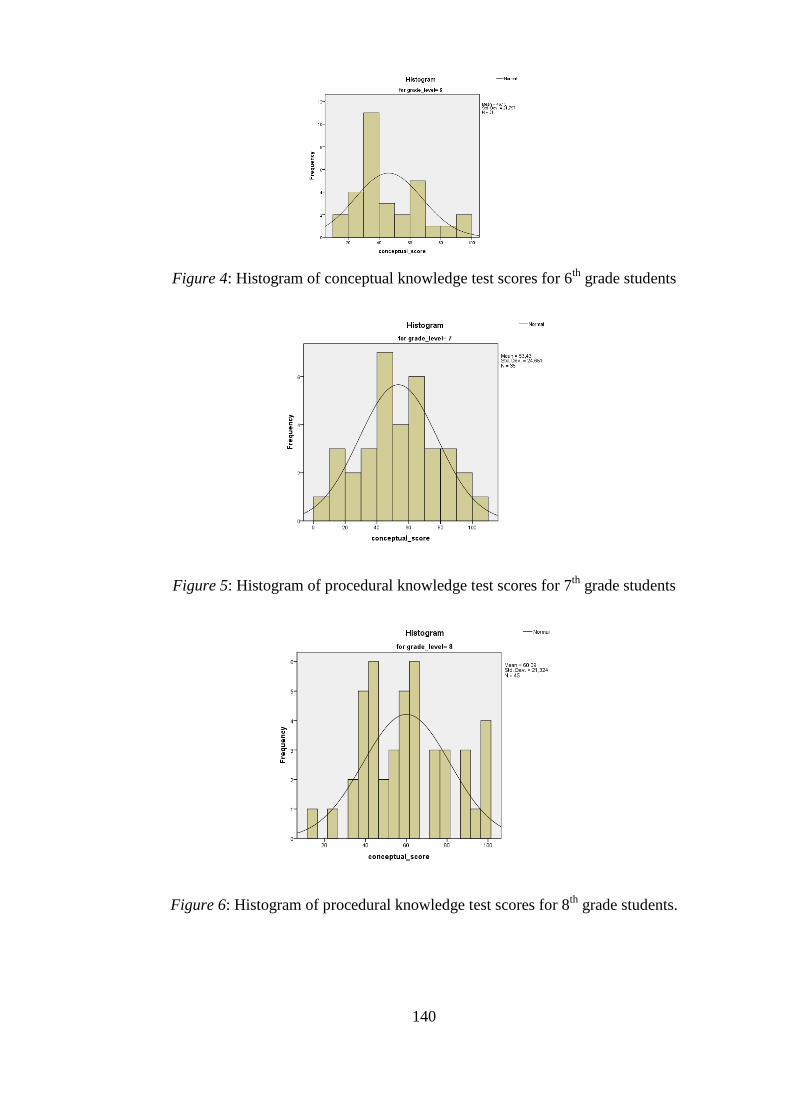
140
Figure 4: Histogram of conceptual knowledge test scores for 6th
grade students
Figure 5: Histogram of procedural knowledge test scores for 7th
grade students
Figure 6: Histogram of procedural knowledge test scores for 8th
grade students.
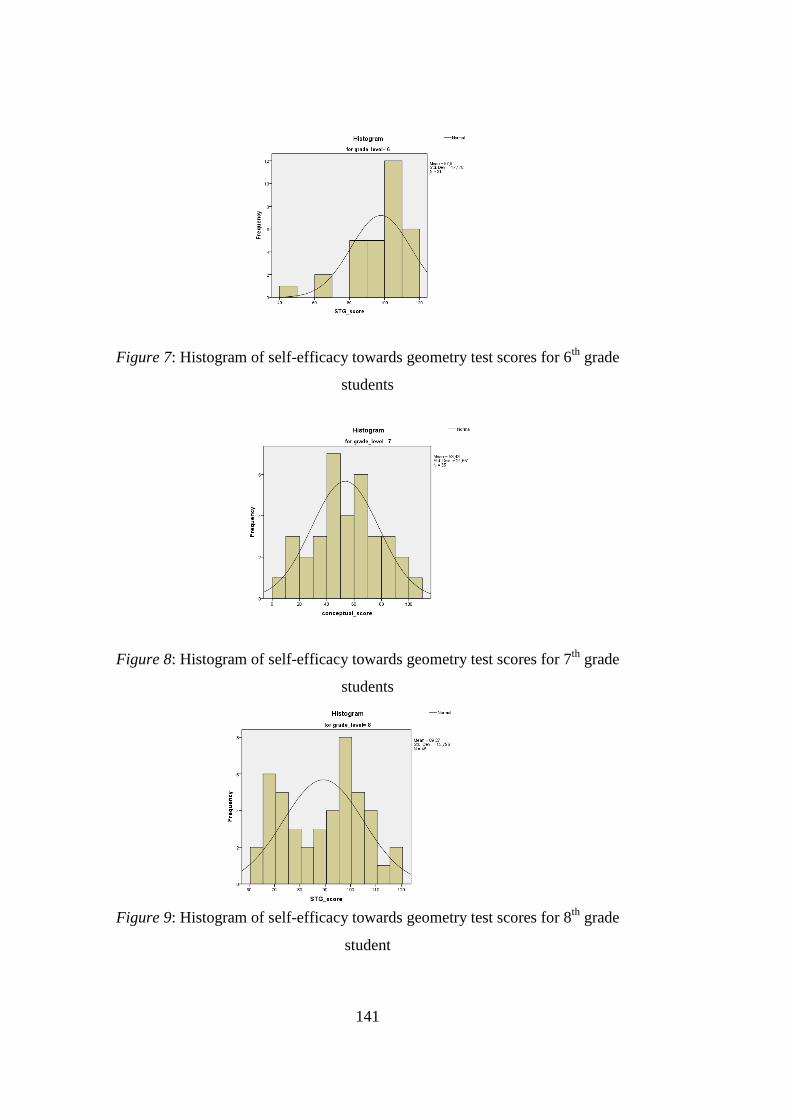
141
Figure 7: Histogram of self-efficacy towards geometry test scores for 6th
grade
students
Figure 8: Histogram of self-efficacy towards geometry test scores for 7th
grade
students
Figure 9: Histogram of self-efficacy towards geometry test scores for 8th
grade
student

142
APPENDIX G

143
APPENDIX H
TEZ FOTOKOPİSİ İZİN FORMU
ENSTİTÜ
Fen Bilimleri Enstitüsü
Sosyal Bilimler Enstitüsü
Uygulamalı Matematik Enstitüsü
Enformatik Enstitüsü
Deniz Bilimleri Enstitüsü
YAZARIN
Soyadı : ORHAN
Adı : Nagehan
Bölümü : İlköğretim Bölümü
TEZİN ADI (İngilizce) : An Investigation of Private Middle School
Students’ Common Errors in the Domain of Area and Perimeter and the Relationship
Between Their Geometry Self-Efficacy Beliefs and Basic Procedural and Conceptual
Knowledge
TEZİN TÜRÜ : Yüksek Lisans Doktora
1. Tezimin tamamından kaynak gösterilmek şartıyla fotokopi alınabilir.
2. Tezimin içindekiler sayfası, özet, indeks sayfalarından ve/veya bir
bölümünden kaynak gösterilmek şartıyla fotokopi alınabilir.
3. Tezimden bir (1) yıl süreyle fotokopi alınamaz.
Yazarın İmzası: Tarih:
X
X
X