
An investigation of operating conditions on anodic ...
13
Advances in Environmental Technology 1 (2018) 61-73 *Corresponding author. Telephone: +98-21-77491242 E-mail address: [email protected] DOI: 10.22104/AET.2018.2874.1140 Advances in Environmental Technology journal homepage: http://aet.irost.ir An investigation of operating conditions on anodic oxidation of synthetic sulfide-containing wastewaters at the surface of a platinum electrode using cyclic voltammetry Amir Behrouzifar 1,2 , Soosan Rowshanzamir 1,2* , Mansour Bazmi 3 1 Fuel Cell Laboratory, Green Research Center, Iran University of Science and Technology (IUST), Tehran, Iran 2 Schools of Chemical Engineering, Iran University of Science and Technology (IUST), Tehran, Iran 3 Research Institute of Petroleum Industry (RIPI), Tehran, Iran A R T I C L E I N F O A B S T R A C T Article history: Received 25April 2018 Received in revised form 13 June 2018 Accepted 24 June 2018 In this paper, cyclic voltammetry (CV) was used to study the effects of operating parameters (i.e., sulfide concentration, sodium chloride concentration as supporting electrolyte, temperature, mixing speed, and potential scan rate) on the anodic oxidation of synthetic sulfide-containing wastewaters at the surface of a platinum electrode. The results revealed that anodic oxidation could be used to eliminate sulfide from wastewaters in a wide concentration range, and the oxidation current was an ascending function of the sulfide concentration. The supporting electrolyte concentration had a negligible effect, as the sulfide dissociated in the aqueous media and brought electrical conductivity to the solution. The optimum concentration of electrolyte was found to be 0.05 mol/L. Increasing temperature improved the kinetics of the oxidation reactions and enhanced the electrical conductivity of the solution, which resulted in increasing the anodic oxidation rate. However, at higher temperatures, undesired side reactions were activated which resulted in lowering the power efficiency of the desired anodic oxidation reactions. The optimum operating temperature was found to be 40 – 60 °C. The mixing speed had a periodic effect on the sulfide oxidation. It decreased the diffusion resistance and also the residence time of sulfide at the electrode surface. These phenomena affected the anodic oxidation oppositely and hence, a middle value around 200 rpm was found to be the optimum. By increasing the potential scan rate, the time of performing the reactions in each cycle increased and the overall oxidation progress improved. It was found that mass transfer resistance was a limiting step in the overall reaction. Based on the findings, anodic oxidation has the potential for treating sulfide-containing wastewaters and in the future may be a competitor for conventional treatment processes. Keywords: Wastewater treatment Electrochemical oxidation Anodic oxidation Cyclic voltammetry Sulfide pollutant 1. Introduction Sulfide is one of the key contaminants which presents in industrial and domestic wastewaters [1]. It has an extremely unpleasant odor [2] and contributes to corrosion in wastewater collection and treatment systems [3,4]. Also, sulfide is very toxic [5], which may cause health problems for those working in plants producing or treating sulfide- containing wastewater. Sulfide is present in the wastewater produced in petroleum production surface facilities [6], crude oil refineries [7], petrochemical plants [8], spent caustic treatment units [9], tanneries [10], pulp and paper mills [11], etc. The concentration of sulfide in the waste streams is dependent on the process [12]. For example, there are two major sources of sulfide-containing wastewater in petroleum refineries: crude oil desalter
Transcript of An investigation of operating conditions on anodic ...

Advances in Environmental Technology 1 (2018) 61-73
*Corresponding author. Telephone: +98-21-77491242 E-mail address: [email protected]
DOI: 10.22104/AET.2018.2874.1140
Advances in Environmental Technology
journal homepage: http://aet.irost.ir
An investigation of operating conditions on anodic oxidation of synthetic sulfide-containing wastewaters at the surface of a platinum electrode using cyclic voltammetry
Amir Behrouzifar1,2, Soosan Rowshanzamir1,2*, Mansour Bazmi3 1 Fuel Cell Laboratory, Green Research Center, Iran University of Science and Technology (IUST), Tehran, Iran 2 Schools of Chemical Engineering, Iran University of Science and Technology (IUST), Tehran, Iran 3 Research Institute of Petroleum Industry (RIPI), Tehran, Iran
A R T I C L E I N F O A B S T R A C T
Article history: Received 25April 2018 Received in revised form 13 June 2018 Accepted 24 June 2018
In this paper, cyclic voltammetry (CV) was used to study the effects of operating parameters (i.e., sulfide concentration, sodium chloride concentration as supporting electrolyte, temperature, mixing speed, and potential scan rate) on the anodic oxidation of synthetic sulfide-containing wastewaters at the surface of a platinum electrode. The results revealed that anodic oxidation could be used to eliminate sulfide from wastewaters in a wide concentration range, and the oxidation current was an ascending function of the sulfide concentration. The supporting electrolyte concentration had a negligible effect, as the sulfide dissociated in the aqueous media and brought electrical conductivity to the solution. The optimum concentration of electrolyte was found to be 0.05 mol/L. Increasing temperature improved the kinetics of the oxidation reactions and enhanced the electrical conductivity of the solution, which resulted in increasing the anodic oxidation rate. However, at higher temperatures, undesired side reactions were activated which resulted in lowering the power efficiency of the desired anodic oxidation reactions. The optimum operating temperature was found to be 40 – 60 °C. The mixing speed had a periodic effect on the sulfide oxidation. It decreased the diffusion resistance and also the residence time of sulfide at the electrode surface. These phenomena affected the anodic oxidation oppositely and hence, a middle value around 200 rpm was found to be the optimum. By increasing the potential scan rate, the time of performing the reactions in each cycle increased and the overall oxidation progress improved. It was found that mass transfer resistance was a limiting step in the overall reaction. Based on the findings, anodic oxidation has the potential for treating sulfide-containing wastewaters and in the future may be a competitor for conventional treatment processes.
Keywords: Wastewater treatment Electrochemical oxidation Anodic oxidation Cyclic voltammetry Sulfide pollutant
1. Introduction
Sulfide is one of the key contaminants which presents in industrial and domestic wastewaters [1]. It has an extremely unpleasant odor [2] and contributes to corrosion in wastewater collection and treatment systems [3,4]. Also, sulfide is very toxic [5], which may cause health problems for those working in plants producing or treating sulfide-
containing wastewater. Sulfide is present in the wastewater produced in petroleum production surface facilities [6], crude oil refineries [7], petrochemical plants [8], spent caustic treatment units [9], tanneries [10], pulp and paper mills [11], etc. The concentration of sulfide in the waste streams is dependent on the process [12]. For example, there are two major sources of sulfide-containing wastewater in petroleum refineries: crude oil desalter

A. Behrouzifar et, al / Advances in Environmental Technology 1 (2018) 61-73 62
effluent and sour waters produced in the different units [13]. The maximum concentration of sulfide in these wastewaters are about 100 and 10 mg/L, respectively [14]. However, sulfide concentration is very high in some industrial wastewater. For example, in spent caustic treatment unit of ethylene plants, the produced wastewater has about 0.5 to 6.0 wt% sodium hydrosulfide, 1.0 – 4.0 wt% sodium hydroxide, 1.0 – 5.0 wt% sodium carbonate, and up to 0.2 wt% sodium mercaptide [15,16] These wastewaters contain large amounts of inorganic ionic materials and due to the presence of sodium hydroxide are very alkaline with their pH in the range of 11 to 14. There are many sources of wastewater and consequently, the wastewater streams are diverse in contaminants and concentrations [17]; therefore, a wide range of technologies have been developed for the treatment of wastewaters [18,19]. Recently, electrochemical technologies have been extensively examined for the treatment of a variety of organic and inorganic pollutants [20]. The main advantages of electrochemical treatments are high contaminant removal, high energy efficiency, mild operating conditions, low waste production and emission, low chemicals usage, ease of control and automation, flexible operation, compact facilities, etc. In addition, electrochemical techniques can be easily modified for use in different applications and can be combined with other treatment technologies with almost no difficulties. Also, as the design of electrochemical systems is modular, they are very attractive for remote applications [21]. Electrochemical wastewater treatment methods include electrocoagulation, electroflotation, electrooxidation, electrodisinfection, and electroreduction processes [22]. As reported by Barrera-Díaz et al. [23], the oxidation process has some benefits over other electrochemical techniques. Briefly, these include better quality of treated wastewater, no production of sludge, and the possibility to use for refractory pollutants. Electrochemical oxidation involves two mechanisms: direct anodic oxidation, where the contaminants are oxidized at the surface of anode; and indirect oxidation where a mediator, which is produced in situ, perform the oxidation reaction [24]. In anodic oxidation, there is no need to add any chemicals to the wastewater stream. Also, no other contaminants are
generated in this process and less facilities are needed. These advantages make anodic oxidation more attractive than other oxidation processes [25]. In this paper, the anodic oxidation of synthetic sulfide-containing wastewaters at the surface of a polycrystalline platinum electrode was studied using the cyclic voltammetry technique. The effects of operating conditions (i.e., sulfide concentration, supporting electrolyte concentration, temperature, mixing speed, and potential scan rate) were investigated experimentally.
2. Materials and methods
2.1. Materials and setup
The analytical grade chemicals used in this work (i.e., sodium sulfide 99.99%, sodium chloride 99.99%, hydrochloric acid 37%) were supplied by the Merck and Sigma-Aldrich Companies. To polish the electrodes surfaces, silicon carbide 5000 mesh sandpaper (991A Softflex, Matador GmbH and Co. KG) and 0.05 μm alumina powder (Azar Electrode Company) were utilized. To control the applied potential/current and to collect the obtained data, a conventional potentiostat (PGSTAT302N with NOVA software, Metrohm Autolab B.V.) was utilized. The experiments were performed in a three-electrode jacketed cell. A schematic of the three-electrode system is shown in Figure 1. Sodium sulfide (Na2S, 9H2O) was used as the source of sulfide and sodium chloride (NaCl) was used as the supporting electrolyte. A circulator (RCS 6-D, Lauda Dr. R. Wobser GmbH and Co. KG) was used to control the temperature of the cell within ± 0.5 °C of the desired set point. An Ag/AgCl electrode saturated with KCl was used as the reference electrode and all the potentials reported in this paper are in respect to this electrode. A 2 mm diameter platinum disk was used as the working electrode. A platinum rod was the counter electrode. The working and counter electrode materials were 99.99% platinum. All the electrodes were supplied by the Azar Electrode Company. Platinum was used as it is a highly active electrocatalyst and has a low overpotential toward the electrolysis of the sulfur compounds [26].

A. Behrouzifar et, al / Advances in Environmental Technology 1 (2018) 61-73
63
F
P
WERECE
PS
PC
C
B
WO
WI
N2
CS
MS
TCGS
Fig. 1. Schematic of the three-electrode cell. CE: counter electrode, RE: reference electrode, WE: working electrode, N2: nitrogen, GS: gas sparger, MS: magnetic stirrer, WI: water in, WO: water out, TC: thermocouple, PS: potentiostat, CS: control station, PC: computer
2.2. Experimental procedures
To study the anodic oxidation behavior of sulfide at the surface of the platinum electrode, the cyclic voltammetry technique was utilized. The lower and upper potential limits of the CV voltammograms were chosen as -0.4 V and 1.2 V, respectively. This range was selected in such a way that the hydrogen and oxygen evolution reactions and also the electrochemical reactions of Na+ and Cl- did not occur. The effects of sulfide concentration (25 – 500 mg/L), supporting
electrolyte concentration (0.01 – 0.50 mol/L), temperature (30 – 90 °C), mixing speed (0 – 400 rpm), and potential scan rate (5 – 100 mV/s) were investigated experimentally. As shown in Table 1, each parameter was studied at five different values. In evaluating the effects of each independent parameter, the other ones were controlled at a constant value (i.e., sulfide concentration of 100 mg/L, supporting electrolyte concentration of 0.10 mol/L, temperature of 30 °C, mixing speed of zero rpm, and potential scan rate of 25 mV/s).
Table 1. Parameters and their corresponding values studied in the anodic oxidation of sulfide
Parameter
Unit Level 1 Level 2 Level 3 Level 4 Level 5
Concentration of sulfide mg/L 25 50 100 250 500
Concentration of supporting electrolyte mol/L 0.01 0.05 0.10 0.25 0.50
Temperature °C 30 45 60 75 90
Mixing speed rpm 0 100 200 300 400
Potential scan rate mV/s 5 10 25 50 100
In addition, to study the effects of time lapse on the progress of the electrochemical oxidation of sulfide, five CV cycles were recorded for all the above-mentioned
parameters. As stated before, in all the experiments (except those at which the effects of potential scan rate were studied), a 25 mV/s scan rate was used and hence, each

A. Behrouzifar et, al / Advances in Environmental Technology 1 (2018) 61-73 64
cycle took 128 seconds to complete. During the investigation of potential scan rate effects, the duration of each CV cycle was floated between 640 to 32 seconds for a scan rate of 5 to 100 mV/s, respectively. To perform the experiments, required amounts of sodium sulfide and sodium chloride were dissolved in deionized water. Next, the electrochemical cell was filled with this solution, and then the cleaned working, counter, and reference electrodes were put in the cell. After that, the solution was purged with a nitrogen gas stream for about 15 min to ensure that there was no dissolved oxygen in the reaction environment. Simultaneously, water (as the heating/cooling media) was circulated through the circulator into the cell’s jacket until the temperature of the cell contents became constant and equal to the desired set point. The water circulation was continued until the end of each experiment.
2.3. Electrode cleaning
As the concentration of sulfide in the conducted electrochemical oxidation experiments was low (i.e., between 25 – 500 mg/L), the presence of even very low amounts of impurities at the electrode surface may lead to their reaction at the given experimental conditions and hence, the formation of some additional peaks in the observed voltammograms. Since the nature and concentration of impurities were unknown, their effects could not be isolated from the desired anodic oxidation peaks of sulfide. As a result, the cleanliness of the electrode surface was a key factor in the study of sulfide anodic oxidation. This was why a combined mechanical and electrochemical method was used to clean the surface of electrodes. Initially, the voltammogram of the as received (fresh) polycrystalline platinum disk electrode was obtained in 0.10 M NaCl aqueous solution using the cyclic voltammetry technique with a scan rate of 25 mV/s. Before starting each experiment, the surface of the electrodes was polished with the silicon carbide sandpaper and then by the alumina powder. Afterwards, the electrodes were immersed in 1.0 M HCl aqueous solution for a while, rinsed with deionized water and dried using a nitrogen gas stream. To ensure that there was no impurity at the electrodes surface, an electrochemical cleaning route was utilized. Briefly, the electrodes were dipped in 0.10 M NaCl electrolyte solution, and a CV test (-0.4 to 1.2 V with a scan rate of 25 mV/s) was conducted. The CV tests were continued until the obtained voltammogram became stable and similar to that of the fresh electrode which was recorded before. Finally, the electrode was rinsed and dried again.
3. Results and discussion
Anodic oxidation of sulfide is a multi-steps process. Initially, the sulfide species should be diffused from the bulk of solution to near the electrode surface. Then, those sulfide
species that are in the vicinity of the electrode should be electrochemically adsorbed onto the surface. After that, the adsorbed sulfide should be electrochemically oxidized. Next, the product of reaction should be desorbed from the electrode surface, and finally, the reaction product should be diffused back into the bulk of the solution. The main product of anodic oxidation of sulfide is sulfate via the intermediate production of other sulfur species [27]. Figure 2 shows the voltammograms of the platinum electrode surface in the presence of the sulfide species in the potential range of -0.4 to 1.2 V. Three distinctive peaks can be observed in these voltammograms at the potentials of 0.2, 0.8, and 1.1 V. The intensity of the peaks is more at higher potentials. Besides, the intensity of the measured currents in the oxidation half-cycles are much more than those obtained in the reduction half-cycles. This indicates that anodic oxidation of sulfide is almost irreversible and the reaction products in the forward sweep do not undergo reduction in the reverse sweep. As can be seen in Figure 2, with the lapse of time, the measured currents at a certain potential increase and then approximately become constant. Initially, there is no adsorbed sulfide at the electrode surface and hence, the current recorded in the first voltammogram is significantly less than the others. Over time, more sulfide is adsorbed on the electrode surface and electrochemically oxidized. Consequently, the current passed through the electrodes increases. However, as the adsorption sites which are available on the electrode surface are limited, the adsorption of sulfide on the electrode surface and anodic oxidation of the adsorbed sulfide reaches equilibrium after a while. This means that, at a fixed condition, a limited amount of sulfide can exist on the electrode surface and therefore, the anodic current has a boundary. This phenomenon can be readily identified in the voltammograms of Figure 2. As can be seen, the difference of the measured currents in the voltammograms became less and less, and the final cycles of the voltammogram are almost identical. In the following sections, the effect of the studied parameters on anodic oxidation of sulfide is described separately.
3.1. Sulfide concentration
Figure 3 illustrates the effects of sulfide concentration (25 to 500 mg/L) on the first voltammograms of the platinum electrode. As can be seen, the intensity of the anodic current was a direct function of the sulfide concentration. At almost all potentials, the measured currents increased by increasing sulfide concentration and hence, the efficiency of sulfur elimination at the higher concentration of sulfide was more. However, in the concentration range of 100 to 250 mg/L, the rate of current increase was approximately low. Vice versa, the shortage of sulfide in the solution led to a rapid decrease of anodic currents and at the low concentration of sulfide, the

A. Behrouzifar et, al / Advances in Environmental Technology 1 (2018) 61-73
65
measured current was almost negligible. Thus, it could be concluded that the obtained currents were a result of the anodic oxidation of sulfide. Increasing the sulfide concentration (from 25 to 100 mg/L) led to an increasing driving force of mass transfer from the bulk of the solution into the electrode surface and hence, decreasing diffusion resistance. This finally resulted in increasing the overall reaction rate, which could be tracked by increasing the anodic currents. However, by further increasing the sulfide concentration (from 100 to 250 mg/L), the contribution of
diffusion resistance with respect to surface reactions resistance became low and consequently, the overall reactions rate would not enhance with the further increase of sulfide concentration. Nevertheless, the kinetics of surface reactions was a function of reactants concentration. When surface reactions resistance was predominant, enhancement of the overall anodic oxidation rate via increasing sulfide concentration was possible. That was why increasing sulfide concentration beyond 250 mg/L resulted in an increase of anodic oxidation currents once more.
Fig. 2. Voltammograms of platinum electrode in sulfide concentration of 100 mg/L, supporting electrolyte concentration of 0.10 mol/L, temperature of 30 °C, potential scan rate of 25 mV/s and without mixing
-10
10
30
50
70
90
110
130
-0.5 -0.3 -0.1 0.1 0.3 0.5 0.7 0.9 1.1 1.3
Cu
rren
t d
ensi
ty (
A/m
2)
Potential vs. Ag/AgCl (V)
Cycle 1, Anodic Cycle 2, Anodic
Cycle 3, Anodic Cycle 4, Anodic
Cycle 5, Anodic Cycle 1, Cathodic
Cycle 2, Cathodic Cycle 3, Cathodic
Cycle 4, Cathodic Cycle 5, Cathodic

A. Behrouzifar et, al / Advances in Environmental Technology 1 (2018) 61-73 66
Fig. 3. Effects of sulfide concentration on the first cycle of platinum electrode voltammograms (other conditions: supporting electrolyte concentration of 0.10 mol/L, temperature of 30 °C, potential scan rate of 25 mV/s and without mixing)
3.2. Supporting electrolyte concentration
Figure 4 shows the effects of supporting electrolyte concentration (0.01 to 0.50 mol/L) on the first voltammograms of the platinum electrode. As can be seen, with increasing electrolyte concentration, at each potential, the anodic currents increase and then decrease; after that, they approximately remain constant. The electrical conductivity of solution increases with increasing electrolyte concentration, which results in increased rate of oxidation reactions and hence, anodic currents. However, in a certain concentration of electrolyte, the ionic resistance of solution will no longer be a limiting step in the overall reaction. By increasing the amount of electrolyte beyond this value, only marginal progress can be obtained. On the other hand, by increasing of the amounts of electrolyte, some undesired events may take place. The most important being that the possibility of sulfide adsorption on the electrode surface will be reduced since the presence of electrolyte ions, especially at the vicinity of the electrode surface, restricts the sulfide to come near the electrode and can be adsorbed on its surface. Consequently, the rate of anodic oxidation will be dropped via further increasing the electrolyte concentration. That is the reason for reducing the measured anodic currents in the voltammograms of Figure 4 by increasing the electrolyte concentration beyond 0.05 mol/L. It's worthy to note that the concentration of electrolyte has little effect on the anodic oxidation current.
This can be readily observed in the voltammograms of Figure 4, as the changes to the anodic currents via the variation of electrolyte concentration are negligible at each potential. Thus, it can be concluded that the contribution of ionic resistance of the solution in the overall resistance to oxidation reactions is low. This means that the dissociation of sulfide brings enough conductivity to the solution, which is required to carry the charged materials between the electrodes. In the sulfide-containing aqueous solutions, based on the pH of the environment, three forms of sulfide (i.e. H2S, HS–, and S2–) can exict. At 25 °C, the first and second dissociation constants of hydrogen sulfide are 7.05 and 12.85, respectively [28,29]. Consequently, the relative composition of these species in the solution is H2S: HS–:S2– = 0.5:0.5:0.0 at the pH of 7.05; at the pH of 12.85, the relative composition becomes H2S: HS–:S2– = 0.0:0.5:0.5. Therefore, in neutral and alkaline environments, a large portion of sulfide will dissociate in the aqueous media and the extent of its dissociation increases with the pH of the solution. So, due to the presence of ionic sulfide species in the solution, the electrical conductivity of the sulfide-containing solutions is high enough, and it is possible to ignore using the supporting electrolyte. Also, as stated before, some sulfide-containing wastewaters have large amounts of ionic salts which will dissociate in the water and increase the electrical conductivity even more.
-10
10
30
50
70
90
110
130
150
170
190
210
-0.5 -0.3 -0.1 0.1 0.3 0.5 0.7 0.9 1.1 1.3
Cu
rren
t d
ensi
ty (
A/m
2)
Potential vs. Ag/AgCl (V)
25 mg/L, Anodic 50 mg/L, Anodic
100 mg/L, Anodic 250 mg/L, Anodic
500 mg/L, Anodic 25 mg/L, Cathodic
50 mg/L, Cathodic 100 mg/L, Cathodic
250 mg/L, Cathodic 500 mg/L, Cathodic

A. Behrouzifar et, al / Advances in Environmental Technology 1 (2018) 61-73
67
Fig. 4. Effects of supporting electrolyte concentration on the first cycle of platinum electrode voltammograms (other conditions; sulfide concentration of 100 mg/L, temperature of 30 °C, potential scan rate of 25 mV/s and without mixing)
3.3. Temperature
The effects of the temperature of the cell contents on the anodic oxidation of sulfide in the range of 30 to 90 °C is shown in the voltammograms of Figure 5. As can be seen, increasing the temperature results in a sharp rise in the obtained currents. The temperature affects anodic oxidation through the kinetics of the reactions and also the electrical conductivity of the solution. Temperature has a favorable effect on both of these parameters. Increasing the kinetics of the reactions and also enhancing the electrical conductivity of the solution will result in increasing the anodic oxidation rate of sulfide. Nevertheless, by increasing the temperature, the rate of reactions at the reduction half-cycle is also increased. This means that a greater portion of the oxidized sulfide will be reduced at higher temperatures.
This will be lower overall oxidation progress. For example, as can be observed in Figure 5, reduction currents obtained in the voltammogram recorded at 90 °C is almost higher than oxidation currents in the voltammograms logged at 60°C and less. Besides, the temperature affects the thermodynamic potential of the electrochemical reactions. The functionality can be expressed by the Nernst equation [30]. It is obvious in Figure 5 that the increase of temperature results in the formation of some new peaks in the voltammograms of the platinum electrode. This situation is more severe for the voltammogram recorded at 90 °C. By increasing the temperature, the possibility of performing side reactions increases. This is due to the variation of thermodynamic potential and also the improved kinetics of the side reactions.
-10
10
30
50
70
90
110
-0.5 -0.3 -0.1 0.1 0.3 0.5 0.7 0.9 1.1 1.3
Cu
rren
t d
ensi
ty (
A/m
2)
Potential vs. Ag/AgCl (V)
0.01 M, Anodic 0.05 M, Anodic
0.10 M, Anodic 0.25 M, Anodic
0.50 M, Anodic 0.01 M, Cathodic
0.05 M, Cathodic 0.10 M, Cathodic
0.25 M, Cathodic 0.50 M, Cathodic

A. Behrouzifar et, al / Advances in Environmental Technology 1 (2018) 61-73 68
Fig. 5. Effects of temperature on the first cycle of platinum electrode voltammograms (other conditions: sulfide concentration of 100 mg/L, supporting electrolyte concentration of 0.10 mol/L, potential scan rate of 25 mV/s and without mixing)
By analyzing the data of Figure 5, it is possible to calculate the activation energy of the electrochemical reaction which take place at each of the three peaks of the platinum electrode voltammograms. Since the only variable is temperature, the peak currents can be related to the temperature via an Arrhenius-type equation:
𝑖𝑝𝐴= 𝑘 exp (
−𝐸𝑎𝑝𝑝𝑅𝑇
) (1)
In this equation, ip is peak current, A is working electrode surface area, k is pre-exponential factor, Eapp is apparent activation energy, R is universal gas constant, and T is absolute temperature. The activation energy can be obtained by plotting the logarithm of the peak current versus the inverse of temperature, as shown in Figure 6. In this figure, the experimental values are denoted by markers which are designated by EXP, the models prediction are shown by lines which are labelled by PRD, and the 95%
lower and 95% upper confidence limits are indicated by dash-lines which are symbolized by LCL and UCL, respectively. Table 2 shows the calculated activation energies and pre-exponential factors for each of the three peaks. Also, statistical parameters (including R-square, adjusted R-square, root mean square of the error, and p-value for F-test) of the fitted models are presented in this table. A brief description of the statistical parameters which are used to evaluate goodness of fit can be found elsewhere [31]. As can be seen, the obtained data are well fitted to the Arrhenius-type equation. The activation energy of peak 1 and peak 3 is the highest and lowest values, respectively. It means that anodic oxidation reactions are happening in peak 3 easier than in the other two peaks and also in peak 2 easier than peak 1. This indicates why the measured currents in peak 3 are higher than those in peak 2 and those in peak 2 are higher than peak 1.
Table 2. Calculated parameters of Eq. 1 and statistic factors for fitting peak currents to Eq. 1 and Eq. 2
Model Peak no. Eapp/R ln(k) R2 Adj. R2 RMSE P>F
Eq. 1 1 4.439 ± 0.378 15.639 ± 1.141 0.979 0.972 0.163 0.00132
2 3.748 ± 0.123 15.385 ± 0.373 0.997 0.996 0.053 0.00008
3 2.377 ± 0.228 12.255 ± 0.688 0.973 0.964 0.098 0.00188
Eq. 2 1 0.965 0.956 0.841 0.00047
2 0.987 0.984 3.826 0.00006
3 0.985 0.982 10.585 0.00008
R2 is R-square, Adj. R2 is adjusted R-square, RMSE is root mean square error, and P>F is p-value for F-test.
-10
40
90
140
190
240
290
340
-0.5 -0.3 -0.1 0.1 0.3 0.5 0.7 0.9 1.1 1.3
Cu
rren
t d
ensi
ty (
A/m
2)
Potential vs. Ag/AgCl (V)
30 °C, Anodic 45 °C, Anodic
60 °C, Anodic 75 °C, Anodic
90 °C, Anodic 30 °C, Cathodic
45 °C, Cathodic 60 °C, Cathodic
75 °C, Cathodic 90 °C, Cathodic

A. Behrouzifar et, al / Advances in Environmental Technology 1 (2018) 61-73
69
Fig. 6. Functionality of peak current densities of voltammograms of Figure 5 versus inverse of absolute temperature (EXP: experimental values, PRD: predicted values, LCL: 95% lower confidence limit, and UCL: 95% upper confidence limit)
3.4. Mixing speed
Figure 7 shows the effects of mixing speed on the anodic oxidation of sulfide. As can be seen, the mixing speed has an abnormal effect on the anodic currents logged in the first voltammograms of platinum electrode. By mixing the solution at the speed of 100 rpm, the anodic current decreases with respect to the situation in which the solution is stagnant. By increasing the mixing speed up to 200 rpm, the current passed through the electrode increases. A further increase of speed up to 300 rpm, results in decreasing the anodic current one more time. At the speed of 400 rpm, the obtained voltammogram is almost identical to that logged in at 300 rpm, and the anodic currents are not changed. It is worth noting that the effects of mixing on the anodic oxidation of sulfide is approximately negligible, as the measured currents do not change too much by the variation of mixing speed. By mixing the solution, two phenomena occur: the diffusion resistance of the reactants from the bulk of the solution into the electrode surface decreases, and the residence time of each single sulfide molecule at the electrode surface decreases. These two situations are opposite, as decreasing the diffusion resistance enhances the overall anodic oxidation progress while decreasing the residence time, to some extent, prevents sulfide species to adsorb and react on the electrode surface and hence worsening the anodic oxidation of sulfide. This is why a periodic behavior was
observed in studying the effects of the mixing speed. Nevertheless, mixing has the extra positive effect of removing the oxidized products from the vicinity of electrode surface on the anodic oxidation process. This cause the products to not have enough time on the electrode surface to be reduced. This phenomenon can be readily observed by comparing the reduction half-cycle voltammograms of Figure 7 in the condition that the solution is stagnant and is mixed. The reduction currents are much lower in the voltammograms in which the solution is mixed with respect to those logged in the stagnant solution. 3.5. Potential scan rate
The effects of the potential scan rate in the range of 5 to 100 mV/s on the first cycle of voltammograms of the platinum electrode are shown in Figure 8. As it is obvious, increasing the potential scan rate results in increasing the obtained anodic currents. However, this does not mean that the rate of conversion increases via the potential scan rate since at a lower potential scan rate, the time elapsed in a single cycle is more; and hence, the reactions are occurring in longer periods of time. These two factors are opposite each other, and the overall reaction progress is a result of both of them. The calculations revealed that the charge consumed in the oxidation half-cycle voltammograms of Figure 8 decreased with increasing the potential scan rate. Thus, it could be concluded that in these experiments, the
0
1
2
3
4
5
6
2.7 2.8 2.9 3 3.1 3.2 3.3
ln(P
eak
curr
ent
den
sity
)
1000/Temperature (1/K)
1st Peak, EXP 2nd Peak, EXP 3rd Peak, EXP 1st Peak, PRD
2nd Peak, PRD 3rd Peak, PRD 1st Peak, LCL 2nd Peak, LCL
3rd Peak, LCL 1st Peak, UCL 2nd Peak, UCL 3rd Peak, UCL

A. Behrouzifar et, al / Advances in Environmental Technology 1 (2018) 61-73 70
reaction time had a stronger effect than the obtained current in the anodic oxidation of sulfide. It was worth noting that in previous sections, in which a constant potential scan rate was used, the time of cycles was equal and hence, it was possible to judge the reactions progress by studying the measured anodic currents. At a higher potential scan rate, the time that it takes for the working
electrode to reach the potentials in which the oxidation reactions take place is shorter. Since the reactants have less time to be adsorbed on the electrode surface and be electrochemically oxidized, their concentrations are not reduced significantly. Therefore, due to the large concentration of sulfide at the electrode surface in a higher potential scan rate, the obtained anodic currents are higher.
Fig. 7. Effects of mixing speed on the first cycle of platinum electrode voltammograms (other conditions: sulfide concentration of 100 mg/L, supporting electrolyte concentration of 0.10 mol/L, temperature of 30 °C, and potential scan rate of 25 mV/s)
Fig. 8. Effects of potential scan rate on the first cycle of platinum electrode voltammograms (other conditions: sulfide concentration of 100 mg/L, supporting electrolyte concentration of 0.10 mol/L, temperature of 30 °C, and without mixing)
-10
10
30
50
70
90
110
-0.5 -0.3 -0.1 0.1 0.3 0.5 0.7 0.9 1.1 1.3
Cu
rren
t d
ensi
ty (
A/m
2)
Potential vs. Ag/AgCl (V)
0 rpm, Anodic 100 rpm, Anodic
200 rpm, Anodic 300 rpm, Anodic
400 rpm, Anodic 0 rpm, Cathodic
100 rpm, Cathodic 200 rpm, Cathodic
300 rpm, Cathodic 400 rpm, Cathodic
-10
10
30
50
70
90
110
130
150
-0.5 -0.3 -0.1 0.1 0.3 0.5 0.7 0.9 1.1 1.3
Cu
rren
t d
ensi
ty (
A/m
2)
Potential vs. Ag/AgCl (V)
5 mV/s, Anodic 10 mV/s, Anodic
25 mV/s, Anodic 50 mV/s, Anodic
100 mV/s, Anodic 5 mV/s, Cathodic
10 mV/s, Cathodic 25 mV/s, Cathodic
50 mV/s, Cathodic 100 mV/s, Cathodic
A. Behrouzifar et, al / Advances in Environmental Technology 1 (2018) 61-73
71
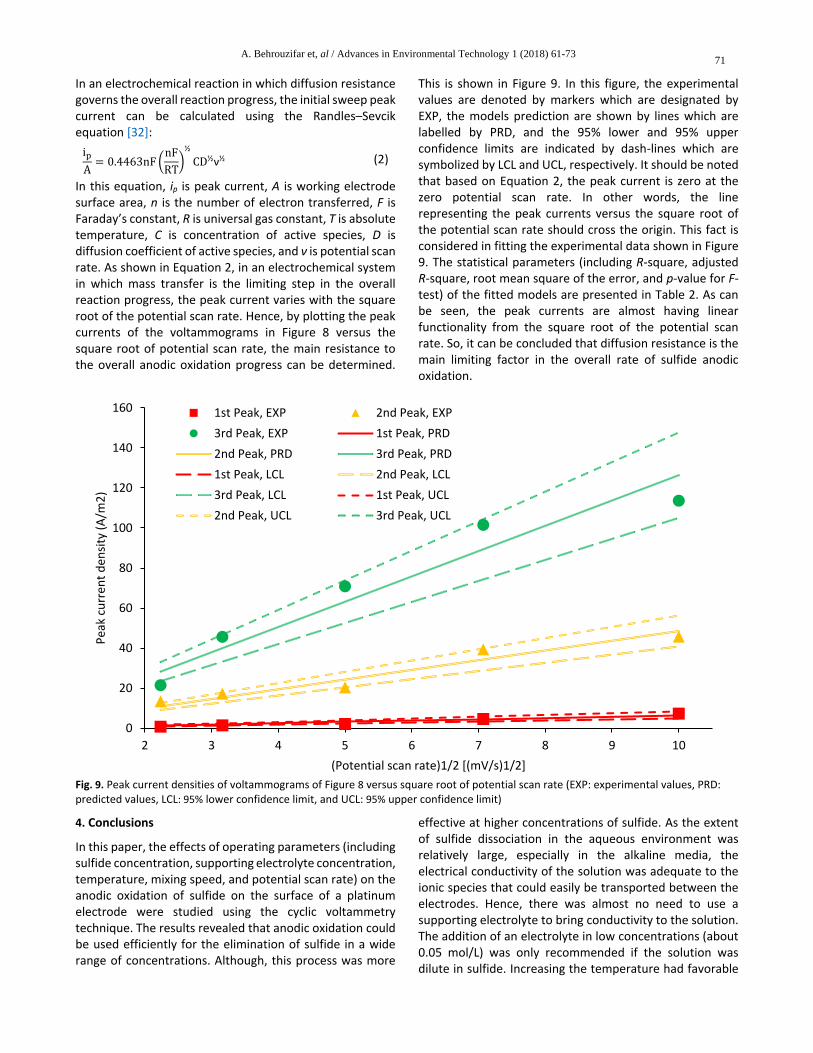
In an electrochemical reaction in which diffusion resistance governs the overall reaction progress, the initial sweep peak current can be calculated using the Randles–Sevcik equation [32]:
ip
A= 0.4463nF (
nF
RT)
½
CD½ν½ (2)
In this equation, ip is peak current, A is working electrode surface area, n is the number of electron transferred, F is Faraday’s constant, R is universal gas constant, T is absolute temperature, C is concentration of active species, D is diffusion coefficient of active species, and ν is potential scan rate. As shown in Equation 2, in an electrochemical system in which mass transfer is the limiting step in the overall reaction progress, the peak current varies with the square root of the potential scan rate. Hence, by plotting the peak currents of the voltammograms in Figure 8 versus the square root of potential scan rate, the main resistance to the overall anodic oxidation progress can be determined.
This is shown in Figure 9. In this figure, the experimental values are denoted by markers which are designated by EXP, the models prediction are shown by lines which are labelled by PRD, and the 95% lower and 95% upper confidence limits are indicated by dash-lines which are symbolized by LCL and UCL, respectively. It should be noted that based on Equation 2, the peak current is zero at the zero potential scan rate. In other words, the line representing the peak currents versus the square root of the potential scan rate should cross the origin. This fact is considered in fitting the experimental data shown in Figure 9. The statistical parameters (including R-square, adjusted R-square, root mean square of the error, and p-value for F-test) of the fitted models are presented in Table 2. As can be seen, the peak currents are almost having linear functionality from the square root of the potential scan rate. So, it can be concluded that diffusion resistance is the main limiting factor in the overall rate of sulfide anodic oxidation.
Fig. 9. Peak current densities of voltammograms of Figure 8 versus square root of potential scan rate (EXP: experimental values, PRD: predicted values, LCL: 95% lower confidence limit, and UCL: 95% upper confidence limit)
4. Conclusions
In this paper, the effects of operating parameters (including sulfide concentration, supporting electrolyte concentration, temperature, mixing speed, and potential scan rate) on the anodic oxidation of sulfide on the surface of a platinum electrode were studied using the cyclic voltammetry technique. The results revealed that anodic oxidation could be used efficiently for the elimination of sulfide in a wide range of concentrations. Although, this process was more
effective at higher concentrations of sulfide. As the extent of sulfide dissociation in the aqueous environment was relatively large, especially in the alkaline media, the electrical conductivity of the solution was adequate to the ionic species that could easily be transported between the electrodes. Hence, there was almost no need to use a supporting electrolyte to bring conductivity to the solution. The addition of an electrolyte in low concentrations (about 0.05 mol/L) was only recommended if the solution was dilute in sulfide. Increasing the temperature had favorable
0
20
40
60
80
100
120
140
160
2 3 4 5 6 7 8 9 10
Pea
k cu
rren
t d
ensi
ty (
A/m
2)
(Potential scan rate)1/2 [(mV/s)1/2]
1st Peak, EXP 2nd Peak, EXP
3rd Peak, EXP 1st Peak, PRD
2nd Peak, PRD 3rd Peak, PRD
1st Peak, LCL 2nd Peak, LCL
3rd Peak, LCL 1st Peak, UCL
2nd Peak, UCL 3rd Peak, UCL

S Rowshanzamir et, al / Advances in Environmental Technology 1 (2018) 61-73 72
effects on the kinetics of the electrochemical oxidation reactions and also enhanced the electrical conductivity of the solution. On the other hand, increasing the temperature increased the rate of energy consumption and hence, the operating expenses. Besides, higher temperatures intensified the undesired side-reactions which consumed additional electrical current and hence, decreased power efficiency and also lowered the sulfide elimination conversion. Finally, working at higher operating temperatures required using temperature resistant alloys which increased the fixed investment costs. Accordingly, some intermediate temperature should be ideal. Based on the findings of this paper, a temperature of about 40 – 60 °C was optimal for the anodic oxidation of sulfide. The mixing of the solution had two positive effects: it lowered the diffusion resistance of the sulfide from the bulk of the solution to the electrode surface and removed the products away from the electrode vicinity and hence, prevented the possible reduction of the oxidized products. However, increasing the mixing speed resulted in a lower residence time of sulfide on the electrode surface to be adsorbed and oxidized. Based on the obtained results, 200 rpm was the best mixing speed during the anodic oxidation of sulfide. The potential scan rate affected the time of applying the potential to the sulfide-containing solution. As the scan rate was lower, the potential was exposed to the solution for a longer time and hence, the overall oxidation conversion would be higher. However, this meant that much electrical power was consumed. Also, increasing residence time would result in the need for larger equipment to carry a certain amount of materials. Economic studies are required to find the optimum residence time. The results showed that the electrochemical oxidation process had great potential for treating sulfide-containing wastewaters. However, this technology faces some challenges which the more important ones are listed below:
Finding affordable electrodes that have enough electrocatalytic activity toward the anodic oxidation of sulfide. Although noble metals can be used as the electrocatalyst, an attempt must be made to lower the loading of the metal by using advanced deposition technologies or alloying.
Finding the optimum operating conditions to reach maximum oxidation conversion, while consuming minimum electrical power.
Studying the degradation of the electrode material and electrocatalytic activity decline over time.
Surveying the corrosion of the treatment system, since the simultaneous existence of water, salts, sulfide, and electrical current make a harsh corrosive environment.
Optimum designing of the reactor and process to meet the environmental, economical, and technical challenges.
Acknowledgement
The authors acknowledge the Research Institute of Petroleum Industry for their support of this work.
References
[1] Pikaar, I., Likosova, E. M., Freguia, S., Keller, J., Rabaey, K., Yuan, Z. (2015). Electrochemical abatement of hydrogen sulfide from waste streams. Critical reviews in environmental science and technology, 45(14), 1555-1578.
[2] Churchill, P., Elmer, D. (1999). Hydrogen sulfide odor control in wastewater collection systems. Journal of the New England water environment association, 33(1), 57-63.
[3] Robert, P. G., Bowker, A. G. A. (1991). Hydrogen sulfide corrosion: its consequences, detection and control. United States environmental protection agency, Washington, DC.832-S-91–100.
[4] Bowker, R. P. G., Smith, J. M., Shah, H. J., Flaherty, P. A., 1991. Hydrogen sulfide corrosion in wastewater collection and treatment systems. United States environmental protection agency, Washington, DC.
[5] Strickland, J., Cummings, A., Spinnato III, J. A., Liccione, J. J., Foureman, G. L. (2003). Toxicological review of hydrogen sulfide. United States environmental protection agency, Washington, DC.
[6] Rankin, K., Bejan, D., Bunce, N. J. (2010). Electrochemical oxidation of the sulfide ion in synthetic geothermal brines in batch cells using coke electrodes. Industrial and engineering chemistry research, 49, 6261-6266.
[7] Talei, M., Mowla, D., Esmaeilzadeh, F. (2015). Ozonation of an effluent of oil refineries for COD and sulfide removal. Desalination and water treatment, 56(6), 1648-1656.
[8] Mattiusi, E. M., Kaminari, N. M. S., Ponte, M. J. J. S., Ponte, H. A. (2015). Behavior analysis of a porous bed electrochemical reactor the treatment of petrochemical industry wastewater contaminated by hydrogen sulfide (H2S). Chemical engineering journal, 275, 305-314.
[9] Vaiopoulou, E., Provijn, T., Prévoteau, A., Pikaar, I., Rabaey, K. (2016). Electrochemical sulfide removal and caustic recovery from spent caustic streams. Water research, 92, 38-43.
[10] Rajalo, G., Petrovskaya, T. (1996). Selective electrochemical oxidation of sulphides in tannery wastewater. Environmental technology, 17(6), 605-612.
[11] Särkkä, H., Kuhmonen, K., Vepsäläinen, M., Pulliainen, M., Selin, J., Rantala, P., Sillanpää, M. (2009). Electrochemical oxidation of sulphides in paper mill wastewater by using mixed oxide anodes. Environmental technology, 30(9), 885-892.
[12] Kienow, K. K., Amy, G. L., Bryant, C., Glasgow, D., Hoffman, H., Keller, J., Knopf, W., Lanyon, R., Oleszkiewicz, J. A., Pomeroy, R. D., Ponte, M., Randall,

A. Behrouzifar et, al / Advances in Environmental Technology 1 (2018) 61-73
73
C. W., Redner, J., Rolen, T., Rogers, E., Schafer, P., Schultz, S., Tchobanoglous, G., 1989. Sulfide in wastewater collection and treatment systems, American society of civil engineers, New York.
[13] Nemerow, N. L., Agardy, F. J. (1998). Strategies of industrial and hazardous waste management. John Wiley and sons.
[14] AECOM, 2010. Petroleum refining water/wastewater use and management, IPIECA, London, United Kingdom.
[15] Ellis, C. E., Lawson, R. J., Brandenburg, B. L., Environmental, Z. (1994, March). Wet air oxidation of ethylene plant spent caustic. In 6th annual ethylene producers conference.
[16] Maugans, C., Howdeshell, M., De Haan, S. (2010). Update: Spent caustic treatment. Hydrocarbon processing, 89(4), 61-61.
[17] Cheremisinoff, N. P. (2002). Handbook of water and wastewater treatment technologies Butterworth. Heineman, Boston USA, 404, 138-140.
[18] Gogate, P. R., Pandit, A. B. (2004). A review of imperative technologies for wastewater treatment I: oxidation technologies at ambient conditions. Advances in environmental Research, 8(3-4), 501-551.
[19] Gogate, P. R., Pandit, A. B. (2004). A review of imperative technologies for wastewater treatment II: hybrid methods. Advances in environmental research, 8(3-4), 553-597.
[20] Chen, G. (2004). Electrochemical technologies in wastewater treatment. Separation and purification technology, 38(1), 11-41.
[21] Radjenovic, J., Sedlak, D. L. (2015). Challenges and opportunities for electrochemical processes as next-generation technologies for the treatment of contaminated water. Environmental science and technology, 49(19), 11292-11302.
[22] Mook, W. T., Aroua, M. K., Issabayeva, G. (2014). Prospective applications of renewable energy based electrochemical systems in wastewater treatment: A review. Renewable and sustainable energy reviews, 38, 36-46.
[23] Barrera-Díaz, C., Cañizares, P., Fernández, F. J., Natividad, R., Rodrigo, M. A. (2014). Electrochemical advanced oxidation processes: an overview of the current applications to actual industrial effluents. Journal of the Mexican chemical society, 58(3), 256-275.
[24] Martinez-Huitle, C. A., Ferro, S. (2006). Electrochemical oxidation of organic pollutants for the wastewater treatment: direct and indirect processes. Chemical society reviews, 35(12), 1324-1340.
[25] Anglada, A., Urtiaga, A., Ortiz, I. (2009). Contributions of electrochemical oxidation to waste‐water treatment: fundamentals and review of applications. Journal of chemical technology and biotechnology, 84(12), 1747-1755.
[26] Lam, V., Li, G., Song, C., Chen, J., Fairbridge, C., Hui, R., Zhang, J. (2012). A review of electrochemical desulfurization technologies for fossil fuels. Fuel processing technology, 98, 30-38.
[27] Caliari, P. C., Pacheco, M. J., Ciríaco, L. F., Lopes, A. (2017). Anodic oxidation of sulfide to sulfate: effect of the current density on the process kinetics. Journal of the Brazilian chemical society, 28(4), 557-566.
[28] Tsonopoulos, C., Coulson, D. M., Inman, L. B. (1976). Ionization constants of water pollutants. Journal of chemical and engineering data, 21(2), 190-193.
[29] Zavodnov, S. S., Kryukov, P. A. (1960). The value of the second dissociation constant of hydrogen sulfide. Russian chemical bulletin, 9(9), 1583-1585.
[30] Archer, M. D. ,(1989) Genesis of the Nernst equation, in: Stock, J. T., Orna, M. V. (Eds.), Electrochemistry, Past and present, American chemical societ, 115–126.
[31] Asadi, A. A., Bazmi, M., Alavi, S. M., Royaee, S. J. (2016). Neutralization of NaAlO2 solution with CO2 for synthesis of γ-Al2O3 nanoparticles, Part 1: Effects of synthesis parameters in semi-batch membrane dispersion microstructured reactor. RSC Advances, 6(111), 109681-109691.
[32] Gosser, D. K. (1993). Cyclic voltammetry: simulation and analysis of reaction mechanisms (Vol. 43). New York: VCH.