AN INVESTIGATION OF INTERNATIONAL VOLCANO MONITORING ... · Seismic monitoring is the principal...
69
0 <Insert Report Title> AN INVESTIGATION OF INTERNATIONAL VOLCANO MONITORING TECHNIQUES TO PROVIDE AN EVIDENCE BASE FOR FUTURE SUPPORT OF THE RABAUL VOLCANO OBSERVATORY BY THE AUSTRALIAN GOVERNMENT Amy L Parker – Curtin University
Transcript of AN INVESTIGATION OF INTERNATIONAL VOLCANO MONITORING ... · Seismic monitoring is the principal...

0 <Insert Report Title>
AN INVESTIGATION OF INTERNATIONAL VOLCANO MONITORING TECHNIQUES
TO PROVIDE AN EVIDENCE BASE FOR FUTURE SUPPORT OF THE RABAUL VOLCANO OBSERVATORY BY THE AUSTRALIAN GOVERNMENT
Amy L Parker – Curtin University

1
COPYRIGHT NOTICE
This document, ‘An investigation of international of volcano monitoring techniques: to provide an evidence base for future support of the Rabaul Volcano Observatory by the Australian Government’ 2018 is licensed under the Creative Commons Attribution 4.0 Licence, unless otherwise indicated.
Please give attribution to: © Commonwealth of Australia 2018
We also request that you observe and retain any notices that may accompany this material as part of the attribution.
Notice Identifying Other Material and/or Rights in this Publication:
The author of this document has taken steps to both identify third-party material and secure permission for its reproduction and reuse. However, please note that where these third-party materials are not licensed under a Creative Commons licence, or similar terms of use, you should obtain permission from the rights holder to reuse their material beyond the ways you are permitted to use them under the Copyright Act 1968.
Further Information
For further information about the copyright in this document, please contact:
Intellectual Property and Copyright Manager
Geoscience Australia
GPO Box 378
CANBERRA ACT 2601
Phone: +61 2 6249 9567 or email: [email protected]
Bibliographic reference: Parker, A. 2018. An investigation of international volcano monitoring techniques: to provide an evidence base for future support of the Rabaul Volcano Observatory by the Australian Government. FrontierSI technical report for the Australian Government.
Corresponding author: Amy Parker – [email protected]

2
Table of Contents EXECUTIVE SUMMARY…………………………………………………………………………………………………………….4
1. INTRODUCTION...................................................................................................................... 12 Rabaul Volcano Observatory and the volcanoes of Papua New Guinea ........................................................... 12 Indicators of volcanic unrest ...................................................................................................................... 13 3. GROUND-BASED MONITORING TECHNIQUES ........................................................................... 14 Challenges in the use of ground-based instruments for volcano monitoring .................................................... 14 Current use of ground-based monitoring by the Rabaul Volcano Observatory ................................................. 15 Seismic monitoring .................................................................................................................................... 15
Recommendations .............................................................................................................................. 17 Infrasound monitoring ............................................................................................................................... 17
Recommendations .............................................................................................................................. 17 Gas and geochemical monitoring ................................................................................................................ 18
Recommendations .............................................................................................................................. 19 Ground deformation .................................................................................................................................. 19
Recommendations .............................................................................................................................. 20 Web cameras ............................................................................................................................................ 20
Recommendations .............................................................................................................................. 20 Observers within the community ................................................................................................................ 21
Recommendations .............................................................................................................................. 22 4. REMOTE-SENSING MONITORING TECHNIQUES ........................................................................ 22 Challenges in the use of remote-sensing for volcano monitoring .................................................................... 23 Current use of remote-sensing by the Rabaul Volcano Observatory................................................................ 23 Gas emissions ........................................................................................................................................... 24
Recommendations .............................................................................................................................. 24 Thermal emissions .................................................................................................................................... 25
Recommendations .............................................................................................................................. 25 Synthetic Aperture Radar and Interferometric Synthetic Aperture Radar ......................................................... 25
Recommendations .............................................................................................................................. 27 Optical data .............................................................................................................................................. 27
Recommendations .............................................................................................................................. 28 5. OTHER COMPONENTS OF AN EFFECTIVE MONITORING SYSTEM............................................... 28 Information management .......................................................................................................................... 29
Recommendations .............................................................................................................................. 29 Website and social media........................................................................................................................... 29
Recommendations .............................................................................................................................. 30 Volcano activity reports and alert levels ....................................................................................................... 30
Recommendations .............................................................................................................................. 31 Hazard maps and eruption forecasts ........................................................................................................... 31

3
Recommendation ................................................................................................................................ 32 Personnel and training ............................................................................................................................... 32
Recommendations .............................................................................................................................. 33 Collaboration with the volcanological community .......................................................................................... 33
Regional observatory networks ............................................................................................................ 33 International volcanological community ................................................................................................ 33 Recommendations .............................................................................................................................. 34
6. CONCLUSIONS AND RECOMMENDATIONS ................................................................................ 34
7. REFERENCES .......................................................................................................................... 36
APPENDIX 1 –VOLCANO OBSERVATORIES AND OTHER CONTACTS CONSULTED DURING WRITING OF THIS REPORT ..................................................................................................................................... 44
APPENDIX 2 – USGS VOLCANO DISASTER ASSISTANCE PROGRAM THREAT RANKING FOR THE VOLCANOES OF PAPUA NEW GUINEA ................................................................................................................... 45
APPENDIX 3 – EXAMPLES OF VOLCANO ACTIVITY REPORTS ISSUED BY OTHER VOLCANO OBSERVATORIES ................................................................................................................................................. 48
APPENDIX 4 – EXAMPLES OF VOLCANO OBSERVATORY WEBSITES ............................................... 52
APPENDIX 5 – EXAMPLES OF DERIVED REMOTE-SENSING PRODUCTS AVAILABLE FOR PAPUA NEW GUINEA VOLCANOES ............................................................................................................................... 57
APPENDIX 6 – PRELIMINARY STEPS TOWARDS A NATIONAL-SCALE BASELINE INSAR SURVEY OF ALL PAPUA NEW GUINEA VOLCANOES .......................................................................................................... 62
APPENDIX 7 – EXAMPLES OF VOLCANO OBSERVATORY SOCIAL MEDIA PAGES .............................. 65
4
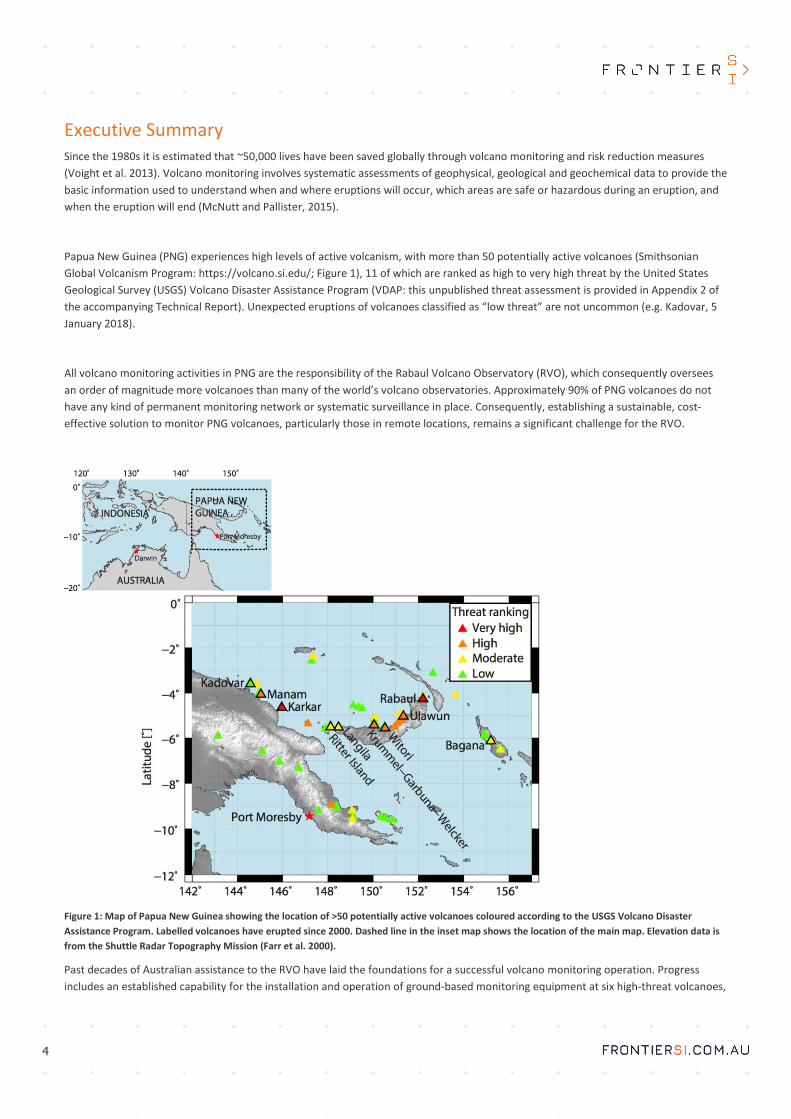
Executive Summary Since the 1980s it is estimated that ~50,000 lives have been saved globally through volcano monitoring and risk reduction measures (Voight et al. 2013). Volcano monitoring involves systematic assessments of geophysical, geological and geochemical data to provide the basic information used to understand when and where eruptions will occur, which areas are safe or hazardous during an eruption, and when the eruption will end (McNutt and Pallister, 2015).
Papua New Guinea (PNG) experiences high levels of active volcanism, with more than 50 potentially active volcanoes (Smithsonian Global Volcanism Program: https://volcano.si.edu/; Figure 1), 11 of which are ranked as high to very high threat by the United States Geological Survey (USGS) Volcano Disaster Assistance Program (VDAP: this unpublished threat assessment is provided in Appendix 2 of the accompanying Technical Report). Unexpected eruptions of volcanoes classified as “low threat” are not uncommon (e.g. Kadovar, 5 January 2018).
All volcano monitoring activities in PNG are the responsibility of the Rabaul Volcano Observatory (RVO), which consequently oversees an order of magnitude more volcanoes than many of the world’s volcano observatories. Approximately 90% of PNG volcanoes do not have any kind of permanent monitoring network or systematic surveillance in place. Consequently, establishing a sustainable, cost-effective solution to monitor PNG volcanoes, particularly those in remote locations, remains a significant challenge for the RVO.
Figure 1: Map of Papua New Guinea showing the location of >50 potentially active volcanoes coloured according to the USGS Volcano Disaster Assistance Program. Labelled volcanoes have erupted since 2000. Dashed line in the inset map shows the location of the main map. Elevation data is from the Shuttle Radar Topography Mission (Farr et al. 2000).
Past decades of Australian assistance to the RVO have laid the foundations for a successful volcano monitoring operation. Progress includes an established capability for the installation and operation of ground-based monitoring equipment at six high-threat volcanoes,

5
a comprehensive understanding of the subsurface structure of the Rabaul Caldera (Johnson et al. 2010) and community outreach in the provinces of Oro, Madang, West New Britain, East New Britain and Bougainville (Nancarrow and Johnson, 2015). However, recent thefts and scavenging of ground-based instruments at four volcanoes (only five are currently instrumented at all), plus a continued lack of instrumentally-based warnings of volcanic eruptions, has led to the need to re-examine Australia’s approach to supporting volcano monitoring in PNG.
A review of current global best practice in the acquisition and use of ground-based and remotely-sensed (satellite) datasets for volcano monitoring was undertaken, using case studies and instrumental advances documented in the scientific literature, plus direct conversations with international volcano observatories. Full details and recommendations relating to individual monitoring methods are outlined in the accompanying Technical Report. The key findings of the investigation are summarised here. Implementation of these recommendations, described in the following sections, is required to elevate the current level of volcano monitoring in PNG towards a functioning early warning system for volcano hazards. Principally the recommendations emphasise the need to supplement past support for instrumentation at volcanoes with matched assistance in the development, and implementation, of Standard Operating Procedures, to translate scientific data into information that is effectively communicated to the public and government. Continued support for ground-based monitoring is recommended on the basis of low-cost instrumentation, bolstered by furthering RVO’s capacity to make use of remote-sensing data and community-based observers. These components are essential whilst uncertainty continues to surround the sustainability of ground-based instrumental networks.
Strengthening ground-based monitoring networks
Low-cost instrumentation
Seismic monitoring is the principal component of ground-based instrumentation installed at PNG volcanoes. Monitoring the number, magnitude, location and types of volcanic earthquakes lies at the heart of every volcano observatory (Loughlin et al. 2015) and permanent, continuously operating instrumentation with near-real-time data telemetry back to the observatory is the core of an effective ground-based monitoring network (personal communication: GNS Science, New Zealand).
Seismic instrumentation of PNG volcanoes should continue to be supported by Australia, including planned installations of existing seismometers supplied by VDAP. New instrument acquisitions should opt for low-cost, off-the-shelf, “Raspberry Shake” seismometers (https://raspberryshake.org/), currently in a test phase at RVO and the Port Moresby Geophysical Observatory (PMGO). These instruments are an order of magnitude cheaper than traditional sensors and can therefore be installed in greater numbers, reducing the impacts of thefts upon data acquisition, and allowing for installations in locations that may not be optimal but provide additional security, such as cell-phone towers or other municipal infrastructure.
Volcano observatories frequently utilise SeisComp3 (Hanka et al., 2010) for processing, storage and dissemination of seismic data (Alvarado et al. 2018). RVO and PMGO are currently receiving assistance from Australia to transition regional and volcano seismic networks to this system. This should be used as an opportunity to promote integration of these networks (and other international networks such as the Oceania Regional Seismic Network: ORSNET), which is beneficial to volcano monitoring, especially when only one station is in operation at a volcano (Guerrero et al. 2015).
Second to seismic instrumentation, small ground-based networks (i.e. those with few instruments or instrument types) at other global volcanoes commonly include low-cost web cameras (e.g. volcanoes throughout Vanuatu following assistance from GNS Science, New Zealand; Pacaya Volcano, Guatemala: Escobar-Wolf et al. 2015). Imagery is typically telemetered to the observatory as still images at regular intervals (e.g. one per minute or hour), providing direct visual insights into activity at remote volcanoes.
In combination, these methods provide basic sources of data to support observations of unrest, eruption assessments and activity reporting. Other key components of ground-based networks include instruments for monitoring ground displacements (most commonly with the Global Positioning System: GPS) and gas emissions (Moran et al. 2008). Like seismometers, lower cost instruments for these applications are already, or soon to be, available. Geoscience Australia (GA) are currently experimenting with lower cost GPS solutions

6
(e.g. Swift Navigation: https://www.swiftnav.com/piksi-multi) for continuous displacement monitoring, and UV cameras based on Raspberry Pi technology (in this case PiCams) are yielding new, lower cost solutions to monitor volcanic emissions of sulphur dioxide (SO2: Wilkes et al. 2017). Unlike seismic monitoring, both gas and ground-displacement measurements can be supported by remote-sensing. This capability should be utilised in conjunction with a strategic plan for the deployment of lower cost instruments as and when resources become available, either for permanent installations, or to form part of a response cache for use during periods of heightened unrest or eruptions.
Community-based observers
Where ground-based instruments are limited or unavailable, the first information that an eruption is imminent may come from eye-witness reports of felt earthquakes, gas emissions, or other changes evident to local communities (Pallister and McNutt, 2015; Loughlin et al. 2015). Outstation observatories and observers play significant roles in gathering observations at volcanoes globally, allowing communities to continue to reside in hazardous locations (Stone et al. 2014) and aiding evacuations, including in PNG prior to the eruption of Ulawun, New Britain, in 2000. Involving communities in volcano monitoring enhances communication, understanding and trust between scientists and the public (Stone et al. 2014; Bowman and Henquinet, 2015), and alleviates thefts of instruments and infrastructure, as communities understand why equipment is there and that they have a stake in its successful operation (Mothes et al. 2015).
Expanding and supporting the community-based network of observers at PNG volcanoes is key to sustaining the monitoring and outreach capacity of RVO. Support is required to fill currently vacant posts, identify which institutions or people are most suited to becoming observers, and develop easier ways for members of the public to relay information to RVO. Improvements in cell phone connectivity continue to increase the scope of community-based initiatives. RVO has already established communication with existing observers using WhatsApp (Nancarrow and Johnson, 2015), and other examples of cell-phones being used for municipal projects in PNG include health (ABC, 2018) and corruption reporting (UNDP PNG, 2014; Papua New Guinea Today, 2018). Globally, websites and cell-phone apps are fulfilling an increasing role in channelling public observations of natural hazards to scientists quickly and in a standardised format, and in channelling information from scientists to the public. Two such examples of this “citizen-science” are the USGS “Did You Feel It” website (https://earthquake.usgs.gov/data/dyfi/) and the British Geological Survey app “myVolcano” (https://itunes.apple.com/au/app/myvolcano/id774648897?mt=8). The applicability of such a service specifically for natural hazards in PNG should be explored.
Building capability for the use of remote-sensing data
At volcanoes with no permanent ground-based instruments, satellite-based data provides the best means of bridging the volcano-monitoring data gap (Loughlin et al. 2015), and of making systematic observations of eruption precursors on regional scales (e.g. Biggs et al. 2009). A range of satellite sensors have repeatedly demonstrated their ability to monitor volcanic unrest, detect eruption onsets, and track eruptive hazards (Poland, 2015). However, most observatories in low to middle-income countries, including RVO, lack the resources necessary to access, process and apply raw satellite data sets (Ebmeier et al. 2018). Despite this, RVO’s capacity to use remote-sensing can be built in two ways: via access to derived satellite products already being disseminated via the internet; and through developing partnerships with external organisations, consortiums or research institutions. Currently this encompasses support provided by the Darwin Volcanic Ash Advisory Centre (VAAC), and satellite radar products provided by GA.
Access to derived satellite data products
International initiatives to develop and distribute downstream data products provide ready and open access to some remotely-sensed information via the internet. This includes services delivering measurements of SO2 and thermal emissions. Synoptic studies using remote-sensing SO2 and thermal monitoring platforms indicate that some PNG volcanoes have high emission rates (McCormick et al. 2012; Wright et al. 2015). Within any given month, at least one to three PNG volcanoes may be expected to emit detectable levels of SO2 (McCormick et al. 2012). Similarly, Bagana and Manam are ranked in the top 30% of thermal-energy emitting volcanoes globally (Wright et al. 2015). Thus, these products may provide RVO with useful information about some active PNG volcanoes.
7
Current platforms for SO2 monitoring products include NASA’s Global Sulfur Dioxide Monitoring Service (https://so2.gsfc.nasa.gov/); NOAA National Environmental Satellite, Data and Information Service (http://satepsanone.nesdis.noaa.gov/pub/OMI/OMISO2/index.html); and Support to Aviation Control Service (SACS: http://sacs.aeronomie.be/; Brenot et al. 2014), which will soon incorporate new, higher resolution data from the European Space Agency Sentinel-5 satellite into issued alerts.
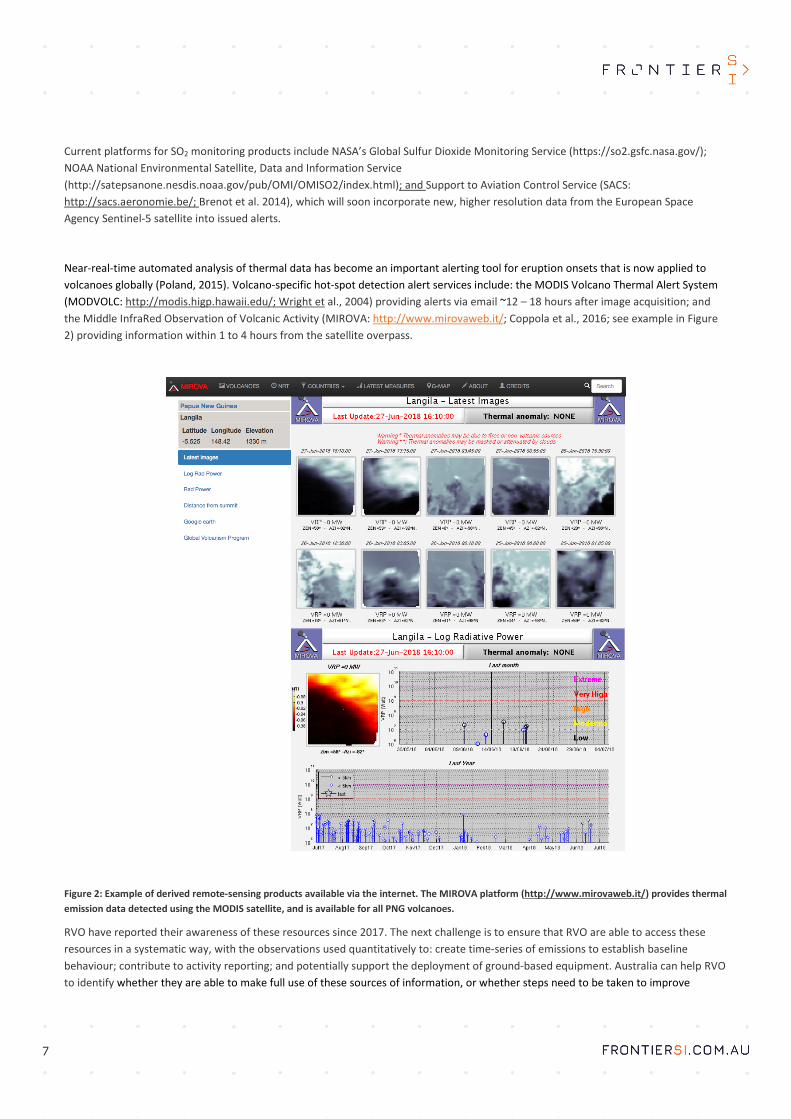
Near-real-time automated analysis of thermal data has become an important alerting tool for eruption onsets that is now applied to volcanoes globally (Poland, 2015). Volcano-specific hot-spot detection alert services include: the MODIS Volcano Thermal Alert System (MODVOLC: http://modis.higp.hawaii.edu/; Wright et al., 2004) providing alerts via email ~12 – 18 hours after image acquisition; and the Middle InfraRed Observation of Volcanic Activity (MIROVA: http://www.mirovaweb.it/; Coppola et al., 2016; see example in Figure 2) providing information within 1 to 4 hours from the satellite overpass.
Figure 2: Example of derived remote-sensing products available via the internet. The MIROVA platform (http://www.mirovaweb.it/) provides thermal emission data detected using the MODIS satellite, and is available for all PNG volcanoes.
RVO have reported their awareness of these resources since 2017. The next challenge is to ensure that RVO are able to access these resources in a systematic way, with the observations used quantitatively to: create time-series of emissions to establish baseline behaviour; contribute to activity reporting; and potentially support the deployment of ground-based equipment. Australia can help RVO to identify whether they are able to make full use of these sources of information, or whether steps need to be taken to improve
8
accessibility of these data, or training is required to promote systematic usage. Given that access to these resources is relatively new (last 18 months), RVO would benefit from Australia’s assistance in reviewing their current information management practices and infrastructure, with an assessment of whether these are suited to including results from online remote-sensing services as well as ingesting other new data-streams, such as images from web cameras.
Access to other remote-sensing measurements via partner organisations
Volcano observatories typically gain access to other remote-sensing information through partnerships with external organisations, consortiums or research institutions. Partners task or access the satellite imagery, carry out analysis of the data and communicate results, with observatories requesting observations at volcanoes that they deem to be restless (Pritchard et al. 2018). Australia supports RVO in this capacity via systematic sharing of information through the Darwin VAAC and GA, who have activated the International Charter for Space and Major Disaster, plus provided ad hoc satellite radar measurements during eruptions.
Interferometric Synthetic Aperture Radar (InSAR) measurements of ground displacements fulfil an increasing role in volcano monitoring. Volcanoes that exhibit ground displacements are statistically more likely to erupt, and InSAR surveys have increased the number of ground displacement observations at volcanoes by ~400% since 1997 (Biggs et al. 2014). Whilst RVO struggles to resource repeat ground-based displacement campaigns, satellite-based InSAR is an attractive alternative for carrying out large-scale, multi-volcano surveys, without the need to physically visit each volcano (e.g. Chaussard and Amelung, 2012; Ebmeier et al. 2013). Unlike gas and thermal monitoring, automated services for InSAR-derived ground displacement detection are still in development (González et al. 2016). Environmental conditions at PNG volcanoes present acute challenges for applications of these data, and it is anticipated that the use of InSAR by RVO will require external involvement for the foreseeable future. For Australia, an immediate and attainable goal in assisting RVO (and one that is currently underway - see Appendix 6 in the accompanying technical report), is a systematic baseline survey of ground displacements at all PNG volcanoes using InSAR. Longevity of InSAR monitoring for PNG beyond this, and access to other remote-sensing imagery, would benefit from greater integration of RVO into the international volcanological community.
Establishing Standard Operating Procedures
Volcano monitoring data alone can never automatically guarantee successful outcomes (Tilling, 2008). The acquisition of monitoring information by an observatory must be matched with an equal capability to manage, interpret, and translate data into an accessible format that can 1) be used to report volcano state-of-health to the public, media and government, and 2) benefit long-term trend analysis to establish baseline behaviour from which anomalies can be identified
The information contained within recent activity reports produced by RVO during eruptive crises, plus the absence of information during inter-eruption periods, indicates gaps in current data analysis and information reporting by RVO.
Australia is equipped to assist RVO to develop and implement Standard Operating Procedures to robustly and systematically analyse incoming monitoring data. Such protocols should outline the types of output products (e.g. earthquake counts, Real-time Seismic Amplitude Measurements – RSAM: Endo and Murray, 1991) and an achievable frequency of analysis (e.g. access satellite-derived measurements from the internet once a week at high-threat volcanoes). Building this capacity will ensure the observatory fulfils, and is not overwhelmed by or distracted from, day-to-day and week-to-week monitoring tasks. The observatory can then demonstrate it is able to effectively utilise existing monitoring data before new or more data-streams are added. These standard output measurements, complemented by imagery from web cameras, will provide quantitative evidence to be included in activity reports (see examples in Appendix 3 of the accompanying Technical Report), and can be systematically recorded to establish baseline activity.
Standard Operating Procedures require the re-design of RVO’s system of Volcano Alert Levels, which are currently used inconsistently in eruption reports. Volcano Alert Levels are a tool used universally by observatories to quickly and simply inform local populations and government of the level of volcanic unrest using a simple colour, letter or number code system (Winson et al., 2014; Loughlin et al. 2015; Brown et al. 2015). Observatories benefit from using Volcano Alert Levels that are designed to be realistic, simple and appropriate

9
given the level of access to monitoring data (e.g. The Vanuatu Meteorology and Geo-Hazards Department, 2016). RVO would benefit from transitioning to a transparent and universal system to be used consistently in all communications.
The Standard Operating Procedures implemented at RVO should culminate in the production of regular activity reports that incorporate the re-designed Volcano Alert Levels and systematic observational outputs (e.g. earthquake counts, RSAM measurements). Each volcano observatory follows unique protocols for collating information about volcanic activity in reports or bulletins, typically generated weekly (e.g. Pritchard et al. 2018). Australia can assist RVO to formulate an achievable and useful schedule on which reports should be produced, design a report template, and run training in how to populate reports with observational data. Reports should follow a consistent structure providing clear details of the current Volcano Alert Level, whether this has changed since the last report, and any observations that have been made, including the method (e.g. whether SO2 was detected via ground or satellite-based instruments). Systematic reporting of information in this way improves accountability of the observatory, ensures that monitoring data-streams are used in a consistent and meaningful manner, not just collected, and also assists observatories in collating information required for other systematic bulletins of international significance such as the Volcano Observatory Notification to Aviation (VONA).
Establishing an effective communication framework
Experience suggests that RVO struggles to maintain a visible and effective presence amongst PNG national government and the public. This is worsened by a lack of instrumentally based, early warnings of eruptions. Under these conditions, the observatory is likely to continue to struggle to obtain the national support required to expand or adequately resource its monitoring operations.
Effective communication is recognised as boosting support for volcano observatories, as it justifies the existence of the observatory to the public and government, who otherwise may not be aware of the observatory’s activities, only hearing about and from scientists during times of crisis (Stone et al. 2014). Consequently, RVO would benefit from assistance in establishing a consistent and achievable communication framework detailing: which information should be shared and how often; which platforms should be used; and to which stakeholders it should be sent (including government, the media, community representatives, NGOs and the general public.) Establishing clear, sustainable and strong communication practices is a low-cost activity that is far easier to achieve during non-eruptive times and expedites community engagement during eruptions (personal communication: VDAP).
Volcano observatory communications call upon a diverse range of dissemination channels including observatory websites (see example in Figure 3), SMS, mobile apps, email, phone lines, radio, Skype, WhatsApp and social channels such as Facebook and Twitter. Effective utilisation of these low-cost technologies is crucial to reach a larger segment of the population (Alvarado et al. 2018) and mean that outreach activities no longer need solely rely upon sporadic visits by observatory staff, sometimes years apart. In particular, social media plays an increasing role in informing and updating the public about volcanic unrest (Brown et al. 2015). In many cases information is uploaded to social media before it is disseminated on official websites (e.g. personal communication: R. Weber, GA, describing Indonesia; C. Muller, Observatorio Vulcanológico y Sismológico de Costa Rica, describing Costa Rica).
A significant challenge for RVO is its difficulty to communicate nationally and internationally due to the lack of an observatory website or social media presence. For the >30 volcano observatories listed by the World Organisation of Volcano Observatories, only four (including RVO) were found not to have a website. Websites act as point of contact to the observatory, improve visibility of the observatory within the international community, and improve dissemination of information. Content can range from basic static information such as contact details plus the names and locations of volcanoes, to the addition of Volcano Alert Levels, links to recent activity reports, links to social media platforms, information about different types of volcanic hazards, access to hazard maps, and near-real-time streams of monitoring data such as web cameras and seismometers (Loughlin et al. 2015; McNutt and Pallister, 2015).
Improving the standard of communication of RVO to match that of similar organisations globally will raise the visibility and accountability of the observatory within PNG (to both public and government) and within the international volcanological community. From this, the observatory is better placed to benefit from global advances in the use of remote-sensing and other data to support volcano monitoring.

10
Figure 3: The Vanuatu Meteorology & Geo-Hazards Department website provides clear contact information and links to the Department’s social media pages. Each volcano is described on a separate page (this example is for Ambyrm: http://www.vmgd.gov.vu/vmgd/index.php/geohazards/volcano/our-active-volcanos/ambrym) depicting a live feed to a seismic drum plot and web camera, plus links to volcano activity reports and a Volcano Alert Level.

11
THE WAY FORWARD The recommendations outlined by this report and the accompanying Technical Report are summarised in Figure 4. This path forward aligns with RVO’s strategic priorities and the vision of the PNG Department of Mining, Petroleum and Geohazard Management.
Australia’s focus should lie in assisting RVO to make better use of monitoring data collected at PNG volcanoes, and in modernising community engagement to improve the observatory’s profile in national PNG government and to the public. Openness and a willingness to share information are identified as fundamental to the success of all volcano observatories (personal communication: VDAP). Assisting RVO to become more outward-facing will also help to attract other technical assistance and donations, and ensure the observatory is better placed to benefit from the research advances of the wider volcanological community, most significantly in access to remote-sensing data.
The addition of any new ground-based monitoring instruments to RVO’s equipment cache should consider lower cost solutions to seismic, GPS and gas monitoring, plus web cameras, which are routine components of small instrument networks. The value of additional monitoring data-streams from new equipment should be carefully assessed against RVO’s capacity to access and utilise existing data to produce robust and systematic observational outputs. RVO will continue to encounter challenges in the maintenance of equipment, and the telemetry and storage of monitoring data. Any increases to data volumes, or changes in data types, will require support for information management and information storage infrastructure. For this, Australia is likely to be required to provide on-going assistance.
These recommendations comprise what are viewed to be realistic steps that can be taken to assist RVO towards providing an effective early warning system for volcanic hazards. The activities offer tangible progress for the observatory measured, not just in new instruments, but in a functioning observatory website, templates for activity reporting, a new system of Volcano Alert Levels, and Standard Operating Procedures, ensuring the observatory is equipped with a robust and sustainable day-to-day, week-to-week operating plan, that culminates in an effective framework for communicating volcano hazard information to stakeholders.
Figure 4: Flowchart summarising the main recommendations of this report. Blue boxes highlight additional components that are required to successfully implement the suggested set of Standard Operating Procedures. The addition of new monitoring instruments should be carefully assessed against RVO’s capacity to fulfil these Standard Operating Procedures with the existing monitoring data.

12
1. Introduction Unlike other natural hazards, volcanic eruptions are often preceded by duration of ‘unrest’ (e.g. Phillipson et al. 2013). If detected and recognised effectively, this can provide early warning to surrounding populations, and initiate actions to mitigate disaster. Despite exponential global population growth, the number of fatalities per volcanic eruption has notably declined in recent decades, demonstrating that the application of science and technology to monitor volcanoes and reduce risks is effective (Auker et al. 2013). Since the 1980s it is estimated that approximately50,000 lives have been saved globally through volcano monitoring and risk reduction measures (Voight et al. 2013).
Volcano monitoring provides the basic data that can be used to understand when and where volcanoes will erupt, which areas are safe or hazardous during an eruption, and when the eruption will end (McNutt and Pallister, 2015). Increasingly volcanoes are being monitored from both the ground and space (remote-sensing), enabling volcano observatories to access more monitoring data-types to anticipate hazards and provide forecasts regarding the onset or evolution of volcanic eruptions (Sparks et al. 2012). No matter how accurate or timely, volcano monitoring data alone can never automatically guarantee successful outcomes, as the translation of monitoring information to disaster risk reduction is dominated by political, social-economic and cultural factors (Tilling, 2008). However, the acquisition and use of adequate monitoring information is the only opportunity to try and avert disaster (Tilling, 2008).
This report details current “best practice” in the acquisition and use of ground-based and remotely-sensed datasets to monitor volcanoes. The content is based upon case studies and instrumental advances documented in the scientific literature, plus information provided publicly by volcano observatories on websites, and direct conversations with staff from international volcano observatories (these contacts and websites are listed in Appendix 1). The report aims to provide examples from other observatories that are most applicable in the context of volcano monitoring in Papua New Guinea (PNG). Monitoring methods are therefore outlined in light of the successes and challenges experienced during recent decades of Australian assistance for volcano monitoring in PNG. Guidance is provided as to how these approaches could provide sustainable improvements to monitoring remote volcanoes in this setting.
As well as detailing ground-based and remote-sensing monitoring methods, the report highlights additional activities required for a functional volcano monitoring operation. These components are necessary to translate and communicate scientific monitoring data into relevant information that reaches, benefits and is understood by government authorities and the public. These aspects of a volcano monitoring are of equal, if not greater importance than data collection, particularly where uncertainty surrounds the sustainability of instrumental networks.
Rabaul Volcano Observatory and the volcanoes of Papua New Guinea
Volcano monitoring in PNG is fulfilled solely by the Rabaul Volcano Observatory (RVO), which is responsible for monitoring more than 50 Holocene volcanoes (as categorised by the Smithsonian Global Volcanism Program: https://volcano.si.edu/). This is an order of magnitude more monitoring targets than the jurisdictions of many of the world’s global volcano observatories, and the RVO has a modest staff to undertake all monitoring and outreach tasks. The most recent RVO organisation chart lists 17 staff positions within the observatory, but at the present time it is not clear how many positions are actually filled. The total number may be as low as 10.
In addition to assistance provided by Australia through the Department of Foreign Affairs and Trade (DFAT) and Geoscience Australia (GA), and their predecessor organisations, RVO receives assistance for monitoring PNG volcanoes from the United States Geological Survey (USGS) Volcano Disaster Assistance Program (VDAP) which has provided instrumentation (e.g. Endo, 2005) and crisis response (e.g. Ewert and Miller, 1995), and the Japan International Cooperation Agency (JICA) which has provided crisis response (e.g. Global Volcanism Program, 2002) and supported other activities alongside GA, such as the Rabaul Earthquake Location and Caldera Structure experiment (RELACS: Johnson et al., 2010).
13
Since the 1994 eruption of Rabaul caldera, GA has worked with RVO through the PNG Volcanological Service Support project (1995-2000) and the Twinning Program (2000-2015), which resulted in monitoring successes, including the design and installation of instrumental monitoring networks at Rabaul caldera and at five remote volcanoes — Ulawun, Pago (Witori), Karkar, Manam, and Lamington. However, recent thefts and scavenging at four of these sites, plus a multitude of other economic, technological and personnel challenges have hindered the recent work of RVO and its ability to provide timely, instrumentally-based early warnings of eruptions. Without this demonstrable benefit to saving lives and livelihoods within PNG, the observatory has struggled to obtain the support required in PNG government to expand or adequately resource its monitoring operations.
In an unpublished VDAP threat assessment of PNG volcanoes (reproduced in Appendix 2), 28 volcanoes ranked as low threat; 13 volcanoes ranked as moderate threat; and 11 ranked as high to very high threat. Producing threat assessments for PNG volcanoes is challenging. Little is known about eruptive histories and eruptive potential, and since this ranking exercise, an unexpected eruption at Kadovar volcano on 5 January 2018 (ranked in the “low threat” category) led to a complete and prolonged evacuation (currently 5 months), emphasising the eruptive and disruptive potential of even low-threat PNG volcanoes.
Indicators of volcanic unrest
Volcano monitoring involves systematic assessments of geophysical, geological and geochemical data at a volcano, each of which provides information about physical processes that may be related to the movement of subsurface magma or other eruption precursors (McNutt and Pallister, 2015). The three pillars of volcano monitoring are measurements of seismicity, gas emissions and displacements of Earth’s surface (ground deformation).
Monitoring volcanic seismicity (i.e. earthquakes) lies at the heart of every volcano observatory (Loughlin et al. 2015). Seismic activity almost always precedes and/or accompanies volcanic activity, and seismicity is therefore considered to be the best indicator and forecaster (over days to weeks) of the level and evolution of volcanic activity (McNutt and Pallister, 2015). The number and type of seismic events can be diagnostic during the build-up to an eruption, commonly progressing from dominantly volcano-tectonic events to dominantly low-frequency earthquakes in the hours, days, and weeks preceding the onset of eruptive activity (Moran et al. 2008).
As magma ascends to shallower depths, the solubility of volatiles contained within the melt tends to decrease leading to exsolution and bubble formation within the melt. If permeability is high enough, gases escape to the surface, and their detection, measurement, and variations over time may represent an eruption precursor (e.g. Carn, 2015). Different gases are thermodynamically stable under different conditions, therefore like seismicity, tracking the progression of gas flux and species can be diagnostic of the depth, temperature and volume of subsurface magma (e.g. Carn, 2015). Degassing transitions from dominantly carbon dioxide (CO2) to dominantly sulphur dioxide (SO2) as magma ascends towards the surface. Progressively increasing fluxes of SO2 may be indicative of a possible eruption, and if degassing decreases without an associated decrease in seismicity, degassing pathways may have become plugged signalling the possibility of an explosive eruption (McNutt and Pallister, 2015). When volcanic degassing events such as explosions, eruption tremors and bursts couple with the atmosphere, sound waves below 20Hz are generated and can be measured using infrasound (Garcés et al. 2013).
Comparisons between ground-based sensors deployed at volcanoes globally suggest that ground deformation is the indicator of pre-eruptive unrest that provides the longest lead-time (Phillipson et al. 2013). Inputs of magma into the crust often result in Earth surface displacements of millimetres to tens of centimetres, and volcanoes that exhibit any type of ground deformation (uplift or otherwise) are shown to be statistically more likely to erupt (Biggs et al. 2014). Ground deformation therefore has strong evidential worth as an eruption indicator (Biggs et al. 2014). Through simple physical models, displacement measurements are often used to infer the location, magnitude and geometry of buried sources of displacements, through which it may be possible to distinguish between magmatic and non-magmatic causes of deformation (Moran et al. 2008).

14
At a volcano that has not been historically active, or where monitoring is not available, the first information that an eruption is imminent may come from eye-witness reports of felt earthquakes, gas emissions, variations in hydrothermal and groundwater systems, or other changes evident to local communities (Pallister and McNutt, 2015; Loughlin et al. 2015). Visual observations can also be made using cameras and satellites operating either in the visual or Infra-Red (IR) parts of the electromagnetic spectrum. Thermal anomalies detected in this way are indicative of fumarole fields with above-ambient temperatures, warm crater lakes, hot vents heated by emitted gases, and active lava lakes, flows, or domes (Carn, 2015). Thermal anomalies have been detected to span multiple months prior to eruptive events (e.g. Sana Ana volcano, El Salvador: Laiolo et al. 2017), and during eruptions are shown to correlate with lava effusion rates, cycles of lava dome growth and explosive disruption, and short-term variations in eruption intensity (Wright et al. 2015 and references therein).
When a volcano exhibits signs of unrest, there remains significant uncertainty as to whether it will lead to an eruption. A synthesis of unrest activity at 228 volcanoes active between 2000 and 2011 indicates that only 47% of reported unrest led to eruption (Phillipson et al., 2013). The duration of unrest may range from days to years (Phillipson et al., 2013), and may be significantly more difficult to detect at volcanoes with permanent or semi-permanent open conduits, which do not exhibit precursory ground deformation (Chaussard et al. 2013) and have fewer and smaller precursory earthquakes (McNutt and Pallister, 2015). Understanding the significance of unrest at a given volcano is therefore enigmatic. Volcanologists are best equipped to contextualise activity only when they have knowledge of the baseline behaviour of the volcano. The first objective of volcano monitoring is to gauge the background state of behaviour against which changes can be measured (e.g. Loughlin et al. 2015). Monitoring information collected during non-eruptive times therefore has a crucial role in evaluating activity during unrest episodes.
3. Ground-based monitoring techniques Ground-based instrument networks for volcano monitoring vary significantly in cost, sophistication, effectiveness and deployment type. Permanent deployments acquire data over long time periods (years to decades), with information either telemetered to the observatory for real-time analysis or, where telemetry is not possible, collected on a regular basis (e.g. weekly, monthly). Where resources are available, permanent, continuously operating instrumentation (most commonly seismometers), with data telemetry back to the observatory, is considered to be the core of an effective ground-based monitoring network, facilitating some level of near-real-time continuous monitoring (personal communication: B. Scott and G. Jolly, GNS Science, New Zealand). From this minimum baseline, observatories are best placed to detect at least some level of unrest. Temporary deployments of equipment (hours to days or weeks) can then densify ground-based networks in a reactionary response (Loughlin et al. 2015). Temporary deployments may also occur where permanent deployments are not possible (e.g. campaign GPS surveys versus installation of a continuously recording station).
The most common tool for ground-based volcano monitoring is a seismic network to detect the magnitude, location and types of earthquakes. This may be accompanied by geodetic instruments to measure changes in ground surface elevation, and cameras, spectrometers or other instruments to measure changes in volcanic gas emissions. Other components can include: web cameras and thermal-IR (TIR) imaging cameras to provide multi-spectral observations; additional geochemical monitoring via sampling and analysis of gases and water emitted from the volcano summit and flanks; infrasound to detect explosions; other geophysical properties such as changes in gravity or conductivity; and other environmental factors such as changes in groundwater levels in wells or at tide gauges. Many of these phenomena can be observed by people living close to the volcanoes, and reports from local communities also form part of the monitoring toolkit available to volcano observatories.
Challenges in the use of ground-based instruments for volcano monitoring
Installing and maintaining ground-based networks of instruments at PNG volcanoes is problematic. Access to sustainable data telemetry is a limiting factor for ground-based instruments and once installed, networks are vulnerable to destruction by volcanic activity and extreme weather conditions, plus theft, scavenging and vandalism. Usual precautions taken to protect stations, such as concrete housing, have proved to be insufficient, with thieves targeting the batteries and solar panels used for power as well as, or in preference to, the instruments themselves (personal communication: VDAP field engineers). Theft of instruments and infrastructure is a problem
15
experienced by volcano observatories worldwide but is noted to be reduced where communities understand why equipment is there and that they have a stake in its successful operation (e.g. Mothes et al. 2015). In PNG, improved public awareness contributed to the absence of instrument thefts during the RELACS seismic experiment from September 1997 to January 1998 (Nancarrow and Johnson, 2015).
Co-locating instruments with municipal infrastructure through community partnerships (e.g. in schools) is another commonly used strategy, involving the community in protecting the instrument and clearing away vegetation and ashfall. Alternatively, co-locating instruments with other protected infrastructure such as cell-phone towers is possible, and new regional seismic stations installed by the Port Moresby Geophysical Observatory (PMGO) have been co-located with Telikom infrastructure.
In PNG and other low-income countries, ground-based instrumentation is predominantly donated by international organisations. There are numerous cases where developed countries provide expensive equipment, which is installed and then quickly malfunctions (personal communication: G. Jolly, GNS Science, New Zealand). New donations inherently require additional resources for hiring or training personnel, and for maintenance and purchase of spare parts (Granados et al. 2015). Maintaining the instruments, power sources and telemetry requires a constant input of resources from local or national government, and often this does not match the requirements of the observatory. Donations of equipment are therefore not always as beneficial as intended and can place additional strain on an already stretched observatory to maintain a patchwork network of different instruments, for which they do not receive sufficient resources from government to consistently maintain. Having un-used or in-operable instruments risks frustration amongst observatory personnel. Future requests for assistance can become solely focussed on support for repairing or installing out-dated equipment, rather than for improving other aspects of observatory operations. An argument can be made for consolidating networks of out-dated equipment and making what does work, do so more effectively (personal communication: VDAP).
Current use of ground-based monitoring by the Rabaul Volcano Observatory
Despite the high level of volcanic activity in PNG, currently only five PNG volcanoes have any kind of permanent instrumental monitoring. Additionally, some volcanoes may have in place official observers who undertake systematic surveillance on behalf of RVO. Establishing a sustainable, cost-effective solution to monitor PNG volcanoes, particularly those in remote locations, therefore remains a significant challenge.
Seismic monitoring is the most developed component of RVO’s monitoring capability, with four seismologists on staff according to the most recent RVO organisational chart. A 7-station seismic network is in place to monitor the Rabaul caldera, plus single stations at Ulawun, Langila, Manam and Karkar. Additional seismic stations are under consideration for Kadovar, Bagana and Lamington.
In addition to seismic monitoring, geodetic monitoring of Rabaul caldera currently includes a network of four continuously recording GPS receivers. This network was established in 1996 by GA and upgraded by VDAP in 2000 (Endo, 2005). Nearly two decades of displacement observations have been collected, but the observations are often not continuous as stations are not quickly returned to service after outages. Other geodetic techniques employed at the Rabaul caldera have included campaign levelling and GPS, plus microgravity, tiltmeter and Electronic Distance Measurement networks.
Seismic monitoring
The first aim of a volcano seismic network is to track earthquake rate and energy release, as volcanic eruptions are typically preceded by increases in the number and size of earthquakes (Moran et al. 2008). Real time seismic amplitude measurement (RSAM: Endo and Murray, 1991) is well tested for this purpose and has been an effective mechanism for anticipating renewed volcanic activity, including prior to the 2000 eruption of Ulawun. These basic measurements are achievable with a single sensor, and where resources are limited, single seismic stations can be used to alert authorities to unrest and trigger the deployment of additional monitoring equipment

16
(Guerrero et al. 2015). Consequently, it would be considered a major advance if all active volcanoes had at least one dedicated seismic station with continuous data telemetry to the observatory (Loughlin et al. 2015). Having two seismic stations is beneficial for distinguishing between volcanic and non-volcanic signals e.g. wind, aircraft, manmade explosions and electronic interference (Moran et al. 2008), but the next major improvement comes with networks of five to six stations - a very significant jump (personal communication: B. Scott and G. Jolly, GNS Science, New Zealand). With this level of instrumentation, it becomes possible to track changes in earthquake location, event type and source properties, providing more information about magma migration and a volcano’s eruptive state, and improving the ability to forecast the evolution of volcanic activity (McNutt, 2002; Moran et al. 2008).
Instruments within volcano seismic networks have historically been short period (1 second), analogue, single (vertical) component instruments with telemetry over low-frequency radio or phone lines. However, because these instruments have a limited dynamic range, they can become saturated with energy from large events that occur during energetic pre- or co-eruptive phases (Moran et al. 2008). Increasingly, three component, digital, broadband and/or strong motion seismometers are installed in volcano monitoring networks, providing more accurate earthquake locations (Moran et al. 2008) and recording over a larger band of frequencies, with a higher dynamic range capable of capturing a greater spectrum of events, including long period seismicity, micro-earthquakes and large magnitude earthquakes (McNutt, 2002). Data is then digitised on-site and sent via UHF radio, satellite, microwave, internet or phone technology to the observatory.
Short period, single component seismometers have remained useful components of volcano seismic networks because they are lower cost and somewhat simpler than digital broadband instruments, requiring less power, and a smaller bandwidth for low-frequency, analogue data telemetry (Moran et al. 2008). Dense broadband seismic networks are typically funded through collaborations with research institutions rather than observatories (e.g. Telica Volcano, Nicaragua: Rogers et al. 2015). However, the accessibility and cost of broadband instruments has recently reached a pivotal point with the advent of “pocket” seismographs (e.g. “Raspberry Shake”, based on Raspberry Pi: https://raspberryshake.org/), which are an order of magnitude cheaper than traditional broadband sensors. Raspberry Shake instruments include: single-component (1D), three-component (3D), vertical component plus three-component accelerometers (4D), and vertical component plus infrasound (shake’n’boom).
Large-scale deployments of Raspberry Shake instruments include 100+ units acquired by the Oklahoma Geological Survey, and for Disaster Risk Reduction initiatives in schools in Indonesia, but they have not yet been tested for volcano monitoring purposes. A recent test installation of a Raspberry Shake instrument in PNG by GA will be informative in gauging the suitability of these instruments and their sensitivity to low magnitude (M<= 1) events. Other organisations considering trialling the Raspberry Shake instruments have suggested that low cost alterations of the sensors may result in a significant improvement in instrument performance (personal communication: VDAP).
Volcano seismic networks benefit from sharing data with any regional seismic sites (especially when only one station is in operation: Guerrero et al. 2015), and best practice is to have just one analysis system that accesses all seismic data/sites, both regional and volcano-specific (personal communication: B. Scott, GNS Science, New Zealand). The SeisComP3 software (Hanka et al., 2010) has been introduced both at RVO and PMGO. This application combines tools for data acquisition, transfer and archive, with automatic procedures to determine location, depth, magnitude, and rupture parameters, plus alerting and visualization tools (Hanka et al., 2010). SeisComp3 is now frequently in use at other volcano observatories for processing, storing and disseminating seismic data (e.g. Alvarado et al. 2018).
PNG is subject to large regional seismic events. First-hand observations of RVO’s interpretation of seismic data suggest that there may be some level of preoccupation with picking and locating these regional earthquakes rather than assessing volcanic seismicity (personal communication: VDAP). Revisiting or re-establishing a set of Standard Operating Procedures, in conjunction with transitioning to SeisComP3, may help to re-focus RVO seismic monitoring efforts on volcanic events, whilst facilitating better integration of the volcano and regional seismic networks, and avoiding time being spent on unnecessary manual tasks that could be automated. A useful aim would be to define a set of basic, standardised outputs that are achievable with the current level of instrumentation, such as RSAM

17
time-series and event counts. These standard outputs can then be used to provide quantitative evidence in activity reports (see examples in Appendix 3) and be systematically recorded to establish baseline seismic activity at volcanoes with instrumentation.
Recommendations
High priority
• Continued assessment of the applicability of low-cost Raspberry Shake instruments to monitor volcanic events. It is recommended that the results of the current test deployment are shared with other parties such as VDAP. Full deployment of Raspberry Shake instruments may first be tested in response to an event as part of RVO’s reserve cache of equipment before a more significant investment is made.
• It is recommended that municipal infrastructure or cell-phone tower compounds are considered for future permanent seismic station installations to increase levels of security. Concrete housing may require reinforcement with steel panels or bars.
• Continue efforts to transition volcano seismic networks to SeisComP3 facilitating better integration of regional and volcano networks, whilst ensuring that RVO is focused on volcanic, not regional events.
• Establishment of Standard Operating Procedures to include workflows for systematic outputs for volcanos that are monitored instrumentally (e.g. daily, weekly, monthly earthquake counts). These observations will form the key quantitative evidence to be reported to stakeholders in activity reports.
Infrasound monitoring
The principles behind infrasound and seismic monitoring are comparable, and the equipment for infrasound monitoring is often installed in parallel with seismometers (e.g. Shake’n’Boom Raspberry Shake instruments combine seismic and infrasound monitoring in a single unit). Like seismometers, infrasound monitoring of volcanoes can be accomplished with local sensors deployed in an array, which minimizes weather-dependent propagation effects and increases the source signal amplitude (Johnson and Ripepe, 2011). In addition to explosion detection, arrays can sense eruptive plume height (Capla-Auerbach et al. 2010) and provide insight into eruption dynamics (Johnson and Ripepe, 2011).
Local infrasound arrays are not featured in the majority of volcano monitoring networks, although usage has increased in the last decade (e.g. installed at Tungurahua, Ecuador, in 2006: Fee et al. 2010). An alternative option is to use networks of distant, regional sensors. The global International Monitoring System (IMS) infrasound stations routinely pick up signals from erupting volcanoes, including the 2005 eruption of Manam (Brown, 2005; Wilson and Olson, 2005). The Comprehensive Nuclear Test Ban Treaty infrasound station at Kerevat in East New Britain, plus Australian infrasound stations operated by the Australian National University and GA, are capable of detecting explosive eruptions at PNG volcanoes. GA currently has an informal alert system in place when infrasonic events are detected on the Australian network along the same azimuthal direction of PNG volcanoes. There is irresolvable ambiguity in these alerts, as events may be attributed to seismic activity that lies along the same azimuth (personal communication: D. Brown, GA), but steps could be implemented to “sanity check” the alerts against the seismic record to reduce the number of false positives Certainly, there is scope to make better use of these instruments, which provide low-tech (text-based) alerts, and may provide additional corroboration of other observed signals.
Recommendations
Medium priority
• Investigate the applicability of the existing Australian infrasound monitoring network to provide alerts for possible volcanic events. If found to be applicable, formalise this as an alert system accessible by RVO.

18
Gas and geochemical monitoring
Continuous, ground-based monitoring of volcanic gas emissions include point measurements from volcano flanks to measure diffuse degassing of CO2 through soils. This provides detailed (e.g. hourly) time-series that have been used to identify deep inputs of magmatic fluids (e.g. Boudoire et al. 2017). Challenges arise in scaling these measurements to the whole volcano and in removing environmental effects such as soil moisture, which are most prolific at tropical volcanoes (Carn, 2015).
The most commonly used instruments for monitoring gas emissions are small, low-cost, commercially available instruments that scan the volcanic plume and utilise UV correlation spectroscopy (FLYSPEC: Horton et al. 2006) or differential absorption spectroscopy (mini-DOAS: e.g. Edmonds et al. 2003) to measure SO2. These sensors require a view of the plume to collect data during daylight hours and can be installed at low-elevation sites (Moran et al. 2008). Increased use of mini-DOAS instruments at volcanoes globally has resulted from the Network for Observation of Volcanic and Atmospheric Change initiative (NOVAC: Galle et al. 2010), who recommend that instruments are deployed 5 - 10 km downwind, ideally in an array of two to four sensors to cover all wind directions. The time resolution of the technique is on the order of 10 min, providing approximately 40 emission rate measurements per day (Goma volcano, Democratic Republic of Congo: Galle et al. 2010). The NOVAC project is improving observations of global real-time SO2 emissions, and also provides a community support network for instrument operators.
Alternatively, UV cameras have been developed for use in imaging SO2 plumes (e.g. Bluth et al. 2007). Like seismometers, recent development of these sensors using Raspberry Pi technology (in this case PiCams) are yielding new, lower cost solutions to monitoring volcanic SO2 (Wilkes et al. 2017). Whilst currently not in operational use by a volcano observatory (to the author’s knowledge), these sensors may provide a suitable solution for RVO in the future, and further developments in the standardisation, provision and roll-out of this technology should be taken into consideration.
Continuous measurements of multiple gas species can be achieved using a multi-gas sensor deployed at the crater rim downwind of a volcanic plume (Auippa et al. 2007). This approach provides measurements of the abundance of multiple gas species and their mixing ratios at high temporal resolution (Carn, 2015), but its applicability at PNG volcanoes is limited by the need for regular (e.g. monthly) calibration with samples of known gas compositions (personal communication: C. Kern, VDAP).
Periodic direct measurements of volcanic gas geochemistry can be used to support continuous measurements, where emission rates are low, or where continuous installations are not possible. This involves in situ sampling of fumaroles, hot springs and streams, where samples are taken at (or close to) the point of emission, followed by laboratory assessments facilitating complete chemical and isotopic analysis (Carn, 2015). Occasional sampling in this way may comprise a basic component of long-term gas monitoring and can be used to establish a long-term geochemical baseline for non-eruptive conditions (e.g. Moran et al. 2008). Prior to the 1994 Rabaul eruption, campaign measurements at key geothermal points were made via boat across the Rabaul harbour (Johnson et al. 2010). However, like other campaign measurements, these observations are temporally coarse, require ongoing field visits (which at Rabaul, are no longer sustained), and are dangerous during periods of unrest as direct access to the volcano is required.
RVO’s capability to monitor volcanic degassing is currently limited. A continuously operating DOAS is in operation at Tavurvur within Rabaul caldera, but there are difficulties in assessing measurements from this sensor as emission rates are low, and the location is only favourable for monitoring the plume for half of the year (personal communication: C. Kern, VDAP). RVO does have a chemistry graduate on staff who is involved in NOVAC, and if additional mini-DOAS instruments were available, would be equipped to use them. Additionally, RVO is in possession of a FLYSPEC, but this is reported to be inoperable and a replacement has been requested (personal communication: VDAP). What may be most beneficial to RVO is assistance in developing a strategic plan to determine which volcanoes would be best suited to gas monitoring as/when resources become available and whether access to this instrumentation should form part of an event response cache to be deployed during periods of unrest. This should consider low-cost UV camera solutions as the technology becomes available.

19
Recommendations
Medium priority
• A strategic plan for the installation of continuously recording instruments at volcanoes where degassing rates are higher, as and when (or if) equipment becomes available, including the use of low-cost PiCam-based UV cameras.
• Ensure there is a basic capability for gas monitoring, such as an instrument available in an emergency equipment cache, to be deployed in response to other signs of unrest.
Ground deformation
Ground-based methods for measuring deformation include repeat levelling and Electronic Distance Measurement (EDM) surveys (e.g. Dzurisin, 2006); GPS campaign surveys (e.g. Nunnari and Puglisi, 1994); semipermanent GPS, which are comparable to campaign surveys but with occupation times of weeks to months rather than hours to days (Dzurisin et al. 2017); continuously operating GPS (e.g. Larson et al. 2010); continuously operating tiltmeters (Voight et al. 1998); and tide gauges.
Campaign-based geodetic surveys do not require permanent field installations and data telemetry, and therefore baseline surveys can be used to establish initial measurements which can then be repeated should future activity warrant. Although surveys of this nature are able to cover large networks (McNutt and Pallister, 2015), the logistical and personnel costs involved in travelling to volcanoes mean that it may in fact be more economical to install a single continuously recording instrument (e.g., Moran et al. 2008). Indeed, new additions to ground-based geodetic monitoring networks are now most commonly cited to be continuously recording GPS with data telemetry to the observatory, rather than the establishment of new campaign networks (e.g. networks installed in Vanuatu since 2010). The large number of volcanoes in PNG, and limited staff numbers at RVO, also make establishing wide-scale baseline surveys challenging, and satellite-based methods (see remote-sensing in Section 4) using Interferometric Synthetic Aperture Radar (InSAR) would likely be more useful for this purpose given the locations and number of volcanoes. This satellite-based approach has been used to establish baseline geodetic measurements across large volcanic provinces (e.g. Kenya: Biggs et al, 2009; Central America: Ebmeier et al. 2013; Indonesia: Chaussard and Amelung, 2012).
Continuously recording tiltmeters can provide near-real-time deformation information and are one of the few geodetic monitoring techniques that do not require significant processing or calibration (Moran et al. 2008). However, the instruments drift over time-scales of weeks to months requiring calibration, and are therefore not useful for measuring long-term deformation trends but are better suited to detecting transient deformation that occurs over periods of seconds to hours (Voight et al. 1998).
Longer-term displacements can be obtained in near-real-time from continuously recording GPS receivers. Single stations provide information about changes in ground displacements at a single point, and more information and confidence in the observations can be achieved with a network of stations, which in general are located within 5 - 10 km of the eruptive vent (Moran et al. 2008). Commonly, continuous GPS instruments are co-located with seismic stations to share data telemetry and other infrastructure. Instruments predominantly run at 15-second recording intervals with data sent once daily to the archiving center via radio, internet, or satellite (Alvarado et al. 2018), or radioed in real time (Smets et al. 2014). Most GPS studies are based upon daily coordinate solutions obtained by averaging observations over a 24-hour period (Larson et al. 2010), however temporal resolution is lost with this approach.
GA is currently experimenting with lower cost GPS solutions (e.g. Swift Navigation https://www.swiftnav.com/piksi-multi) for continuous displacement monitoring. The Trimble and Ashtech stations that make up the Rabaul GPS network are currently at the end of life and suffer from frequent outages. A possible solution is the replacement of these stations with lower cost instruments. Processing of the data would be well suited to a sustainable, open-source software, which would require provision of extra training to the staff at RVO.

20
Recommendations
Medium priority
• Consider lower cost GPS solutions as replacements for the Rabaul caldera GPS network based upon the outcomes of GA experiments. If successful, implement in conjunction with the RTKLib software and training on its usage.
• Formulate a strategy for co-locating continuous GPS with existing or new seismic stations beyond Rabaul. • Discuss with RVO the benefit of repeating campaign levelling measurements where GPS are in operation (i.e.
might not be a useful task given limited resources). • Use InSAR remote-sensing, rather than campaign surveys, to support new baseline measurements and to guide
future installations of ground-based geodetic equipment.
Web cameras
Many small-scale volcano monitoring networks (i.e. those with limited instrument numbers or types) include web cameras (e.g. networks of one to three seismic instruments plus a web camera at volcanoes throughout Vanuatu following assistance from GNS Science, New Zealand; Pacaya Volcano, Guatemala: Escobar-Wolf et al. 2015). Web cameras provide direct visual insight into activity at remote volcanoes, and typically the images are telemetered to the observatory at regular intervals (e.g. one per minute or hour) and made available for public view via an observatory website (e.g. Snedigar et al. 2006; Carn, 2015; see websites in Appendix 1 for GNS Science, New Zealand; Servicio Nacional de Geologia y Mineria, Chile; Centro Nacional de Prevención de Desastres, Mexico;; Observatorio Vulcanológico y Sismológico de Costa Rica, Costa Rica; Centre for Volcanology and Geological Hazard Mitigation, Indonesia; Servicio Nacional de Estudios Territoriales, El Salvador; Observatorio Vulcanológico del INGEMMET, Peru; Servicio Geologico Colombiano, Columbia; Instituto Nacional de Sismologia, Vulcanologia, Meteorologia e Hidrologia Guatemala; Instituto Nicaraguense de Estudios Territoriales, Nicaragua; The Vanuatu Metereorology and Geo-Hazards Department, Vanuatu - see example for Ambrym volcano in Appendix 4, Figure A4.3). This assists the observatory in demonstrating to the public that they are directly watching remote volcanoes, and even if imagery is not systematically stored, it still provides a useful indicator as to when more information or instrumentation is required.
Web camera images can be included or referred to in daily reporting (an approach used by the Alaska Volcano Observatory). The next step is implementation of systems to store and sort the images e.g. automatically removing those acquired at night or during total cloud cover, and then using the images to quantitatively track eruptive behaviour including luminescence and calculation of plume heights (Lovick et al. 2008; Harrild et al. 2016). As visual cameras are only operational during daylight, they may be paired with near-IR or TIR cameras to detect thermal anomalies during the night (e.g. Mount Etna, Italy: Coltelli et al. 2017), which may be used for detection and quantification of volcanic ash (Prata et al. 2009), and changes in shallow thermal structure (Chiodini et al. 2007).
The Darwin Volcanic Ash Advisory Centre (VAAC) has discussed the benefits of installing web cameras on cell-phone towers in PNG that are pointed at the volcanoes (personal communication: A. Bear-Crozier, Darwin VAAC). This would greatly improve the capacity of RVO to directly view remote volcanoes using a low-cost, low-power source of equipment. Installations of web cameras would need to be matched with sufficient IT infrastructure to be able to sustain an image feed and ideally to store imagery at regular intervals (e.g. hourly). A plan for use of the imagery in communication with the public via regular activity reports and an observatory website (discussed in Section 5) should also be developed.
Recommendations
High priority
• In collaboration with the Darwin VAAC, work towards the co-location of web cameras with other monitoring equipment or/and at cell-phone towers that have a clear view of volcanoes. This will likely require an

21
investigation into the suitability of RVO’s telemetry/IT infrastructure to ensure a reliable image feed, and some level of image storage, can be achieved.
• Formulate a plan for the use of web camera imagery in public outreach, to support regular activity reportson an observatory website (see Section 5).
Observers within the community
There is increasing evidence supporting the value of community-based involvement in disaster risk management, assessment and monitoring (Maskrey, 2011). Observations from lay people not only provide insight into volcanic processes in data-poor settings, but can also enhance communication, understanding and trust between scientists and the public (Stone et al. 2014). Community-based early warning systems (CBEWS) have been successfully implemented for a range of natural hazards in Indonesia, Philippines, Italy and Colombia (see references in Bowman and Henquinet, 2015). CBEWS and networks of local observers elevate local communities from being passive recipients of information generated by unknown organisations, to active contributors that are involved in gathering observations and ensuring that information is communicated between authorities and the public (Bowman and Henquinet, 2015)
The use of community observers is commonly reported by volcano observatories (e.g. Goma Volcano Observatory, Democratic Republic of Congo; Observatorio Vulcanolólogico y Sismológico de Costa Rica; Servicio Nacional de Estudios Territoriales, El Salvador). Community contributions can be made via a formal network of observers organised by the observatory, or be un-solicited. The latter requires some line of communication to be open between the general public and the volcano observatory (commonly social media or phone-lines), and for the public to have some knowledge of what to look for. In these cases, information often comes via phone calls from those upon whose land instruments are located, or from other public or municipal authorities/institutions, for example in Costa Rica reports are received from National Park personnel (as many volcanoes are located in national parks), plus reports from the public on Facebook (personal communication: R. Salvage, Observatorio Vulcanolólogico y Sismológico de Costa Rica).
The most developed, established and well documented example of community observers operating as an integral component of a volcano monitoring network are the ‘vigías’ (Spanish for watchman, guard, sentinel or lookout) of Tungurahua volcano, Ecuador. The success of this network is measured in several effective evacuations prior to eruptions since 2000 and is due to the functionality of the vigías as a source of observational data for scientists; as a communication channel for increasing community awareness, understanding and preparedness; and as an early warning system for civil protection (Stone et al. 2014). The vigías approach has now been extended to other Ecuadorian volcanoes (personal communication: VDAP).
The Tungurahua vigías network was established almost 30 years ago, developing from a requirement of the communities to have and be part of some form of early warning system to avoid permanent relocation from their homes (Stone et al. 2014). Vigías were recruited based on their position within the community, because they already had equipment on their land, or because they had good line of sight/hearing of the volcano. They were also recognised as being good communicators and enthusiastic about being part of municipal initiatives. Initial basic training was provided in what to observe, how to describe it, and how to communicate it, plus uniforms (hats), giving the vigías a sense of social identity. Rather than waiting for incoming reports, the Civil Defence authority calls the vigías at the same time every day over a VHF radio network to collect reports and to report back to the observers about the state of the volcano. This consistent communication helps to ensure a continued sense of purpose. Formally establishing communication protocols in this way is thought to have aided success of the network (Stone et al. 2014), particularly by ensuring that all participants stay on the line until all reports are collected before the observatory provides their summary of activity (personal communication: VDAP).
Clearly defining the roles, responsibilities and resources available for community observers is imperative. CBEWS networks have failed through poor planning, such as not providing batteries for megaphones, failing to clearly define who is responsible for maintaining equipment, and not installing solar-panels to charge radios where there is no electricity supply (e.g. El Salvador: Bowman and White,
22
2012). Consideration must also be given to the social impacts of enabling specific community members with technology and information.
Like other ground-based monitoring instruments, relationships with community observers require regular maintenance (Guerrero et al. 2015). Although the actual financial requirements are small, those that are required (maintenance of the radio network; uniforms) are symbolic of the value of the network, and long-term neglect of this funding represents a significant threat (Guerrero et al. 2015). In Ecuador, the vigías gather once a year for an annual luncheon with key officials to fortify the network, receive an annual scientific report on the overall trend of the volcano’s activity, and maintain collaborative ties. At Tungurahua there have been few robberies of monitoring equipment, and this is attributed by the observatory to public perception that the instruments are there for their benefit, and public knowledge that a vigías is attentive to the instrument’s well-being (Mothes et al. 2015).
Multi-tiered networks of out-post observatories and observers have also been utilised for many decades throughout Indonesia, with local out-posts bridging the gap between centralised scientists and local spokespeople. Outstation observatories have also worked successfully in PNG. Outposts at Langila, Pago (Witori), Manam, Ulawun and Karkar have, at times, had access to a seismic station and tiltmeters, with observers reporting monitoring results along with visual observations to RVO via HF radio on a daily basis. A highly competent observer at Ulawun assisted in the detection of escalating unrest and consequent evacuation prior to eruption in 2000 by communicating with RVO over radio to discuss instrumental results (Nancarrow and Johnson, 2015). However, it appears that various posts are no longer filled, and the absence of a local observer at Bagana volcano has been flagged by RVO.
Expanding and strengthening the CBEWS capacity in PNG has potential to provide multi-parametric observations of remote volcanoes to the observatory, whilst simultaneously improving community engagement and outreach. Improvements in cell phone connectivity continue to increase the scope of this type of initiative, and there are existing examples of cell phones being used for municipal projects in PNG, including as a connection to health authorities whereby members of the public can send pictures of their symptoms via SMS for diagnosis (ABC, 2018); and by the UN Development Programme and Department of Finance (DoF), which receives reports of corruption via SMS messages (UNDP PNG, 2014; Papua New Guinea Today, 2018). RVO staff are noted to have modernised their communication with existing observers, establishing a regular connection on WhatsApp (Nancarrow and Johnson, 2015). Tools such as this to improve connectivity with communities should receive continued and increased support. CBEWS networks can benefit Disaster Risk Management activities related to all types of natural hazards, including tsunamis, earthquakes, and landslides (e.g. Stone et al. 2014). Websites and cell-phone apps provide new tools for the public to provide observations of natural hazards to scientists quickly and in a standardised format. Two such examples of this “citizen-science” are the USGS “Did You Feel It” website (https://earthquake.usgs.gov/data/dyfi/ ) and the British Geological Survey app “myVolcano” (https://itunes.apple.com/au/app/myvolcano/id774648897?mt=8 ). The applicability of such a service specifically for natural hazards in PNG should be explored.
Recommendations
High priority
• Create a functioning CBEWS network by: educating RVO about successful networks elsewhere; assisting RVO to identify a new observer at Bagana and individuals or institutions suited to the role at other key volcanoes where no observers exist; identify how other members of the public can best relay information to RVO including the suitability of “citizen-science” apps.
4. Remote-sensing monitoring techniques Satellite-based remote-sensing is suited to volcano monitoring on regional-scales (100s km), simultaneously targeting multiple volcanoes whilst avoiding the costs of man-power in the field, equipment theft, and any risks to personnel or equipment due to hazardous eruptions or locations. Remote-sensing products are increasingly being used in multi-parametric assessments of volcanic

23
activity, and a range of satellite sensors have repeatedly demonstrated their ability to monitor volcanic unrest, detect eruption onsets, and track eruptive hazards (Poland, 2015). At remote or unmonitored volcanoes with no permanent ground-based instruments, satellite-based data provides the best means of bridging the volcano-monitoring gap (Loughlin et al. 2015), and of making systematic observations of eruption precursors (e.g. Biggs et al. 2009).
Satellite-based observations include SO2, thermal and ash emissions, plus structural or topographic changes during eruptions, deposition of eruptive products, and ground deformation. Broadly speaking there are three types of satellite remote-sensing data: high temporal resolution imagery (minutes, hours) intended for meteorological applications; lower temporal resolution imagery (days, weeks) for terrestrial applications; and derived products available as jpegs or similar available from online services (Moran et al. 2008).
Challenges in the use of remote-sensing for volcano monitoring
Remote-sensing is not yet a globally operational tool for volcano monitoring (Poland, 2015), and observatories that have the most limited ground-based equipment and who may therefore benefit most from remote-sensing, are also those least likely to have the resources necessary to access, process and apply satellite datasets in volcano monitoring operations. For many observatories, derived products are the only way in which remote-sensing information can be accessed independently, with access to and utilisation of other remote-sensing data achieved via partnerships with other organisations, consortiums or research institutions (e.g. Pritchard et al. 2018).
Barriers to the uptake of remote-sensing data include the cost of imagery, difficulties in storing and using large data volumes, the latency between image acquisition and delivery to the user, a lack of technical training, complexities in processing the data, ambiguities in data interpretation, and difficulties in accessing large data-files over poor internet connections. Internet access is a fundamental challenge in the use of remote-sensing data, and improved, reliable access to the internet would significantly increase the capacity of many observatories, including RVO, to access and utilise remote-sensing (Loughlin et al. 2015).
Because of these challenges, few volcano observatories currently have in-house capability to independently and routinely use meteorological and terrestrial satellite products in day-to-day operations. However, the accessibility of these data is improving, and international initiatives to develop and distribute downstream data products do provide ready access to some remotely-sensed information. The costs of remote-sensing data have also decreased, with some new satellites providing data at no cost (e.g. the European Space Agency Sentinel satellites) and satellite operators increasing their participation in the International Charter for Space and Major Disasters, which may come into effect during eruptive crises to provide free and more frequent satellite acquisitions for several weeks. Similarly, platforms for free and open source software for image processing and map-making have been launched (Brown et al. 2015), but whilst these attempts to set up satellite-based monitoring have developed promising software, many are no longer maintained (Pritchard et al. 2018).
Current use of remote-sensing by the Rabaul Volcano Observatory
The VAAC’s current use of remote-sensing imagery overlaps with a volcano observatory’s need for remote-sensing data to detect ash, SO2 and thermal emissions. RVO’s current use of remote-sensing information is therefore predominantly via the Darwin VAAC, and most eruption alerts for PNG volcanoes (as recorded by the Smithsonian Global Volcanism Program) are issued based upon remote-sensing observations of the Darwin VAAC. Due to the high temporal resolution of imagery, data from geostationary meteorological satellites often provides the first indication of unrest or eruptive activity (Poland, 2015). For example, during the 5 January 2018 eruption of Kadovar Island the Darwin VAAC reported that “Himawari-8 imagery subsequently showed that the eruption began around 0220 UTC” (Global Volcanism Program, 2018).
The Darwin VAAC shares composite images and GIFs derived from satellite data with RVO and other relevant users over WhatsApp (personal communication. A. Bear-Crozier, Darwin VAAC). This facilitates an informal line of communication between scientists and is

24
and effective way of sharing information in real time (personal communication: S. Saunders, RVO). Whilst this interaction with the Darwin VAAC will continue, there are additional ways in which RVO can gain better access to remote-sensing information, and better incorporate satellite products into operational monitoring procedures in a systematic way.
Gas emissions
Remotely-sensed measurements of volcanic gas emissions involve detection of SO2, which exists in the atmosphere at low ambient levels, and exhibits a distinctive absorption signature in the UV and IR (Carn, 2015). UV sensors of atmospheric SO2 include: the Ozone Monitoring Instrument (OMI) on NASA’s Aura satellite, the Global Ozone Monitoring Experiment 2 (GOME-2) on MetOp-A/B, and the Ozone Mapping and Profiler Suite (OMPS) aboard Suomi-NPP. IR sensors capable of measuring volcanic SO2 include multispectral instruments (e.g., MODIS, ASTER, SEVIRI, HIRS, and VIIRS) and hyperspectral sounders (e.g., AIRS, IASI, and CrIS). Thus, there is a multitude of satellite sensors capable of providing insights into volcanic SO2 emissions, and fortunately these can be navigated by an observatory through a series of online platforms that provide derived SO2 measurements (for links and examples see Appendix 5, Figure A5.1-5.3). These include: OMI and OMPS images via NASA’s Global Sulfur Dioxide Monitoring Service, which RVO have been accessing since 2017 (personal communication: S. Saunders, RVO); NOAA National Environmental Satellite, Data and Information Service, which provides OMI SO2 column 5 km 24 hour composite images downloadable as jpeg/GeoTiff/NetCDF; and Support to Aviation Control Service (SACS: Brenot et al. 2014), which provides access to OMI, OMPS, GOME-2, IASI and AIRS, with an automated email service alerting alert users of any exceptional SO2 emissions in the region. RVO have been directed to this service by the Darwin VAAC (personal communication: A. Bear-Crozier, Darwin VAAC).
Satellite platforms available for SO2 remote-sensing are advancing, most recently with the 2017 launch of UV visible spectrometer TROP-OMI (Sentinel-5) by the European Space Agency. This sensor has a higher spatial resolution than OMI (3.5 x 7 km pixels instead of 12 x 24 km) and is therefore more sensitive to lower gas concentrations. Currently there is development of an operational tool using these data, which will be incorporated into the SACS platform.
Synoptic studies of PNG volcanoes using satellite remote-sensing show that volcanic degassing is persistent across the region. Between 2005 - 2008, OMI observations revealed that in any given month, at least one volcano and generally two or three were emitting detectable levels of SO2 (McCormick et al. 2012). These derived satellite measurements, available via online services, may therefore be relevant for detecting unrest (e.g. the onset of degassing or increasing in flux), and for characterising baseline behaviour. The challenge for RVO is to establish Standard Operating Procedures to use these data sets most effectively, for example tasking a staff member to access these resources on a systematic basis and use the observations quantitatively to create time-series of emissions.
Recommendations
High priority
• Work with the Darwin VAAC to support RVO’s use of existing online platforms that provide access to remote-sensing of volcanic gas emissions.
• Establish Standard Operating Procedures to ensure RVO are able to access and use these sources of information systematically (e.g. check on a daily basis for all volcanoes) or identify whether steps need to be taken to improve the accessibility of these data products.
• Assist RVO to archive this information to form time-series and potentially identify baseline gas emissions. • Assist RVO to incorporate this information into volcano activity reporting where appropriate. • Establish Standard Operating Procedures for what to do once an anomaly has been detected.
25
Thermal emissions
Volcano thermal emissions are tracked by multiple satellite systems using the shortwave IR, mid-IR and TIR regions of the electromagnetic spectrum. Many of these sensors acquire images multiple times per day of the same area on the ground, and near-real-time automated analysis of thermal data has become an important alerting tool for eruption onsets that is now applied at volcanoes around the world (Poland, 2015).
Web services providing volcano-specific hot-spot detection alerts utilise the Moderate Resolution Imaging Spectroradiometer (MODIS) sensor mounted on NASA’s Terra and Aqua satellites. Although the spatial resolution of MODIS is larger than many volcanic features (1 km x 1 km), the sensitivity of multispectral sensors is high, and thermal features an order of magnitude smaller than this resolution can be detected (e.g. Francis et al. 1996). The MODIS Volcano Thermal Alert System (MODVOLC: Wright et al., 2004; see Appendix 5, Figure A5.4 5.5, for link and example) provides near-real-time monitoring, analysing every MODIS image and using multispectral thresholds to identify pixels above thresholds indicative of hot-spots. Alerts are provided via email approximately 12 – 18 hours after image acquisition. Since 2017, RVO has accessed a similar platform, the Middle InfraRed Observation of Volcanic Activity (MIROVA: Coppola et al., 2016 see Appendix 5, Figure A5.5, for link and example) service (personal communication: S. Saunders, RVO), although it is not clear in what capacity. MIROVA provides information within 1 to 4 hours from the satellite overpass, including time-series of thermal emissions as radiative power. Synoptic studies of volcano thermal emissions measured by MODIS between 2000 – 2014 rank Bagana and Manam in the 30% highest-energy emitting volcanoes in the world (Wright et al. 2015), thus satellite thermal imagery provides a useful tool for measuring fluctuations in activity at these persistently active volcanoes.
MODVOLC and MIROVA are tailored for volcano applications and deemed to be reliable and well-tested by the volcanological community for this purpose. Other hotspot detection services utilising other sensors also exist, principally for bushfire detection (e.g. Geoscience Australia Sentinels Hotspots https://sentinel.ga.gov.au) and may also make use of the higher temporal resolution of the Himawari-8 imagery. Should these services be found to be suitable for volcano monitoring operations by other observatories, they could also be added to the tools available for thermal monitoring by RVO.
Recommendations
High priority
• Work with the Darwin VAAC to support RVO’s use of existing online platforms that provide access to remote-sensing of volcanic thermal emissions.
• Establish Standard Operating Procedures to ensure RVO is able to access and use these sources of information systematically (e.g. check on a daily basis for all volcanoes) or identify whether steps need to be taken to improve the accessibility of these data.
• Assist RVO to archive the information to form time-series and potentially identify baseline thermal emissions. • Assist RVO to incorporate the information into volcano activity reporting where appropriate. • Establish Standard Operating Procedures for what to do once an anomaly has been detected.
Synthetic Aperture Radar and Interferometric Synthetic Aperture Radar
Satellite radar data plays a dual purpose in volcano monitoring. Firstly, the amplitude of Synthetic Aperture Radar (SAR) images provides information about surface changes. On time-scales of days to weeks during eruptions, SAR amplitude can be used to track the emplacement of eruptive products (effusive: lava; explosive: ash, pyroclastic flows, and lahars: Pritchard et al. 2018), and track the shape of volcanic structures (detecting growth/destruction of new vents/craters or domes: e.g. Merapi, Pallister et al. 2013), including large magnitude (metre-scale) topographic changes (Ebmeier et al. 2018).

26
Secondly, phase comparisons between repeat acquisitions of SAR imagery (known as InSAR – Interferometric SAR) can be used to produce images of ground displacement at high spatial resolution (~10m). By 1997, ground-based geodetic methods had observed ground deformation at 44 volcanoes, but by 2010 the use of InSAR for regional and volcanic province wide deformation surveys had increased this number to 110 and by 2014, to 210 (Biggs et al. 2014). Unlike ground-based methods, InSAR facilitates assessment of the broader deformation field, and may better identify deformation sources offset from the edifice, plus evidence of gravitational instabilities on volcano flanks (e.g. Ebmeier et al. 2010). This is significant considering evidence of volcanic collapse in multiple PNG volcanoes, with offshore debris avalanches detected at 11 volcanoes (Silver et al. 2009).
Assessments of the use of SAR/InSAR data in volcano monitoring are based upon the past two decades, during which satellite radar data was difficult and/or expensive to access, and coverage was sporadic or incomplete (Pritchard et al. 2018). Past assessments of the applicability to PNG volcanoes have emphasised that the suitability of InSAR for regional monitoring is dependent upon the availability and affordability of data (Romeyn and Garthwaite, 2012). These factors, plus the latency between image acquisition and delivery to the user, and large orbital repeat times of more than 1 month have, until recently, limited the use of SAR/InSAR for near-real-time applications. Consequently, the vast majority of applications of InSAR data to volcanoes have been retrospective studies of eruptions/unrest, or investigations into long-term (multi-year) trends. These retrospective, multi-year studies provide the only baseline monitoring information (geodetic or otherwise) at many volcanoes worldwide (e.g. Biggs et al. 2009).
Since 2007, commercial SAR satellites have operated with shorter orbital repeat times (now on the order of a few days), but imagery is often expensive (US$100s - 1000s per scene), and volcanoes are not necessarily included in the acquisition plan so satellites must be ‘tasked’ (at additional cost) in advance to collect data over a given region. Tasking for volcano monitoring has been achieved through research institutions, multi-institution consortiums, or via activation of the International Charter for Space and Major Disasters for Earth observation data during eruptions. Since 2014 the cost, frequency, accessibility and coverage of SAR data has been revolutionised by the European Space Agency Sentinel-1 satellite constellation. Sentinel-1 provides SAR coverage of PNG volcanoes on a 12-day basis. Whilst the data is available freely online, higher level processing is required for it to be useful in volcano monitoring.
Like other remote-sensing datasets, the role that InSAR and SAR play in volcano monitoring operations varies (Ebmeier et al., 2018). In general, low and middle-income countries do not have the capacity to process and analyse InSAR data in-house, and in almost all instances, SAR/InSAR has been integrated into volcano monitoring through collaborative networks of international researchers such as the Committee on Earth Observation Satellites (CEOS) Volcano Pilot project (Pritchard et al. 2018). Researchers/scientists from partner institutions purchase, task or access the satellite imagery, carry out analysis of the data and communicate/deliver results to observatories, with observatories requesting observations at volcanoes that they deem to be restless (Pritchard et al. 2018). Observatories then receive the information as jpg (image format) or kmz (Google Earth) files, showing either time-series products calculated over weeks or months, or rapidly produced images for hazard assessments, plus written interpretations (Pritchard et al. 2018).
Although SAR/InSAR Sentinel-1 satellite data is now available globally free of charge, and open-access processing packages exist, it is unlikely that the majority of volcano observatories will establish in-house capacity for SAR/InSAR data processing and analysis in the near future. When training in InSAR data processing and interpretation has taken place, observatories have found it to be beneficial, but this has not resulted in the development of an in-house capability (Pritchard et al. 2018; personal communication: M. Garthwaite, GA). Applying InSAR data at volcanoes is challenging: steep slopes, glaciated peaks and vegetation all cause loss of signal (incoherence), and topographically correlated atmospheric effects mask or lead to false interpretations of ground deformation (Parker et al. 2014, 2015). Based upon experiences at volcano observatories in Latin America, Pritchard et al. (2018) found that often the staff members that participate in training are not necessarily in permanent contracts, and that even after training, observatories want access to second opinions on data that they interpret. Consequently, higher levels of training are required.
Unlike other types of remote-sensing monitoring data, alert systems for automated deformation detection from InSAR, or derived deformation products, are not in regular operation. Platforms are being developed for automated processing of Sentinel-1 InSAR data at

27
volcanoes globally (González et al. 2016), however, existing examples from PNG volcanoes highlight the difficulties in applying automated algorithms in the context of PNG (personal communication: J. Biggs, University of Bristol), where volcanoes are heavily vegetated and many are located on small islands a few km wide. It is therefore anticipated that the use of interferograms from an automated service will, at least for the foreseeable future, still require some degree of expert interpretation to avoid mis-information.
GA currently provides InSAR and SAR images to RVO on an ad hoc basis. Through basic training, RVO staff has an awareness of the data and its capability, but unless connections with other research institutions are established, it is unlikely that RVO will be able to access these data independently in the near future. Incorporating SAR/InSAR into monitoring is therefore likely to continue to rely upon GA or other organisations for the foreseeable future. An immediate and attainable goal for using InSAR at PNG volcanoes is a systematic baseline ground-deformation survey at all volcanoes. Whilst InSAR has been applied to assess ground displacements at Rabaul (Hutchinson and Dawson, 2009; Romeyn and Garthwaite, 2012; Ronchin et al. 2017; Garthwaite et al. in prep), it is not clear whether (or which) other PNG volcanoes may exhibit measurable ground deformation as a detectable precursor to eruption. Using the available SAR data archive for a complete initial assessment across the documented PNG volcano catalogue will highlight which volcanoes are suited for future on-going InSAR monitoring and will also be informative in optimising the placement of ground-based geodetic instruments. Preliminary work towards a baseline national-scale InSAR survey has been completed as part of this report, and the results can be viewed in Appendix 6.
Recommendations
High priority
• Ensure that RVO understand that the capacity for in-house InSAR/SAR analysis may not be realistic in the short to medium term and that access to and use of SAR/InSAR data is likely to rely upon GA and other external organisations. RVO can be assisted in gaining greater visibility within the volcanological community to stimulate interest in this topic.
• Systematic survey of PNG volcanoes using archived and ongoing InSAR datasets to guide future ground-based geodetic and InSAR surveys.
• Assist RVO during eruptions by activating the International Charter for Space and Major Disasters and providing analysis of InSAR and SAR products.
• Assist RVO to ensure they benefit from, and have a voice in, global initiatives in improving the accessibility of SAR/InSAR data.
Optical data
Visual observations from optical sensors can be used to identify eruptive plumes, and to identify deposits and structural changes during eruptions. However, SAR is widely thought of as superior to the latter due to operability in all weathers and all times of day, plus its dual purpose in detecting both surface changes and ground deformation (Meyer et al. 2015). Optical data is consequently not commonly cited as an operational tool used by volcano observatories, but has been applied in a secondary role, as easy-to-comprehend “map bases” upon which observations from radar images are compiled (e.g. Pallister et al. 2018). Optical data has also been used to map products from historical eruptions to aid in re-constructing eruptive histories (e.g. Francis et al. 1996). Understanding past volcano behavior in this way is beneficial for understanding the potential impacts of future eruptions.
Operational tools using optical imagery to map vegetation vigour have also been prototyped. The “VEGAN” tool in the European Space Agency Geohazards Exploitation Platform (https://geohazards-tep.eo.esa.int/#!pages/informationProcessing) uses the European Space Agency Sentinel-2 satellite to assess the health of plant life and agriculture following eruptions. As gas emissions can also result in vegetation death, there is potential to apply such tools to detect unrest or precursors to eruptions.
28
Recommendations
Low priority
• Optical imagery is currently unlikely to be applied in any context at PNG volcanoes unless by an external research consortium. However, optical imagery would be beneficial for mapping historical eruptive products, which can be used as inputs to hazard maps.
• Derived-products from optical satellites to map the effects of volcanic emissions upon vegetation vigour may become available, and it should be ensured that if/when this occurs, RVO has access to the observations.
5. Other components of an effective monitoring system Monitoring data that is collected but not used, interpreted, or turned into accessible information, is of limited value. Therefore, of equal importance to the acquisition of monitoring data is the way in which it is managed by an observatory. This encompasses: observatory information management systems; access to auxiliary information necessary to make hazard maps and assessments; and the observatory’s capability to apply workflows to monitoring data, translating measurements into information that can be communicated to government authorities, the public, the media and the volcanological community. These activities may all be supported by access to training, plus better inclusion and interaction of the observatory within regional and international volcanological networks.
Even with the limited instrumental monitoring infrastructure currently available at PNG volcanoes, there are significant improvements that can be implemented to use existing monitoring data more effectively, improving the way in which it is turned into activity reports or alerts and then communicated to necessary audiences. Establishing clear, sustainable and strong communication practices is a low-cost activity that can bolster the long-term core capability of a volcano observatory, and which can be called upon during periods of unrest.
During the 1983-85 crisis period at Rabaul caldera, a Public Information Unit was established to provide clear and established links with the media. This assisted greatly in the dissemination of volcano-related information, and in confronting growing public distrust that developed when a lack of communication led to fears that important information was being withheld (McKee et al. 2017). It is far easier to establish these communication protocols and networks during non-eruptive times, and far easier to re-activate established communication mechanisms during eruptions, than start from scratch (personal communication: VDAP).
Effective communication can help to justify the existence of the observatory to the public and government, who otherwise may not be aware of the observatory’s activities, only hearing about and from scientists during times of crises such as forced evacuations. Shifting this relationship to one where scientific information builds trust (e.g. Tungarhua, Ecuador: Stone et al. 2014), and the public is familiar with the presence of the volcano observatory (e.g. Mothes et al. 2015) would be beneficial in PNG.
Communication and information sharing is ever easier to achieve with the expansion of cell-phone technology. Consequently, public awareness and outreach activities no longer need solely rely upon sporadic visits by observatory staff, sometimes years apart. Dissemination channels for volcano observatories include observatory websites, SMS (see example of SMS alert for ashfall by the Observatorio Vulcanológico INGEMMET, Peru, in Appendix 3, Figure A3.5), email, phone lines, radio, Skype, WhatsApp, citizen-science websites and applications (described in Section 3) and social channels such as Facebook and Twitter (see examples in Appendix 7). Utilising these low-cost technologies is crucial to reach a larger segment of the population (Alvarado et al. 2018). Although the costs of telecommunications in PNG remain high, with frequent outages, and intermittent connections in island and western provinces (Lawrence, 2017), access has improved significantly since economic deregulation and the 2008 rollout of Digicell's network, which connected millions of PNG citizens to the internet (Lawrence, 2017; Watson, 2017). Overall accessibility is reported to have expanded from less than 3% population coverage in 2006 to over 80% by early 2016 (Oxford Business Group, 2016).

29
Information management
Volcano observatories require rapid and reliable methods to collate, analyse, and interpret multi-parametric monitoring data (McNutt and Pallister, 2015). This begins with storage of data in well-formatted databases from which the observatory then has the ability to easily retrieve, visualise and interpret different data-streams (Miller and Jolly, 2014). Open source databases, such as WOVOdat, provide specific data structures for storing volcano-monitoring data, and an offline, tailored version of this software is reported to have been implemented at RVO (Venezky and Newhall, 2007; Newhall et al. 2017).
Once data-base structures are established, being able to visualize time-series of gas emissions, ground deformation and seismic event counts on common time axes is a fundamental tool for identifying correlations between different datasets (Miller and Jolly, 2014), and gauging levels of baseline activity at volcanoes. VDAP have developed the “VALVE” software specifically for this purpose, and which is configured to each observatory’s databases and data ingestion types. Another available platform is the gempa software “VORTEX” (https://www.gempa.de/products/vortex/), which is based on SeisComP3 with added capability to handle multiple data types including web camera feeds. Further to VALVE, VDAP have developed a “Dashboard” system (comparable to the Alaska Volcano Observatory’s “Log Post” system), to act as a gateway to all information related to a volcano including monitoring streams, publications, information stored in the Smithsonian Global Volcanism Program, and any publicly reported information including social media tags.
Implementation of these two types of information management services may be beneficial goals for RVO. Current information management practices should be reviewed, with an assessment of whether they are optimized for (or even capable of) including results from online remote-sensing services, and how new data-streams (such as from web cameras) may be sustainably ingested.
Recommendations
High priority
• Assess RVO’s existing information management protocols and infrastructure to determine whether these are capable of ingesting information from remote-sensing and new data-streams such as web cameras, or identify what additional capability is required.
• Assess the benefit to RVO in implementing a more sophisticated information management system similar to VALVE or VORTEX, and Dashboard, to view multiple data-streams on common axes, collate different information sources for each volcano, and provide outputs that could feed into an observatory website in the future.
Website and social media
It is now routine practice for observatories to have a website (see list in Appendix 1 and examples in Appendix 4). For the >30 observatories listed by the World Organisation of Volcano Observatories, only RVO, the Solomon Islands, the Goma Volcano Observatory, Democratic Republic of Congo, and the Antenne de Recherches Géophysiques et Volcanologiques, Cameroun, were found not to have a website. Assisting RVO to establish an observatory website to improve dissemination of information and improve visibility within the national and international community is a concept that has received strong support from both the Darwin VAAC and VDAP.
Observatory websites provide the public with a point of contact to the observatory and basic information such as the names and locations of volcanoes accompanied by an alert level if such a system exists. Additionally, a website may include links to recent activity reports or bulletins, links to social media platforms, information about different types of volcanic hazards, and access to hazard maps. It is also common for observatories to run analysis tasks automatically and post the results and/or near-real-time streams of monitoring data such as web cameras, GPS and seismometers on webpages (Loughlin et al. 2015; McNutt and Pallister, 2015).
The Vanuatu Meteorology & Geo-Hazards Department runs a simple, concise and informative website, and is an example that would be appropriate for RVO to follow (see Appendix 4, Figures A4.1-4.3). The Vanuatu website (http://www.vmgd.gov.vu/vmgd/index.php/geohazards/volcano) provides information about the location of Vanuatu volcanoes,

30
monitoring data-streams (web camera feeds and seismic drum-plots), current alert status, basic hazard maps and key messages that provide instructions for what to do during and after different volcanic hazards. The website was constructed under training provided by JICA, which ran for 21 days using the software “Joomla” (https://www.joomla.org/).
Social media also plays an increasing role in informing and updating the public about volcanic unrest (Brown et al. 2015). Multiple observatories report of their presence on and use of Facebook and Twitter to collect eyewitness observations, photographs and videos, and to disseminate updates about volcanic activity (see examples in Appendix 7). In many cases information is uploaded to social media before it is added to the official observatory website (e.g. personal communication: R. Weber, GA, describing Indonesia; C. Muller, Observatorio Vulcanológico y Sismológico de Costa Rica, describing Costa Rica). Management of the official observatory website and social media accounts forms part of the observatory duties e.g. in Costa Rica a specific member of staff is responsible for distributing information on Facebook. Whilst RVO has a Facebook page (https://www.facebook.com/Rabaul-Volcano-Observatory-296332617213276/), it is currently not in use.
Recommendations
High priority
• Assist RVO to establish a basic website similar to that for Vanuatu Meteorology and Geo-Hazards Department (http://www.vmgd.gov.vu/vmgd/index.php/geohazards/volcano) to act as a source of public information about PNG volcanoes. This should encompass PNG earthquakes and expand to include PMGO. It would be possible to begin with a static website containing information about PNG volcanoes and actions to take during an eruption (i.e. outreach material), which can then be developed to include regular updates and alerts as capability increases.
• Assist RVO to develop a simple strategy for regular and consistent communication via social media that fits with their current operating procedures (e.g. share weekly summaries of seismic activity).
Volcano activity reports and alert levels
Each volcano observatory follows unique protocols for collating and disseminating information about volcanic activity levels in the form of formal reports or bulletins at regular or semi-regular intervals (see examples in Appendix 3). A common feature of these activity reports (which are also frequently included on observatory websites) are Volcano Alert Levels (VALs). VALs are used by volcano observatories to quickly and simply inform local populations and government of the level of volcanic unrest using a simple colour, letter or number code system (e.g. Winson et al., 2014; Loughlin et al. 2015; Brown et al. 2015).
One of the first VAL systems globally was developed by RVO in response to unrest at Rabaul in the early 1980’s (RVO Volcano Information Bulletin no.2, 1983; UNDRO United Nations, Office of the Disaster Relief Coordinator, 1985; Winson et al. 2014). More recent evidence can be found for a detailed alert system tailored to Rabaul and relating to changes in specific observables (Johnson et al. 2010). Volcanic alerts recorded in the Smithsonian Global Volcanism Program database suggest that a system of alert levels is in place at other PNG volcanoes (e.g. Manam May 2017 – “RVO recommended that the Alert Level be lowered to Stage 1”: Global Volcanism Program, 2017). However, the significance of RVO’s alert levels is not explained and the alerts are not used consistently, being absent from more recently received reports of eruptive activity (e.g. Kadovar eruption January 2018). There is therefore a clear need to revisit and clarify the VAL system currently used by RVO and the role of VALs in activity reports.
Some debate has arisen over the role of VALs, including concerns that their use implies that volcano observatories have predictive capabilities, and that responsibility may be placed upon volcanologists for decisions that go beyond scientific expertise (e.g. Papale, 2017). However, VALs remain a clear and almost universally used method of communicating changes in volcanic activity (although tailored to each observatory). Whereas some observatories assign specific observables, interpretations and actions to each VAL level, a simpler system would be recommended to RVO to avoid misinformation and misinterpretation. This has been recognised elsewhere,

31
and assistance given to other countries to improve volcano monitoring has included creating more realistic, simpler and appropriate versions of VALs reflecting the available data (e.g. The Vanuatu Meteorology and Geo-Hazards Department, 2016: see Appendix 4, Figure A4.2). This VAL system is then used consistently on all communications, bulletins, websites and when producing hazard maps.
Many volcano observatories produce weekly activity reports (e.g. Pritchard et al. 2018) based upon activity during the previous week. Reports can be less frequent (e.g. monthly or bi-monthly) at inactive volcanoes, or where weekly updates are not possible (e.g. Vanuatu produces reports on a monthly basis: The Vanuatu Meteorology and Geo-Hazards Department, 2016), and more frequent (e.g. daily) during periods of unrest. These documents are then sent via email to stakeholders, in some cases subscribers (e.g. Alaska Volcano Observatory offers a sign-up to email notifications) and are posted on the observatory website and/or social media pages (see examples in Appendix 3, Figures A3.1-3.3).
Activity reports do not necessarily need to be lengthy or detailed, but generally follow a consistent structure providing clear details of the current activity level (using a VAL), whether this has changed since the last report, and any observations that have been made, including how they were made (e.g. whether SO2 was detected via ground or satellite-based instruments) (see examples in Appendix 3). Reporting information in this systematic way improves accountability of the observatory, ensures that monitoring data-streams are used as input to information that is consistently received by the public, and also assists observatories in collating information required for other systematic bulletins such as the Volcano Observatory Notification to Aviation (VONA) (see example in Appendix 3, Figure A3.4).
Recommendations
High priority
• Assist RVO in producing a transparent system of Volcano Alert Levels (VALs) for all PNG volcanoes to be used consistently in all communications and which is supported by the current level of access to monitoring data.
• Help RVO to build volcano alerts and activity reports into Standard Operating Procedures. Create an activity report template and run a workshop in how to populate this with information. Assist RVO to draw up a realistic schedule on which these reports should be produced.
• Assist RVO to draw up a more complete list of stakeholders to send activity reports to, including leaders of province/communities at each volcano, NGOs, aid contributors and news outlets. Where appropriate, encourage RVO to seek feedback from these stakeholders on which information they require.
Hazard maps and eruption forecasts
Hazard maps and eruption forecasts are two principal tools used to translate volcanological knowledge into actionable information that can be used by civil protection and disaster risk management authorities. Both are dependent upon some knowledge of the past behavior of the volcano derived from geological analysis and mapping of eruptive deposits, with additional constraints gleaned from analogous volcanoes worldwide (Loughlin et al. 2015; Pallister and McNutt, 2015). To produce probabilistic eruption forecasts, these inputs are combined with knowledge of baseline or background activity levels to produce event trees that allow scientists to anticipate and assign probabilities to the full spectrum of possible outcomes (e.g. Newhall and Pallister, 2015). In an ideal scenario, event trees are pre-populated prior to unrest, and provide a way of ensuring that all scientists have the same conceptual model for the way the volcano works and perceive changes in different types of eruption precursors in a consistent manner (personal communication: H. Wright, VDAP). However, for RVO it may be more likely that this type of assessment would take place during a crisis with the assistance of VDAP or other expert users.
In contrast, RVO has already identified realistic ways in which they can improve hazard mapping during a VDAP East Asia-Pacific workshop on volcanic hazard assessments in 2016. RVO’s suggestions include: inventorying current hazards maps; producing a standardized template for future hazards maps; and testing that template by asking users for feedback (RVO’s comments provided by H. Wright, VDAP).

32
One way in which GA can assist RVO towards this goal of hazard mapping is through improved access to auxiliary datasets, including population density maps/databases, and detailed topographic information. Population density information is necessary to prioritise instrumental deployments, make volcano ‘threat’ assessments (e.g. Ewert et al. 2005), inform exposure to hazard and assess the potential impacts of eruptions upon human livelihoods.
Digital surface models (DSMs) are required to produce hazard maps, as topography is a major control upon the dispersion of eruptive products. DSMs are also critical for accurate applications of InSAR data for geodetic monitoring. Evidence for flank instabilities/collapse at PNG volcanoes and eruptions at island volcanoes raises concerns about tsunami generation, and DSMs are required to make basic judgements about tsunami inundation extents. In addition to 30 m DSMs available from the Shuttle Radar Topography Mission (Farr et al. 2000) and ALOS World 3D (Takaku and Tadono, 2017), a 5 m resolution DSM was produced by the Australian Government Department of Defence in 2012, albeit without complete coverage of PNG territory. Access to this product would provide RVO with more up-to-date and accurate topographic information where there is coverage that has a spatial resolution five times better than that of other DSM products and which better represents recent eruptive products deposited up to 2012.
Recommendation
High priority
• Provide RVO with access to 5 m DSM as a basis for producing hazard maps. • Determine if there is any way in which RVO may be assisted in accessing population density information if it has
been acquired or estimated by other parties or NGOs. Medium priority
• Provide support to RVO in producing simple hazard maps.
Personnel and training
RVO staff have received support from GA and other international organisations to attend international meetings and workshops. Attendance at these events promotes connections to the wider volcanological community, and efforts should be made to ensure that less senior members of staff have the opportunity to represent RVO at meetings to ensure continuity between generations of staff. Ongoing attendance at specific workshops related to equipment user communities (e.g. the NOVAC) should be encouraged.
Staff have previously received training in the use and maintenance of the equipment currently operated by RVO. Future training activities may be directed to downstream use of these data sources. This could include: a workshop to revisit and improve upon Standard Operating Procedures for different datasets to ensure that necessary workflows are in place to produce standard information outputs; a workshop in how to use this information in volcano activity reports including designing a standard report template; a workshop to develop an appropriate Volcano Alert Level system to be used consistently in all observatory communications; a communication workshop to help RVO establish a consistent, achievable communication framework (e.g. frequency of posts, lists of who information should be sent to, and guidance on what information should be included for different audiences); and training in the maintenance of an observatory website and social media channels.
One aspect of running volcano observatories that is often underestimated is ensuring that there are sufficient personnel to develop and maintain monitoring expertise (Jolly, 2015). RVO has experienced difficulties in attracting and keeping staff, in part because those with technical skills seek employment in industries with more lucrative remuneration packages. RVO could explore the possibility of employing a non-scientific staff member to contribute to information management, communication and information requests, thereby helping those specialist staff at the observatory to focus on fulfilling the basic monitoring capacity required to operate effectively.
33
Recommendations
High priority
• Continue to support attendance of RVO staff to international meetings, emphasising the importance of allowing less senior members of staff to participate.
• Direct training towards downstream data usage, ranging from establishing/revisiting standard operating procedures to establishing an effective framework for communication.
• Consider the benefit of having non-technical staff members assist with information management, communication and information requests, and free-up technical staff to focus on monitoring activities.
Collaboration with the volcanological community
Regional observatory networks
Collaborative regional networks for volcano monitoring can be an efficient way to build capacity and make use of leveraged resources (Loughlin et al. 2015). The largest such network is The Latin American Association of Volcanology (ALVO), representing 11 Latin American countries. This association was established to enhance communication amongst all types of experts (from seismologists to field engineers and technicians) and has increased the independence of the region in managing volcanological hazards, including across country borders (Granados et al, 2015).
The Melanesian Volcanological Network, consisting of PNG, Solomon Island and Vanuatu, was first proposed at a meeting of country representatives hosted by SOPAC (the Pacific Island Applied Geoscience Commission) in 2007 with the aim of supporting capacity development for volcanological monitoring, and sharing information and equipment during times of volcanological activity (Bonte and Holland, 2008). Some evidence of sharing equipment for volcano monitoring has been reported to occur within this network: Vanuatu provided equipment to the Solomon Islands during the 2017 eruption of Tinakula volcano, and RVO assisted Vanuatu with mobile seismic monitoring equipment and community awareness activities for a 3-week period in 2010 (UN Sasakawa Award nomination, 2015). Since this time there is little evidence that the Melanesian Volcanological Network is still operating or has worked well in the past (personal communication: B. Scott, GNS Science, New Zealand). However, with recent improvements (post-2010) in the capacity of Vanuatu to monitor volcanoes (e.g. Todman et al. 2010), there may now be some benefit in revisiting the potential of the Melanesian Volcano Network to support RVO. A useful starting point may be via a Whatsapp group between the observatories (and GA and GNS Science, New Zealand), which is shown to be an effective mode of communication at volcano observatories (although it should be noted that such communication may already be in place). Other similar regional networks e.g. the Oceania Regional Seismic Network (ORSNET) are functioning successfully (The Vanuatu Meteorology and Geo-Hazards Department, 2016).
International volcanological community
In addition to collaborative activities with government aid agencies (e.g. VDAP, DFAT, JICA), almost all volcano observatories show evidence of multiple on-going relationships with individual universities or consortiums of universities. These collaborative relationships are vital in ensuring volcano observatories are able to draw upon research advances and turn them into operational activities (Loughlin et al. 2015). This includes: improving access to (usually temporary) ground-based equipment networks; improving knowledge of eruptive histories, including the development of conceptual models to provide a framework within which real-time monitoring data may be interpreted (Miller and Jolly, 2014); and gaining access to remote-sensing data (e.g. the CEOS volcano pilot: Pritchard et al. 2018).
Improved access to remote-sensing data is a key benefit of increasing RVO’s involvement in the international volcanological community. The Group on Earth Observation (GEO) Geohazard Supersites and Natural Laboratories (GSNL) initiative has significant potential to

34
drastically accelerate access to and the use of remote-sensing data for PNG volcanoes. In selected locations, GSNL provide open access to otherwise expensive remote-sensing data sets and encourage international collaboration among scientists and end users. Supersites must be led by a member of staff in-country, who provides significant input into the application process, managing the site (alongside other international project leads), and bi-annual reporting. Whilst this may not be currently viable for RVO due to the significant time commitment, there are ways in which GA can assist RVO to be better placed to pursue this in the future.
In general terms, to benefit from international collaborative opportunities, an observatory requires a level of visibility within the international community to raise awareness about its needs and to accelerate communication. The uptake of collaborative research/monitoring projects is then dependent upon the observatory having the time and resources to respond to information requests, host visitors and provide field input. Therefore, despite the benefits to volcanological understanding and instrumentation, research projects in particular can be viewed by an observatory as a hindrance and a drain on the already limited resources available for day-to-day operational monitoring (Brown et al. 2015). The long-term use of any monitoring equipment resulting from such projects may also be prohibited by the need for continued maintenance in the field (Brown et al. 2015). Consequently, suggestions for future collaborative work are not necessarily well received by RVO (Nancarrow and Johnson, 2015; personal communications with others who have tried to instigate collaborative projects with RVO in the last 12 months).
Whilst extensive involvement with international research institutions may currently overwhelm RVO, GA can provide support in laying the foundations for establishing such relationships in the longer-term. First and foremost, this involves improving the visibility of RVO within the international community, which will result from the types of activities detailed in this report. GA may also host discussions with RVO about the type of inputs from research institutions they feel would be beneficial to them in the near to medium term, and how GA can help to make contact with these parties and facilitate their involvement with RVO.
Recommendations
High priority
• Help RVO to establish an information communication network with other Melanesian volcano observatories if deemed to be beneficial.
• Assist RVO to identify how external research institutions may contribute to their operations and help RVO to manage these relationships.
• Assist RVO in becoming well-placed to pursue inclusion in international initiatives such as the GEO Geohazard Supersites and Natural Laboratories.
6. Conclusions and recommendations Recommendations pertaining to specific monitoring techniques are included in all sections of this report. Any future investment in ground-based instrumentation for RVO should consider low-cost, off-the-shelf platforms for seismic, geodetic and gas monitoring, plus web cameras. Co-locating these instruments with municipal infrastructure, such as cell-phone towers, may aid in improving site security. Even if additional ground-based instruments are not installed, RVO may benefit from the development of a plan detailing suitable installation sites, which can then be used as and when equipment becomes available.
Expanding and strengthening the network of community-based observers is a key tool for bolstering RVO’s ground-based monitoring capability, even (or, especially) at non-instrumented volcanoes. This will also improve the outreach capacity of RVO and may aid in reducing thefts of equipment. To expand the network, RVO may benefit from learning about successful CBEWS networks elsewhere, and from assistance in identifying which institutions and individuals are most suited to becoming observers, and how other members of the public can best relay information to the observatory.
The value of additional equipment and new sources of data should be carefully assessed against RVO’s capacity to analyse and make use monitoring measurements in systematic analysis. Emphasis should be placed upon assessing and improving the capability of the
35
observatory in downstream use of monitoring data and dissemination of information. Existing monitoring data-streams need to be re-evaluated, with the aim of developing and implementing Standard Operating Procedures to systematically produce observational products. This will help to ensure that the observatory is fully able to exploit all current monitoring data-streams, before adding additional load. For seismic data, this may comprise daily, weekly, or monthly compilations of earthquake counts and RSAM measurements. In addition to seismic data, RVO has access via the internet to remote-sensing derived products detailing SO2 and thermal emissions at all PNG volcanoes. The observatory may initially benefit from assistance in navigating these online resources, including formulating a schedule upon which thermal and SO2 imagery should be accessed, and identifying the most useful outputs to be recorded.
Ongoing support from Australia is likely to be required in the maintenance of equipment, and in the telemetry, storage and management of monitoring data. RVO’s current information management system and infrastructure should be reviewed to ensure that it is sufficient to support currently available data, including remote-sensing derived products. Additionally, an assessment should be made as to whether the current system is capable of ingesting information from new data-streams, such as web cameras, or to identify what additional capability is required. Similarly, ongoing support from Australia will be required during periods of volcanic unrest and eruptions. At these times, GA should continue to provide RVO with remote-sensing observations (SAR and InSAR), oversee activation of the International Charter for Space and Major Disasters, and aid in the deployment of emergency equipment.
The introduction of Standard Operating Procedures for the production of volcano activity reports would improve RVO’s capacity to document volcanic activity in a structured and systematic way. The observatory may benefit from workshops for designing an effective report template, and in how to populate this with content including systematic observational products and information from community-based observers. Activity reports and all other observatory communications would benefit from the development of a consistent, transparent and universal system of Volcano Alert Levels that is supported by the current level of access to monitoring data.
To ensure that volcano activity and hazard information reaches the general public, PNG government and other stakeholders (including the wider volcanological community), RVO requires Standard Operating Procedures outlining an achievable strategy for communication. In addition to the outreach activities already undertaken by RVO, this should include the establishment of a basic observatory website to act as a source of public information about PNG volcanoes and a point of contact to the observatory. Social media and other diverse communication channels should be utilised as widely as possible to promote sustained information sharing and community engagement. Openness and a willingness to share information are identified as fundamental to the success of all volcano observatories. Improving the visibility of RVO and assisting it to become an public-facing organisation will: promote the observatory’s standing within communities and PNG government; help to attract other technical assistance and donations; and aid the observatory in benefiting from the research advances of the wider volcanological community, most significantly in access to remote-sensing data. Many PNG volcanoes will continue to have no or insufficient monitoring for the foreseeable future but monitoring at all volcanoes can benefit from improved communication and community engagement.

36
7. References ABC, 2018. News article: PNG government gives mobile phone users another 3 months to register sim cards. http://www.abc.net.au/news/programs/pacific-beat/2018-01-23/png-government-gives-mobile-phone-users-another-3/9351774, accessed on 11 April 2018.
Aiuppa, A., Moretti, R., Federico, C., Giudice, G., Gurrieri, S., Liuzzo, M., Papale, P., Shinohara, H. and Valenza, M., 2007. Forecasting Etna eruptions by real-time observation of volcanic gas composition. Geology, 35(12), pp.1115-1118.
Alvarado, A., Ruiz, M., Mothes, P., Yepes, H., Segovia, M., Vaca, M., Ramos, C., Enríquez, W., Ponce, G., Jarrín, P. and Aguilar, J., 2018. Seismic, volcanic, and geodetic networks in Ecuador: Building capacity for monitoring and research. Seismological Research Letters, 89(2A), pp.432-439.
Auker, M.R., Sparks, R.S.J., Siebert, L., Crosweller, H.S. and Ewert, J., 2013. A statistical analysis of the global historical volcanic fatalities record. Journal of Applied Volcanology, 2(1), p.2.
Berardino, P., Fornaro, G., Lanari, R. and Sansosti, E., 2002. A new algorithm for surface deformation monitoring based on small baseline differential SAR interferograms. IEEE Transactions on Geoscience and Remote Sensing, 40(11), pp.2375-2383.
Biggs, J., Anthony, E.Y. and Ebinger, C.J., 2009. Multiple inflation and deflation events at Kenyan volcanoes, East African Rift. Geology, 37(11), pp.979-982.
Biggs, J., Ebmeier, S.K., Aspinall, W.P., Lu, Z., Pritchard, M.E., Sparks, R.S.J. and Mather, T.A., 2014. Global link between deformation and volcanic eruption quantified by satellite imagery. Nature communications, 5, p.3471.
Bluth, G.J.S., Shannon, J.M., Watson, I.M., Prata, A.J. and Realmuto, V.J., 2007. Development of an ultra-violet digital camera for volcanic SO2 imaging. Journal of Volcanology and Geothermal Research, 161(1-2), pp.47-56.
Bonte, M. and Holland, P., 2008. Sub-regional workshop on the Melanesian Volcanological Network, Honiara, Solomon Islands. SOPAC Trip Report 453
Bowman, L.J. and Henquinet, K.B., 2015. Disaster risk reduction and resettlement efforts at San Vicente (Chichontepec) Volcano, El Salvador: toward understanding social and geophysical vulnerability. Journal of Applied Volcanology, 4(1), pp.1-18.
Bowman, L. and White, P., 2012. ‘Community’ perceptions of a disaster risk reduction intervention at Santa Ana (Ilamatepec) Volcano, El Salvador. Environmental Hazards, 11(2), pp.138-154.
Brenot, H., Theys, N., Clarisse, L., Van Geffen, J., Van Gent, J., Van Roozendael, M., Van Der A, R., Hurtmans, D., Coheur, P.F., Clerbaux, C. and Valks, P., 2014. Support to Aviation Control Service (SACS): an online service for near real-time satellite monitoring of volcanic plumes. Natural hazards and earth system sciences, 14(5), pp.1099-1123.
Boudoire, G., Di Muro, A., Liuzzo, M., Ferrazzini, V., Peltier, A., Gurrieri, S., Michon, I., Giudice, G., Kowalski, P. and Boissier, P., 2017. New perspectives on volcano monitoring in a tropical environment: continuous measurements of soil CO2 flux at Piton de la Fournaise (La Réunion Island, France). Geophysical Research Letters.
Brown, D., 2005, Listening to the earth, http://www.ga.gov.au/ausgeonews/ausgeonews200606/infrasound.jsp, accessed on 17 May 2018.

37
Brown, S. K., Loughlin, S. C., Spark, Vye-Brown, C., Barclay, J., Calder, E., Cottrell, E., Jolly, G., Komorowski, J-C., Mandeville, C., Newhall, C., Palma, J., Potter, S., and Valentine, G., 2015. Global volcanic hazards and risk. In: S.C. Loughlin, R.S.J. Sparks, S.K. Brown, S.F. Jenkins & C. Vye-Brown (eds) Global Volcanic Hazards and Risk, Cambridge: Cambridge University Press, p 81.
Caplan-Auerbach, J., Bellesiles, A. and Fernandes, J.K., 2010. Estimates of eruption velocity and plume height from infrasonic recordings of the 2006 eruption of Augustine Volcano, Alaska. Journal of Volcanology and Geothermal Research, 189(1-2), pp.12-18.
Carn, S.A., 2015. Gas, plume, and thermal monitoring. In The Encyclopedia of Volcanoes (Second Edition) (pp. 1125-1149).
Chaussard, E. and Amelung, F., 2012. Precursory inflation of shallow magma reservoirs at west Sunda volcanoes detected by InSAR. Geophysical Research Letters, 39(21).
Chiodini, G., Vilardo, G., Augusti, V., Granieri, D., Caliro, S., Minopoli, C. and Terranova, C., 2007. Thermal monitoring of hydrothermal activity by permanent infrared automatic stations: results obtained at Solfatara di Pozzuoli, Campi Flegrei (Italy). Journal of Geophysical Research: Solid Earth, 112(B12).
Coltelli, M., d’Aranno, P.J., de Bonis, R., Guerrero Tello, J.F., Marsella, M., Nardinocchi, C., Pecora, E., Proietti, C., Scifoni, S., Scutti, M. and Wahbeh, W., 2017. The Use of Surveillance Cameras for the Rapid Mapping of Lava Flows: An Application to Mount Etna Volcano. Remote Sensing, 9(3), p.192.
Coppola, D., Laiolo, M., Cigolini, C., Delle Donne, D. and Ripepe, M., 2016. Enhanced volcanic hot-spot detection using MODIS IR data: results from the MIROVA system. Geological Society, London, Special Publications, 426(1), pp.181-205.
Dzurisin, D., 2006. Volcano deformation: new geodetic monitoring techniques. Springer Science & Business Media.
Dzurisin, D., Lisowski, M. and Wicks Jr, C.W., 2017. Semipermanent GPS (SPGPS) as a volcano monitoring tool: rationale, method, and applications. Journal of Volcanology and Geothermal Research, 344, pp.40-51.
Ebmeier, S.K., Biggs, J., Mather, T.A., Wadge, G. and Amelung, F., 2010. Steady downslope movement on the western flank of Arenal volcano, Costa Rica. Geochemistry, Geophysics, Geosystems, 11(12).
Ebmeier, S.K., Biggs, J., Mather, T.A. and Amelung, F., 2013. On the lack of InSAR observations of magmatic deformation at Central American volcanoes. Journal of Geophysical Research: Solid Earth, 118(5), pp.2571-2585.
Ebmeier, S.K., Andrews, B.J., Araya, M.C., Arnold, D.W.D., Biggs, J., Cooper, C., Cottrell, E., Furtney, M., Hickey, J., Jay, J. and Lloyd, R., 2018. Synthesis of global satellite observations of magmatic and volcanic deformation: implications for volcano monitoring & the lateral extent of magmatic domains. Journal of Applied Volcanology, 7(1), p.2.
Edmonds, M., Herd, R.A., Galle, B. and Oppenheimer, C.M., 2003. Automated, high time-resolution measurements of SO2 flux at Soufrière Hills Volcano, Montserrat. Bulletin of Volcanology, 65(8), pp.578-586.
Endo, E.T. and Murray, T., 1991. Real-time seismic amplitude measurement (RSAM): a volcano monitoring and prediction tool. Bulletin of Volcanology, 53(7), pp.533-545.

38
Endo, E.T., 2005. The Rabaul Volcano Observatory Real-time GPS Upgrade. USGS Open-File Report 2005-1232.
Escobar-Wolf, R.P., Chigna, G., Morales, H., Waite, G.P., Oommen, T. and Lechner, H.N., 2015, December. International Collaboration on Building Local Technical Capacities for Monitoring Volcanic Activity at Pacaya Volcano, Guatemala. In AGU Fall Meeting Abstracts.
Ewert, J.W. and Miller C.D., 1995. The USGS/OFDA Volcano Disaster Assistance Program, USGS Open-File Report, 95-553.
Ewert, J.W., Guffanti, M. and Murray, T.L., 2005. An assessment of volcanic threat and monitoring capabilities in the United States: framework for a National Volcano Early Warning System, USGS Open-File Report 2005-1164.
Farr, T.G. and Kobrick, M., 2000. Shuttle Radar Topography Mission produces a wealth of data. Eos, Transactions American Geophysical Union, 81(48), pp.583-585.
Fee, D., Garces, M. and Steffke, A., 2010. Infrasound from Tungurahua volcano 2006–2008: Strombolian to Plinian eruptive activity. Journal of Volcanology and Geothermal Research, 193(1-2), pp.67-81.
Francis, P.W., Wadge, G. and Mouginis-Mark, P.J., 1996. Satellite monitoring of volcanoes. In Monitoring and Mitigation of Volcano Hazards (pp. 257-298). Springer, Berlin, Heidelberg.
Galle, B., Johansson, M., Rivera, C., Zhang, Y., Kihlman, M., Kern, C., Lehmann, T., Platt, U., Arellano, S. and Hidalgo, S., 2010. Network for Observation of Volcanic and Atmospheric Change (NOVAC)—A global network for volcanic gas monitoring: Network layout and instrument description. Journal of Geophysical Research: Atmospheres, 115(D5).
Garcés, M.A., Fee, D., Matoza, R., Fagents, S.A., Gregg, T.K.P. and Lopes, R.M.C., 2013. Volcano acoustics. Modeling Volcanic Processes: The Physics and Mathematics of Volcanism, pp.359-383.
Garthwaite, M. C. et al, in prep. Progress towards operational InSAR monitoring of volcano deformation in developing countries: Case study of Rabaul, Papua New Guinea, Frontiers in Earth Science, Geohazards and Georisks.
Global Volcanism Program, 2002. Report on Witori (Papua New Guinea). In: Wunderman, R (ed.), Bulletin of the Global Volcanism Network, 27:9. Smithsonian Institution.
Global Volcanism Program, 2017. Report on Manam (Papua New Guinea). In: Sennert, S K (ed.), Weekly Volcanic Activity Report, 24 May-30 May 2017. Smithsonian Institution and US Geological Survey.
Global Volcanism Program, 2018. Report on Kadovar (Papua New Guinea). In: Sennert, S K (ed.), Weekly Volcanic Activity Report, 3 January-9 January 2018. Smithsonian Institution and US Geological Survey.
González, PJ; Walters, RJ; Hatton, EL; Spaans, K; McDougall, A; Hooper, AJ; Wright, TJ, LiCSAR: Tools for automated generation of Sentinel-1 frame interferograms, AGU Fall Meeting, 2016.
Granados, H.D., Viramonte, J.G. and Palma, J.L., 2015. Integrating Efforts in Latin America: Asociación Latinoamericana de Volcanología (ALVO). In Volcanic Hazards, Risks and Disasters (pp. 461-494).
39
Guerrero, N.O., Brown, S.K., Granados, H.D. and Criollo, C.L., 2015. Global monitoring capacity: development of the Global Volcano Research and Monitoring Institutions Database and analysis of monitoring in Latin America. In: S.C. Loughlin, R.S.J. Sparks, S.K. Brown, S.F. Jenkins & C. Vye-Brown (eds) Global Volcanic Hazards and Risk, Cambridge: Cambridge University Press, p.323. Hanka, W., Saul, J., Weber, B., Becker, J., Harjadi, P., Rudloff, A., Bossu, R., Ottemöller, L. and Clinton, J., 2010. Real-time earthquake monitoring for tsunami warning in the Indian Ocean and beyond. Natural Hazards & Earth System Sciences, 10(12).
Harrild, M., Webley, P.W. and Dehn, J., 2016, February. Can we develop an effective early warning system for volcanic eruptions usingoff the shelf'webcams and low-light cameras?. In AGU Fall Meeting Abstracts.
Horton, K.A., Williams-Jones, G., Garbeil, H., Elias, T., Sutton, A.J., Mouginis-Mark, P., Porter, J.N. and Clegg, S., 2006. Real-time measurement of volcanic SO 2 emissions: validation of a new UV correlation spectrometer (FLYSPEC). Bulletin of Volcanology, 68(4), pp.323-327.
Hutchinson D. and Dawson, J., 2009. Satellite Radar Interferometry: Application to Rabaul Caldera, Papua New Guinea. Geoscience Australia Record 2009/39 GeoCat #69305.
Johnson, R.W., Itikarai, I., Patia, H. and McKee, C.O., 2010. Volcanic systems of the Northeastern Gazelle Peninsula, Papua New Guinea: Synopsis, evaluation, and a model for Rabaul Volcano, Papua New Guinea. In Rabaul Volcano Workshop Report.
Johnson, J.B. and Ripepe, M., 2011. Volcano infrasound: A review. Journal of Volcanology and Geothermal Research, 206(3-4), pp.61-69.
Jolly, G., 2015. The role of volcano observatories in risk reduction. In: S.C. Loughlin, R.S.J. Sparks, S.K. Brown, S.F. Jenkins & C. Vye-Brown (eds) Global Volcanic Hazards and Risk, Cambridge: Cambridge University Press p.299.
Laiolo, M., Coppola, D., Barahona, F., Benítez, J.E., Cigolini, C., Escobar, D., Funes, R., Gutierrez, E., Henriquez, B., Hernandez, A. and Montalvo, F., 2017. Evidences of volcanic unrest on high-temperature fumaroles by satellite thermal monitoring: The case of Santa Ana volcano, El Salvador. Journal of Volcanology and Geothermal Research, 340, pp.170-179.
Larson, K.M., Poland, M. and Miklius, A., 2010. Volcano monitoring using GPS: Developing data analysis strategies based on the June 2007 Kīlauea Volcano intrusion and eruption. Journal of Geophysical Research: Solid Earth, 115(B7).
Lawrence, C., 2017. Infrastructure challenges for Papua New Guinea’s Future. PNG Country Assessment: Lowry Institute.
Loughlin, S.C., Vye-Brown, C., Sparks, R.S.J., Brown, S.K., Barclay, J., Calder, E., Cottrell, E., Jolly, G., Komorowski, J-C., Mandeville, C., Newhall, C., Palma, J., Potter, S., Valentine, G. 2015 An introduction to global volcanic hazard and risk. In: S.C. Loughlin, R.S.J. Sparks, S.K. Brown, S.F. Lovick, J., Lawlor, O., Dean, K. and Dehn, J., 2008, December. Observation of volcanoes through webcams: Tools and techniques. In AGU Fall Meeting Abstracts. Maskrey, A., 2011. Revisiting community-based disaster risk management. Environmental Hazards, 10(1), pp.42-52.
McCormick, B.T., Edmonds, M., Mather, T.A. and Carn, S.A., 2012. First synoptic analysis of volcanic degassing in Papua New Guinea. Geochemistry, Geophysics, Geosystems, 13(3).
McKee, C., Itikarai, I. and Davies, H., 2017. Instrumental Volcano Surveillance and Community Awareness in the Lead-Up to the 1994 Eruptions at Rabaul, Papua New Guinea, In Advances in Volcanology, Springer Berlin Heidelberg, 1-29. McNutt, S.R., 2002. Volcano seismology and monitoring for eruptions. International Geophysics Series, 81(A), pp.383-406.
40
Meyer, F.J., McAlpin, D.B., Gong, W., Ajadi, O., Arko, S., Webley, P.W. and Dehn, J., 2015. Integrating SAR and derived products into operational volcano monitoring and decision support systems. ISPRS Journal of Photogrammetry and Remote Sensing, 100, pp.106-117.
Miller, C.A. and Jolly, A.D., 2014. A model for developing best practice volcano monitoring: a combined threat assessment, consultation and network effectiveness approach. Natural hazards, 71(1), pp.493-522.
Moran, S.C., Freymueller, J.T., LaHusen, R.G., McGee, K.A., Poland, M.P., Power, J.A., Schmidt, D.A., Schneider, D.J., Stephens, G., Werner, C.A. and White, R.A., 2008. Instrumentation recommendations for volcano monitoring at US volcanoes under the National Volcano Early Warning System, USGS Open-File Report, 2008-5114.
Mothes, P.A., Yepes, H.A., Hall, M.L., Ramón, P.A., Steele, A.L. and Ruiz, M.C., 2015. The scientific–community interface over the fifteen-year eruptive episode of Tungurahua Volcano, Ecuador. Journal of Applied Volcanology, 4(1), p.9.
Nancarrow, S. N., and Johnson, R. W., 2015. Rabaul Volcanological Observatory Twinning Program Completion Report. Geoscience Australia report, in confidence.
Newhall, C.G., Costa, F., Ratdomopurbo, A., Venezky, D.Y., Widiwijayanti, C., Win, N.T.Z., Tan, K. and Fajiculay, E., 2017. WOVOdat–An online, growing library of worldwide volcanic unrest. Journal of Volcanology and Geothermal Research, 345, pp.184-199.
Newhall, C.G. and Pallister, J.S., 2015. Using multiple data sets to populate probabilistic volcanic event trees. In Volcanic Hazards, Risks and Disasters (pp. 203-232).
Nunnari, G. and Puglisi, G., 1994. The global positioning system as a useful technique for measuring ground deformations in volcanic areas. Journal of Volcanology and Geothermal Research, 61(3-4), pp.267-280.
Oxford Business Group, 2016. https://oxfordbusinessgroup.com/overview/change-calling-series-reforms-and-infrastructure-projects-bring-much-needed-advances-sector Accessed on 22 May 2018.
Pallister, J.S., Schneider, D.J., Griswold, J.P., Keeler, R.H., Burton, W.C., Noyles, C., Newhall, C.G. and Ratdomopurbo, A., 2013. Merapi 2010 eruption—Chronology and extrusion rates monitored with satellite radar and used in eruption forecasting. Journal of Volcanology and Geothermal Research, 261, pp.144-152.
Pallister, J. and McNutt, S.R., 2015. Synthesis of volcano monitoring. In The Encyclopedia of Volcanoes (Second Edition) (pp. 1151-1171).
Pallister, J., Wessels, R., Griswold, J., McCausland, W., Kartadinata, N., Gunawan, H., Budianto, A. and Primulyana, S., 2018. Monitoring, forecasting collapse events, and mapping pyroclastic deposits at Sinabung volcano with satellite imagery. Journal of Volcanology and Geothermal Research, in press.
Papale, P., 2017. Rational volcanic hazard forecasts and the use of volcanic alert levels. Journal of Applied Volcanology, 6(13).
Papua New Guinea Today, 2018. News article: Using mobile phones to fight corruption in Papua New Guinea. http://news.pngfacts.com/2018/04/using-mobile-phones-to-fight-corruption.html?m=0 Accessed on 11 April 2018.
Parker, A.L., Biggs, J. and Lu, Z., 2014. Investigating long-term subsidence at Medicine Lake Volcano, CA, using multitemporal InSAR. Geophysical Journal International, 199(2), pp.844-859.

41
Parker, A.L., Biggs, J., Walters, R.J., Ebmeier, S.K., Wright, T.J., Teanby, N.A. and Lu, Z., 2015. Systematic assessment of atmospheric uncertainties for InSAR data at volcanic arcs using large-scale atmospheric models: Application to the Cascade volcanoes, United States. Remote Sensing of Environment, 170, pp.102-114.
Phillipson, G., Sobradelo, R. and Gottsmann, J., 2013. Global volcanic unrest in the 21st century: an analysis of the first decade. Journal of Volcanology and Geothermal Research, 264, pp.183-196.
Poland, M., 2015. Volcano monitoring from space. In: S.C. Loughlin, R.S.J. Sparks, S.K. Brown, S.F. Jenkins & C. Vye-Brown (eds) Global Volcanic Hazards and Risk, Cambridge: Cambridge University Press., p.311.
Prata, A.J. and Bernardo, C., 2009. Retrieval of volcanic ash particle size, mass and optical depth from a ground-based thermal infrared camera. Journal of Volcanology and Geothermal Research, 186(1-2), pp.91-107.
Pritchard, M.E., Biggs, J., Wauthier, C., Sansosti, E., Arnold, D.W.D., Delgado, F., Ebmeier, S.K., Henderson, S.T., Stephens, K., Cooper, C. and Wnuk, K., 2018. Towards coordinated regional multi-satellite InSAR volcano observations: Results from the Latin America pilot project. Journal of Applied Volcanology.
Rodgers, M., Roman, D.C., Geirsson, H., LaFemina, P., McNutt, S.R., Muñoz, A. and Tenorio, V., 2015. Stable and unstable phases of elevated seismic activity at the persistently restless Telica Volcano, Nicaragua. Journal of Volcanology and Geothermal Research, 290, pp.63-74.
Romeyn, R.P. and Garthwaite, M.C., 2012. Broad-scale volcano monitoring in Papua New Guinea using satellite interferometric synthetic aperture radar. Geoscience Australia.
Ronchin, E., Masterlark, T., Dawson, J., Saunders, S. and Martì Molist, J., 2017. Imaging the complex geometry of a magma reservoir using FEM-based linear inverse modeling of InSAR data: application to Rabaul Caldera, Papua New Guinea. Geophysical Journal International, 209(3), pp.1746-1760.
Silver, E., Day, S., Ward, S., Hoffmann, G., Llanes, P., Driscoll, N., Appelgate, B. and Saunders, S., 2009. Volcano collapse and tsunami generation in the Bismarck volcanic arc, Papua New Guinea. Journal of Volcanology and Geothermal Research, 186(3-4), pp.210-222.
Smets, B., d’Oreye, N., Kervyn, F., Kervyn, M., Albino, F., Arellano, S.R., Bagalwa, M., Balagizi, C., Carn, S.A., Darrah, T.H. and Fernández, J., 2014. Detailed multidisciplinary monitoring reveals pre-and co-eruptive signals at Nyamulagira volcano (North Kivu, Democratic Republic of Congo). Bulletin of Volcanology, 76(1), p.787.
Snedigar, S.F., Cameron, C.E. and Nye, C.J., 2006, December. The Alaska Volcano Observatory Website a Tool for Information Management and Dissemination. In AGU Fall Meeting Abstracts.
Sparks, R.S.J., Biggs, J. and Neuberg, J.W., 2012. Monitoring volcanoes. Science, 335(6074), pp.1310-1311.
Stone, J., Barclay, J., Simmons, P., Cole, P.D., Loughlin, S.C., Ramón, P. and Mothes, P., 2014. Risk reduction through community-based monitoring: the vigías of Tungurahua, Ecuador. Journal of Applied Volcanology, 3(1), p.11.
Takaku J. and Tadono T., 2017. Quality updates of ‘AW3D’ global DSM generated from ALOS PRISM, In Proc. IGARSS2017, IEEE, Fort Worth, TX, USA., pp. 5666-5669.

42
Tilling, R.I., 2008. The critical role of volcano monitoring in risk reduction. Advances in Geosciences, 14, pp.3-11.
Todman, S., Garaebiti, E., Jolly, G.E., Sherburn, S., Scott, B., Jolly, A.D., Fournier, N. and MIller, C.A., 2010, December. Developing monitoring capability of a volcano observatory: the example of the Vanuatu Geohazards Observatory. In AGU Fall Meeting Abstracts.
UNDP PNG, 2014. News article: Mobile phones helping to fight corruption in Papua New Guinea. http://www.pg.undp.org/content/papua_new_guinea/en/home/ourwork/democraticgovernance/successstories/fighting-corruption-using-mobile-phones-.html, Accessed on 11 April 2018.
UN Sasakawa Award Nomination 2015, Candidate Information, https://www.wcdrr.org/sasakawa/nominees/3907 Accessed on 27 June 2018.
The Vanuatu Meteorology and Geo-Hazards Department, 2016. The Vanuatu Meteorology and Geo-Hazards Department Annual Report 2015. Port Vila, Vanuatu, VMGD publications, http://www.vmgd.gov.vu/vmgd/images/admin-media/docs/VMGD-Annual-Report-2015.pdf, Accessed on 28 June 2018.
Venezky, D. and Newhall, C.G., 2007. WOVOdat design document: the schema, table descriptions, and create table statements for the database of worldwide volcanic unrest (WOVOdat version 1.0). USGS Open-File Report, 2007-1117.
Voight, B., Calvache, M.L., Hall, M.L. and Monsalve, M.L., 2013. Nevado del Ruiz Volcano, Colombia 1985. In Encyclopedia of Natural Hazards (pp. 732-738). Springer Netherlands.
Voight, B., Hoblitt, R.P., Clarke, A.B., Lockhart, A.B., Miller, A., Lynch, L. and McMahon, J., 1998. Remarkable cyclic ground deformation monitored in real-time on Montserrat, and its use in eruption forecasting. Geophysical Research Letters, 25(18), pp.3405-3408.
Watson, A. H. A. 2017, http://www.devpolicy.org/ten-years-papua-new-guinea-conversation-digicel-20170731/ accessed 22 May 2018.
Wegmüller, U. and Werner, C., 1997. GAMMA SAR processor and interferometry software, In: 3rd ERS Scientific Symposium, European Space Agency.
Wilkes, T.C., Pering, T.D., McGonigle, A.J.S., Tamburello, G. and Willmott, J.R., 2017. A Low-Cost smartphone sensor-based UV camera for volcanic SO2 emission measurements. Remote Sensing, 9(1), p.27.
Wilson, C.R. and Olson, J.V., 2005. 153US and 155US signals from Manam Volcano. Inframatics, 9, pp.31-35.
Winson, A.E., Costa, F., Newhall, C.G. and Woo, G., 2014. An analysis of the issuance of volcanic alert levels during volcanic crises. Journal of Applied Volcanology, 3(1), p.14.
Wright, R., Flynn, L.P., Garbeil, H., Harris, A.J. and Pilger, E., 2004. MODVOLC: near-real-time thermal monitoring of global volcanism. Journal of Volcanology and Geothermal Research, 135(1-2), pp.29-49.
Wright, R., Blackett, M. and Hill-Butler, C., 2015. Some observations regarding the thermal flux from Earth's erupting volcanoes for the period of 2000 to 2014. Geophysical Research Letters, 42(2), pp.282-289.

43

44
Appendix 1 –Volcano observatories and other contacts consulted during writing of this report
Australian Burea of Meterology/ Darwin VAAC
Adele Bear-Crozier [email protected]
Chile - Servicio Nacional de Geologia y Mineria (SERNAGEOMIN)
http://www.sernageomin.cl/red-nacional-de-vigilancia-volcanica/
Loreto Cordova [email protected]
Colombia - Servicio Geologico Colombiano
https://www2.sgc.gov.co/volcanes/index.html
Cristian Lopez [email protected]
Milton Ordoñez [email protected]
Costa Rica - Observatorio Vulcanológico y Sismológico de Costa Rica
http://www.ovsicori.una.ac.cr/index.php/vulcanologia
Cyril Muller [email protected]
Rebecca Salvage [email protected]
Democratic Republic of Congo - Goma Volcano Observatory
Tuluka Mavonga Georges [email protected]
Charles Balagizi [email protected]
Ecuador - Instituto Geofisico - Escuela Politecnica Nacional
http://www.igepn.edu.ec/red-de-observatorios-vulcanologicos-rovig
El Salvador - Servicio Nacional de Estudios Territoriales (SNET)
http://www.snet.gob.sv/ver/vulcanologia
Guatemala - Instituto Nacional de Sismologia, Vulcanologia, Meteorologia e Hidrologia (INSIVUMEH)
http://www.insivumeh.gob.gt/?page_id=70
G. Chigna [email protected]
Indonesia - Centre for Volcanology and Geological Hazard Mitigation (CVGHM)
https://magma.vsi.esdm.go.id/
Devy Syahbana [email protected]

45
Mexico - Centro Nacional de Prevención de Desastres, or CENAPRED
Each volcano is monitored by a separate institution e.g. Colima carried out by members of the Centro Universitario de Estudios e Investigaciones de Vulcanologia - Universidad de Colima
http://www.cenapred.unam.mx:8080/reportesVolcan
Nicaragua - Instituto Nicaraguense de Estudios Territoriales (INETER)
http://webserver2.ineter.gob.ni/vol/dep-vol.html
Virginia Tenorio [email protected]
Wilfried Strauch [email protected]
New Zealand - GNS Science
https://www.gns.cri.nz/Home/Our-Science/Natural-Hazards/Volcanoes/Volcano-Monitoring
Brad Scott [email protected]
Gill Jolly [email protected]
Peru - Observatorio Vulcanológico del INGEMMET (OVI)
http://ovi.ingemmet.gob.pe/
Philippines - Philippine Institute of Volcanology and Seismology (PHIVOLCS)
http://www.phivolcs.dost.gov.ph/
Powell Volcano Working Group (USGS Powell Center for Analysis and Synthesis)
Kevin Reath (Powell Fellow) [email protected]
Vanuatu - Vanuatu Metereorology and Geo-Hazards Department
http://www.vmgd.gov.vu/vmgd/index.php/geohazards/volcano
Esline Garaebiti [email protected]
VDAP (USGS Volcano Disaster Assistance Program)
Five days was spent working with the VDAP team at the Cascades Volcano Observatory, US.

46
Appendix 2 – USGS Volcano Disaster Assistance Program threat ranking for the volcanoes of Papua New Guinea
Table A2.1 Unpublished threat ranking of PNG volcanoes carried out by VDAP using the USGS NVEWS ranking approach (Ewert et al. 2005). Names have been cross checked with the Smithsonian Global Volcanism Program.
Very High High Moderate Low
Rabaul
Karkar
Ulawun
Manam
Witori (Pago)
Long Island
Lamington
Krummel-Garbuna-Weckler
Hargy
Sulu Range
Bamus
Bagana
Dakataua
Ritter Island
Lolobau
Billy Mitchell
Bam
Ambitle
Langila
Victory
Loloru
Waiowa
Tuluman
Tavui
Kadovar
Garua Harbour
Dawson Straight Group
Lihir
Yelia°
Garove
Umboi
Baluan
Sakar
Balbi
Wagipa∴
Koranga
Narage°
Lolo
Bola
Mundua
Madilogo
Hydrographers Range
Takuan Group
Boisa
Blup Blup
Doma Peaks
Tore
Crater Mountain°
Sessagara
Iamalele
Musa River *
Managlase Plateau

47
* Not contained within the Smithsonian Global Volcanism Program catalogue
° Recorded as Pleistocene in the Smithsonian Global Volcanism Program catalogue
∴ Cone of Goodenough in the Smithsonian Global Volcanism Program catalogue

48
Appendix 3 – Examples of volcano activity reports issued by other volcano observatories
Figure A3.1: Example of a volcano activity report issued by the Vanuatu Meteorology & Geo-Hazards Department for Ambrym volcano and available on the Department’s website (http://www.vmgd.gov.vu/vmgd/index.php/geohazards/volcano/alert-bulletin). A Volcano Alert Level is clearly assigned in the first line of the report.

49
Figure A3.2: Example of a monthly volcano activity report issued by the El Salvador Servicio Nacional de Estudios Territoriales (SNET) for San Miguel Volcano and available via the website (www.snet.gob.sv/ver/vulcanologia/monitoreo/informe+mensual/?id_volcan=7). RSAM and photographs are used as evidence for the level of activity.

50
Figure A3.3: Example of a daily volcano activity report issued by the USGS Alaska Volcano Observatory and available via the website (www.avo.alaska.edu/activity/avoreport.php?view=status). A Volcano Alert Level is clearly assigned for each volcano in the report.

51
Figure A3.4: Example of a Volcano Observatory Notice for Aviation (VONA) issued by the Indonesian Centre for Volcanology and Geological Hazard Mitigation (CVGHM) and available via the website (https://magma.vsi.esdm.go.id/vona/display?noticenumber=2018DUK113).
Figure A3.5: Example of an SMS alert regarding ashfall issued by the Peru Observatorio Vulcanológico del INGEMMET (OVI) available via the website (http:// ovi.ingemmet.gob.pe).

52
Appendix 4 – Examples of volcano observatory websites
The Vanuatu Meteorology & Geo-Hazards Department website provides a simple and well-structured example that could be followed by RVO.
Figure A4.1: The Vanuatu Meteorology & Geo-Hazards Department volcano monitoring homepage displaying the location and Volcano Alert Levels of Vanuatu volcanoes (http://www.vmgd.gov.vu/vmgd/index.php/geohazards/volcano).

53
Figure A4.2: The Vanuatu Meteorology & Geo-Hazards Department Volcano Alert Level System as displaced on the Department website (http://www.vmgd.gov.vu/vmgd/index.php/geohazards/volcano/volcano-info/volcanic-alert-level).

54
Figure A4.3: The Vanuatu Meteorology & Geo-Hazards Department website showing an example of the page for Ambryn volcano (http://www.vmgd.gov.vu/vmgd/index.php/geohazards/volcano/our-active-volcanos/ambrym) depicting live feed to drum plot and web camera, plus links to the volcano activity report and a volcano alert level, and links to social media (Facebook and Twitter) .
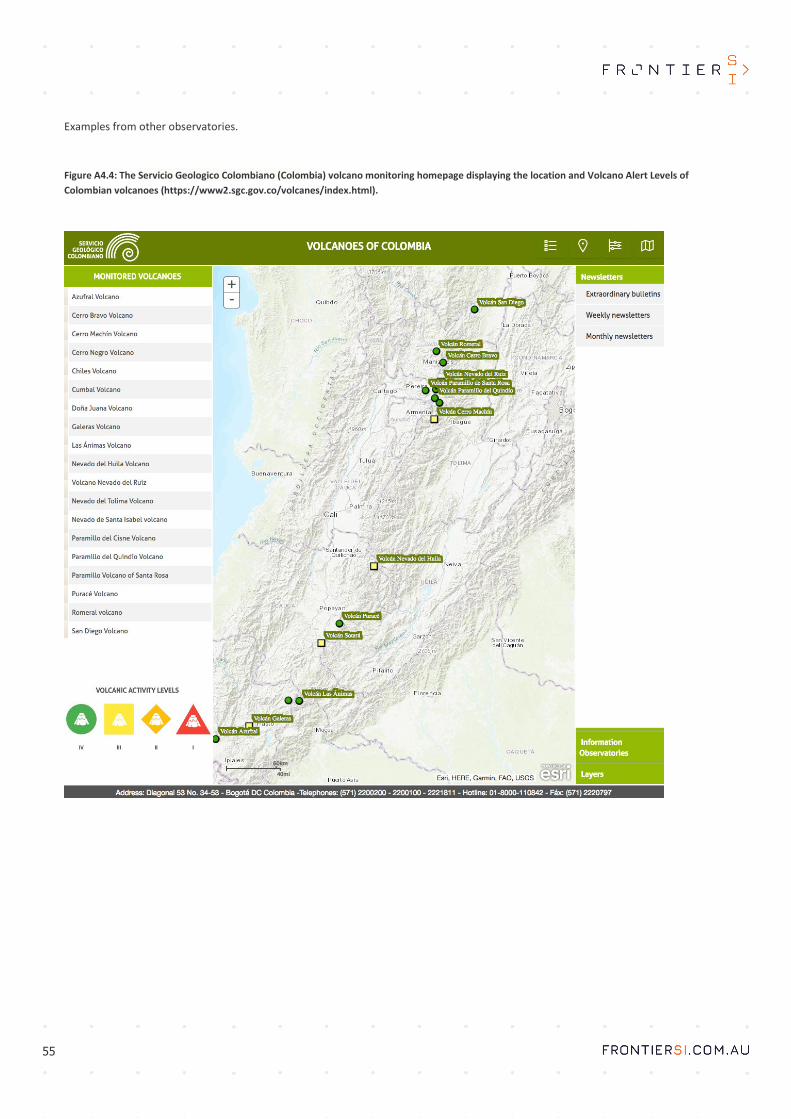
55
Examples from other observatories.
Figure A4.4: The Servicio Geologico Colombiano (Colombia) volcano monitoring homepage displaying the location and Volcano Alert Levels of Colombian volcanoes (https://www2.sgc.gov.co/volcanes/index.html).

56
Figure A4.5: The Chile Servicio Nacional de Geologia y Mineria (SERNAGEOMIN) volcano monitoring homepage displaying the location and Volcano Alert Levels of Chilean volcanoes (http://www.sernageomin.cl/red-nacional-de-vigilancia-volcanica/). Also included is clear information on the frequency of activity reporting.

57
Appendix 5 – Examples of derived remote-sensing products available for Papua New Guinea volcanoes
Figure A5.1: SO2 monitoring - NASA’s Global Sulfur Dioxide Monitoring Service (https://so2.gsfc.nasa.gov/index.html).

58
Figure A5.2: SO2 monitoring - NOAA National Environmental Satellite, Data and Information Service (http://satepsanone.nesdis.noaa.gov/pub/OMI/OMISO2/pnguinea.html).

59
Figure A5.3: SO2 monitoring - Support to Aviation Control Service (SACS) (http://sacs.aeronomie.be/).
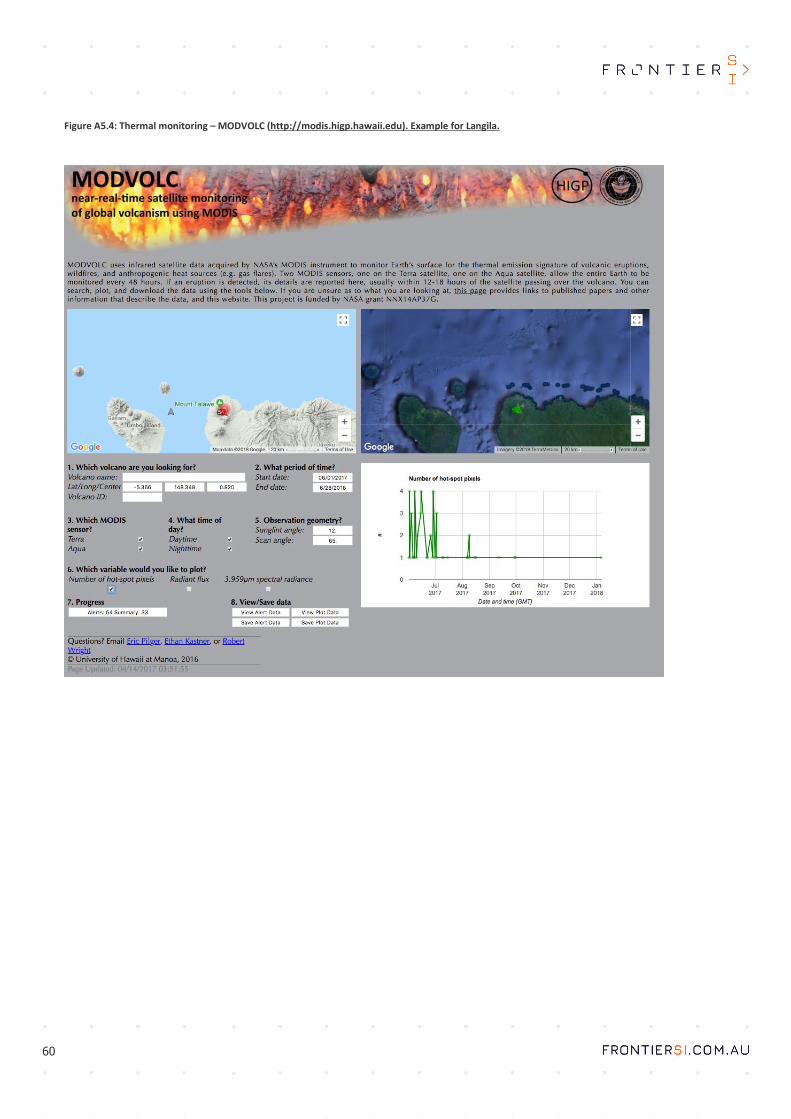
60
Figure A5.4: Thermal monitoring – MODVOLC (http://modis.higp.hawaii.edu). Example for Langila.

61
Figure A5.5: Thermal monitoring – MIROVA (http://www.mirovaweb.it/). Example for Langila.

62
Appendix 6 – Preliminary steps towards a national-scale baseline InSAR survey of Papua New Guinea volcanoes
Preliminary work towards a baseline national-scale InSAR survey was completed as part of this report. This survey used archived ascending pass Fine Beam ALOS-1 PALSAR (L-band: λ~23.6 cm) data covering the time period 2007 - 2011, plus ascending pass Fine Beam (SM3) ALOS-2 data (also L-band) for some volcanoes (see Tables A6.1 and A6.2).
Table A6.1: Information on the ALOS-PALSAR and ALOS-2 datasets being used for the national InSAR volcano survey of PNG.
ALOS-1 ALOS-2 Number of PNG volcanoes covered 48 28 Percentage of total recognized volcanoes 86% 50% Total number of scenes 24 11 Total number of images 488 117
The 13 volcanoes that were investigated are detailed in Table A6.2. The methodology applied was comparable to that of Chaussard and Amelung (2012). A network of small baseline interferograms was produced using the GAMMA software (Wegmüller and Werner, 1997) with phase in radians converted to displacement in centimetres. Any pixels with coherence below a threshold of 0.6 were masked to reduce unwrapping errors. Interferograms were then cropped to a ~15 km x 15 km box centered on each volcano summit and the measurements were referenced to a common region. This region was set using an annulus (e.g. Parker et al. 2015) with inner and outer radii that are volcano dependent and selected to lie outside the relief of the volcano (i.e. where the elevation decreases to the average of the surrounding region). In some cases (i.e. small island volcanoes) this approach was not possible and a 5 x 5 pixel region was instead selected. In these cases, four separate reference regions were tested to ensure that the average velocity at the centre of the volcano was not dependent on the reference selected, and did not vary by more than 1σ. A velocity map for each volcano was then generated by adding the displacement values on a pixel-by-pixel basis and dividing the sum by the total time span of all the constituent interferograms. Out of the 13 volcanoes tested, interferograms were coherent enough to produce velocity maps at nine volcanoes, with three requiring further tests and only one (Lolobau) completely unsuccessful (Table A6.2). Five volcanoes exhibited signs of deformation during velocity mapping and interferogram analysis (Table A6.2). At these volcanoes, time-series of displacements at the volcano summit were produced using the SBAS approach (Berardino et al. 2002). For volcanoes where both ALOS-1 and -2 were assessed, the best fitting linear displacement-rate to the ALOS-1 data was used to estimate the displacement at the time of the first ALOS-2 acquisition, thus producing a quasi-continuous time-series (see example for Ulawun in Figure A6.1). Velocity maps and time-series for two volcanoes to have exhibited apparent deformation during the observation period (Langila and Ulawun) are shown in Figure A6.1.

63
Table A6.2: Volcanoes studied in a preliminary baseline InSAR survey. Colours show the VDAP threat ranking (Appendix 2) and are very high (red), high (orange), moderate (yellow), low (green). Tildas indicate inconclusive results.
The results of this preliminary study highlight the potential for L-band SAR data as a monitoring tool at densely vegetated PNG volcanoes, with the caveat that the separation between image acquisitions is short (i.e. no more than two or three orbital revisits of ALOS-2). For instance, a 28-day ALOS-2 interferogram is able to resolve coherent interferometric phase over the heavily vegetated Kadovar volcano, whereas much longer interferometric combinations cannot.
In extending this approach to other PNG volcanoes, careful assessment should be made to identify possible topographic errors, which may occur due to differences between the DSM used in processing and any topographic changes that have occurred since formation of the DSM due to eruptions. The DSM used here for interferogram formation is the 30 m SRTM acquired in 2000 (Farr et al. 2000). Other more suitable DSMs include the 2012 ALOS 3D World DSM (Takaku and Tadono, 2017) or the 5 m DSM acquired by the Australian Department of Defence.
Shorter wavelength SAR datasets (C-band: λ~5.5 cm; X-band: λ~3.1 cm ) are more susceptible to incoherence caused by vegetation. More extensive test applications should be carried out to determine the suitability of Sentinel-1 C-band InSAR for monitoring at PNG volcanoes. This dataset is open access, and likely to provide imagery beyond 2020, however the usefulness of this dataset for volcano monitoring in PNG is currently unclear.
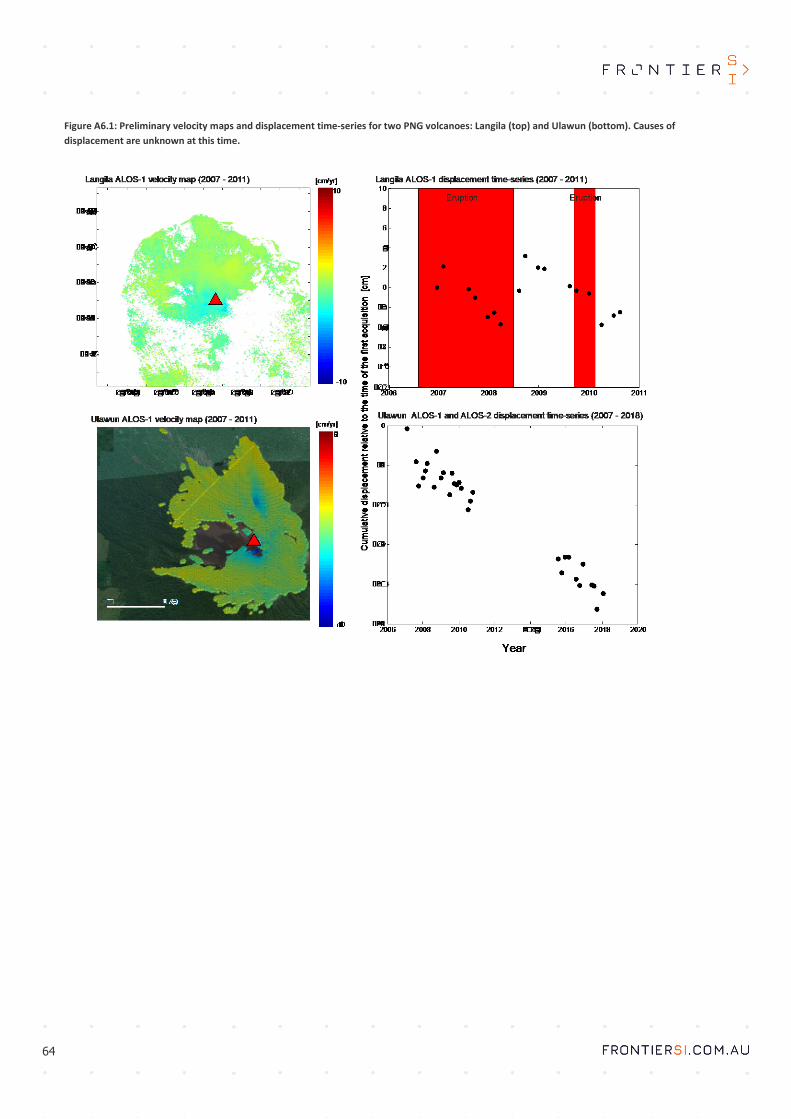
64
Figure A6.1: Preliminary velocity maps and displacement time-series for two PNG volcanoes: Langila (top) and Ulawun (bottom). Causes of displacement are unknown at this time.

65
Appendix 7 – Examples of volcano observatory social media pages
Costa Rica
Figure A7.1: The Facebook page for the Observatorio Vulcanológico y Sismológico de Costa Rica (https://www.facebook.com/OVSICORI) that is followed by over half a million people.

66
Figure A7.2: The Twitter page for the Observatorio Vulcanológico y Sismológico de Costa Rica (https://twitter.com/OVSICORI_UNA) .
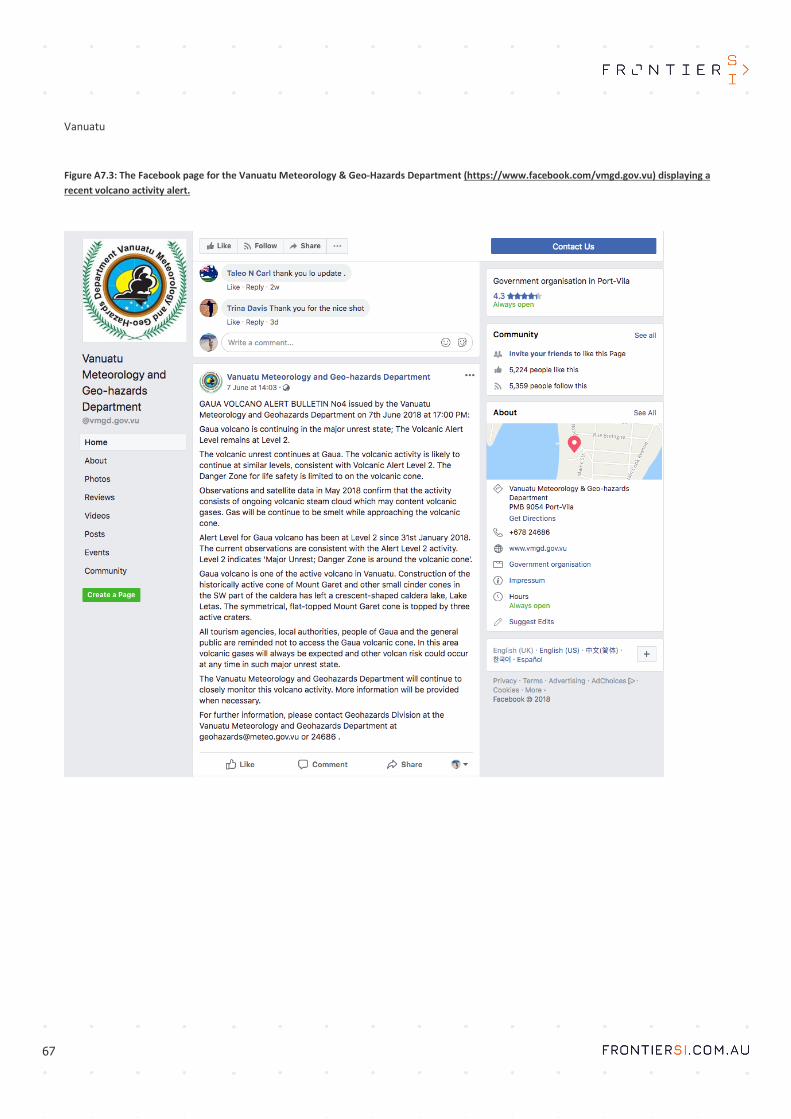
67
Vanuatu
Figure A7.3: The Facebook page for the Vanuatu Meteorology & Geo-Hazards Department (https://www.facebook.com/vmgd.gov.vu) displaying a recent volcano activity alert.

68
Philippines
Figure A7.4: The Twitter page for the Philippine Institute of Volcanology and Seismology (https://twitter.com/phivolcs_dost) clearly displaying contact information for the observatory via a pinned Tweet.


![Gameboy Advance: iss-de - Deutsch...Gameboy Advance: iss-de German manual [Index] [1] DSCN0949.JPG DSCN0950.png DSCN0954.png DSCN0955.png DSCN0956.png DSCN0957.png DSCN0958.png DSCN0959.png](https://static.fdocuments.in/doc/165x107/5f266ceceb0d265fef10f12f/gameboy-advance-iss-de-deutsch-gameboy-advance-iss-de-german-manual-index.jpg)