AN INVESTIGATION OF FISCHER-TROPSCH REACTION … · AN INVESTIGATION OF FISCHER-TROPSCH REACTION...
220
AN INVESTIGATION OF FISCHER-TROPSCH REACTION FOR SYNTHESIS OF HYDROCARBONS AND ALCOHOLS Thesis submitted in accordance with the requirement of Cardiff University for the degree of Doctor of Philosophy Sarwat Iqbal 2009
Transcript of AN INVESTIGATION OF FISCHER-TROPSCH REACTION … · AN INVESTIGATION OF FISCHER-TROPSCH REACTION...
AN INVESTIGATION OF FISCHER-TROPSCH
REACTION FOR SYNTHESIS OF
HYDROCARBONS AND ALCOHOLS
Thesis submitted in accordance with the requirement of Cardiff University for the degree of Doctor of Philosophy
Sarwat Iqbal
2009
UMI Number: U585264
All rights reserved
INFORMATION TO ALL USERS The quality of this reproduction is dependent upon the quality of the copy submitted.
In the unlikely event that the author did not send a complete manuscript and there are missing pages, these will be noted. Also, if material had to be removed,
a note will indicate the deletion.
Dissertation Publishing
UMI U585264Published by ProQuest LLC 2013. Copyright in the Dissertation held by the Author.
Microform Edition © ProQuest LLC.All rights reserved. This work is protected against
unauthorized copying under Title 17, United States Code.
ProQuest LLC 789 East Eisenhower Parkway
P.O. Box 1346 Ann Arbor, Ml 48106-1346
DECLARATION
This work has not previously been accepted in substance for any degree and is not concurrently submitted in candidature for any degree.
Signed ................................. (Candidate) Date . ^ . H .
STATEMENT 1
This thesis is being submitted in partial fulfillment of the requirements for the degree of PhD
Signed (Candidate) Date
STATEMENT 2
This thesis is the result of my own independent work/investigation, except where otherwise stated. Other sources are acknowledged by explicit references.
Signed .. (Candidate) Date ... A A l . .?...
STATEMENT 3
I hereby give consent for my thesis, if accepted, to be available for photocopying and for inter-library loan, and for the title and summary to be made available to outside organizations.
Signed ... (Candidate) Date
STATEMENT 4: PREVIOUSLY APPROVED BAR ON ACCESS
I hereby give consent for my thesis, if accepted, to be available for photocopying and for inter-library loans after expiry of a bar on access previously approved by the Graduate Development Committee.
Signed ................................. (Candidate) Date........
Abstract
Abstract
Fischer Tropsch (FT) technology as a source of alternate fuels is unique. The FT products
are of excellent quality and their environmental properties are valuable in increasing
drive towards cleaner fuels. There was surge of interest in FT in the thirties and fifties
(during the Second World War) and now again in last couple of years.
Fischer Tropsch technology has a disadvantage of broad product spectrum. There is
strong requirement of improvement in the optimization of reaction in order to get a
maximum yield of high value commercial products, mainly high value molecular weight
products, alcohols and short chain hydrocarbons. Most of the investigations reported in
this thesis have dealt with study and possible modifications in the preparation and
reaction conditions of previously studied CoMnOx catalyst. Co-precipitation method for
preparation of this catalyst has been studied in detail. Precipitation by variable pH has
been found to be better than constant pH. pH, ageing time of precipitates and temperature
of precipitation mixture are very important parameters which affect the selectivity pattern
of products. This selectivity pattern was found to be further influenced by reaction
temperature and pressure during CO hydrogenation reaction.
An improvement in the selectivities for CO hydrogenation reaction has been developed
using a modified co-precipitated Co/Mn oxide catalyst. This modification was achieved
by using two different metal promoters, i.e., Potassium and ruthenium. Addition of these
promoters has influenced the catalytic properties in a variety of ways as was observed
from characterization and reaction results. Addition of small quantity of potassium
Abstract
(0.15%), and ruthenium (0.1%) promoters shifted the product spectrum to long chain
hydrocarbons along with decrease in methane selectivity.
Further improvements in catalytic activity and selectivity were made by addition of two
different types of activated carbons (wood and peat shell) into Co/Mn catalyst. Co and
Mn impregnated on wood peat carbon were found to be highly selective for high
molecular weight hydrocarbons along with low selectivity of CO2 compared with pure
CoMnOx catalyst. An increase in concentration of metals with these carbons showed an
increase in selectivity of CO2 . One particular catalyst system of iron and manganese was
studied with peat and wood carbons and was found to be highly selective for CO2
formation.
Alcohols, an important product of FT reaction are a good substitute to motor fuel which
can enhance the octane number and can reduce the environmental pollution. Cobalt
molybdenum sulphide is a patented catalyst system for alcohols synthesis. Present study
has investigated the influence of transition metal promoters on selectivity pattern of this
catalyst. Ti, Ni and Zr metals have been used as promoters. Addition of Ni and Ti into
C0 M0 S2 have shown good catalytic activity but the major product was CC>2- Zr addition
has shown less CO2 and more hydrocarbons. Pure C0 M0 S2 catalyst was found to be
better for synthesis of higher alcohols.

To my mother
ACKNOWLEDGEMENTS
I would like to express my sincere gratitude to the following people who helped me in
completion of my studies.
My academic supervisor Prof. Graham Hutchings for giving me this opportunity to work
in his group and for his guidance and encouragement throughout this project.
My industrial supervisor Dr. Khalid Karim (SABIC) for his keen interest in the project
providing continued support and advice.
Mr. Tahir Hussain and Dr. Saleh. A Al-Sayari (SABIC) for their useful suggestions and
input.
Dr.Thomas Davies for his assistance. His invaluable efforts were especially appreciated
in completion of this work.
Dr. Albert Carley, for providing much help and inspiration, in particular for XPS analysis.
Dr. Stuart Taylor and Dr. Jonathan Bartley for always being there to help me in research
as well as many other difficult situations.
Alun, John, Steve, Richard and Mai, without whom my research would have been much
more difficult- thanks for all reactor work and trouble-shooting.
My parents, for their endless love, motivation and understanding.
Finally, I would like to acknowledge SABIC for financial support.
Contents
CONTENTS
LIST OF TABLES xiii
LIST OF FIGURES xvi
LIST OF ABBREVIATIONS xviii
Chapter 1: Introduction 1
1.1 Aims and objectives 1
1.2 Heterogeneous catalysis 2
1.3 History of Fischer-Tropsch (FT) reaction (CO hydrogenation) 3
1.4 Preparation of synthesis gas 7
1.5 Product distribution 8
1.6 Reactors used in FT synthesis 10
1.6.1 Tubular fixed bed reactor 10
1.6.2 Fluidized bed reactor 11
1.6.3 Slurry Phase reactors 12
1.7 CO Hydrogenation - Mechanism 13
1.7.1 Carbide mechanism 13
1.7.2 Hydroxycarbene mechanism 14
1.7.3 CO insertion mechanism 17
1.8 Metal catalysts used in Fischer Tropsch (FT) synthesis 18
Contents
1.9 Cobalt-as an FT catalyst 19
1.10 Catalyst promoters 24
1.11 Synthesis of alcohols from syngas 27
1.11.1 Catalysts for alcohols synthesis 29
1.12 References 32
Chapter 2: Experimental 42
2.1 Catalyst preparation 42
2.1.1 Co precipitation 42
(i) Preparation of cobalt manganese oxide catalysts by coprecipitation 45
at constant pH
(ii) Preparation of cobalt manganese oxide catalysts by coprecipitation 46
at variable pH
2.1.2 Impregnation 46
2.1.2.1 Deposition of metal promoters on the surface of cobalt 47
manganese oxide catalysts
2.1.3 Deposition precipitation 48
2.1.3.1 Preparation of cobalt/iron and manganese supported/combined 48
catalysts with activated carbon by deposition precipitation method
2.1.4 Catalyst preparation for alcohols
2.1.4.1 Preparation of alkali-promoted cobalt molybdenum sulfide
49
49
Contents
catalysts for syngas conversion to alcohols
2.2 Analysis of products 50
2.2.1 Gas Chromatography 50
2.2.1.1 Instrumental components 50
(i) Carrier gas 51
(ii) Sample injection port 51
(iii) Columns 52
(iv) Detectors 52
(a) Thermal conductivity detector (TCD) 52
(b) Flame Ionization Detector (FID) 52
(iv) Data acquisition 53
2.3 Catalytic testing 53
2.4 Calculations 54
2.5 Surface and bulk characterization 54
2.5.1 BET surface area measurements 54
2.5.2 X-ray Diffraction 55
2.5.3 Temperature Programmed reduction (TPR) 57
2.5.4 X-ray Photoelectron spectroscopy (XPS) 58
2.5.5 Scanning Electron Microscopy (SEM) 60
Contents
2.5.6 Energy Dispersive X-ray Spectroscopy (EDX) 60
2.6 References 62
Chapter 3: Effect of preparation conditions on the 63
catalytic performance of CoMnO, catalysts for CO hydrogenation
3.1 Introduction 63
3.2 Catalyst preparation and pretreatment 67
3.3 Effect of preparation conditions 67
3.3.1 Effect of constant and variable pH on the coprecipitation of CoMnOx 67
3.3.1.1 Catalyst preparation at constant pH 67
3.3.1.1.2 Results 69
3.3.1.1.2.1 Testing results of catalysts calcined in different furnaces 69
3.3.1.1.2.2 Characterization for catalysts calcined in different furnaces 70
(i) BET 70
(ii) XRD 70
3.3.1.2 Catalyst preparation at variable pH 71
3.3.1.2.1 Results 72
3.3.1.2.1.1 Testing results of catalyst prepared at variable pH 72
Contents
3.3.1.2.1.2 Characterization of catalyst prepared at variable pH 73
(i) XRD 73
(ii) BET 74
3.3.2 Effect of variation of metal ratios (Co and Mn) 74
3.3.2.1 Results 74
3.3.2.1.1 Testing results of catalysts prepared with variation of metal ratios (Co: Mn) 74
3.3.2.1.2 Characterization of catalysts prepared by variation of metal ratios (Co: Mn) 76
(i) BET 76
(ii) XRD 76
3.3.3 Effect of temperature variation 77
3.3.3.1 Results 78
3.3.3.1.1 Testing results of catalysts prepared by variation of temperature 78
3.3.3.1.2 Characterization of catalysts prepared by variation of temperature 79
(i) XRD 79
(ii) BET 80
3.3.4 Effect of pH variation 81
3.3.4.1 Results 81
Contents
3.3.4.1.1 Testing results of catalysts prepared by variation of pH 81
3.3.4.1.2 Characterization of catalysts prepared by variation of pH 82
(i) BET 82
(ii) XRD 82
3.3.5 Effect of variation of precipitating agents 83
3.3.5.1 Results 83
3.3.5.1.1 Testing results of catalysts prepared by variation of precipitating agents 83
3.3.5.1.2 Characterization of catalysts prepared by variation of pH 85
(i) XRD 85
(ii) BET 86
(iii) SEM 87
3.3.6 Effect of variation of ageing time 88
3.3.6.1 Results 88
3.3.6.1.1 Testing results of catalysts prepared by variation of ageing time 88
3.3.6.1.2 Characterization of catalysts prepared by variation of ageing time 90
(i) XRD 90
(ii) BET 91
vi
Contents
(iii)XPS 91
(iv) SEM 92
(v) TPR 93
3.3.70ptimum preparation conditions 95
3.4. Effect of reaction conditions 95
3.4.1 The influence of reaction temperature 96
3.4.2 The influence of reaction pressure 98
3.5 Conclusion 100
3.6 References 102
Chapter 4: The influence of metal promoters in the 106
hydrogenation of carbon monoxide using cobalt manganese oxide catalysts
4.1 Introduction 106
4.2 Experimental 109
4.3 Potassium (K) 110
4.3.1 Results 110
4.3.1.1 Catalytic activity results 110
4.3.1.2 Characterization of catalysts promoted with potassium 112
Contents
(i) BET 112
(ii) XRD 113
(iii)SEM 114
4.3.2 Mechanism of promoter (K) action 115
4.4 Ruthenium (Ru) 116
4.4.1 Results 117
4.4.1.1 Catalytic activity results 117
4.4.1.2 Characterization of catalyst promoted with ruthenium 120
(i) BET 120
(ii) XRD 121
4.5 Primary alcohols selectivity 122
4.6 Conclusion 123
4.7 Future work 123
4.8 References 125
Chapter 5: Fischer Tropsch Synthesis on activated carbons 129
combined with cobalt/iron and manganese; the effect of preparation and reaction
conditions on CO hydrogenation
5.1 Introduction 129
Contents
5.2 Experimental 132
5.3 Results 130
5.3.1 Co/Mn supported on wood and peat derived activated carbons 133
5.3.1.1 Catalytic testing results of Co/Mn supported on wood and peat 133
activated carbons
5.3.1.2 Characterization of Co/Mn supported on wood derived activated carbon 135
(i) BET 135
(ii) XRD 135
(iii) SEM 136
(iv)EDX 138
5.3.2 Co/Mn/C (wood and peat derived) by co-precipitation method 138
5.3.2.1 Results 139
5.3.2.1.1 Catalytic testing results 139
5.3.2.1.2 Characterization of Co/Mn precipitated with peat and wood derived carbons 140
(i) XRD 140
(ii) BET 141
5.3.4 Iron/manganese/carbon (wood and peat derived) 141
Contents
5.3.4.1 Results 143
5.3.4.1.1 Testing results 143
5.3.4.1.2 Characterization of Fe and Mn precipitated with peat and wood 143
derived carbons
(i) XRD 143
(ii) BET 144
5.4 Conclusion 145
5.5 Future work 146
5.6 References 147
Chapter 6: An investigation of synthesis of higher alcohols 149
from syngas using modified molybdenum sulphide catalyst
6.1 Introduction 149
6.2 Alkali-doped molybdenum sulfide based catalysts 150
6.3 Experimental 152
6.4 Results on C0 -M0 S2 based catalyst system 153
6.4.1 Catalytic testing results 153
6.5 Effect of metal promoters on catalytic performance of C0 M0 S2 156
6.5.1 Experimental 157
Contents
6.5.2 Results 157
6.5.2.1 Catalytic testing results 157
6.5.2.2 Characterization of C0 M0 S2 doped with various metal promoters 161
(i) XRD 161
(ii) BET 162
(iii) SEM 162
6.6 Conclusions 164
6.7 Future work 165
6.8 References 166
Chapter 7: Conclusions 172
Appendix 176
Appendix 1: Single bed reactor 177
Appendix 2: High pressure reactor for alcohols synthesis 178
Appendix 3: Product analysis of catalysts tested in single bed and 181
high pressure alcohol reactors
Appendix 4: Six bed reactor 182
Appendix 5: Data evaluation 184

Contents
Appendix 6: Product Analysis of catalysts tested in 6-bed reactors 192
List of Tables
LIST OF TABLES
Table 1.1: Syngas generation processes 7
Table 1.2: Maximum yield of C„ products from Sculz-Flory distribution 9
Table 1.3: Typical product selectivity of various FT catalysts 20
Table 1.4: Overview of the promotion effects displayed by the different elements 26
reported in literature for the Co- Fischer-Tropsch catalytic performances
Table 2.1: Reagents used in catalyst preparation 43
Table 3.1: CO hydrogenation over CoMnOx catalysts calcined in two 69
different furnaces
Table 3.2: CO hydrogenation over a CoMnOx catalyst prepared by variable 72
pH method
Table 3.3: CO hydrogenation of catalysts prepared with different ratios of metals 75
Table 3.4: Surface area analysis of catalysts prepared with different ratios of metals 76
Table 3.5: CO hydrogenation of catalysts prepared at different temperatures 78
Table 3.6: Surface area analysis of catalysts prepared at different temperatures 80
Table 3.7: CO hydrogenation of catalysts prepared by variation of pH 81
Table 3.8: Surface area analysis of catalysts prepared by variation of pH 82
Table 3.9: CO hydrogenation of the catalysts prepared with different precipitants 84
Table 3.10: BET surface areas of catalysts prepared with different precipitants 86
List of Tables
Table 3.11: CO hydrogenation of catalysts aged for different time intervals 89
Table 3.12: BET of aged catalysts (0 to 5h) 91
Table 3.13: XPS results of aged samples 92
Table 3.14: TPR profile of CoMnOx catalyst 94
Table 3.15: Influence of reaction temperature on CoMnOx catalyst 96
Table 3.16: Influence of reaction pressure of syngas on CoMnOx catalyst 100
Table 4.1: CO hydrogenation over CoMnOx promoted with various concentrations 111
of potassium
Table 4.2: Surface area of catalysts promoted with potassium 112
Table 4.3: CO hydrogenation over CoMnOx doped with Ru 117
Table 4.4: Surface area of catalysts promoted with ruthenium 120
Table 5.1: Catalytic testing results of Co/Mn with wood and peat derived carbon 134
Table 5.2: Elements observed on activated carbon on EDX in order of abundance 138
Table 5.3: Elements observed on supported Co/Mn/C on EDX in order of abundance 138
Table 5.4: Catalytic testing results of Co/Mn with wood and peat derived carbon 139
Table 5.5: Catalytic testing results of Fe/Mn combined with wood derived carbon 143
Table 6.1: Comparison of CO hydrogenation over Co-MoS2/K2C0 3 /clay/lubricant 154
catalyst (previous and present)
xiv

List of Tables
Table 6.2: CO hydrogenation over Co-MoS2+Ni, Ti, Zr/K^COa/clay/lubricant 158
catalyst
Table 6.3: BET surface areas of C0 M0 S2 doped with various metals 162
xv
List of Figures
LIST OF FIGURES
Figure 1.1: FT reactor types a) Tubular fixed bed reactor; b) Circular fluidized bed 12
reactor; c) Fixed fluidized bed reactor; d) Slurry reactor
Figure 1.2: The hydroxy-carbene mechanism 16
Figure 1.3: The CO insertion mechanism 17
Figure 2.1: Diagram of a gas chromatograph system 51
Figure 2.2: X-Ray beams on a crystal 56
Figure 2.3: Schematic representation of single bed reactor 177
Figure 2.4: Schematic representation of high pressure reactor 179
Figure 2.5: Flow diagram of single bed reactor and high pressure alcohols reactor 180
Figure 2.6: Flow diagram of one set of 6-bed reactors 183
Figure 3.1: XRD pattern of catalysts calcined in a) muffle furnace b) tube furnace 71
Figure 3.2: XRD pattern for catalyst prepared by variable pH method 73
Figure 3.3: XRD pattern for the catalysts prepared with different ratios of metals 77
Figure 3.4: XRD pattern for the catalysts prepared at different temperatures 80
Figure 3.5: Comparison of catalysts prepared by variation of pH 83
Figure 3.6: XRD comparison of catalysts prepared with different precipitants 86
xvi
List of Figures
Figure 3.7: SEM of the catalysts prepared with different precipitants 87
Figure 3.8: Comparison of XRD of catalysts aged at different time intervals 90
Figure 3.9: SEM image of catalysts aged for different time intervals 92
Figure 3.10: TPR profile of CoMnOx catalyst 94
Figure 4.1: XRD comparison of catalysts promoted with potassium 113
Figure 4.2: SEM images of CoMnOx catalyst promoted with potassium 114
Figure 4.3: Effect of ruthenium promoter on selectivity of hydrocarbons 118
Figure 4.4: XRD comparison of catalyst promote with ruthenium 121
Figure 5.1: XRD comparison of CoMnOx with Co/Mn supported on wood 136
and peat carbons
Figure 5.2: SEM images of wood and peat carbons 136
Figure 5.3: SEM images of Co/Mn supported on wood and peat carbons 137
Figure 5.4: XRD comparison of Co/Mn precipitated with wood 141
and peat carbons
Figure 5.5: XRD comparison of Fe/Mn catalysts precipitated with wood 144
and peat carbons
Figure 6.1: Time online data of CO hydrogenation on C0 M0 S2 catalyst 155
Figure 6.2: XRD comparison of C0 M0 S2 doped with various metals 161
Figure 6.3: SEM images of C0 M0 S2 and doped C0 M0 S2 with various metals 162
xvii
List of abbreviations
LIST OF ABBREVIATIONS
BET - Brunaur, Emmett, Teller (surface area)
EDX - Energy Dispersive X-ray Spectroscopy
FID - Flame Ionization Detector
FT - Fischer-Tropsch Synthesis
GHSV - Gas Hourly Space Velocity
SEM - Scanning Electron Microscopy
SF - Sulz-Flory Distribution
TCD - Thermal Conductivity Detector
TPR - Temperature Programme Reduction
XPS - X-ray Photoelectron Spectroscopy
XRD - X-ray Powder Diffraction
xviii
Chapter 1
Chapter 1
Introduction
1.1 Aims and Objectives
The objective of this research project was synthesis of high value products from the
reaction of synthesis gas over a suitable catalyst.
Fischer-Tropsch (FT) products consist of mixture of low and high molecular weight
products. A large amount of resources is used in the separation of products formed in F-T
reaction. Therefore synthesis of a catalyst with an improved selectivity for high value
products is of commercial importance. High molecular weight waxes can be
hydrocracked down to valuable products. The market for the speciality wax products is
small compared to the markets for lubricant based oils and very much smaller than the
1
Chapter 1
market for distillates that are produced by hydrocracking the wax. Medium molecular
weight products can be used as liquid transport fuels. Low molecular weight products can
be divided into low and high value products. Methane is a highly favourable product in
Fischer Tropsch (F-T) reaction and can be obtained in 100% selectivity. But it is of minor
value and is sold as town gas. Low molecular weight (C2-C4) olefins are extremely useful
products for petrochemical industiy and can also be oligomerized to a very good quality
diesel. The market for the use of ethane and propane to produce plastics in petrochemical
industry is large. They command significantly higher prices than fuels. Butene is also
useful petrochemical feed stock. C3 together with the C4 paraffins may be sold as
liquefied petroleum gas. In addition to hydrocarbons, various oxygenated products are
formed in FT reaction. Alcohols are considered as potential substitute for motor fuels
because of their environmental friendly behaviour.
Initial development of catalyst in the present study was based on findings of Hutchings et
al. [1-4] using CoMnOx catalyst for synthesis of hydrocarbons. Further some studies were
done for alcohols formation using C0 M0 S2 catalyst.
1.2 Heterogeneous Catalysis
Heterogeneous catalysis has influenced our lives greatly in the 20th century. In 1908, the
German chemist Fritz Haber succeeded in synthesizing ammonia by feeding N2 and H2 at
high pressure over an osmium catalyst. Carl Bosch and Alwin Maittasch picked this
discovery and tested over 2500 different materials until they found an iron-based
compound active enough to serve as a commercial catalyst. The Haber-Bosch ammonia
2
Chapter 1
synthesis has become an important chemical process worldwide through which nitrogen
fixation provided mankind with a much-needed fertilizer.
In 1930s there was development of three important types of refinery catalysts, for
hydrocarbon cracking, alkylation and dehydrogenation. Heterogeneous catalysis played a
major role in warfare, using new cracking and alkylation catalysts. The Allied forces
produced higher octane aviation fuel which gave their aircraft superior performance over
the Messerschmitt in the famous battle of Britain.
Another important catalytic process which emerged was the Fischer-Tropsch synthesis.
Germany and Japan had an abundance of coal, but no reliable source of petroleum. The
Co/Fe-catalyzed Fischer-Tropsch process converted coal to syngas. Further reaction of
syngas gave a liquid mixture which was rich in C5-C11 olefins and paraffins. South Africa
also used this process for converting coal to compensate for its shortage of a petroleum
supply. Fischer Tropsch-type processes are now back in demand as governments seek
sulfur-free fuels and alternatives to petroleum [5].
1.3 History of Fischer-Tropsch (FT) reaction (CO hydrogenation)
The history of this process started in early 1900s, when Sabatier and Senderens
discovered that synthesis gas (CO/H2) can be converted to methane over reduced cobalt
and nickel catalysts at atmospheric pressure and temperatures from 200 to 300°C [6].
Badische Anilin and Soda Fabrik (BASF) followed this work in 1913. They took out two
patents [7] on the synthesis of oxygenates using cobalt and osmium catalysts at high
pressure. In 1923 Franz Fischer and Hans Tropsch of the Kaiser Wilhelm Institute at
Ruhr discovered that alkalized iron catalysts at high pressure (100 to 150 atmospheres
3
Chapter 1
and 400 to 450°C) can produce an oily liquid mixture consisting of oxygenated
compounds [8 ]. The same catalyst was reported to be active for the production of linear
hydrocarbons at low pressure, but these catalysts deactivated rapidly [9, 10] and a search
was started for an improved catalyst. Fischer and Tropsch observed an enhancement in
the selectivity of hydrocarbons by using a combination of iron and zinc oxide [1 1 , 1 2 ].
This discovery started an intensive research for metal catalysts for the production of
commercial Fischer Tropsch catalyst which is active at low pressure. Early results
showed that high pressure was unsuitable for the synthesis of higher hydrocarbons so the
catalytic tests were conducted at low pressures. The choice of atmospheric operating
pressures were satisfactory for cobalt and nickel catalysts but was not suitable for iron
catalysts which operate best in the range 7-30 atmospheres. As a result, the development
of practical iron catalysts was delayed for many years. Initial experiments showed that
nickel was unsuitable because of its rapid deactivation and high methanation reaction.
Later this research was switched to cobalt because of the poor yields and rapid
deactivation trends of iron catalyst. In 1934 Ruhrchemie AG achieved the first Fischer -
Tropsch plant license using a cobalt thorium oxide catalyst. Eighteen plants were licensed
for this process in Germany, Japan, France and Manchuria until 1945 in order to
supplement limited petroleum resources. World War II destroyed most of the German
plants and the remainings were forced to shut down for several years. At that time there
was a decline of interest in the Fischer - Tropsch process in Europe because of an
increase in coal prices. After World War II a programme was funded by U.S.Bureau of
mines because of the fear for the shortage of petroleum. Various test facilities were
constructed by using the reports from German plants. Fixed bed reactors were developed
4
Chapter 1
by two German firms, Ruhrchemie and Lurgi (Arbeitgemeinschaft), using a precipitated
iron catalyst. This catalyst was aimed to produce high yield of waxes. Later several
companies in USA developed fluidized bed reactors (Standard Oil and Hydrocarbon
Research Inc.) with Kellogg Co. with a circulating entrained catalyst version of the
reactor [13]. Interest in these processes was decreased by the discovery of immense
reserves of petroleum in Middle East in later 1940s and mid 1950s. The plants in US
could not compete with the low oil price and were subsequently closed [14].
The most important event in further developments of coal liquefaction was
commissioning of a plant in 1955 by South African Coal, Oil and Gas Corporation
(SASOL). This plant has been in commercial operation ever since. The plant incorporated
both the fixed bed (Arbeitgemeinschaft) reactors and Synthol reactors (Kellogg). Iron
based catalysts along with various promoters are used in both reactors.
In 1973, the OPEC embargo increased oil prices and it was realized that crude oil
supplies could become limited in future. This realization renewed an interest in synthetic
fuel and coal along with other alternatives like wind, water, solar, geothermal and nuclear
resources. A lot of effort was put into researching the Fischer-Tropsch synthesis process
which already existed as a proven method for the synthesis of fuels and chemicals from
coal. The United States exerted a leading role in this research. In 1981, the investment in
synfuel research in the US began to suffer and declined to a minimal level in late 1980s.
Other nations reduced their investments in alternative energy resources. However, there
has been a renewal of interest in the Fischer - Tropsch reaction after the current Gulf oil
crisis.
5
Chapter 1
The Fischer - Tropsch process is an indirect method for the formation of products using
synthesis gas (derived from coal). Coal can be converted into liquid fuels and chemicals
using various direct methods e.g. Pyrolysis (coal decomposition to liquids) and the
Bergius hydrogenation reaction (where hydrogen gas and an organic solvent are reacted
with the coal to produce methane and liquid hydrocarbons). It has been estimated that
80% of the global energy consumption depends on fossil fuels, which include oil, natural
gas and coal. These fuels are unsustainable and estimated availabilities at current rate of
production are: 40 years for oil, 65 years for natural gas and 155 years for coal. In
contrast to the limited resources, world demands for energy, particularly for oil, are
increasing markedly because of the growing population and the world development.
More than 60% of the oil is consumed in the transportation sector in forms of gasoline,
diesel and jet fuel. The transportation industry is expected to remain highly dependent on
oil in the future [15]. The limited natural reserves of oil will drive the world rapidly to
peak production and consumption, after which a permanent shortage of oil can be
expected. Hence, an alternative route for generating transportation fuel is highly desirable.
The Fischer Tropsch (FT) process is one of the processes that are being developed [16] to
offer a solution to this problem. The quality of the feed products formed along with a
non-crude oil feedstock suggests the FT process should play an important role in the
worldwide energy supply in the coming decades [17]. The FT synthesis for the CO
hydrogenation to linear C2+ hydrocarbons continues to attract considerable research
attention [18].
6
Chapter 1
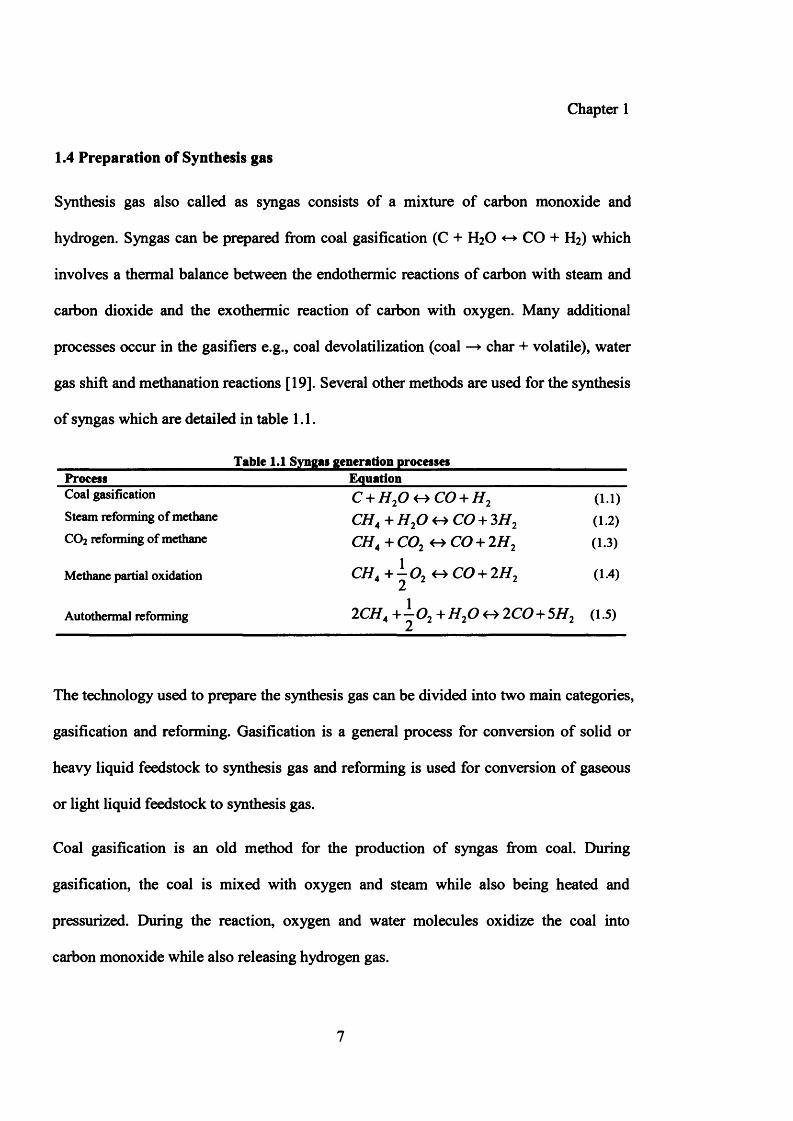
1.4 Preparation of Synthesis gas
Synthesis gas also called as syngas consists of a mixture of carbon monoxide and
hydrogen. Syngas can be prepared from coal gasification (C + H2O <-► CO + H2) which
involves a thermal balance between the endothermic reactions of carbon with steam and
carbon dioxide and the exothermic reaction of carbon with oxygen. Many additional
processes occur in the gasifiers e.g., coal devolatilization (coal —► char + volatile), water
gas shift and methanation reactions [19]. Several other methods are used for the synthesis
of syngas which are detailed in table 1 .1 .
Table 1.1 Syngas generation processesProcess EquationCoal gasification C 4- H 2O CO + H 2 (1.1)Steam reforming of methane CH4 + H20 CO + 3H2 ( 1.2 )CO2 reforming of methane CHA+C02 <r*C0 + 2H2 (1.3)
Methane partial oxidation CH4+ ^ 0 2 < ^C 0 + 2H2 (1.4)
Autothermal reforming 2CH4 + ^ 0 2+H20<-> 2CO + 5H2 (1.5)
The technology used to prepare the synthesis gas can be divided into two main categories,
gasification and reforming. Gasification is a general process for conversion of solid or
heavy liquid feedstock to synthesis gas and reforming is used for conversion of gaseous
or light liquid feedstock to synthesis gas.
Coal gasification is an old method for the production of syngas from coal. During
gasification, the coal is mixed with oxygen and steam while also being heated and
pressurized. During the reaction, oxygen and water molecules oxidize the coal into
carbon monoxide while also releasing hydrogen gas.
7
Chapter 1
Steam reforming of hydrocarbons is the dominating process for the production of
hydrogen and carbon monoxide. Steam reforming is often used in combination with
various and oxygen or air-blown partial oxidation processes for production of synthesis
gas.
1.5 Product distribution
Low selectivity to the desired products is the limitation of F-T reaction. Product
distribution from CO hydrogenation has been explained through various theoretical
models which can fit and rationalize the distribution of products obtained from F-T
catalysts [20-22]. These theoretical models are based on the following assumptions:
(1) Chain growth proceeds via a polymerization process, with growth occurring
predominantly in single- carbon increments. (2) The probabilities of increase in chain
length and of termination are independent of the length of the oligomer chain attached to
the surface. Anderson [23] has derived an analytical function which is similar to the
distribution function derived by Schulz and Flory. Anderson - Schulz - Flory (ASF)
equation was based on the assumption that the FT synthesis is a polymerization process
[24].
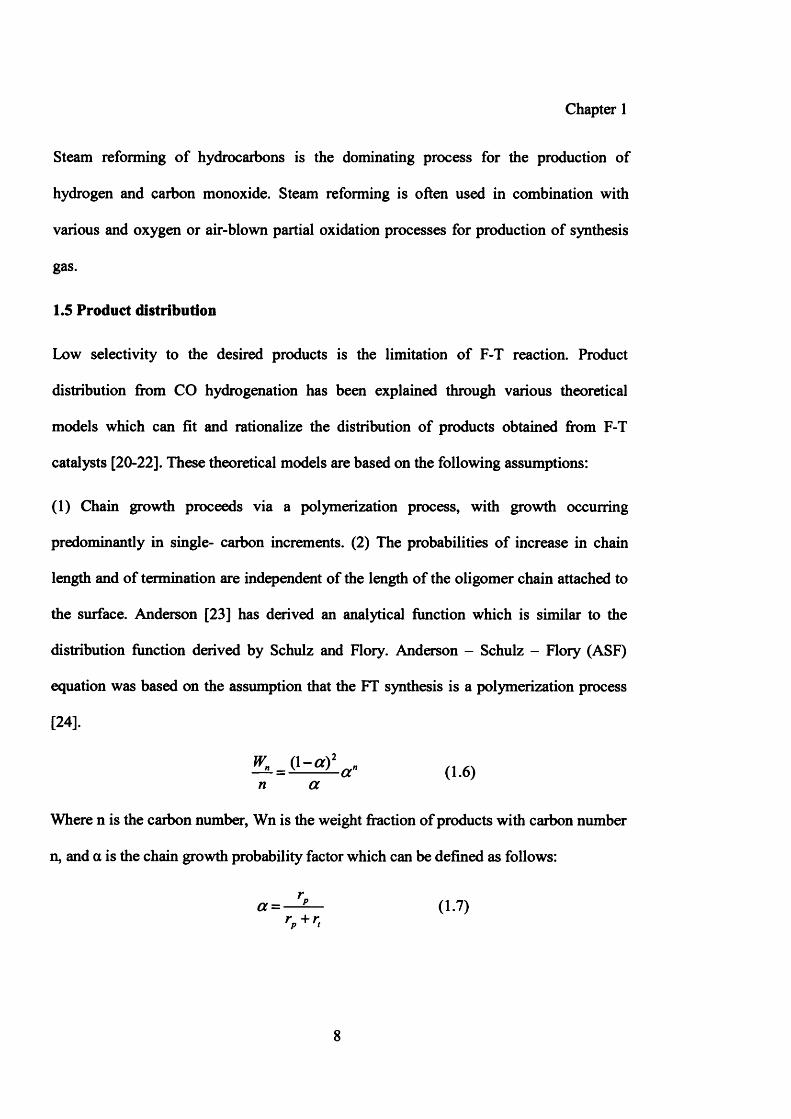
(1.6)n a
Where n is the carbon number, Wn is the weight fraction of products with carbon number
n, and a is the chain growth probability factor which can be defined as follows:
(1.7)
8
Chapter 1
Where rp and rt are the rate of chain growth and rate of chain termination respectively.
Both rates are controlled by the reaction conditions and catalyst type. Typical ranges of a
on Ru, Co and Fe catalysts were reported as 0.85 - 0.95, 0.70 - 0.80, and 0.50 - 0.70
respectively by Dry [24]. The higher the value of a, the longer the chain length is.
For practical reasons, equation (1.6 ) is often re-written as:
log— = n log a + log—— (1 .8 ) n a
WA plot of log—-~ n is the well-known Schulz-Flory diagram. That gives a linear graph n
with a slope of log a .
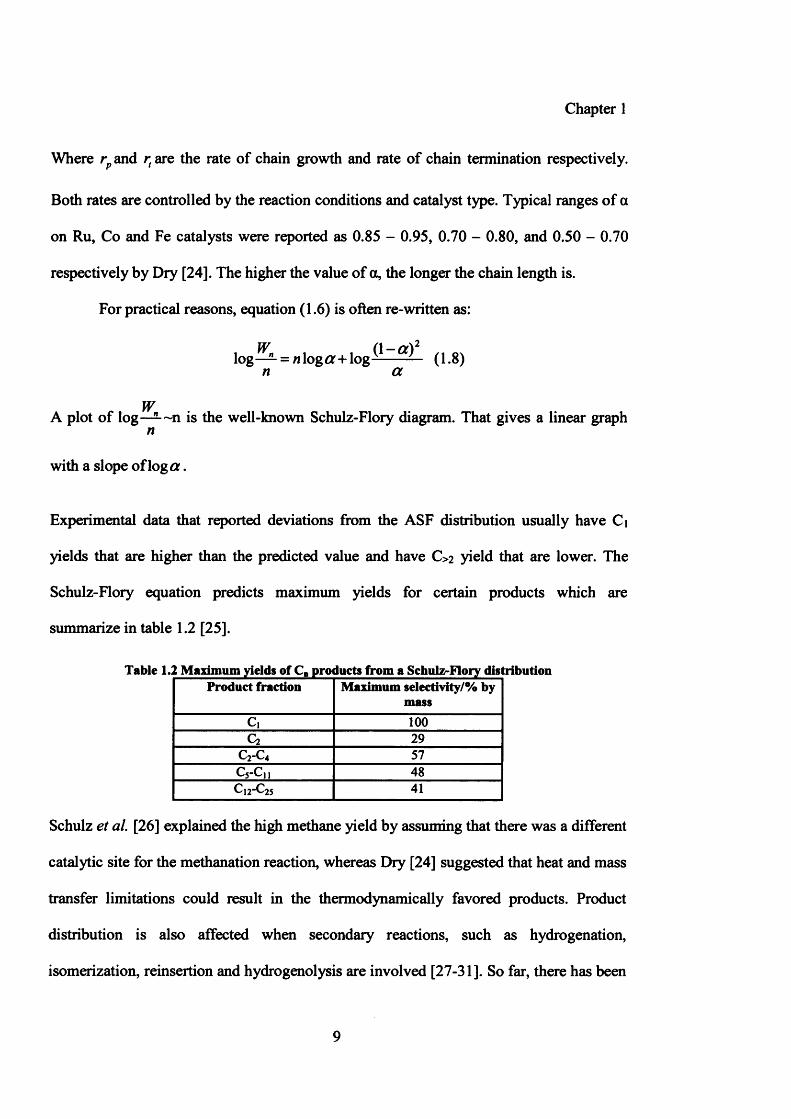
Experimental data that reported deviations from the ASF distribution usually have Ci
yields that are higher than the predicted value and have C>2 yield that are lower. The
Schulz-Flory equation predicts maximum yields for certain products which are
summarize in table 1.2 [25].
Table 1.2 Maximum yields of C„ products from a Schulz-Flory distributionProduct fraction Maximum selectivity/% by
massc , 100Q 29
C2-C4 57C5-C11 48C12-C25 41
Schulz et al. [26] explained the high methane yield by assuming that there was a different
catalytic site for the methanation reaction, whereas Dry [24] suggested that heat and mass
transfer limitations could result in the thermodynamically favored products. Product
distribution is also affected when secondary reactions, such as hydrogenation,
isomerization, reinsertion and hydrogenolysis are involved [27-31]. So far, there has been
9
Chapter 1
no single model which could explain all the observed catalytic results. There is an
interdependence of selectivities and product distributions are mostly broad.
High selectivity to a single valuable product or narrow distribution of products is always
economical. Several attempts are being made in order to develop highly selective systems
for syngas conversion to fuels and chemicals. These efforts include modification of F-T
catalysts, reactor operating optimization and designs of reactors [32, 33].
1.6 Reactors used in FT synthesis
Design of reactors used in FT synthesis is very closely related to the highly exothermic
reactions. Poor removal of heat leads to a temperature built up inside the reactor, which
results in high selectivity towards methane. Capital cost for construction, ease of
operation, product separation and product selectivity are other important factors to be
considered during reactor built up for FT reaction.
There are three common types of reactors developed for FT synthesis: tubular fixed bed
reactor, fluidized bed reactor and slurry reactor.
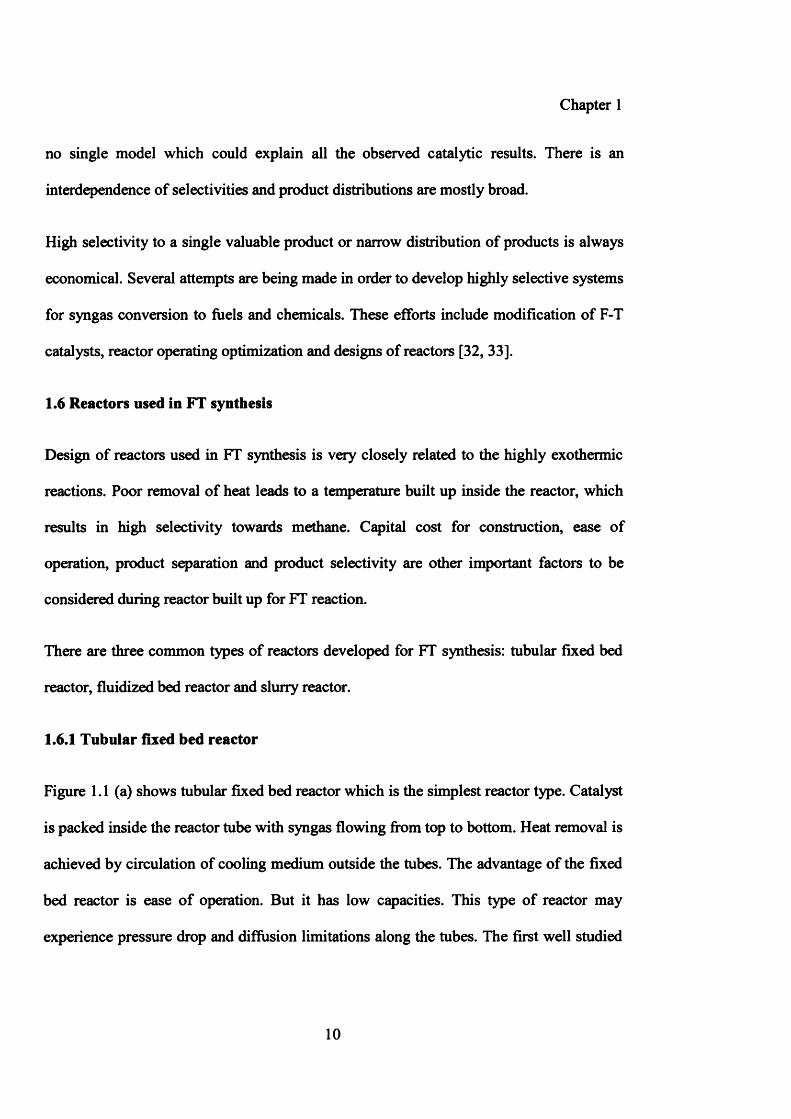
1.6.1 Tubular fixed bed reactor
Figure 1.1 (a) shows tubular fixed bed reactor which is the simplest reactor type. Catalyst
is packed inside the reactor tube with syngas flowing from top to bottom. Heat removal is
achieved by circulation of cooling medium outside the tubes. The advantage of the fixed
bed reactor is ease of operation. But it has low capacities. This type of reactor may
experience pressure drop and diffusion limitations along the tubes. The first well studied
10
Chapter 1
commercial reactor, SASOL Arge belongs to the tubular fixed bed reactor type. Shell’s
Middle Distillate Synthesis (SMDS) in Malaysia uses this reactor type.
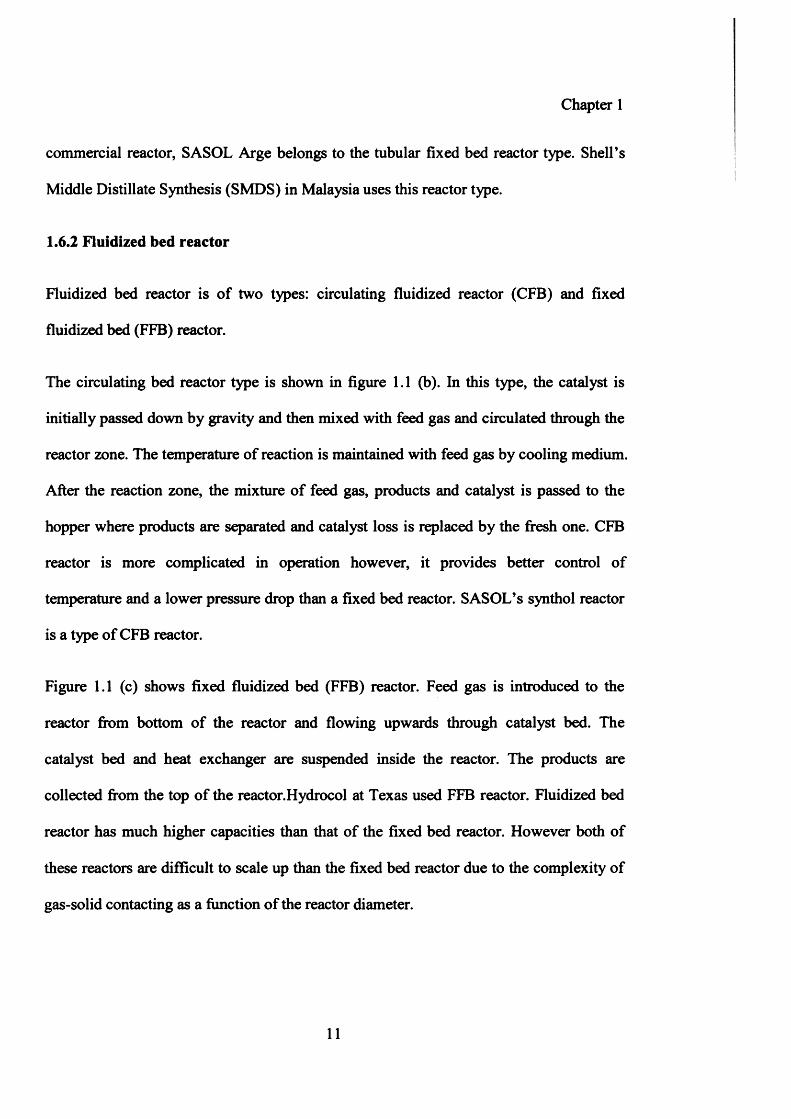
1.6.2 Fluidized bed reactor
Fluidized bed reactor is of two types: circulating fluidized reactor (CFB) and fixed
fluidized bed (FFB) reactor.
The circulating bed reactor type is shown in figure 1.1 (b). In this type, the catalyst is
initially passed down by gravity and then mixed with feed gas and circulated through the
reactor zone. The temperature of reaction is maintained with feed gas by cooling medium.
After the reaction zone, the mixture of feed gas, products and catalyst is passed to the
hopper where products are separated and catalyst loss is replaced by the fresh one. CFB
reactor is more complicated in operation however, it provides better control of
temperature and a lower pressure drop than a fixed bed reactor. SASOL’s synthol reactor
is a type of CFB reactor.
Figure 1.1 (c) shows fixed fluidized bed (FFB) reactor. Feed gas is introduced to the
reactor from bottom of the reactor and flowing upwards through catalyst bed. The
catalyst bed and heat exchanger are suspended inside the reactor. The products are
collected from the top of the reactor.Hydrocol at Texas used FFB reactor. Fluidized bed
reactor has much higher capacities than that of the fixed bed reactor. However both of
these reactors are difficult to scale up than the fixed bed reactor due to the complexity of
gas-solid contacting as a function of the reactor diameter.
11
Chapter 1
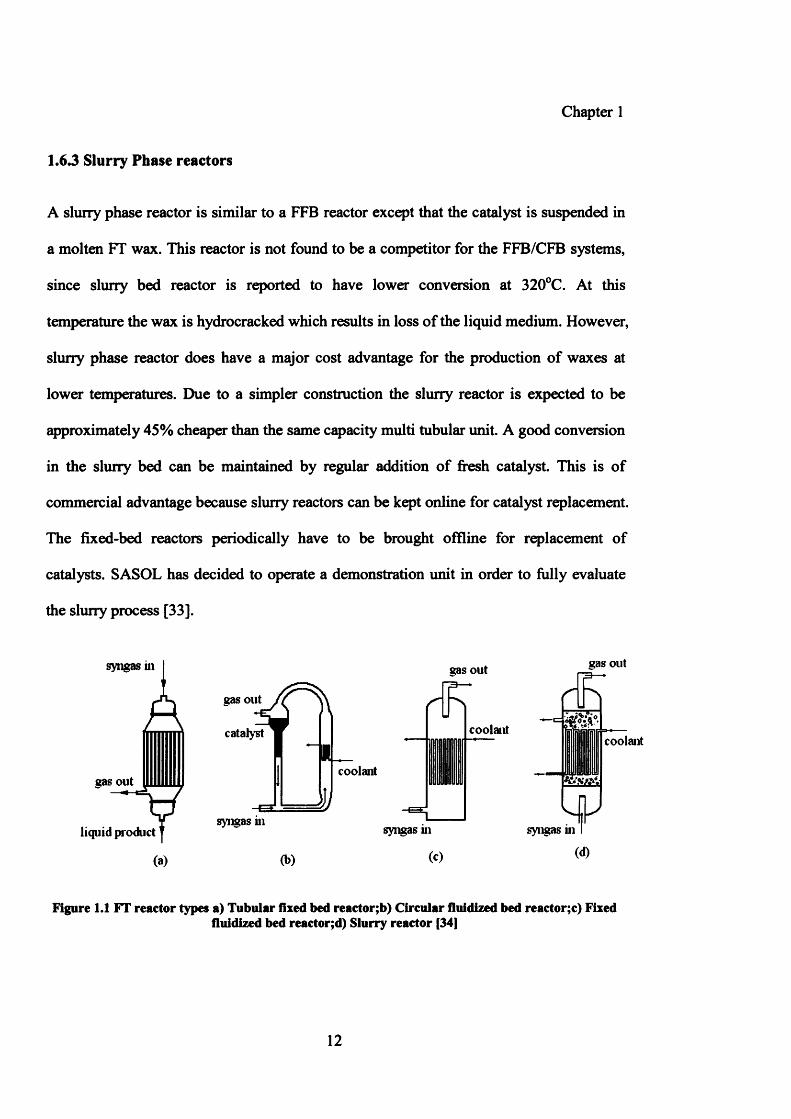
1.6.3 Slurry Phase reactors
A slurry phase reactor is similar to a FFB reactor except that the catalyst is suspended in
a molten FT wax. This reactor is not found to be a competitor for the FFB/CFB systems,
since slurry bed reactor is reported to have lower conversion at 320°C. At this
temperature the wax is hydrocracked which results in loss of the liquid medium. However,
slurry phase reactor does have a major cost advantage for the production of waxes at
lower temperatures. Due to a simpler construction the slurry reactor is expected to be
approximately 45% cheaper than the same capacity multi tubular unit. A good conversion
in the slurry bed can be maintained by regular addition of fresh catalyst. This is of
commercial advantage because slimy reactors can be kept online for catalyst replacement.
The fixed-bed reactors periodically have to be brought offline for replacement of
catalysts. SASOL has decided to operate a demonstration unit in order to fully evaluate
the slurry process [33].
syngas in
Agas out
Tliquid product T
(a)
gas out gas out
coolantcatalyst
coolant
syngas ui syngas m
(b) (c)
= kfc/i'o j i . *.<<•
coolant
Figure 1.1 FT reactor types a) Tubular fixed bed reactor;b) Circular fluidized bed reactor;c) Fixedfluidized bed reactor;d) Slurry reactor [34]
12
Chapter 1
1.7 CO Hydrogenation - Mechanism
The mechanism of the FT reaction involves the growth of hydrocarbons and oxygenates
from the interaction of intermediates derived from CO and H2 . Continuous interaction of
monomer with an oligomeric surface species causes chain growth and the final products
result from desorption of these species. The mechanism of FT reaction is very complex
because of a wide range of products. Various research groups have reviewed the
mechanism of hydrocarbon synthesis [16, 35, 36]. Several mechanisms have been
proposed for CO hydrogenation reaction which may compete with each other or run in
parallel. There are three mechanisms which have been agreed most commonly.
1.7.1 Carbide mechanism
Fisher and Tropsch proposed this mechanism first [37], where the synthesis proceeds by
the formation and hydrogenation of metal carbides to give methylene groups which can
subsequently be polymerized to yield a broad spectrum of hydrocarbons. This involves
dissociation of C-O bond prior to reaction with H2, which further operates by the
insertion of the CHX group of one M-CHX species into the M-C bond of another M-CHX
species. This can be presented as follows with simplicity.
CO— > M-CO— > M-C— > M—CHX— > polymerization
Carbide mechanism was supported by Metterties and Stein [38], Hermann [39] and Olive
[40] from homogeneous coordination theory. Laws and Puddephatt [41] have
demonstrated ethylene formation by coupling of two methylene groups on a Co cluster.
Evidence for CH2 migration insertion into an M-H bond comes from studies of Carter and
Goddard [42]. Saez et al. [43] have proposed mechanism for the formation of propene by
13
Chapter 1
bridging two methyles combined with another methyl group on a single Rh atom. These
results can provide support to carbide mechanism although the reaction conditions are
different compared with FT conditions. There is much evidence [44-46] in favour of the
carbide mechanism but it has several flaws. A direct hydrogenation of metal carbide
investigated by Kummer et a l [47] using labeled 14CO over reduced iron catalyst
challenged the carbide mechanism. Their results show that the carbide hydrogenation
could be responsible for no more than 8 - 30% of the methane formed. The carbide
mechanism could not explain the formation of oxygenated products which is a limitation
of carbide mechanism. It is a two or three dimensional polymerization model, with
surface carbides combining/inserting in random directions which would lead to larger
yield of branched products than observed. It can be concluded that the carbide
mechanism cannot fully explain the total product stream.
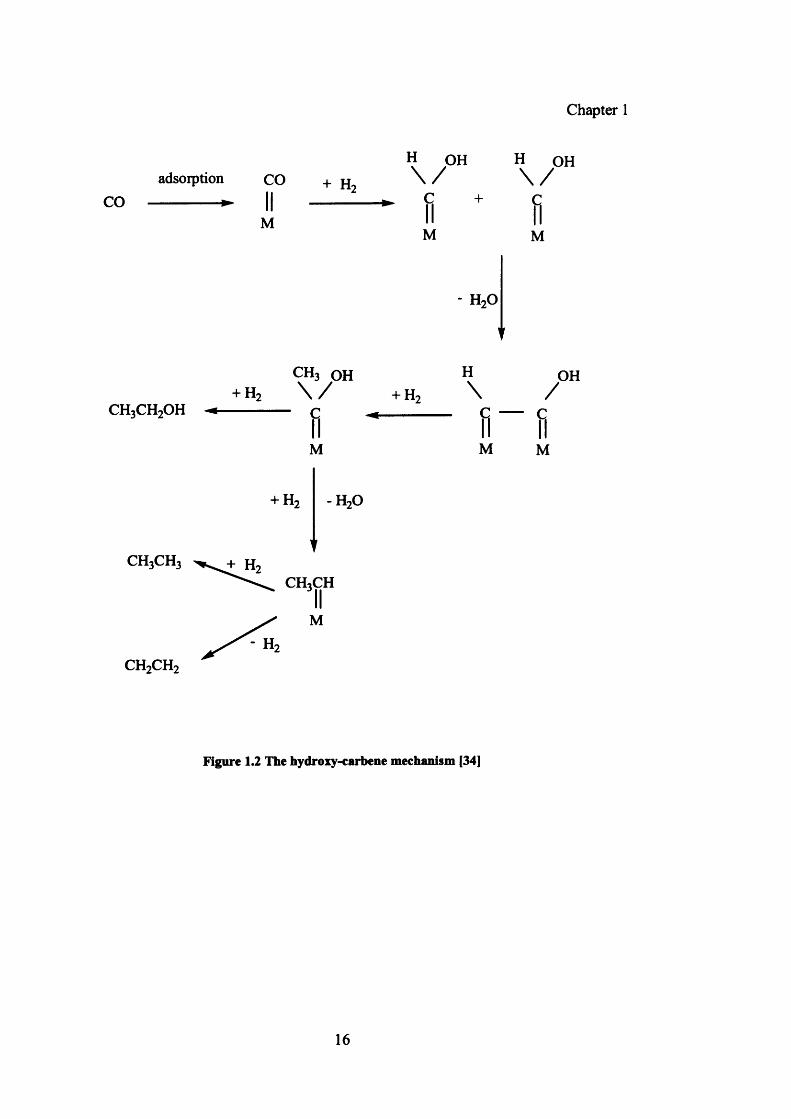
1.7.2 Hydroxycarbene mechanism
Emmett [48] developed an alternative to the carbide mechanism to explain the product
stream in detail. A similar mechanism was proposed by Storch et al. [49] where CO is
chemisorbed on the metal atoms without dissociation and C-C bond formation occurs by
hydroxylcarbene intermediate M-CHOH. The intermediate is formed by the interaction of
non-dissociatively adsorbed CO reacting with hydrogen. The intermediate takes part in
condensation leading to C-C bond formation and chain growth. Chain termination and
desorption of products takes place by hydrogenation of the intermediate to an alcohol.
One simple illustration of this mechanism is shown in figure 1.2.
14
Chapter 1
This mechanism can successfully explain the formation of oxygenates and branched
products. Various research groups have supported this mechanism [50-53].
Voevodskii [54] suggested a variation of hydroxycarbene mechanism. They proposed
formation of carbene species by the hydrogenation of hydroxycarbene intermediate,
which then reacted with CO to start chain growth. The mechanistic pathway of this
mechanism is illustrated as follows:
CO—►M=C=0—►M=CHOH—►M=CH2 -► M -CH2COI
m -c h 2c h o hi
Alcohols, hydrocarbons
Ekstroom and Lapswzewicz [55] postulated similar mechanism but the carbene
undergoes polymerization reaction as was proposed by the carbide mechanism.
CO—♦M=C=0—>M=CHOH—►M=CH2 -> Polymerization
15
Chapter 1
H OH H OH adsorption CO + jj \ / \ /
CO ------------------ II jj * (j
M MM
- h 2o
CH3CH2OH
c h 2c h 2
+ HoCH3 o h \ /
■ c+ H,
M
+ H' - h2o
c h 3c h 3 hch 3c h
H\
M
/OH
M
Figure 1.2 The hydroxy-carbene mechanism [34]
16
Chapter 1
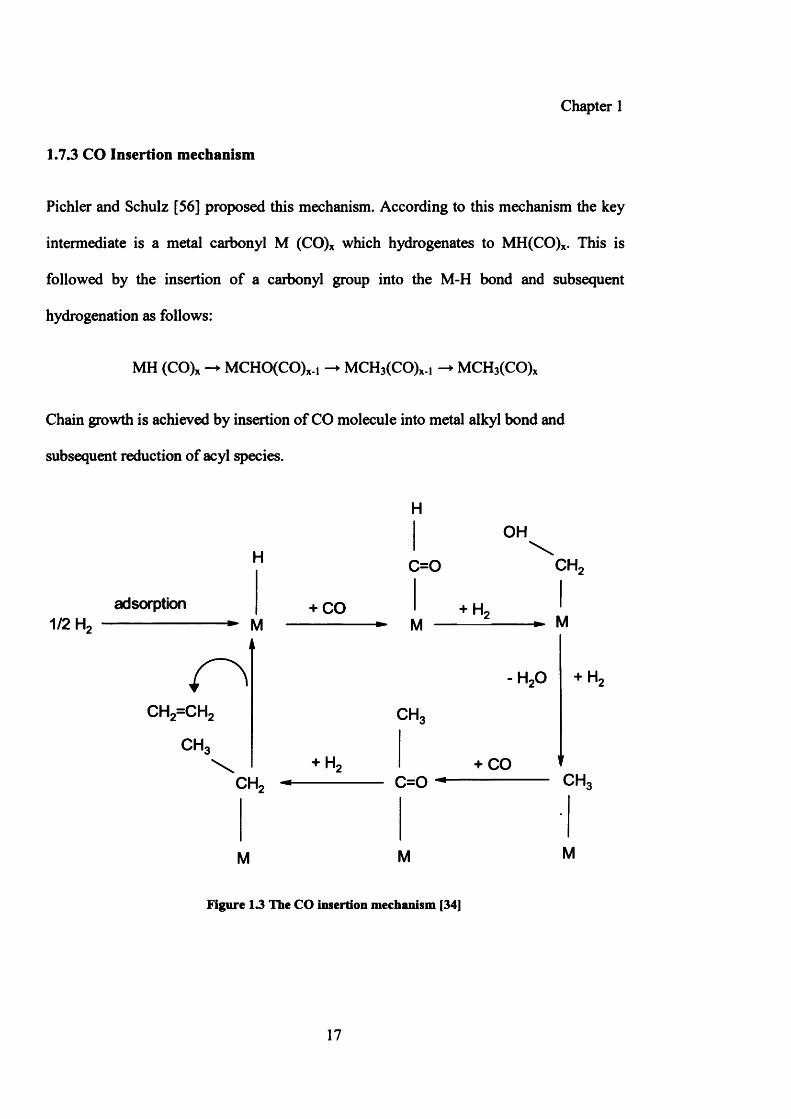
1.7.3 CO Insertion mechanism
Pichler and Schulz [56] proposed this mechanism. According to this mechanism the key
intermediate is a metal carbonyl M (CO)x which hydrogenates to MH(CO)x. This is
followed by the insertion of a carbonyl group into the M-H bond and subsequent
hydrogenation as follows:
MH (CO)x MCHO(CO)x.! -► MCH3(CO)x.i -> MCH3(CO)x
Chain growth is achieved by insertion of CO molecule into metal alkyl bond and
subsequent reduction of acyl species.
adsorption1/2 hi
H
M
c h 2=c h 2
CHo
Chi
M
+ CO
+ hi
H OH
C=0 CH,
M
O i
C=0
M
+ H.M
-HoO
+ CO
+ H,
CH,
M
Figure 13 The CO insertion mechanism [34]
17
Chapter 1
A large number of products can be obtained following desorption of intermediates. This
evidence is supported by various researchers [57-59].
Since the FT reaction is a very complicated catalytic reaction, these mechanisms only
provide some possibilities of different routes for the hydrogenation of carbon monoxide.
The ‘real’ mechanism of the CO hydrogenation could be a combination of these routes or
maybe is totally different.
1.8 Metal Catalysts used in Fischer - Tropsch (FT) Synthesis
Conversion of syngas into hydrocarbon products requires the presence of suitable metal
catalysts. Recent studies emphasize the importance of an active catalyst suitable for the
production of hydrocarbons from FTS [60]. The 3d and 4f transition metals (group VIII
metals) of the periodic table are particularly suitable for the chemisorption process of CO
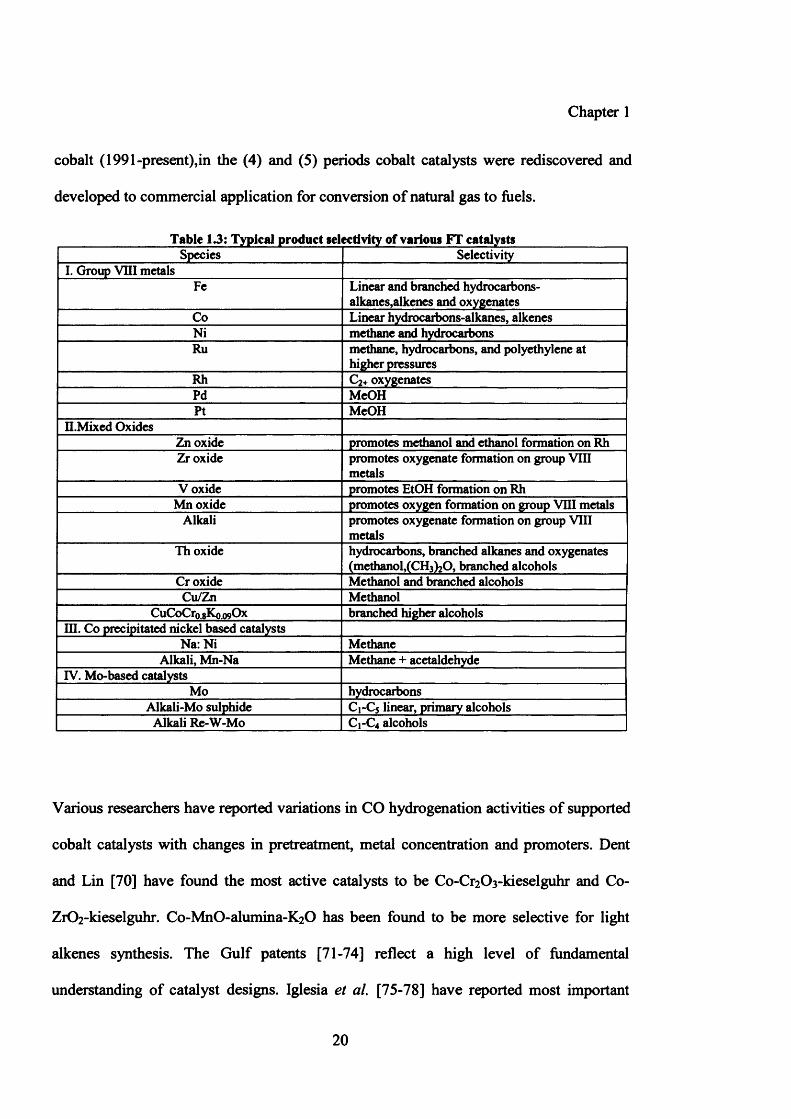
and H2 which is the first step of this reaction [61]. Selectivities of various FT catalysts are
compared in table 1.3 [62].
Almost all transition metals in group VIII can produce a wide range of products by CO
hydrogenation e.g. Pd, Ir, Rh, Os, Ni, Co, Fe, Ru and Pt can produce alcohols and various
hydrocarbons. The activity and selectivity of a certain metal catalyst depends on the
choice of promoters and supports along with suitable preparation and reaction conditions.
Iridium, platinum and palladium exhibit very slight activity and mostly produce alcohols.
Rhodium and osmium produce oxygen containing hydrocarbons at high temperatures
[63-66]. Ruthenium catalysts can produce paraffins of very high molecular weights. Fe,
Co, Ni and Ru are found to be suitable for the production of highest yields of
hydrocarbons. Unfortunately, Nickel is found to be unattractive for this process because
18
Chapter 1
of high selectivity to methane. Ru shows very good selectivity for valuable paraffinic
waxes but it has been found that world supplies of Ru for the operation of commercial
plant would be insufficient in near future. Iron catalyst shows more carburization
tendency compared with cobalt. Therefore, cobalt is found to be the most suitable metal
for F-T reaction.
Although cobalt is more expensive in comparison with iron but various factors make it
economically viable e.g. longer catalyst life time, higher catalytic activity and
reproducibility. Titanium, vanadium, chromium and manganese do not find application
as the basic metal in F-T catalysts because it is hard to reduce their oxides. But it is found
that these metal oxides are important components in F-T catalysts if used as promoters
[67-69].
1.9 Cobalt - as an FT catalyst
Cobalt catalyst for FT synthesis was first discovered about 90 years ago. Catalyst
technology has advanced from a simple oxide to highly active and highly optimized
cobalt catalysts along with various supports and promoters. Advances in cobalt catalyst
design can be conveniently discussed in five historical periods:
( 1) Discovery (1902-1928), when cobalt catalysts were established as the most active for
FT synthesis (2) Commercial development of cobalt and iron catalysts (1929-
1928) ,when commercial processes were developed in Germany (3) the iron age (1950-
1974),in this age iron catalysts were developed mainly in south Africa and very little
work focused on cobalt (4) rediscovery of cobalt (1975-1990) (5) GTL and the return to
19
Chapter 1
cobalt (1991-present),in the (4) and (5) periods cobalt catalysts were rediscovered and
developed to commercial application for conversion of natural gas to fuels.
Table 13: Typical product selectivity of various FT catalystsSpecies Selectivity
I. Group VIII metalsFe Linear and branched hydrocarbons-
alkanes,alkenes and oxygenatesCo Linear hydrocarbons-alkanes, alkenesNi methane and hydrocarbonsRu methane, hydrocarbons, and polyethylene at
higher pressuresRh C2+ oxygenatesPd McOHPt MeOH
H.Mixed OxidesZn oxide promotes methanol and ethanol formation on RhZr oxide promotes oxygenate formation on group VIII
metalsV oxide promotes EtOH formation on Rh
Mn oxide promotes oxygen formation on group VIII metalsAlkali promotes oxygenate formation on group VIII
metalsTh oxide hydrocarbons, branched alkanes and oxygenates
(methanol,(CI^O, branched alcoholsCr oxide Methanol and branched alcoholsCu/Zn Methanol
CuCoCr0.gK0.09Ox branched higher alcoholsIQ. Co precipitated nickel based catalysts
Na: Ni MethaneAlkali, Mn-Na Methane + acetaldehyde
IV. Mo-based catalystsMo hydrocarbons
Alkali-Mo sulphide C1-C5 linear, primary alcoholsAlkali Re-W-Mo C1-C4 alcohols
Various researchers have reported variations in CO hydrogenation activities of supported
cobalt catalysts with changes in pretreatment, metal concentration and promoters. Dent
and Lin [70] have found the most active catalysts to be Co-Cr2 0 3 -kieselguhr and Co-
Zr0 2 -kieselguhr. Co-MnO-alumina-K^O has been found to be more selective for light
alkenes synthesis. The Gulf patents [71-74] reflect a high level of fundamental
understanding of catalyst designs. Iglesia et al. [75-78] have reported most important
20
Chapter 1
advances from fundamental studies which lead to a better understanding of relationships
between activity and cobalt metal dispersion for supported cobalt catalysts, and effect of
precious metal promoters in enhancing reduction of cobalt at lower temperatures along
with effect of reaction and readsorption on product selectivity. Goodwin et al. [79-85]
have reported a relationship of catalysts activity with Zr, La, and Ru promoters.
Cobalt-based FTS catalysts are claimed to have the advantage of a higher conversion rate,
high selectivity to paraffins and longer life with considerably clean synthesis gas which
leads to higher production rate [8 6 -8 8 ]. Supported cobalt metal particles are known to be
very active FT synthesis catalysts, because of their high productivity for long chain
paraffins. Co-based FT catalysts are prepared usually by impregnation of a porous
support such as alumina, silica, titania, or more recently carbon with a solution of a cobalt
precursor salt [89-93]. The catalytic performance is known to be a function of both the
metal dispersion and the extent of reduction of the oxidic precursor species [94]. The
effect of ceria addition on the performance of lOwt. % Co catalysts supported on SiC>2
and AI2O3 for Fischer Tropsch synthesis has been investigated by Gheitanchi et al. [95].
With the addition of ceria, significant changes in CO conversion and hydrocarbon
selectivity are observed. Ceria addition with different loadings to cobalt catalysts
enhanced C5-C10 fraction and decreased methane selectivity. Liang et al. [96] have
reported high yields of light olefins using Co/Mn complex oxides prepared by sol-gel
method. Investigations of CO hydrogenation behaviour of iron and cobalt manganese of
catalysts indicate that the latter ones exhibit higher activities at lower temperatures with
lower methane and higher alkene yields. It has been shown by Ernst et al. [97] that the
addition of various amounts of cerium oxide modifies significantly the properties of
21
Chapter 1
Co/SiC>2 catalysts in Fischer Tropsch synthesis under pressure, it results in increase in
methanation and an orientation of the selectivity towards the C5-C13 fraction at the
expense of C22+ hydrocarbons while the activity remains almost the same. Addition of
Mn to Co catalysts facilitates the reduction of C0 3 O4 and also reduces its particle size
[98]. Martinez et al. [99] have suggested that a maximum CO conversion is found for the
sample with 30 wt. % Co loading supported on SBA-15, the addition of 1 wt. % Re
enhances the reducibility of cobalt oxides and increased the catalytic activity. Re also
favoured the formation of long chain n-parrafines (C10+) and decreased methane
selectivity. Effect of Co catalysts promoted by Ianthanum/Al2 0 3 is studied by Ladford et
al. [100] and this is concluded that, low La contents (up to La/Al = 0.013) promotion on
cobalt/alumina has little influence on activity and selectivity of the reduced catalyst in
CO hydrogenation. And catalysts with higher loadings of La show a decrease in TOF for
CO hydrogenation. And those catalysts prepared by reverse impregnation show a little
effect of La on the TOF for CO hydrogenation or selectivity to higher hydrocarbons and
olefins. Ernst et al. [101] have reported the effect of addition of cerium and lanthanum
metals on Co/Si0 2 catalysts. They have adopted sol-gel preparation technique. Addition
of cerium and lanthanum enhances methane selectivity along with increase in Cs+
selectivity and decrease in chain growth probability a. Singleton et al. [102] have
patented a highly stable cobalt/alumina catalyst doped with lanthanum oxide and barium
oxide (in the range of 1% and 5%) that has shown an improvement in thermal stability of
the catalyst and enhances the activity. Wanchun et al. [103] have patented a catalyst
comprising of cobalt, rhenium supported on titania along with boron and phosphorus for
the production of C12+ hydrocarbons. This has been observed that addition of a very small
22
Chapter 1
amount of phosphorus into cobalt supported catalysts increases CO conversion and C2 -
C4 selectivity and decreases the Cs+oil selectivity [104]. The effect of zirconia addition
has been studied by Moradi et al. [105]. They have reported an increase in selectivity of
higher hydrocarbons by loading zirconium on Co/Si0 2 catalyst.
Mazzone and Fernandes [106] have concluded after a detailed investigation of reaction
conditions that conversion of syngas increases with increase in H2 : CO ratio. As the H2 :
CO ratio approaches 2 the amount of syngas converted to hydrocarbons (FTS) and water
increases. As conversion increases, the water gas shift (WGS) reaction increases its rate
due to the production of more water by the FTS reaction. They have also reported that
hydrogen is responsible for the termination of hydrocarbon chains into paraffins.As such
an increase in the H2 :CO feed ratio will increase the partial pressure of H2 in the reaction
media and thus increases the termination rate into paraffins, reducing the amount of
olefins produced by the reaction. At low H2 : CO ratios, the fraction of olefins production
is at its maximum since the amount of hydrogen is small enough not to produce great
quantities of paraffins. As the H2 :CO ratio increases the termination into paraffin
increases and the ratio of olefin to paraffins tends to zero. An increase in the total
pressure reduces CO conversion and increases the hydrocarbon yield (about 2 to 25% for
each 10 atm increase). This happens because the rate of the FT reaction is directly
proportional to the total pressure; the rate of the WGS is not directly affected by the total
pressure, but coupled to the H2O partial pressure, which depends on the conversion level.
Wang et al. [107] have studied the influence of La loading on Zr-Co/activated carbon
catalysts for FTS. They have observed an increase in CO conversion from 86.4% to
23
Chapter 1
92.3% when low La loading (La=0.2 wt. %) was added into the Zr-Co/activated carbon
catalyst.
1.10 Catalyst Promoters
Catalyst promoters play an important role in obtaining a high selectivity to a single
product. Promoters are doping agents added to catalyst materials in small amounts in
order to improve their activity and selectivity [108]. Promoter elements can be divided
into two types on the bases of their action. Structural Promoters affect the formation and
stability of the active phase of a catalyst material. Metal oxides which are difficult to
reduce belong to this category, e.g., AI2O3, TI1O2 and MgO [67, 109]. Second type is
Electronic promoters which directly affect the elementary steps involved in each turnover
on the catalyst. Electronic promoters affect the local electronic structure of an active
metal mostly by adding or withdrawing electron density near the Fermi level in the
valence bond of the metal. This results in a modification of the chemisorption properties
of active metal.
The main function of structural promoters is to affect the dispersion of cobalt on support
[108]. A high Co dispersion results in a high active Co metal surface and an improved
catalytic activity. Structural promotion does not influence the product selectivity but it
may increase catalyst activity and stability. Promoter elements can be added to the
support oxide resulting in a decreased Co compound formation with the support oxide.
More specifically, the formation of cobalt nitrate, cobalt silicate or cobalt aluminate
should be avoided under reduction conditions. A related problem is the reduction in the
support surface area, specially a problem in the case of titania, where the anatase phase is
only stable under oxidative regeneration conditions from 400 to 750°C. The addition of Si,
24
Chapter 1
Zr and Ta as promoter elements may avoid surface collapse of the support. The catalytic
performance is known to be a function of both the metal dispersion and the extent of
reduction of the oxidic precursor species [1 1 0 ].
Some promoter elements can act as an oxidic interface between the supported Co particle
and the support oxide leading to an increased stability of cobalt particles against sintering
during reduction or oxidative regeneration. The addition of promoter elements may also
lead to increase in cobalt dispersion after preparation. In the absence of promoters,
relatively large cobalt crystals are formed, whereas, by addition of these additives,
smaller supported cobalt particles are made. Panpranot et al. [ I l l ] have mentioned that
small metal particles composed of a promoter element can dissociate hydrogen in the
neighborhood of a supported cobalt particle that leads to the formation of atomic
hydrogen which may spill over by diffusion to cobalt. This results in an increase in the
number of active sites and therefore a higher catalyst activity. Noble metals such as Re,
Pt and Ru are known to act in this manner. In contrast to structural promoters electronic
effects are less obvious to be detected. Electronic promotion can only occur when there is
a direct interaction between the promoter element and cobalt active surface. A beneficial
catalytic effect can be obtained if the deposited metal oxides are not blocking all the
active cobalt sites, which would lead to decrease in hydrogen or CO chemisorption. A
similar effect occurs with the support oxides which is generally known as the ‘strong
metal-support interaction’ or SMSI effect [108, 112, 113]. SMSI effect is observed in
metal supported catalysts. Due to the small particle size of catalytic components, their
interaction with the oxide support develops during all stages of catalyst preparation,
especially during thermal treatments (calcination, reduction). In most cases the adhesion
25
Chapter 1
forces between reduced metal particles and an oxide support are weak, implying surface
bonding through van der Walls forces only. It is expected, therefore that the support
exerts little influence on the catalytic and the adsorptive properties of small metal
particles. The net result of the SMS1 is a decrease in hydrogen chemisorption which
results in a decreased hydrogenation activity of the catalyst. This results in lower methane
and higher olefin yields in the F-T reaction, when compared to non-SMSI catalysts. This
effect has been reported by Hutchings et al. [114] and Kugler et al. [115] as well. Sizes of
metal particles on the catalyst support vary from cluster to a few atoms. Particle size has
a strong effect on the catalytic properties of metals. Small particles may have properties
which deviate from bulk metal surfaces [116, 117]. Bimetallic alloy formation may also
influence the activity and selectivity of Co FT catalysts. Depending on the promoter
element added to the cobalt cluster alloying might lead to an increased catalyst activity,
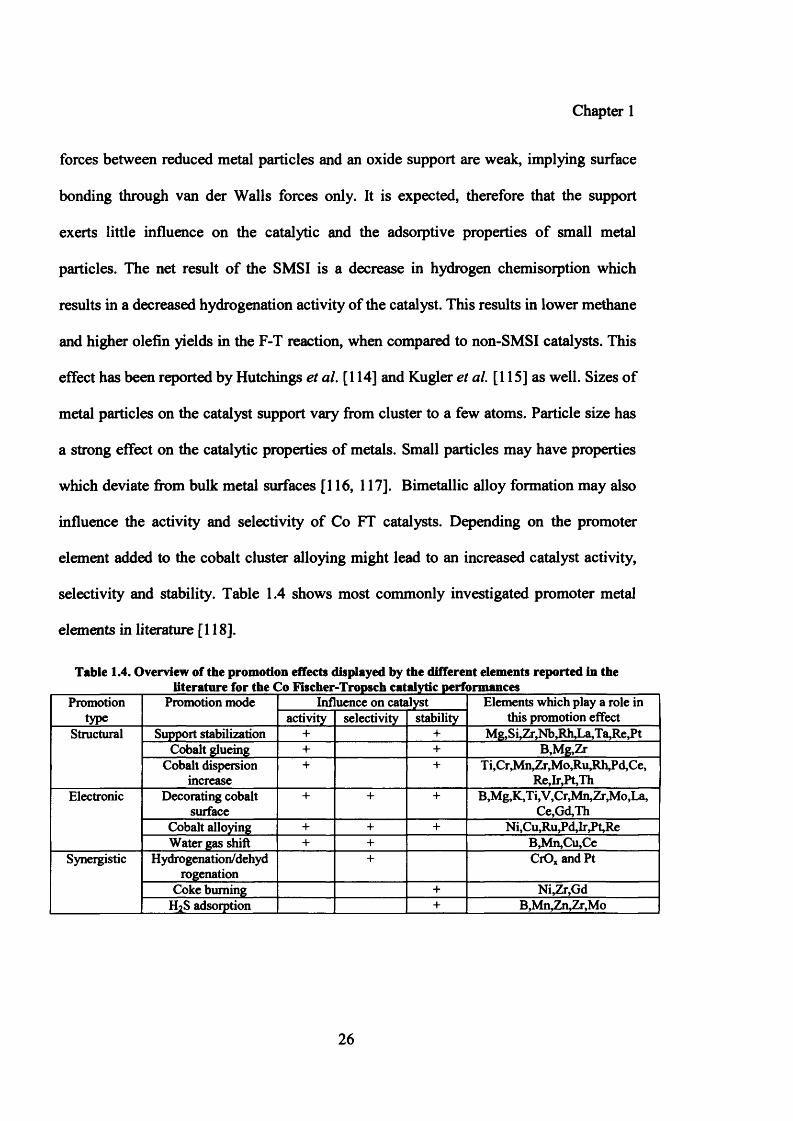
selectivity and stability. Table 1.4 shows most commonly investigated promoter metal
elements in literature [118].
Table 1.4. Overview of the promotion effects displayed by the different elements reported in the __________ literature for the Co Fischer-Tropsch catalytic performances_______________
Promotiontype
Promotion mode Influence on catalyst Elements which play a role in this promotion effectactivity selectivity stability
Structural Support stabilization + + Mg,Si,Zr,Nb,Rh,La,Ta,Re,PtCobalt glueing + + B,Mg,Zr
Cobalt dispersion increase
+ + T i,Cr,Mn,Zr,Mo,Ru,Rh,Pd,Ce, Re,Ir,Pt,Th
Electronic Decorating cobalt surface
+ + + B,Mg,K,Ti,V,Cr,Mn,Zr,Mo,La,Ce,Gd,Th
Cobalt alloying + + + Ni, Cu,Ru,Pd, Ir^Pt, ReWater gas shift + + B,Mn,Cu,Ce
Synergistic Hydrogenation/dehydrogenation
+ CrO* and Pt
Coke burning + Ni,Zr,GdH2S adsorption + B,Mn,Zn^r,Mo
26
Chapter 1
1.11 Synthesis of alcohols from syngas
There is an increase in interest for alcohol synthesis since last two decades. Alcohols
when used as fuel additives, combust more completely than the traditional fuels and do
not have the negative impact on the environment as happened to tetra-ethyl lead and
methyl tert-butyl ether (MTBE). With the increasingly tighten environmental law, the
use of alcohol in fuel industry is receiving more attention.
Methanol
Methanol is one of the most important chemicals ever developed so far. The majority of
methanol is produced via the syngas route. The process is a very well developed
commercial process with high activity and selectivity. Methanol is widely used as
primary raw material and solvent in laboratory as well as in pharmaceutical industry.
When used in fuel industry to blend with gasoline, methanol causes problems due to its
high blending vapor pressure, low water tolerance and low hydrocarbon solubility.
Ethanol
Ethanol is another important chemical. It has a long history of being used in food industry
and medical sector. It has also been used in the chemical industry as solvent or reagent as
starting material to manufacture detergents, paint and cosmetic products.
The extensive application of ethanol as automotive fuel in fuel industry started in the
1970’s and now is the fastest growing sector among all the applications. Currently there
is around 30 million cubic meters per year used in the fuel industry, which accounts for
70% of the world ethanol production.
There are various methods that can be used to produce ethanol. The most widely
employed two methods are fermentation and catalytic synthesis. Fermentation is using
27
Chapter 1
food e.g. sugar cane, com as feedstock to produce ethanol, which has been commercially
operated in Brazil (sugar cane) and the USA (com). Currently 95% of fuel ethanol is
obtained from fermentation process. The fermentation method is however time
consuming and labor intensive.
Another approach to produce ethanol is catalytic synthesis which could be further
classified as ethylene hydration (in which ethylene gas reacted with extremely pure water
over the surface of a catalyst support impregnated with phosphoric acid) and syngas route.
Syngas routes to produce ethanol are similar to the mixed alcohol synthesis; hence it is
discussed in the following section.
Higher alcohols
Apart from the interest in ethanol synthesis, higher alcohol synthesis (also called HAS)
has been receiving growing attentions. The HAS normally refers to the synthesis of
mixture of C1-C6 alcohols with the purpose of obtaining high C2+ alcohol selectivity. The
percentage of higher alcohols for blending to gasoline is estimated to be circa 30 - 45 wt
% [119].
Several processes have been developed to synthesize mixed alcohols: the FT synthesis,
isosynthesis, oxosynthesis which includes hydroformylation of olefins, homologation of
methanol and lower molecular weight alcohols. The FT synthesis via the syngas route is
widely recognized technique for this purpose. Since 1980’s, there had been several
technology developers worked on the HAS. Dow is the first company that developed the
HAS technology using molybdenum sulfide based materials. Snamprogetti and Haldor
Topsoe developed a HAS process with modified methanol catalyst and started a 12,000
ton/y pilot plant in 1982 [120]. Lurgi built 2 tones per day (TPD) demonstration plants in
28
Chapter 1
1990 based on its HAS process with low pressure methanol synthesis [121]. IFP built its
20 (BPD) pilot plant in Japan [122].
Several companies have shown interests in developing HAS technology. Power Energy
Fuels Inc. (PEFI) developed the Ecalene™ mixed alcohol process [123] which is using
modified M0 S2 catalyst based on Dow’s process. Pearson Technologies has built a 30
ton/day biomass gasification and alcohol production plant in Mississippi emphasizing in
producing ethanol product [124].
The final commercialization of HAS technology depends very much on the development
and performance of its catalyst. Together with the development in syngas generation
technology, mixed alcohol synthesis could play an important role in the next generation
of fuel industry.
1.11.1 Catalysts for alcohols synthesis
According to the active metal involved, catalysts used for HAS can be roughly classified
into 4 categories: modified methanol synthesis catalyst, the IFP (Institut Franjjais du
Petrole) mixed oxides catalyst, alkali modified cobalt molybdenum catalyst and rhodium
based catalyst.
It is commonly accepted that higher alcohol can be synthesized by appropriate
modification of methanol synthesis catalysts and catalytic reaction conditions [124, 125].
With the addition of alkali and alkaline-earth, methanol synthesis catalysts favor the
formation of higher alcohols and other oxygenates. This type of catalyst mainly includes
alkali-doped ZnO/Cr2C>3 catalyst, alkali-doped Cu/ZnO/Cr2C>3 catalyst and Co, Fe, or Ni
modified Cu/ZnO/Cr2C>3 catalyst. Alkali-doped Zn0 /Cr2 0 3 catalyst is also called
29
Chapter 1
modified high pressure methanol synthesis catalyst. The other two types of catalysts,
alkali-doped Cu/ZnO/Cr2C>3 and Co, Fe, or Ni modified Cu/ZnO/Cr2C>3 catalyst are called
modified low pressure methanol synthesis catalyst.
The IFP mixed oxide catalyst is also called modified FT catalyst which mainly consists of
mainly oxides of copper and cobalt and a series of elements such as aluminum, chromium,
zinc and noble metals [126, 127]. The function of cobalt in the IFP catalyst is different
from that in the modified methanol catalyst because small amount of addition
significantly affect the catalytic activity.
Molybdenum sulfide based catalysts for alcohol synthesis were first independently
discovered by research groups at Dow Chemicals [128-130] and Union Carbide [131].
They reported that molybdenum sulfide catalysts promoted by cobalt and alkali
compounds are active for the higher alcohol synthesis.
Molybdenum carbide catalysts were also reported for the formation of alcohols by
Leclercq et al. [132] and Woo et al. [133]. They reported that the formation of alcohols is
linked with the surface stoichiometry and to the extent of carburization. Potassium
promotion could enhance the selectivity towards C1-C7 alcohols [133]. Xiang et al. [134]
and Ayela et al. 135] investigated the addition of cobalt and potassium to the
molybdenum carbides system respectively and reported that addition of both leads to high
activity and selectivity towards C2+ alcohols.
Rhodium based catalyst is another category for higher alcohol synthesis [136]. Rhodium
containing catalyst shows good selectivity toward the synthesis of ethanol and other C2
oxygenates [137]. However, its high price due to limited natural resource makes
30
Chapter 1
commercially application difficult. Hence, study in the rhodium containing catalyst
currently is for academic purpose.
In the present study some investigation has been done on synthesis of higher alcohols as
well.CoMoS2 has been reproduced under modified and well controlled preparation
conditions and is further studied by addition of several metals (e.g. Zr, Ti and Ni) as
promoter.
Following this introduction, chapter 2 is experimental which is mainly focused on the
catalyst preparation, catalyst characterization, catalytic reaction procedure and data
analysis. Effect of various preparation and reaction variables on CoMnOx has been
discussed in chapter 3. An influence of metal promotes (K and Ru) on CoMnOx catalyst
is detailed in chapter 4. Chapter 5 is related to addition of two different types of activated
carbon (Wood and peat derived) in cobalt manganese in comparison with an iron
manganese catalyst. Chapter 6 is about syngas conversion to alcohols using C0 M0 S2
catalyst modified with various metal promoters like Ni, Ti and Zr. Chapter 7 concludes
all the investigated catalyst systems in present study followed by appendix 1 - 6 with a
detailed description of reactor systems, GC configurations and data evaluation methods.
31
Chapter 1
1.12 References:
[1]. M. van der Riet, G. J. Hutchings, and R. G. Copperthwaite, J. Chem. Soc. Chem. Commun., 1986,10, 798.
[2]. R. G. Copperthwaite, G. J. Hutchings, M. van der Riet, and J. Woodhouse, Ind. Eng.
Chem. Res., 1987, 26, 869.
[3]. S. Colley, R. G. Copperthwaite, G. J. Hutchings, and M. van der Riet, Ind. Eng.
Chem. Res., 1988, 27, 1379.
[4]. G. J. Hutchings, M. van der Riet, and R. Hunter, J. Chem. Soc., Faraday Trans. 1989,
85, 2875.
[5]. R. Agrawal, N. R. Singh, F. H. Ribeiro, and A. D. Delgass, Substantial fuel for the
transportation sector. Proc. Natl. Acad. Sci. USA, 2007,104,4828
[6 ]. P. Sabatier, J. B. Senderens, and C. B. Hebd. Seances Acad. Sci., 1902,134, 514
[7]. BASF: German Patent, 1913, 293,787
[8 ]. F. Fischer, and H. Tropsch, Brennest- Chem., 1923,4, 276
[9]. F. Fischer, and H. Tropsch, German Patent 1922,411,216
[10]. F. Fischer, and H. Tropsch, Brennest-Chem., 1924, 201, 217
[11]. F. Fischer, and H.Tropsch. German Patent, 1925,484,337
[12]. F. Fischer, and H. Tropsch, Brennest-Chem., 1926, 7, 97
[13]. M. E. Dry, in “Catalysis - Science and Technology” Vol.l, J. R. Anderson and M.
Boudart, Springer Verlag Berlin 1981, 4, 159
32
Chapter 1
[14]. R. B. Anderson, in “Catalysis” Vol.4 P. H. Emmet, Van Nostrand-Reinhold, New
Jersey, 1956
[15]. B. P Statistical Review of World Energy, 2006
[16]. J. P. Hindermann, G. J. Hutchings, and A. Kiennemann, Catal. Rev. Sci. Eng., 1993,
35, 1
[17]. G. L. Bezemer, P. B. Radstake, U. Falke, H. Oosterbeek, H. P. C. E. Kuipers, A. J.
Van Dillen, and K. P. de Jong, J. Catal., 2006,237, 152
[18]. M. E. Dry, Appl. Catal. A., 1996,138, 319
[19]. P. Courty, and P. Chaumette. Eng. Prog., 1987, 7, 23
[20]. G. Henrichi-Olive, and S. Olive, Angew. Chem. Int. Ed. Engl., 1976, 15, 136
[21].C. N. Satterfield, G. A. Huff, H. G. Stenger, and R. J. Madon, Ind. Eng. Chem.
Fundam., 1985, 24, 450
[22]. C. N. Satterfield, and G. A. Huff, J. Catal., 1982, 73, 187
[23]. R. B. Anderson, in “Catalysts for the Fischer-Tropsch synthesis ”, Vol. 4, Van
Nostrand Reinhold, New York 1956
[24]. M. E. Dry, J. Mol. Catal., 1982,17, 133
[25]. S. E. Colley “Hydrogenation o f carbon monoxide over modified cobalt-based
catalysts”, PhD Thesis, University of Witwatersrand, 1991
[26]. H. Schulz, E. van Steen, and M. Claeys, in ‘Selective hydrogenation and
dehydrogenation’, DGMK, Kassel, Germany, 1993
[27]. S. Novak, R. J. Madon, and H. Suhl, J. Catal., 1982, 77, 141
33
Chapter 1
[28].E. Iglesia, S. C. Reyes, R. J. Madon, and S. L. Soled, in “Advances in Catalysis” ,
Vol. 39, Academic Press, New York, 1993, 221
[29]. E. W. Kuipers, C. Scheper, J. H. Wilson, and H. Oosterbeek, J. Catal., 1996, 158,
288
[30]. E. W. Kuipers, I. H. Vinkenburg, and H. Oosterbeek, J. Catal., 1995,152, 137
[31]. C. L. Bianchi, and V. Ragaini, J. Catal., 1997,168, 70
[32]. D. L. King, J. A. Cusumano, and R. L. Garten, Catal. Rev. - Sci. Eng., 1981, 23, 233
[33]. M. E. Dry, Catal. Today., 1990, 6, 183
[34]. Y. Zhao “On the investigation o f alcohol synthesis via the Fischer Tropsch
reaction”, PhD Thesis, University of Cardiff, 2007
[35]. A. A. Adesina, Appl. Catal., 1996,138, 345
[36]. B. H. Davies, Fuel Proc. Technol., 2001, 71, 157
[37]. F. Fischer, and H. Tropsch, Brennstoff Chem., 1926, 7, 97
[38]. E. L. Metterties, and J. Stein, J. Chem. Rev., 1979, 79, 479
[39]. W. A. Hermann, Chem. Int. Ed. Engl., 1982, 21, 117
[40]. G. Henrici-Olive, and S. Olive in ‘The chemistry o f the metal carbon bond’ Vol.3,
Hartley and Patai, J. Wiley and Sons, 1985
[41]. W. J. Laws, and R.J. Puddephatt, J. Chem. Soc. Chem. Commun., 1984, 2, 116
[42]. E. A. Carter, and W. A. Goddard, J. Am. Chem. Soc., 1987,109, 579
34
Chapter 1
[43]. I. M. Saez, N. J. Meanwell, B. F. Taylor, B. E. Mann, and P. M. Maitlis, J. Chem.
Soc. Chem. Commun., 1987, 5, 361
[44]. D. Bianchi, L. M. Tau, and C. O. Bennett J. Catal., 1983, 84, 358
[45]. A. T. Bell, Catal. Rev. - Sci. Eng., 1981, 23, 203
[46]. P. M. Loggenberg, L. Carlton, R. G. Copperthwaite, and G. J. Hutchings, J. Chem.
Soc. Chem. Commun., 1987, 8 , 541
[47]. J. T.Kummer, T. W. de Witt, and P. H. Emmett, J. Am. Chem. Soc., 1948, 70, 3632
[48]. P. H. Emmett, Lecture No. 4, “Catalytic Processes Utilizing CO and H ”, Oak
Ridge National Laboratory, 1974
[49]. H. Storch, N. G. Golumbic, and R. B. Anderson, in “The Fischer-Tropsch and
related synthesis ” J. Wiley and sons, New York, 1951
[50].W. K. Hall, R. J. Kokes, and P. H. Emmett, J. Am. Chem. Soc., 1957, 79, 2983
[51].W. K. Hall, R. J. Kokes, and P. H. Emmett, J. Am. Chem. Soc., 1960, 82, 1027
[52]. V. Ponec, Catalysis, 1981, 5,49
[53]. A. Raje, and B. H. Davies, in: “J.J. Spivey Ed., Catalysis The Royal Soc. Chem.,
Cambridge, 1996,12, 52
[54]. V. V. Voevodskii in: M. Van der Riet, “Carbon monoxide hydrogenation with
transition metal oxide supported cobalt and iron catalysts”, PhD Thesis, University of
Witwatersrand, 1988
[55]. A. Ekstroom, and J. A. Lapswzewicz, J. Phys. Chem., 1987, 91, 4514
[56]. H. Pichler, and H. Schulz, Chem. Ing. Tech., 1970, 42, 1162
35
Chapter 1
[57]. G. Henrichi-Olive, and S. Olive, Chem. Int. Ed. Engl., 1976,15, 136
[58]. C. K. Rofer-De Poorter, Chem. Rev., 1981, 81, 447
[59]. S. L. Brown, and S. G. Davies, J. Chem. Soc. Chem. Commun., 1986,1, 84
[60]. G. Jacobs, J. A. Chaney, P. M. Patterson, T. K. Das, J. C. Maillot, and B. H. Davies,
J. Synch. Rad., 2004,11, 414
[61]. S. A. Hedrick, S. S. C. Chuang, A. Pant, and A. G. Dastidar, Catal. Today., 2000,
55, 249
[62]. M. A. Vannice, J. Catal., 1975, 37,462
[63]. M. A. Vannice, J. Catal., 1976,40, 129
[64]. M. A. Vannice, J. Catal., 1975, 37, 449
[65]. M. A. Vannice, J. Catal., 1979, 50, 278
[6 6 ]. S. E. Colley, R. G. Copperthwaite, G. J. Hutchings, and M. Van der Riet, Ind. Eng.
Chem., 1988, 27, 1339
[67]. J. Venter, M. Kaminsky, G. L. Geoffrey, and M. A.Vannice, J. Catal., 1987, 103,
450
[6 8 ]. E. Tronconi, C. Christiani, N. Ferlazzo, P. Forzatti, P.L. Villa, and I. Pasquon. Appl.
Catal., 1987,32, 285
[69]. A. L. Dent, and M. Lin, Am. Chem. Soc. Adv. Chem. Series., 1979,178, 47
[70]. T. B. Kobylinski, U.S.Patent, 1978,4,088,671
[71]. C. B. Kibby, and T. P. Kobylinski, U.S.Patent, 1985, 4,492,774
36
Chapter 1
[72]. H. Beuther, C. L. Kibby, T. P. Kobylinski, and R. B. Pannell, U.S. Patents, 1983, 4,
413,064, 1985, 4,493,905, 1986, 4,605,680, 1986, 4,613,624
[73]. T. P. Kobylinski, C. L. Kibby, R. B. Pannell, and E. G. Eddy, U.S. Patents, 1986,
4,605,676, 1986, 4,605,679
[74]. E. Iglesia, S. L. Soled, and R. A. Fiato, J. Catal, 1992,137, 212
[75]. E. Iglesia, S. L. Soled, R. A. Fiato, and G.H. Via, J. Catal., 1993,145, 345
[76]. E. Iglesia, S. L. Soled, and J. Baumgartner, J .Catal., 1995,153, 108
[77]. E. Iglesia, Appl. Catal., 1997,161, 59
[78].S. Eri, J. G. Goodwin ,G. Marcelin, and T. Riis, U.S. Patents, 1989, 4,880,763,1989,
4,801,573 , 1992,4,857,599 , 1992, 5,116,879
[79]. S. Vada, B. Chen, and J. G. Goodwin, J. Catal., 1995,153, 224
[80]. S. Ali, B. Chen, and J. G. Goodwin, J. Catal., 1995,157,25
[81]. G.J. Haddad, B.Chen, and J. G. Goodwin, J. Catal., 1996,160,43
[82]. K. Kogelbauer, J. G. Goodwin, and R. Oukaci, J. Catal., 1996,160, 125
[83]. A. R. Belambe, R. Oukaci, and J. G. Goodwin, J. Catal., 1997,166, 8
[84]. R. Oukaci, A. H. Singleton, and J. G. Goodwin, Appl. Catal., 1999,186, 129
[85]. J. J. Li, G. Das, T. Zhang, and Y. Davies, Appl. Catal., 2002, 236, 67
[8 6 ]. C. H. Bartholomew, in “Studies in surface science and catalysis ” 2003,163,2884
[87]. G. Jacobs, K. Chudhari, D. Sparks, Y. Zhang, B. Shi, R. Spicer, T. K. Das, J. Li,
and B. H. Davies, Fuel., 2003, 82, 1251
37
Chapter 1
[8 8 ]. E. Iglesia, Appl. Catal, 1997,161, 59
[89]. Y. Q. Zhuang, M. Claeys, and E. V. Steen, Appl. Catal., 2006, 301, 138
[90]. A. A. Mirzaei, R. Habibpour, M. Faizi, and E. Kashi, Appl. Catal., 2006, 301, 272
[91]. F. Morales, F. M. F. de Groot, O. L. G. Gijzeman, A. Mens, O. Stephan, and B. M.
Weckhuysen, J. Catal., 2005, 230, 301
[92]. P. A. Chemavskii, Kinet. Catal., 2005,46, 634
[93]. J. S. Girardon, A. S. Larmontov, L.Gengembre, P. A. Chemavskii, A. Griboval-
Constant, and A. Y. Khodakov, J. Catal, 2005,230, 339
[94]. R. Gheitanchi, A. A. Khodadadi, M. Taghizadeh, and Y. Mortazavi, React. Kinet.
Catal. Lett., 2006, 8 8 , 225
[95]. Q. Liang, K. Chen, W. Hou, and Q. Yan, Appl. Catal., 1998,166, 191
[96]. B. Ernst, L. Hilaire, and A. Kiennemann, Catal. Today., 1999, 50,425
[97]. D. Das, G. Ravichandran, and D. K. Chakrabarty, Appl. Catal., 1995,131, 335
[98]. A. Martinez, C. Lopez, F. Marquez, and I. Diaz, J. Catal., 2003, 220,486
[99]. S. J. Ledford, H. M. Houlla, P. Andrew, and M.H. David, J. Phys. Chem., 1989, 50,
6770
[100]. B. Ernst, A. Kiennemann, and P. Chaumette, ILERCSI-ECPMURA CNRS 1498
[101]. A. H. Singleton, Energy International Corporation [US/US], 135 William Way
Pittsburg, PA 15328 (US)
38
Chapter 1
[102]. C. Wenchun, M. Kamel, M. Manzer, and E. Leo, Subramanian, Munirpallam
A.2001, (Kennett Sq., PA) 09/314811
[103]. B. C. Murchison, 1985, (Midland, MI) 06/550852
[104]. G. R. Moradi, M. M. Basir, A. Taeb, and A. Kiennemann, Catal Commun., 2003,
4, 27
[105]. L. C. A. Mazzone, and F.A.N. Fernandes, Lat. Am. Appl. Res., 2006, 36, 141
[106]. T. Wang, Y. Ding, Y. Lu, and L. Lin, J. Nat. Gas. Chem., 2008,17, 153
[107]. B. Comils, W. A. Herrmann, R. Schlogl, and C. H. Wong, in “Catalysis from A to
Z", A concise encyclopedia, Wiley-VCH, Weinheim
[108]. M. E. Dry, T. Schingingles, and C. S. Botha, J. Catal., 1970,17, 341
[109]. J. S. Girardon, A.S. Larmontov, L. Gengembre, P. A. Chemavskii, A. Griboval-
Constant, and A.Y. Khodakov, J. Catal., 2005, 230, 339
[110]. J. Panpranot, J.G. Goodwin, and A. Sayari, Catal. Today., 2002, 77,269
[111]. S. J.Tauster, S.C. Funk, and R. L. Garten, J. Am. Chem. Soc., 1978,100, 170
[112]. K. I. Hadjiivanov, and D.G. Klissurski, Chem. Soc. Rev., 1996, 25, 61
[113]. G. J. Hutchings, S. Afr. J. Chem., 1986, 34, 65
[114]. E. L. Kugler, Prep Am. Chemi, Soc. Div. Pet. Chem., 1980, 25, 564
[115]. D. L. King, J. Catal., 1978, 51, 397
[116]. C. S. Kellner, and A.T. Bell, J. Catal., 1982, 75, 251
[117]. http://igitur-archive.librarv.uu.nl/dissertation/2006-0906-201148Zc2.pdf
39
Chapter 1
[118]. J. C. Slaa, J. G. Van Ommen, and J.R.H. Ross, Catal. Today., 1992,15, 129
[119]. H. B. M. Olayan, Eng. Prog., 1987, 7, 9
[120]. A. H. El Sawy, NTIS. DE90010325. SAND89-7151, 1990, Mitre Corporation
[121]. A. J. Lucero, R. E. Klepper, W. M. O'Keefe, and V. K. Sethi, Prepr. Symp. - Am.
Chem. Soc., Div. Fuel, Chem., 2001, 46, 413
[122]. U.S. Department of Energy, National Renewable Energy Laboratory, 2006
NREL/SR-510-39947
[123]. K. Klier, Adv. Catal., 1982,31, 243
[124]. K. Smith, and R.B. Anderson, J. Catal., 1984, 85, 428
[125]. A. Surgier, US Patent, 1974,3787332
[126]. A. Surgier, US Patent, 1975,3899577
[127]. G. J. Quarderer, and K. A. Cochran, European Patent, 1984, 0,119,609
[128]. R. R. Stevens, European Patent, 1986, 0,172,431
[129]. C. B. Murchison, M. M. Conway, R. R. Stevens, and G. J. Quarderer, Proc. 9th Int.
Congr. Catal., Calgary, 1988, 2, 626
[130]. N. E. Kinkade, European patents, 1985, 0,149,255 and 0,149,256
[131]. L. Leclercq, A. Almazouari, M. Dufour, and G. Leclercq, in: “The Chemistry o f
Transition Metal Carbides and Nitrides”, S.T. Oyama (Ed.), Blackie, Glasgow, 1996,
345
[132]. H. C. Woo, K.Y. Park, Y.G. Kim, I. Nam, J. S. Chung, and J. S. Lee, Appl. Catal.,
1991,75, 267
[133]. M. Xiang, D. Li, H. Qi, W. Li, B. Zhong, and Y. Sun, Fuel., 2007, 8 6 , 1298
[134]. E. C. Alyea, D. He, and J. Wang, Appl. Catal., 1993,104, 77
40

Chapter 1
[135]. M. Ichikawa “Agency of Industrial Science and Technology”, early
disclosure, No. 85 - 32731, 1985, 2, 19
[136]. S.C. Nirula, 1994, PEP Review no. 85-1-4, SRI International, Meno Park,
CA.
41

Chapter 2
Chapter 2
Experimental
2.1 Catalyst Preparation
There are several methods for the preparation of catalysts and each catalyst can be
prepared through different routes. Impregnation, coprecipitation and deposition
precipitation are three important methods for catalyst preparation which are widely used
in industry. There are various preparation variables involved in these methods which
affect the morphology and activity of catalysts, e.g. heat treatment is important in
impregnation; pH, temperature and ageing time affect the nature of catalyst in
precipitation and deposition precipitation methods.
42
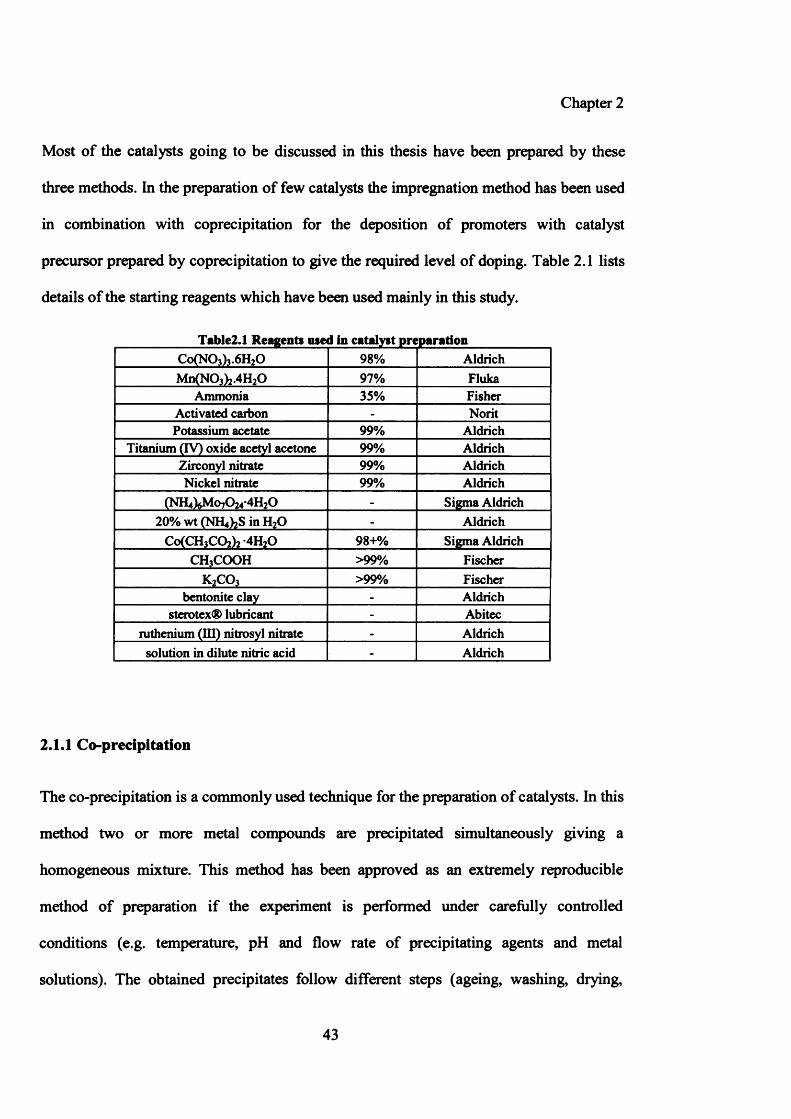
Chapter 2
Most of the catalysts going to be discussed in this thesis have been prepared by these
three methods. In the preparation of few catalysts the impregnation method has been used
in combination with coprecipitation for the deposition of promoters with catalyst
precursor prepared by coprecipitation to give the required level of doping. Table 2.1 lists
details of the starting reagents which have been used mainly in this study.
Table2.1 Reagents used in catalyst preparationCo(N0 3 )3 .6 H2 0 98% AldrichMntNOaMHjO 97% Fluka
Ammonia 35% FisherActivated carbon - NoritPotassium acetate 99% Aldrich
Titanium (IV) oxide acetyl acetone 99% AldrichZirconyl nitrate 99% AldrichNickel nitrate 99% Aldrich
(N H ^ O y O j^ H jO - Sigma Aldrich20% wt (N ^ h S in H20 - Aldrich
Co(CH3C02)2-4H20 98+% Sigma AldrichCH3COOH >99% Fischer
k 2c o 3 >99% Fischerbentonite clay - Aldrich
sterotex® lubricant - Abitecruthenium (III) nitrosyl nitrate - Aldrich
solution in dilute nitric acid - Aldrich
2.1.1 Co-precipitation
The co-precipitation is a commonly used technique for the preparation of catalysts. In this
method two or more metal compounds are precipitated simultaneously giving a
homogeneous mixture. This method has been approved as an extremely reproducible
method of preparation if the experiment is performed under carefully controlled
conditions (e.g. temperature, pH and flow rate of precipitating agents and metal
solutions). The obtained precipitates follow different steps (ageing, washing, drying,
43
Chapter 2
calcination and reduction) to give a final catalyst with homogeneous distribution of active
metal components. This method can successfully be used for the large scale production of
catalysts [1].
There is a main disadvantage associated with this method of preparation which is very
high chemical cost because of the large mass loss that occurs during the derivation of
final product from the reagents. Co-precipitation method has been observed as the best
technique for catalyst preparation in this research and it facilitated a homogeneous
preparation of reproducible catalysts on laboratory scale.
It has been observed during this research that co-precipitation requires proper control of
all preparation variables and steps. Most important variables to be controlled are rate of
addition of different solutions, rate of stirring, pH, temperature of precipitation and
ageing time. These factors affect the reproducibility of catalyst affecting the final
structure and activity of catalyst. In this study only nitrates of cobalt and manganese were
used and the precipitating agent was always ammonia (various other precipitating agents
were tried but ammonia has been found as the best precipitating agent). During heat
treatment -NO3 and NH3 decompose to high area oxides avoiding poisoning effects [2],
Warm distilled water was used for all dilutions or washings to minimise impurities.
Filtration was done in a preheated funnel in order to avoid a change in the metal ratio
induced by the cooling of precipitation mixture during filtration process.
In this study two different methods have been employed for co-precipitation of CoMnOx
catalyst.
44
Chapter 2
1 . simultaneous mixing of two metals salts solutions with precipitating agent in which
flow rates of both(nitrate solutions and precipitating agent) were kept constant for
precipitation at a single constant pH and
2. Introduction of precipitating agent in the mixed metals salts solution in which flow rate
of precipitating agent was kept constant and pH of precipitation mixture was varied
Method 2 was found better for this particular catalyst in which pH of the precipitation
mixture was varied. Both methods have been detailed in the following paragraphs.
i) Preparation of cobalt manganese oxide catalysts by coprecipitation at constant pH
100 ml each of Co and Mn 1M solutions (prepared from the nitrate salts) were premixed
and heated to 70°C. The NH3 precipitating solution (200ml of 5.6M NH3 solution) was
also preheated to 70°C. Both reagents (mixed metal salts solutions and NH3 solution)
were combined together in the reaction vessel at 70°C at a combined pumping rate of
6.7ml/min (3.3 ml/min NH3 solution, 3.3 ml/min metals solution). The reagents were
combined a reaction vessel (70°C) containing 100 ml of water (necessary for submerging
the pH probe) and reacted at constant pH of 8.30 +/- 0.01. The duration of reaction was
ca.lh and it yielded 500 ml of solution containing the co-precipitated catalyst. This
solution was filtered through a preheated funnel (using wide mesh filter paper to enable a
rapid filtration) and washed (using 500ml of warm distilled water).
After washing the catalyst was dried (110°C) over night (16h) giving a material denoted
as catalyst precursor which was calcined at 500°C for 24h to get a final catalyst.
45
Chapter 2
ii) Preparation of cobalt manganese oxide catalysts by coprecipitation at variable
pH
100 ml each of Co and Mn 1M solutions (prepared from the nitrate salts) were premixed
and heated to 80°C in a round bottom flask. Ammonium hydroxide solution (5.6M/1)
preheated at 80°C was added to the nitrate solution, which was continuously stirred whilst
the temperature was maintained at 80°C. pH was varied from 2.80 to 8.0. The precipitates
were first filtered and then washed several times with warm distilled water. The
precipitates were then dried at 110°C for 16h to give a material denoted as the catalyst
precursor which was subsequently calcined in static air in the furnace (500°C, 24h) to
give the final catalyst.
2.1.2 Impregnation
Impregnation is very well known and simple process for catalyst preparation on industrial
scale. In this method solutions of metals salts precursors are added to the pores of support
followed by subsequent drying for the removal of solvent. Drying has to be carried out in
a way so that the impregnated component remains within the pore system and does not
migrate to the exterior surface. If this stage is done correctly, the support has crystallites
of the impregnated component in the interstices of pores [2 ].
There are two types of impregnation divided on the bases of the amount of added volume
of the solutions, wet impregnation and incipient wetness impregnation. In wet
impregnation the volume of metals salt solution is larger than pore volume of support.
However, in incipient wetness impregnation method the amount of added solutions is
equal to or less than the pore volume of support.
46
Chapter 2
All the doped catalysts were prepared by impregnation method. The main advantages of
this technique are that the metal is deposited directly on the exposed surface of catalyst
due to which most of the active metal is exposed directly to the reagent gases. This is
opposite to the catalysts prepared by coprecipitation or deposition precipitation methods
where the active metal gets distributed uniformly through whole surface of the catalyst.
Catalyst preparation by this method is very rapid and reproducible and there is less waste
of expensive metal components. The disadvantage of this method is the limited amount of
material which can be incorporated in a support.
In this study incipient wetness impregnation has been adopted for deposition of metals
dopants on the surface of cobalt manganese oxide catalysts.
The detailed procedure for deposition of metal dopants on surface of catalysts by
incipient wetness impregnation method is detailed as under:
2.1.2.1 Deposition of metal promoters on the surface of cobalt manganese oxide
catalysts
Pore volume of catalyst precursor (uncalcined material) of cobalt manganese oxide was
measured by slowly adding distilled water in a weighed quantity of catalyst precursor,
until it was in a mouldable form between paste and solution state. It was observed that
1 .6 g of precursor needs 1 .1 0 ml of distilled water.
Catalyst precursor was impregnated with calculated amounts of metal promoters reagents
dissolved in measured volume of distilled water. The resulting slurry was dried at 110°C
47
Chapter 2
for 16h followed by calcination at 500°C for 24h. All the doped catalysts detailed in
chapter 4 have been prepared by this method.
2.1.3 Deposition Precipitation
Deposition-precipitation is a technique for catalyst preparation in which metal particles
are deposited on the surface of a support by precipitation in such a way that nucleation is
prevented in the bulk of solution. This procedure enables deposition of finely divided
active metal components on the surface of a support. In this method higher loadings of
active metal precursors are achieved on the surface of support compared with
impregnation.
In this study deposition precipitation method has been adopted for the deposition of
cobalt and manganese on activated carbon. The detailed procedure is given as under:
2.13.1 Preparation of cobalt/iron and manganese supported/combined catalysts
with activated carbon by deposition precipitation method
Aqueous solutions of Cobalt nitrate hexahydrate/iron nitrate nonahydrate and Manganese
nitrate tetrahydrate were mixed and preheated in a round bottom flask at 80°C. Weighed
quantity of activated carbon was added in this mixture of solutions. Ammonium
hydroxide solution (5.6M) preheated at 80°C was added to the nitrate solution, which was
continuously stirred whilst the temperature was maintained at 80°C. pH was varied from
4.80 to 8.0. The precipitates were first filtered and then washed several times with warm
distilled water. The precipitates were then dried at 110°C for 16h to give a material
48
Chapter 2
denoted as the catalyst precursor which was subsequently calcined in tube furnace
(500°C,24h) under continuous flow of helium to give the final catalyst.
This procedure was adopted for preparation of all Co/Fe and Mn catalysts combined with
activated carbon which are discussed in chapter 5.
2.1.4 Catalysts preparation for alcohols
2.1.4.1 Preparation of alkali-promoted cobalt molybdenum sulfide catalysts for
syngas conversion to alcohols
Alkali-promoted cobalt molybdenum sulfide catalysts (C0 -M0 S2/K2CO3) were prepared
as follows. A solution of (NH4)2MoS4 was prepared by dissolving (NH4)6Mo7 0 2 4 ’4 H2 0
(15g) into (NH4)2S/H20 (106 ml, 20%) with stirring (340-343K, lh). A solution of the
cobalt compound was prepared by dissolving Co (CH3CC>2)2 (10.5g) in distilled water
(200 ml). The two solutions were then added simultaneously drop-wise into a well-stirred
solution of aqueous acetic acid solution (30%) at 328K. The solution was vigorously
stirred (lh, 328 K) and the resultant black solution was filtered and dried at room
temperature in a fume cupboard overnight. The dried sample was heated under nitrogen
(lh, 773 K ramping rate 25K/min), giving a grey-black product. This product was then
ground and mixed with K2CO3, bentonite clay and sterotex® lubricant in a weight ratio
of 66/10/20/4 (10% K2CO3) unless otherwise indicated.
This method was adopted for preparation of C0 M0 S2 catalysts which are discussed in
chapter 6 .
49
Chapter 2
2.2 Analysis of products
The residual gaseous product was analyzed by on-line gas chromatography (FID and
TCD), and liquids were analyzed by off-line gas chromatography. The detailed
description of gas chromatography used in this study is discussed in appendix 3 (for
syngas to alcohols) and appendix 6 (for syngas to alkenes).
2.2.1 Gas Chromatography
Chromatography is the collective term for a family of techniques capable to produce data
for the composition of chemical mixtures. Gas Chromatography is one of the most
extensively used techniques amongst the analytical methods. This technique specifically
involves a sample being vaporized and injected into the head of the chromatographic
column. The sample is transported through the column by the flow of inert, gaseous
mobile phase. The column itself contains a stationary phase which is adsorbed onto the
surface of an inert solid.
2.2.1.1 Instrumental components
Gas chromatograph (GC) mainly consists of following components:
i. Carrier gasii. Sample injector portiii. Columnsiv. Detectorsv. Data acquisition system
50
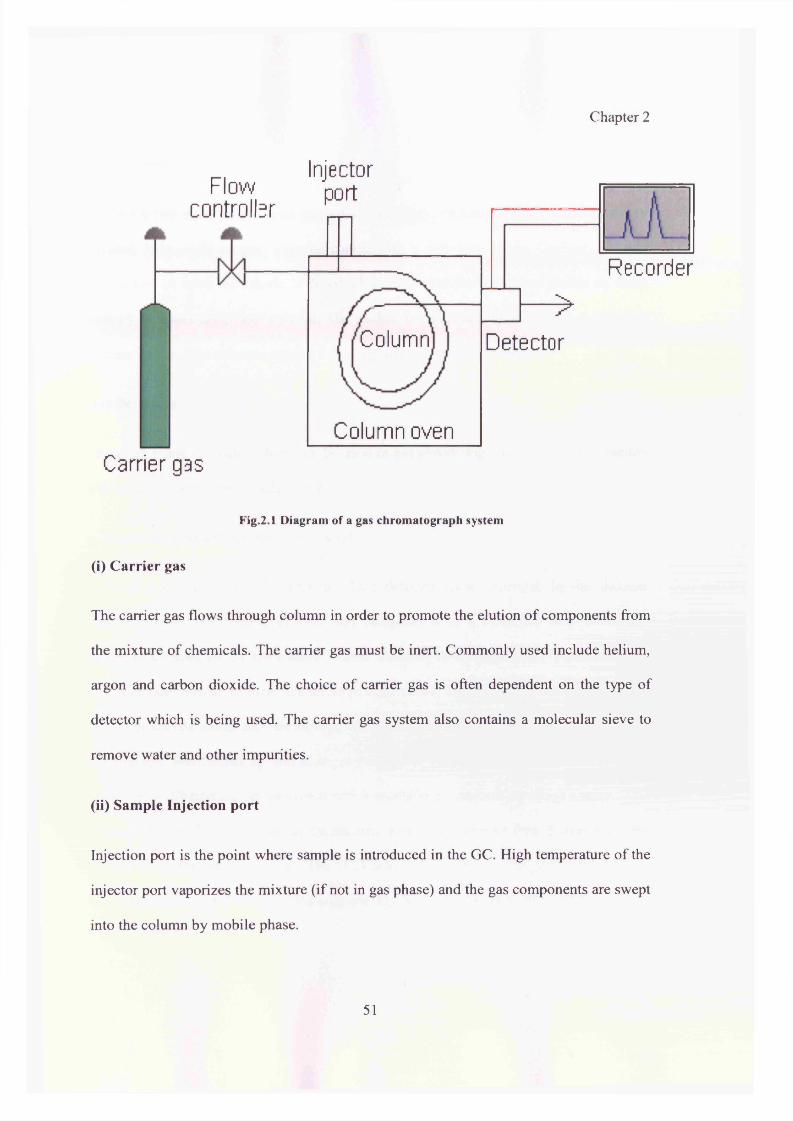
Chapter 2
F l o wcontroller
C o l u m n o v e n
>D e t e c t o r
C a r r ie r g a s
Fig.2.1 Diagram of a gas chromatograph system
R e c o r d e r
(i) Carrier gas
The carrier gas flows through column in order to promote the elution o f components from
the mixture o f chemicals. The carrier gas must be inert. Commonly used include helium,
argon and carbon dioxide. The choice o f carrier gas is often dependent on the type of
detector which is being used. The carrier gas system also contains a molecular sieve to
remove water and other impurities.
(ii) Sample Injection port
Injection port is the point where sample is introduced in the GC. High temperature of the
injector port vaporizes the mixture (if not in gas phase) and the gas components are swept
into the column by mobile phase.
C o l u m n
Injec torport
51
Chapter 2
(iii) Columns
There are two types of columns, packed and capillary. Packed columns contain a finely
divided, inert, solid support material coated with a stationary phase. Capillary column
consists of an open tube made of fused silica with an outer coating of plastic an inner
coating of stationary-phase material. The packed columns are the most popular column
systems in use. The columns used in this study are detailed in appendix 6 .
(iv) Detectors
There are many detectors which can be used in gas chromatography. Different detectors
will give different types of selectivity.
a. Thermal conductivity detector (TCD)
TCD is a chemical specific detector. This detector senses changes in the thermal
conductivity of the column effluent and compares it to a reference flow of carrier
gas.TCD consists of an electrically heated filament in a temperature-controlled cell.
Under normal conditions there is a stable heat flow from the filament to the detector body.
When an analyte elutes and the thermal conductivity of the column effluent is reduced,
the filament gets heated up and changes resistance. This change in resistance is often
sensed by a Wheatstone bridge circuit which produces a measurable voltage change. The
column effluent flows over one of the resisters while the reference flow is over a second
resistor in the four-resister circuit. The TCD detects all molecules, not just hydrocarbons,
so it is commonly used for fixed gas analysis (O2, N2, CO, CO2, H2S, NO, NO2).
52
Chapter 2
b. Flame Ionization Detector (FID)
FID is one of the many methods to analyze materials coming off of the GC column. A
stainless steel jet is constructed in FID. The carrier gas from column flows through the jet
mixes with hydrogen and bums at the tip of FID. There is metal collector electrode
located at the side of flame. Hydrocarbons ionized in the flame are attracted to this
electrode and the resulting electron current is amplified by an electrometer amplifier.
FID is sensitive to almost all hydrocarbons.
(v) Data Acquisition
Computer based systems are extensive tools for the analysis of data from data systems.
The raw data can be plotted to form the chromatograms in variable scales of retention and
the response axis.
2.3 Catalytic testing
CO hydrogenation for syngas to alkenes was carried out using six fixed-bed laboratory
reactors, which enabled testing of catalysts under identical experimental conditions. The
detailed description of these reactors is given in appendix 4. A single bed reactor was
used for evaluation of few catalysts which is detailed in appendix 1 .
CO hydrogenation for syngas to alcohols was carried out in high pressure alcohols
reactor which has been detailed in appendix 2 .
53
Chapter 2
2.4 Calculations
Gas chromatographic data was corrected for the derivation of final data using method of
calculations detailed in appendix 5.
2.5 Surface and Bulk Characterization
2.5.1 BET Surface Area Measurements
Surface area is an important characteristic capable of affecting the quality and utility of
materials. For this reason it is important to determine and control this factor accurately.
The most common and widely used technique for the estimation of surface area is BET
(Brunauer, Emmett and Teller) method. BET equation is based on the extension of the
Langmuir model for monolayer molecular adsorption. There is an assumption that
adsorption of first layer takes place in an array of surface sites with same energy.
Molecules in the first layer act as sites for multilayer adsorption which approaches
infinite thickness as p—► p0.
1 + £ z l . P - (2 .1)V (P o -p ) VmC VmC p„
BET equation
Where
Where p and po are the equilibrium and saturation pressure respectively, V is the volume
of gas adsorbed at pressure p, Vm is the volume of gas required to form a monolayer and
C is a constant related heat of adsorption.
54
Chapter 2
Based on experimental results, equation (2.1) can be plotted a s — versus — . TheV(Po ~ P) Po
C -1 1slope and intercept of the BET plot are equal t o a n d respectively. With the
Vn£
monolayer volume Vm known, the surface area can be obtained by:
A = ——— N.cr (2.2)' 22414 A
Where Na is the Avogadro number and a is the area of one nitrogen molecule (generally
accepted as 0.162 nm ).
Measurement of the BET surface area was achieved by N2 physi-sorption at the
temperature of liquid nitrogen. Before each measurement, the sample was degassed for 1
h at 393K under N2 flowing. Measurement was done using Micromeritics ASAP2000
(Gemini). Sample tube (with sample) was first evacuated and the void volume of the
apparatus measured using helium. Afterwards the sample tube was immersed into liquid
nitrogen, followed by adding nitrogen to start adsorption. Data of pressure drop versus
volume of nitrogen adsorbed were then recorded, which could be used to calculate the
surface area according to the method described above.
2.5.2 X-ray Diffraction
X-ray Diffraction (XRD) is a versatile, non-destructive technique that reveals detailed
information about the chemical composition and crystallographic structure of materials.
Diffraction occurs when electromagnetic radiation impinges on a material with a
comparable length scale to the wavelength of radiation. The distances of crystal lattices
55
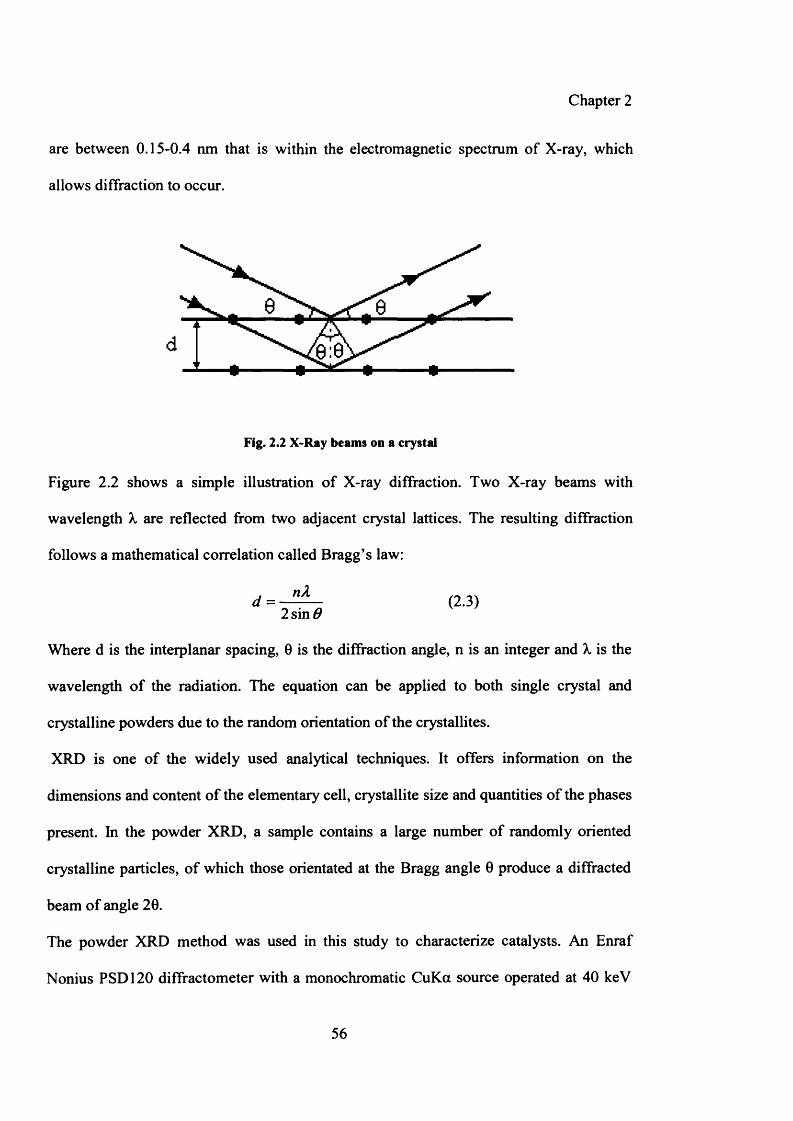
Chapter 2
are between 0.15-0.4 nm that is within the electromagnetic spectrum of X-ray, which
allows diffraction to occur.
d
Fig. 2.2 X-Ray beams on a crystal
Figure 2.2 shows a simple illustration of X-ray diffraction. Two X-ray beams with
wavelength X are reflected from two adjacent crystal lattices. The resulting diffraction
follows a mathematical correlation called Bragg’s law:
d = (2.3)2 sin#
Where d is the interplanar spacing, 0 is the diffraction angle, n is an integer and X is the
wavelength of the radiation. The equation can be applied to both single crystal and
crystalline powders due to the random orientation of the crystallites.
XRD is one of the widely used analytical techniques. It offers information on the
dimensions and content of the elementary cell, crystallite size and quantities of the phases
present. In the powder XRD, a sample contains a large number of randomly oriented
crystalline particles, of which those orientated at the Bragg angle 0 produce a diffracted
beam of angle 2 0 .
The powder XRD method was used in this study to characterize catalysts. An Enraf
Nonius PSD 120 diffractometer with a monochromatic CuKa source operated at 40 keV
56
Chapter 2
and 30 mA was used to obtain intensity and 20 values. Phase identification was
performed by matching experimental patterns to the JCPDS data base.
2.5.3 Temperature Programmed Reduction (TPR)
Temperature programmed reduction (TPR) is the most commonly used analytical
technique used to get information on the reduction behavior of metal oxide catalysts. The
direct information obtained includes the number of defined peaks in the TPR profile and
the corresponding temperature at which these peaks occur. Various properties such as the
ease with which species can be reduced, the state of metallic compounds, interactions of
metal-metal and metal-support can be obtained from TPR. These characteristics can then
be used for the optimization of catalyst pretreatment.
In TPR, a reducible catalyst or catalyst precursor is exposed to a flow of a reducing gas
mixture (typically nitrogen or argon containing few volume percent of hydrogen), while
the temperature is increased linearly. The rate of reduction is continuously followed by
measuring the composition of the reducing gas mixture at the outlet of the reactor. The
experiment permits the determination of the total amount of hydrogen consumed, from
which the degree of reduction and thus the average oxidation state of the solid material
after reduction process can also be determined [3].
A TPDRO 1100 series (Thermo Electron Corporation) was used to perform the TPR
measurements. Typical measurement was performed by sandwiching a sample (0.03 g)
with quartz wool in a quartz reactor tube. The sample was out-gassed by heating at 393K
for 60 minutes in a stream of Ar (15 cm3/min). After cooling down to ambient
57
Chapter 2
temperature, Ar was switched to a gas mixture made of 10% H2/Ar. A cold trap
containing a mixture of liquid nitrogen and iso-propanol was used to trap water that was
produced from the reduction of the metal oxide. The gas mixture (20 cm3/min) flowed
through the reactor, followed by an increase of temperature at 5K/min from ambient to
1273K and then returned to ambient. The consumption of hydrogen during the reaction
was recorded by a TCD detector, giving intensity as function of temperature.
2.5.4 X-ray Photoelectron Spectroscopy (XPS)
XPS, is one of the most frequently used techniques in catalysis, as it provides information
on the elemental composition, the oxidation state of elements and, dispersion of one
phase over another.
XPS is based on the photoelectric effect, whereby an atom absorbs a photon of energy, hv,
after which a core or valence electron with binding energy Eb is ejected with kinetic
energy.
Ek = hv - Eb - cp (2.4)
Where:
Ek = the kinetic energy of the photoelectron h is the plank’s constant, v is the frequency
of the existing radiation,Eb is the binding energy of the photoelectron with respect to the
Fermi level of the sample and (p is the work function of the spectrometer.
In XPS, the intensity of photoelectrons is measured as a function of their kinetic energy.
58
Chapter 2
XPS can be used to analyze the composition of samples because a set of binding energies
is characteristic for an element. Binding energies are not only element-specific but also
contain chemical information, because the energy levels of core electrons depend slightly
on the chemical state of the atom.
An XPS spectrometer contains an X-ray source - usually Mg Ka (1253.6 eV) or A1 Ka
(1486.3 eV) and an analyzer which is mostly hemispherical in design. In the entrance
tube, the electrons are retarded or accelerated to a value called the ‘pass energy’ at which
they travel through the hemisphere filter. Behind the energy filter is the actual detector,
which consists of an electron multiplier which amplifies the incoming photoelectrons to
measurable current. The resolution of XPS is determined by the line width of the X-ray
source, the broadening due to the analyzer and the natural line width of the level. These
three factors are related as follows:
(AE) 2 = (AEX) 2 + (AE* , ) 2 + (AEMl) 2 (2.5)
where:
AE is the width of a photoemission peak at half-maximum, AEx is the line width of the
X-ray source, AEan is the broadening due to the analyzer and AEnat is the natural line
width.
The instrument used was Kratos Axis Ultra-DLD photoelectron spectrometer. Samples
were run using a monochromatic aluminium x-ray source (hv=1486.6ev). Kratos charge
neutralization system was used to minimize sample charging. All high resolution spectra
were run at pass energy of 40ev whilst survey spectra were run at energy of 160ev.
59
Chapter 2
2.5.5 Scanning Electron Microscopy (SEM)
The scanning electron microscopy (SEM) is a type of electron microscope that images
the sample surface by scanning it with a high-energy beam of electrons. The electrons
interact with the atoms that make up the sample producing signals that contain
information about the sample’s surface topography and composition. A beam of electrons
is produced at the top of the microscope by an electron gun. The electron beam follows a
vertical path through the microscope which is held within vacuum. The beam travels
through electromagnetic fields and lenses, which focus the beam down towards the
sample. The energy exchange between the electron beam and the sample results in the
emission of secondary electrons and electromagnetic radiation, which can be detected to
produce an image. The electrons are detected by scintillator-photomultiplier device and
the resulting signal is rendered into a 2 -dimensional intensity distribution that can be
viewed and saved as an image. The brightness of the signal depends on the number of
secondary electrons reaching the detector. If the beam enters the sample peipendicular to
its surface the activated region is uniform about the axis of the beam and a certain
number of electrons ‘escape’ from within the sample. The escape distance of one side of
the beam decreases with an increase in angle of incidence resulting in the emission of
more secondary electrons.
The analysis was performed using a Zeiss Evo-40 series scanning electron microscope.
2.5.6 Energy Dispersive X-ray Spectroscopy (EDX)
Energy Dispersive X-ray Spectroscopy is an analytical technique used for the elemental
analysis of a sample. An electron beam of 10-20 Kev energy strikes the surface of a
60
Chapter 2
conducting sample. The incident beam excites an electron in inner shell, prompting its
ejection resulting in the formation of an electron hole within the atom’s electronic
structure. An electron from an outer, high energy shell fills the hole and the excess
energy is released in the form of an x-ray.
The EDX detector measures the number of emitted x-rays versus their energy. The
energy of the x-ray is characteristic of the element from which x-ray was emitted. The
EDX detector converts the energy of each individual x-ray into a voltage signal of
proportional size. This is achieved through a three stage process. Firstly the x-ray is
converted into a charge by an ionization of atoms in the semiconductor crystals. Secondly
this charge is converted into the voltage signal by the field effect transmitter preamplifier.
Finally the voltage signal is input into the pulse processor for measurement. The output
from the preamplifier is a voltage ramp where each x-ray appears as a voltage step on the
ramp. In traditional EDX analysis in the SEM the spatial resolution is limited to around
one micron by the interaction volume of the beam within the sample.
The equipment used was a Zeiss Evo-40 series SEM in conjunction with INCAx-sight
EDX detector.
61
Chapter 2
2.6 References
1.US Patent, 4605639
2. “Catalyst Handbook” Martyn V. Twigg 1989, 38
3. “Handbook o f heterogeneous catalysts" G. Ertl and H. Knozinger, J. Weikamp 1997, 3,
1080
4. W. A. Dietz, J. Gas Chrom, 1967, 6 8
5. O. Mikes, Ref. therein, M. Van der Riet “Carbon Monoxide Hydrogenation with
Transition Metal Oxide Supported Cobalt and Iron Catalysts", PhD Thesis, University of
Witwatersrand, 1988
62
Chapter 3
Chapter 3
Effect of preparation conditions on the catalytic
performance of CoMnO* catalysts for CO
hydrogenation
3.1 Introduction
As discussed in chapter 1, the development of a suitable catalyst for the synthesis of
selective products through Fischer Tropsch reaction is commercially attractive. There has
been renewed interest in recent years in selective production of petrochemical feedstocks
such as ethylene, propylene and butylenes (C2-C4 olefins) directly from synthesis gas [1-
8 ]. Whatever the operating conditions, the FT reaction always produces a wide range of
hydrocarbons and oxygenated products.
63
Chapter 3
Methane, an unwanted product, is always present and its selectivity can vary from as low
as about 1% up to 100%. At the other end of the product stream, the selectivity of longer
chain linear waxes can vary from zero to over 70%. The intermediate carbon number
products between the two extremes are only produced in limited amounts. Thus it seems
to be impossible to produce, on a carbon number basis, more than about 18% C2,about
16% C3,about 42% gasoline/naphtha (C5 to 200°C BP) and about 20% diesel fuel (200 to
320°C) [9].
The range of carbon number products can be varied by altering the operating temperature,
the type of catalyst, the amount or type of promoter present, the feed gas composition, the
operating pressure or the type of reactor used. Whatever the process conditions, there is
always a clear interrelationship between all of the products formed.
An approach to improve the selectivity of the classical FT process for conversion of
syngas to hydrocarbons involves the use of a bifunctional catalyst system containing a
metal catalyst (FT catalyst) combined with a support. The FT reaction with cobalt-based
catalysts has been studied extensively [10-15] and it has been shown that cobalt-based
catalysts are superior to other metal catalysts typically iron-based catalysts. Co-Mn
catalysts favour olefins formation [16, 17] more than the other Co-based bimetallic
catalysts. The Co-Mn catalysts are mainly composed of metallic cobalt particles
dispersed on MnO [18].
There was growing interest in manganese oxide during the 1970s for the synthesis of
light alkenes [19-21]. Many catalysts were patented during this time for the synthesis of
light alkenes from iron and manganese oxide catalysts that demonstrated high selectivity
64
Chapter 3
for C2-C4 alkenes. This early work brought about the realization that manganese oxide
could be used for the promotion of light alkenes selectivity with iron catalysts and this
resulted in a diverse range of research established on the basis of this system. The
addition of manganese to Co catalysts has been proved to bring about a significant
increase in the formation of light alkenes and a decrease in methane selectivity [22-29],
Manganese as a promoter can improve the dispersion of the Co active component and
suppresses carbon chain growth as well as deep hydrogenation of primary FT products,
leading to high selectivity of lower alkenes.
Van der Riet [30] has reported the best results so far with CoMnOx catalysts for the direct
synthesis of light alkenes from syngas. He has observed C3 hydrocarbons as the major
product with comparatively low Cj and C2 selectivities. The total C3 selectivity increased
with increasing conversion which was achieved by increasing temperature or pressure
whilst Ci and C2 remain low. For example for a CoMnOx catalyst with Co/Mn = 1:1 at
220°C, at conversions of ca.40 mole %, C3 selectivities of ca.20 mass % were reported
with a corresponding CH4 selectivity of 7-8.5 mass %. This catalyst was stabilized after
ca.l2 0 h.
Ground pelletelised catalysts consisting of a co-precipitated mixture of cobalt and a
partially reducible manganese oxide gave excellent yields of olefins from synthesis gas
[31-34]. These investigations were carried out in micro reactors and it was found that
only small amounts of carbon dioxide appeared in the products. Copperthwaite et al. [33]
attributed the formation of carbon dioxide to the oxidation of carbon monoxide using
CoMnOx catalysts. The same catalyst has however been shown to be an excellent water
gas shift (WGS) catalyst [35] at higher reaction temperatures (300-400°C).
65
Chapter 3
Keyser et al. [36] undertook an investigation 10 years afterwards to establish the
performance of the cobalt/manganese oxide catalyst for the conversion of carbon
monoxide with hydrogen under conditions favouring the formation of gaseous, liquid and
solid (i.e. wax) hydrocarbons. The catalyst required a fairly long stabilization period and
produced an industrially viable product stream. They observed a significant water gas
shift (WGS) reaction activity under Fischer Tropsch synthesis conditions (2100 kPa,
220°C). The WGS activity increased with increasing manganese oxide content but
decreased with an increase in pressure from 600 to 2100 kPa. The yield of olefm was
most favourable at short reaction times (time on stream) but decreased significantly as a
result of hydrogenation at long reaction times. They have also reported the effect of
pressure variation on selectivity of olefins. A lower olefin yield was observed at high
pressure of syngas.
Co-Mn catalysts have been investigated intensively for their higher selectivity to lower
molecular weight olefins [37, 38] but the present studies have been focussed mainly on
the improvement of the preparation method and the characterization of the catalysts. The
effect of a wide range of preparation variables on the structure and morphology of
precipitated cobalt manganese catalyst for FT synthesis has been studied. These variables
include the molar ratio of Co: Mn, precipitate ageing time, pH and temperature of
precipitation, and choice of precipitation agents. Optimum preparation conditions have
been decided on the basis of the catalytic results. The effects of reaction variables
(reaction temperature and pressure) have also been studied in order to define the best
reaction conditions for further studies. Particular attention has been paid to collect all
liquids and waxes to get a full mass balance along with gas phase data.
66
Chapter 3
3.2 Catalyst preparation and pre-treatment
All catalysts going to be discussed in the following sections were prepared by
coprecipitation according to the methods detailed in chapter 2. All of these catalysts were
reduced under pure hydrogen at 400°C for 16h before reaction with syngas. Detailed
reaction conditions are given along with results.
3.3 Effect of preparation conditions
The effect of a range of preparation variables at the precursor stage of cobalt manganese
oxide catalysts has been investigated and the optimum preparation conditions are
identified with respect to catalytic activity for the CO hydrogenation.
It is important to mention that there is considerable variation in the catalytic activity of
CoMnOx catalysts and they require ~ 100 h to become stabilized. Hence, all the catalysts
discussed in this chapter were stabilized for 80-100 h.
3.3.1 Effect of constant and variable pH on the coprecipitation of CoMnOx
3.3.1.1 Catalyst preparation at constant pH
Initial catalyst preparation was done by coprecipitation of cobalt and manganese nitrates
heated at 70°C with ammonium hydroxide solution preheated at 70°C at pH of 8.30 as
detailed in chapter 2. All efforts were made to control pH in the range of +/-0.01 as this
is an important factor for CoMnOx catalyst [30]. The temperature of coprecipitation
affects the metal ratio in the catalyst which has a subsequent effect on the catalytic
activity; thus the temperature of precipitation mixture was adjusted to 70°C and a buchner
67
Chapter 3
funnel was heated in the oven prior to filtration process in order to avoid uncontrolled
precipitation, particularly of manganese species. Precipitation was done in the sealed
reaction vessel and there was minimal contact of oxygen in order to avoid the oxidation
of manganese species. The whole slurry consisted of a homogeneous mixture of
precipitates and there was no appearance of black particles indicating oxidation of
manganese. All tubes of short size were used for the flow of mixed nitrates solutions and
ammonia solutions in order to avoid the temperature fluctuation. Large pore size filter
paper (Whatman filter paper no. 14) was used for very quick filtration and due to its
ability to retain a larger portion of the precipitated catalyst. Percent yield of most of these
catalysts was 40-50%.
Catalytic tests were carried out in single bed reactor detailed in chapter 2. In a typical
experiment the catalyst (2 g, 0.6-0.85 mm) was reduced with H2 (GHSV = 300 h '1, 400°C,
atmospheric pressure) in a fixed bed stainless steel reactor. A mixture of CO/H2/N2 (47.5:
47.5: 5) was allowed to react over the reduced catalyst at a GHSV = 300 h' 1 at pressure of
6 bar. Liquid products were collected in a trap held at 20°C and analyzed by off-line gas
chromatography, and the residual gaseous product was analyzed by on-line gas
chromatography (FID and TCD).
68
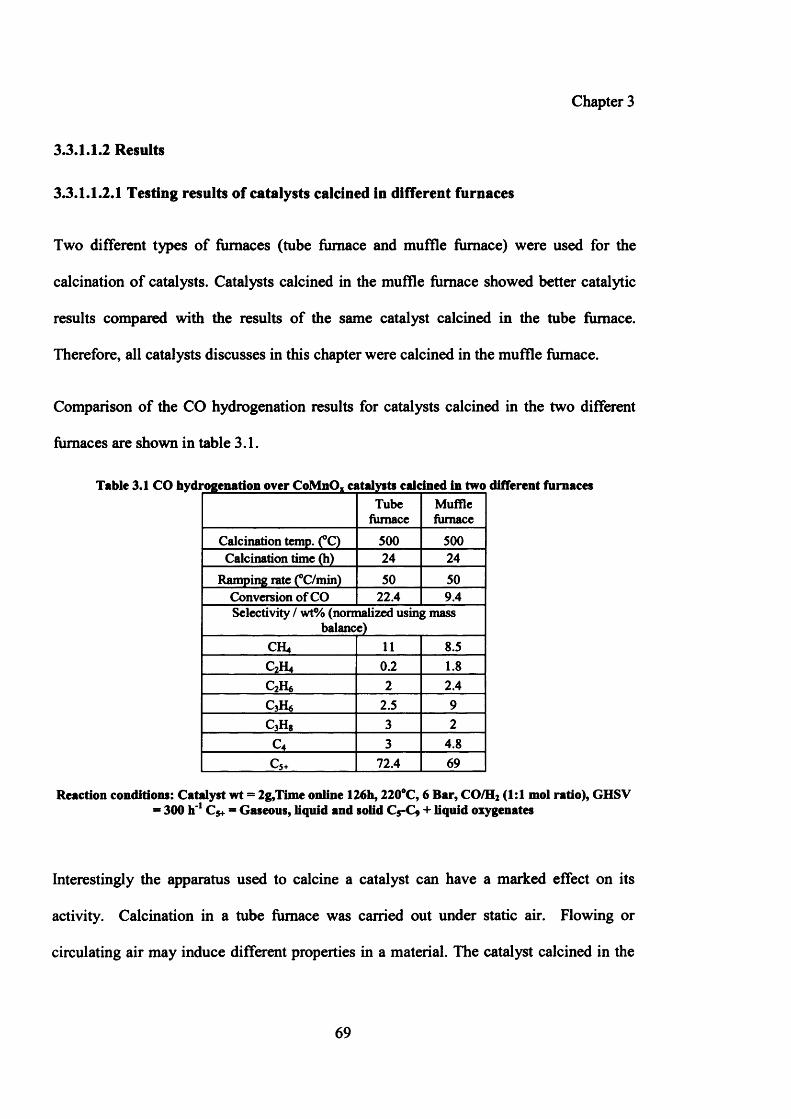
Chapter 3
3.3.1.1.2 Results
3.3.1.1.2.1 Testing results of catalysts calcined in different furnaces
Two different types of furnaces (tube furnace and muffle furnace) were used for the
calcination of catalysts. Catalysts calcined in the muffle furnace showed better catalytic
results compared with the results of the same catalyst calcined in the tube furnace.
Therefore, all catalysts discusses in this chapter were calcined in the muffle furnace.
Comparison of the CO hydrogenation results for catalysts calcined in the two different
furnaces are shown in table 3.1.
Table 3.1 CO hydrogenation over CoMnO, catalysts calcined in two different furnacesTube
furnaceMufflefurnace
Calcination temp. (°C) 500 500Calcination time (h) 24 24
Ramping rate (°C/min) 50 50Conversion of CO 22.4 9.4Selectivity / wt% (normalized using mass
balance)CH4 1 1 8.5C2H4 0 . 2 1 . 8
QHo 2 2.4C3H6 2.5 9c 3h 8 3 2
C4 3 4.8c 5+ 72.4 69
Reaction conditions: Catalyst wt = 2g,Time online 126h, 220°C, 6 Bar, CO/H2 (1:1 mol ratio), GHSV = 300 h' 1 C$4. - Gaseous, liquid and solid C5-C9 + liquid oxygenates
Interestingly the apparatus used to calcine a catalyst can have a marked effect on its
activity. Calcination in a tube furnace was carried out under static air. Flowing or
circulating air may induce different properties in a material. The catalyst calcined in the
69
Chapter 3
tube furnace was good in catalytic activity with high conversion but the selectivity to
alkenes was very low. On the other hand the catalyst calcined in the muffle furnace
showed very good selectivity to light alkenes particularly ethylene and propylene
although conversion was low under similar reaction conditions.
Catalyst calcined in tube furnace was found to be more active for CO conversion with
lower selectivity to alkenes. On the other hand catalyst calcined in muffle furnace was
highly selective to formation of alkenes although CO conversion was low.
3.3.1.1.2.2 Characterization for catalysts calcined in different furnaces
(i) BET surface area
The surface areas of CoMnOx solids obtained with calcination in different furnaces were
measured using the BET method. For catalysts calcined in the tube furnace, the BET
surface area was 15 m /g, whereas for the catalyst calcined in the muffle furnace the BET
surface area was 9 m2/g. The increase in surface area of the catalyst calcined in tube
furnace may result in a more active material leading to an enhancement in CO conversion.
(ii)XRD
The XRD pattern of catalyst calcined in the muffle furnace is compared with the XRD
pattern of catalyst calcined in the tube furnace in figure 3.1. Both catalysts show typical
mixed spinel oxide structure of CoMnOx along with some phases of Mn3 0 4 . There is no
major difference between the XRD patterns of catalysts calcined in the different furnaces.
70
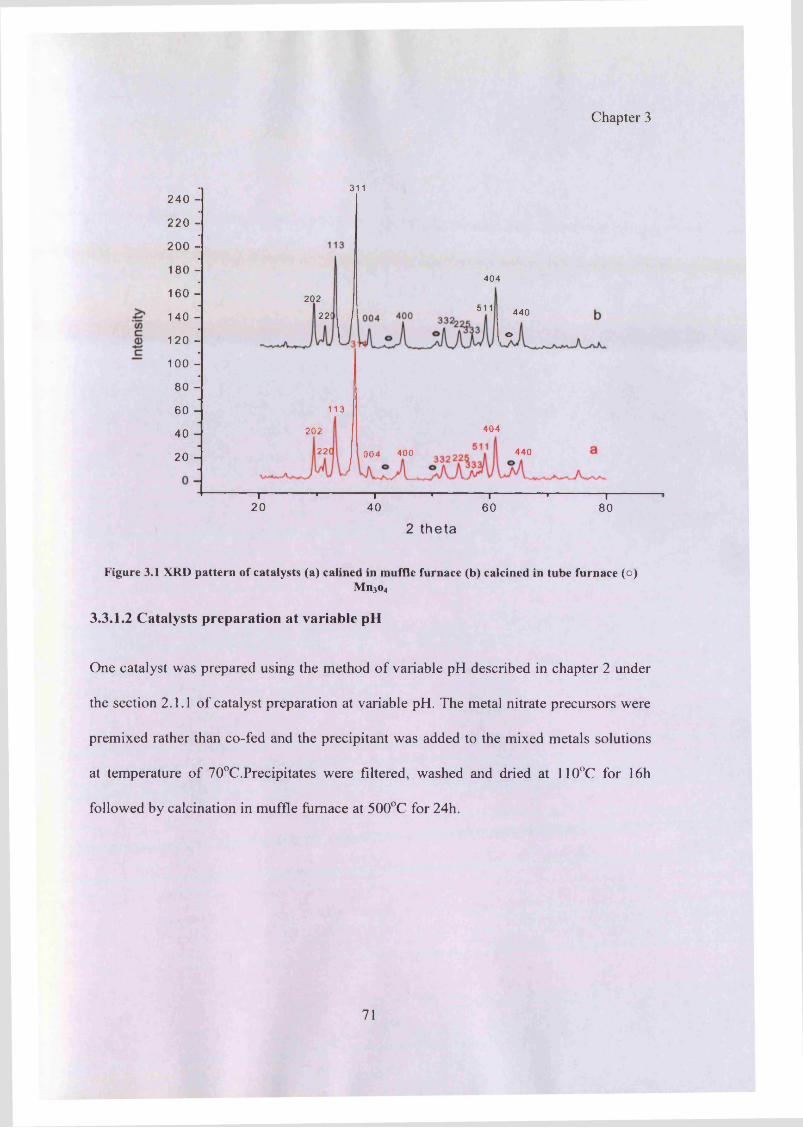
Chapter 3
311240 -
220 -
200 -
180 -404
160 - 202511 440140 - 2 2 !
o120 -
100 -
80 -
60 - 113
40420240 -
22 440004 40020 -
T T T T T TT20 40 60 80
2 theta
Figure 3.1 XRD pattern of catalysts (a) calined in muffle furnace (b) calcined in tube furnace (o)Mn3o4
3.3.1.2 Catalysts preparation at variable pH
One catalyst was prepared using the method o f variable pH described in chapter 2 under
the section 2.1.1 o f catalyst preparation at variable pH. The metal nitrate precursors were
premixed rather than co-fed and the precipitant was added to the mixed metals solutions
at temperature of 70°C.Precipitates were filtered, washed and dried at 110°C for 16h
followed by calcination in muffle furnace at 500°C for 24h.
71
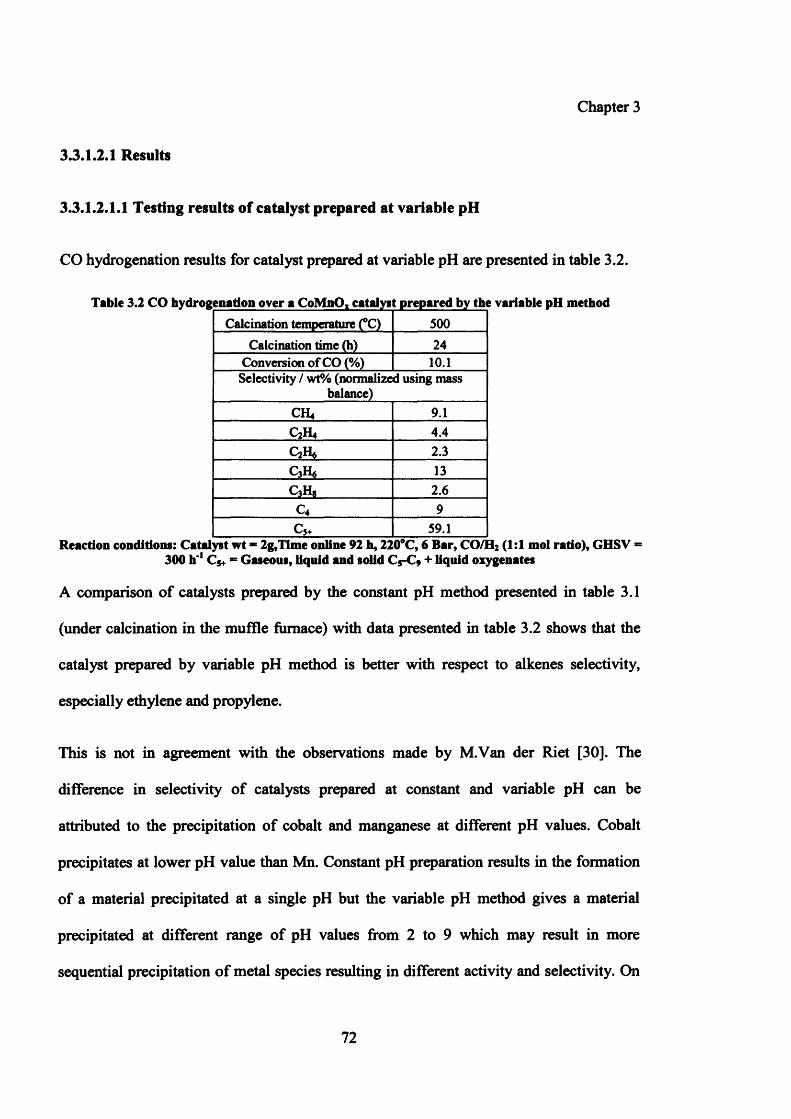
Chapter 3
3.3.1.2.1 Results
3.3.1.2.1.1 Testing results of catalyst prepared at variable pH
CO hydrogenation results for catalyst prepared at variable pH are presented in table 3.2.
Table 3.2 CO hydrogenation over a CoMnO, catalyst prepared by the variable pH methodCalcination temperature (°C) 500
Calcination time (h) 24Conversion of CO (%) 1 0 . 1
Selectivity / wt% (normalized using mass balance)
CH4 9.1C2H4 4.4C2H6 2.3C A 13c 3h 8 2 . 6
c 4 9C5+ 59.1
Reaction conditions: Catalyst wt * 2g,Time online 92 h, 220°C, 6 Bar, CO/H2 (1:1 mol ratio), GHSV = 300 h 1 Cjt = Gaseous, liquid and solid C5-C9 + liquid oxygenates
A comparison of catalysts prepared by the constant pH method presented in table 3.1
(under calcination in the muffle furnace) with data presented in table 3.2 shows that the
catalyst prepared by variable pH method is better with respect to alkenes selectivity,
especially ethylene and propylene.
This is not in agreement with the observations made by M.Van der Riet [30]. The
difference in selectivity of catalysts prepared at constant and variable pH can be
attributed to the precipitation of cobalt and manganese at different pH values. Cobalt
precipitates at lower pH value than Mn. Constant pH preparation results in the formation
of a material precipitated at a single pH but the variable pH method gives a material
precipitated at different range of pH values from 2 to 9 which may result in more
sequential precipitation of metal species resulting in different activity and selectivity. On
72
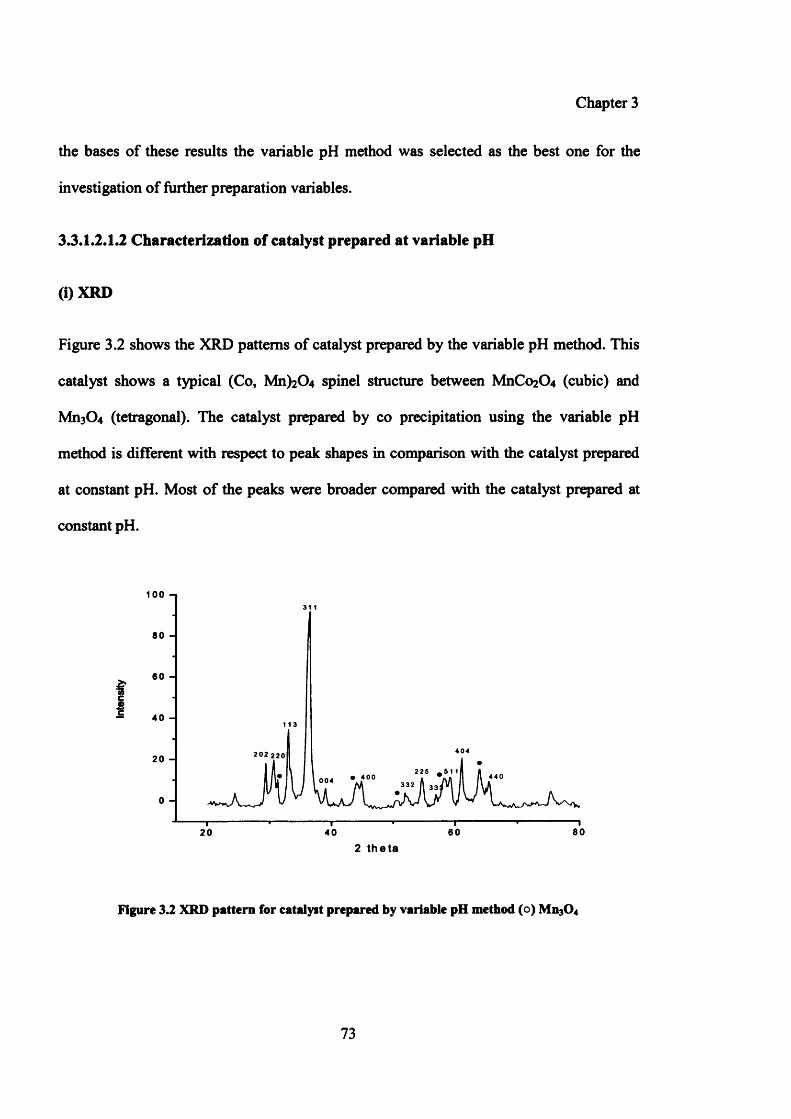
Chapter 3
the bases of these results the variable pH method was selected as the best one for the
investigation of further preparation variables.
3.3.1.2.1.2 Characterization of catalyst prepared at variable pH
(i) XRD
Figure 3.2 shows the XRD patterns of catalyst prepared by the variable pH method. This
catalyst shows a typical (Co, Mn)2C>4 spinel structure between MnCo2C>4 (cubic) and
Mn3<34 (tetragonal). The catalyst prepared by co precipitation using the variable pH
method is different with respect to peak shapes in comparison with the catalyst prepared
at constant pH. Most of the peaks were broader compared with the catalyst prepared at
constant pH.
1 0 0 - i
8 0 -
6 0 -
4 0 -
2 0 2 2 2 020 -
2 25• 4 0 00 0 43 3 :
8 06 020 4 0
2 theta
Figure 3.2 XRD pattern for catalyst prepared by variable pH method (o) Mn30 4
73
Chapter 3
(ii) BET
The surface area of the catalyst prepared by the variable pH process was 10m2/g which is
similar to the catalyst prepared at constant pH. These results show that pH variation
results in slightly different bulk structure but it does not affect the surface of catalyst.
33.2 Effect of variation of metals ratios (Co and Mn)
3.3.2.1 Results
33.2.1.1 Testing results of catalysts prepared with variation of metal ratios (Co: Mn)
Five new batches of catalysts were prepared with different ratios of cobalt and
manganese metals in the starting solutions, using the variable pH method of precipitation.
All the experiments reported in the following paragraphs were done in the 6 -bed reactor
detailed in chapter 2. The catalyst (0.5 g, 0.6-0.85 mm) was reduced with H2 (GHSV =
600 h'1, 400°C, atmospheric pressure). A mixture of CO/H2/N2 (47.5: 47.5: 5) was
allowed to react over the reduced catalyst at a GHSV = 600 h' 1 at pressure of 6 bar.
Liquid products were collected in a trap held at 20°C . Table 3.3 shows a comparison of
catalytic data for catalysts prepared with different Co: Mn ratios.
The catalyst prepared with a 1:1 ratio (Co: Mn) showed better selectivity to light alkenes
along with less methane. Catalysts prepared with metal ratios of Co: Mn = 1:1.3 and Co:
Mn = 1.3:1 have comparable activity and selectivity with the catalyst prepared with 1: 1
which shows similar nature of all three catalysts. On the other hand the catalysts prepared
74
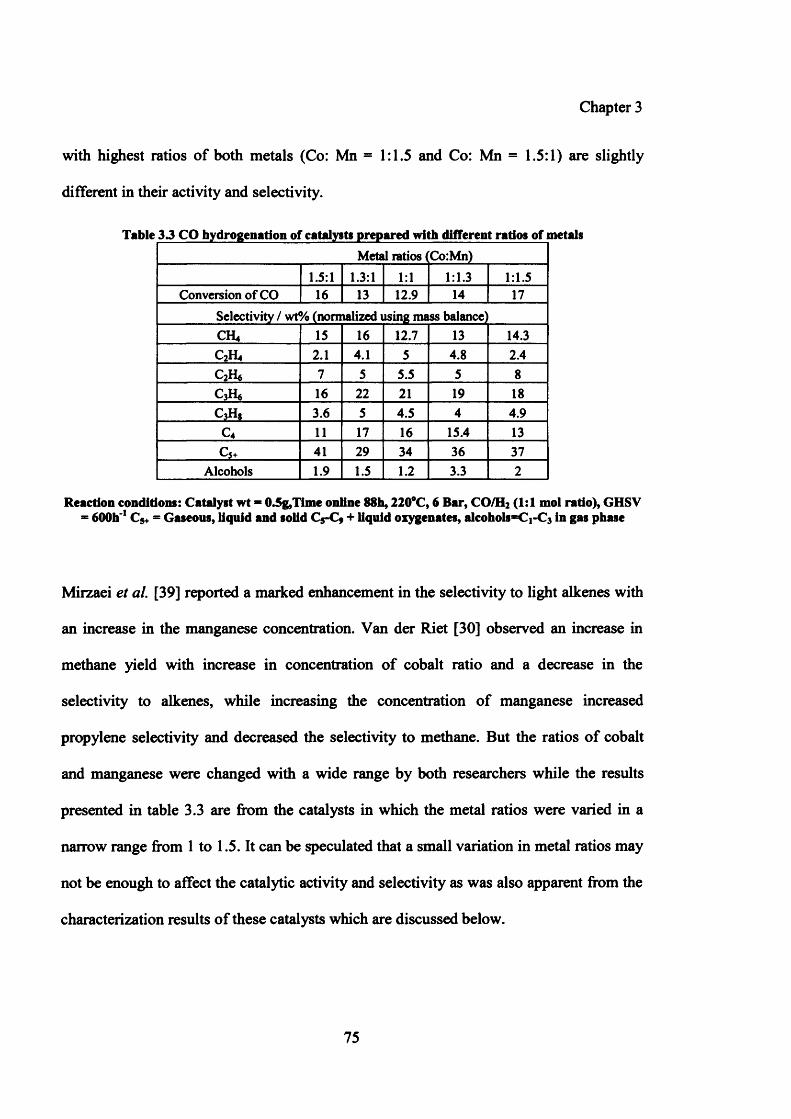
Chapter 3
with highest ratios of both metals (Co: Mn = 1:1.5 and Co: Mn = 1.5:1) are slightly
different in their activity and selectivity.
Table 3 3 CO hydrogenation of catalysts prepared with different ratios of metalsMetal ratios lCo:Mn)
1.5:1 1.3:1 1 : 1 1:1.3 1:1.5Conversion of CO 16 13 12.9 14 17
Selectivity / wt% (normalized using mass balance'CH4 15 16 12.7 13 14.3C2H4 2 . 1 4.1 5 4.8 2.4C2IU 7 5 5.5 5 8
c 3h« 16 2 2 2 1 19 18c 3h 8 3.6 5 4.5 4 4.9
c 4 1 1 17 16 15.4 13c 5+ 41 29 34 36 37
Alcohols 1.9 1.5 1 . 2 3.3 2
Reaction conditions: Catalyst wt * 0.5g,Time online 88b, 220°C, 6 Bar, CO/H2 (1:1 mol ratio), GHSV * 600b'1 Cg+ = Gaseous, liquid and solid C5-C* + liquid oxygenates, alcohols =Ci-C3 in gas phase
Mirzaei et al. [39] reported a marked enhancement in the selectivity to light alkenes with
an increase in the manganese concentration. Van der Riet [30] observed an increase in
methane yield with increase in concentration of cobalt ratio and a decrease in the
selectivity to alkenes, while increasing the concentration of manganese increased
propylene selectivity and decreased the selectivity to methane. But the ratios of cobalt
and manganese were changed with a wide range by both researchers while the results
presented in table 3.3 are from the catalysts in which the metal ratios were varied in a
narrow range from 1 to 1.5. It can be speculated that a small variation in metal ratios may
not be enough to affect the catalytic activity and selectivity as was also apparent from the
characterization results of these catalysts which are discussed below.
75
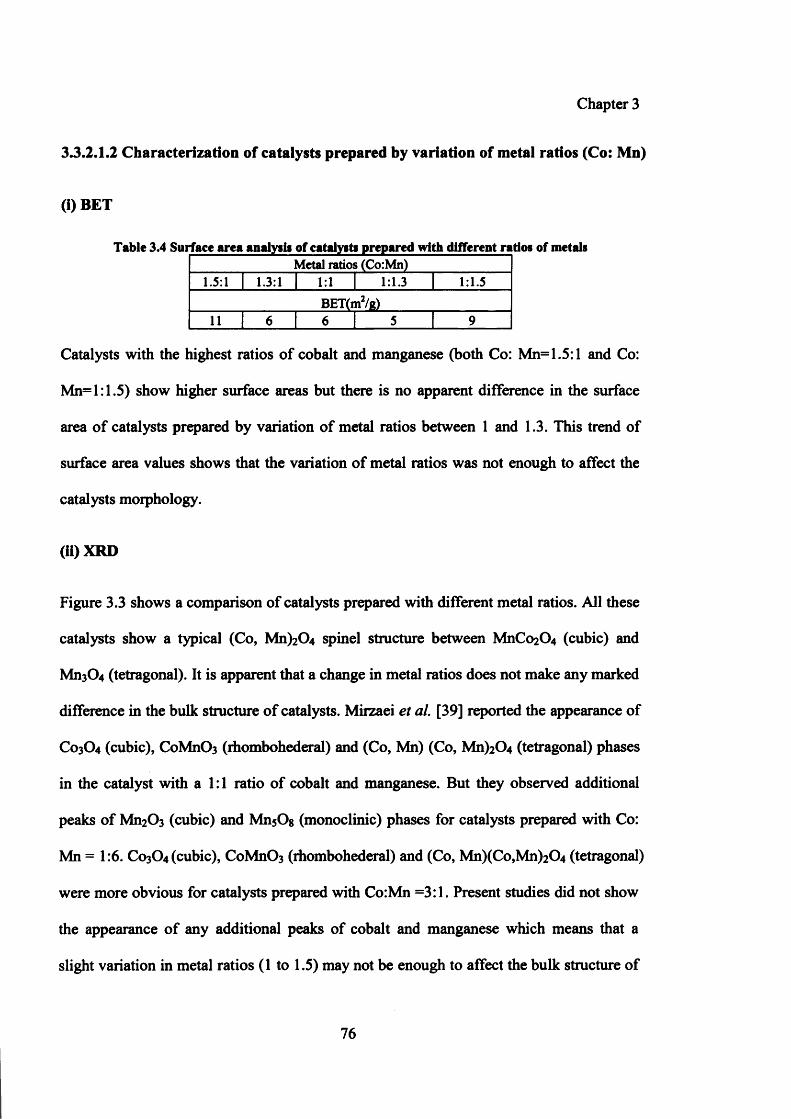
Chapter 3
3.3.2.1.2 Characterization of catalysts prepared by variation of metal ratios (Co: Mn)
(i) BET
Table 3.4 Surface area analysis of cataly»t» prepared with different ratios of metalsMetal ratios (Co:Mn)
1.5:1 1.3:1
11 | 6
1:1BET(m2/g)
1:1.3 1:1.5
Catalysts with the highest ratios of cobalt and manganese (both Co: Mn= 1.5:1 and Co:
Mn=l:1.5) show higher surface areas but there is no apparent difference in the surface
area of catalysts prepared by variation of metal ratios between 1 and 1.3. This trend of
surface area values shows that the variation of metal ratios was not enough to affect the
catalysts morphology.
(ii)XRD
Figure 3.3 shows a comparison of catalysts prepared with different metal ratios. All these
catalysts show a typical (Co, Mn)2C>4 spinel structure between MnCo2C>4 (cubic) and
Mn3C>4 (tetragonal). It is apparent that a change in metal ratios does not make any marked
difference in the bulk structure of catalysts. Mirzaei et al. [39] reported the appearance of
C0 3 O4 (cubic), CoMnC>3 (rhombohederal) and (Co, Mn) (Co, Mn)2C>4 (tetragonal) phases
in the catalyst with a 1:1 ratio of cobalt and manganese. But they observed additional
peaks of Mn2C>3 (cubic) and MnsOg (monoclinic) phases for catalysts prepared with Co:
Mn = 1:6 . C0 3 O4 (cubic), CoMnC>3 (rhombohederal) and (Co, Mn)(Co,Mn)2C>4 (tetragonal)
were more obvious for catalysts prepared with Co:Mn =3:1. Present studies did not show
the appearance of any additional peaks of cobalt and manganese which means that a
slight variation in metal ratios (1 to 1.5) may not be enough to affect the bulk structure of
76
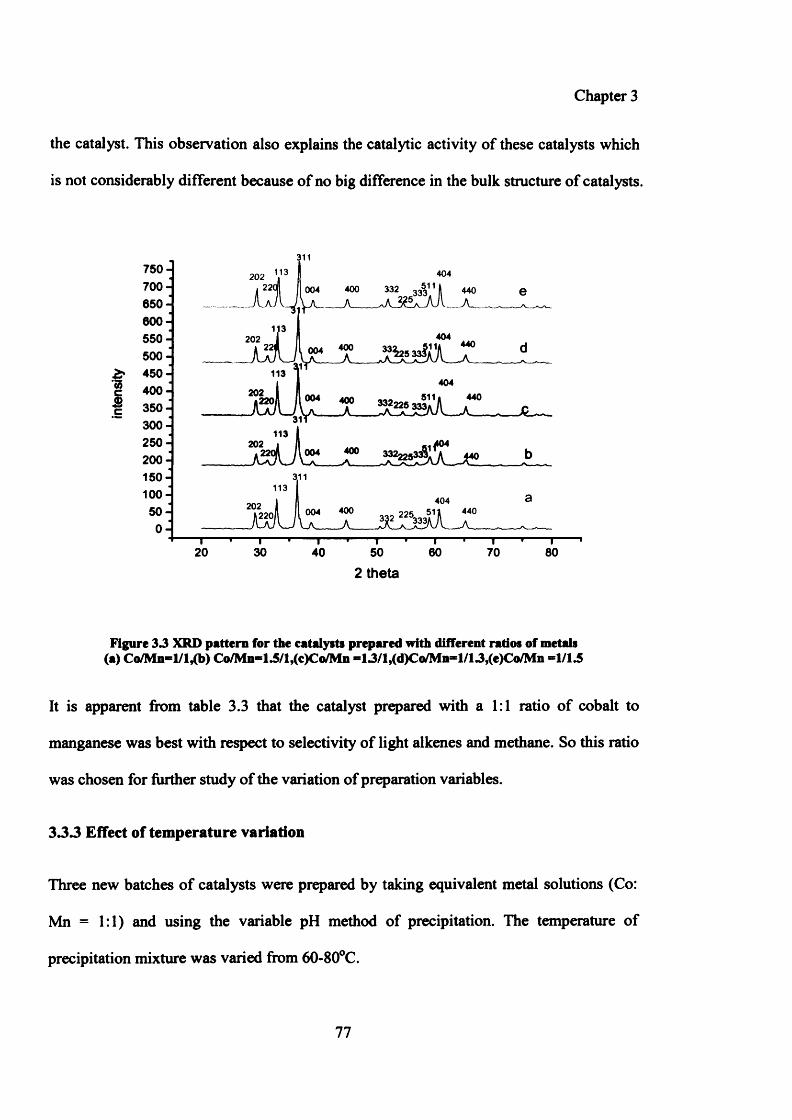
Chapter 3
the catalyst. This observation also explains the catalytic activity of these catalysts which
is not considerably different because of no big difference in the bulk structure of catalysts.
750-700-650-600-550-500-
£* 450-35c©c
400-350-300-250-200 -
150-100 -
50-0 -
004 400
"T"20
"T"30
i40
404
440
404ii* 440 d
404511< 440
004 r p
i50
404
—r~60
I70
“T"80
2 theta
Figure 3 3 XRD pattern for the catalysts prepared with different ratios of metals(a) C o/M n-l/l^b) Co/M n*13/l,(c)Co/M n «13/l,(d)Co/M n>l/13,(e)Co/M n -1 /1 3
It is apparent fix>m table 3.3 that the catalyst prepared with a 1:1 ratio of cobalt to
manganese was best with respect to selectivity of light alkenes and methane. So this ratio
was chosen for further study of the variation of preparation variables.
3 3 3 Effect of temperature variation
Three new batches of catalysts were prepared by taking equivalent metal solutions (Co:
Mn = 1:1) and using the variable pH method of precipitation. The temperature of
precipitation mixture was varied from 60-80°C.
77
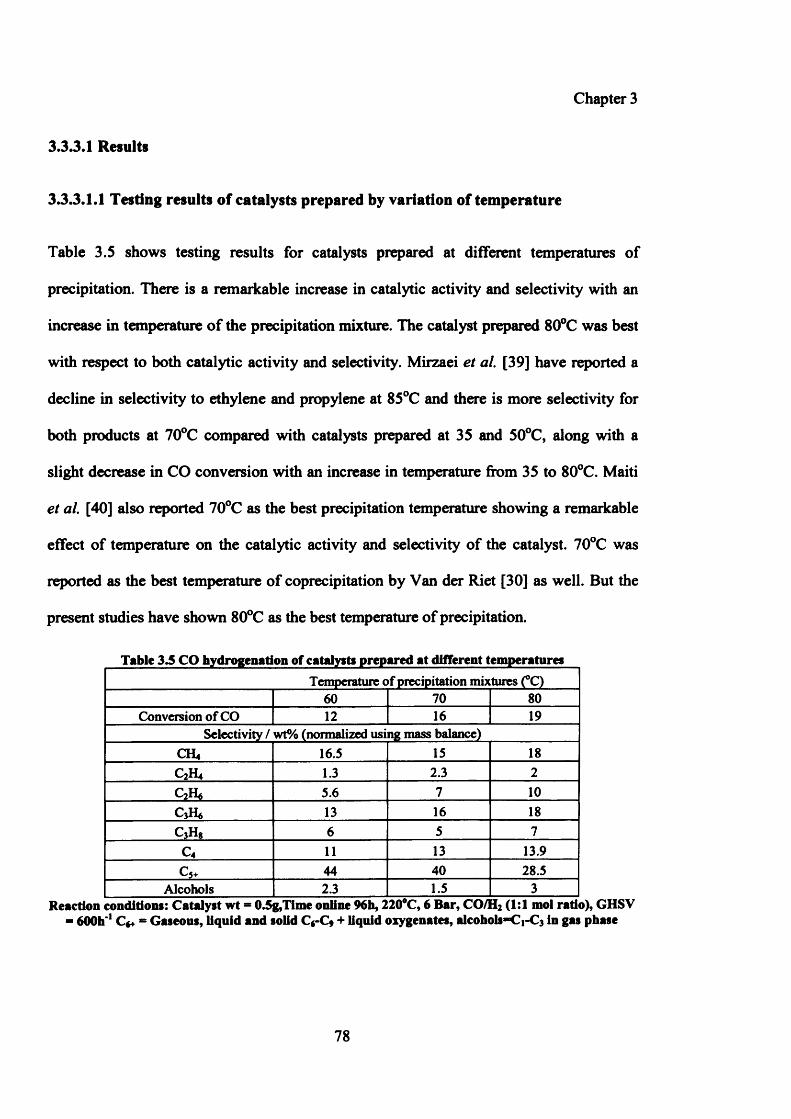
Chapter 3
3.3.3.1 Results
333.1.1 Testing results of catalysts prepared by variation of temperature
Table 3.5 shows testing results for catalysts prepared at different temperatures of
precipitation. There is a remarkable increase in catalytic activity and selectivity with an
increase in temperature of the precipitation mixture. The catalyst prepared 80°C was best
with respect to both catalytic activity and selectivity. Mirzaei et al. [39] have reported a
decline in selectivity to ethylene and propylene at 85°C and there is more selectivity for
both products at 70°C compared with catalysts prepared at 35 and 50°C, along with a
slight decrease in CO conversion with an increase in temperature from 35 to 80°C. Maiti
et al. [40] also reported 70°C as the best precipitation temperature showing a remarkable
effect of temperature on the catalytic activity and selectivity of the catalyst. 70°C was
reported as the best temperature of coprecipitation by Van der Riet [30] as well. But the
present studies have shown 80°C as the best temperature of precipitation.
Table 3.5 CO hydrogenation of catalysts prepared at different temperaturesTemperature of precipitation mixtures (°C)
60 70 80Conversion of CO 1 2 16 19
Selectivity / wt% (normalized using mass balance)CH4 16.5 15 18C2H4 1.3 2.3 2
5.6 7 1 0
c 3h* 13 16 18c 3h 8 6 5 7
c 4 1 1 13 13.9
c 5+ 44 40 28.5Alcohols 2.3 1.5 3
Reaction conditions: Catalyst wt = 0ig,T im e online 96b, 220°C, 6 Bar, CO/H2 (1:1 mol ratio), GHSV - 600b*1 C*+ - Gaseous, liquid and solid Cr C, + liquid oxygenates, alcohols-Cj-Q in gas phase
78
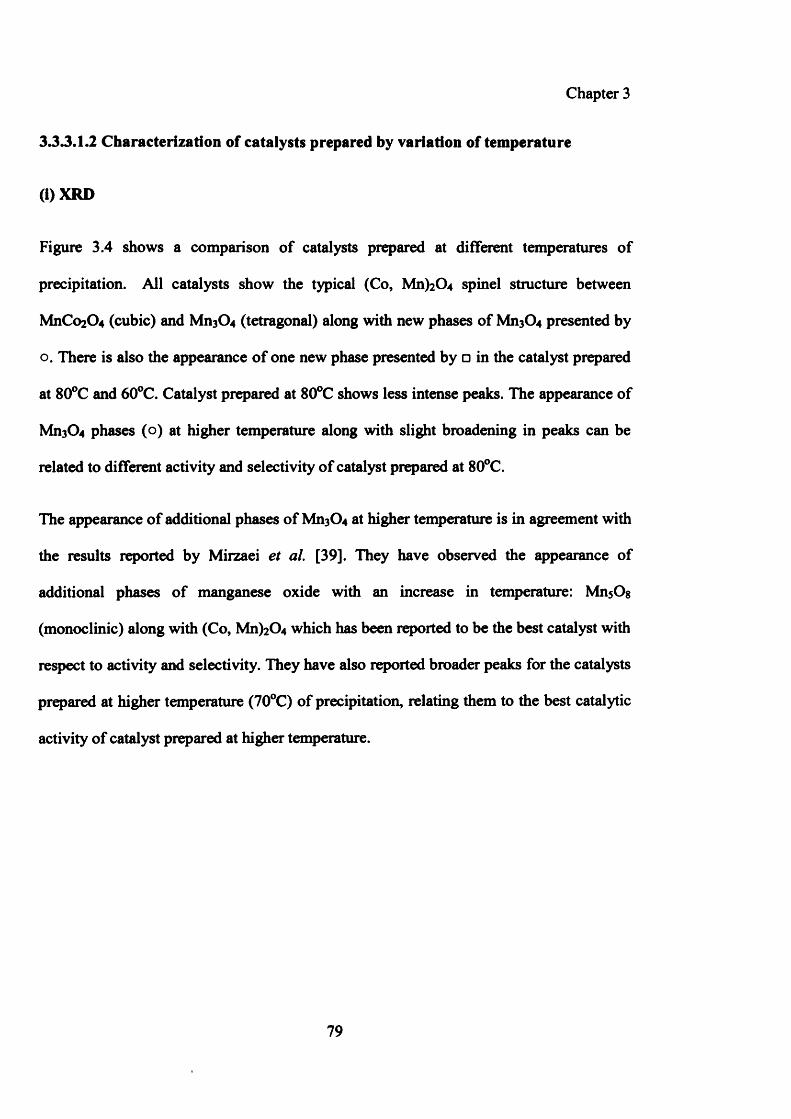
Chapter 3
33.3.1.2 Characterization of catalysts prepared by variation of temperature
(i)XRD
Figure 3.4 shows a comparison of catalysts prepared at different temperatures of
precipitation. All catalysts show the typical (Co, Mn^CU spinel structure between
MnCo2 0 4 (cubic) and Mn3 0 4 (tetragonal) along with new phases of Mn3 0 4 presented by
o. There is also the appearance of one new phase presented by □ in the catalyst prepared
at 80°C and 60°C. Catalyst prepared at 80°C shows less intense peaks. The appearance of
Mn3<Z>4 phases (o) at higher temperature along with slight broadening in peaks can be
related to different activity and selectivity of catalyst prepared at 80°C.
The appearance of additional phases of Mn3 0 4 at higher temperature is in agreement with
the results reported by Mirzaei et al. [39]. They have observed the appearance of
additional phases of manganese oxide with an increase in temperature: Mn$Og
(monoclinic) along with (Co, Mn)2C>4 which has been reported to be the best catalyst with
respect to activity and selectivity. They have also reported broader peaks for the catalysts
prepared at higher temperature (70°C) of precipitation, relating them to the best catalytic
activity of catalyst prepared at higher temperature.
79
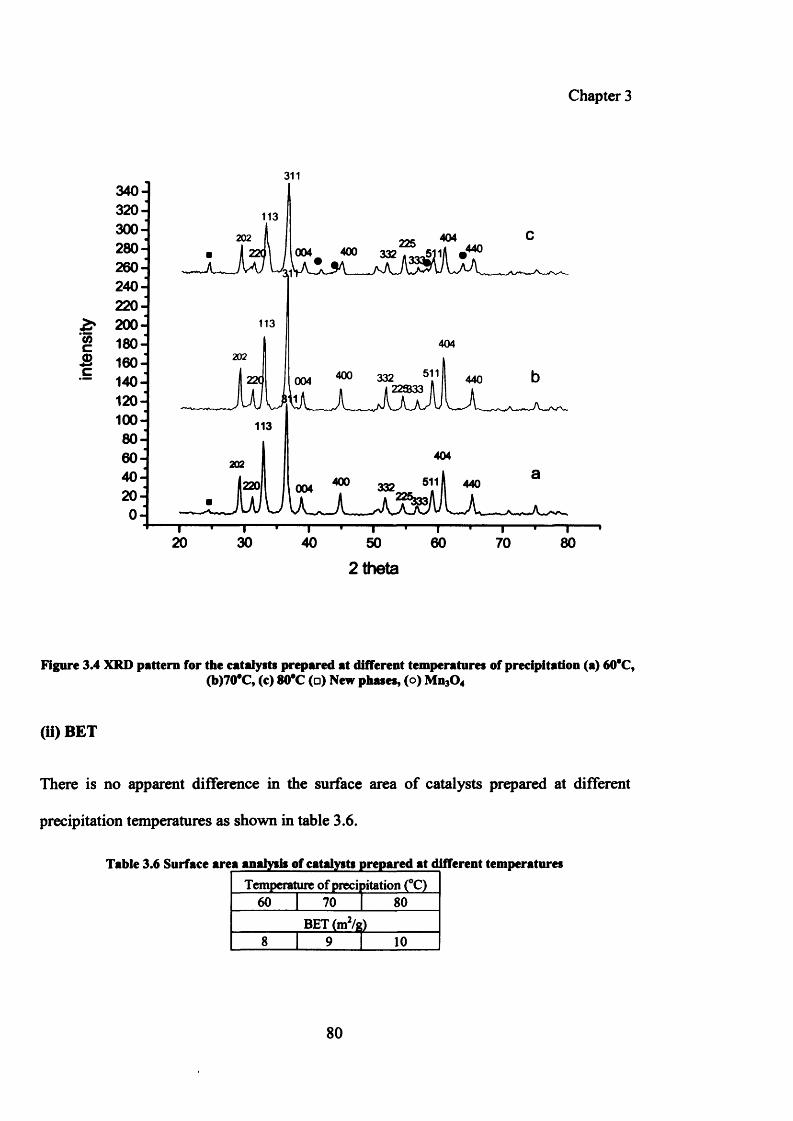
Chapter 3
340-320-300-280-260-240-220-200-
0)c 180-& 160-
140-120-100-80-60-40-20-0-
004 « 332w 5" l | 440
lA ^JL -A ^U U L -^^“ I-------- r— I-------1--------1--------1------- 1--------1------- 1------- r20 30 40 50 60
2 theta
” i r70
" " ’I "" >
80
Figure 3.4 XRD pattern for the catalysts prepared at different temperatures of precipitation (a) 60°C,(b)70#C, (c) 80*C (□) New phases, (o) Mn30 4
(ii) BET
There is no apparent difference in the surface area of catalysts prepared at different
precipitation temperatures as shown in table 3.6.
Table 3.6 Surface area analysis of catalysts prepared at different temperaturesTemperature of precipitation (°C)
60 70 80BET (m2/a)
8 9 10
80
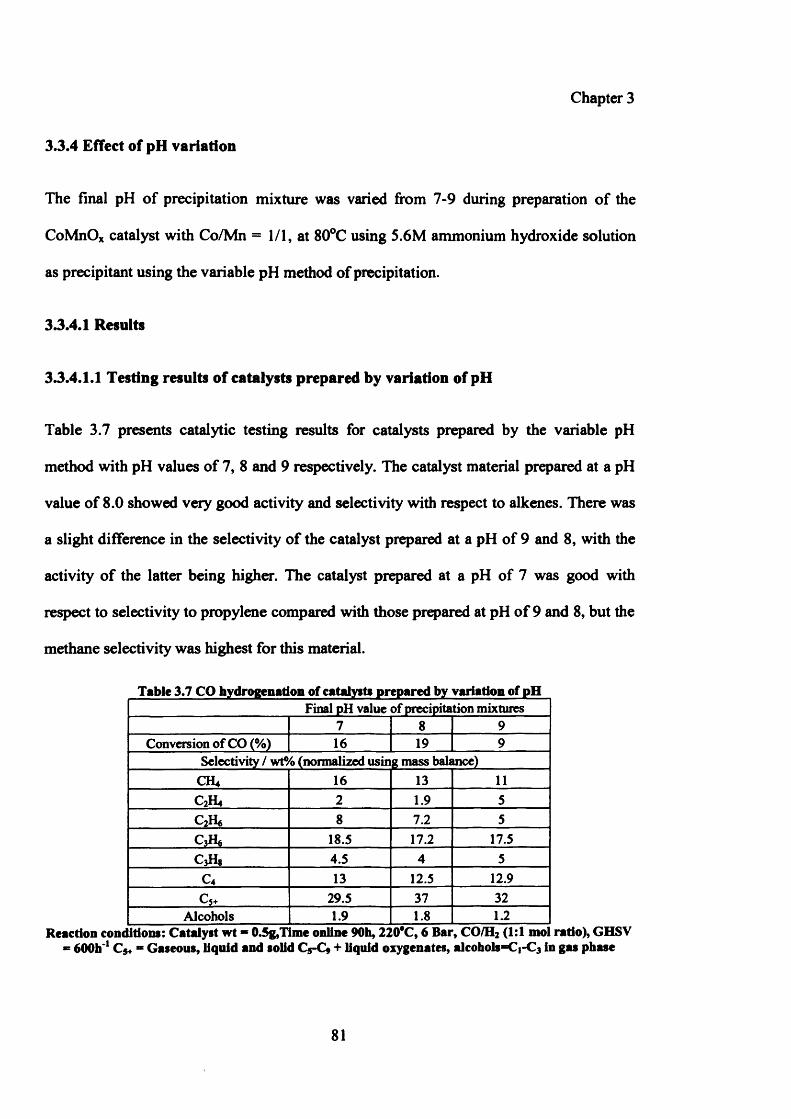
Chapter 3
3.3.4 Effect of pH variation
The final pH of precipitation mixture was varied from 7-9 during preparation of the
CoMnOx catalyst with Co/Mn = 1/1, at 80°C using 5.6M ammonium hydroxide solution
as precipitant using the variable pH method of precipitation.
33.4.1 Results
3.3.4.1.1 Testing results of catalysts prepared by variation of pH
Table 3.7 presents catalytic testing results for catalysts prepared by the variable pH
method with pH values of 7, 8 and 9 respectively. The catalyst material prepared at a pH
value of 8.0 showed very good activity and selectivity with respect to alkenes. There was
a slight difference in the selectivity of the catalyst prepared at a pH of 9 and 8 , with the
activity of the latter being higher. The catalyst prepared at a pH of 7 was good with
respect to selectivity to propylene compared with those prepared at pH of 9 and 8 , but the
methane selectivity was highest for this material.
Table 3.7 CO hydrogenation of catalyst* prepared by variation of pHFinal pH value of precipitation mixtures
7 8 9Conversion of CO (%) 16 19 9
Selectivity / wt% (normalized using mass balance)CH4 16 13 1 1
C2H4 2 1.9 5
C * 8 7.2 5C ,ih 18.5 17.2 17.5CjHg 4.5 4 5
C4 13 12.5 12.9c 5+ 29.5 37 32
Alcohols 1.9 1 . 8 1 . 2
Reaction conditions: Catalyst wt ■ 0.5g,Time online 90h, 220°C, 6 Bar, CO/H2 (1:1 mol ratio), GHSV600h C5+ “ Gaseous, liquid and solid C5-C9 + liquid oxygenates, alcohols=Ci-C3 in gas phase
81
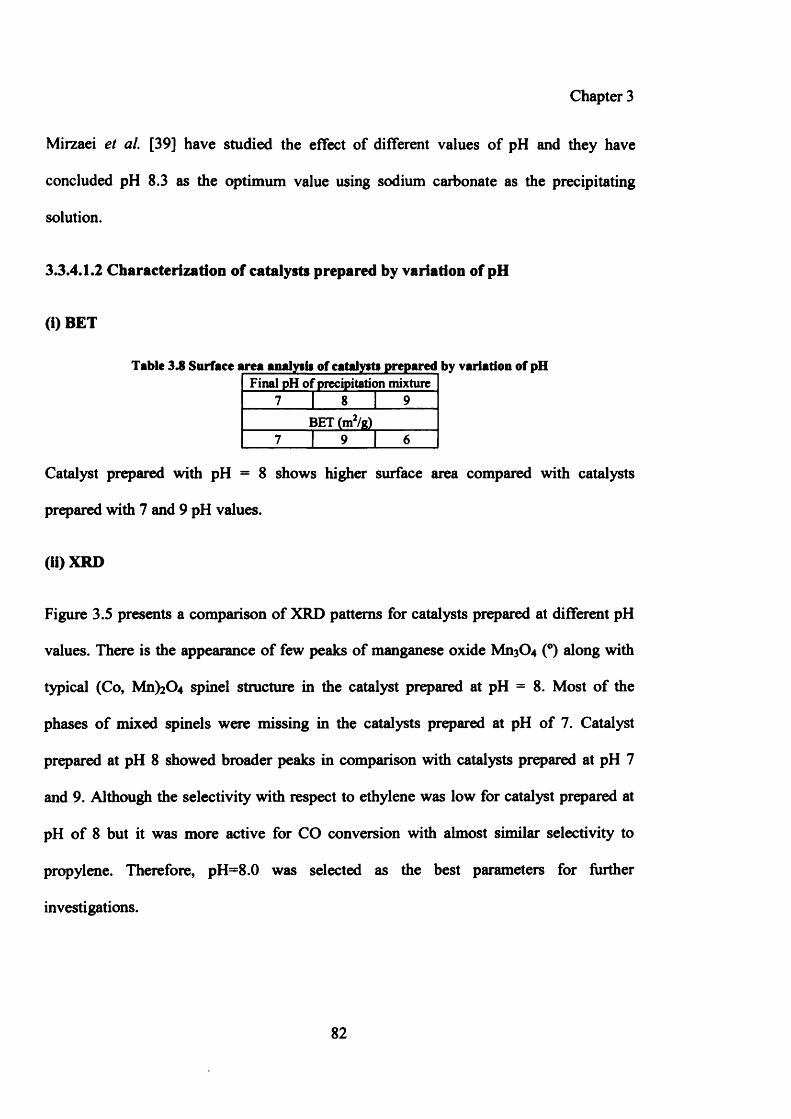
Chapter 3
Mirzaei et al. [39] have studied the effect of different values of pH and they have
concluded pH 8.3 as the optimum value using sodium carbonate as the precipitating
solution.
33.4.1.2 Characterization of catalysts prepared by variation of pH
(i) BET
Table 3.8 Surface area analysis of catalysts prepared by variation of pHFinal pH of precipitation mixture
7 I 8 1 9_________ BET(m2/g )________
Catalyst prepared with pH = 8 shows higher surface area compared with catalysts
prepared with 7 and 9 pH values.
(ii)XRD
Figure 3.5 presents a comparison of XRD patterns for catalysts prepared at different pH
values. There is the appearance of few peaks of manganese oxide Mn3 0 4 (°) along with
typical (Co, Mn)2<I>4 spinel structure in the catalyst prepared at pH = 8 . Most of the
phases of mixed spinels were missing in the catalysts prepared at pH of 7. Catalyst
prepared at pH 8 showed broader peaks in comparison with catalysts prepared at pH 7
and 9. Although the selectivity with respect to ethylene was low for catalyst prepared at
pH of 8 but it was more active for CO conversion with almost similar selectivity to
propylene. Therefore, pH=8.0 was selected as the best parameters for further
investigations.
82
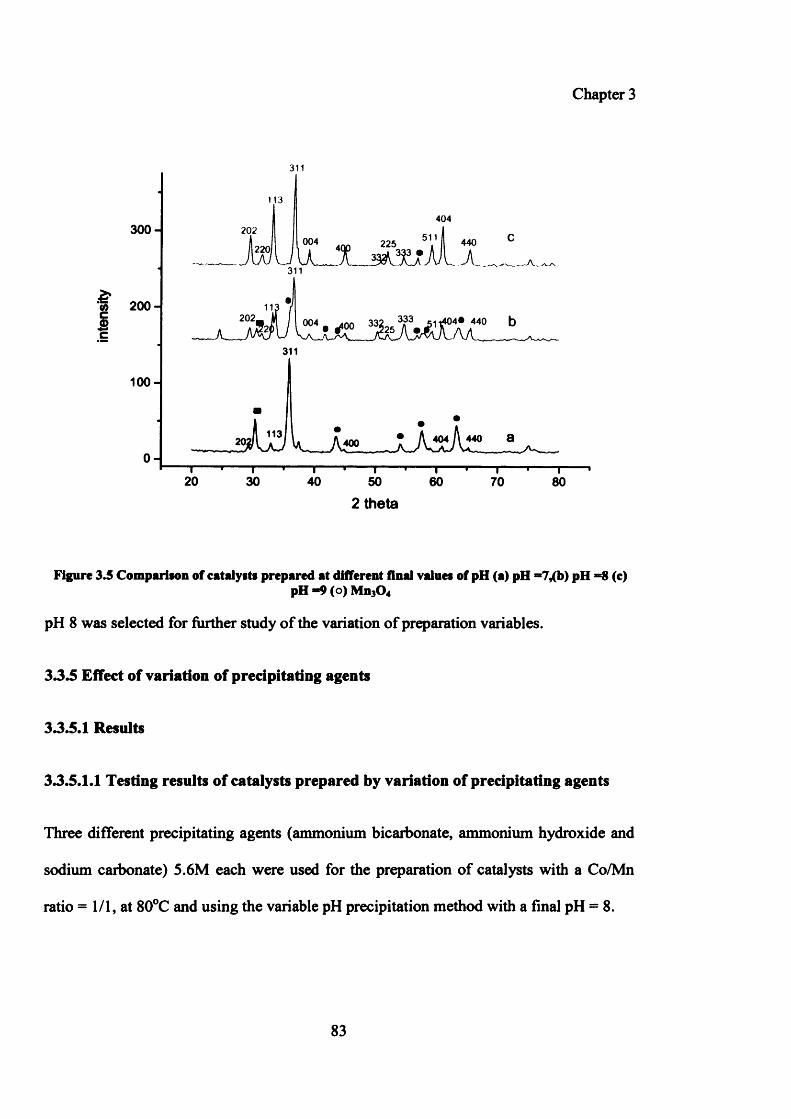
Chapter 3
311
3 0 0 -
£«5 2 0 0c2c
100 -
0 -
404
004 225 5 V |l 440
~i r20
~T~30
I40
"* r~50
“T~60
"T“70
” T“80
2 theta
Figure 3.5 Comparison of catalysts prepared at different final values of pH (a) pH “7,(b) pH = 8 (c)pH -9 (o) Mn30 4
pH 8 was selected for further study of the variation of preparation variables.
33.5 Effect of variation of precipitating agents
33.5.1 Results
33.5.1.1 Testing results of catalysts prepared by variation of precipitating agents
Three different precipitating agents (ammonium bicarbonate, ammonium hydroxide and
sodium carbonate) 5.6M each were used for the preparation of catalysts with a Co/Mn
ratio = 1/1, at 80°C and using the variable pH precipitation method with a final pH = 8 .
83
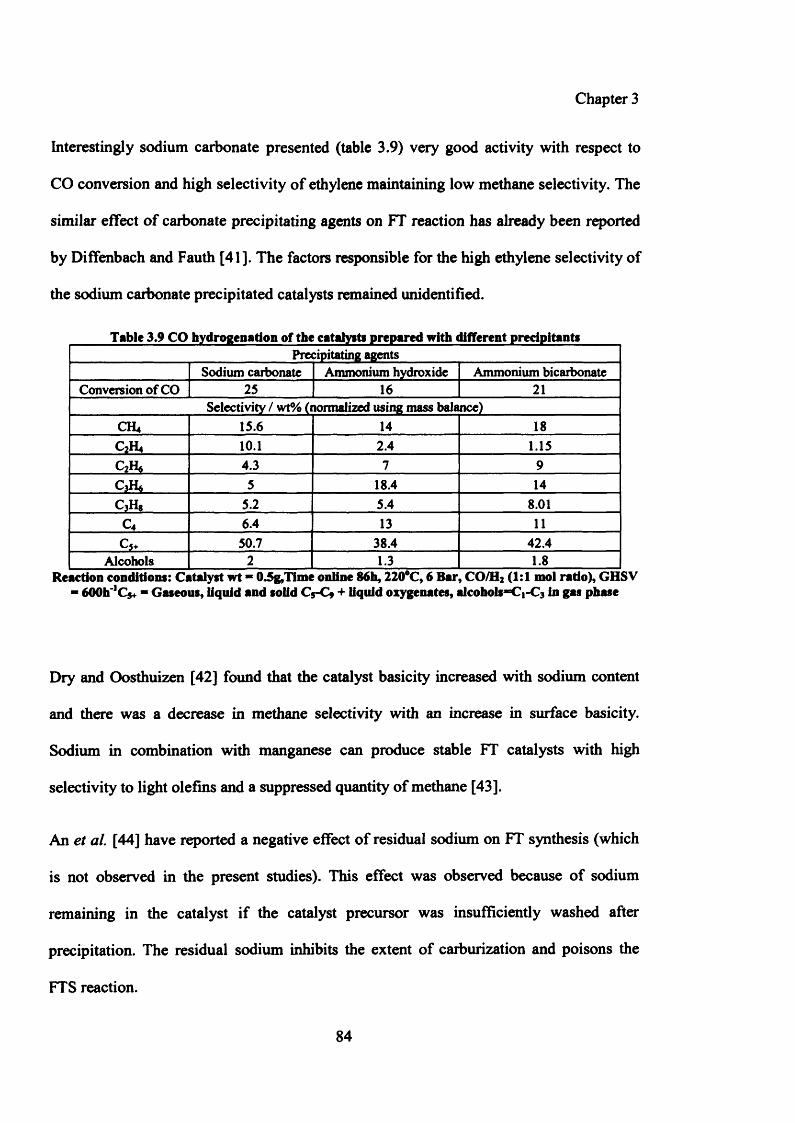
Chapter 3
Interestingly sodium carbonate presented (table 3.9) very good activity with respect to
CO conversion and high selectivity of ethylene maintaining low methane selectivity. The
similar effect of carbonate precipitating agents on FT reaction has already been reported
by Diffenbach and Fauth [41]. The factors responsible for the high ethylene selectivity of
the sodium carbonate precipitated catalysts remained unidentified.
Tabic 3.9 CO hydrogenation of the catalysts prepared with different predpitantsPrecipitating agents
Sodium carbonate Ammonium hydroxide Ammonium bicarbonateConversion of CO 25 16 2 1
Selectivity / wt% (normalized using mass balance)CH, 15.6 14 18c 2hu 1 0 . 1 2.4 1.15C2ih 4.3 7 9CM , 5 18.4 14c 3h* 5.2 5.4 8 . 0 1
c4 6.4 13 1 1
50.7 38.4 42.4Alcohols 2 1.3 1 . 8
Reaction conditions: Catalyst wt ■ 0ig,T1me online 86b, 220°C, 6 Bar, CO/H2 (1:1 mol ratio), GHSV - 600b'1 C$+ * Gaseous, liquid and solid C5-C* + liquid oxygenates, alcohols*=Ci-C3 in gas phase
Dry and Oosthuizen [42] found that the catalyst basicity increased with sodium content
and there was a decrease in methane selectivity with an increase in surface basicity.
Sodium in combination with manganese can produce stable FT catalysts with high
selectivity to light olefins and a suppressed quantity of methane [43].
An et al. [44] have reported a negative effect of residual sodium on FT synthesis (which
is not observed in the present studies). This effect was observed because of sodium
remaining in the catalyst if the catalyst precursor was insufficiently washed after
precipitation. The residual sodium inhibits the extent of carburization and poisons the
FTS reaction.
84
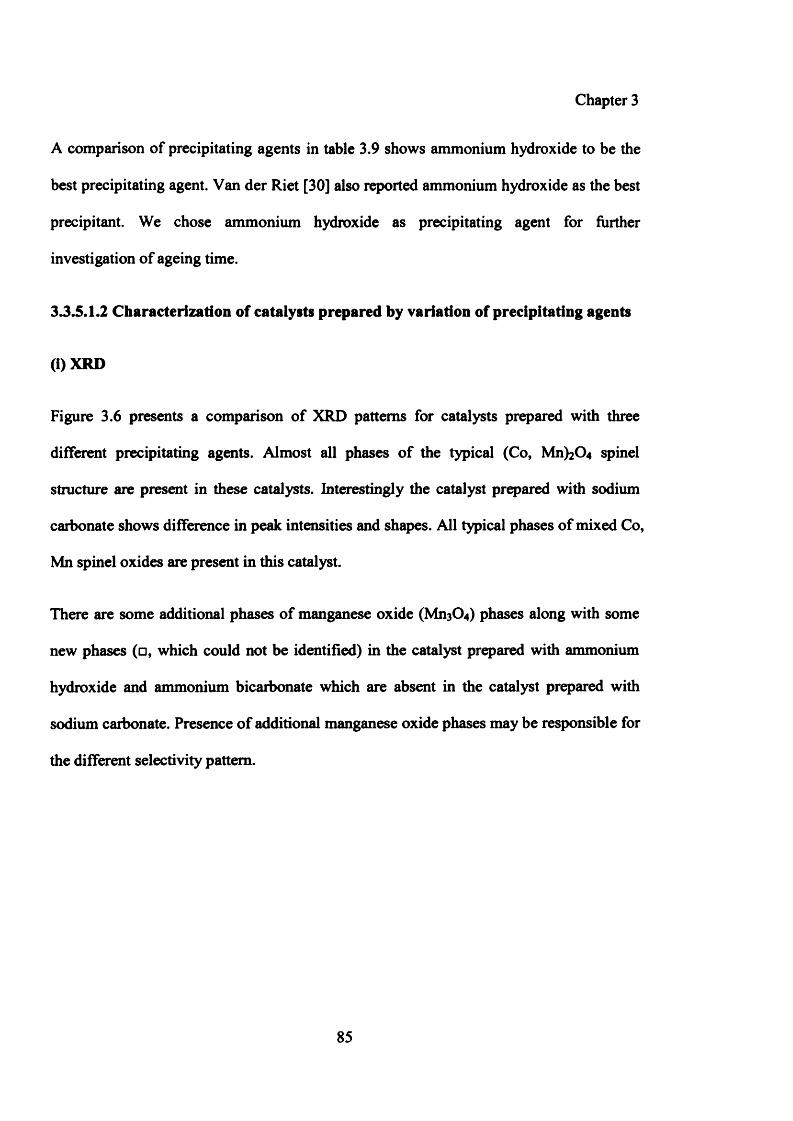
Chapter 3
A comparison of precipitating agents in table 3.9 shows ammonium hydroxide to be the
best precipitating agent. Van der Riet [30] also reported ammonium hydroxide as the best
precipitant. We chose ammonium hydroxide as precipitating agent for further
investigation of ageing time.
33.5.1.2 Characterization of catalysts prepared by variation of precipitating agents
(i)XRD
Figure 3.6 presents a comparison of XRD patterns for catalysts prepared with three
different precipitating agents. Almost all phases of the typical (Co, Mn)2C>4 spinel
structure are present in these catalysts. Interestingly the catalyst prepared with sodium
carbonate shows difference in peak intensities and shapes. All typical phases of mixed Co,
Mn spinel oxides are present in this catalyst.
There are some additional phases of manganese oxide (Mn3 0 4 ) phases along with some
new phases (□, which could not be identified) in the catalyst prepared with ammonium
hydroxide and ammonium bicarbonate which are absent in the catalyst prepared with
sodium carbonate. Presence of additional manganese oxide phases may be responsible for
the different selectivity pattern.
85
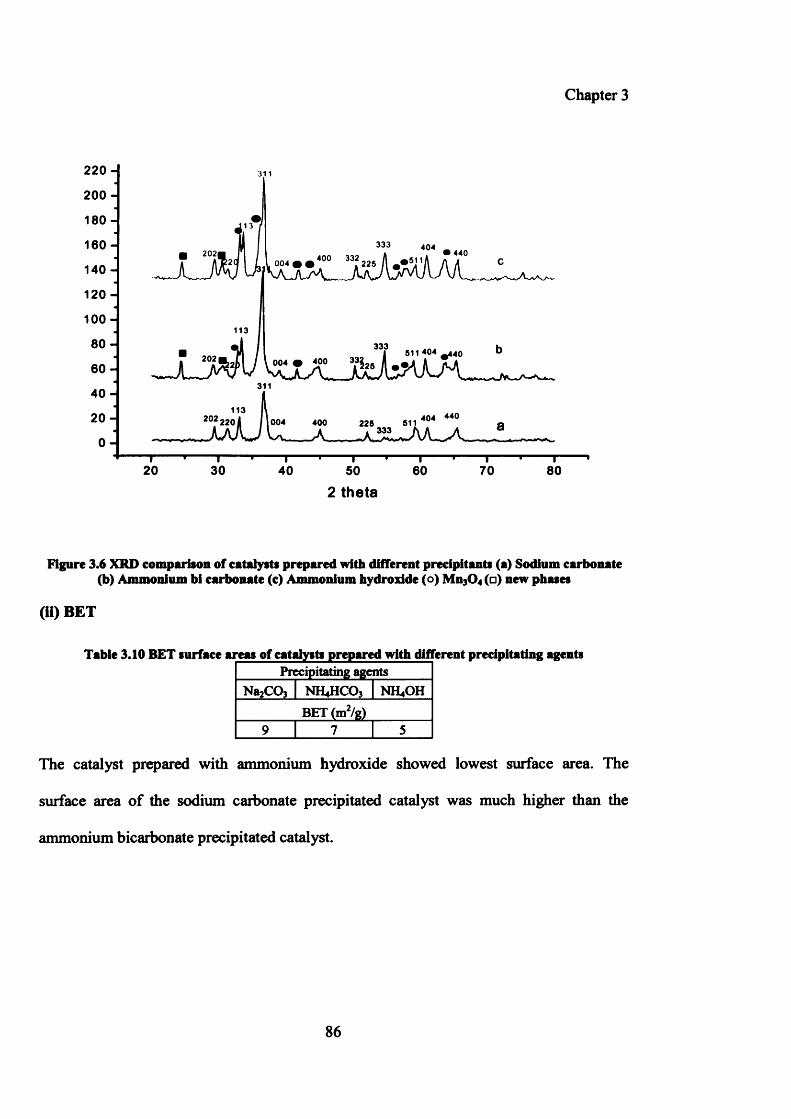
Chapter 3
220 -
200 -
180 -
160 -
140 -
120 -
1 0 0 -
80 -
60 -
4 0 -
20 -
0 -
333 404
311
' 220 A / | 004 400 226 611 404 44° a^ _ - aJ2LwM _A _JL"I ----- 1------'----- T"20 30 40
1-----50
2 theta
t -60
~~r~70
~T~80
Figure 3.6 XRD comparison of catalysts prepared with different precipitants (a) Sodium carbonate(b) Ammonium bi carbonate (c) Ammonium hydroxide (o ) Mn30 4 (□) new phases
(ii) BET
Table 3.10 BET surface areas of catalysts prepared with different precipitating agentsPrecipitating agents
Na2CQ3 NH4HCO3 NH4OH
_______ BET(m 2/g)________
The catalyst prepared with ammonium hydroxide showed lowest surface area. The
surface area of the sodium carbonate precipitated catalyst was much higher than the
ammonium bicarbonate precipitated catalyst.
86
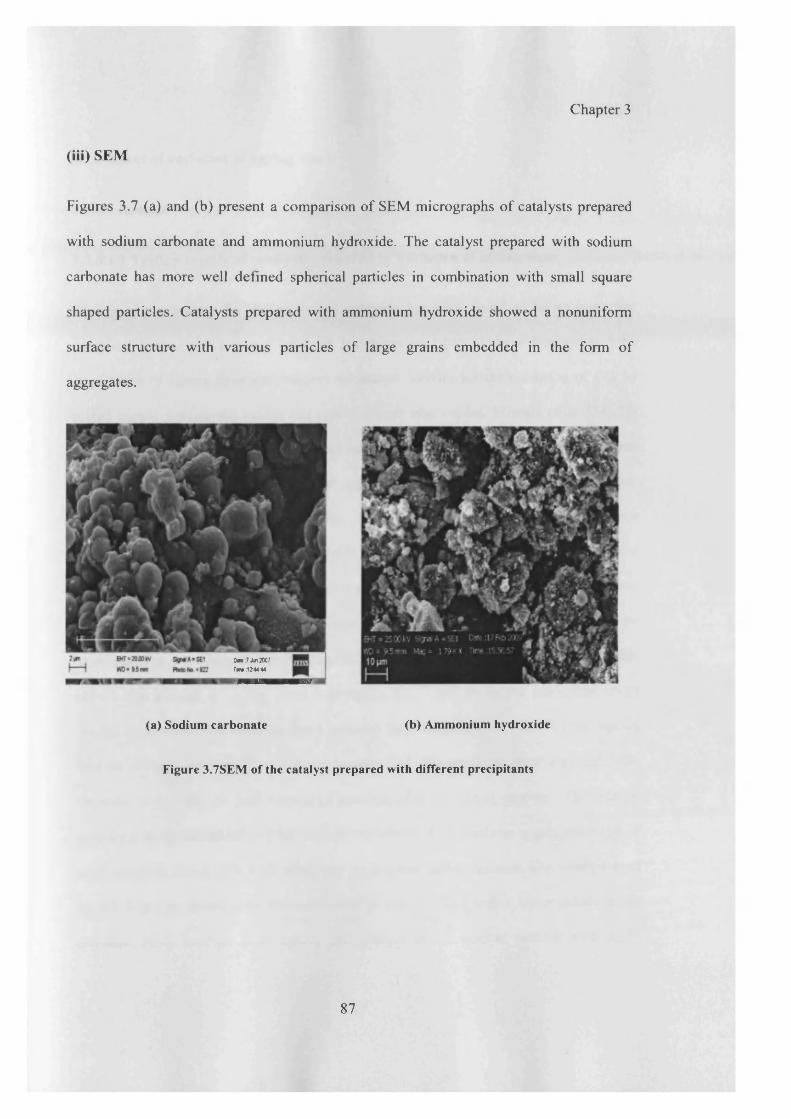
Chapter 3
(iii) SEM
Figures 3.7 (a) and (b) present a comparison of SEM micrographs o f catalysts prepared
with sodium carbonate and ammonium hydroxide. The catalyst prepared with sodium
carbonate has more well defined spherical particles in combination with small square
shaped particles. Catalysts prepared with ammonium hydroxide showed a nonuniform
surface structure with various particles o f large grains embedded in the form of
aggregates.
M t 7 A * 2007 Tim 1244:44
(a) Sodium carbonate (b) Ammonium hydroxide
Figure 3.7SEM of the catalyst prepared with different precipitants
87
Chapter 3
3.3.6 Effect of variation of ageing time
3.3.6.1 Results
33.6.1.1 Testing results of catalysts prepared by variation of ageing time
Ageing of precipitates for different time intervals has been found to be an important
parameter in the stabilization of catalysts. Hutchings et al. [45-53] have demonstrated the
importance of ageing time with respect to catalyst activity for the oxidation of CO by
mixed copper manganese oxides and mixed copper zinc oxides. Mirzaei et al. [54, 55]
have also studied the effect of ageing time on catalytic performance of mixed iron cobalt
oxide catalysts for syngas conversion to light alkenes. In all these studies it has been
observed that the ageing of precipitates obtained by coprecipitation leads to phase
changes towards thermodynamically stable forms. In the present study the effect of
catalyst precursor ageing on the morphology and catalytic activity of cobalt, manganese
oxide has been studied for the hydrogenation of CO. A series of mixed cobalt manganese
oxide catalysts were prepared by the co-precipitation method (Co/Mn=l: 1, 80°C, variable
pH=8) with a range of ageing times 0 (unaged), 0.5, 2 and 5h for the precipitate under
similar conditions. The catalysts were calcined for 24h at 500°C. The effect of ageing
time on catalytic performance is shown in table 3.11. These results show a considerable
variation in the catalytic performance of catalysts after the ageing process. The catalyst
aged for 0 h shows highest activity with lowest selectivity to methane among the series of
aged catalysts, along with high selectivity to ethylene and propylene. The catalyst aged
for 0 h was also found to be more selective to C6+ products with a lower selectivity to
methane. After half an hour ageing the catalyst shows similar activity with slight
88
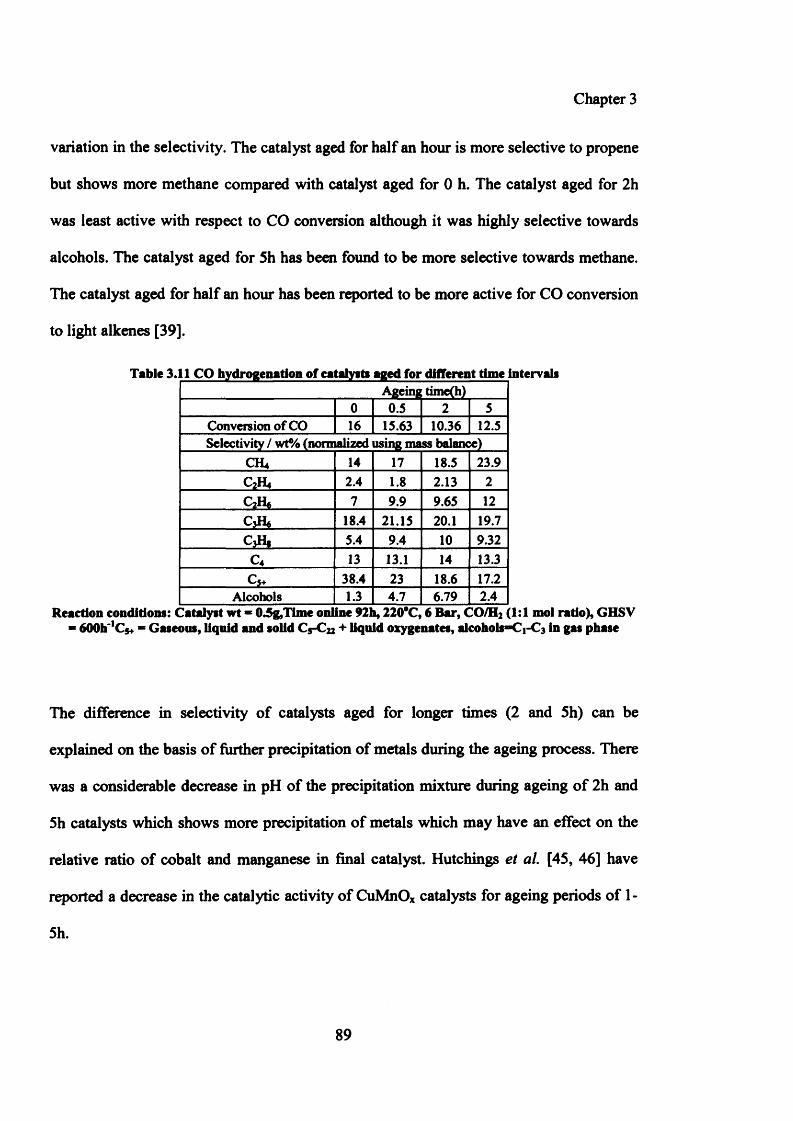
Chapter 3
variation in the selectivity. The catalyst aged for half an hour is more selective to propene
but shows more methane compared with catalyst aged for 0 h. The catalyst aged for 2h
was least active with respect to CO conversion although it was highly selective towards
alcohols. The catalyst aged for 5h has been found to be more selective towards methane.
The catalyst aged for half an hour has been reported to be more active for CO conversion
to light alkenes [39].
Table 3.11 CO hydrogenation of cataiyiti aged for different time IntervalsAgeing time(h)
0 0.5 2 5Conversion of CO 16 15.63 10.36 12.5Selectivity / wt% (normalized using mass balance)
CH* 14 17 18.5 23.9C2H4 2.4 1.8 2.13 2
QH* 7 9.9 9.65 12
C A 18.4 21.15 20.1 19.7C3H, 5.4 9.4 10 9.32
C4 13 13.1 14 13.3C5+ 38.4 23 18.6 17.2
Alcohols 1.3 4.7 6.79 2.4Reaction conditions: Catalyst wt * 0.5g,Ttme online 92b, 220°C, 6 Bar, CO/H2 (1:1 mol ratio), GHSV
- 600h'1Cs+ * Gaseous, liquid and solid Cg-Cn + liquid oxygenates, alcohols”Ci-C3 in gas phase
The difference in selectivity of catalysts aged for longer times (2 and 5h) can be
explained on the basis of further precipitation of metals during the ageing process. There
was a considerable decrease in pH of the precipitation mixture during ageing of 2h and
5h catalysts which shows more precipitation of metals which may have an effect on the
relative ratio of cobalt and manganese in final catalyst. Hutchings et a l [45, 46] have
reported a decrease in the catalytic activity of CuMnOx catalysts for ageing periods of 1-
5h.
89
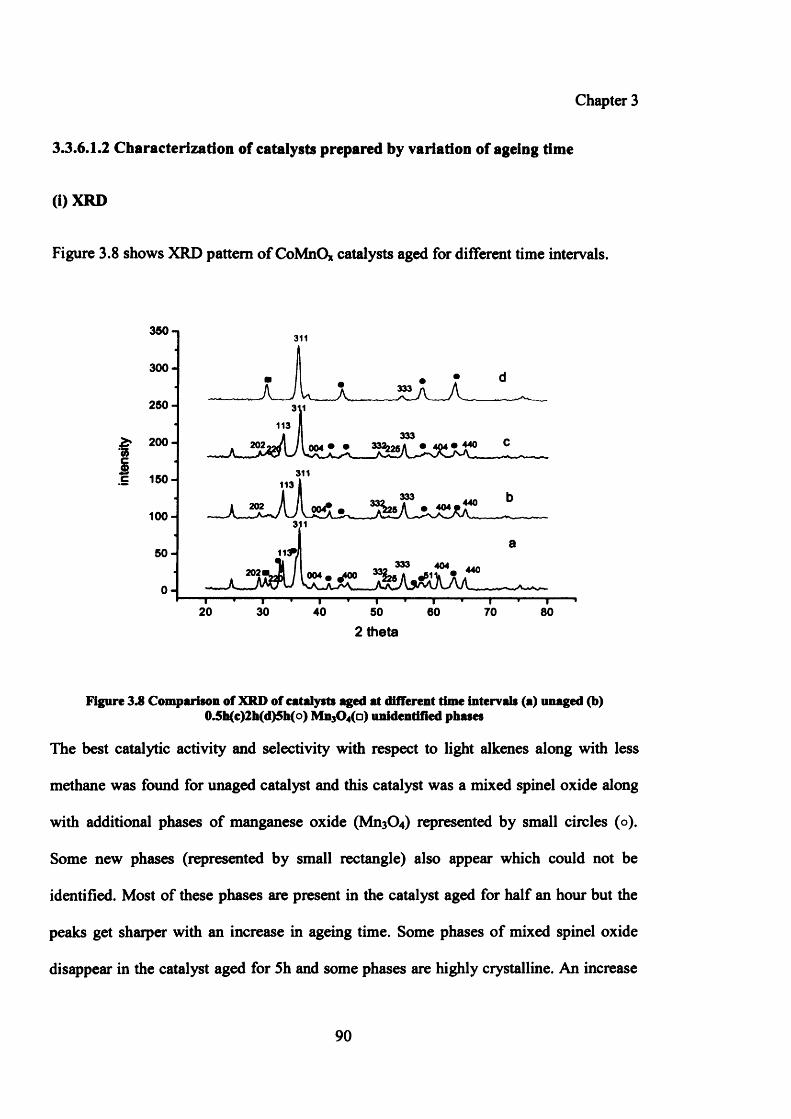
Chapter 3
3.3.6.1.2 Characterization of catalysts prepared by variation of ageing time
(i) XRD
Figure 3.8 shows XRD pattern of CoMnO* catalysts aged for different time intervals.
350-1311
300-
250-113
3332 0 0 -35
202
IC
311150- 113333 440oo/f202 • 404
100 -311
50-333
0 0 4 . J00 “ k s A . W ”f 04. 440202i
0-20 30 40 50 60 70 80
2 theta
Figure 3.8 Comparison of XRD of catalysts aged at different time intervals (a) unaged (b) 0 .5h(c)2h(d)5h(o) Mn30 4(a) unidentified phases
The best catalytic activity and selectivity with respect to light alkenes along with less
methane was found for unaged catalyst and this catalyst was a mixed spinel oxide along
with additional phases of manganese oxide (Mn3C>4) represented by small circles (o ) .
Some new phases (represented by small rectangle) also appear which could not be
identified. Most of these phases are present in the catalyst aged for half an hour but the
peaks get shaiper with an increase in ageing time. Some phases of mixed spinel oxide
disappear in the catalyst aged for 5h and some phases are highly crystalline. An increase
90
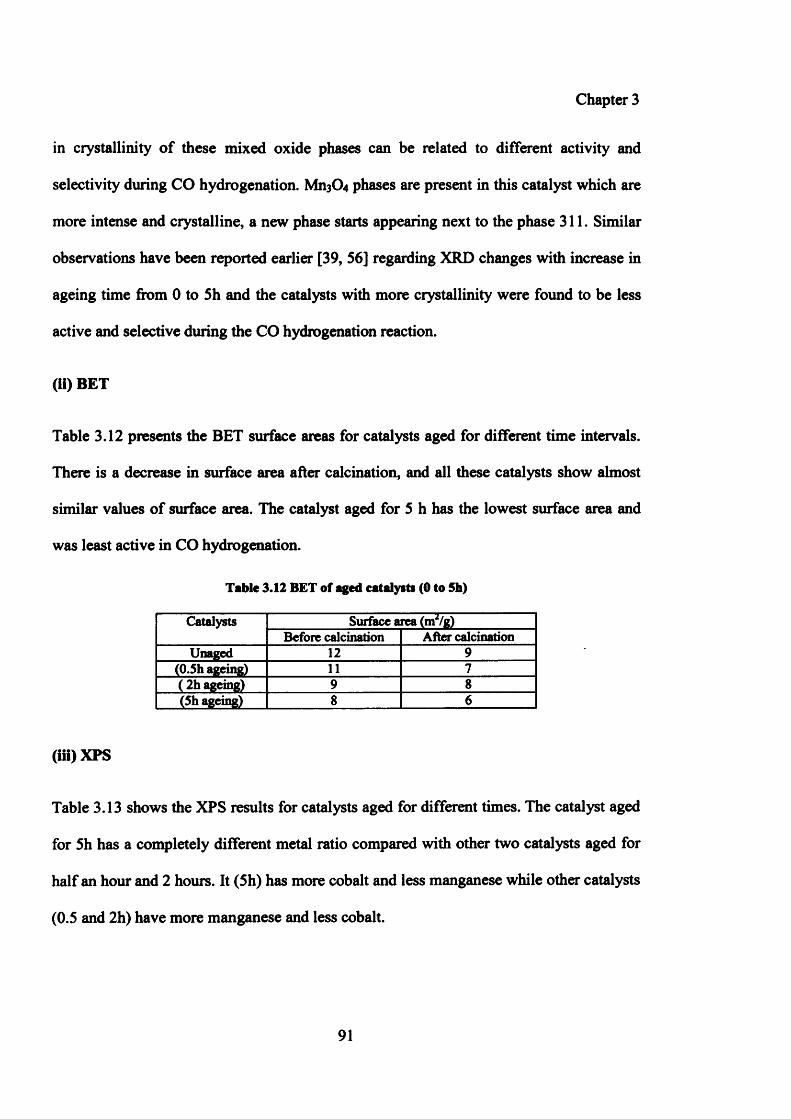
Chapter 3
in crystallinity of these mixed oxide phases can be related to different activity and
selectivity during CO hydrogenation. Mn304 phases are present in this catalyst which are
more intense and crystalline, a new phase starts appearing next to the phase 311. Similar
observations have been reported earlier [39, 56] regarding XRD changes with increase in
ageing time from 0 to 5h and the catalysts with more crystallinity were found to be less
active and selective during the CO hydrogenation reaction.
(ii) BET
Table 3.12 presents the BET surface areas for catalysts aged for different time intervals.
There is a decrease in surface area after calcination, and all these catalysts show almost
similar values of surface area. The catalyst aged for 5 h has the lowest surface area and
was least active in CO hydrogenation.
Table 3.12 BET of aged catalysts (0 to 5h)
Catalysts Surface area (mVg)Before calcination After calcination
Unaged 12 9(0.5h ageing) 11 7( 2h ageing) 9 8(5h ageing) 8 6
(iii)XPS
Table 3.13 shows the XPS results for catalysts aged for different times. The catalyst aged
for 5h has a completely different metal ratio compared with other two catalysts aged for
half an hour and 2 horns. It (5h) has more cobalt and less manganese while other catalysts
(0.5 and 2h) have more manganese and less cobalt.
91
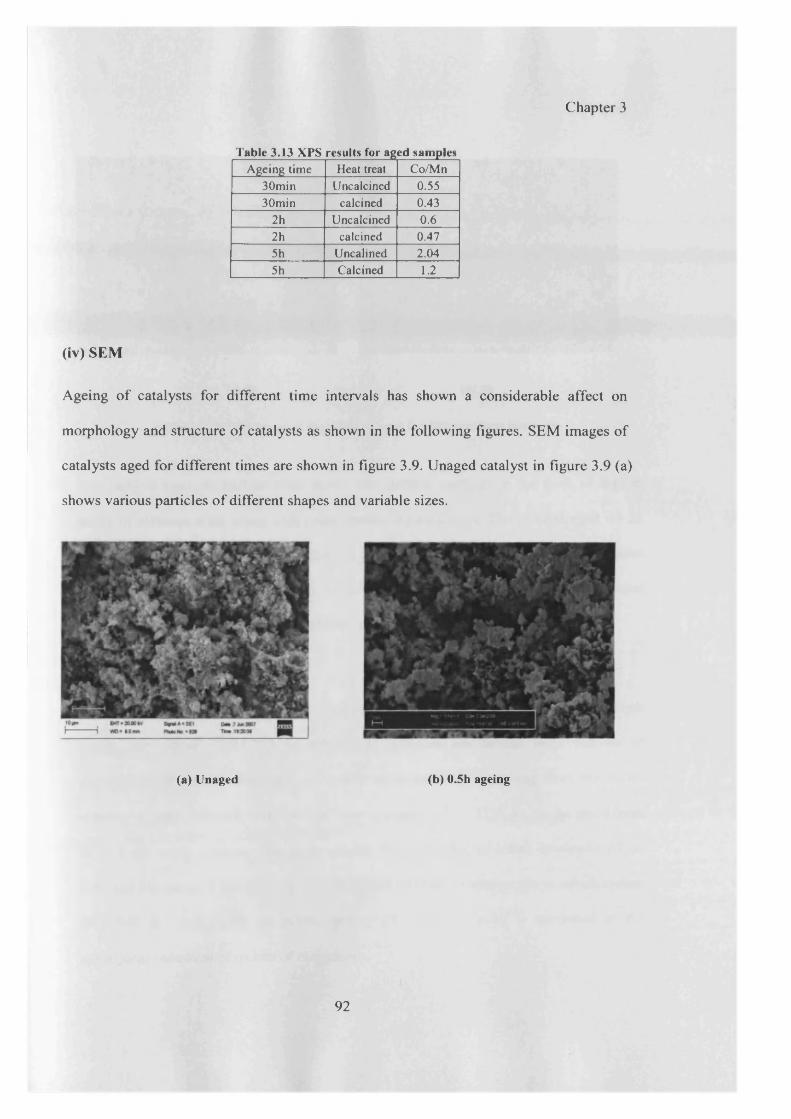
Chapter 3
Table 3.13 XPS results for aged samplesAgeing time Heat treat Co/Mn
30min Uncalcined 0.5530min calcined 0.43
2h Uncalcined 0.62h calcined 0.475h Uncalined 2.045h Calcined 1.2
(iv) SEM
Ageing o f catalysts for different time intervals has shown a considerable affect on
morphology and structure o f catalysts as shown in the following figures. SEM images of
catalysts aged for different times are shown in figure 3.9. Unaged catalyst in figure 3.9 (a)
shows various particles o f different shapes and variable sizes.
(a) Unaged (b) 0.5h ageing
92
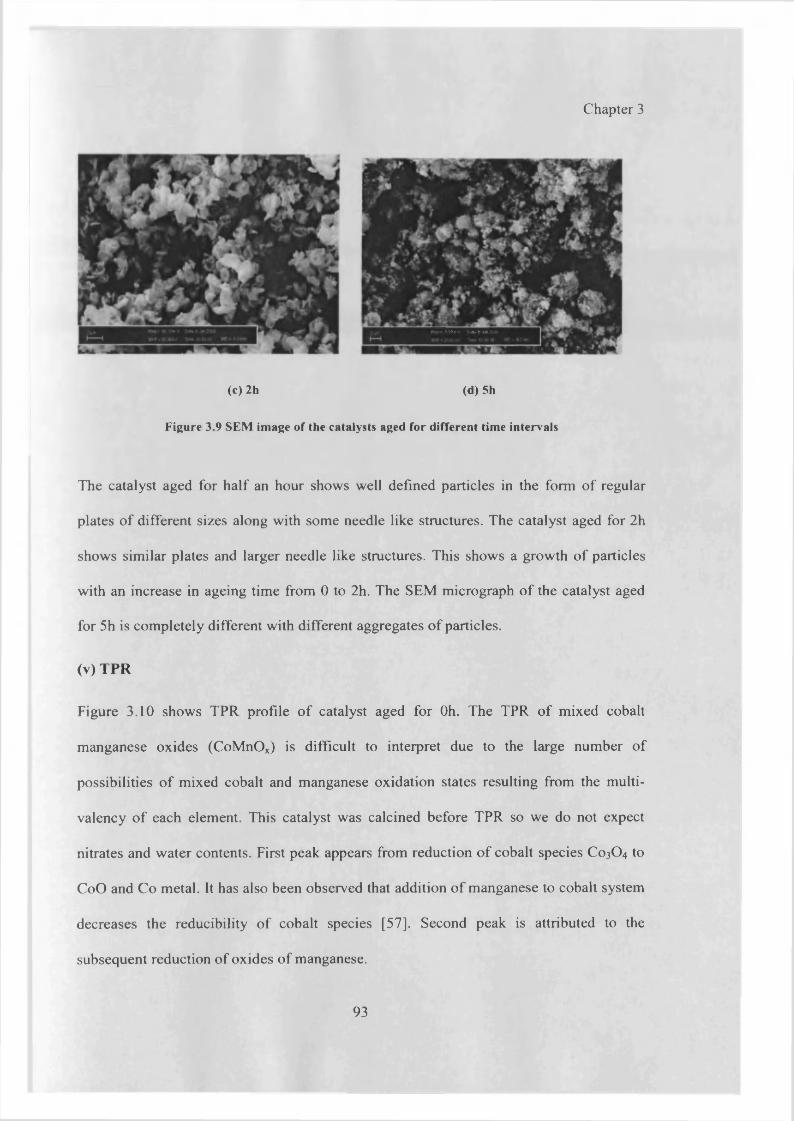
Chapter 3
(c) 2h (d) 5h
Figure 3.9 SEM image of the catalysts aged for different time intervals
The catalyst aged for half an hour shows well defined particles in the form o f regular
plates o f different sizes along with some needle like structures. The catalyst aged for 2h
shows similar plates and larger needle like structures. This shows a growth o f particles
with an increase in ageing time from 0 to 2h. The SEM micrograph o f the catalyst aged
for 5h is completely different with different aggregates o f particles.
(v) TPR
Figure 3.10 shows TPR profile o f catalyst aged for Oh. The TPR o f mixed cobalt
manganese oxides (CoMnOx) is difficult to interpret due to the large number o f
possibilities o f mixed cobalt and manganese oxidation states resulting from the multi
valency o f each element. This catalyst was calcined before TPR so we do not expect
nitrates and water contents. First peak appears from reduction o f cobalt species C0 3 O4 to
CoO and Co metal. It has also been observed that addition o f manganese to cobalt system
decreases the reducibility o f cobalt species [57]. Second peak is attributed to the
subsequent reduction of oxides o f manganese.
93
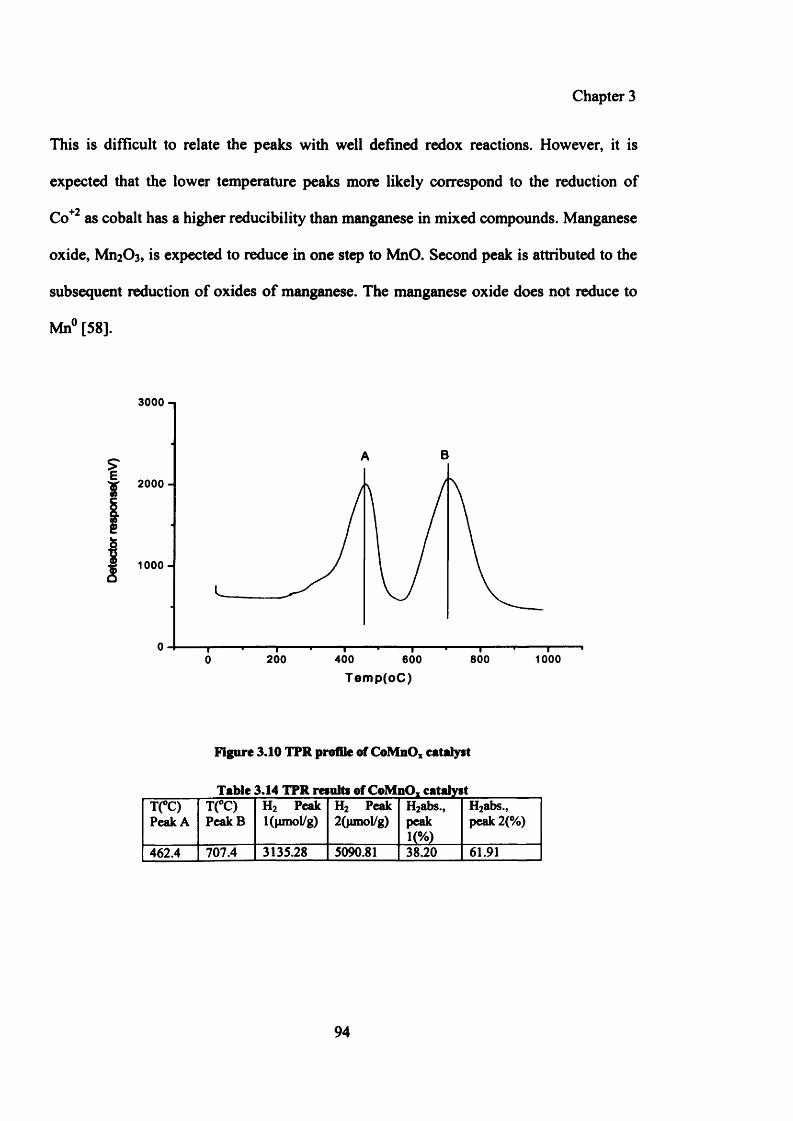
Chapter 3
This is difficult to relate the peaks with well defined redox reactions. However, it is
expected that the lower temperature peaks more likely correspond to the reduction of
Co+2 as cobalt has a higher reducibility than manganese in mixed compounds. Manganese
oxide, Mn2<3 3 , is expected to reduce in one step to MnO. Second peak is attributed to the
subsequent reduction of oxides of manganese. The manganese oxide does not reduce to
Mn° [58].
3000-.
f2000 -¥
Jj 1000-
200 400 800 10006000Temp(oC)
Figure 3.10 TPR profile of CoMnOx catalyst
Table 3.14 TPR results of CoMnO, catalystT(°C) Peak A
T(°C) Peak B
H2 Peak l(junol/g)
H2 Peak 2 (pmol/g)
H2abs.,peak1 (%)
H2abs.,peak 2 (%)
462.4 707.4 3135.28 5090.81 38.20 61.91
94
Chapter 3
3.3.7 Optimum preparation conditions
After a detailed investigation of preparation variables CoMnOx catalyst was prepared
using the following preparation conditions:
Ratio of metals (Co/Mn) =1/1, temperature of precipitation = 80°C, precipitating agent =
ammonium hydroxide, molarity of ammonium hydroxide = 5.6M, ageing time = Oh
The catalyst prepared under these conditions was used for the investigation of reaction
conditions as discussed below.
3.4. Effect of reaction conditions
The reaction conditions have a marked effect on the catalytic performance. It has been
reported by Dry [59] that selectivity on a carbon basis is essentially a function of the
probability of chain growth, a.
Control of the product selectivity is therefore to a large extent determined by the factors
that influence the value of a. The main factors are the temperature of the reaction, the gas
composition and more specifically the partial pressures of the various gases in contact
with catalyst inside the reactor. Overall, by manipulating these factors a high degree of
flexibility can be obtained regarding the type of product and the carbon range.
For optimization of reaction conditions, in this study the effects of operating conditions
such as reaction temperatures and reaction pressure have been examined to investigate
the catalyst stability and its performance under different FT conditions.
95
a f f UNjfo
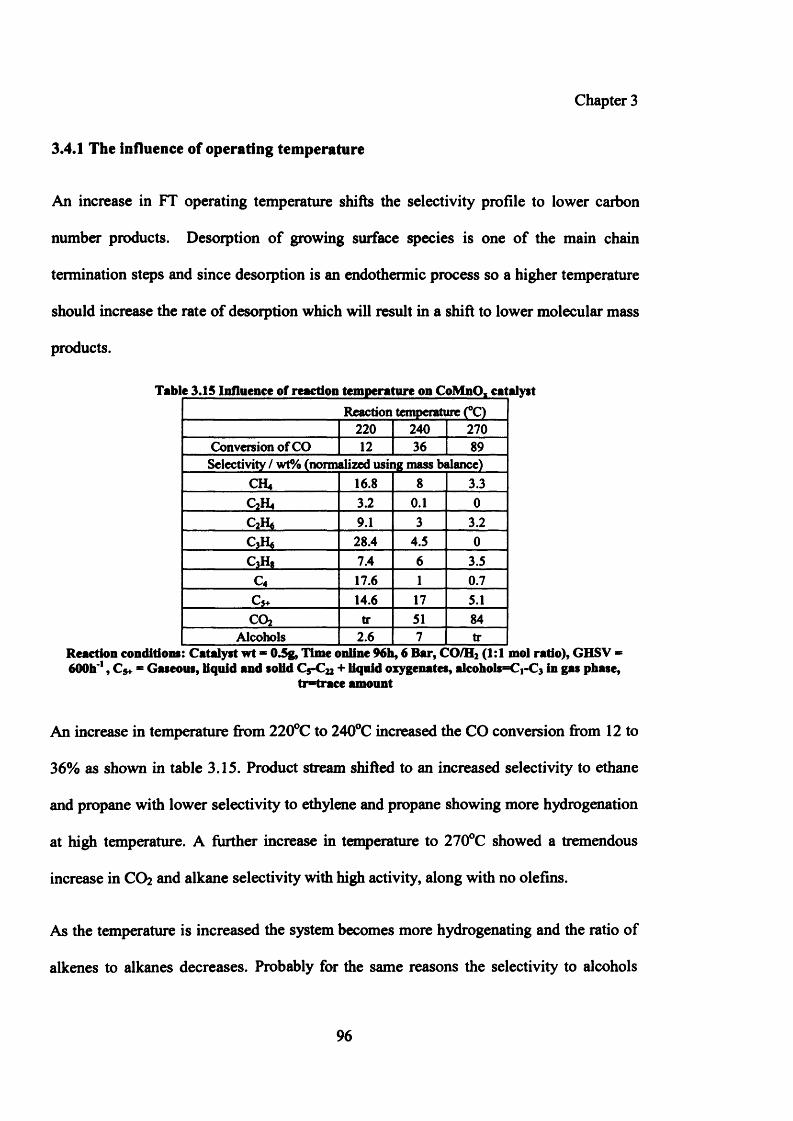
Chapter 3
3.4.1 The influence of operating temperature
An increase in FT operating temperature shifts the selectivity profile to lower carbon
number products. Desorption of growing surface species is one of the main chain
termination steps and since desorption is an endothermic process so a higher temperature
should increase the rate of desorption which will result in a shift to lower molecular mass
products.
Tabic 3.15 Influence of reaction temperature on CoMnO, catalystReaction temperature (°C)
2 2 0 240 270Conversion of CO 1 2 36 89
Selectivity / wt% (normalized using mass balance)CH4 16.8 8 3.3QHU 3.2 0 . 1 0
Q H , 9.1 3 3.2CjH, 28.4 4.5 0
c 3h , 7.4 6 3.5c 4 17.6 1 0.7c 3+ 14.6 17 5.1CO2 tr 51 84
Alcohols 2 . 6 7 trReaction conditions: Catalyst wt = O ig, lim e online 96b, 6 Bar, CO/H2 (1:1 mol ratio), GHSV = 600b'1, C}f = Gaseous, liquid and solid C5-C22 + liquid oxygenates, alcobols^C i^ in gas phase,
tr-trace amount
An increase in temperature from 220°C to 240°C increased the CO conversion from 12 to
36% as shown in table 3.15. Product stream shifted to an increased selectivity to ethane
and propane with lower selectivity to ethylene and propane showing more hydrogenation
at high temperature. A further increase in temperature to 270°C showed a tremendous
increase in CO2 and alkane selectivity with high activity, along with no olefins.
As the temperature is increased the system becomes more hydrogenating and the ratio of
alkenes to alkanes decreases. Probably for the same reasons the selectivity to alcohols
96
Chapter 3
also decreases with an increase in temperature up to 270°C. The degree of chain
branching also increases with an increase in temperature, which can result in higher
molecular weight products thus increasing C5+ selectivity at high temperature. Van der
Riet [30] has observed exactly similar effects on activity and selectivity of CoMnOx
catalysts with an increase in temperature. It is worth mentioning here that the amount of
heavy products including wax and liquids increased with an increase in temperature to
270°C.
CO2 was the most dominant product at high temperature. The very first reaction in FT is
the chemisoiption of CO at the catalyst surface. There are two possibilities of reaction,
either the chemisorbed CO as such inserts into the growing chain leading to subsequent
hydrogenation to CH2 or CO first dissociates to C and O atoms on the surface and the C
then hydrogenates to CH2 which then inserts into growing hydrocarbon chain. In later
case the adsorbed oxygen atoms could react with hydrogen atoms and result in water
formation (the main by-product of FT reaction). In spite of little or no CO2 produced on
cobalt catalyst at low temperature of reaction, either CO chemisoiption does not occur on
the catalyst surface or the actual rate of hydrogen reacting with oxygen atoms is much
faster than that of CO reacting with OH species. Co catalyst has been reported to be a
good water gas shift catalyst at higher temperature [35] resulting in higher CO2
selectivity. This can be argued that the rate of CO reacting with oxygen atoms is faster at
higher temperature compared with hydrogen reacting with oxygen.
Bai et al. [60] have demonstrated an increase in alkene selectivity with an increase in
temperature for a Fe/Mn catalyst using a slurry phase FT reactor. They have also
reported the formation rate of liquids and heavy waxes decreasing with an increase in
97
Chapter 3
temperature from 270 to 300°C. They have observed a slight increase in methane
selectivity with an increase in temperature.
Mirzaei et al. [61] have reported a significant increase in methane selectivity with
increase in temperature from 280 to 450°C for an iron manganese catalyst, obtaining the
highest alkene selectivity at 360°C, which remains high at higher temperature. Their
studies and results concentrate on the formation of alkenes (C2-C4) only without
mentioning formation of CO2 and alkanes.
Everson and Mulder [62] have observed an increase in CO conversion with an increase in
temperature for a fixed set of operating conditions and for a fixed bed length with the
product stream shifting towards the higher molecular weight hydrocarbons. They have
also observed a decrease in alkene to alkane ratio consistent with the present studies.
3.4.2 The influence of reaction pressure
The higher the CO partial pressure the more is the catalyst surface covered by adsorbed
monomers. The lower the coverage by partially hydrogenated CO monomers the higher
the probability of chain growth is expected to be [61]. Two key steps leading to chain
termination are desoiption of the growing polymeric chains yielding alkenes, and
hydrogenation of the chains to yield alkanes.
Table 3.16 shows the effect of an increase in reaction pressure of syngas on the
performance of the CoMnOx catalyst. There is an increase in CO conversion with an
increase in pressure from 3 to 9 bars, and methane selectivity decreased with an increase
in pressure. Likewise the propylene to propane ratio increased with an increase in
98
Chapter 3
pressure of syngas. From these results 6 bar pressure was chosen as the best reaction
pressure because of the high propylene to propane ratio, with a lower selectivity to
methane. Interestingly there is a decrease in alcohol synthesis with an increase in pressure
of syngas. Alcohols are also primary FT products just like alkenes, and it could be
possible that at least some, if not all, of the alkenes are formed by dehydration of these
primary alcohols.
These observations are in agreement with the reported results of syngas pressure variation
[59, 61]. Mirzaei et al. [61] have reported no significant decrease in CO conversion for a
FeMnTi0 2 catalyst with an increase in pressure from 1 to 6 bar along with an increase in
the selectivity of light alkenes. A tremendous decrease in methane selectivity is reported
with an increase in pressure.
An increase in total pressure would generally result in condensation of hydrocarbons
which are normally in the gaseous state at atmospheric pressure. Higher pressure would
probably lead to the saturation of catalyst pores by liquid reaction products [63]. A
different composition of the liquid phase in catalyst pores at high syngas pressures could
affect the rate of elementary steps.
Van der Riet [30] reported a decline in catalytic activity of CoMnOx with an increase in
pressure from 5.9 bar to 10.95 bar and the selectivity to hydrocarbons remained
unchanged. A further increase in pressure to 211 bar reduced the catalytic activity even
more and the selectivity changed appreciably. This has been postulated to be in indication
of deactivation of the catalyst at elevated pressures as the result of a structural change e.g.
carbide formation or particle disintegration. They have also concluded 6 bar pressure as
99
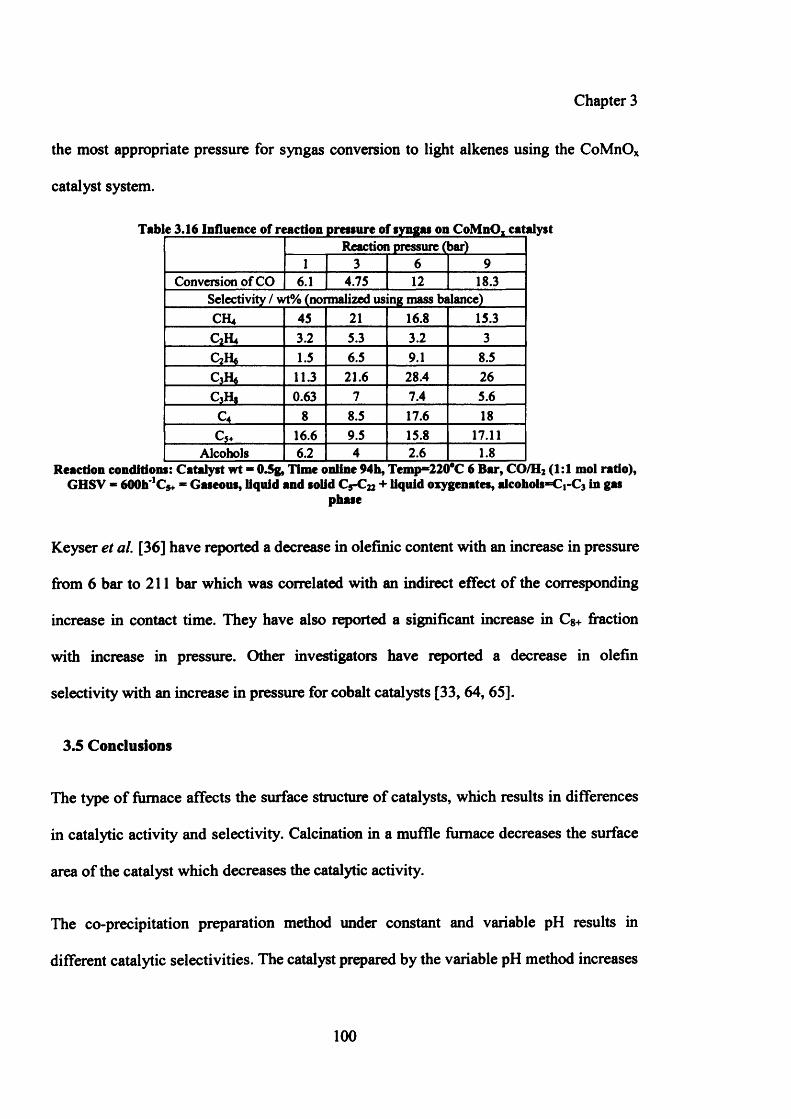
Chapter 3
the most appropriate pressure for syngas conversion to light alkenes using the CoMnOx
catalyst system.
TabReaction pressure (1>ar)
1 3 6 9Conversion of CO 6 . 1 4.75 1 2 18.3
Selectivity / wt% (normalized using mass balance)CH4 45 2 1 16.8 15.3C2H4 3.2 5.3 3.2 3
1.5 6.5 9.1 8.5c 3h* 11.3 2 1 . 6 28.4 26c 3h , 0.63 7 7.4 5.6
c 4 8 8.5 17.6 18
C5+ 16.6 9.5 15.8 17.11Alcohols 6 . 2 4 2 . 6 1 . 8
Reaction conditions: Catalyst wt - 0.5g, Time online 94b, Temp*“220#C 6 Bar, CO/H2 (1:1 mol ratio), GHSV - 600h'ICj+ ■ Gaseous, liquid and solid C5-C22 + liquid oxygenates, alcohols^Cj-Ca in gas
phase
Keyser et al. [36] have reported a decrease in olefinic content with an increase in pressure
from 6 bar to 211 bar which was correlated with an indirect effect of the corresponding
increase in contact time. They have also reported a significant increase in Cg+ fraction
with increase in pressure. Other investigators have reported a decrease in olefin
selectivity with an increase in pressure for cobalt catalysts [33, 64, 65].
3.5 Conclusions
The type of furnace affects the surface structure of catalysts, which results in differences
in catalytic activity and selectivity. Calcination in a muffle furnace decreases the surface
area of the catalyst which decreases the catalytic activity.
The co-precipitation preparation method under constant and variable pH results in
different catalytic selectivities. The catalyst prepared by the variable pH method increases
100
Chapter 3
selectivity to ethylene and propylene. Catalysts prepared by both methods do not show
any difference in surface area which is related to their similar catalytic activities.
The best preparation conditions for an optimum catalytic performance are 1/1 Co/Mn
ratio, at pH 8 and 80°C for 0 h ageing. It has been observed that catalysts with less
crystalline mixed spinel oxide structures have good catalytic activity and selectivity. An
increase in ageing time increases the crystallinity of the mixed spinel oxide phase and
results in a decline in the selectivity to light alkenes. It is clear that the precipitation
conditions, especially temperature and pH of precipitation mixture, are of crucial
importance and control of these parameters should be incorporated into the experimental
design involving co-precipitation for the preparation of mixed metal oxide catalysts.
Reaction conditions also play an important role in controlling the catalytic activity and
selectivity. An increase in the temperature of the reaction decreases olefin selectivity and
increases the selectivity to alkanes. Methane selectivity increases tremendously with an
increase in reaction temperature. Higher temperature increases selectivity to C5+ products
along with tremendous increase in CO2 formation.
An increase in reaction pressure at 220°C increases the catalytic activity and decreases
methane selectivity. An increase in pressure from 3bar to 9bar decreases the selectivity to
ethylene and increases propene selectivity.
The best reaction conditions were 220°C at 6 bar pressure, with molar feed ratio of
CO/H2= 1/1.
101
Chapter 3
3.6 References:
[1]. D. J. Duvenhage and N. J. Coville, Appl Catal, 1997,153,43
[2]. C. Cabet, A. C. Roger, A. Kiennemann, S. Lakamp and G. Pourroy, J. Catal., 1998, 173,64
[3]. L. Sergio, S. L. Gobzalez-Cortes, M. Serbia, A. Rudolfo-Baecher, A. Oliveros, J. Oeozco, B. Fontal, A. J. Mora and G. Delgado, Reac. Kinet. Catal. Lett., 2002, 75, 3
[4]. F. Tihay, G. Pourroy, M. Richard-Plouet, A.C. Roger and A. Kiennemann, J. Appl. Catal., 2001, 206, 29
[5]. F. Tihay, A. C. Roger, A. Kiennemann and G. Pourroy, Catal. Today., 2000, 58 ,263
[6]. T. V. Reshetenko, L. B. Avdeeva, A. A. Khassin, G. N. Kustova, V. A. Ushakov, E. M. Moroz, A. N. Shmakov, V. V. Kriventsov, D. I. Kochubey, Y. T. Pavlyukhin, A. L. Chuvilin Z. R. Ismagilov, Appl. Catal., 2004,268,127
[7]. V. A. de la Pen’a O'Shea, N. N. Men&idez, J. D. Tomero and J. L. G. Fierro, Catal. Lett., 2003, 88,123
[8]. A. A. Mirzaei, R. Habibpour and E. Kashi, Appl. Catal., 2005, 296, 222
[9]. M. E. Dry, Stud. Surf. Sci. Catal., 2004,152, 211
[10]. C. H. Yang, F. E. Massoth and A. G. Oblad, Adv. Chem. Ser., 1979,178, 35
[11]. A. O. Rautavoma and H. S. Van der Baan, Appl. Catal., 1981,1, 247
[12]. B. Sarup and B. W. Wojciechowski, J. Chem. Eng., 1989, 67, 62
[13]. I. C. Yates and C. N. Satterfield, En. Fuels., 1991,5, 168
[14]. E. Iglesia, S.C. Reyes, J.R. Madon and S.I. Soled, Adv. Catal. Relat. Subj., 1993,39, 221
[15]. C. A. Chanenchuk, I.C. Yates and C.N. Satterfield, En. Fuels., 1991, 5, 847
[16]. G. P. Vander laan and A. A. C. M. Beenackers, Catal. Rev. Sci. Eng., 1999, 41, 225
[17]. S. L. Gonz61ez-Cort6s, S. M. A. Rodulfo-Baechler, A. Oliveros, J. Orozco, B. Fontal, A. J. Mora and G. Delgado, React. Kinet. Catal. Lett., 2002,75, 3
[18]. M. J. Keyser, R. C. Everson and R. L. Espinoza, Appl. Catal., 1998,171, 99
102
Chapter 3
[19]. A. G. Ruhrchemie, British Patent GB, 1976,1,553,361
[20]. H. Kolbel, and K. D.Tillmetz, US Patent 1977,4,177,203
[21]. H. Kolbel, and K. D. Tillmetz, German Patent 1976,2,507,647
[22]. J. Barrault, Stud. Surf. Sci. Catal., 1982,11,225
[23]. J. Barrault, C. Forquy, J. Menezo and R. Maurel, Reac. Kinet. Catal. Lett., 1980,15, 153
[24]. J. Barrault, C. Forquy and V. Perrichon, Appl. Catal., 1983, 5, 119
[25]. B. Bussemeier, C.D. Frohning and B. Comils, Hydrocarb. Proc., 1976, 55, 105
[26]. B. Bussemeier, C.D. Frohning, G. Horn and W. Kluy, Chem. Abst., 1977, 87,41705
[27]. B. Bussemeier, C.D. Frohning, G. Horn and W. Kluy, Chem. Abst., 1977, 86,124093
[28]. H. Kolbel and D. K. Tillmetz, Chem. Abst., 1977, 86, 192342
[29]. H. Kolbel and D. K. Tillmetz, Chem. Abst., 1980,92, 146244
[30]. M. Van der Riet, “Carbon Monoxide Hydrogenation with Transition Metal Oxide Supported Cobalt and Iron Catalysts”, PhD Thesis, University of Witwatersrand, 1988
[31]. M. Van der Riet, G. J. Hutchings, and R. G. Copperthwaite, J. Chem. Soc.(London), Chem. Commun., 1986, 10, 798
[32]. M. Van der Riet, R. G. Copperthwaite, and G. J. Hutchings, J. Chem. Soc.(London), Faraday Trans., 1987, 83, 2963
[33]. R. G. Copperthwaite, G. J. Hutchings, M. Van der Riet, and J. Woodhouse, Ind.Eng. Chem. Res., 1987, 26, 869
[34]. S. E. Colley, R. G. Copperthwaite, G. J. Hutchings, and M. Van der Riet, Ind. Eng. Chem. Res., 1988, 27, 1339
[35]. F. M. Gottschalk, R. G. Copperthwaite, M. Van der Riet, and G. J. Hutchings, Appl. Catal., 1988, 38, 103
[36]. M. J. Keyser, R. C. Everson, and R. L. Espinoza, Appl. Catal., 1998,171, 99
[37]. B. Bussemeier, C. D. Frohning and B. Comils, Hydrocarb. Proc., 1976,105, 55
103
Chapter 3
[38]. J. L. Zhou, S. R. Yan, Y. D. Guan, X. Y. Huang and Q. J. Zeng, Proceedings o f the Fourth Japan-China Symposium on Coal Ci Chemistry, 1993, 5 ,473
[39]. A. A. Mirzaei, M. Faizi, and R. Habibpour Appl. Catal., 2006,306, 98
[40]. G. C. Maiti, R. Malessa, U. Lochner, H. Papp, and M. Baems, Appl. Catal., 1985, 16,215
[41]. R. A. Diffencbach, and D. J. Fauth, J. Catal., 1986,100,466
[42]. M. E. Dry, and G. J. Oosthuizen, J. Catal., 1968,11, 18
[43]. Q. Xu, D. He, M. Fujiwara, and Y. Souma, J. Mol. Catal., 1997, 120, L 23
[44]. X. An, B. Wu, W. Hou, H. Wan, Z. Tao, T. Li, Z. Zhang, H. Xiang,Y. Li, B. Xu, and F. Yi, J. Mol. Catal., 2007,263,266
[45]. G. J. Hutchings, A. A. Mirzaei, R.W. Joyner, M. R. H. Siddiqui, and S. H. Taylor, Catal. Lett., 1996,4 2 ,21
[46]. G. J. Hutchings, A. A. Mirzaei, R. W. Joyner, M. R. H. Siddiqui, and S. H. Taylor, Appl. Catal., 1998,166,143
[47]. S. H. Taylor, G. J. Hutchings, and A. A. Mirzaei, Chem. Commun., 1999,4,1373
[48]. M. Whittle, A. A. Mirzaei, J. S. J. Hangreeves, R. W. Joyner, C. J. Kiely, S. H. Taylor, and G. J. Hutchings, Phys. Chem. Chem. Commun., 2002,4, 5915
[49]. A. A. Mirzaei, H. R. Shaterian, R. W. Joyner, J. S. J. Hangreeves, S. H. Taylor, and G. J. Hutchings, Catal. Commun., 2003,4,17
[50]. A. A. Mirzaei, H. R. Shaterian, M. Habibi, G. J. Hutchings, and S. H. Taylor, Appl. Catal., 2003, 253,499
[51]. A. A. Mirzaei, H. R. Shaterian, S. H. Taylor, and G. J. Hutchings, Catal. Lett.,2003, 87, 103
[52]. S. H. Taylor, G. J. Hutchings, and A. A. Mirzaei, Catal. Today., 2003, 84, 113
[53]. A. A. Mirzaei, H. R. Shaterian, and M. Kaykhaii, Appl. Surf. Sci., 2005, 239,246
[54]. A. A. Mirzaei, R. Habibpour, and E. Kashi, Appl. Catal., 2005, 296,222
[55]. A. A. Mirzaei, R. Habibpour, M. Faizi, and E. Kashi, Appl. Catal., 2006, 301, 272
104
Chapter 3
[56]. K. J. Cole, “Copper Manganese based mixed oxides for ambient temperature CO oxidation and higher temperature oxidation reactions”, PhD Thesis, Cardiff University, 2008
[57]. F. Morales, E. Smit, F. M. F. Groot, T. Visser, and B. M. Weckhuysen, J. Catal., 2007, 246,91
[58]. L. R. Leith and M. G. Howden, Appl. Catal., 1988,37, 75
[59]. M. E. Dry, Stud. Surf. Sci. Catal., 2004,152,197
[60]. L. Bai, H. Wei, Y. Wang-Li, Yi. Z. Han, and B. Yhong, Fuel., 2002, 81, 1577
[61]. A. A. Mirzaei, S. Vahid, and M. Feyzi, Adv. Phys. Chem., 2008, 2009,1
[62]. C. R. Everson, and H. Mulder, J. Catal., 1993,143,166
[63]. A. Griboval, A. Y. Khodakov, R. Bechara, and V. L. Zholobenko, Stud. Surf. Sci. Catal., 2002,144, 609
[64]. S. E. Colley, “Hydrogenation o f carbon monoxide over modified cobalt-based catalysis ”, PhD thesis, University of Witwatersrand, Johannesburg, South Africa, 1991
[65]. H. H. Storch, N. Golumbic, and R. B. Anderson, in “The Fischer-Tropsch and Related Synthesis ”, Wiley, New York, 1951
105
Chapter 4
Chapter 4
The influence of metal promoters in the hydrogenation
of carbon monoxide using cobalt manganese oxide
catalysts
4.1 Introduction
Classical Fischer Tropsch (FT) synthesis follows a polymerization process for
hydrocarbon chain growth giving a broad range of product distribution from methane to
waxes [1]. Large proportion of the feedstock consists of unsaturated hydrocarbons,
especially those with two to four carbon atoms. These unsaturated light hydrocarbons
synthesised from syngas using modified FT catalysts are of great economic interest.
106
Chapter 4
Variation of reaction conditions leads to moderate shifts in the broad product distribution
within the constraints of the Schulz-Flory (SF) distribution law [2]. However, high
selectivity to a single product or narrow distribution of products requires the development
of an improved catalyst. Incorporation of metal promoters and other additives is an
approach to the chemical modification of FT catalysts. Catalyst promoters enhance the
overall catalytic performances and lifetime if the promoter element is added in an
appropriate manner and in a limited range of loading. It is difficult to define the term
‘promoter* since there are many different types of promoters and it is often difficult to
distinguish between the promoters, the active catalytic component and the carrier. An
appropriate definition can be ‘a promoter is a substance added to a catalyst in a small
amount, which by itself has little or no activity, but it imparts either better activity or
selectivity for the desired reaction than is realized without it* [3].
Table 1.3 (in chapter 1), details the beneficial effects of promoters for cobalt catalysts. It
is clear from the table that different promoter elements could have multiple modes of
promotion action.
Many transition metal oxides have been investigated as potential promoters for Co-based
catalysts in FTS [4-30].
Although different promotion functions have been proposed in literature, transition metal
oxides have mostly been regarded as electronic promoters, having direct influence on the
activity or selectivity of Co sites. This effect is manifested through direct interaction of
the supported Co particles with the transition metal oxides. Hence, the transition metal
107
Chapter 4
oxide promoters are thought to be spreading over the cobalt surface in sub-monolayer
coverages, modifying the adsorption properties of Co active sites [31].
Early in the nineties, Ruiz et al. [10] reported an enhancement in catalyst activities and
increased selectivities to alkenes and higher hydrocarbons upon addition of V, Mg and Ce
oxides to Co-based FT catalysts. These variations were attributed to electronic effects
induced by the metal oxides. Similar results were reported by Bessel [11] using a Cr
promoter in Co/ZSM-5 catalysts. Addition of Cr improved the catalyst activity and
shifted the selectivity from methane to higher, generally more olefinic hydrocarbons.
They suggested an interaction between transition metal oxide and the cobalt oxide as a
cause of promotion which inhibits cobalt reduction and improves cobalt dispersion.
Further, Kikuchi et al. [12] reported the effect of Cr, Ti, Mn and Mo on the FT
performance of catalysts loaded with ultra fine cobalt particles. The addition of these
promoters effectively enhanced the catalyst activity, lowered the methane selectivity and
increased C5+ production. They attributed these effects to a structural promotion, causing
a decrease of the cobalt particle size in the catalysts. Another promotion induced by Mn
and Mo was reported by the group of Belosludov [19]. They investigated the addition of
Mn and Mo to Co-based FT catalysts using computational chemistry. They found that the
transition metal oxides under investigation improved the sulphur tolerance of the
catalysts.
Effect of two metal promoters (Ru and K) on the catalytic activity of CoMnO* catalyst
will be discussed in this chapter. Different loadings of these metal promoters have been
studied along with CoMnOx catalysts in an attempt to:
108
Chapter 4
— Firstly; further enhance the selectivity towards the commercially viable C2 and C3
olefins, and — Secondly; to further suppress methane formation, and thus prevent the loss
of an expensive carbon source to a commercially less viable product.
4.2 Experimental
The detailed preparation of catalysts and their testing has been discussed in chapter 2.
Briefly, Cobalt manganese oxide catalysts (Co/MnOx) were prepared by co-precipitation
from a solution of mixed nitrates with aqueous ammonia under variable pH from 2.8 to 8
at 80°C. Precipitates were filtered, washed and dried at 110°C. Doping of the catalysts
with various metal promoters was achieved by incipient wetness. The doped materials
were dried at 110°C for 16h and calcined at 500°C for 24h. The calcined catalysts were
pelleted and sieved (0.65-0.85mm). Catalysts (0.5g) were loaded in to six fixed-bed
laboratory reactors (Appendix 4). Catalysts were subsequently reduced in situ at 400°C
for 16h in a hydrogen atmosphere (GHSV = 600b'1, atmospheric pressure). All catalysts
were tested under almost identical reaction conditions (CO/H2 =1/1, T=220°C, P = 6 bar,
and GHSV = 600b*1). A stabilization period of ~ 1 0 0 h after initiation of FT synthesis was
allowed before mass balance data collection. Analysis of gas products was determined by
on-line gas chromatography capable of analysis of hydrocarbons (FID) and CO, H2 , CO2,
N2 (TCD detector ) as detailed in chapter 2.
Catalysts doped with potassium and ruthenium were prepared and tested according to the
method detailed as above and their results will be discussed in the following sections.
109
Chapter 4
4.3 Potassium (K)
The impact of potassium addition on the performance of FTS catalysts has been studied
extensively. Potassium is known to promote the formation of olefins and longer-chain
hydrocarbons, and the suppression of methane [32-36]. The positive impact of potassium
addition on the activity of FT catalysts depends on the level of promotion.
4.3.1 Results
43.1.1 Catalytic activity results
The effect of potassium loading on the performance of Co/MnOx catalysts during the CO
hydrogenation is presented in table 4.1. The addition of small quantities of potassium
(0.09, 0.1, 0.12, 0.15 wt %) was shown to be enough to affect the performance of these
catalysts in a variety of ways. Potassium acetate was used as a salt precursor. Particular
attention was given to the selectivity of methane and alkenes to alkane ratio.
Table 4.1 shows that a small variation in potassium concentration with CoMnOx has a
remarkable effect on the activity and selectivity of catalysts during CO hydrogenation.
An increase in potassium concentration from 0.09 to 0.1 % drops CO conversion down
from 15 to 9.7% along with a decrease in methane selectivity. There is an increase in the
selectivity of ethylene with an increase in potassium concentration from 0.09 to 0.1%, but
selectivity of propene decreases from 29% to 22%.
110
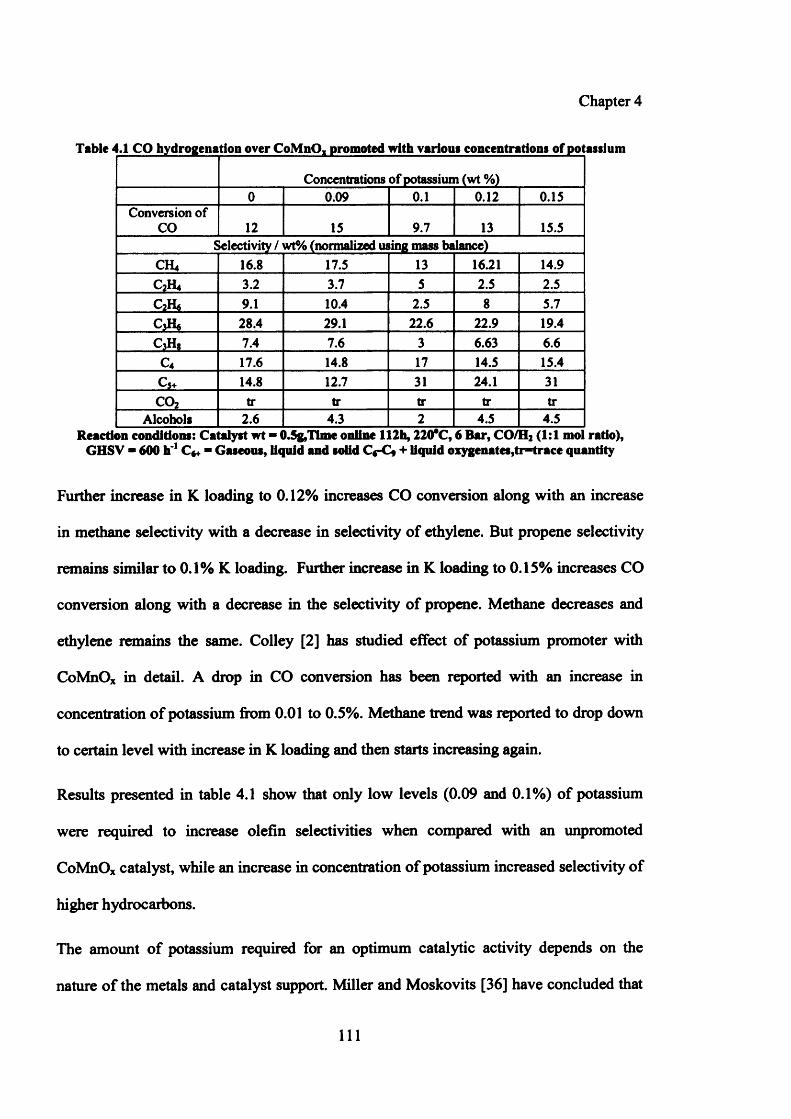
Chapter 4
Table 4.1 CO hydrogenation over CoMnO, promoted with variom concentrations of potassium
Concentrations of potassium (wt %)0 0.09 0 . 1 0 . 1 2 0.15
Conversion of CO 1 2 15 9.7 13 15.5
Selectivity / wt% (normalized using mass balance)CH4 16.8 17.5 13 16.21 14.9C2H4 3.2 3.7 5 2.5 2.5QH* 9.1 10.4 2.5 8 5.7CjH* 28.4 29.1 2 2 . 6 22.9 19.4c 3h 8 7.4 7.6 3 6.63 6 . 6
c 4 17.6 14.8 17 14.5 15.4c 5+ 14.8 12.7 31 24.1 31c o 2 tr tr tr tr tr
Alcohols 2 . 6 4.3 2 4.5 4.5Reaction condition*: Catalyst wt ■ 0.5g,Tlme online 112h, 220*C, 6 Bar, CO/H2 (1:1 mol ratio),
GHSV ■ 600 h' 1 C * - Gaseous, liquid and solid C«-C* + liquid oxygenates,tr-trace quantity
Further increase in K loading to 0.12% increases CO conversion along with an increase
in methane selectivity with a decrease in selectivity of ethylene. But propene selectivity
remains similar to 0.1% K loading. Further increase in K loading to 0.15% increases CO
conversion along with a decrease in the selectivity of propene. Methane decreases and
ethylene remains the same. Colley [2] has studied effect of potassium promoter with
CoMnOx in detail. A drop in CO conversion has been reported with an increase in
concentration of potassium from 0.01 to 0.5%. Methane trend was reported to drop down
to certain level with increase in K loading and then starts increasing again.
Results presented in table 4.1 show that only low levels (0.09 and 0.1%) of potassium
were required to increase olefin selectivities when compared with an unpromoted
CoMnOx catalyst, while an increase in concentration of potassium increased selectivity of
higher hydrocarbons.
The amount of potassium required for an optimum catalytic activity depends on the
nature of the metals and catalyst support. Miller and Moskovits [36] have concluded that
111
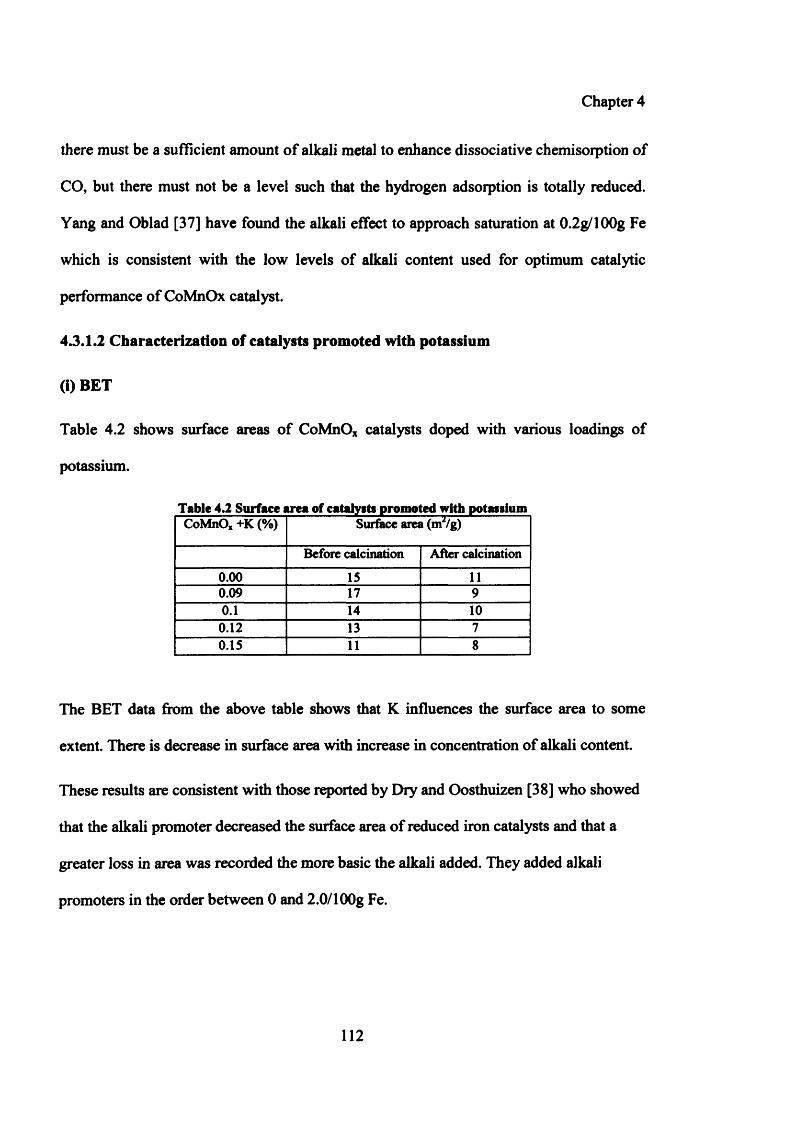
Chapter 4
there must be a sufficient amount of alkali metal to enhance dissociative chemisorption of
CO, but there must not be a level such that the hydrogen adsorption is totally reduced.
Yang and Oblad [37] have found the alkali effect to approach saturation at 0.2g/100g Fe
which is consistent with the low levels of alkali content used for optimum catalytic
performance of CoMnOx catalyst.
4.3.1.2 Characterization of catalysts promoted with potassium
(i) BET
Table 4.2 shows surface areas of CoMnOx catalysts doped with various loadings of
potassium.
Table 4.2 Surface area of catalytta promoted with potassiumCoMnOx +K (%) Surface area (rnVg)
Before calcination After calcination
0.00 15 110.09 17 90.1 14 100.12 13 70.15 11 8
The BET data from the above table shows that K influences the surface area to some
extent. There is decrease in surface area with increase in concentration of alkali content.
These results are consistent with those reported by Dry and Oosthuizen [38] who showed
that the alkali promoter decreased the surface area of reduced iron catalysts and that a
greater loss in area was recorded the more basic the alkali added. They added alkali
promoters in the order between 0 and 2.0/1 OOg Fe.
112
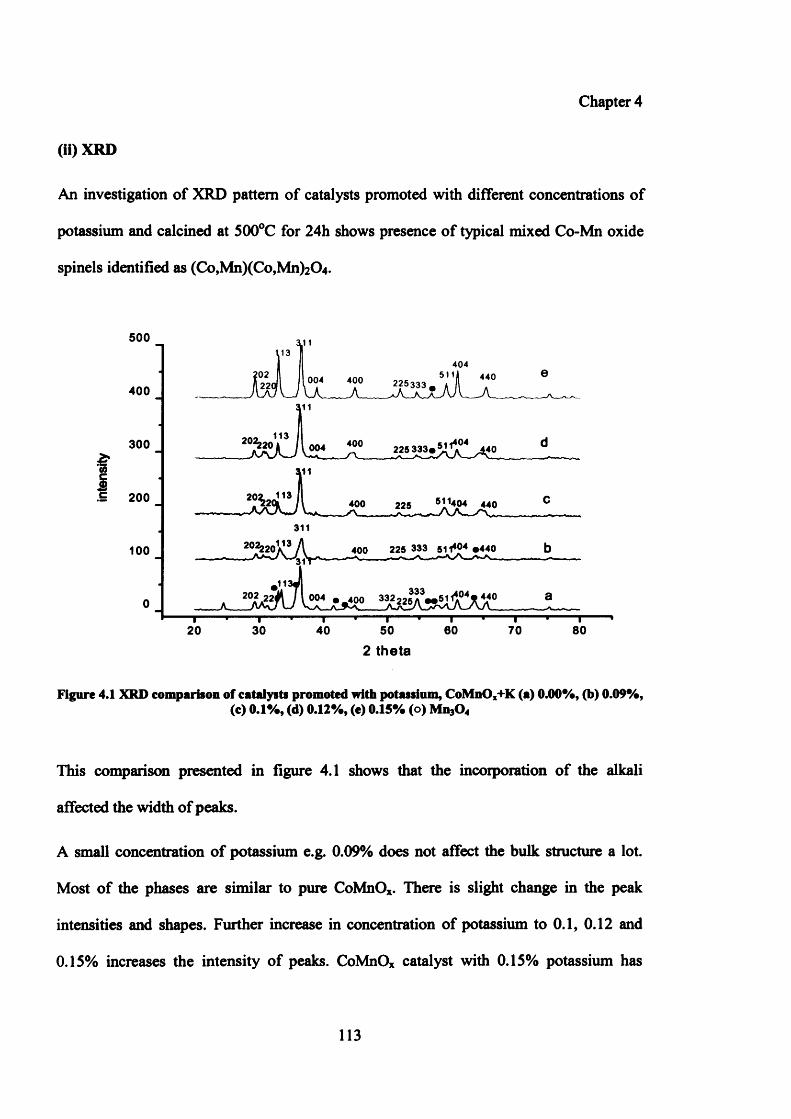
Chapter 4
(ii)XRD
An investigation of XRD pattern of catalysts promoted with different concentrations of
potassium and calcined at 500°C for 24h shows presence of typical mixed Co-Mn oxide
spinels identified as (Co,Mn)(Co,Mn)2C>4 .
1-------------------1-------------- 1-------- 1---- 1-------------------1---------• i -20 30 40 50 60 70 80
2 theta
Figure 4.1 XRD comparison of catalysts promoted with potassium, CoMnOx+K (a) 0.00%, (b) 0.09%,(c) 0.1%, (d) 0.12%, (e) 0.15% (o) Mn30 4
This comparison presented in figure 4.1 shows that the incorporation of the alkali
affected the width of peaks.
A small concentration of potassium e.g. 0.09% does not affect the bulk structure a lot.
Most of the phases are similar to pure CoMnOx. There is slight change in the peak
intensities and shapes. Further increase in concentration of potassium to 0.1, 0.12 and
0.15% increases the intensity of peaks. CoMnO* catalyst with 0.15% potassium has
113
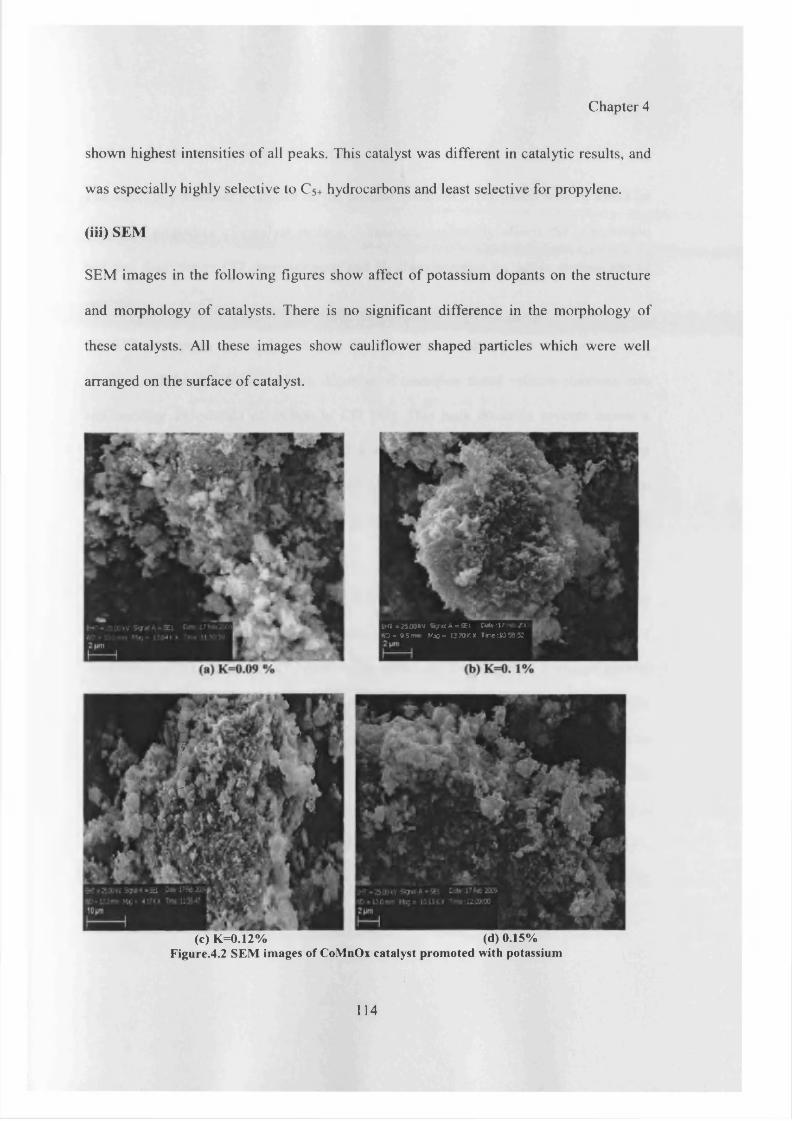
Chapter 4
shown highest intensities o f all peaks. This catalyst was different in catalytic results, and
was especially highly selective to C54 hydrocarbons and least selective for propylene.
(iii) SEM
SEM images in the following figures show affect o f potassium dopants on the structure
and morphology o f catalysts. There is no significant difference in the morphology of
these catalysts. All these images show cauliflower shaped particles which were well
arranged on the surface o f catalyst.
EHT = 25,00kV Signal A • SE1 Cutir' 11 Z AO » 95 m m Ksg - 12 70 K * l r 5 :10 58 5:
(c) K=0.12% (d) 0.15%Figure.4.2 SEM images of CoMnOx catalyst promoted with potassium
114
Chapter 4
4.3.2 Mechanism of promoter (K) action
The effect of potassium promoter on the product spectrum is consistent with its effect on
electronic properties of catalyst surface. Potassium, essentially affects the competition
between dissociative CO chemisoiption and H2 chemisorption on active surface site of
catalyst.
The CO adsorption mechanism during the FT reaction takes place via metal sigma
bonding and the simultaneous back donation of transition metal valence electrons into
anti bonding 2n orbitals of carbon in CO [39]. This back donation process causes a
strengthening of metal-carbon bond, and a simultaneous weakening of carbon-oxygen
bond. If there is sufficient weakening of C-O bond in the absorption process, then
dissociative CO adsorption will occur which generates the building blocks for the
formation of carbon chain.
Bonzel and Krebs [40, 41] have reported surface spectroscopic studies of CO adsorbed on
alkali metal doped transition-metal surfaces. These studies have indicated a significant
weakening of CO bond, and an increase in the extent of CO adsorption. A charge transfer
has been reported to take place from the alkali metal to the vacant d orbitals of the active
metal, as evidenced by the lowering of the work function [42]. The additional electron
density imparted to the metal serves to increase the extent of back donation into 2n
orbitals of CO, which causes a weakening of CO bond. This trend was observed by a
noticeable decrease in the CO stretching frequency upon addition of alkali promoters [43,
44]. An increase in AHads was indicated from measurement of heat of adsorption of CO
on Fe + K surface, with an increase in alkali metal content [45].
115
Chapter 4
The presence of an electron-donating species on the catalyst surface can suppress the
adsorption of hydrogen because hydrogen itself donates an electron to metal upon
adsorption [46]. It has been reported by Dry and Koel [45, 47] that the presence of CO
and surface carbide decreases the adsoiption of hydrogen on metals. Furthermore, heat of
adsorption of hydrogen decreases with an increase in alkali metal [45, 48, 49] which
confirms that alkali-metal addition suppresses adsorption of hydrogen. Assuming that K
has a similar effect on the chemisoiptive properties of the present CoMnOx catalyst, then
the observed reduction in methane formation and increase in selectivity of ethylene
(K=0.1%) can be attributed to the suppression in relative concentrations of H2 with
respect to CO. This decrease in H2 concentrations decreases the hydrogenating properties
of catalyst surface.
4.4 Ruthenium
Ruthenium metal has been reported to be a good promoter for an enhancement of
reduction of cobalt oxides and can inhibit the carbon deposition during FT reaction [50,
51]. Initially ruthenium catalysts were observed to be effective for “Polyethylene
synthesis” [52], later it was found that typical products of FT can be formed by using
ruthenium catalysts [51-56]. Ruthenium has been reported as a promoter which is not
negatively affected by water (a by product in FT) [57, 58], and inactive ruthenium oxides
are not formed. However, the exact reaction mechanism of Ru-promoted catalysts in FT
reaction has not been clear.
In the present studies ruthenium doped (0.05, 0 .1 and 0.15%) catalysts with CoMnOx
were prepared and tested under similar conditions as detailed in experimental section 4.2.
Ruthenium nitrocyl nitrate was used as a salt precursor.
116
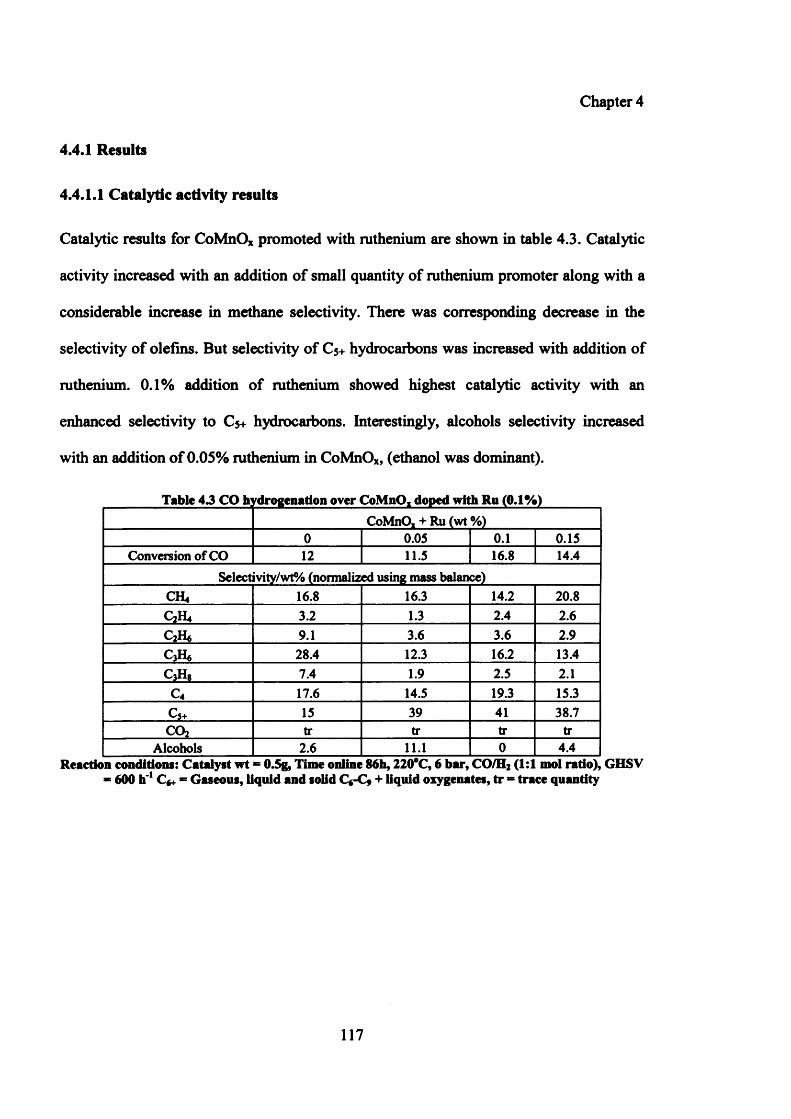
Chapter 4
4.4.1 Results
4.4.1.1 Catalytic activity results
Catalytic results for CoMnOx promoted with ruthenium are shown in table 4.3. Catalytic
activity increased with an addition of small quantity of ruthenium promoter along with a
considerable increase in methane selectivity. There was corresponding decrease in the
selectivity of olefins. But selectivity of C5+ hydrocarbons was increased with addition of
ruthenium. 0 .1 % addition of ruthenium showed highest catalytic activity with an
enhanced selectivity to C5+ hydrocarbons. Interestingly, alcohols selectivity increased
with an addition of 0.05% ruthenium in CoMnOx, (ethanol was dominant).
Table 43 CO lrrdrogenation over CoMnO, doped with Ru (0.1%)CoMnOi + Ru (wt %)
0 0.05 0.1 0.15Conversion of CO 12 11.5 16.8 14.4
Selectivity/wt% (normalized using mass balance)CH4 16.8 16.3 14.2 20.8
C2H4 3.2 1.3 2.4 2.6
QHfi 9.1 3.6 3.6 2.9CsH* 28.4 12.3 16.2 13.4CjHg 7.4 1.9 2.5 2.1
c 4 17.6 14.5 19.3 15.3C5+ 15 39 41 38.7C02 tr tr tr tr
Alcohols 2.6 11.1 0 4.4Reaction conditions: Catalyst wt = 0.5g, Time online 86h, 220°C, 6 bar, CO/H2 (1:1 mol ratio), GHSV
* 600 h' 1 Q+ = Gaseous, liquid and solid C*-C* + liquid oxygenates, tr = trace quantity
117
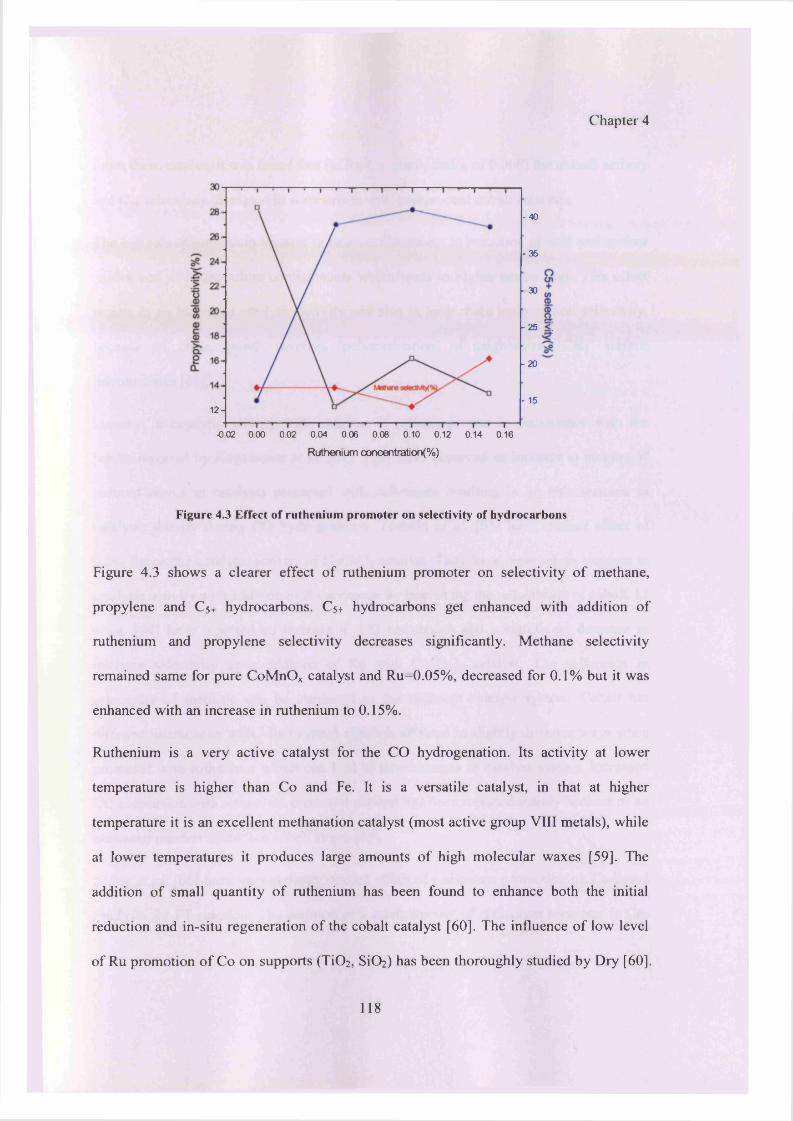
Chapter 4
- 40
-35
-30
-25 <:
-20
- 151 2 -
-0.02 0.00 0.02 0.04 0.06 0.08 0.10 0.12 0.14 0.16
Ruthenium ooncentration(%)
Figure 4.3 Effect of ruthenium promoter on selectivity of hydrocarbons
Figure 4.3 shows a clearer effect o f ruthenium promoter on selectivity o f methane,
propylene and C5+ hydrocarbons. C5+ hydrocarbons get enhanced with addition of
ruthenium and propylene selectivity decreases significantly. Methane selectivity
remained same for pure CoMnOx catalyst and Ru=0.05%, decreased for 0.1% but it was
enhanced with an increase in ruthenium to 0.15%.
Ruthenium is a very active catalyst for the CO hydrogenation. Its activity at lower
temperature is higher than Co and Fe. It is a versatile catalyst, in that at higher
temperature it is an excellent methanation catalyst (most active group VIII metals), while
at lower temperatures it produces large amounts o f high molecular waxes [59]. The
addition o f small quantity o f ruthenium has been found to enhance both the initial
reduction and in-situ regeneration o f the cobalt catalyst [60]. The influence o f low level
of Ru promotion of Co on supports (TiC>2 , SiC>2 ) has been thoroughly studied by Dry [60].
118
Chapter 4
From these studies, it was found that (at Ru/Co atomic ratios of 0.008) the overall activity
and C$+ selectivity increased in comparison with unpromoted cobalt catalysts.
The key role of ruthenium appears to be an enhancement in reduction of bulk and surface
oxides and of hydrocarbon contaminants which leads to higher active sites. This effect
results in an increased catalytic activity and also in long-chain hydrocarbon selectivity,
because FT chain growth involves ‘polymerization* of neighboring ‘CH2 * surface
intermediates [61].
Increase in catalytic activity with addition of ruthenium was in consistence with the
results reported by Kogelbauer et al. [62]. They have observed an increase in number of
reduced atoms in catalysts promoted with ruthenium resulting in an enhancement in
catalytic activity during CO hydrogenation. Tsubaki et al. [63] have studied effect of
0.2% Ru on the catalytic activity of Co/Si0 2 catalyst. They have reported an increase in
catalytic activity with addition of Ru promoter by improving the reducibility of cobalt. Li
et al. [64] have reported an increase in CO conversion and a significant decrease in
methane selectivity upon addition of Ru with Co/Ti0 2 catalyst. The difference in
selectivity of methane can be attributed to the different catalyst system. Cobalt has
different interactions with MnO system which is affected in slightly different ways when
promoted with ruthenium which can lead to new changes in catalyst system. Increased
CO conversion with ruthenium promoted catalyst has been reported mainly because of an
increased number of surface cobalt atoms [65].
Xiong et al. [6 6 ] have very recently studied effect of ruthenium promotion on Co-based
catalysts for FT reaction. The addition of a small amount of ruthenium promoter to Co
119
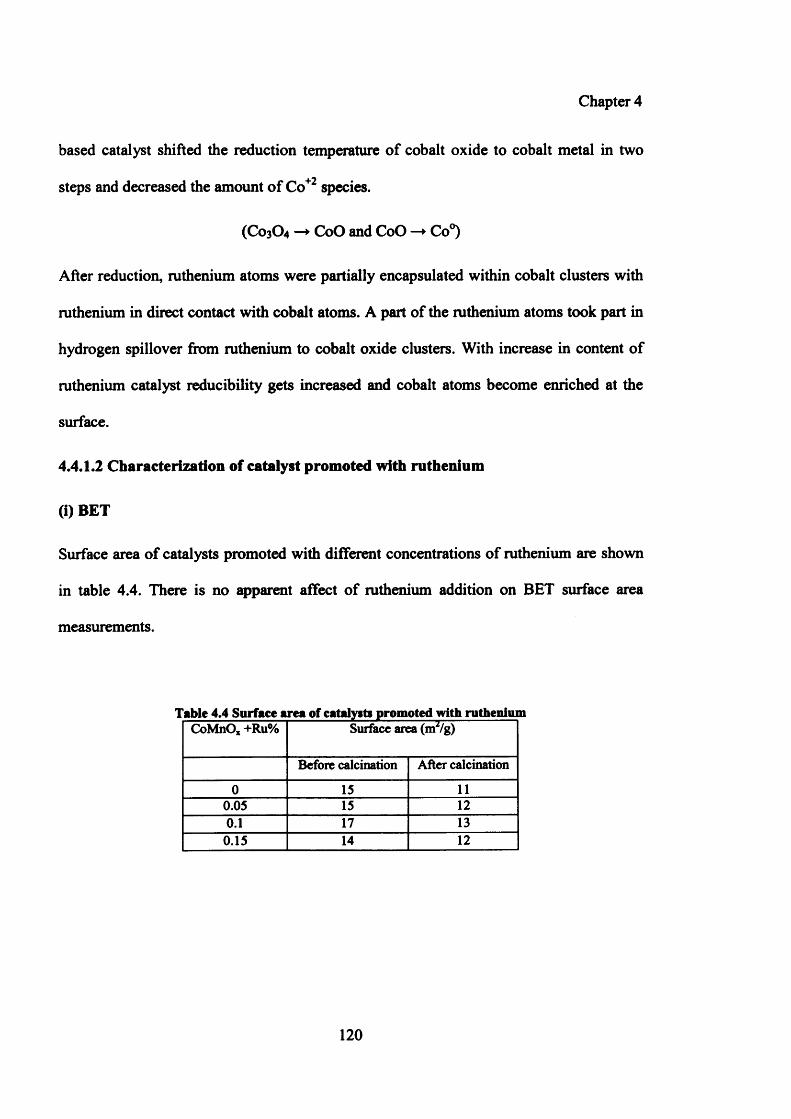
Chapter 4
based catalyst shifted the reduction temperature of cobalt oxide to cobalt metal in two
steps and decreased the amount of Co+2 species.
(C0 3 O4 —► CoO and CoO —► Co°)
After reduction, ruthenium atoms were partially encapsulated within cobalt clusters with
ruthenium in direct contact with cobalt atoms. A part of the ruthenium atoms took part in
hydrogen spillover from ruthenium to cobalt oxide clusters. With increase in content of
ruthenium catalyst reducibility gets increased and cobalt atoms become enriched at the
surface.
4.4.1.2 Characterization of catalyst promoted with ruthenium
(i) BET
Surface area of catalysts promoted with different concentrations of ruthenium are shown
in table 4.4. There is no apparent affect of ruthenium addition on BET surface area
measurements.
Table 4.4 Surface area of catalyita promoted with rutheniumCoMnO, +Ru% Surface area (itfVg)
Before calcination After calcination
0 15 110.05 15 120.1 17 13
0.15 14 12
120
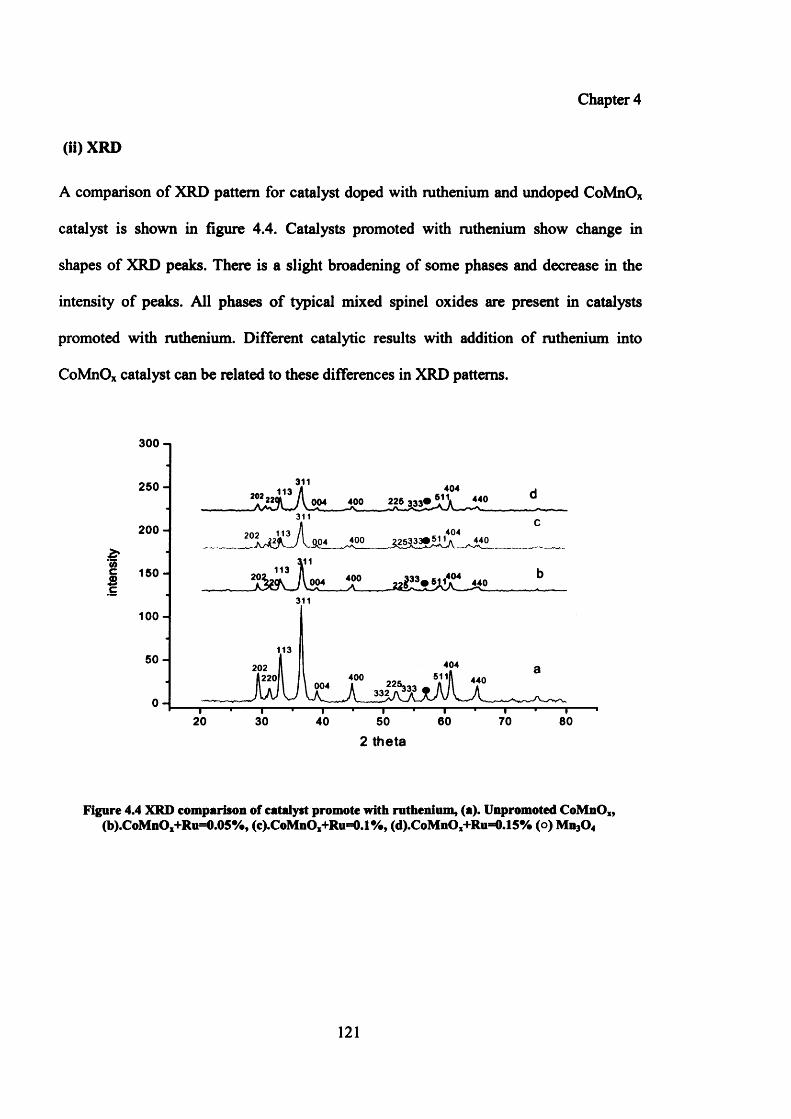
Chapter 4
(ii) XRD
A comparison of XRD pattern for catalyst doped with ruthenium and undoped CoMnOx
catalyst is shown in figure 4.4. Catalysts promoted with ruthenium show change in
shapes of XRD peaks. There is a slight broadening of some phases and decrease in the
intensity of peaks. All phases of typical mixed spinel oxides are present in catalysts
promoted with ruthenium. Different catalytic results with addition of ruthenium into
CoMnOx catalyst can be related to these differences in XRD patterns.
2 theta
Figure 4.4 XRD comparison of catalyst promote with ruthenium, (a). Unpromoted CoMnO,, (b).CoMnOx+Ru=0.05%, (c).CoMnOx+Ru=0.1 %, (d).CoMnO,+Ru=0.15% (o) Mn3Q4
121
Chapter 4
4.5 Primary alcohols selectivity
Both ruthenium (Ru=0.05 and 0.15%) and potassium (0.09, 0.12 and 0.15%) promoters
have shown an enhancement in the selectivities of alcohols. The formation of these was
consistent with an observed shift of selectivity pattern towards longer chain hydrocarbons
coupled with the presence of increased concentrations of CO which is available for
possible CO insertion in the formation of alcohols [67, 6 8 ].
It is reported that the addition of alkali salts to methanol synthesis catalysts often increase
yields of higher alcohols [69]. It has been suggested that selectivity of alcohols during
CO hydrogenation on Rh catalysts varies with the basicity or acidity of support [70].
Storch et al. [71] also have reported an increase in the content of oxygenated products
with potassium promoter while studying Fe/AkOa catalysts.
Ruthenium has been reported to enhance the selectivity of alcohols when used as a
promoter with Co catalysts [72, 73]. An enhancement in selectivity of alcohols has been
reported when using ruthenium and other transition metal promoters with Co-based
catalysts [74]. On the bases of extensive characterization studies it is noticed that highly
dispersed cobalt metal is the main active site in catalysts promoted with transition metals,
and that transition metals can promote the reduction of Co+2 cation to a metallic state by
hydrogen spillover mechanism.
122
Chapter 4
4.6 Conclusions
Effect of two different promoters on the catalytic performance of CoMnOx catalyst for
CO hydrogenation activity has been studied using potassium and ruthenium.
Promotion of cobalt manganese catalyst with potassium in the range of 0.09, 0.12 and
0.15% increased CO conversion and C5+ selectivity. Addition of 0.1% potassium
increased selectivity of light alkenes with decrease in methane selectivity.
From a literature survey the mechanism of promoter action was thought to be through the
influence of potassium on electronic properties of catalyst surface, which creates a
competition between dissociative CO chemisoiption and H2 adsorption on active catalyst
surface. An increase in CO dissociative adsoiption accompanied by a suppression of H2
adsorption was due to the enhancement of electron-donating character of active metal
with alkali promotion.
Addition of ruthenium promoter increased catalytic activity with corresponding increase
in methane selectivity. Light alkenes selectivity was decreased with an addition of
ruthenium metal and selectivity of C5+ hydrocarbons was enhanced.
4.7 Future work
Various aspects of addition of alkali and transition metal promoters (K and Ru) can be
further modified by detailed investigation of actual mechanisms involved. Ru has been
reported to affect the reduction behaviour of cobalt catalysts; TPR studies will be useful
to get an idea of change in reduction temperature with addition of various concentrations
123

Chapter 4
of Ru. CO chemisorption studies can provide an evidence of change in metal dispersion
of these promoted catalysts which may have an effect on catalytic behaviour.
CO chemisorption studies on potassium and ruthenium doped catalysts will be very
useful for explanation of increased selectivity of alcohols.
124
Chapter 4
4.8 References:
[1]. Y.T. Shah, and A. J. Perrotta, Ind. Eng. Chem. Prod. Res. Develop., 1976,15, 23
[2]. S. E. Colley, “Hydrogenation o f Carbon monoxide over modified cobalt-based catalysts”, PhD thesis, University of Witwatersrand, Johannesburg, South Africa, 1991
[3]. G.V. Lee, G. T. M. Bastein, I. V. Boogert, B. Schuller, H. Y. Luo, and V. Ponec, J. Chem. Soc. Farad. Trans., 1987, 83, 2013
[4]. G. W. Huber, S. J. M. Butala, M. L. Lee, and C. H. Bartholomew, Catal. Lett., 2001, 74, 45
[5]. H. K. Woo, R. Srinivasan, L. Rice, R. J. Deangelis, and P. J. Reucroft, J. Mol. Catal., 1990, 59, 83
[6 ]. J. E. Baker, R. Burch, S. J. Hibble, and P. K. Loader, Appl. Catal., 1990, 65, 281
[7]. S. E. Colley, M. J. Betts, R. J. Copperthwaite, G. J. Hutchings, and N. J. Coville, J. Catal., 1992,134, 186
[8 ]. A. F. Y. Alshammary, I. T. Caga, A. Y. Tata, J. M. Winterbottom, and I. R. Harris, J .Chem. Tech. Biotech., 1992, 55, 275
[9]. I. R. Harris, I. T. Caga, A. Y. Tata, and J. M. Winterbottom, Stud. Surf. Sci. Catal., 1993, 75, 2801
[10]. A. G. Ruiz, A. S. Escribano, and I. R. Ramos, Appl. Catal., 1994,120, 71
[11]. S. Bessel, Stud. Surf. Sci. Catal., 1994, 81 ,479
[12]. E. Kikuchi, R. Sorita, H. Takahashi, and T. Matsuda, Appl. Catal., 1999,186, 121
[13]. A. Frydman, D. G. Castner, C. T. Cambell, and M. Schmal, J. Catal., 1999,188, 1
[14]. S. Sun, N. Tsubaki, and K. Fujimoto, Chem. Lett., 2000, 2, 176
[15]. J. L. Li, L. G. Xu, R. A. Keogh, and B. H. Davies, in “Book o f abstracts ”, 219th ACS National Meeting, San Francisco, 2000
[16]. D. G. Wei, J. G. Goodwin, R. Oukaci, and A. H. Singleton, Appl. Catal., 2001, 210, 137
[17]. G. Jacobs, T. Das, P. M. Patterson, Y. Q. Zhang, J. L. Li, G. Racoillet, and B. H. Davies, Appl. Catal., 2002, 233, 263
125
Chapter 4
[18]. J. L. Li, G. Jacobs, Y. Q. Zhang, T. Das, and B. H. Davies, Appl. Catal., 2002, 223, 195
[19]. R. V. Belosludov, S. Skahara, K. Yajima, S. Takami, M. Kubo, and A. Miyamoto, Appl. Surf. Sci., 2002,189, 245
[20]. T. Riedel, and G. Schaub, Top. Catal., 2003, 26, 145
[21]. A. Martinez, C. Lopez, F. Marquez, and I. Diaz, J. Catal., 2003, 220, 486
[22]. M. Wei, K. Okabe, and H. Arakawa, J. Jap. Petrol. Inst., 2003, 46, 339
[23].W. S. Yang, D. H. Yin, J. Chang, H. W. Xiang, Y. Y. Xu, and Y. W. Li, Acta, Chim. Sinica., 2003, 61, 681
[24]. N. N. Madikizela-Mnqanqeni, and N. J. Coville, J. Mol. Catal., 2005, 225, 137
[25]. Y. Zhang, M. Koike, and N. Tsubaki, Catal. Lett., 2005, 99, 193
[26]. F. M. T. Mendes, C. A. C. Perez, F. B. Noronha, and M. Schmal, Catal. Today., 2005,101,45
[27]. Y. H. Zhang, H. F. Xiong, K. Y. Liew, and J. L. Li, J. Mol. Catal. Chem., 2005,237, 172
[28]. H. F. Xiong, Y. H. Zhang, K. Liew, and J. L. Li, J. Mol. Catal. Chem., 2005, 231, 145
[29]. T. K. Das, G. Jacobs, and B. H. Davies, Catal. Lett., 2005,101, 187
[30]. A. I. Molina, J. M. Robles, E. R. Catellon, B. Pawelec, J. L. G. Fierro, and A. Jimenez-Lopez, Appl. Catal., 2005, 286, 239
[31]. http://igitur-archive.library.uu.nl/dissertation/2006-0906-201148/c2.pdf
[32]. R. B. Anderson, in “The Fischer Tropsch Synthesis ”, Academic press, Orlando, FL, 1984
[33]. M. E. Dry, in “The Fischer Tropsch Synthesis ”, Springer-Verlag, New York, 1981, 159
[34]. Y. Yang, H. W. Xiang, Y. Y. Xu, L. Bai, and Y. W. LI, Appl. Catal., 2004, 266, 181
[35]. D. B. Bukur, D. Mukesh, and S. A. Patel, Ind. Eng. Chem. Res., 1990, 29, 194
[36]. D. G. Miller, and M. Moskovits, J. Phys. Chem., 1988, 92, 6081
126
Chapter 4
[37]. G. H. Yang, and A. G. Oblad, Am. Chem. Soc. Div. Pet. Chem. Prepr., 1978, 23, 513
[38]. M. E. Dry, and G. J. Oosthuizen, J. Catal., 1968,11, 18
[39]. C. T. Campbell, and D. W. Goodman, Surf. Sci., 1982,123,413
[40]. H. P. Bonzel, J. Vac. Sci. Technol., 1984, 2, 8 6 6
[41]. H. P. Bonzel, and H. J. Krebs, Surf. Sci., 1981,109, 527
[42]. N. D. Lang, and A. R. Williams, Phys. Rev. Lett., 1976, 37, 212
[43]. E. L. Garfunkel, J. E. Crowell, and G. A. Somoijai, J. Phys. Chem., 1982, 8 6 , 310
[44]. J. E. Crowell, E. L. Garfunkel, and S. A.Somoijai, Surf. Sci., 1982,121, 203
[45]. M. E. Dry, T. Shingles, L. J. Boshoff, and G. J. Oosthuizen, J. Catal., 1969,1 5 ,190
[46]. M. E. Dry, in “Catalysis, Science and Technology” Vol. 1, Springer Verlag, Berlin,1981,4, 159
[47]. B. E. Koel, D. E. Peebles, and J. M. White, Surf. Sci., 1981,107, 367
[48]. C. H. Bartholomew, Catal. Lett., 1990, 7, 27
[49]. J. L. Rankin, and C. H. Bartholomew, J. Catal., 1986,100, 533
[50]. E. iglesia, S. L. Soled, and R. A. Fiato, US Patent, 1988, 4794099
[51]. J. Panpranot, J. G. Goodwin, and A. Sayari, J. Catal., 2002,211, 530
[52]. D. L. King, J. Catal., 1978, 51, 316
[53]. D. S. Jordan, and A. T. Bell, J. Phys. Chem., 1986, 90, 4797
[54]. D. S. Jordan, and A. T. Bell, J. Catal., 1987,107, 338
[55]. E. Iglesia, S. Reyes, R. Madon, and S. Soled, Adv. Catal., 1993, 39, 221
[56]. M. A. Vannice, Catal. Rev., 1976,14, 153
[57]. C. S. Kellner, and A. T. Bell, J. Catal., 1981, 70, 418
[58]. M. Clayes, and E. S Van, Catal. Today., 2002, 71, 419
127
Chapter 4
[59]. M. A. Vannice, J. Catal., 1975, 37, 449
[60]. M. E. Dry, Stud. Surf. Sci. Catal., 2004,152, 560
[61]. E. Iglesia, S. L. Soled, R. A. Fiato, and G. H. Via, J. Catal., 1993,143, 345
[62]. A. Kogelbauer, J. G. Goodwin, and R. Oukaci, J. Catal., 1996,160, 125
[63]. N. Tsubaki, S. Sun, and K. Fujimoto, J. Catal., 2001,199, 236
[64]. J. Li, G. Jacobs, Y. Zhang, T. Das, and D. Davies, Appl. Catal., 2002, 223, 195
[65]. S. Vada, A. H. off, E. Adnanes, D. Schanke, and A. Holmen, Top. Catal., 1995, 2, 155
[66]. H. Xiong, Y. Zhang, K. Liew, and J. Li, Fuel Proc. Tech., 2009, 90, 237
[67]. D. A. Wesner, G. Linden, and H. P. Bonzel, Appl. Surf. Sci., 1986, 26, 335
[68]. G. Ertl, S. B. Lee, and M. Weiss, Surf. Sci., 1981, 92, 6081
[69]. S. C. Chuang, J. G. Goodwin, and I. Wender, J. Catal., 1985, 95, 435
[70]. J. R. Katzer, A. W. Sleight, P. Gajardo, J. B. Michel, E. F. Gleason, and S. McMillan, Farad. Discuss., 1979, 72, 72
[71]. H. H. Storch, N. Golumbic, and R. B. Anderson, in “77ie Fischer Tropsch and related synthesis” John Wiley and Sons, New York, 1951
[72]. B. H. Davies, Top. Catal., 2005, 32, 143
[73]. M. E. Dry, J. Chem. Tech. Biotech., 2002,77,43
[74]. K. Takeuchi, T. Matsuzaki, T. Hanaoka, and K. Wei, J. Mol. Catal., 1989, 55, 361
128
Chapter 5
Chapter 5
Fischer Tropsch Synthesis on activated carbons
combined with cobalt/iron and manganese; the effect of
preparation and reaction conditions on CO
hydrogenation
5.1 Introduction
Activated carbon is a form of carbon which is extremely porous and has a large surface
area available for chemical reactions. Sufficient activation for useful applications may
come solely from the high surface area, though further chemical treatment often enhances
the adsorbing properties of the material.
129
Chapter 5
Earlier studies indicated that using carbon as a support could alter catalytic behavior of
metals in Fischer Tropsch reaction [1, 2]. In addition studies utilizing glassy carbons
(carbon molecular sieves) showed that the ultramicroporosity in these carbons could
affect selectivity in certain reactions [3, 4]. This lead to an initial study focused on the
preparation and catalytic behavior of iron/glassy carbon catalysts [5-7]. It rapidly became
apparent that these carbon-supported iron systems were quite interesting and a broader
base was required for comparison, so catalysts composed of iron dispersed on graphitic
carbon, carbon blacks and activated carbons were also prepared. In contradiction to
earlier studies of Fe/carbon CO hydrogenation catalysts, these carbon supported iron
catalysts were very active, and they typically had higher activities and olefin/paraffin
ratios than unpromoted Fe/AkOa catalysts [5 ,6 ].
Recently Van Steen and Prinsloo [8 ] have used catalysts composed of iron supported on
carbon nano tubes for synthesis of C 1-C5 hydrocarbons from syngas hydrogenation.
However, the activity of these catalysts was quite low and declined quickly (from 45% to
15%) within 50h of testing.
In the last 20 years activated carbon has been widely used as a heterogeneous catalyst
support but it was not commonly applied in the FTS field [9-13]. Vannice et al. [14-17]
were pioneers of the use of activated carbon for supported FTS catalysts. They found that
only CH4 and C2-C4 olefins were produced selectively from syngas on activated carbon
supported catalysts. Ma et al. [18] have studied the FTS with activated carbon supported
iron catalysts. They found that catalyst activity was increased with increase in reduction
temperatures between 350 and 420°C and gas and liquid hydrocarbons were formed on
the catalysts with a C5+ weight percentage of about 35%.
130
Chapter 5
In recent years, studies over molecular sieves indicate that meso-porous materials are
very promising for primary production of diesel range hydrocarbons by FTS [19-22].
Production of hydrocarbons up to C28 has been reported by supported cobalt on these
materials at typical FT conditions. Activated carbon has been found to be another
promising catalyst support for restriction of hydrocarbon chain length [23-25].
The effect of molybdenum loading and four different types of activated carbon support
on activity, stability and selectivities to hydrocarbons and oxygenates during Fischer-
Tropsch synthesis have been studied by Ma et al. [26]. Addition of Mo promoter to the
Fe/Cu/K catalyst supported on peat derived activated carbon leads to improved catalyst
stability and selectivity. Carbon support type has been reported to affect both catalyst
activity and selectivity.
In the present study two different types of activated carbons (peat and wood) have been
investigated in combination with cobalt and iron/manganese catalysts for CO
hydrogenation. The particular aim of these studies was to obtain:
—Low methane and CO2 yield
—High selectivity of hydrocarbons
—High conversion of CO
131
Chapter 5
5.2 Experimental
The detailed preparation of catalysts and their testing has been discussed in chapter 2.
Two methods of preparation (Insipient wetness impregnation and co-precipitation) were
adopted for preparation of carbon supported/combined catalysts.
Impregnation method was used for the preparation of wood and peat derived activated
carbon supported catalysts with weight ratio of Co/Mn/C=20/20/60%. Weighed
quantities of cobalt and manganese nitrates were dissolved in water and impregnated on
carbon supports. Impregnated materials were dried at 110°C for 16h and calcined at
500°C under continuous flow of helium for 24h.
Activated carbon combined with cobalt manganese catalysts (Co/Mn/C = 40/40/20%)
were prepared by co-precipitation from a solution of mixed nitrates at 80°C. Carbon was
added in the mixed metal nitrate solutions (Co/Mn=l/l). Precipitation was done with
aqueous solution of ammonium hydroxide at 80°C. pH was varied from 4 to 8.0.
Precipitates were filtered and dried at 110°C and calcined at 500°C under continuous flow
of helium for 24h.
Exactly similar method was adopted for the synthesis of iron manganese catalysts with
activated carbons (Fe/Mn/C =40/40/20%). Iron nitrate was used as a salt precursor. pH
was varied from 0 .2 1 -8 .0 0 .
The calcined catalysts were pelleted and sieved (0.65-0.85mm). Catalysts (0.5g) were
loaded into six fixed-bed laboratory reactors (Appendix 4). Catalysts were subsequently
reduced in situ at 400°C for 16h in a hydrogen atmosphere (GHSV = 600h**). All
catalysts were tested under almost identical reaction conditions (CO/H2 = 1/1, T = 220°C,
132
Chapter 5
P = 6 bar, and GHSV = 600b'1). A stabilization period of ~100h after initiation of FT
synthesis was allowed before mass balance data collection. Analysis of gas products was
determined by on-line gas chromatography capable of analysis of hydrocarbons (FID)
and C0 ,H2,C0 2 ,N2 (TCD detector) detailed in appendix 5 and 6 .
5.3 Results
5.3.1 Co/Mn supported on wood and peat derived activated carbons
Two catalysts were prepared with wood and peat derived activated carbons
(Co/Mn/C=20/20/60%) using incipient wetness impregnation method. Weighed
quantities of cobalt and manganese nitrates were dissolved in distilled water and
impregnated on wood derived activated carbon. Impregnated material was dried at 110°C
for 16h and calcined at 500°C under helium for 24h.
5.3.1.1 Catalytic testing results of Co/Mn supported on wood and peat activated
carbons
Table 5.1 shows a comparison of supported cobalt and manganese on wood and peat
derived activated carbon with a pure CoMnOx catalyst (prepared by co precipitation
method and calcined in an air atmosphere). All three catalysts were tested at 240°C.
Catalyst supported with 60% wood derived activated carbon was found to be more active
compared with pure CoMnOx catalyst along with an increase in selectivity of C5+
hydrocarbons. Interestingly C02 selectivity was less with wood supported catalyst
compared with pure CoMnOx catalyst.
133
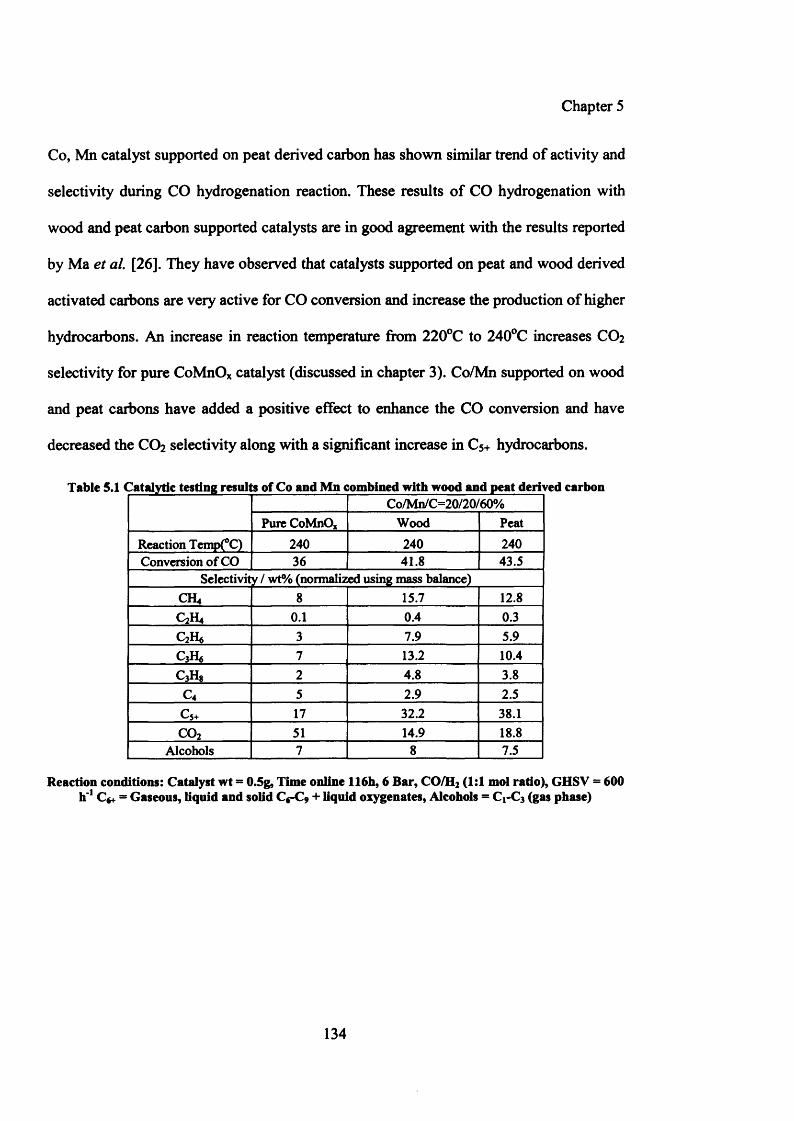
Chapter 5
Co, Mn catalyst supported on peat derived carbon has shown similar trend of activity and
selectivity during CO hydrogenation reaction. These results of CO hydrogenation with
wood and peat carbon supported catalysts are in good agreement with the results reported
by Ma et al. [26]. They have observed that catalysts supported on peat and wood derived
activated carbons are very active for CO conversion and increase the production of higher
hydrocarbons. An increase in reaction temperature from 220°C to 240°C increases CO2
selectivity for pure CoMnOx catalyst (discussed in chapter 3). Co/Mn supported on wood
and peat carbons have added a positive effect to enhance the CO conversion and have
decreased the CO2 selectivity along with a significant increase in C5+ hydrocarbons.
Table 5.1 Catalytic testing results of Co and Mn combined with wood and peat derived carbonCo/Mn/C=20/20/60%
Pure CoMnO„ Wood PeatReaction Temp(°C) 240 240 240Conversion of CO 36 41.8 43.5
Selectivity / wt% (normalized using mass balance)CH4 8 15.7 12.8C2H4 0.1 0.4 0.3C2H6 3 7.9 5.9C3H5 7 13.2 10.4C3H* 2 4.8 3.8
C4 5 2.9 2.5C5+ 17 32.2 38.1c o 2 51 14.9 18.8
Alcohols 7 8 7.5
Reaction conditions: Catalyst wt = 0.5g, Time online 116b, 6 Bar, CO/H2 (1:1 mol ratio), GHSV = 600 h '1 C«+ - Gaseous, liquid and solid C6-C9 + liquid oxygenates, Alcohols = Cr C3 (gas phase)
134
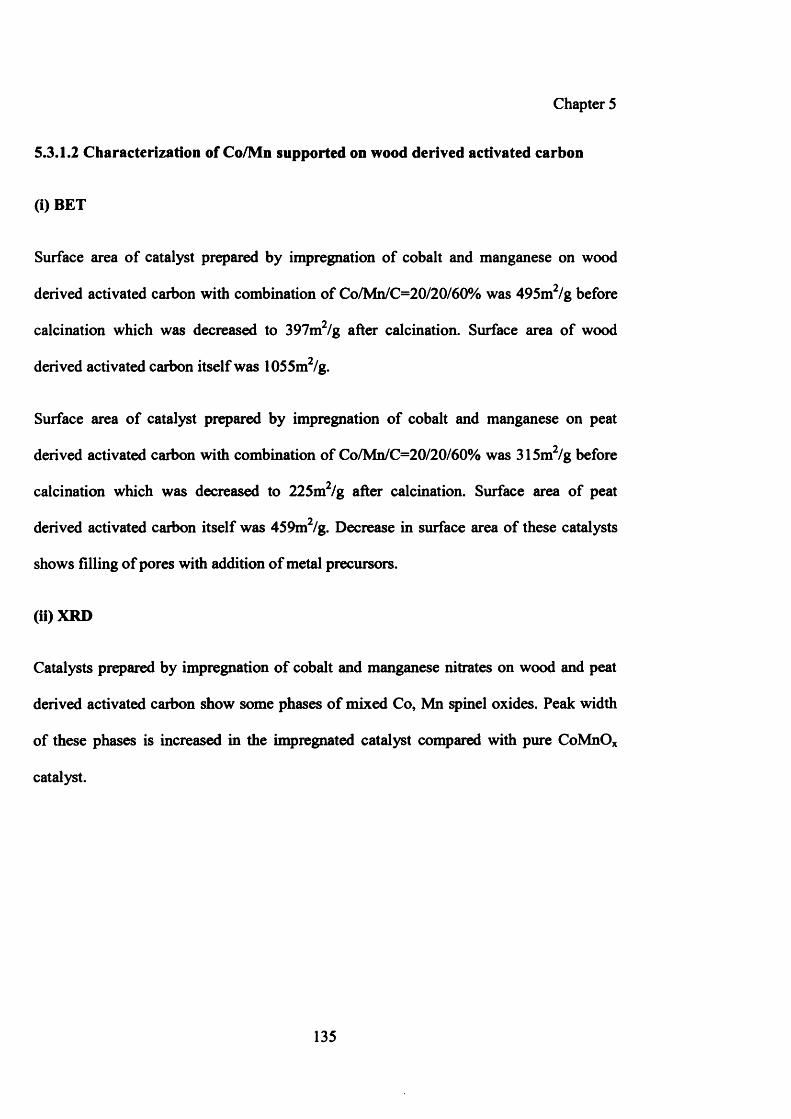
Chapter 5
5.3.1.2 Characterization of Co/Mn supported on wood derived activated carbon
(i) BET
Surface area of catalyst prepared by impregnation of cobalt and manganese on wood
derived activated carbon with combination of Co/Mn/C=20/20/60% was 495m2/g before
calcination which was decreased to 397m2/g after calcination. Surface area of wood
derived activated carbon itself was 1055m2/g.
Surface area of catalyst prepared by impregnation of cobalt and manganese on peat
derived activated carbon with combination of Co/Mn/C=20/20/60% was 315m2/g before
calcination which was decreased to 225m /g after calcination. Surface area of peat
derived activated carbon itself was 459m2/g. Decrease in surface area of these catalysts
shows filling of pores with addition of metal precursors.
(ii)XRD
Catalysts prepared by impregnation of cobalt and manganese nitrates on wood and peat
derived activated carbon show some phases of mixed Co, Mn spinel oxides. Peak width
of these phases is increased in the impregnated catalyst compared with pure CoMnOx
catalyst.
135
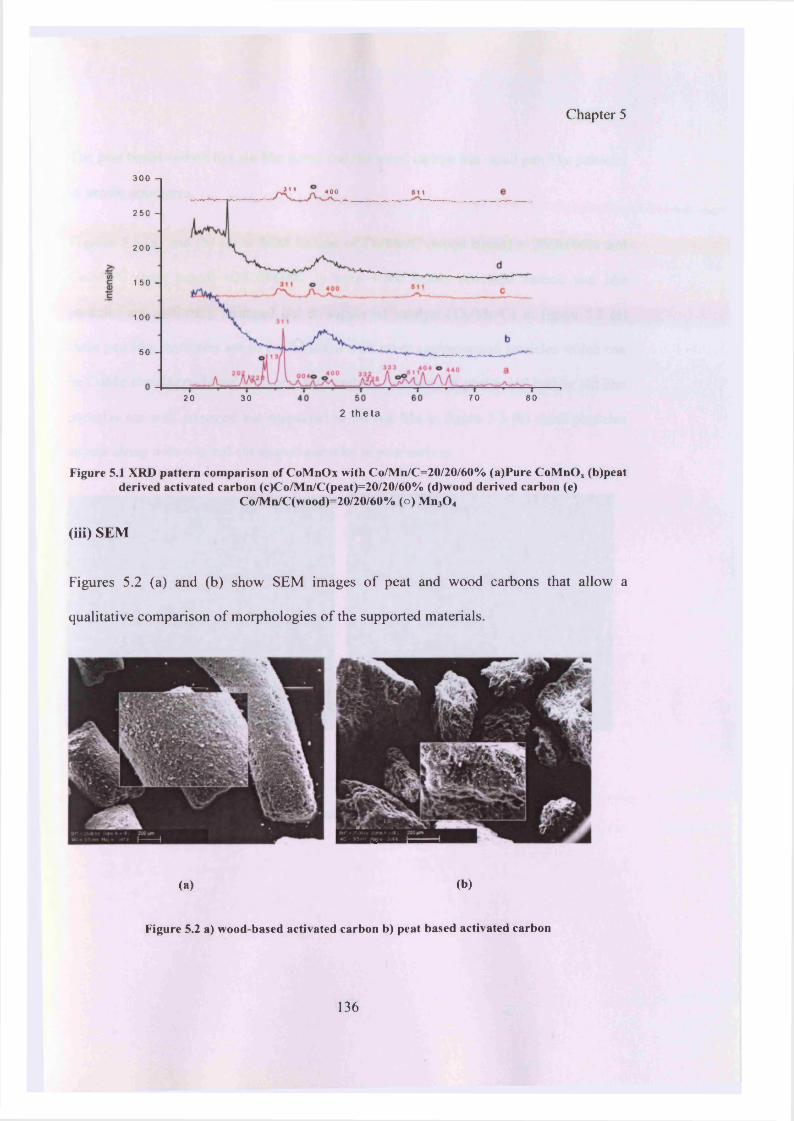
Chapter 5
3 0 0 - |
311 4 0 0
250 -
2 0 0 -
150 -
1 0 0 -
50 -
70 8020 30
2 t h e t a
Figure 5.1 XRD pattern comparison of CoMnOx with Co/Mn/C=20/20/60% (a)Pure CoMnO, (b)peat derived activated carbon (c)Co/Mn/C(peat)=20/20/60% (d)wood derived carbon (e)
Co/Mn/C(wood)=20/20/60% (o) Mn30 4
(iii) SEM
Figures 5.2 (a) and (b) show SEM images o f peat and wood carbons that allow a
qualitative comparison o f morphologies o f the supported materials.
(a) (b)
Figure 5.2 a) wood-based activated carbon b) peat based activated carbon
136
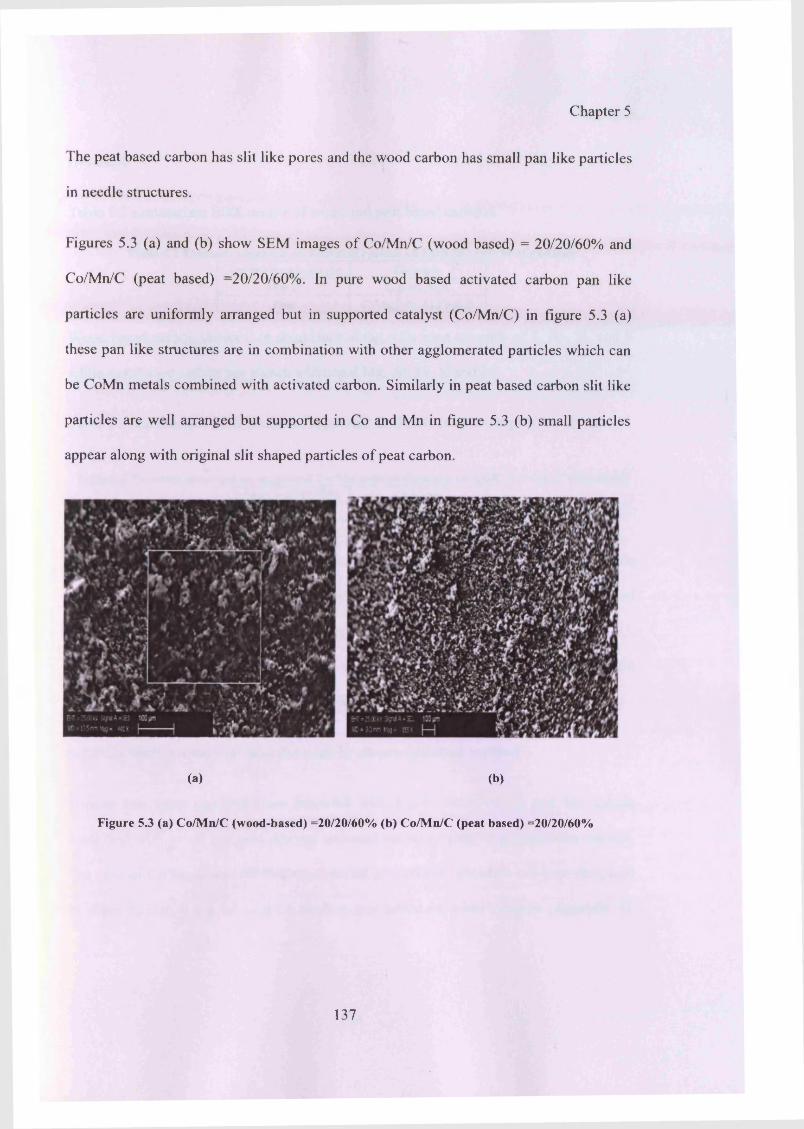
Chapter 5
The peat based carbon has slit like pores and the wood carbon has small pan like particles
in needle structures.
Figures 5.3 (a) and (b) show SEM images o f Co/Mn/C (wood based) = 20/20/60% and
Co/Mn/C (peat based) =20/20/60%. In pure wood based activated carbon pan like
particles are uniformly arranged but in supported catalyst (Co/Mn/C) in figure 5.3 (a)
these pan like structures are in combination with other agglomerated particles which can
be CoMn metals combined with activated carbon. Similarly in peat based carbon slit like
particles are well arranged but supported in Co and Mn in figure 5.3 (b) small particles
appear along with original slit shaped particles o f peat carbon.
(a) (b)
Figure 53 (a) Co/Mn/C (wood-based) =20/20/60% (b) Co/Mn/C (peat based) =20/20/60%
137
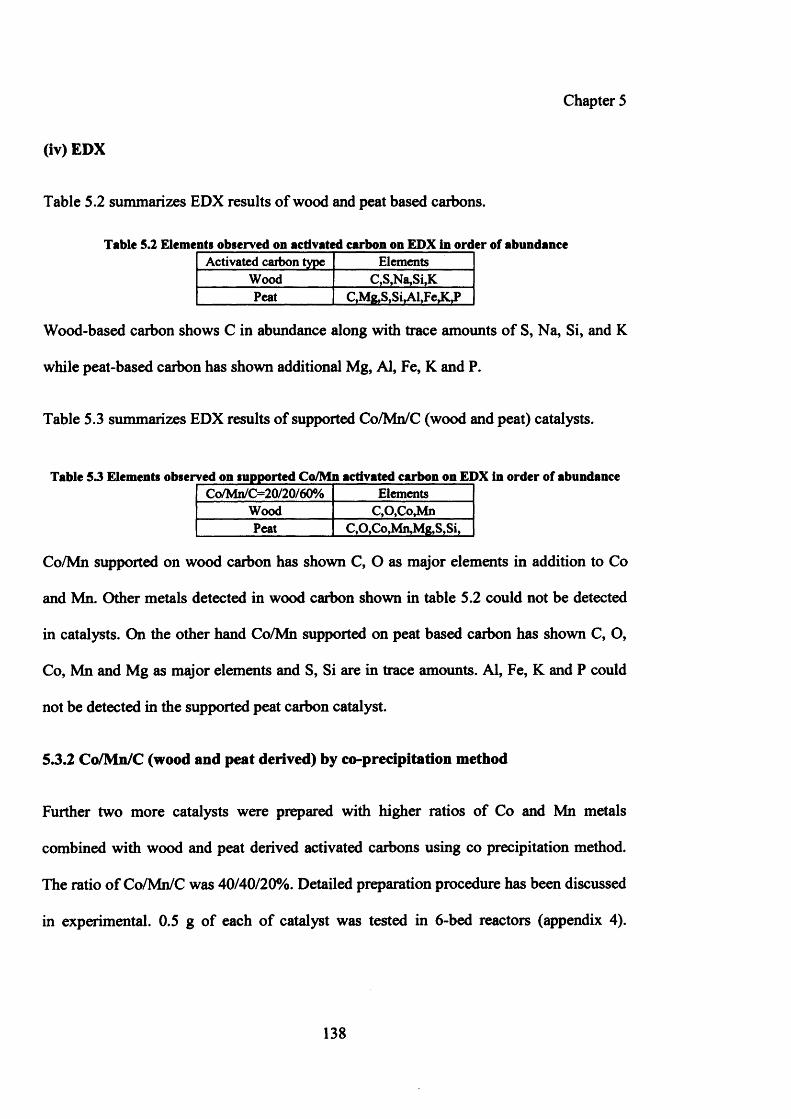
Chapter 5
(iv) EDX
Table 5.2 summarizes EDX results of wood and peat based carbons.
Table 5.2 Elements observed on activated carbon on EDX in order of abundanceActivated carbon type Elements
Wood C,S,Na,Si,KPeat C.MfcS.SiAUcJCP
Wood-based carbon shows C in abundance along with trace amounts of S, Na, Si, and K
while peat-based caibon has shown additional Mg, Al, Fe, K and P.
Table 5.3 summarizes EDX results of supported Co/Mn/C (wood and peat) catalysts.
Table 53 Elements observed on supported Co/Mn activated carbon on EDX in order of abundanceCo/Mn/C=20/20/60% Elements
Wood C,0,Co,MnPeat C,0,Co,Mn,Mg,S,Si,
Co/Mn supported on wood carbon has shown C, O as major elements in addition to Co
and Mn. Other metals detected in wood carbon shown in table 5.2 could not be detected
in catalysts. On the other hand Co/Mn supported on peat based carbon has shown C, O,
Co, Mn and Mg as major elements and S, Si are in trace amounts. Al, Fe, K and P could
not be detected in the supported peat carbon catalyst.
5.3.2 Co/Mn/C (wood and peat derived) by co-precipitation method
Further two more catalysts were prepared with higher ratios of Co and Mn metals
combined with wood and peat derived activated carbons using co precipitation method.
The ratio of Co/Mn/C was 40/40/20%. Detailed preparation procedure has been discussed
in experimental. 0.5 g of each of catalyst was tested in 6 -bed reactors (appendix 4).
138
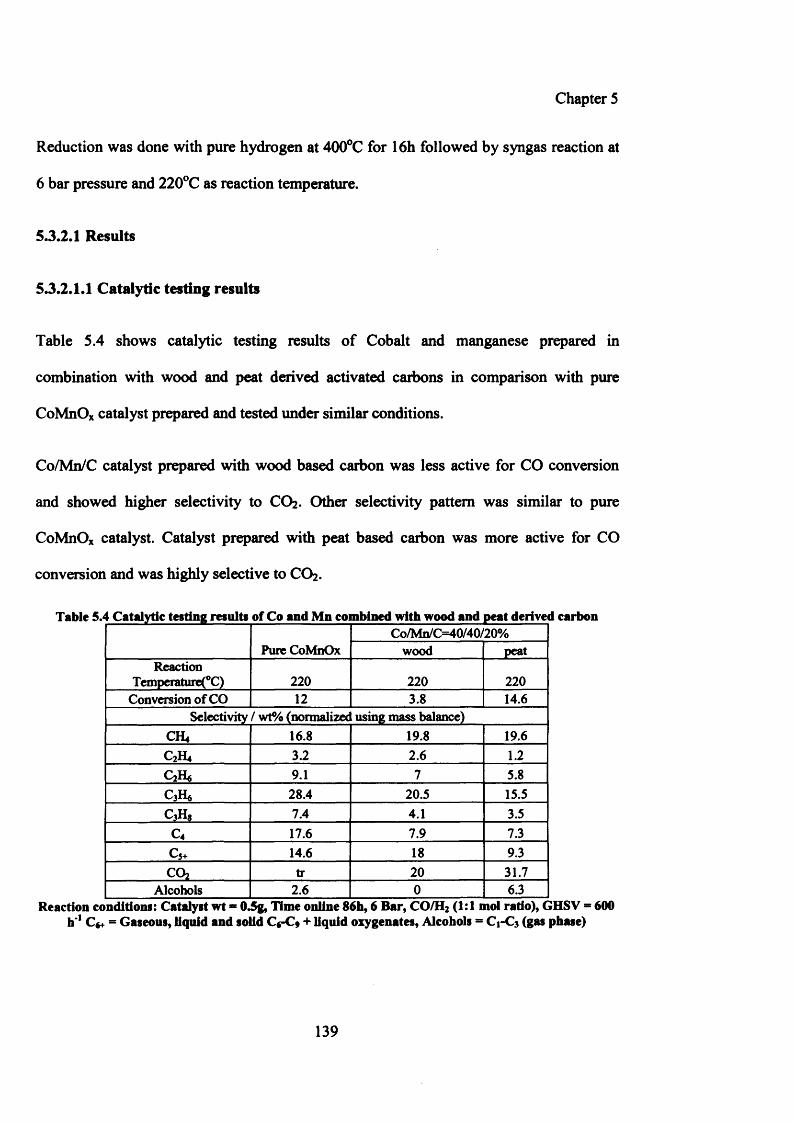
Chapter 5
Reduction was done with pure hydrogen at 400°C for 16h followed by syngas reaction at
6 bar pressure and 220°C as reaction temperature.
5.3.2.1 Results
5.3.2.1.1 Catalytic testing results
Table 5.4 shows catalytic testing results of Cobalt and manganese prepared in
combination with wood and peat derived activated carbons in comparison with pure
CoMnOx catalyst prepared and tested under similar conditions.
Co/Mn/C catalyst prepared with wood based carbon was less active for CO conversion
and showed higher selectivity to CO2 . Other selectivity pattern was similar to pure
CoMnOx catalyst. Catalyst prepared with peat based carbon was more active for CO
conversion and was highly selective to CO2.
Table 5.4 Catalytic testing result! of Co and Mn combined with wood and peat derived carbon
Pure CoMnOxCo/Mn/C=40/40/20%
wood peatReaction
Temperature(0C) 2 2 0 2 2 0 2 2 0
Conversion of CO 1 2 3.8 14.6Selectivity / wt% (normalized using mass balance)
CH4 16.8 19.8 19.6C2H4 3.2 2 . 6 1 . 2
QH* 9.1 7 5.8CsH* 28.4 20.5 15.5c 3h 8 7.4 4.1 3.5
c 4 17.6 7.9 7.3c 5+ 14.6 18 9.3CO2 tr 2 0 31.7
Alcohols 2 . 6 0 6.3Reaction conditions: Catalyst wt * 0.5g, Time online 86h, 6 Bar, CO/H2 (1:1 mol ratio), GHSV = 600
h*1 C*+ = Gaseous, liquid and solid C*-C* + liquid oxygenates, Alcohols = Cr C3 (gas phase)
139
Chapter 5
Ideally, comparison of Co/Mn/C (peat) catalysts presented in table 5.2 and 5.4 cannot be
made because of different catalysts and reaction conditions. But, it can be argued that
Co/Mn supported on wood and peat activated carbons by method of incipient wetness
impregnation are better with respect to CO conversion and CO2 selectivity compared with
catalysts prepared with both types of carbons in combination with Co and Mn by method
of co-precipitation.
5.3.2.1.2 Characterization of Co and Mn precipitated with peat and wood derived
activated carbon
(i)XRD
Figure 5.4 shows XRD pattern of Co/Mn/C =40/40/20% in combination with peat and
wood based carbons. Both catalysts (Co/Mn/C, with wood and peat carbons) show typical
phases of Co, Mn mixed spinel oxides along with carbon.
Interestingly, XRD pattern of Co/Mn/C supported catalysts shown in figure 5.2 shows
more phases of Co, Mn spinel oxides compared with higher loadings of Co, Mn with
carbons shown in figure 5.4.
It can be argued that metals were more homogeneously dispersed on carbons by
impregnation method compared with co-precipitation of Co and Mn with activated
carbons. This is worth mentioning here that during co-precipitation of metal salts,
although carbon was mixed and stirred with solutions but most of the carbon particles
were not mixed thoroughly with precipitates.
140
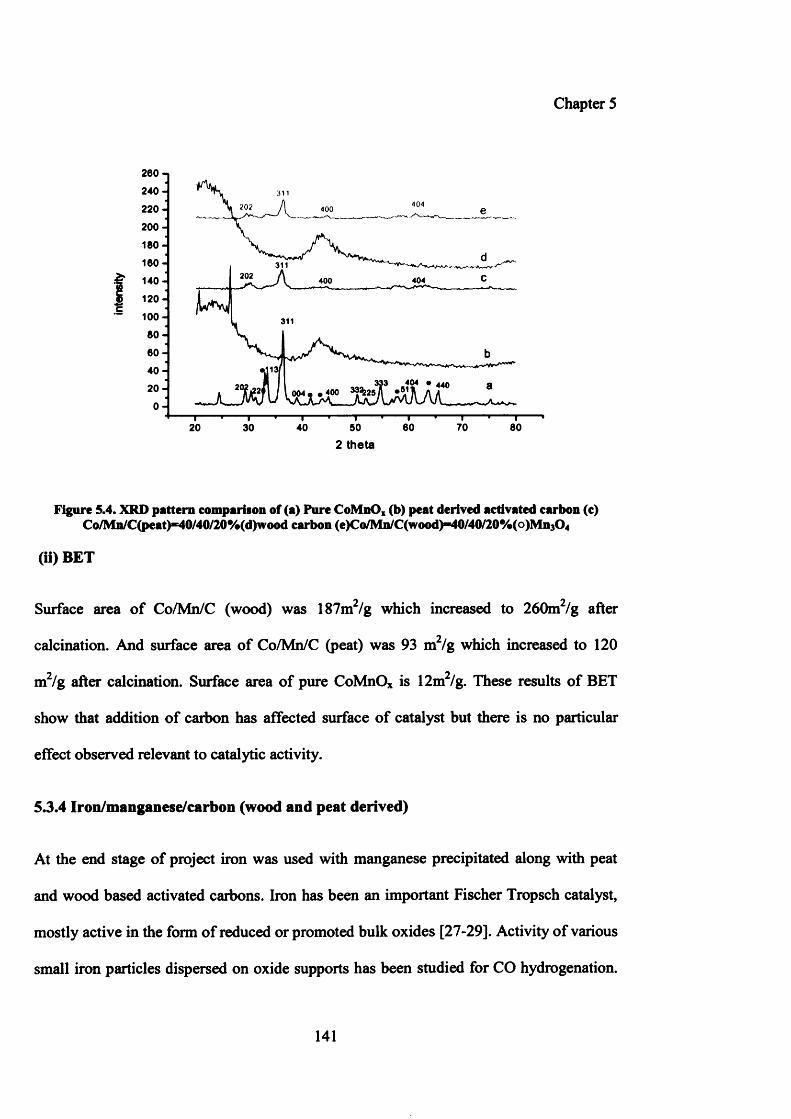
Chapter 5
260 i
2 4 0 - 3114042022 2 0 - 400
2 0 0 -
180
160- 311
140- 404400
120 -
100 - 311
60
402 0 - 004
0 -
50 60 70 8020 30 402 theta
Figure 5.4. XRD pattern comparison of (a) Pure CoMnOx (b) peat derived activated carbon (c) Co/Mn/C(peat)*40/40/20%(d)wood carbon (e)Co/Mn/C(wood)B'40/40/20%(o)Mn304
(ii) BET
Surface area of Co/Mn/C (wood) was 187m /g which increased to 260m /g after
calcination. And surface area of Co/Mn/C (peat) was 93 m2/g which increased to 120
m /g after calcination. Surface area of pure CoMnOx is 12m /g. These results of BET
show that addition of carbon has affected surface of catalyst but there is no particular
effect observed relevant to catalytic activity.
53.4 Iron/manganese/carbon (wood and peat derived)
At the end stage of project iron was used with manganese precipitated along with peat
and wood based activated carbons. Iron has been an important Fischer Tropsch catalyst,
mostly active in the form of reduced or promoted bulk oxides [27-29]. Activity of various
small iron particles dispersed on oxide supports has been studied for CO hydrogenation.
141
Chapter 5
It has been observed that strong interactions of iron with oxide surfaces prevent the
complete reduction of iron [30-33]. Jung et al. [34, 35] have reported that the use of
carbon support can prevent the reducibility problem and can also provide high dispersion
of iron. They have reported very interesting activity results of iron/caxbon catalysts for
CO hydrogenation.
Two catalysts were prepared using Fe/Mn/C (wood and peat) = 40/40/20% by co
precipitation method. Briefly carbon was added into mixed solutions of iron and
manganese nitrates and precipitated with aqueous ammonia solution at 80°C. pH was
varied from 0.21-8.00. Precipitates were filtered, washed, dried and calcined under
standard conditions. Both catalysts were pelleted and sieved to 0.65-0.85mm, reduced
under pure hydrogen at 400°C for 16h followed by syngas reaction. Iron catalysts were
found to be inactive at 220°C and were tested at 300°C.
Fe/Mn catalyst prepared with wood based carbon was not very active even at 300°C
compared with peat based carbon catalyst. Major product with Fe/Mn/C (wood based
carbon) was CC>2- Fe/Mn/C (peat based carbon) was very active for CO conversion and
showed CO2 as main product along with alkanes selectivity pattern similar to wood based
carbon catalyst. Iron has been reported to be an active water gas shift catalyst which
results in higher CO2 formation during FT reaction. Relatively very few studies have
been published to discuss the formation of CO2 in the FT synthesis. There are different
phases of iron in iron-based catalysts, i.e., magnetite and carbide. XRD pattern of
Fe/Mn/C catalysts in present studies has shown magnetite phases along with mixed
phases of Fe and Mn.
142
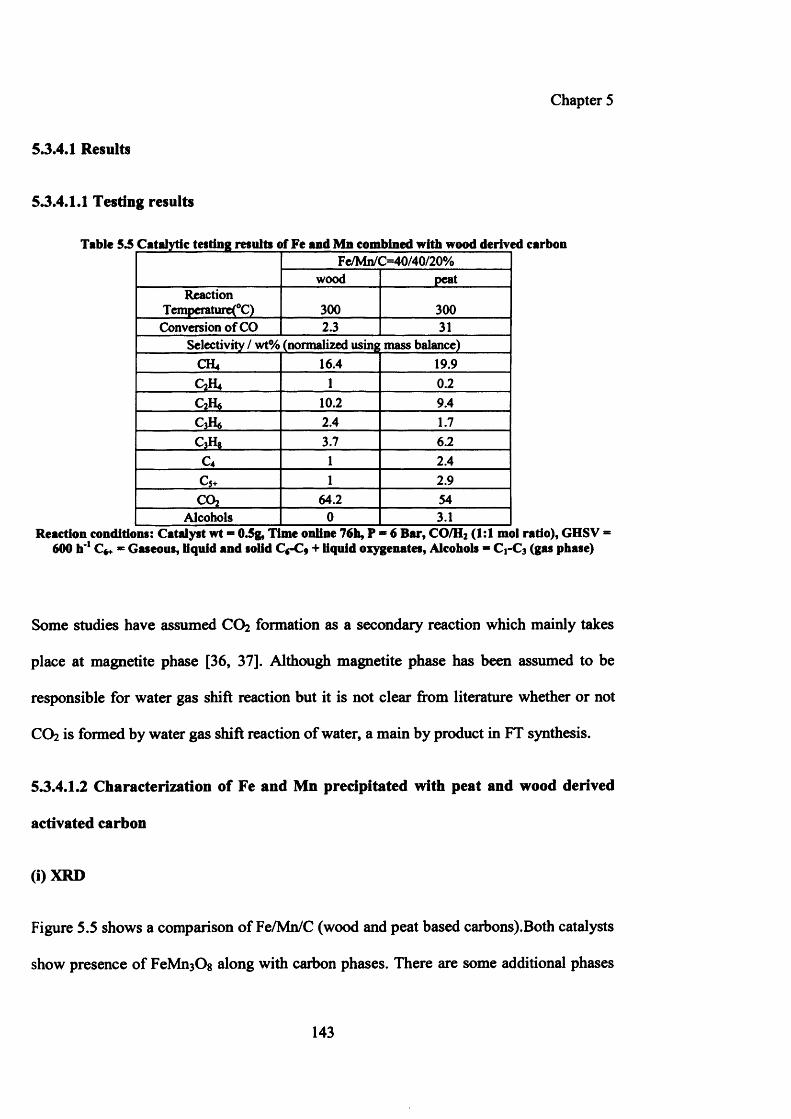
Chapter 5
5.3.4.1 Results
5.3.4.1.1 Testing results
Table 5.5 Catalytic testing results of Fe and Mn combined with wood derived carbonFe/Mn/C=40/40/20%
wood peatReaction
Temperatune(0C) 300 300Conversion of CO 2.3 31
Selectivity / wt% (normalized using mass balance)CH4 16.4 19.9C2H4 1 0.2
10.2 9.4C3H6 2.4 1.7c 3h* 3.7 6.2
c 4 1 2.4c 5+ 1 2.9COj 64.2 54
Alcohols 0 3.1Reaction conditions: Catalyst wt = 0.5g, Time online 76b, P = 6 Bar, CO/H2 (1:1 mol ratio), GHSV *
600 h' 1 C*+ ■ Gaseous, liquid and solid C<-C* + liquid oxygenates, Alcohob ■ Cj-C3 (gas phase)
Some studies have assumed CO2 formation as a secondary reaction which mainly takes
place at magnetite phase [36, 37]. Although magnetite phase has been assumed to be
responsible for water gas shift reaction but it is not clear from literature whether or not
CO2 is formed by water gas shift reaction of water, a main by product in FT synthesis.
5.3.4.1.2 Characterization of Fe and Mn precipitated with peat and wood derived
activated carbon
(i) XRD
Figure 5.5 shows a comparison of Fe/Mn/C (wood and peat based carbons).Both catalysts
show presence of FeMnsOg along with carbon phases. There are some additional phases
143
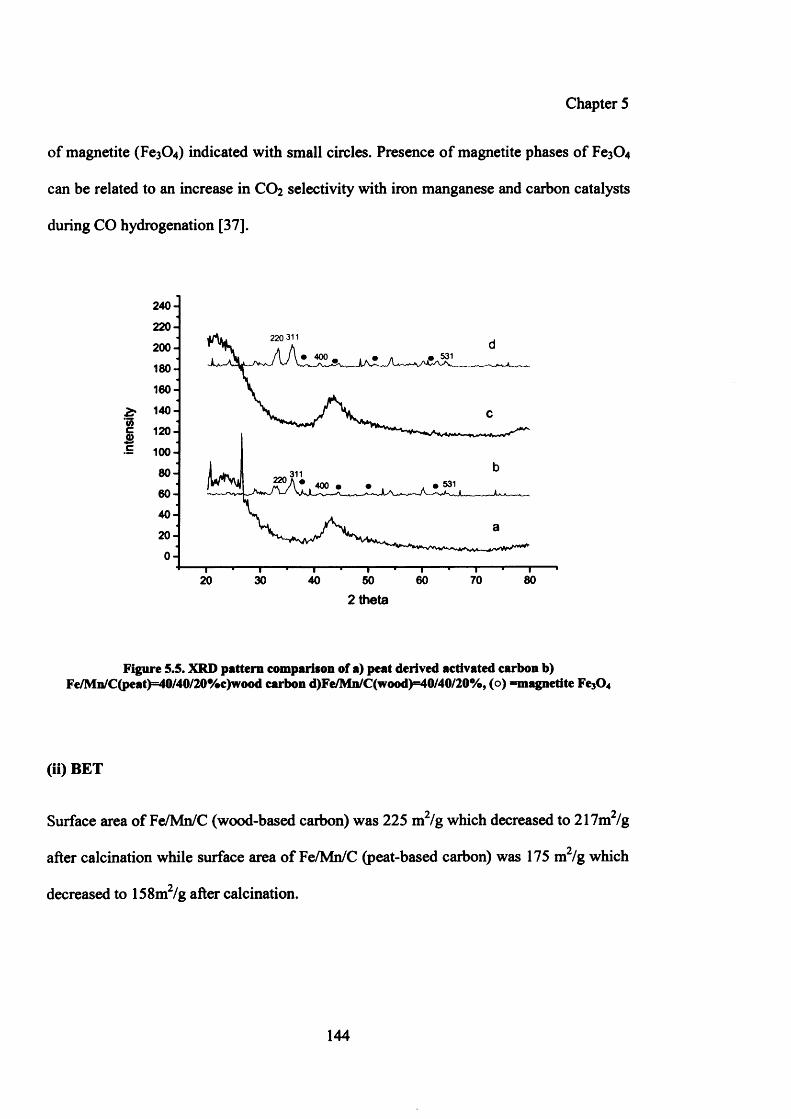
Chapter 5
of magnetite (Fe3C>4) indicated with small circles. Presence of magnetite phases of Fe3C>4
can be related to an increase in CO2 selectivity with iron manganese and carbon catalysts
during CO hydrogenation [37].
240
220 311200
v 531• 400180160
& 140-'55“ 120 -c£c 100-
80- 311220 • 531400 •60-40-20 -
0 -
8060 7020 30 40 502 theta
Figure 5.5. XRD pattern comparison of a) peat derived activated carbon b) Fe/Mn/C(peat)=40/40/20%c)wood carbon d)Fe/Mu/C(wood)=40/40/20%, (o) =magnetite Fe30 4
(ii) BET
A ^
Surface area of Fe/Mn/C (wood-based carbon) was 225 m /g which decreased to 217m /g
after calcination while surface area of Fe/Mn/C (peat-based carbon) was 175 m2/g which
decreased to 158m2/g after calcination.
144
Chapter 5
5.4. Conclusions
Effect of two different types of carbon (wood and peat derived) on the catalytic
performance (activity and selectivity) of cobalt and manganese catalysts is discussed in
this chapter. Impregnation method was used for supporting cobalt and manganese on
peat and wood carbons and their catalytic activity was compared under similar reaction
conditions. Both types of carbons combined with metals were found to be more selective
to the production of C5+ hydrocarbons with far higher CO conversion and low selectivity
to CO2 in comparison with pure CoMnO* at 240°C.
Further metal concentrations were increased along with both wood and peat carbons and
were tested at lower temperature. Catalysts with higher concentrations of cobalt and
manganese with 20% carbons were found to be less active at 220°C along with very high
selectivity to CO2 and low productivity of hydrocarbons compared with pure CoMnOx at
220°C.
Two iron catalysts have been prepared and tested with wood and peat based carbons and
are found to be highly selective for CO2 formation. Over all cobalt and manganese
catalysts supported with wood based carbon, Co/Mn/C = 20/20/60% has been found to be
less selective to CO2 and more selective to hydrocarbons, particularly propylene, at
higher temperature. Present studies have shown that increase in temperature from 220°C
to 240°C with pure CoMnOx catalyst shifts the selectivity pattern to CO2 but very
interesting character for reduction for CO2 formation with Co/Mn and wood based carbon
has been observed. There is very limited literature available on effect of wood based
carbon with FT catalysts, particularly cobalt catalysts. EDX analysis of wood and peat
145
Chapter 5
carbons has shown different combination of metals present along with carbon which can
lead to difference in catalytic activity.
5.5. Future work
A different catalyst system for CO hydrogenation reaction has been studied with cobalt,
manganese in combination with wood and peat based carbons. Main emphasis was
catalytic activity. Very big differences have been observed in the testing results. There is
further need of detailed studies on actual mechanism involved with particular types of
activated carbons. CO chemisorptions can provide good information on dispersion of
active sites present with these particular catalysts. TPR studies can give an idea about the
change in reduction behavior of carbon supported catalysts. XPS studies will be useful
for an identification of oxidation states of cobalt and manganese before and after the
reaction. TPR studies of Fe/Mn/C catalysts will be interesting to see if carbon has
changed the reducibility of iron.
146
Chapter 5
5.6 References:
[1]. M. A. Vannice, Cat. Rev. - Sci. Eng., 1976,14, 153
[2]. K. Aika, H. Hori, and A. Ozaki, J. Catal., 1972, 27, 424
[3]. L. J. Schmitt, and P. L.Walker, Carbon., 1971,10, 791
[4]. L. J. Schmitt, and P. L.Walker, Carbon., 1972,10, 87
[5]. C. Moreno-Castilla, O. P. Mahajan, H. J. Jung, M. A.Vannice, and P. L.Walker, Jr.Absts., 14th Amer. Carbon Conf. Penn State, 1979
[6 ], M. A. Vannice, P. L. Walker, H. J. Jung, C. Moreno-Castilla, and O. P. Mahajan., Proc. VII, Int. Cong. Catal. Tokyo, 1980
[7], C. Moreno-Castilla, O. P. Mahajan, P. L.Walker, H. J. Jung, and M. A. Vannice, Carbon., 1980,18, 271
[8 ]. E. Van Steen and F. F. Prinsloo, Catal. Today., 2002, 71, 327
[9], F. Rodriguez-Reinoso, Carbon., 1998, 36, 159
[10]. H. Tamon, and M. Okazaki, Carbon., 1996, 34, 741
[11]. B. Singh, S. Madhusudhanau, V. Bubey, R. Nath, and N. B. S. N. Rao, Carbon., 1996, 34, 327
[12]. J. Barrault, A. Guilleminot, J. C. Achard, V. Paul-Boncour, A. Percheron-Guegan, and L. Hilaire, M. Coulon, Appl. Catal., 1986, 22, 273
[13]. A. Guerrero-Ruiz, A. Sepulveda-Escribano, and I. Rodriguez-Ramos, Appl. Catal., 1994,120, 71
[14]. J. J. Venter, and M. A. Vannice, Catal. Lett., 1990, 7, 219
[15]. J. J. Venter, M. Kaminsky, G. L. Geoflrroy, and M. A.Vannice, J. Catal., 1987,103,450
[16]. M. A. Vannice, P. L.Walker, H. J. Jung, C. Moreno-Castilla, and O. P. Mahajan, Stud. Surf. Sci. Catal., 1981, 7, 460
[17]. A. A. Chen, M. Kaminsky, G. L.Geoffroy, and M. A.Vannice, J. Phys. Chem.,1986, 90, 4810
147
Chapter 5
[18]. W. P. Ma, Y. J. Ding, H. Y. Lou, and L. W. Lin, in. “The 7 China-Japan Symposium on coal and Cj chemistry " 2001
[19]. D. H. Yin, W. H. Li, W. S. Yang, H. W. Xiang, Y. H. Sun, B. Zhong, and S. Y. Peng, Microp. Mesop. Mater., 2001, 47, 15
[20]. A. Y. Khodakov, A. Griboval-Constant, R. Bechara, and V. L. Zholobenko, J. Catal., 2002, 206, 230
[21]. M. Agustin, L. Carlos, M. Francisco, and D. Isabel, J. Catal., 2003, 220, 486
[22]. Y. Ohtsuka, Y. Takahashi, M. Noguchi, T. Arai, S. Takahashi, N. Tsubouchi, and Y. Wang, Catal. Today., 2004, 89, 419
[23]. W. P. Ma, Y. J. Ding, and L. W. Lin, Ind. Eng. Chem. Res., 2004,43, 2391
[24]. W. P. Ma, Y. J. Ding, J. Yang, X. Liu, and L. W. Lin, React. Kinet. Catal. Lett., 2005, 84, 11
[25]. E. L. Kugler, L. Feng, X. Li, and D. B. Dadybuijor, Stud. Surf. Sci. Catal., 2000, 130,299
[26]. W. Ma, E. L. Kugler, and D. B. Dadybuijor, Stud. Surf. Sci. Catal., 2004,163, 125
[27]. R. B. Anderson, Catalysis., 1956,4, 119
[28]. M. E. Dry, in “Catalysis: Science and Technology ” 1981,1
[29]. V. Ponec, Coal Sci., 1984,3, 1
[30]. M. A. Vannice, J. Catal., 1975, 37, 449
[31]. M. A. Vannice, J. Catal., 1977, 50, 228
[32]. M. A. Vannice, and R. L. Garten, J. Mol. Catal., 1975,1, 201
[33]. M. A. Vannice, J. Catal., 1982, 74, 199
[34]. H. J. Jung, P. L. Walker, and M. A. Vannice, J. Catal., 1982, 75, 416
[35]. H. J. Jung, L. N. Mulay, M. A. Vannice, R. M. Stanfield, and W. N. Delgass, J. Catal., 1982, 76, 208
[36]. E. S. Lox, and G. F. Formette, Ind. Eng. Chem. Res., 1993, 23, 71
[37]. G. P. Van der Lann, and A. A. C. M. Beenackers, Appl. Catal, 2000,193, 39
148
Chapter 6
Chapter 6
An investigation of synthesis of higher alcohols from
syngas using modified molybdenum sulphide catalysts
6.1 Introduction
Much attention has been given to the synthesis of mixed alcohols due to its properties as
the gasoline blend or alternative motor fuel for the reduction of exhaust emission in the
last 20 years. The addition of alcohols and other oxygenates into gasoline gives rise to
decreases toxic exhaust gases (CO, NOx) and in some cases increases octane number. Use
of methyl tent-butyl ether (MTBE) has been prohibited recently in some countries as
additive of oil-based fuel due to the new legal requirements in environmental protection.
149
Chapter 6
So, the catalyst conversion of synthesis gas to mixed alcohols is attracting renewed
interest for industrial applications as well as fundamental research.
6.2 Alkali-doped molybdenum sulfide based catalysts
Molybdenum based catalyst was first discovered by Dow [1,2] and Union Carbide [3].
These catalysts are highly selective to C2+ alcohols synthesis and are naturally resistant
against sulphur. Molybdenum sulphide based catalyst system has been studied by various
researchers [4-6].
First of all Dow investigated C0 -M0 S2 catalysts for the synthesis of higher alcohols from
syngas. This catalyst was prepared by the method of co precipitation. They presented
effects of different reaction parameters on the catalytic activity and selectivity of these
catalysts. Alcohols selectivity was reported to be increased by an increase in reaction
pressure and decreased feed ratio of syngas. Iranmahboob et al. [7, 8 ] have also reported
an investigation of C0 -M0 S2 catalysts. They have reported effect of temperature on
selectivity of alcohols and they have concluded a temperature range of 563-583K as
suitable condition for clay to act as a modifier which increases the activity and selectivity
of catalysts [6 ]. They have also studied an effect of potassium and cesium promoters on
Co-MoS2/clay catalyst. They found that an increase in reaction temperature increased the
alcohols yield but decreased alcohol selectivity [7].
Attempts have been made to develop new catalysts to improve the catalytic performance
for selectivity of mixed alcohols. Recent studies have revealed that both the activity and
selectivity to higher alcohols can be improved by addition of effective promoters, such as
150
Chapter 6
Fischer-Tropsch components and alkali metals into MoS2-based catalysts [9-11], change
in nature of supports [12-17] and modification in catalyst preparation method [18,19].
Murchison et al. [1] and Xie et al. [20] have studied effect of potassium promoter on
M0 S2 based catalyst. They have reported a decrease in catalytic activity upon addition of
potassium and a shift of products to alcohols from higher hydrocarbons.
Very recently other new catalysts were also developed and a good activity and selectivity
could also be obtained. For example, Kaliaguine et al. [21, 22] reported conversion of
syngas to higher alcohols over nanocrystalline Co-Cu-based perovskites as catalysts.
Xiang et al. [23, 24] have reported synthesis of higher alcohols from syngas over Fischer
Tropsch elements modified molybdenum carbides. However up till now, alkali doped
catalysts are still considered the most promising catalysts due to their resistance to
sulphur poisoning and higher activity for the water-gas shift reaction.
Basically the function of cobalt in C0 -M0 S2 catalyst is considered to modify the
selectivity to the products (alcohols). This can be related to the capability of cobalt to
enhance the chain growth [25-27].
In the design of unsupported M0 -S2 based catalysts, it is important to properly introduce
the modifier and preparation method to improve its catalytic activity. In literature [28-31]
the 3rd row transition metals such as Co, Fe, Ni, Rh, have been introduced into alkali-
doped M0 S2 catalyst systems. It has been considered that at least two forms of transition
metal promoters simultaneously existed in M0 S2 based catalysts, namely, separate phases
of transition metals and mixed phases such as so-called “ Mo-M-S ”(M=transition metals)
[32,33]. It has been concluded that the close interaction between Mo and promoter atoms
151
Chapter 6
also exerted a strong effect on the promotion effects for mixed alcohols synthesis from
syngas. Moreover, the structure and morphology of metal promoter and M0 S2 support
was closely related to the promotion effects. It has been reported that the addition of La
or Ce, into supported Ni and supported cobalt catalysts gave an increase in catalytic
activity [34-36].
In present studies, C0 M0 S2 catalyst has been doped with three metal promoters, namely,
Ni, Ti and Zr and their effect on morphology and catalytic performance has been studied
for the synthesis of alcohols from syngas.
6.3 Experimental
Alkali-promoted cobalt molybdenum sulfide solid (C0 -M0 S2/K2CO3) mixed with
bentonite clay and sterotex® lubricant was used for the C0 -M0 S2 based catalyst in this
study. The C0 -M0 S2 (Mo: Co = 2 :1) solid was prepared by co-precipitation as described
in Chapter 2.
Catalytic tests were carried out using high pressure reactor which is described in Chapter
2. The dilution of catalyst was performed by intimate mixing of the catalyst with silicon
carbide (4.8 ml/5.2 ml for C0 -M0 S2 based catalyst).
Prior to the catalytic run, system leakage test was carried out using nitrogen (Oxygen free,
BOC). After the system was found safe and leak-free, syngas was gradually introduced to
the system, replacing the nitrogen. Following the complete replacement, the system was
brought up to the required pressure, followed by heating with a ramping rate of 1 K/min
until it reached the desired temperature.
152
Chapter 6
All catalysts were studied under identical reaction conditions. Reaction pressure was 75
bar and temperature of reaction was 580K.
6.4 Results on C0-M0 S2 based catalyst system
6.4.1 Catalytic testing results
The present section describes the CO hydrogenation activity of Co-
MoS2/K2C0 3 /clay/lubricant catalyst. Silicon carbide intimately mixed with catalyst was
used for the catalytic reaction. Before catalytic test, a blank run with silicon carbide was
carried out. There was no catalytic activity observed with the blank run. This suggests
that silicon carbide is an inert material with respect to CO hydrogenation and hence can
be used as diluent for catalytic test. Reasons of diluting the catalyst bed are: 1) to achieve
and maintain an isothermal regime for the reaction; and 2 ) to avoid possible hot spot
developing in the catalyst bed.
Table 6.1 shows catalytic testing results of pure C0 M0 S2 mixed with K^COs/bentonite
clay/sterotex and SiC. This catalyst showed very high activity and it took almost 45h to
get stabilized. Methane selectivity was high and hydrocarbon selectivity was less when
compared with previously reported results of same catalyst under similar reaction
conditions [37]. Selectivity of ethanol was similar as was reported earlier. Interesting
characteristic of present catalyst preparation was increased CO conversion and selectivity
to propanol. Better activity of catalyst can be attributed to the improved preparation
conditions like controlled flow rate of reagents with the help of peristaltic pump, use of a
proper reaction vessel instead of beaker and mechanical stirrer instead of magnetic stirrer.
153
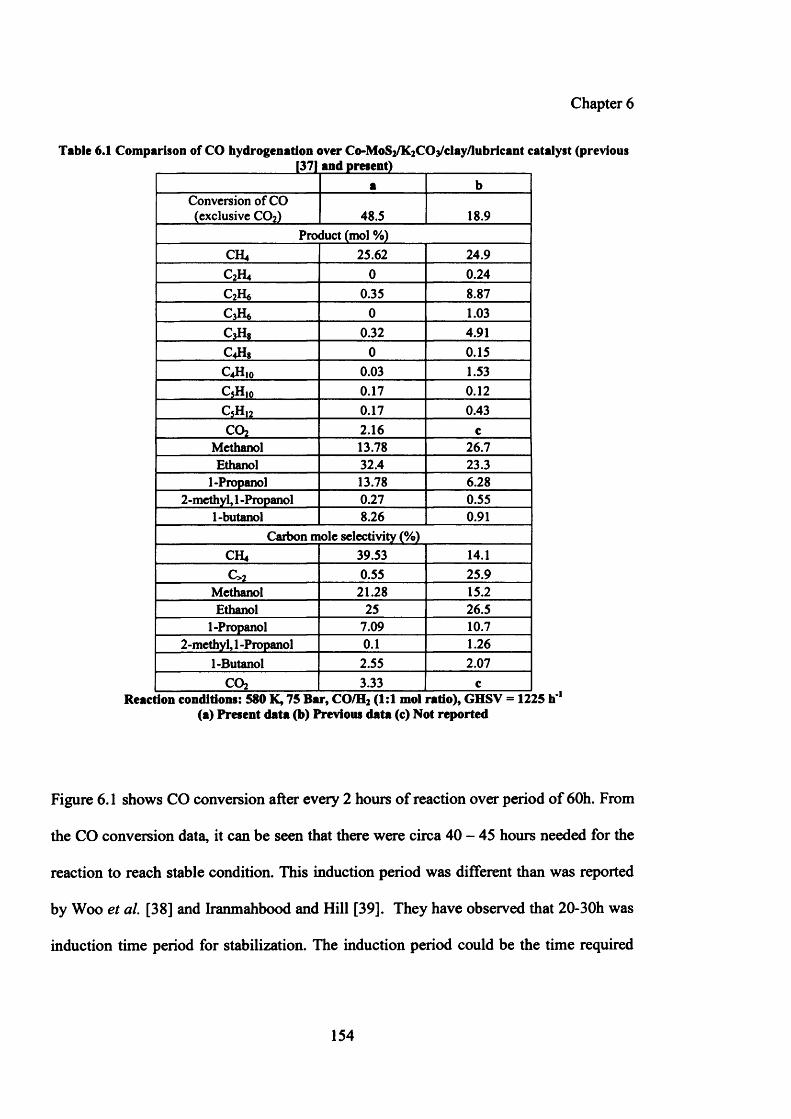
Chapter 6
Table 6.1 Comparison of CO hydrogenation over Co-MoS/K^COs/clay/lubricant catalyst (previous ____________________ 1371 and present) _______________
a bConversion of CO (exclusive C02) 48.5 18.9
Product (mol %)CH4 25.62 24.9C2H4 0 0.24C2H6 0.35 8.87C3H6 0 1.03c 3h 8 0.32 4.91CJlg 0 0.15C4Hio 0.03 1.53C5H,o 0.17 0.12
c 5h 12 0.17 0.43COa 2.16 c
Methanol 13.78 26.7Ethanol 32.4 23.3
1-Propanol 13.78 6.282-methyl, 1 -Propanol 0.27 0.55
1-butanol 8.26 0.91Carbon mole selectivity (%)
CH4 39.53 14.1c>2 0.55 25.9
Methanol 21.28 15.2Ethanol 25 26.5
1-Propanol 7.09 10.72-methyl, 1 -Propanol 0.1 1.26
1-Butanol 2.55 2.07COz 3.33 c
Reaction conditions: 580 K, 75 Bar, CO/H2 (1:1 mol ratio), GHSV = 1225 h' 1 (a) Present data (b) Previous data (c) Not reported
Figure 6 .1 shows CO conversion after every 2 hours of reaction over period of 60h. From
the CO conversion data, it can be seen that there were circa 40 - 45 hours needed for the
reaction to reach stable condition. This induction period was different than was reported
by Woo et a l [38] and Iranmahbood and Hill [39]. They have observed that 20-30h was
induction time period for stabilization. The induction period could be the time required
154
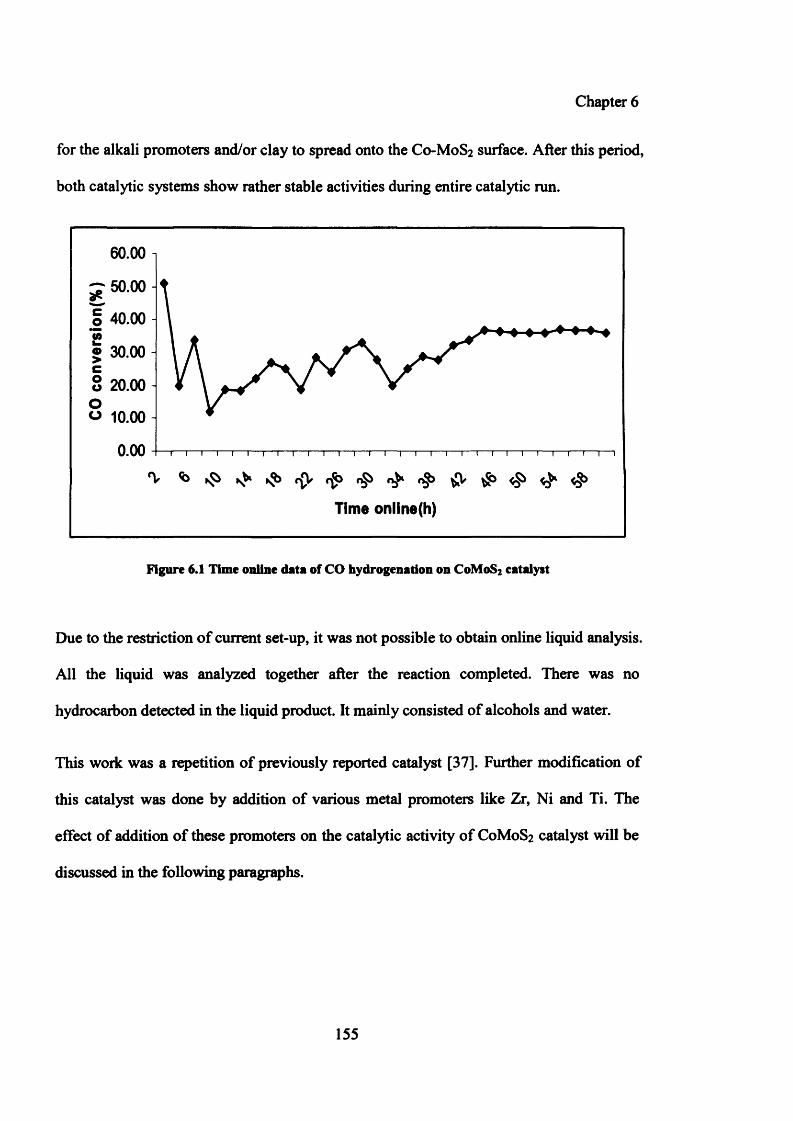
Chapter 6
for the alkali promoters and/or clay to spread onto the C0 -M0 S2 surface. After this period,
both catalytic systems show rather stable activities during entire catalytic run.
60.00
— 50.00 -
40.00 -
• 30.00 -
o 20.00 -
o 10.00 -
0.00
Time online(h)
Figure 6.1 Time online data of CO hydrogenation on CoMoS2 catalyst
Due to the restriction of current set-up, it was not possible to obtain online liquid analysis.
All the liquid was analyzed together after the reaction completed. There was no
hydrocarbon detected in the liquid product. It mainly consisted of alcohols and water.
This work was a repetition of previously reported catalyst [37]. Further modification of
this catalyst was done by addition of various metal promoters like Zr, Ni and Ti. The
effect of addition of these promoters on the catalytic activity of C0 M0 S2 catalyst will be
discussed in the following paragraphs.
155
Chapter 6
6.5 Effect of metal promoters on catalytic performance of C0M0S2
C0 M0 S2 catalyst has never been reported in combination with Zr, and Ti. There is some
patent literature specifically with Co/activated carbon and various bimetallic catalysts
promoted with Zr, Ti and various other metals [40- 42],
Nickel is active catalyst for methanation reaction in the Fischer Tropsch Synthesis. The
development of Co and Ni catalysts was reviewed by Anderson [43]. Fraga and Jordao
[44] have reported the bulk AlNiCu catalysts being extremely selective for the synthesis
of higher alcohols in the syngas reaction. They have also observed that change in salt
concentration changes the selectivity pattern to greater extent. In 1934, Fischer and
Meyer [45] reported active catalysts from alloys of 50% Co or Ni and 50% Al or Si with
NaOH. Similar Si alloys with half Ni and half Co gave catalysts producing larger yield of
liquid hydrocarbons. Lucero et al. [46] have patented a crystalline M0 2 C catalyst with Ni
for the production of alcohols from syngas. Similarly, Zr is an effective promoter for Co
based catalysts which can improve the reducibility of cobalt-based catalysts. Zr-promoted
Co catalysts were found to have higher activity and C5+ selectivity for FTS than
unpromoted catalysts [47]. Ali et al. [48] reported that zirconium promotion possibly
creates an active surface with cobalt that increases activity and selectivity to
hydrocarbons. Titanium has also been reported to be a good promoter for FTS leading to
high catalytic activity [49, 50]. Because of positive effects of Ni, Ti and Zr on FTS
performance these metal promoters were used in combination with C0 M0 S2 catalyst for
reaction of CO hydrogenation. The details of their effect on activity and selectivity of
alcohols is detailed in the following section.
156
Chapter 6
6.5.1 Experimental
Pure C0 M0 S2 catalyst was prepared by co precipitation method. Detailed procedure has
been mentioned in chapter 2 and above. Catalyst precursor was promoted with Ni, Zr and
Ti (0.2%) using nitrates (acetyl acetone for Ti) as salt precursors by impregnation method.
Briefly, weighed quantity of metal salt was dissolved in distilled water and was
impregnated on C0 M0 S2 . This impregnated material was dried at 1 10°C for 16h followed
by calcination at 500°C for lh under continuous flow of nitrogen. Catalysts were mixed
with potassium carbonate (K2CO3), bentonite clay and sterotex® lubricant.
6.5.2 Results
6.5.2.1 Catalytic testing results
Table 6.2 shows a comparison of catalytic testing results of Ti, Zr and Ni doped on
C0 M0 S2 . All these catalysts were premixed with K2C0 3 /Bentonite clay/sterotex lubricant,
diluted with SiC and were tested under similar conditions.
C0 M0 S2 doped with nickel (0.2%) was very active for CO conversion. The major product
with this catalyst was CO2 . C0 M0 S2 doped with titanium was more active compared with
pure C0 M0 S2 catalyst (results shown in table 6 .1) but was highly selective to CO2 like
nickel. C0 M0 S2 impregnated with zirconium was found to be less active in comparison
with other catalysts. This is worth mentioning here that all these catalysts were premixed
with potassium carbonate.
157
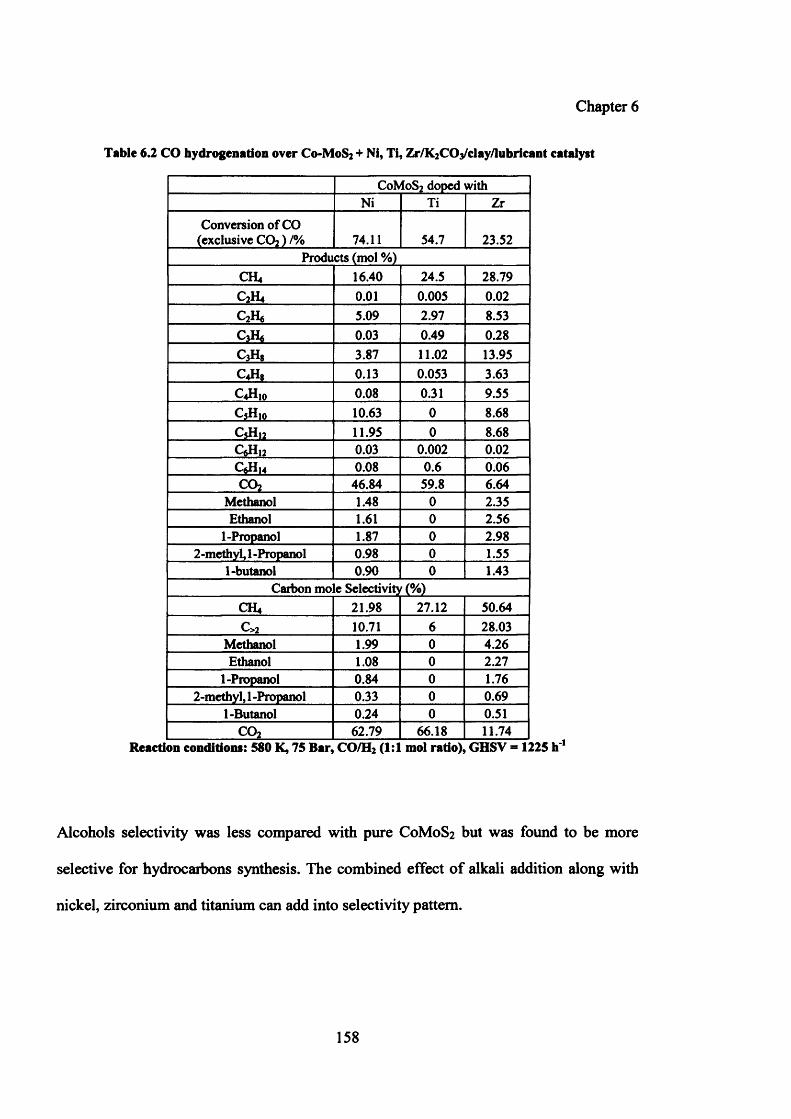
Chapter 6
Table 6.2 CO hydrogenation over Co-MoS2 + Ni, Ti, Zr/I^COyclay/lubricant catalyst
CoMoS2 doped withNi Ti Zr
Conversion of CO (exclusive C02) /% 74.11 54.7 23.52
Products (mol %)CH4 16.40 24.5 28.79C2H4 0 . 0 1 0.005 0 . 0 2
C2H6 5.09 2.97 8.53c 3h« 0.03 0.49 0.28c 3h 8 3.87 1 1 . 0 2 13.95C4H8 0.13 0.053 3.63C4H10 0.08 0.31 9.55C5H 10 10.63 0 8 . 6 8
C5H 12 11.95 0 8 . 6 8
C6H 12 0.03 0 . 0 0 2 0 . 0 2
C6Hm 0.08 0 . 6 0.06COz 46.84 59.8 6.64
Methanol 1.48 0 2.35Ethanol 1.61 0 2.56
1-Propanol 1.87 0 2.982-methyl, 1 -Propanol 0.98 0 1.55
1 -butanol 0.90 0 1.43Carbon mole Selectivity (%)
CH4 21.98 27.12 50.64C> 2 10.71 6 28.03
Methanol 1.99 0 4.26Ethanol 1.08 0 2.27
1-Propanol 0.84 0 1.762-methyl, 1 -Propanol 0.33 0 0.69
1-Butanol 0.24 0 0.51c o 2 62.79 66.18 11.74
Reaction conditions: 580 K, 75 Bar, CO/H2 (1:1 mol ratio), GHSV - 1225 h*1
Alcohols selectivity was less compared with pure C0 M0 S2 but was found to be more
selective for hydrocarbons synthesis. The combined effect of alkali addition along with
nickel, zirconium and titanium can add into selectivity pattern.
158
Chapter 6
Nickel is considered a good methanation catalyst and can also dissociate hydrogen very
fast and forms stable carbides [51, 52]. Ponec [53] has reviewed effect of Rh based
catalysts on alcohol selectivity. An enhancement in alcohols selectivity (particularly
ethanol) was reported over Rh/supported SiC>2 catalysts doped with titanium and
zirconium. Recently Ni doped P-M0 C2 catalysts have been reported for syngas
conversion to higher alcohols [54, 55]. The undoped and unmodified P-M0 C2 exhibited a
high CO conversion but produced CO2 and hydrocarbons as a major product. But
alcohols selectivity was improved upon addition of K and Ni promoters. Conversely
doping the same catalyst (K-Ni- P-M0 C2) with cobalt instead of nickel increased the
selectivity of hydrocarbons.
Present studies have shown an enhancement in hydrocarbons and CO2 selectivity upon
addition of nickel promoter into C0 M0 S2 catalyst. This catalyst has been mixed with
potassium carbonate. A combined effect of Co, Ni and K along with M0 S2 leads to many
possible reactions during CO hydrogenation.
Although undoped M0 S2 produces only hydrocarbons, commonly methane, the
selectivity dramatically shifts to alcohols upon addition of alkali promoters. The role of
alkali promoters into these catalysts is to shift the products from hydrocarbons to alcohols.
Several researchers have studied MoS2-based catalyst for higher alcohols synthesis (HAS)
[56-65]. The selectivity of hydrocarbons and alcohols varies depending on type of metal
promoters used. A combination of Ni with M0 S2 catalyst has been studied along with
K2CO3 [6 6 ]. This catalyst has been found to be highly reactive for CO conversion and has
shown good selectivity to hydrocarbons. CO2 selectivity data is not available for these
catalysts. Alcohols selectivity has been found to be very low compared with pure
159
Chapter 6
C0 M0 S2 catalyst. Present studies have shown similar trend with respect to hydrocarbons
selectivity. This trend is expected, taking into account the fact that nickel is a very well
known methanation catalyst [67].
From the present studies it can be argued that the promotional activity of nickel in these
catalysts is due to the bifunctionality of Ni; one is catalyzing the formation of alcohols
and second is CO insertion reactions. Depending on the dominant reaction, product
stream shifts to CO2 or alcohols.
Titanium addition into C0 M0 S2 has resulted in formation of CO2, while addition of
zirconium in C0 M0 S2 has shown an increase in the formation of hydrocarbons, methane
being the main product.
In CO hydrogenation, it is reported generally that CO molecules adsorbed in a
dissociative pattern are responsible for the synthesis of hydrocarbons while those
adsorbed associatively result in the formation of alcohols [6 8 ]. In alcohols synthesis
catalysts, alkali metals can reduce availability of active hydrogen by blocking the active
sites for dissociative chemisoiption of CO. This blockage of active sites decreases the
interaction of CO with catalyst surface. The associatively adsorbed CO will be directly
hydrogenated to alcohols. From the present results (of C0 M0 S2/K2CO3 + doped with Ti,
Ni, Zr), none of these catalysts was found active for alcohols synthesis compared with
pure C0 M0 S2/K2CO3 . This can be argued that K combined with C0 M0 S2 pure catalyst
blocks the active sites for CO to adsorb dissociatively and leads to direct hydrogenation
for alcohols formation. But addition of transition metals affects the basicity of surface
species leading to different reaction. Again it is hard to emphasize the existence of a
160
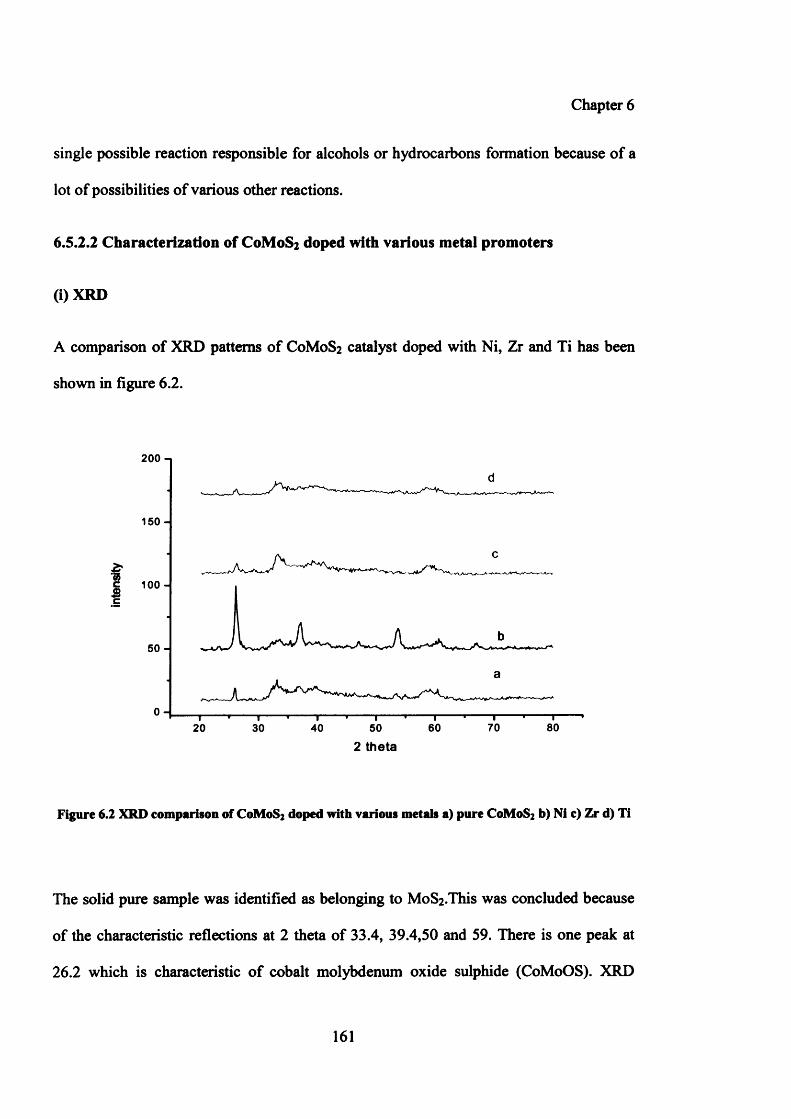
Chapter 6
single possible reaction responsible for alcohols or hydrocarbons formation because of a
lot of possibilities of various other reactions.
6.5.2.2 Characterization of C0 M0 S2 doped with various metal promoters
( i ) X R D
A comparison of XRD patterns of C0 M0 S2 catalyst doped with Ni, Zr and Ti has been
shown in figure 6 .2 .
2 00
150 -
f100 -c£c
50 -
70 806020 30 40 50
2 th e ta
Figure 6.2 XRD comparison of C0M0S2 doped with various metals a) pure C0M0S2 b) Ni c) Zr d) Ti
The solid pure sample was identified as belonging to MoS2.This was concluded because
of the characteristic reflections at 2 theta of 33.4, 39.4,50 and 59. There is one peak at
26.2 which is characteristic of cobalt molybdenum oxide sulphide (C0 M0 OS). XRD
161
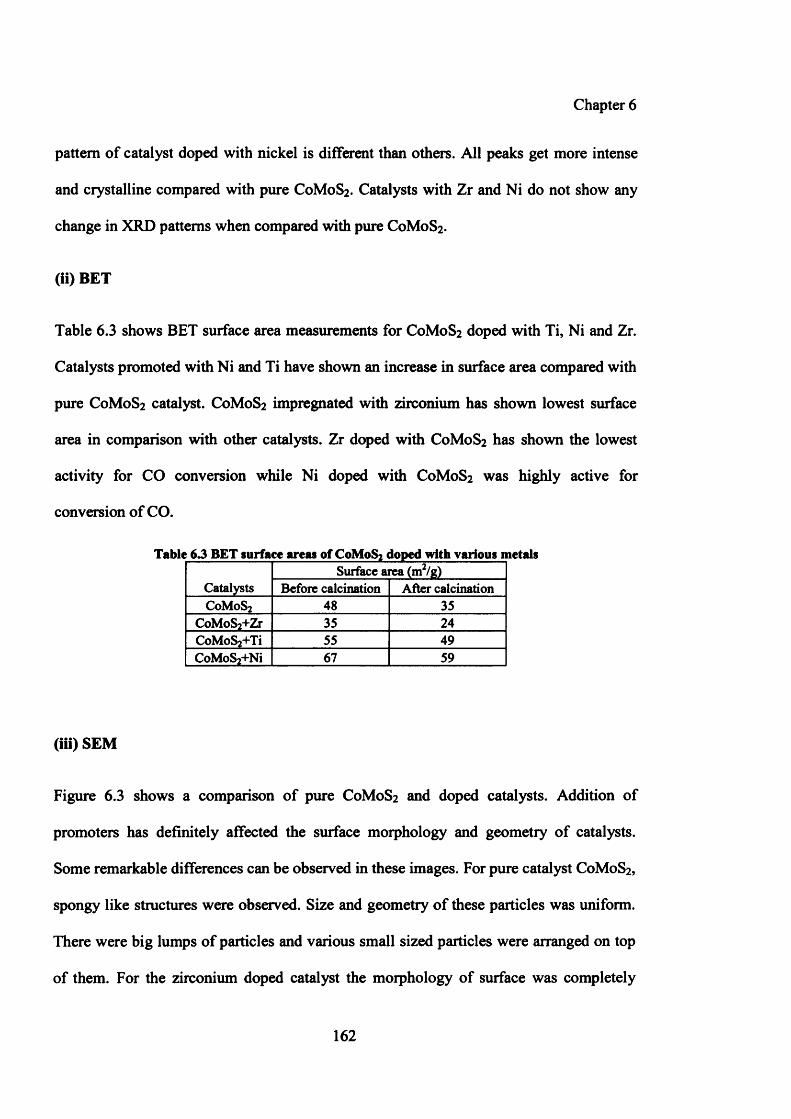
Chapter 6
pattern of catalyst doped with nickel is different than others. All peaks get more intense
and crystalline compared with pure C0 M0 S2 . Catalysts with Zr and Ni do not show any
change in XRD patterns when compared with pure C0 M0 S2 .
(ii) BET
Table 6.3 shows BET surface area measurements for C0 M0 S2 doped with Ti, Ni and Zr.
Catalysts promoted with Ni and Ti have shown an increase in surface area compared with
pure C0 M0 S2 catalyst. C0 M0 S2 impregnated with zirconium has shown lowest surface
area in comparison with other catalysts. Zr doped with C0 M0 S2 has shown the lowest
activity for CO conversion while Ni doped with C0 M0 S2 was highly active for
conversion of CO.
Table 63 BET surface areas of C0M0S2 doped with various metals
CatalystsSurface area (m2/g)
Before calcination After calcinationC0M0S2 48 35
CoMoS2+Zr 35 24CoMoS^Ti 55 49CoMoS2+Ni 67 59
(iii) SEM
Figure 6.3 shows a comparison of pure C0 M0 S2 and doped catalysts. Addition of
promoters has definitely affected the surface morphology and geometry of catalysts.
Some remarkable differences can be observed in these images. For pure catalyst C0 M0 S2,
spongy like structures were observed. Size and geometry of these particles was uniform.
There were big lumps of particles and various small sized particles were arranged on top
of them. For the zirconium doped catalyst the morphology of surface was completely
162
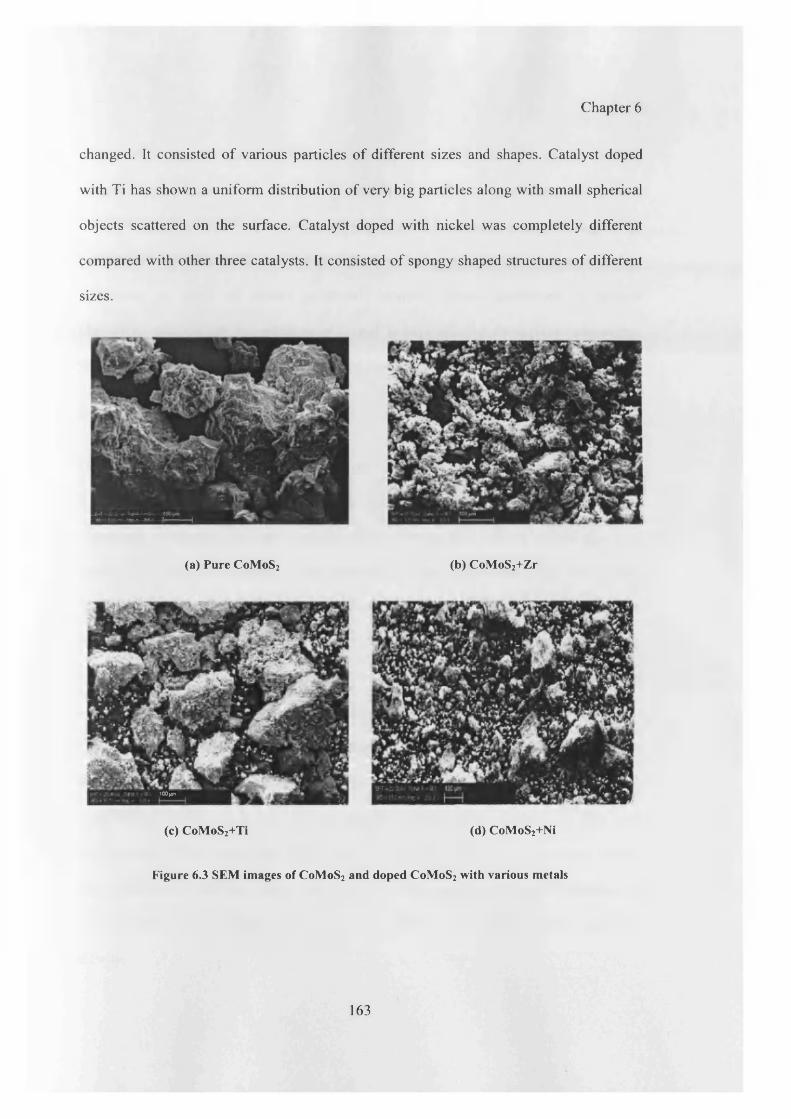
Chapter 6
changed. It consisted o f various particles of different sizes and shapes. Catalyst doped
with Ti has shown a uniform distribution of very big particles along with small spherical
objects scattered on the surface. Catalyst doped with nickel was completely different
compared with other three catalysts. It consisted o f spongy shaped structures of different
sizes.
(a) Pure CoMoS2 (b) CoMoS2+Zr
(c) CoMoS2+Ti (d) CoMoS2+Ni
Figure 6.3 SEM images of CoMoS2 and doped CoMoS2 with various metals
100 pm
163
Chapter 6
The evident morphological differences between pure C0 M0 S2 and doped C0 M0 S2
suggest that addition of Zr, Ni and Ti addition has effectively changed the surface
composition. Similar differences were observed in BET measurements. Although XRD
patterns were similar for Zr and Ti doped catalysts and pure C0 M0 S2 but there was clear
difference in XRD of nickel promoted catalyst. These similarities in surface
characterization suggest that addition of Zr and Ti have affected the surface composition
while it can be argued that addition of Ni can modify the surface and bulk both.
6 . 6 Conclusions
One particular catalyst system of C0 M0 S2 has been reproduced under improved
preparation conditions. This catalyst has shown very good activity along with similar
selectivity of alcohols as was reported earlier. Further this catalyst system has been
modified by addition of various metal promoters. C0 M0 S2 promoted with 0 .2 % Ni was
found to be highly active for CO conversion but was more selective to hydrocarbons.
Titanium addition shifted the products completely to hydrocarbons instead of alcohols.
Zirconium addition into C0 M0 S2 catalyst has shown low water gas shift reaction and
major product was methane, along with other hydrocarbons(C>2).Nickel promoter was
found to be highly active for water gas shift reaction. Combined effect of alkali (K from
K2CO3) along with these transition metal promoters lead to a change in surface
composition leading to a big shift of product stream from alcohols to CO2 and
hydrocarbons. SEM images and BET measurements of promoted catalysts have shown
clear differences between doped and pure C0 M0 S2 catalysts. These differences in
characterization of promoted catalysts can be related to the differences in catalytic
activity.
164
Chapter 6
6.7 Future work
This work was a continuation of previously reported catalyst (C0 M0 S2). Further
modification was done by addition of metal promoters but the reaction conditions were
not changed. Variation in reaction pressure, temperature and syngas ratio can be studied
in future. Testing pure catalysts (without mixing with potassium carbonate) can give
different activity. Surface composition has a strong effect on selectivity pattern which can
be studied and related by XPS. CO chemisorption studies will be useful for understanding
the active sites on catalyst surface. TPR will be useful for further information about the
reduction behavior of these catalysts. Only one particular concentration (0.2%) has been
studied so far, it can be useful to vary the concentrations of these metals which can
influence the surface basicity or acidity leading to different reaction pathways. Further, a
combination of different metals can be studied on C0 M0 S2 catalyst, e.g. the hydrocarbon
formation from Ni/CoMoS2 can be suppressed by addition of lanthanum. The
promotional effect of La metal with Ni has been reported that leads to a strong interaction
of Ni and La improving the Ni dispersion on surface of catalyst [67]. Addition of
lanthanum has been reported to enhance the selectivity for higher alcohols.
165
Chapter 6
6.8 References:
[1]. C. B. Murchison, M. M. Conway, R. R. Stevens, and G. J. Quarderer, Proc. 9th Int.
Congr. Catal., 1988, 2, 626
[2]. R. R. Stevens, European Patent, 1986,172431
[3]. N. E. Kinkade, European Patents, 1985, 0149255 and 0149256
[4]. J. G. Santiesteban, C. E. Bogdan, R. G. Herman, and K. Klier, Proc. 9th Int. Congr.
Catal., 1988, 2, 561
[5], X. Youchang, B. M. Naasz, and G. A. Somoijai, Appl. Catal., 1986, 27, 233
[6 ]. J. Iranmahboob, H. Toghiani, D. O. Hill, and F. Nadi, Fuel Proc. Tech., 2002, 79, 71
[7]. J. Iranmahboob, D. O. Hill and H. Toghiani, Appl. Catal., 2002, 231, 99
[8 ]. J. Iranmahboob, D. O. Hill, and H. Toghiani, Appl. Surf. Sci., 2001,185, 72
[9], K. Fujimoto, and T. Oba, Appl. Catal., 1985,13, 289
[10]. T. Tatsumi, A. Muramatsu, and H. Tominaga, Appl. Catal., 1987, 60, 3157
[11]. D. B. Li, C. Yang, H. R. Zhang,W. H. Li,Y. H. Sun, and B. Zhong, Top. Catal.,
2005, 32, 233
[12]. D. B. Li, C.Yang, H. R. Zhang, W. H. Li, Y. H. Sun, and B. Zhong, Stud. Surf. Sci.
Catal., 2004,147, 391
166
Chapter 6
[13]. Z. R. Li,Y. L. Fu, J. Bao, M. Jiang, T. D. Hu, T. Liu, and Y. N. Xie, Appl. Catal.,
2001, 220,21
[14]. X. M. Ma, G. D. Lin, and H. B. Zhang, Catal. Lett., 2006, 111, 141
[15]. X. M. Wu, Y. Y. Guo, J. M. Zhou, G. D. Lin, X. Dong, and H. B. Zhang, Appl.
Catal. 2008, 340, 87
[16]. X. Dong, H. B. Zhang, G. D. Lin, Y. Z. Yuan, and K. R. Tsai, Catal. Lett., 2003, 85,
237
[17]. H. B. Zhang, X. Dong, G. D. Lin, X. L. Liang, and H. Y. Li, Chem. Commun., 2005,
40, 5094
[18]. Z. R. Li, Y. L. Fu, M. Jiang, T. D. Hu, T. Liu, and Y. N. Xie, J. Fuel. Chem. Tech.,
2001, 29, 149
[19]. X. G. Li, L. J. Feng, Z. Y. Liu, B. Zhong, D. B. Dadybuijor, and E. L. Kugler, Ind.
Eng. Chem. Res., 1998, 37, 3853
[20]. Y. Xie, B. M. Naasz, and G. A. Somoijai, Appl. Catal., 1986, 27, 233
[21]. N. Tien-Thao, M. H. Zahedi-Niaki, H. Alamdari, and S. Kaliagine, J. Catal., 2007,
245, 348
[22]. N. Tien-Thao, M. H. Zahedi-Niaki, H. Alamdari, and S. Kaliagine, Appl. Catal.,
2007, 326, 152
167
Chapter 6
[23]. M. L. Xiang, D. B. Li, H. J. Qi, W. H. Li, B. Zhong, and Y. H. Sun, Fuel., 2007, 8 6 ,
1298
[24]. M. L. Xiang, D. B. Li, H. J. Qi, W. H. Li, B. Zhong, and Y. H. Sun, Fuel., 2006, 85,
2662
[25]. G. Herman, in: Guczi, L. Ed., in “Studies in Surface Science and Catalysis” 1991,
64, 265
[26]. P. Courty, D. Durand, E. Fruend, and A. Sugier, J. Mol. Catal., 1982,17, 241
[27]. D. J. Elliot, F. Pennella, J. Catal., 1986,102,464
[28]. K. J. Smith, R. G. Herman, and K. Klier, Chem. Eng. Sci., 1990,45, 2693
[29]. Z. R. Li, Y. L. Fu, and M. Jiang, Appl. Catal., 1999,187, 187
[30]. H. C. Woo, and Y. G. Kim, Catal. Lett., 1993, 20, 221
[31]. Z. R. Li, Y. L. Fu, M. Jiang,Y. Xie, T. Hu, and T. Liu, Catal. Lett., 2000, 65,43
[32]. H. Topsoe, B. S. Clausen, R. Candia, C. Wivel, and S. Morup, J. Catal., 1981, 6 8 ,
433
[33]. B. H. Upton, C. C. Chen, N. M. Rodriguez, and R. T. K. Baker, J. Catal., 1993,141,
171
[34]. D. Z. Wang, X. P. Cheng, Z. R. Huang, X. Z. Wang, and S. Y. Peng, Appl. Catal.,
1991,77, 109
168
Chapter 6
[35]. H. J. G. Rotgerink, R. P. A. M. Paalman, J. G. V. Ommen, and J. R. H. Ross, Appl.
Catal., 1988, 45, 257
[36]. D. B. Li, C. Yang, H. J. Qi, H. R. Zhang, W. H. Li, Y. H. Sun, and B. Zhong, Catal
Commun., 2004, 5, 605
[37]. Y. Zhao “On the investigation o f alcohol synthesis via the Fischer Tropsch
reaction”, PhD Thesis, University of Cardiff, 2007
[38]. H. C. Woo, I. Nam, J. S. Lee, J. S. Chung, and Y. G. Kim, J. Catal., 1993,142, 672
[39]. J. Iranmahboob, and D. O. Hill, Catal. Lett., 2002, 78,49
[40]. Y. H. Zhu, T. Wang, G. Jiao, and Y. Lv, U. S. Patent, 2008, 891263
[41]. M. K. Carter, U. S. Patent, 2008, 797666
[42]. H. Danjo, N. Fukuoka, and T. Mimura, 2008, W.O. 52905
[43]. R. B. Anderson in “Catalysis”, Vol 4. Van Nostrand Reinhold, Princeton, New
Jersey, 1956
[44]. M. A. Fraga, and E. Jordao, React. Kinet. Catal. Lett., 1998, 64, 331
[45]. F. Fischer, and K. Meyer, Brennst.-Chem., 1934,107, 84
[46]. J. A. Lucero, K.V. Sethi, and H. W. Tuminello, U.S. Patent, 2007,10342
[47]. G. R. Moradi, M. M. Basir, A. Taeb, and A. Kiennemann, Catal. Commun., 2003, 4,
27
169
Chapter 6
[48]. S. Ali, B. Chen, and J. G. Goodwin. J. Catal., 1995,157,35
[49]. P. Chaumette, O. Clause, and H. Azib, European patent, 1997, 400730
[50]. S. Hinchiranan, Y. Zhang, S. Nagamori, T. Vitidsant, and N. Tsubaki, Fuel Proc.
Tech., 2008, 89, 455
[51]. A. Barbier, E. B. Pereira, and G. A. Martin, Catal. Lett., 1997,45 ,221
[52]. A. M. Kraan, Hyperf. Interne., 1998, 111, 23
[53]. V. Ponec, Stud. Surf. Sci. Catal., 1991, 64, 117
[54]. M. Xiang, D. Li, W. Li, B. Zhong, and Y. Sun, Catal. Commun., 2007, 8, 503
[55]. M. Xiang, D. Li, W. Li, B. Zhong, and Y. Sun, Catal. Commun., 2007, 8 , 513
[56]. L. Gang, Z. Chengfang, C. Yanqing, Z. Zhibin, N. Yianhui, C. Linjun, and Y. Fong,
Appl. Catal., 1997,150,243
[57]. Y. T. Park, I. Nam, and G. Y. Kim, Ind. Eng. Chem. Res., 1997, 36, 5246
[58]. G. Bian, L. Fan, Y. Fu, and K. Fujimoto. Appl. Catal., 1998,170, 255
[59]. G. Bian, L. Fan, Y. Fu, and K. Fujimoto. Ind. Eng. Chem. Res., 1998, 3, 1736
[60]. Z. Li, Y. Fu, and M. Jiang, Appl. Catal .A. Gen., 1999,187, 187
[61]. D. Li, C. Yang, W. Li, Y. Sun, and B. Zhong, Top. Catal., 2005, 32, 233
170
Chapter 6
[62]. D. Li, C. Yang, N. Zhao, H. Qi, W. Li, Y. Sun, and B. Zhong, Fuel Proc. Tech.,
2007, 8 8 , 125
[63]. J. Iranmehboob, H. Toghiani, and D. O. Hill, Appl. Catal., 2003, 247, 207
[64]. J. Bao, Y. Fu, and Z. Sun, Chem. Commun., 2003, 6 , 746
[65]. N. Koizumi, K. Murai, T. Ozaki, and M. Yamada, Catal. Today., 2004, 89,465
[6 6 ]. D. Li, C. Yang, H. Qi, H. Zhang, W. Li, Y. Sun, and B. Zhong, Catal. Commun.,
2004, 5, 605
[67]. J. Shested, S. Dahl, J. Jacobsen, and J. R. Rostrup-Nielsen, J. Phys. Chem., 2005,
109, 2432
[6 8 ]. X. Xiadong, E. B. M. Doesburg, and J. J. F. Scholten, Catal. Today., 1987, 2, 125
171
Chapter 7
Chapter 7
Conclusions
An increased interest to develop non-petroleum based alternative methods for the
production of fiiels and chemical feedstock has led to a need for Fischer Tropsch (F-T)
technology. The production and sales of chemical feedstock (by products of the FT
synthesis) have significantly increased the economic viability of the FT process.
This thesis has attempted to examine some important advances in Fischer Tropsch
reaction since its initial development. A historical review is provided in first chapter in
which a detailed comparison of the commonly used catalysts is given along with
proposed mechanisms for CO hydrogenation. Chapter 2 is devoted to a detailed
description of the equipment and methods used during this study.
172
Chapter 7
One of the main objectives of the current thesis was synthesis of a catalyst which is
highly selective to hydrocarbons with a lower selectivity to methane and longer life time.
We have investigated an already studied CoMnOx catalyst. Various preparation variables
for this catalyst have been studied in detail in order to find out the best preparation
conditions. Variable pH method of co-precipitation has been found to be better compared
with an already studied method of constant pH. Precipitation of cobalt and manganese
metals at pH=2.8 - 8.00 at 80°C with 0 h ageing was found to be the best method for
synthesis of CoMnOx catalyst. A detailed investigation has been done for the optimization
of reaction conditions. Best reaction temperature was found to be 220°C and the best
reaction pressure was 6 bar. It has been observed that CO2 selectivity was very low
(almost negligible) for the reactions done at 220°C. While an increase in temperature
from 220°C to 240°C increases methane and CO2 along with an increase in selectivity
towards C5+ hydrocarbons.
A strong requirement for improved catalysts for the synthesis of more selective products
from syngas encouraged an investigation of the effects of metal promoters on an existing
but modified CoMnOx catalyst. Three different concentrations of ruthenium with
CoMnOx catalyst have also been studied. Methane selectivity has been found to be
enhanced by the addition of 0.15% Ru, this also giving an increase in the formation of
higher hydrocarbons. A small change in concentration of ruthenium gave a large
difference in catalyst behavior. Addition of ruthenium, overall, has shown an
enhancement in the formation of hydrocarbons.
We have also studied an effect of different concentrations of potassium addition on
CoMnOx catalyst. A particular concentration of 0.15% has found to be good for synthesis
173
Chapter 7
of light hydrocarbons along with the lowest selectivity to methane. Most of the results of
potassium addition were found to be similar to the previously reported results. A detailed
investigation of the effect of addition of these promoters has been discussed in chapter 4.
The effect of the use of two different types of activated carbons (peat, wood) as support
for Co/ Mn and Fd Mn catalysts was reported in chapter 5. Co/Mn with addition of both
wood and peat derived carbons was found to be more active compared with our pure
CoMnOx catalyst. Co/Mn/C (peat source) was found to be highly selective to synthesis of
propylene with higher catalytic activity compared with Co/Mn/C (wood source).
A comparison of Co/Mn and Fe/Mn along with peat and wood carbons has also been
given in chapter 5. Fe/Mn/C had low activity at low temperature so these catalysts were
tested at 300°C. Fe/Mn/C (peat source) has been found to be highly active with dominant
products of alkanes along with high CO2 and methane compared with Co/Mn/C (peat
source).
A combination of activated carbon derived from wood with Fe/Mn (300°C) and Co/Mn
(220°C) showed very low activity for CO conversion. Co/Mn/C (wood source) was more
selective to propylene with less CO2 compared with Fe/Mn/C (wood source) which was
highly selective to CO2 .
An additional effort has been made for the study of alcohols synthesis from syngas using
the well known C0 M0 S2 catalyst for this reaction. The C0 M0 S2 catalyst has been
prepared under improved conditions and was tested under similar reaction conditions as
have already been reported in patent literature. This catalyst has been found to be more
active with respect to CO conversion and has shown higher selectivity to 1-propanol and
174
Chapter 7
was less selective to methanol and hydrocarbons. Further C0 M0 S2 has been modified
with Zr, Ti and Ni metals. One particular concentration (0.2%) of these metals has been
tested. All three metal promoters have shown low selectivity for alcohols formation. Ni
and Ti have been found to be very active for water gas shift reaction while Zr doped
catalyst was more active for hydrocarbons synthesis (methane being the main product).
Clear differences have been observed in the surface geometry and morphology of these
doped catalysts along with a change in surface area measurements. Actual mechanism of
these catalysts cannot be argued because of lack of characterization of these catalysts.
An important characteristic of the present studies is that a lot of effort has been made to
collect all the products, including liquids and waxes. CO2 is included in the products and
attempts have been made to get a catalyst with the lowest possible selectivity of CO2 .
Most of the reported studies do not include liquids, waxes and CO2 .
The reaction of CO hydrogenation by FT technology has provided an indirect route for
the production of fine petrochemicals from syngas. This fact alone makes the process
very important for future investigation of synthetic fuels production. Since the
development of the first methanation catalyst 106 years ago, the Fischer Tropsch process
has reached a stage when researchers are able to operate it on the commercial scale.
However, there is very little understanding about the actual mechanism of reactions
leading to final products.
175

Appendix
APPENDIX
176
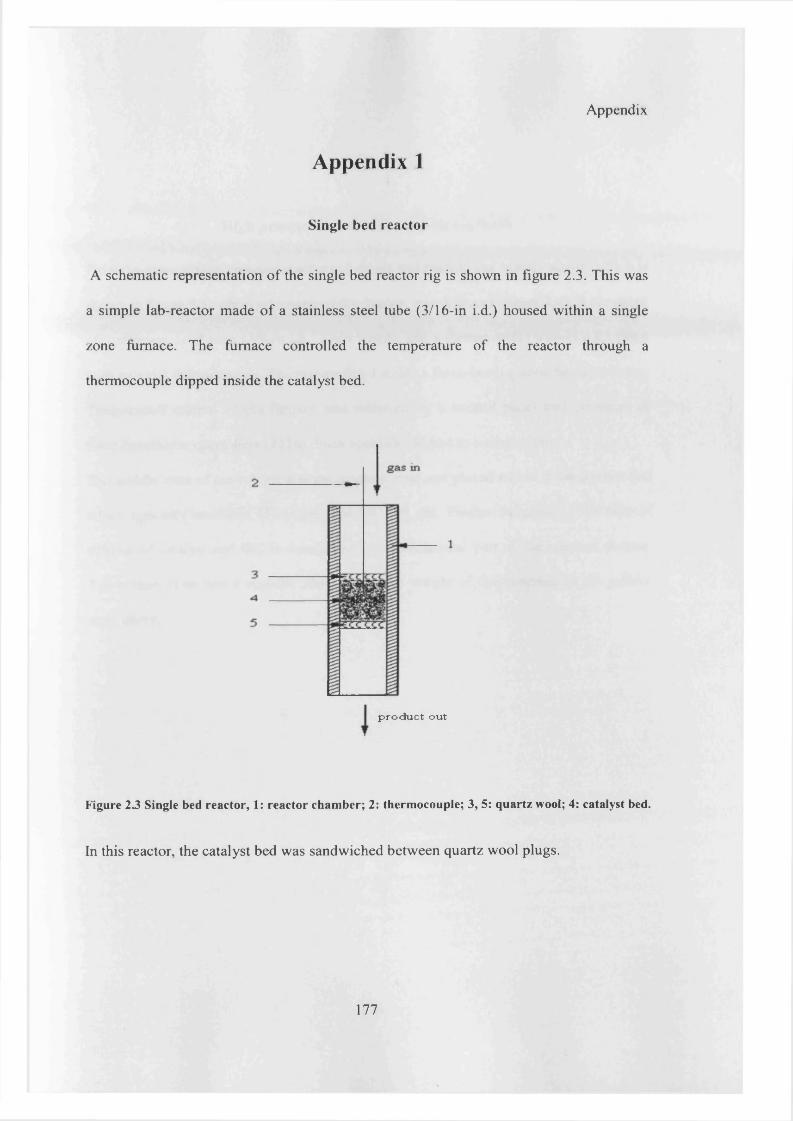
Appendix 1
Appendix
Single bed reac to r
A schematic representation o f the single bed reactor rig is shown in figure 2.3. This was
a simple lab-reactor made o f a stainless steel tube (3/16-in i.d.) housed within a single
zone furnace. The furnace controlled the temperature o f the reactor through a
thermocouple dipped inside the catalyst bed.
product out
Figure 2 3 Single bed reactor, 1: reactor chamber; 2: thermocouple; 3, 5: quartz wool; 4: catalyst bed.
In this reactor, the catalyst bed was sandwiched between quartz wool plugs.
177
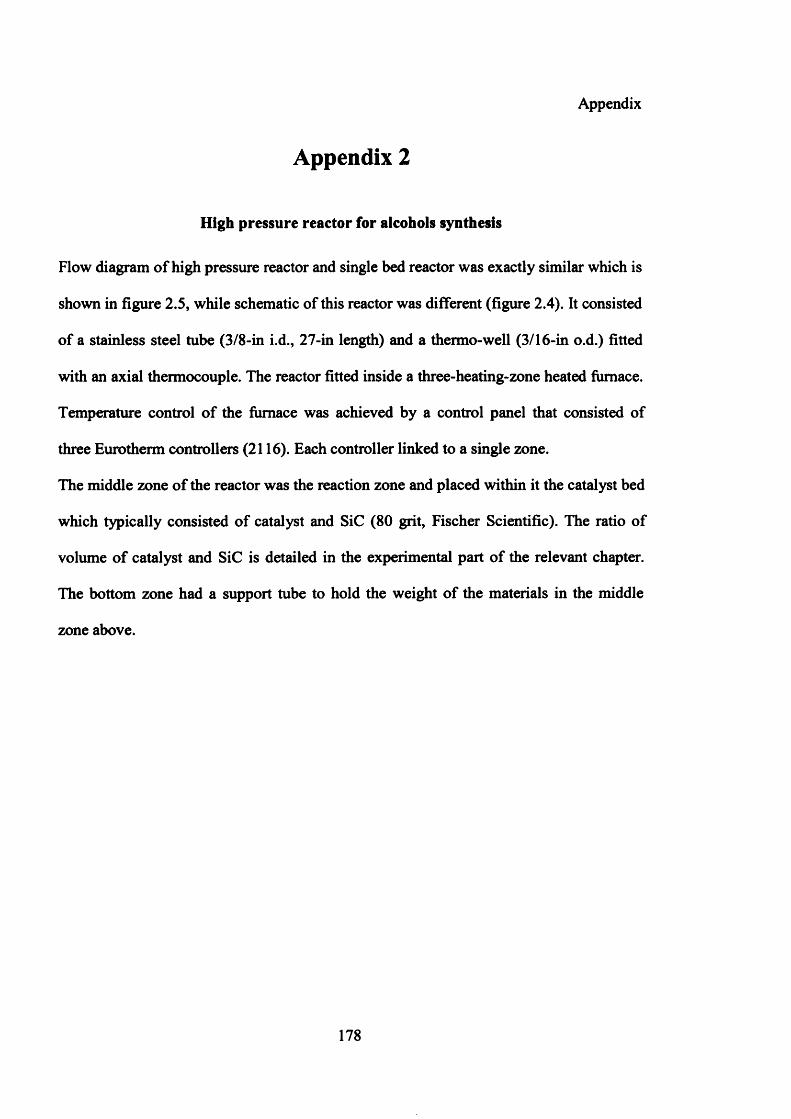
Appendix 2
Appendix
High pressure reactor for alcohols synthesis
Flow diagram of high pressure reactor and single bed reactor was exactly similar which is
shown in figure 2.5, while schematic of this reactor was different (figure 2.4). It consisted
of a stainless steel tube (3/8-in i.d., 27-in length) and a thermo-well (3/16-in o.d.) fitted
with an axial thermocouple. The reactor fitted inside a three-heating-zone heated furnace.
Temperature control of the furnace was achieved by a control panel that consisted of
three Eurotherm controllers (2116). Each controller linked to a single zone.
The middle zone of the reactor was the reaction zone and placed within it the catalyst bed
which typically consisted of catalyst and SiC (80 grit, Fischer Scientific). The ratio of
volume of catalyst and SiC is detailed in the experimental part of the relevant chapter.
The bottom zone had a support tube to hold the weight of the materials in the middle
zone above.
178
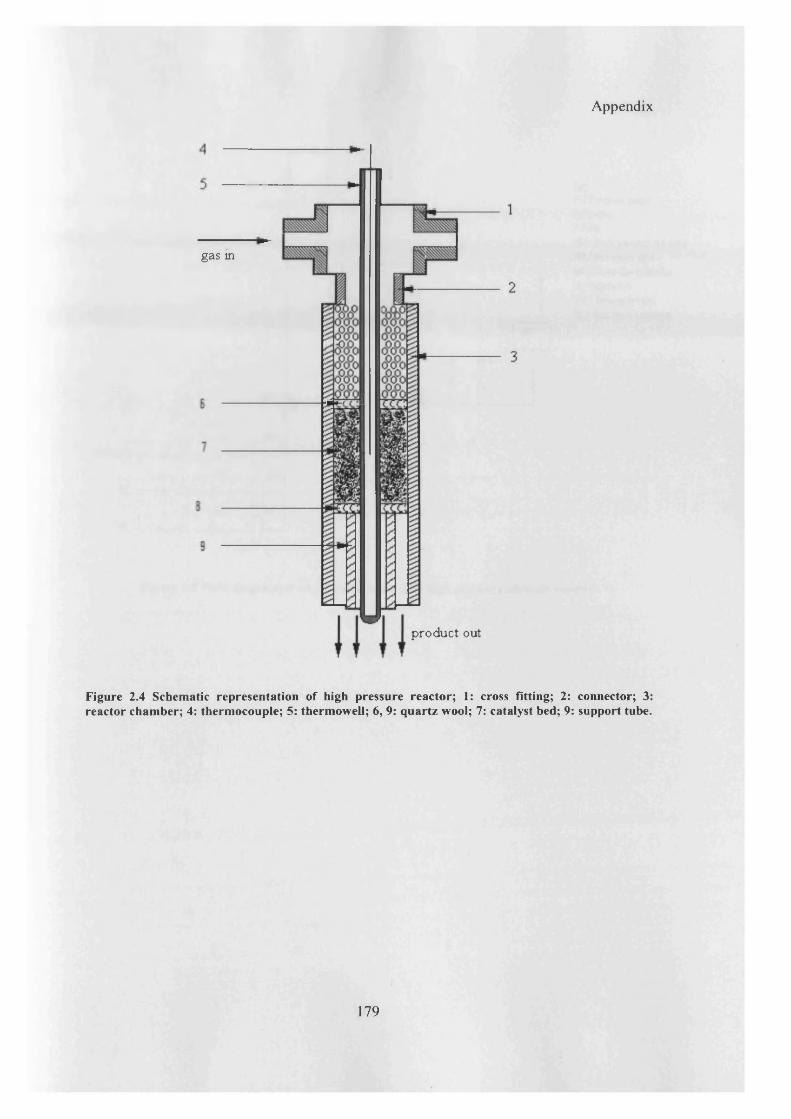
Appendix
gas in
outproduct
Figure 2.4 Schematic representation of high pressure reactor; 1: cross fitting; 2: connector; 3: reactor chamber; 4: thermocouple; 5: thermowell; 6, 9: quartz wool; 7: catalyst bed; 9: support tube.
179
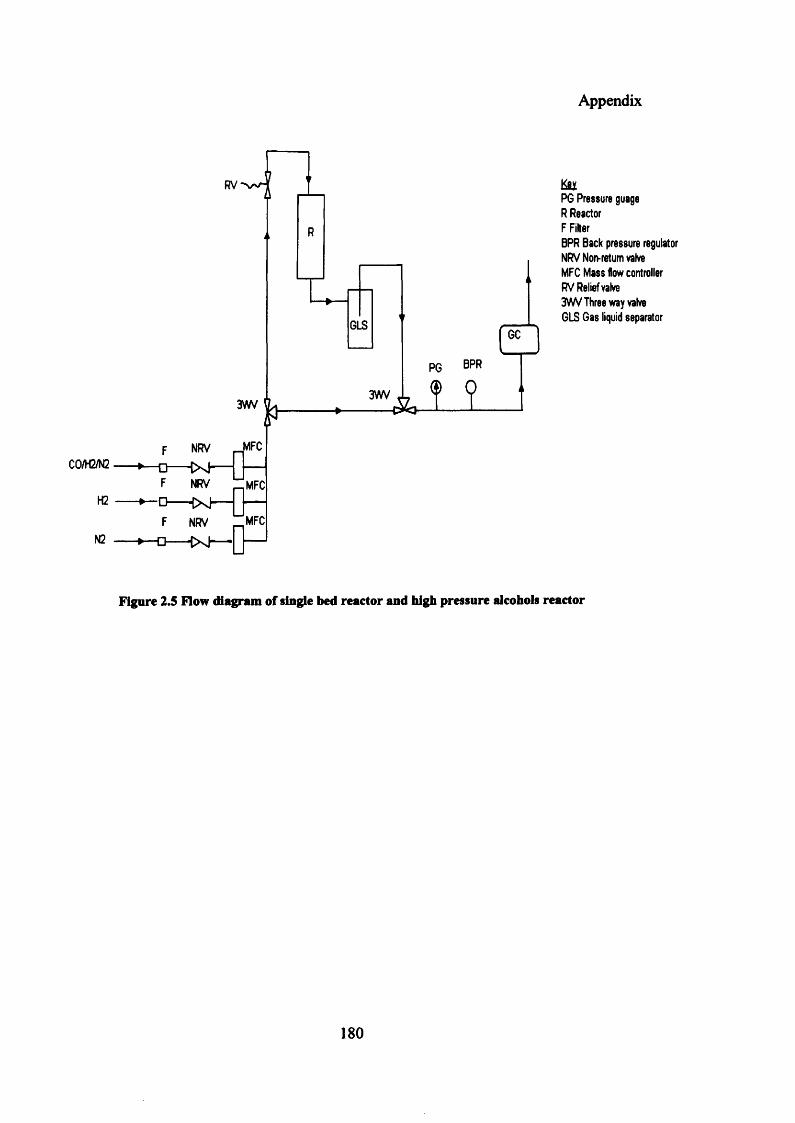
Appendix
BPR
3WV3WV
MFCNRVCO/H2/N2
NRV MFC
MFCNRV
6LS
Kg*PG Pressure guage R Reactor F FilterBPR Back pressure regulator NRV Non-return valve MFC M ass flow controller RV Relief valve 3WV Three way valve GLS G as liquid separator
Figure 2.5 Flow diagram of single bed reactor and high pressure alcohols reactor
180
Appendix 3
Appendix
Product Analysis for catalysts tested in single bed and high pressure alcohol reactor
Analysis of gaseous product was achieved by an online gas chromatograph (GC, Varian
3800). A 5m* 1/8 inch stainless steel Porapak-Q column (mesh size 80-100) was used to
separate the reactants and products. Concentrations of hydrogen, carbon monoxide,
carbon dioxide and nitrogen were analyzed by a thermal conductivity detector (TCD).
The TCD compares the conductivity of the analyzed gas to that of a reference gas.
Conversion was determined using an internal standard, nitrogen. Organic compounds
such as hydrocarbons and oxygenates were determined by a flame ionization detector
(FID). By using a hydrogen and air flame, the FID bums the organic compounds into ions
whose amounts are roughly proportional to the number of carbon atoms present.
Liquid products from alcohols reactor were identified by gas chromatography mass
spectrometer (GC-MS, Perkin Elmer TurboMass). Quantification of liquid products was
determined by an offline GC equipped with a Chrompack capillary column (CP-Sil 8 CB,
30m, 0.32mm, 1pm) and an FID detector.
181
Appendix 4
Appendix
6-bed reactors
CO hydrogenation for most of the catalysts for light alkenes synthesis was carried out
using six fixed-bed laboratory reactors as shown schematically in figure 2 .6 , which
enabled the testing of catalysts under identical experimental conditions.
The reactors were constructed from 316 stainless steel with an internal diameter of 14mm.
Test experiments showed that blank thermal reactions in the absence of catalysts were
negligible at and below 300°C. The reactor consisted of two main parts: (i) the reactor
section containing 0.5g of catalyst and (ii) a post reactor liquid and wax trap. Overall,
figure of these reactors was similar to the single bed reactor presented in figure 2.3.
Preheated gas and catalyst temperatures were measured using K-type thermocouple
positioned in the centre of catalyst bed. Premixed synthesis gas (typically CO 47.5%, H2
47.5%, N2 5% v/v) and H2 (for reduction) were fed to the combined reactors at flow rates
controlled using mass flow controllers (BROOKS 5850S). The pressure was controlled
using a back pressure regulator (Pressure rang 1-30 bar) located down stream of the
reactor and wax/liquid trap. High boiling wax products were trapped in the post-reactor
trap which was held at about +/- 140°C reaction temperature. Lower boiling waxes and
liquids passed through into the trap which was held at room temperature.
182
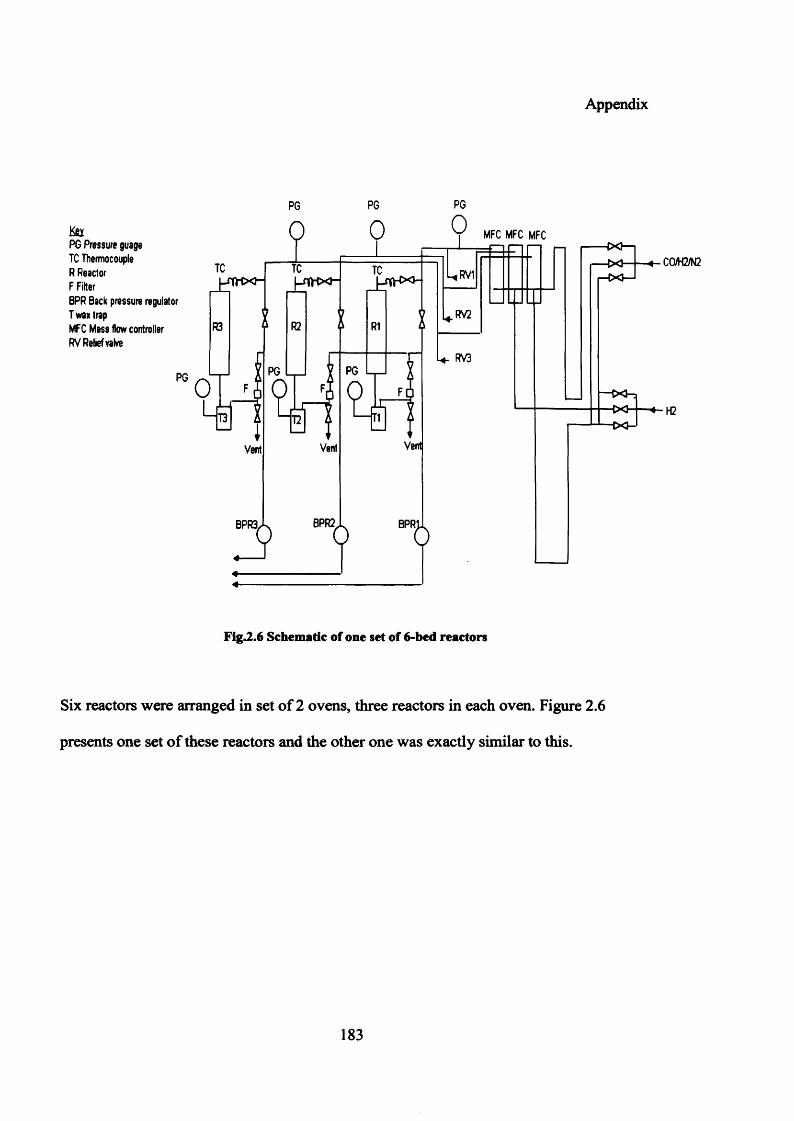
Appendix
KeyPG Pressure guage TC Thermocouple R Reactor F FilterBPR Back pressure regulator T wax trapMFC Mass flow controller RV Relief valve
MFC MFC MFC
Lj THX*”MVfCX-
V
Fig.2.6 Schematic of one set of 6-bed reactors
Six reactors were arranged in set of 2 ovens, three reactors in each oven. Figure 2.6
presents one set of these reactors and the other one was exactly similar to this.
CO/H2/N2
H2
183
Appendix 5
Appendix
Data Evaluation
A procedure of data manipulation was required, in order to obtain quantitative data in the
form of individual product selectivities from the integrated response of the respective gas
chromatographs. Two types of calculation methods were used for the evaluation of data.
One method was based on used of a correction factor, outlined by Dietz [4], while the
other method was based on use of online response factors of particular products in gas
phase. Both of these methods have been detailed below:
i) Data collection by use o f Dietz's correction factors
The varying response of the detector to each product component was corrected by
multiplying each component’s area counts by Dietz’s correction factors. Since the
selectivity of each component of the product yield from a catalyst was quoted in percent
mass derived from equation ( 1).
Selectivity of component i = mass of i/ total mass of all components* 100/1 (1)
Gas product’s concentration was converted from mass percent into volume percent, using
standard gas mixtures with known volume percent; with the method detailed by Mike [5],
as detailed in eq. (2) and (3). The volume percent of gas components was then converted
into grams per component shown in eq (4).
Factors for correcting %m/m to %v/v
e = (%v/v*Mw)/%m/m (2)
184
Appendix
where Mw = molecular weight of the component
e factor was calculated by using a standard gas calibration for a 1 %v/v for a given gas.
Volume percent of the gas components can be calculated from eq (3).
%v/v = (%m/m* e)/Mw (3)
Ideal gas law was used for calculation of grams of gas products per component
n = P V/RT
where n (the number of moles) is used to calculate the mass percent per component using
the following equation
mass of component i = Nj * Mwi
and V= inlet flow rate (ml/hr) *mass balance period (hrs)*%v/v
After addition of weight of liquids and solid masses, the percentage of each compound
was calculated.
Calculation o f conversion
An indication of the activity of the catalyst was determined by the extent of conversion of
the carbon monoxide or for more active catalysts by the extent of volume reduction of the
reagent gases (using nitrogen as internal standard). The basic equation used was
Conversion % = Moles of COm - moles of COout/moles of COm * 100/1
185
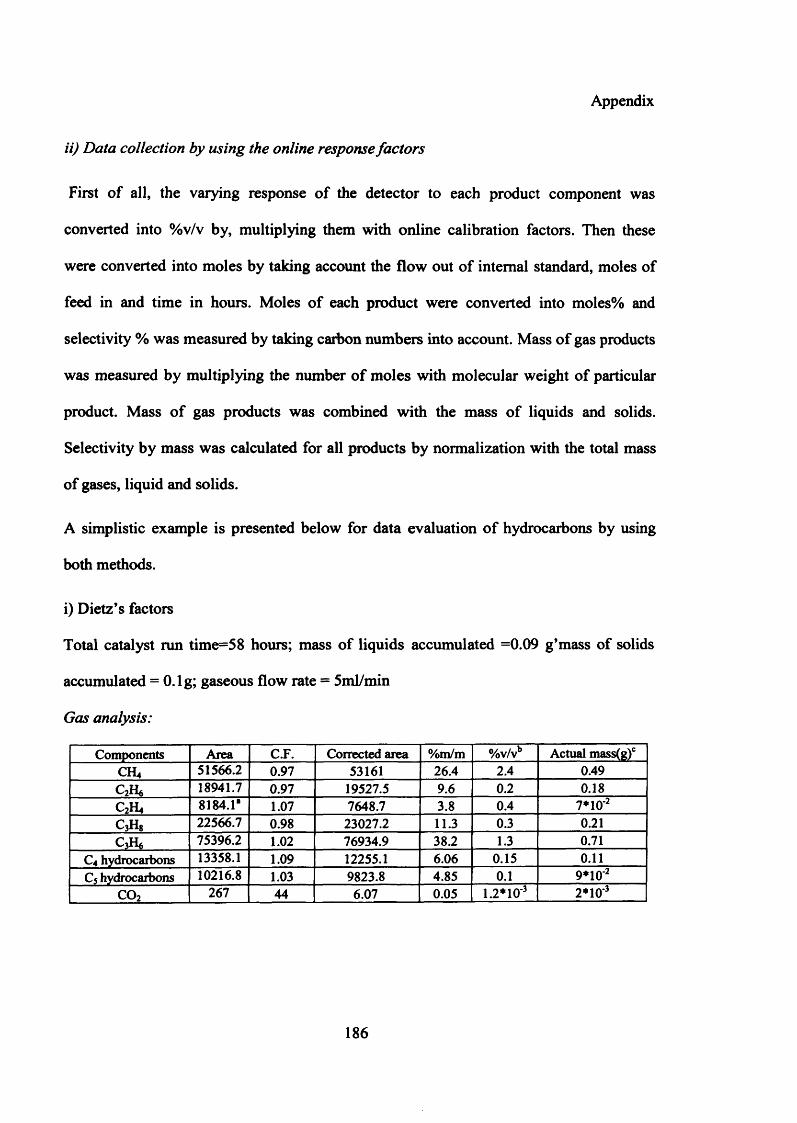
Appendix
ii) Data collection by using the online response factors
First of all, the varying response of the detector to each product component was
converted into %v/v by, multiplying them with online calibration factors. Then these
were converted into moles by taking account the flow out of internal standard, moles of
feed in and time in hours. Moles of each product were converted into moles% and
selectivity % was measured by taking carbon numbers into account. Mass of gas products
was measured by multiplying the number of moles with molecular weight of particular
product. Mass of gas products was combined with the mass of liquids and solids.
Selectivity by mass was calculated for all products by normalization with the total mass
of gases, liquid and solids.
A simplistic example is presented below for data evaluation of hydrocarbons by using
both methods.
i) Dietz’s factors
Total catalyst run time=58 hours; mass of liquids accumulated =0.09 g’mass of solids
accumulated = O.lg; gaseous flow rate = 5ml/min
Gas analysis:
Components Area C.F. Corrected area %m/m %v/vb Actual mass(g)cCH4 51566.2 0.97 53161 26.4 2.4 0.49C A 18941.7 0.97 19527.5 9.6 0 . 2 0.18C2H4 8184.1“ 1.07 7648.7 3.8 0.4 7*10‘2
c 3h 8 22566.7 0.98 23027.2 11.3 0.3 0 . 2 1
C3H6 75396.2 1 . 0 2 76934.9 38.2 1.3 0.71C4 hydrocarbons 13358.1 1.09 12255.1 6.06 0.15 0 . 1 1
C5 hydrocarbons 10216.8 1.03 9823.8 4.85 0 . 1 9*10' 2
C 0 2 267 44 6.07 0.05 1 .2 *1 0 ' 3 2 *1 0 ‘3
186
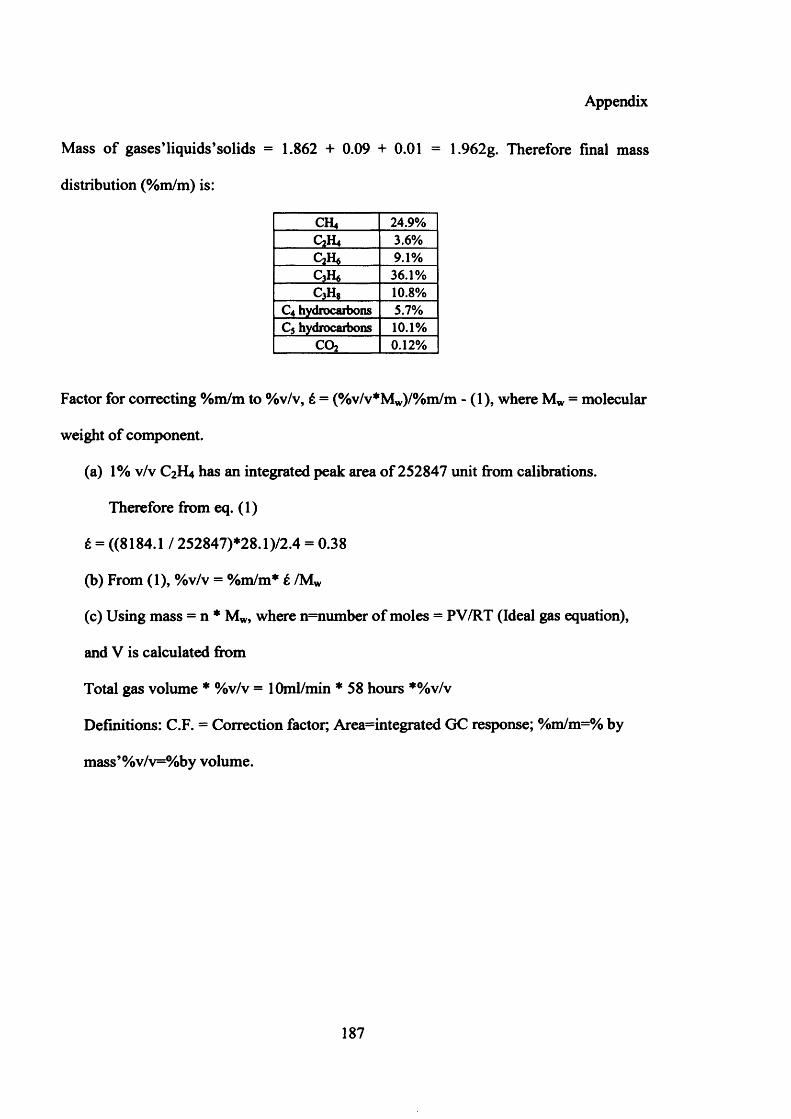
Appendix
Mass of gases’liquids* solids = 1.862 + 0.09 + 0.01 = 1.962g. Therefore final mass
distribution (%m/m) is:
CH4 24.9%C2H4 3.6%QH* 9.1%CJU 36.1%c 3h 8 10.8%
C4 hydrocarbons 5.7%Cs hydrocarbons 10.1%
C02 0.12%
Factor for correcting %m/m to %v/v, £ = (%v/v*Mw)/%m/m - (1), where Mw = molecular
weight of component.
(a) 1% v/v C2H4 has an integrated peak area of 252847 unit from calibrations.
Therefore from eq. (1)
£ = ((8184.1 / 252847)*28.1 )/2.4 = 0.38
(b) From (1), %v/v = %m/m* £ /Mw
(c) Using mass = n * Mw, where n=number of moles = PV/RT (Ideal gas equation),
and V is calculated from
Total gas volume * %v/v = lOml/min * 58 hours *%v/v
Definitions: C.F. = Correction factor; Area=integrated GC response; %m/m=% by
mass’%v/v=%by volume.
187
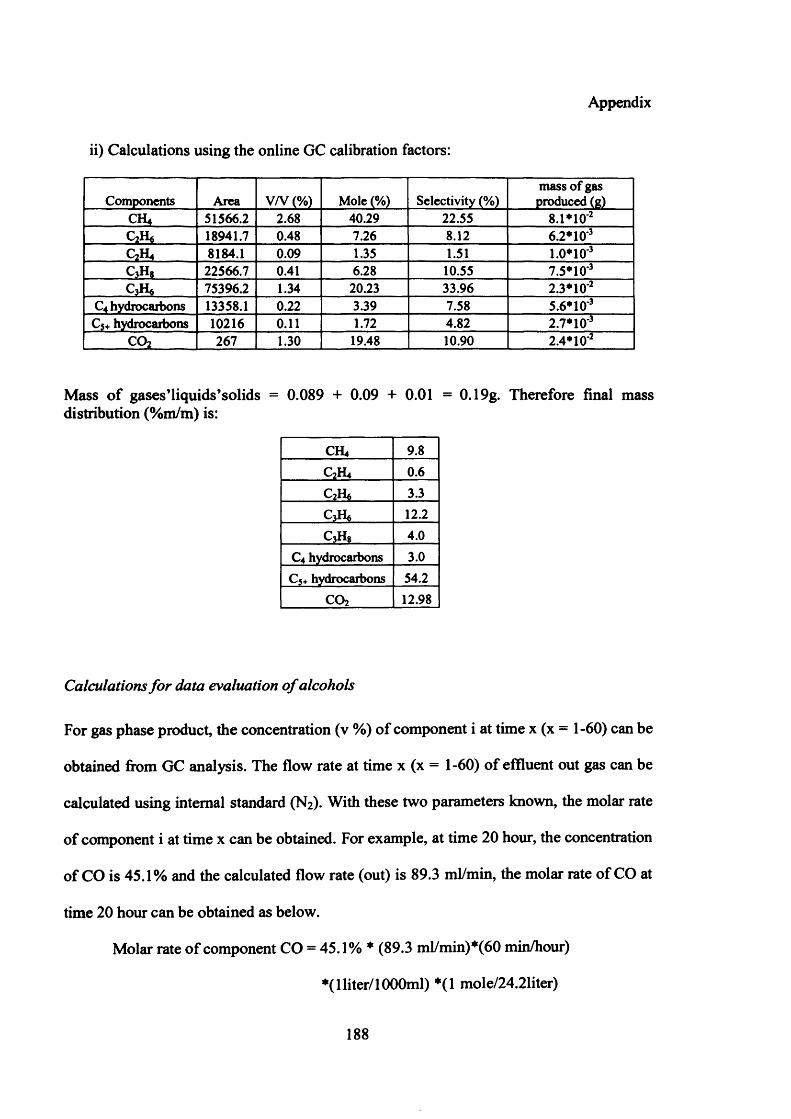
Appendix
ii) Calculations using the online GC calibration factors:
Components Area V/V (%) Mole (%) Selectivity (%)mass of gas produced (g)
CH4 51566.2 2 . 6 8 40.29 22.55 8 .1 *1 0 ' 2
_ c 2h« 18941.7 0.48 7.26 8 . 1 2 6 .2 * 1 0 ‘3
C2H4 8184.1 0.09 1.35 1.51 1 .0 *1 0 ' 3
c 3h 8 22566.7 0.41 6.28 10.55 7.5*10' 3
c 3h« 75396.2 1.34 20.23 33.96 2.3*10' 2
C4 hydrocarbons 13358.1 0 . 2 2 3.39 7.58 5.6*10‘3
C5+ hydrocarbons 10216 0 . 1 1 1.72 4.82 2.7*10'*C 0 2 267 1.30 19.48 10.90 2.4*1 O' 2
Mass of gases’liquids’sol ids = 0.089 + 0.09 + 0.01 = 0.19g. Therefore final mass distribution (%m/m) is:
CH4 9.8
C2H4 0 . 6
QH* 3.3CaH* 1 2 . 2
c 3h 8 4.0C4 hydrocarbons 3.0C5+ hydrocarbons 54.2
CO2 12.98
Calculations fo r data evaluation o f alcohols
For gas phase product, the concentration (v %) of component i at time x (x
obtained from GC analysis. The flow rate at time x (x = 1-60) of effluent
calculated using internal standard (N2). With these two parameters known, the molar rate
of component i at time x can be obtained. For example, at time 20 hour, the concentration
of CO is 45.1% and the calculated flow rate (out) is 89.3 ml/min, the molar rate of CO at
time 20 hour can be obtained as below.
Molar rate of component CO = 45.1% * (89.3 ml/min)*(60 min/hour)
*(1 liter/1000ml) *(1 mole/24.21iter)
= 1-60) can be
out gas can be
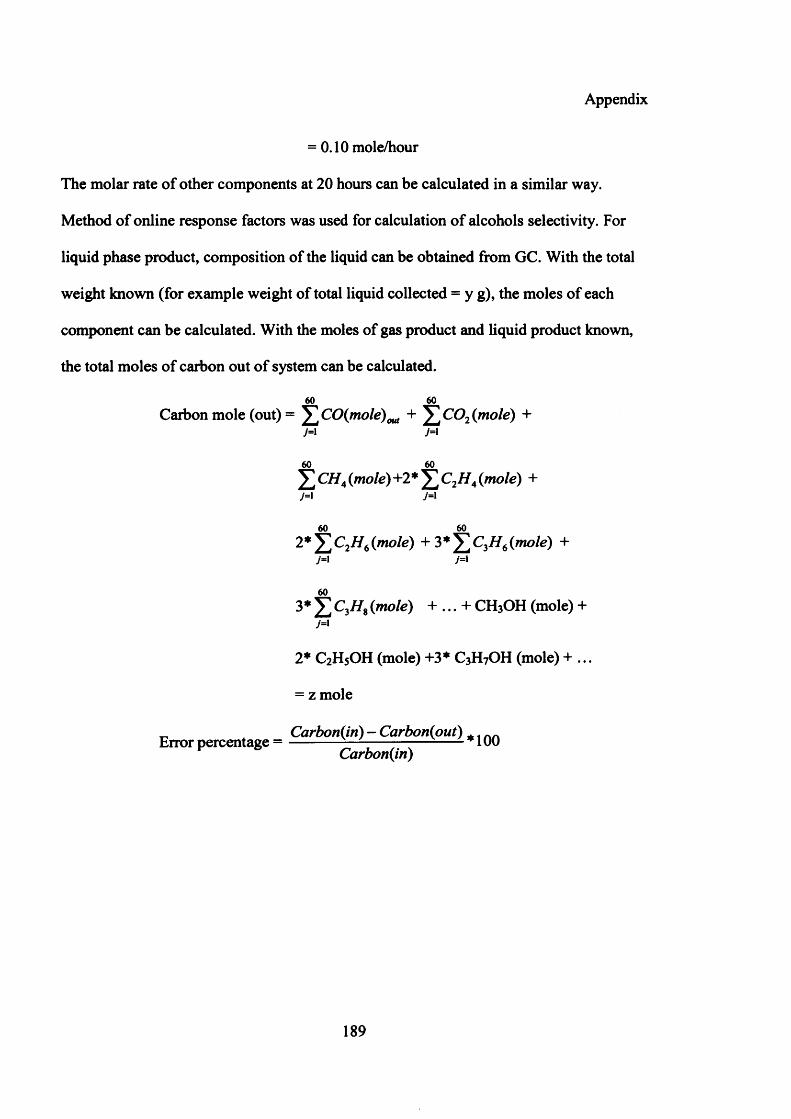
Appendix
= 0.10 mole/hour
The molar rate of other components at 20 hours can be calculated in a similar way.
Method of online response factors was used for calculation of alcohols selectivity. For
liquid phase product, composition of the liquid can be obtained from GC. With the total
weight known (for example weight of total liquid collected = y g), the moles of each
component can be calculated. With the moles of gas product and liquid product known,
the total moles of carbon out of system can be calculated.
60 60Carbon mole (out) = ^1 CO(mole)oul + J 'C Q 7(mole) +
60 60£ CH4 (mole) +2* £ C2H A (mole) +
60 602 * Y j C2H6(mole) + 3 * Y 1CiH 6(mole) +
603* £ CyHt (mole) + ... + CHjOH (mole) +
2* C2H5OH (mole) +3* C3H7OH (mole) + ...
= z mole
Error percentage = Carbonjin)- Carbonjout) a^QQ Carbon(in)
189
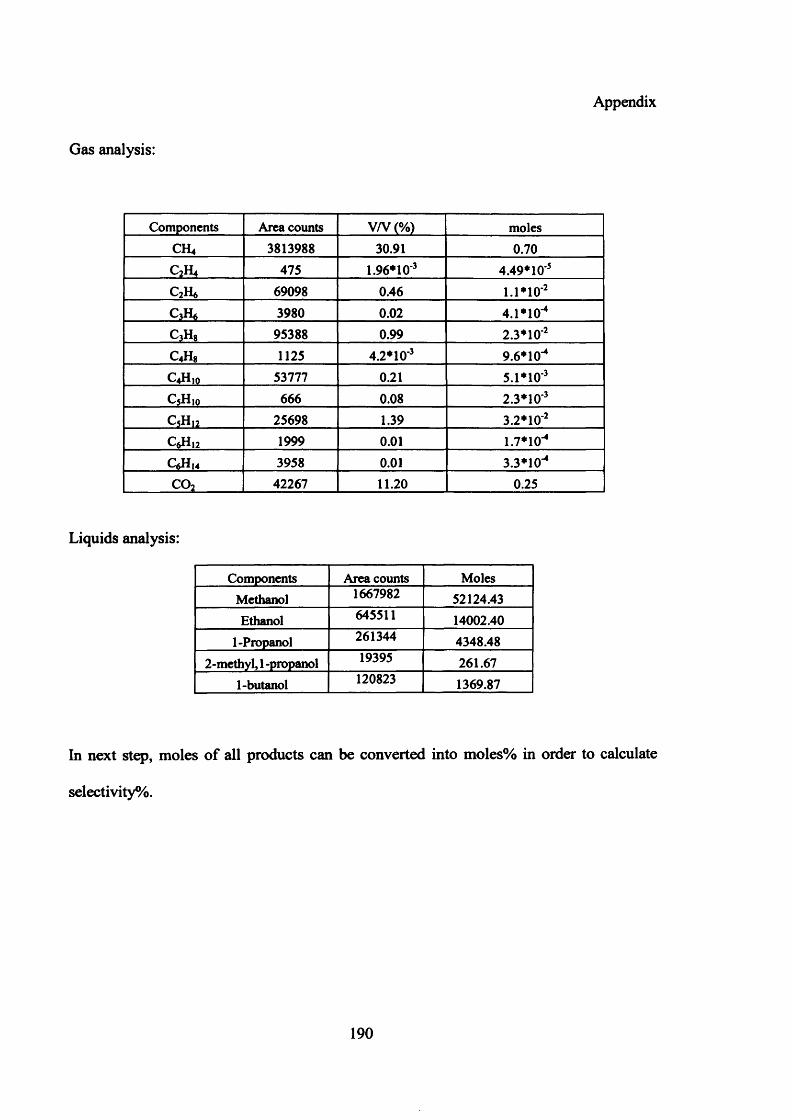
Appendix
Gas analysis:
Components Area counts V/V (%) molesCH4 3813988 30.91 0.70C2H4 475 1.96*10‘3 4.49* 10*5
QH* 69098 0.46 1.1*10‘2
c 3h* 3980 0.02 4.1 *10-4
C3H8 95388 0.99 2.3*10‘2
C4H8 1125 4.2*1 O'3 9.6* 10-4
C4H10 53777 0.21 5.1*10‘3
C5Hjo 666 0.08 2.3* 10‘3
c 5H12 25698 1.39 3.2*10‘2
C6H12 1999 0.01 1.7*10^Q H u 3958 0.01 3.3*10"*C02 42267 11.20 0.25
Liquids analysis:
Components Area counts MolesMethanol 1667982 52124.43Ethanol 645511 14002.40
1-Propanol 261344 4348.482-methyl, 1 -propanol 19395 261.67
1-butanol 120823 1369.87
In next step, moles of all products can be converted into moles% in order to calculate
selectivity%.
190
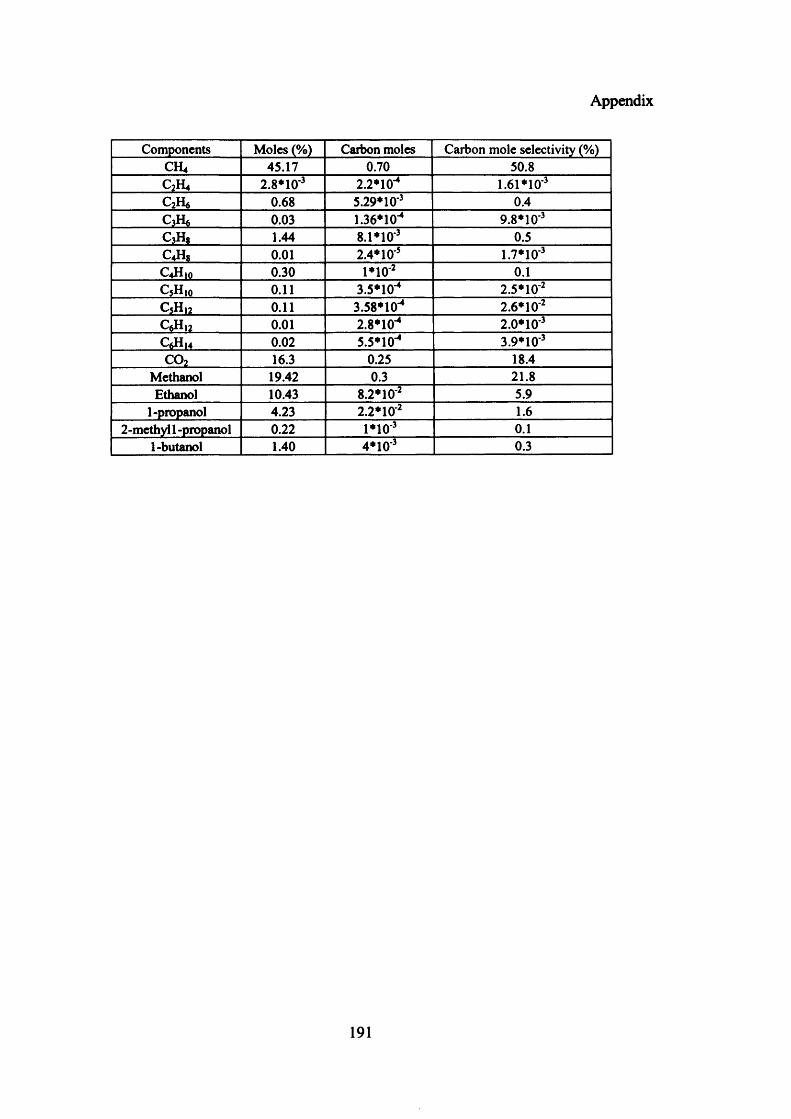
Appendix
Components Moles (%) Carbon moles Carbon mole selectivity (%)CH4 45.17 0.70 50.8C2H4 2 .8*10'3 2.2*1 O'4 1.61*10"3c 2h« 0.68 5.29*10'3 0.4C3H, 0.03 1.36*10"* 9.8*10'3c 3h 8 1.44 8 .1*10'3 0.5
00
*0
0.01 2.4*10'5 1.7*10'3C4H10 0.30 1*10*2 0.1
C5H10 0.11 3.5*10"* 2.5*10'2C5H,2 0.11 3.58*10"* 2.6*1 O’2
C6H .2 0.01 2 .8*10"* 2 .0 *10'3C*H14 0.02 5.5*10-* 3.9*10'3C02 16.3 0.25 18.4
Methanol 19.42 0.3 21.8Ethanol 10.43 8 .2*10 '2 5.9
1-propanol 4.23 2 .2 *10'2 1.62 -methyl 1 -propanol 0.22 1*10’3 0.1
1-butanol 1.40 4*10"3 0.3
191
Appendix 6
Appendix
Product Analysis of catalysts tested in 6-bed reactors
Analysis of gaseous product was achieved by an online gas chromatograph (GC, Varian
3800). Three columns were used for analysis of gaseous products, (Front-Varian CP-
AI2O3/KC, 25m, 0.32mm, 5pm, CP7519, Middle-Mol sieve 13X, 60-80 Mesh, Rear-
Hayesep C, 80-100 Mesh).
Concentrations of hydrogen, carbon monoxide, carbon dioxide and nitrogen were
analyzed by a thermal conductivity detector (TCD). Conversion was determined using an
internal standard, nitrogen. Organic compounds such as hydrocarbons and oxygenates
were determined by a flame ionization detector (FID).
192

Appendix

Appendix
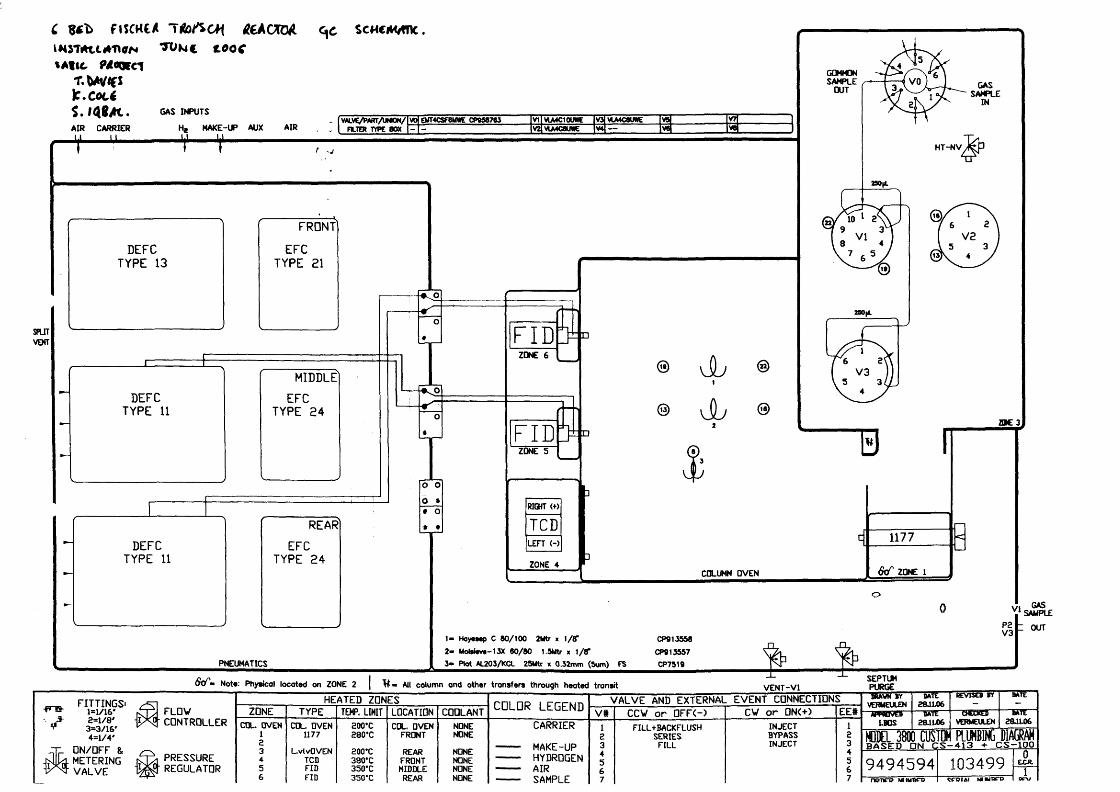
C f i s c w e * T l t o A C H A e A C X & LttOTftUimaN TOnc tooc%AttC fttCOCCl
T.W<CJ | C . C * U S . iQBAt.
c\c scwcwnc.
AIRli
CARRIER
GAS INPUTS
He MAKE-UP AUX AIRVALVE/PAKT/UMOM/
FILTER TYPE BOXWO
|\
VI V L A 4C 10U « V3 VLA4C6UNE VS V7- - V2 VU4C0UN E V4 v e VB
SPLITVEHT
DEFC TYPE 13
FRONT
EFC TYPE 21
MIDDLE'
DEFC EFCTYPE 11 TYPE 24
TYPE 11
REAR
EFC TYPE 24
PNEUMATICS
o o o *• o* •
F I D I F "ZDNE 6
FIDZONE S
_ F D
H T - N V ^ p
ZOC 3
BRIGHT (+)
TCDLEFT <-)
ZONE 4COLUMN OVEN
1177
1 - Hoyesep C 80/100 2Mtr x 1/CT2 - MoWeve-13X 60/80 1.5Mtr x 1/8*3 - Plot AL203/KCL 25Utr x 0.32mm (Sum)
CPS13558 CPS13557 CP7519
VIV1 SAMPLE
t OUT
& / » Note: Physical located on ZONE 2 | All column and other transfers through heated transitSEPTUM
VENT-V1
FITTINGS'1=1/162 = 1/83= 3/164=1/4*
UN/OFF 8.METERINGVALVE
FLOVHEATED ZONES COLOR LEGEND VALVE AND EXTERNAL EVENT CONNECTIONS
ZONE TYPE TEMP. LIMIT LOCATION COOLANT V# CCV o r OFF<-) CV o r 0N<+) EE#CONTROLLER COL. OVEN COL. DVEN 200‘C COL. OVEN NONE CARRIER 1 FILL+BACKFLUSH INJECT 1
1 1177 280*C FRONT NONE 2 SERIES BYPASS 223 L.vlvOVEN 200*C REAR NONE ------- MAKE-UP 3 FILL INJECT 3
4PRESSURE 4 TCD 380*C FRONT NONE ------- HYDROGEN g 5REGULATOR 5 FID 350‘C MIDDLE NONE ------- AIR 6 66 FID 350*C REAR NONE ------- SAMPLE 7 7
DRAVN SY VERMEULEN
DATE28JL06
' REVISED BY DATE
aph h v oLBOS
BATE28JL06
CHECHESVERMEULEN
DATE28.1L06
MODEL 380BASETD
0 CUSTOMON C S -
PLUMBING DIAGRAM- 4 1 3 + C S - 1 0 0
9 4 9 4 5 9 4npnro mumpcd
1 0 3 4 9 9w pia i m lunrp
0EJCJl1XV