An investigation into the reasons cited by low cost ...trap.ncirl.ie/2075/1/pamelawoods.pdf · 1 An...
69
1 An investigation into the reasons cited by low cost airline cabin crew for resigning within the first year of service. By Pamela Doyle Woods A dissertation submitted in partial fulfilment for the award of BA (Hons) in Human Resource Management National College of Ireland Submitted to the National College of Ireland, July 2015.
Transcript of An investigation into the reasons cited by low cost ...trap.ncirl.ie/2075/1/pamelawoods.pdf · 1 An...

1
An investigation into the reasons cited by
low cost airline cabin crew for resigning
within the first year of service.
By Pamela Doyle Woods
A dissertation submitted in partial fulfilment for the award of
BA (Hons) in Human Resource Management
National College of Ireland
Submitted to the National College of Ireland, July 2015.

2
SUBMISSION OF THESIS AND DISSERTATION
National College of Ireland
Research Students Declaration Form
(Thesis / Author Declaration Form)
Name: Pamela Doyle
Student Number: 13116843
Degree for which dissertation is submitted: BA (Hons) in Human
Resource Management.
Material submitted for award
(a) I declare that the work has been composed by myself.
(b) I declare that all verbatim extracts contained in the thesis have been
distinguished by quotation marks and the sources of information
specifically acknowledged.
(c) My thesis will be included in electronic format in the College
Institutional Repository TRAP (thesis reports and projects).
(d) I declare that no material contained in the thesis has been used in any
other submission for an academic award.
Signature of research student:
Date: 15/7/15

3
Submission of Thesis to Norma Smurfit Library
National College of Ireland
Student Name: Pamela Doyle Woods Student Number: 13116843
School: School of Business Course: BA (Hons) HRM
Degree to be awarded: BA (Hons) in Human Resource Management
Title of Thesis:
An investigation into the reasons cited by low cost airline cabin crew for resigning within the
first year of service.
One hard bound copy of your thesis will be lodged in the Norma Smurfit Library and will be
available for consultation. The electronic copy will be accessible in TRAP
(http://trap.ncirl.ie/), the National College of Ireland’s Institutional Rapository. In accordance
with normal academic library practice all theses lodged in the National College of Ireland
Institutional Respository (TRAP) are made available on open access.
I agree to a hard copy of my thesis being available for consultation in the library. I also agree
to an electronic copy of my thesis being made publicly available on the National College of
Ireland’s Institutional Repository TRAP.
Signature of Candidate:
For completion by the School:
The aforementioned thesis was received by: __________________________ Date: ______
The signed form must be appended to all hard bound and electronic copies of your thesis
submitted to your school.
4
Abstract
The objective of this dissertation is to investigate the reasons cited by low cost cabin
crew employees for resigning within the first year of service and to analyse existing
literature and findings from previous studies relating to reasons why employees resign
in general. The researcher aims to establish if there are differences or similarities
between previous studies and the results from this study.
This study analyses the reasons cited on over 900 resignation forms collected over a
period of 12 years, quantitative statistical analysis has been carried out and tests of
proportions applied. The researcher intends to add to the existing research and to
analyse whether gender, age or working in airport bases with higher living costs
contributes to reasons cited.
The research findings indicate that while there are significant similarities between the
reasons cited by cabin crew and the reasons identified in previous studies some
significantly different reasons were also identified. A number of tests of proportions
were carried out to further research in relation to gender, age and the location where the
cabin crew employees were stationed in order to check if there were any significantly
different reasons cited with regard to these factors.
The findings of this research indicate that there were significantly different reasons
cited by males and females in the study and differences exist in relation to age. Unmet
expectations were also a factor contributing to reasons for resignation within the first
year of service along with some other unique contributing factors.
Keywords: low cost models, airlines, leavers, resignation, reasons cited.

5
Acknowledgements
I would like to thank my Supervisor Ron Elliott for his guidance and support throughout
the process of completing this dissertation. I would also like to show my appreciation
to Jonathan Lambert who introduced me to the world of statistical analysis and who
provided me with valuable suggestions and feedback in relation to quantitative analysis
and Keith Brittle for his kindness and patience while providing great advice and support
on this journey. I would also like to thank the organization that allowed me to use the
data contained within this study, as part of their process improvement strategy they
welcomed the opportunity, I would also like to thank my employer particularly the
Directors who supported me professionally and financially.
I would also like to thank my family particularly my Mother Antoinette, my lovely
Daughter Zoefia May and my Husband Ian without their support this would not have
been possible.

6
Table of Contents
ABSTRACT 4
ACKNOWLEDGEMENTS 5
CHAPTER 1 - INTRODUCTION 8
1.0 BACKGROUND TO DISSERTATION 8 1.1 RESEARCH QUESTION 9 1.2 RESEARCH APPROACH 10 1.3 STRUCTURE 10
CHAPTER 2 - LITERATURE REVIEW 11
2.0 SCOPE OF LITERATURE REVIEW 11 2.1 EMPLOYEE TURNOVER 11 2.2 HISTORY OF EMPLOYER / EMPLOYEE RELATIONSHIP. 12 2.3 FACTORS THAT AFFECT STAFF TURNOVER. 12 2.4 BACKGROUND TO LOW COST AVIATION BUSINESS MODELS 16 2.5 MONITORING STAFF TURNOVER FACTORS 17 2.6 EFFECTS OF STAFF TURNOVER ON BUSINESS. 18 2.6 RETENTION STRATEGIES 19 2.7 CONCLUSION 20
CHAPTER 3 – RESEARCH METHODOLOGY 21
3.0 RESEARCH METHODOLOGY INTRODUCTION 21 3.1 RESEARCH AIM AND OBJECTIVES 22 3.2 RESEARCH DESIGN 22 3.3 RESEARCH LIMITATIONS 24 3.4 DATA COLLECTION 24 3.5 METHOD OF DATA ANALYSIS 26 3.6 ETHICAL STANDARDS AND DATA MANAGEMENT 27
CHAPTER 4 – DATA FINDINGS 27
4.1 INTRODUCTION TO RESEARCH FINDINGS 27 4.2 STUDY DEMOGRAPHICS AND SAMPLE CHARACTERISTICS. 28 4.2.1 TOP REASONS CITED FOR RESIGNATION 28 4.2.2 BETTER POSITION / CAREER CHANGE 29 4.2.3 FAMILY REASONS 30 4.2.4 DID NOT LIKE JOB 31 4.2.5 FINANCIAL / PAY REASONS 32 4.2.6 HEALTH REASONS 32 4.2.7 RETURNING TO STUDIES / TRAVEL 33 4.2.8 FURTHER ANALYSIS 34 4.3.1 DIFFERENCES WITH RESPECT TO GENDER AND REASON CITED; “NOT LIKING JOB” 35 4.3.2 DIFFERENCES WITH RESPECT TO GENDER AND CITING OF; “FAMILY REASONS” 35 4.3.3 DIFFERENCES WITH RESPECT TO GENDER AND CITING OF; “HEALTH REASON” 35 4.3.4 DIFFERENCES WITH RESPECT TO GENDER AND REASON CITED; “TO STUDY / TRAVEL” 36 4.3.5 DIFFERENCES WITH RESPECT TO AGE AND REASON CITED; “TO RETURN TO STUDY” 36 4.3.6 DIFFERENCES WITH RESPECT TO AGE AND REASON CITED; “TO TRAVEL” 36 4.3.7 DIFFERENCES WITH RESPECT TO LENGTH OF TENURE AND CITING OF; “FINANCIAL REASONS” 37 4.3.8 DIFFERENCES WITH RESPECT TO CREW LOCATED IN MORE EXPENSIVE COUNTRIES AND CITING
OF; “FINANCIAL REASONS” 37 4.3.9 DIFFERENCES WITH RESPECT TO GENDER AND REASON CITED; “RETURNING HOME” 38

7
4.3.10 DIFFERENCES WITH RESPECT TO AGE AND REASON CITED; “NEW JOB ANOTHER AIRLINE” 38 4.3.11 DIFFERENCES WITH RESPECT TO AGE AND REASON CITED; “EXPECTATION NOT MET” 38 4.3.12 DIFFERENCES WITH RESPECT TO GENDER AND REASON CITED; “NO TRANSFER GRANTED” 39 4.4 CONCLUSION 39
CHAPTER 5 - DISCUSSION 40
5.0 INTRODUCTION 40 5.0.1 PROMOTION OUTSIDE ORGANIZATION / CAREER CHANGE AND LEVEL OF PAY 41 6.0.2 HEALTH REASONS 42 5.0.4 FAMILY REASONS / CHILDREN 43 5.0.5 JOB DISSATISFACTION 44 5.0.6 RETURN TO STUDY 45 5.0.6 PUSH AND PULL THEORIES 45 5.1 IMPLICATIONS OF THE RESEARCH 46 5.2 LIMITATIONS OF THE RESEARCH 47 5.3 FUTURE RECOMMENDATIONS 47
CHAPTER 6 - CONCLUSION 48
CHAPTER 7 - PERSONAL LEARNING 50
REFERENCES 51
APPENDICES 56
APPENDIX 1 – EUROSTAT LIST 56 APPENDIX 2 – CODING CHARTS 57 APPENDIX 3 – SUMMARY OF TOTAL DATA 58 APPENDIX 4 – ALL FIGURES AND TABLES 60

8
Chapter 1 - Introduction
1.0 Background to Dissertation
The aviation industry has grown and changed dramatically over the years with an
increase in the use of low cost business models by airlines to reduce costs and gain
competitive advantage. According to Box & Byus (2009) the origins of the low cost
business model was established in the 70s when US Airline Southwest adopted a low
cost strategy to gain competitive advantage and develop differentiation by introducing
unique operational changes like non-assigned seating on Aircraft.
According to the World Travel Market Global Trends Report 2014, the low cost airline
sector has been very successful and the business model is being embraced by many
scheduled airlines across the World (World Global Trends Report, 2014). Tourism is
reliant on the airline sector with tourism generating $1.8 trillion in overall global
economic activity and creating approximately 100 million jobs. 51% of international
tourism depends on the air industry and estimations are that by 2030 the air industry
will have provided 82 million jobs and have generated $6.9 trillion (Khuong, M.N. &
Le Truc Mai Uyen 2014).
Boyd (2001) argues that the effect of airlines adopting cost cutting strategies results in
employees having less job security, receiving lower pay, working longer hours and that
airlines are treating employees “like machines”. Boyd (2001) states that “the perpetual
pressure to carry out as many duties as possible both during flights and while on the
ground arguably makes cabin crew's occupation one of the most intensive and
potentially stressful jobs in the service sector”, along similar lines a more recent
American study argued that flight attendants were experiencing a greater
prevalence of certain health conditions than the general population. (McNeely et
al. 2014).
Through this study the researcher aims to explore the reasons cited by cabin crew
leavers for their resignation during the 1st year of service working in a low cost airline
business model compared with findings identified in previous studies relating to why
9
employees resign in other industries and to check whether there are significant
differences in the reasons cited.
Whilst there is a vast range of literature and research available in relation to employee
turnover and retention issues in various industries, the researcher has identified that
there is a lack of research specifically analysing the reasons why employees within low
cost business models leave early. Therefore existing literature fails to address whether
or not there are significant differences in the reasons cited. However the literature
review identifies that there are high costs and other implications as a result of having
high staff turnover, the following news articles outline some serious consequences of
staff shortages within the airline industry; Andrews (2007 p.8) The Daily Mail, outlines
that “British Airways is flying dozens of empty planes across the Atlantic because it
has no cabin crew to staff them”, they dismiss claims that they continued to fly the
planes to avoid losing valuable take-off and landing slots at Heathrow airport, while
Air India reported flight delays due to shortages of flight attendants (Business Standard,
2014) and Jet Airways issued an internal memo to communicate that all leave was
cancelled due to staff shortages (Economic Times, 2010). The researcher intends for
the findings from this study to be used in a positive way to identify and attempt to
strategically resolve issues to reduce early leavers and improve length of tenure.
1.1 Research Question
Why do cabin crew from a low cost airline voluntarily leave within the 1st year of
employment? Are there any significant differences between the reasons cited by cabin
crew employees in comparison to employees in other industries?
Are there any significant differences in the reasons cited by the cabin crew employees
in this study by age group, gender and by the location of the airport bases where they
are based to establish if living and working in an airport base with a higher living cost
made any difference to the reasons cited for leaving?
10
1.2 Research Approach
To answer the research questions the researcher completed a literature review and a
study of previous research on the subject and received approval to access and analyse
over 900 resignation forms that were completed by cabin crew employees who resigned
from their role within a low cost airline during the period 2003 - 2015.
The researcher used quantitative research methods and statistical analysis to fulfil the
goal of this dissertation. The data collected from the resignation forms was analysed
using Excel and a statistical package for the social sciences software (SPSS). Aliaga
and Gunderson (2002, p.7) define that “Quantitative research is explaining phenomena
by collecting numerical data that are analysed using mathematically based methods (in
particular statistics)”.
1.3 Structure
This research paper is divided into 7 chapters: The introduction that explains why the
researcher is completing this study, the aims and objectives of the study, a literature
review of scholarly articles, books and other resources on the subject and an outline of
the research methodology that has been applied. The researcher will then outline the
data findings and a discussion regarding what the findings mean. Finally the researcher
will provide a conclusion and will outline their personal learning.

11
Chapter 2 - Literature Review
2.0 Scope of Literature Review
For the purposes of this research study and to examine if there are any significant
differences between the reasons cited by cabin crew employees for leaving their
employment within the first 12 months compared to employees in other industries, this
chapter will review the academic literature available on the subject. The researcher will
define the meaning of staff turnover and review the history of the employee / employer
relationship, general factors & theories in relation to why employees choose to leave,
methods used to capture reasons for leaving, the effects of and costs associated with
staff turnover and finally retention policies.
2.1 Employee Turnover
Employee Turnover has been comprehensively studied over the years (Shaw et al,
1998), Donnolly & Quirin (2006) noted that earlier researchers of this subject
recognized that there are many different reasons why employees decide to stay or leave.
Earlier researchers included; March and Simon, 1958; Mobley, 1977; Mitchell &
Beach, 1979 and Hom, Caranikas-Walker, Prussia, & Griffeth, 1992. According to the
CIPD (2014) employee turnover refers to the proportion of employees that leave an
organization during a set period of time expressed as a percentage of the total
workforce. Other methods used by organizations to measure staff turnover rates are the
stability index, survival rate, half-life index and the leavers’ length of service analysis,
all of which review statistics regarding length of service. The choice of measurement
depends on the organization, but the most popular and familiar is the conventional
‘employee turnover index’ as it could be deemed as the method that provides a basis
for assessing future levels of supply and takes into account wastage. Survival rate
measurements are useful also for identifying recruitment and retention problems. This
information can be used to review retention strategies if required by employers
(Armstrong & Taylor 2014).
12
2.2 History of employer / employee relationship.
In order to understand the subject matter in more detail and to review the reasons why
employees choose to leave their employment the researcher has reviewed the history
behind the employer / employee relationship as it has evolved over time.
According to the CIPD (2015) around the end of the 19th Century welfare officers were
introduced into organizations concerned mainly with the moral protection of women
and children and the need for industrial output. Between the 1960s and 70s significant
developments in personnel techniques developed with the use of theories from the
social sciences regarding motivation and specialism in the areas like reward and
resourcing. Researchers who studied this subject such as Barnard (1938) argue that an
employee will continue to work depending on adequate rewards which is in line with
Levinson et al (1962) who outlines that if an organization fulfils the needs of it’s
employees it can expect that staff will be more motivated to meet the expectations of
the employer. More recently the work of Donnolly & Quirin (2006) reviewing Lee &
Mitchell’s 1994 “Unfolding model of voluntary turnover” concludes that there is a
deeper decision making process and outlines theories behind these findings. The
researcher will cover this subject matter in more detail in the following section.
2.3 Factors that affect Staff Turnover.
To understand the reasons why employees leave their employment early it is important
to review the literature available and the findings of previous studies in relation to this
area. According to IDS (2005) one in eight of all new recruits leave within the first six
months and many researchers have tried to determine the factors associated with why
employees decide to quit. In Donnolly & Quirin’s (2006) review of Lee & Mitchell’s
“Unfolding model of voluntary turnover” they confirm that push & pull theories exist
and that a decision making process is used by employees prior to deciding to quit.
Employees can experience pull factors which could include one or more of the
following; more attractive job offer, career advancement, more challenging and
interesting work, opportunity for better work / life balance or the offer of better benefits
(Mackay (2007) and Armstrong & Taylor (2014). Whilst others can experience push
factors, identified mainly as internal factors such as; low morale, unfair treatment, lack

13
of job security, poor relationship with colleagues, bullying, harassment or experiencing
a feeling of not being able to cope with the job.
A recent CIPD study identified that employee expectations not being met was a key
reason why employees quit their contract (CIPD 2015). While other evidence suggests
that bad recruitment decisions and poorly designed and executed induction processes
can contribute to staff turnover (IDS, 2005).
Another concept known as “Image Theory” describes the analysis and decision making
process that individuals use to decide whether to leave or stay with their employer
(Donnolly & Quirin 2006). In their study Donnolly & Quirin outlined that ‘Shocks”
can be a major contributing factor to employees contemplating quitting or deciding to
review their current employment arrangement. ‘Shocks’ can be initiated by events that
can either be good, bad or neutral and can stem from circumstances either within or
outside the organization. A “Shock” could be triggered by the result of a change in
circumstances, an illness with a family member, the transfer of a spouse or partner to
another location, meeting a spouse in a different location, family status, wanting to
return to study or the need to return home having worked abroad. Chen (2012) argues
that work-family conflict in the airline profession is greater than in some other
occupations and that there are similarities between this profession and nursing due to
the long working hours and the stressful nature of the position.
A breach of the psychological contract could also cause a ‘Shock”. Argyris (1960), one
of the first recorded people to use the term psychological contract argued that when an
understanding exists between a group of employees and their foreman, higher
productivity would result. Rousseau (1989) argued that the psychological contract was
the mutual obligations that existed between an individual and their employer through
promises made to each other and the fulfilment of these promises by both parties. More
recently Kroon (2013) agrees and argues that there is an obligation on employers to
fulfil the needs of psychological contracts by providing employees with such
opportunities as career development, interesting work, good social atmosphere,
organizational policies and job security and that failure to meet the obligations of the
psychological contract will result in a push factor.

14
While low cost models dominate the market evidence would suggest that their cost
saving practices could provide an excellent training ground for cabin crew who can
very quickly get hired by airlines that offer better conditions and salaries. The low cost
models recruit from 18 years of age, such as Easyjet (2015) and Ryanair
(www.ryanair.com) rather than 21 and 23 years of age in comparison to the larger long
haul airlines such as Emirates (www.emirates.com). Emirates, Etihad and Qatar offer
benefits such as paid accommodation and additional paid holidays along with other
“Perks” on these grounds it could be argued that experienced crew from low cost
business models could experience a pull factor from these airlines.
As the researcher is analysing data gathered over the period 2003 – 2015 the researcher
decided to review findings and trends in relation to the reasons why employees
voluntarily leave their employment from data captured in surveys during this period.
Research findings from an earlier CIPD (2005) study depict “promotion outside the
organization” as the number one reason cited by leavers. Other reasons identified are;
“lack of career development”, “change of career” and “level of pay”. More recent
studies by CIPD (2013) show that while voluntary employee turnover has reduced over
the last decade with a significant reduction around 2008 due to recessionary times, the
top reasons why employees leave still include; the attraction of a new job, a lack of
career opportunity, better pay or dissatisfaction in their present position. The labour
market is improving and employers are becoming more focused on retention, although
views with regard to the effectiveness of increasing pay as a solution to retain staff is
mixed. Available evidence seems to suggest non-financial and intangible rewards like
recognition, praise and awards are becoming more important (CIPD, 2015b). CIPD
(2013) argue that an effective retention strategy is about finding the right candidates in
the first instance and that this can be done through improved selection processes as well
as setting the right expectations from the beginning.
Table 1 below outlines all the reasons identified by CIPD (2005) by %.

15
Reasons identified by CIPD (2009) by %
Table 1 – CIPD (2009)
An empirical study by Hochschild (1983) of air-stewardesses argues that emotion
management skills have become a commodity referred to as ‘emotional labour’ and
highlights the difficulties experienced by these employees as they work with
“demanding publics”, thirty two years on and with dramatic changes in the airline
industry there is no doubt that the role of cabin crew has become more demanding and
far less glamorous than it once was. Growth in passenger numbers and quicker
turnaround times would support the argument that “demanding publics” may have
become even more demanding.
Along similar lines Boyd (2001) outlines that big changes have taken place to the
profession of cabin crew with the effect of deregulation of the airline industry and
argues that these changes have encouraged airlines to demand improved service quality
and higher productivity from staff whilst at the same time cutting costs in what she
explains may cause a conflict between cost and quality, and cost and commitment
where employees have less job security, receive lower rates of pay, work longer hours
and are still expected to provide customers with a high quality service.
Boyd (2001) draws attention to Easyjet and BA's quick aircraft turnaround times and
argues that according to respondents the time pressures involved in turning the aircraft
around so quickly may mean that for short-haul crew who operate multiple sectors in a
single day there is very little or no time at all to eat, drink or rest between sectors. Boyd
(2001) went on to argue that the pressure to carry out as many duties as possible both
during flights and while on the ground arguably makes cabin crew's occupation one of
the most intensive and potentially stressful jobs in the service sector. Along similar

16
lines findings from a more recent American study produced evidence that there
was a greater prevalence of certain health conditions experienced by flight
attendants than the general population. McNeely et al., argues that the airline
industry has experienced dramatic changes with increased passenger numbers,
security and longer flight times and with quicker turnaround times between
flights more physical demands are placed on cabin crew (McNeely et al. 2014).
Chen (2012) also makes reference to cabin crew who report experiencing burnout that
he argues can also have adverse effects on their health. Whilst they argue along similar
lines Boyd (2001) maintains that these conditions are not a problem for recruitment
however, as the attraction and popularity of the position and the current economic
environment assures a steady supply of applicants who still apply for the role.
2.4 Background to low Cost Aviation Business Models
As mentioned previously according to Box & Byus (2009) Southwest Airline
introduced a new aviation model in the US in the 1970s arguing that the model brought
massive changes to the air travel industry and was in line with Porter’s theory in relation
to the three major strategies companies should adopt to gain competitive advantage -
cost, differentiation and introduction of a unique dimension. They argue that
Southwest’s “Cattle Call” procedure of boarding passengers in batches of 30 onto the
aircraft are to ensure adherence to quick turnaround times as Southwest had recognized
that airlines only make profits when flying. They outline that to cut costs the low cost
airline model dramatically decreased pay and benefits.
Box & Byus (2009) suggested that many tried to imitate the model but none were as
successful as Ryanair although whilst their business strategy is to secure competitive
advantage within their industry by keeping costs as low as possible, evidence confirms
that their low cost model does not apply to the area of safety which is seen as paramount
(Ryanair, 2015). Ryanair argue that they have invested heavily in this area through
improving training for pilots and by installing what they call the "Formula 1" telemetry
on all its aircraft”, Mulligan (2013) outlines that this equipment professionally known
as an ‘Operational Flight Data Monitoring’ system allows Ryanair to track height,
speed travelled and compliance with their approved flight profiles as the system
provides a confidential report at the end of each flight to Head Office for analysis. As
17
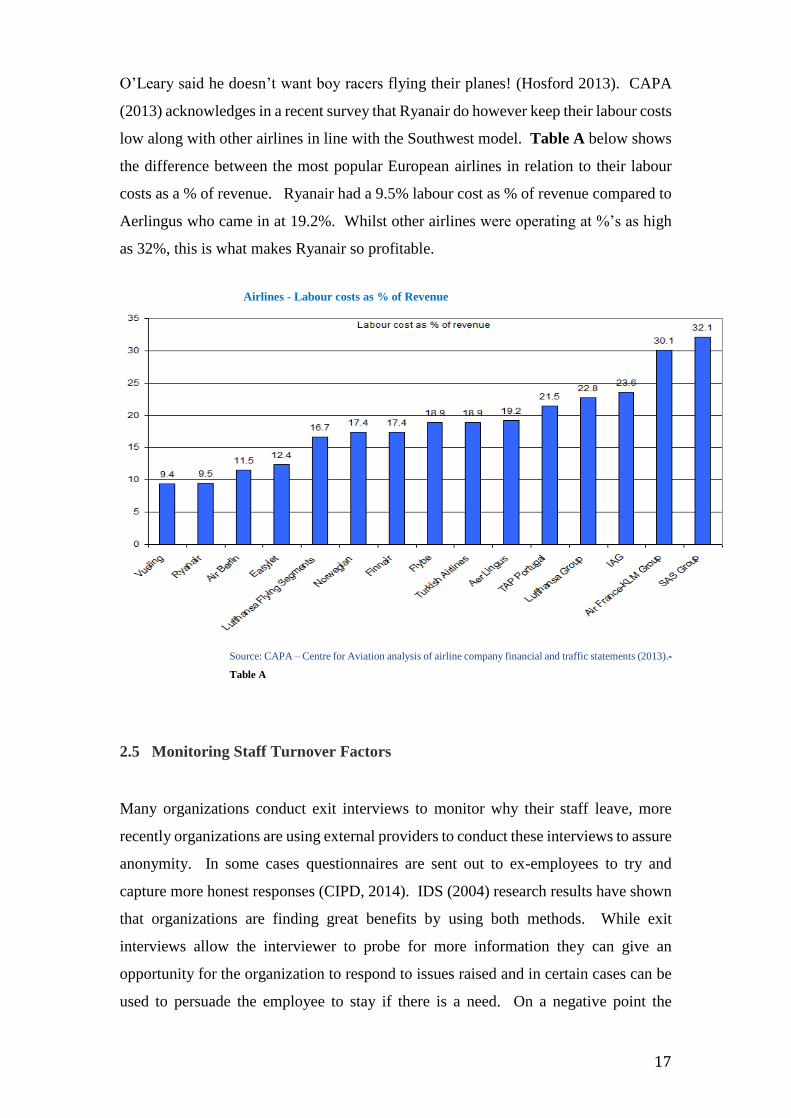
O’Leary said he doesn’t want boy racers flying their planes! (Hosford 2013). CAPA
(2013) acknowledges in a recent survey that Ryanair do however keep their labour costs
low along with other airlines in line with the Southwest model. Table A below shows
the difference between the most popular European airlines in relation to their labour
costs as a % of revenue. Ryanair had a 9.5% labour cost as % of revenue compared to
Aerlingus who came in at 19.2%. Whilst other airlines were operating at %’s as high
as 32%, this is what makes Ryanair so profitable.
Airlines - Labour costs as % of Revenue
Source: CAPA – Centre for Aviation analysis of airline company financial and traffic statements (2013).-
Table A
2.5 Monitoring Staff Turnover Factors
Many organizations conduct exit interviews to monitor why their staff leave, more
recently organizations are using external providers to conduct these interviews to assure
anonymity. In some cases questionnaires are sent out to ex-employees to try and
capture more honest responses (CIPD, 2014). IDS (2004) research results have shown
that organizations are finding great benefits by using both methods. While exit
interviews allow the interviewer to probe for more information they can give an
opportunity for the organization to respond to issues raised and in certain cases can be
used to persuade the employee to stay if there is a need. On a negative point the

18
literature shows a consensus with regard to the argument that employees may not
always be honest in relation to the reasons they provide for fear that their honesty may
have a negative effect on their future reference (CIPD, 2014; Sweeney, 2002; Higgins,
1997). CIPD (2014) noted that some organizations prefer to leave the exit interview
until a few months after the employee has left to allow more time for reflection,
however difficulty in reaching the ex-employee may need to be weighed up. On the
other hand results show that questionnaires have limitations regarding the level of detail
that can be gathered in comparison interviews require time and manpower which may
not always be available (IDS, 2004). Armstrong & Taylor (2014) criticize exit
interviews and suggest that more emphasis should be placed on the results of attitude
or opinion surveys to identify areas of dissatisfaction so that retention plans can be put
in place to retain employees prior to their decision to resign.
2.6 Effects of Staff Turnover on Business.
Seminal works such as Lowe - Holmes (1971) argue that high labour turnover amongst
cabin crew in the airline business is expensive and that it was necessary to investigate
whether factors available at the selection process could assist in the prediction and
elimination of early leavers. He argues that selection of candidates based on personality
and aptitude was more important than level of skills as employees could be trained to
an acceptable standard which would keep them in the job over a longer period of time.
Regarding costs MacKay (2007) outlines that figures produced by CIPD estimate that
the average replacement cost for an employee is approximately £3,950 - £4,625,
measurement of costs is very useful when putting a business case together for strategic
plans to reduce employee turnover.
Factors that should normally be taken into consideration are; direct recruitment costs,
advertising, interviewing, testing, induction costs, training time, administration of new
set ups / leavers and loss of output in relation to inexperience of new recruit.
With regard to the loss of cabin crew, it could be argued that losing experienced cabin
crew would have a negative effect on sales on-board and this could affect revenue and
profits for the organization.
19
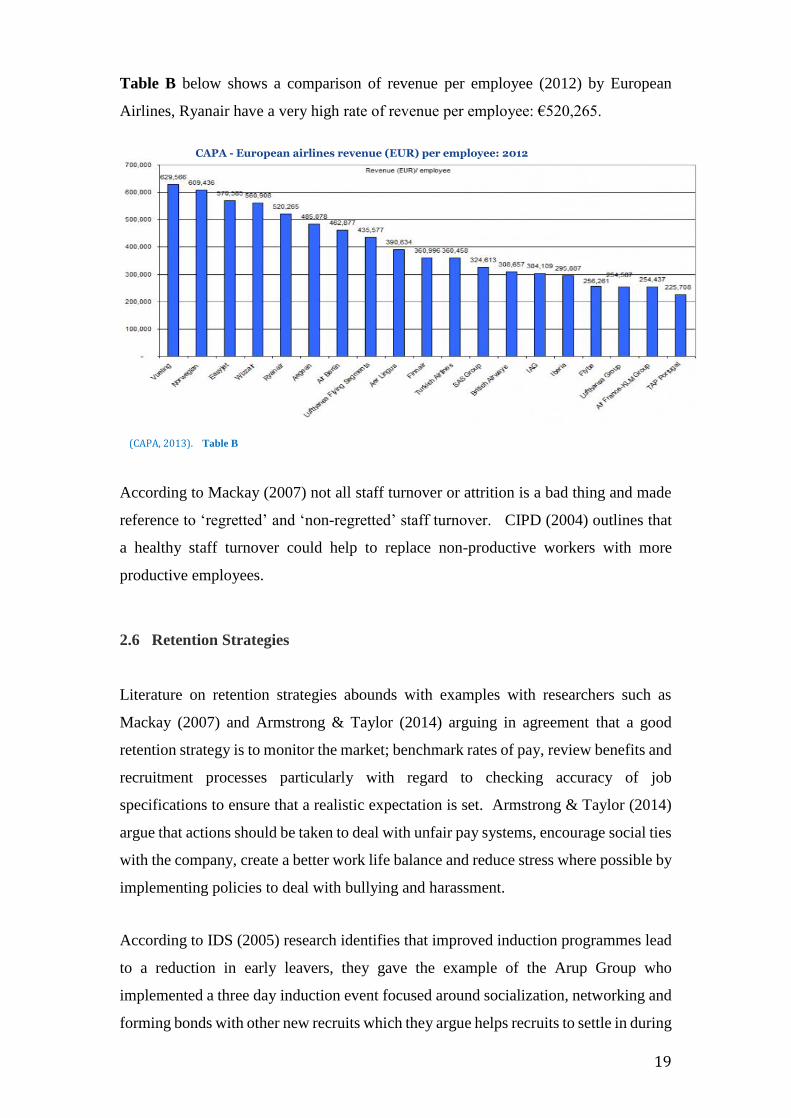
Table B below shows a comparison of revenue per employee (2012) by European
Airlines, Ryanair have a very high rate of revenue per employee: €520,265.
CAPA - European airlines revenue (EUR) per employee: 2012
(CAPA, 2013). Table B
According to Mackay (2007) not all staff turnover or attrition is a bad thing and made
reference to ‘regretted’ and ‘non-regretted’ staff turnover. CIPD (2004) outlines that
a healthy staff turnover could help to replace non-productive workers with more
productive employees.
2.6 Retention Strategies
Literature on retention strategies abounds with examples with researchers such as
Mackay (2007) and Armstrong & Taylor (2014) arguing in agreement that a good
retention strategy is to monitor the market; benchmark rates of pay, review benefits and
recruitment processes particularly with regard to checking accuracy of job
specifications to ensure that a realistic expectation is set. Armstrong & Taylor (2014)
argue that actions should be taken to deal with unfair pay systems, encourage social ties
with the company, create a better work life balance and reduce stress where possible by
implementing policies to deal with bullying and harassment.
According to IDS (2005) research identifies that improved induction programmes lead
to a reduction in early leavers, they gave the example of the Arup Group who
implemented a three day induction event focused around socialization, networking and
forming bonds with other new recruits which they argue helps recruits to settle in during

20
the first few months but also helps to establish supports throughout their entire career
with the organization. Other researchers who have studied this area include Mooney
(1999) and Pennington (2003) who argue that employers should also focus on employee
development, career progression, reviews, rewards, clear vision, improving
communications and establishing a culture of coaching.
2.7 Conclusion
In summary there have been many changes over the years in relation to work and work
practices in line with how industry and business has evolved particularly in the aviation
sector. A lot of changes have taken place as a direct result of increased competition
with the introduction of low cost business models. Airlines who have successfully
imitated the Southwest Airline model have brought a lot of competition to this industry
in Europe (Box & Byus 2009). The highly competitive environment within the aviation
industry has dramatically changed the role of cabin crew, their profession was
previously seen as a glamorous career choice but it is now perceived as a more service
orientated role in the ‘no frills’ low cost model (Hochschild 1983).
Research is suggesting that employees experience push and pull factors that cause both
voluntary and involuntary turnover. The decision to quit is a process of thinking that
can be triggered by a particular happening that can good, bad or neutral and this then
leads to an evaluation by the employee to assess their current situation and contemplate
the decision to quit (Donnelly, D. P. & Quirin, J, 2006).
Some studies suggest that carrying out anonymous exit interviews, or conducting exit
interviews by a third party may reveal more truthful and factual results (Higgins 1997).
It has also been highlighted that conducting exit interviews approximately three months
after an employee has left may reap more factual results as the employee will not be as
fearful of being completely honest with their feedback, however the negative aspect to
this method is that there may be a low return rate on questionnaires or it may be difficult
to contact departed employees (IDS 2004).
Staff turnover can be costly to an organization, not only with regard to backfilling,
recruitment, training and induction costs but also in relation to the effect it has on

21
existing employees and the operational side of the business. (MacKay 2007 and CIPD
2008).
There are a number of preventative measures that can be taken to reduce staff turnover
but it should be noted that not all turnover is bad and that some industries and
organizations benefit from a certain amount of staff turnover particularly in relation to
seasonal businesses (MacKay 2007).
The next chapter will outline the research methodology used to complete this study.
Chapter 3 – Research Methodology 3.0 Research Methodology Introduction
As discussed in the preceding literature review there are internal and external factors
that contribute to reasons cited by leavers during the first year of service. The

22
researcher could not find any studies that specifically explored reasons cited within the
context of the low cost airline industry. This chapter outlines the process used to assess
the factors contributing to reasons cited by this category of workers. Firstly, the
researcher will explain the research aims and objectives and continue to outline the
research design followed by the research limitations; the process of data collection; the
method of data analysis and finally ethical standards and data management.
3.1 Research Aim and Objectives
The overall objective of this dissertation is to investigate the reasons cited on the
resignation forms collected from low cost airline cabin crew employees who left within
the 1st year of service and identify the most and least significant reasons cited. The
researcher will then use this data to determine whether significant differences or
similarities exist between the findings of this study against general reasons cited for
resignation in the literature review and previous studies. While analysing the data the
study will review if there are any significant differences that can be attributed to gender,
age or whether an employee was working in a more expensive airport base location.
The study attempts to answer the following research questions: In terms of numbers,
what reasons were cited most? Do significant differences exist between the findings of
this study and the general reasons cited in the literature review and previous studies?
Do factors such as gender, age and airport base location make any significant
differences to the reasons cited? Can low cost model businesses make changes to
reduce early resignations?
3.2 Research Design
A quantitative design was chosen and pre-existing data from over 900 resignation forms
have been analysed. Tests of proportions have been applied to check if there are any
significant differences in relation to gender, age and airport base location. The
researcher reviewed alternative methodologies before arriving at a decision on the
methodological stance.

23
According to Quinlan (2011) there are two approaches to data analysis, quantitative
data and qualitative data. Quantitative data analysis uses statistical methods of
analysing numerical data whilst qualitative is non-numerical and can be analysed in a
number of ways including content, textually, discursively, thematically or semiotically.
For the purposes of this research assignment the researcher chose to use quantitative
data analysis having reviewed the literature and decided on a methodological stance.
Saunders et al (2009) argues that the methodological stance asserts how a researcher
views the world and what their assumptions and beliefs are concerning their existence.
Two philosophical concepts must be considered to determine the methodological stance
of the researcher, “epistemology and ontology”. Epistemology relates to the study of
knowledge and it’s limitations and how the knowledge is interpreted and generated and
whether it is valid or not (Bryman and Bell, 2011). According to Malhotra and Birks
(2007) paradigms of positivism and interpretivism are associated with epistemology
and the paradigm usually determines which research technique is adopted by the
researcher. According to Saunders et al (2009) ontology is a branch of philosophy
which studies reality and dictates how researchers approach different phenomena.
Positivism suggests that human beings, their actions and institutions can be studied and
it is believed that researchers that embrace positivism believe that reality is “out there”
waiting to be identified (Malhotra and Birks, 2007).
A positivist approach focuses on research that involves scientific experimentation and
Addis and Podesta (2005) argue that such an approach reduces participants of the
research study to numbers. Saunders, et al (2009) on the other hand outlines that
interpretivism is a perspective that uses a subjective approach suggesting that no
independent objective reality exists; an interpretivist researcher does not set out to test
hypotheses. An objectivist is likely to prefer quantitative research and a subjectivist
qualitative, the difference being that quantitative employs measurement whilst
qualitative does not. Some theorists argue that sticking to one paradigm too rigidly is
not the best way but rather the best findings come from selecting the method that is
most relevant to the research problem. Some authors suggest using multiple approaches
(Malhotra and Birks, 2007).
The researcher has decided that an interpretivist approach in this research project would
not be appropriate but rather a positivist approach has been deemed as the better choice
based on the fact that this research project involves scientific experimentation relating

24
to the number of times a reason has been cited so that it can be compared to previous
research findings.
3.3 Research Limitations
There are potential limitations with the method selected including the inability of
participants to be probed or questioned in more detail in relation to the reasons why
they resigned. Another potential limitation is the inability to be sure that an honest
reason was cited at that time of resignation and the concept that capturing the reason
after they had left might have resulted in more reliable data being captured. Another
limitation is the word count of this dissertation and the time frame available. Using
secondary data was also another limitation - further research should aim to acquire
primary data.
3.4 Data Collection
To enable this study to be a viable research project, the researcher initially sought
permission to carry out a survey of recent leavers from a low cost airline for data
collection purposes but this request was not possible. The researcher needed to look at
alternative methods of data collection; it was established that the organization already
had a data capturing process in place in the form of resignation forms that were
completed by every member of staff that voluntarily resigned.
The researcher requested access to the resignation forms for the years 2003 to 2015,
data from a sample of 2071 forms was received (n = 2071). 859 were excluded from
this analysis as they resigned to pursue a permanent contract with the client airline, so
were not deemed as actual resignations for participation in this study. 293 employees
did not cite any reason on their resignation form and these were also excluded from the
study. In total, a sample size of 919 (n = 919) remained.
Each cabin crew employee had completed the standard resignation forms recording;
employee number, name, date, finish date and reason for leaving. This information was
then logged into an employee database and through it’s reporting function enabled the

25
HR department to produce a report that included additional information such as; date
of birth, start date and airport base location.
The researcher discussed this opportunity regarding access to the resignation data with
the Course Director at The National College of Ireland (Des Gargan) and received
permission to use this data as the size and detail of the data was acceptable as
“secondary desk research”. It was decided that the opportunity to have access to and
receive permission to use such a large data set collected over such a long period of time
was too good an opportunity to ignore.
Quinlan (2011) outlines that there are many other methods used to gather data,
methodologies and fundamental philosophies; the diagram below outlines these – The
methodological pyramid; (Quinlan, 2011, p50).
3.4.1 Secondary Source Data Quinlan (2011) argues that secondary source data is second hand material. In the case
of the data being used in this research study it was gathered through compulsory
resignation forms that were completed by each voluntary leaver at the point of
resignation; this information was then recorded exactly as provided on the form into
the employee database. The organization concerned has advised that the data is valid,
credible and justifiable.
Secondary data does not provide original information or evidence but rather it refers to
original information or evidence published in primary sources. Taking this into

26
account the data that the researcher is using although not collected directly by the
researcher was collected directly from the leaver and recorded exactly as documented
on the resignation form, therefore it could be considered or argued that it is primary
data rather than secondary data.
3.4.2 Primary Source Data According to Quinlan (2011) primary sources of data are sources that have been created
or directly gathered by the researcher and can also be called an original source. Primary
data must be original accounts of the phenomenon.
3.4.3 Using Secondary Data Appropriately There was a vast amount of data available to use over a large period of time from 2003
to 2015. Therefore for the purposes of this research assignment, the researcher used
the data captured from employees who left within the first year of service. In selecting
this subset of data from the larger data set, the researcher was careful not to render the
data invalid in any way and that the logic of the data held. In total the population size
was 919.
3.5 Method of Data Analysis
Kent (2007) outlines that the process of inputting data collected into a data matrix or
tables to produce information that can identify variations and patterns is described as
data analysis. There are a number of different software packages that can be used to
statistically analyse data, one of these is SPSS, (Statistical Package for the Social
Sciences) which is a very useful software package. For qualitative data analysis there
have been recently developed packages such as Atlas ti, Nvivo and NUDIST.
For the purposes of this research study the researcher sought to analyse the data using
Excel and the SPSS software package due to the large quantity of data being analysed.
3.5.1 Preparation of the Data In order to carry out quantitative research study the data was prepared. The reasons
provided by the leavers on the resignation forms differed from very descriptive to two
words e.g. “new job” therefore, for more descriptive sentences it was necessary to
categorise the reasons provided so that a comprehensive quantitative review could take
place. In some cases for finer detail the researcher sub-categorised more specific detail
following the findings from the literature review and having reviewed the detail in the

27
resignation forms. This preparation took numerous hours of coding. The coding and
categorisation was used to determine themes and measure the volume of reasons cited.
The researcher used bar charts, pie charts and tables following an analysis in Excel to
show the different variables and to describe the findings and trends for ease of
interpretation of the research findings.
(See Appendix 2, 3 and 4)
3.5.2 Data was categorised into the following Variables; o Push, Pull & Personal Reasons (as identified by the Literature Review)
o Age Groups – into categories calculated by date of birth.
o Airport Bases – by most expensive and less expensive to live.
o Length of days service 3, 6, 9, 12 months.
o Gender
3.6 Ethical Standards and Data Management
Ethical approval and permission was sought and received from the owner of the data.
Permission was granted from the director of the organization following a written
request and presentation of an outline of the research topic by the researcher. The data
was provided with all identifying information removed to ensure confidentiality of
employees.
During the course of this research assignment, great care has been taken to protect the
data and to ensure the confidentiality of the people who completed the resignation
forms. The data has been password protected. The next chapter will outline the
research findings following an analytical review.
Chapter 4 – Data Findings
4.1 Introduction to Research Findings
In this section the researcher presents the results of this study into the characteristics
associated with the reasons behind retention challenges within a low cost airline. Firstly
the researcher will present an overview of the population sample under consideration
and then the findings from the research will be presented in a number of well-
recognized categories. For example: reasons cited for resignation; the influences of

28
career progression; family characteristics and constraints; overall job satisfaction;
followed by health reasons; penultimately the researcher presents the findings with
respect to the effects of intention to travel or return to study.
The study will show that whilst the reasons cited by cabin crew in this study for leaving
are similar to the reasons identified in previous studies, there are some significant
differences for example; reasons cited that were unique to the airline industry were “No
Transfer Granted” and “Airport ID Issues”. Some reasons cited were similar but were
more commonly cited in this study than in previous studies for example “Family
Reasons” and “Employees Returning to Study or Travel”. Further analysis depicted
“Expectation Not Met”, “Not Liking the Job” and remarkably that 8% of cabin crew
cited “did not like flying”.
4.2 Study Demographics and Sample Characteristics.
As previously outlined a total sample size of 919 (n = 919) were included in this study.
With regard to these resignation forms they were completed by cabin crew ex-
employees who resigned within the first 12 months of joining the organization, 259
were males and 660 were females. The variables within the data captured included;
reason cited, age, gender, length of service and the location of the airport where the
cabin crew employees were based and working from. A quantitative analysis was
carried out to compare the findings with previous studies and tests of proportions were
applied to check if significant differences existed in relation to various hypothesis. The
results are as follows:
4.2.1 Top Reasons Cited for Resignation An examination of the top reasons cited for resignation are presented in Table 1 and
Figure 1 below. The first column in Table 1 depicts the reason category cited by the
employee resigning. The second and third columns depict the total number of
respondents falling into each category by % and number respectively. For example,
the sample data set in the first row contained 30% (n=237) which is the number of cabin
crew members who cited “Better Position / Career Change” as their reason for leaving.

29
Top Reasons Percent Count
Better Position / Career Change
30% 237
Family Reasons 21% 213
Did not like job 18% 156
Financial / Pay 13% 141
To Return to Study or Travel 6% 66
Health Reasons 8% 60
Airport ID / Transport Issues 2% 20
No Transfer Granted 2% 20
Going through Disciplinary Issues when resigned.
1% 6
100% 919 Table 1: Top Reasons
Figure 1 below depicts the results in bar chart format by %.
Figure 1: Top Reasons - Percentages
4.2.2 Better Position / Career Change A more in depth examination of the reason ‘Better Position / Career Change’ depicted
more detailed reasons which are outlined in Table 2 and Figure 3 below. With respect
to Table 2, the first column, line 2 depicts “New Job, the second and third columns
depict the total number of respondents falling into each sub category by % and number
respectively. For example, the sample data set in the second row contained 62%
(n=148) this is the number of cabin crew members who cited “New Job” as their reason
for leaving. Figure 3 depicts the result in pie chart format.
0% 5% 10% 15% 20% 25% 30% 35%
Better Position / Career Change
Family Reasons
Did not like job
Financial / Pay
To Return to Study or Travel
Health
Airport ID / Transport Issues
No Transfer Granted
Going through Disciplinary Issues…

30
Top Reasons Percentage Count
Better Position / Career Change 30% 237
New Job 62% 148
New Job with Another Airline 31% 74
Change of Career 5% 10
Pilot Training Position 2% 5
Table 2: Better Position / Career Change
Figure 3: Better Position / Career Change Chart
4.2.3 Family Reasons
Table 3 and Figure 4 below present a more detailed breakdown of specific reasons
within the ‘Family Reasons;’ category. With respect to Table 3, the first column, line
2 “Family Reasons - General” depicts that 51% didn’t provide a more in depth reason
while Line 3 depicts that 42% of this category cited ‘Returning Home for Family
Reasons”. The second and third columns depict the total number of respondents falling
into each sub category by % and number respectively. For example, the sample data
set in the second row contained 51% (n=101) this was the number of cabin crew
To take on a New Job , 62%
New Job with Another
Airline, 31%
To Change Career, 5%
Pilot Training, 2%

31
members who cited “Family Reasons ” as the explanation for leaving. Figure 4 depicts
the result in pie chart format.
Top Reasons Percentage Count
Family Reasons 21% 213
Family Reasons – General 51% 101
Returning Home for Family Reasons 42% 91
Moving Home to Partner / Spouse 2% 7
Children 2% 7
Marriage 2% 7
Table 3: Family Reasons
Figure 4: Family Reasons Chart
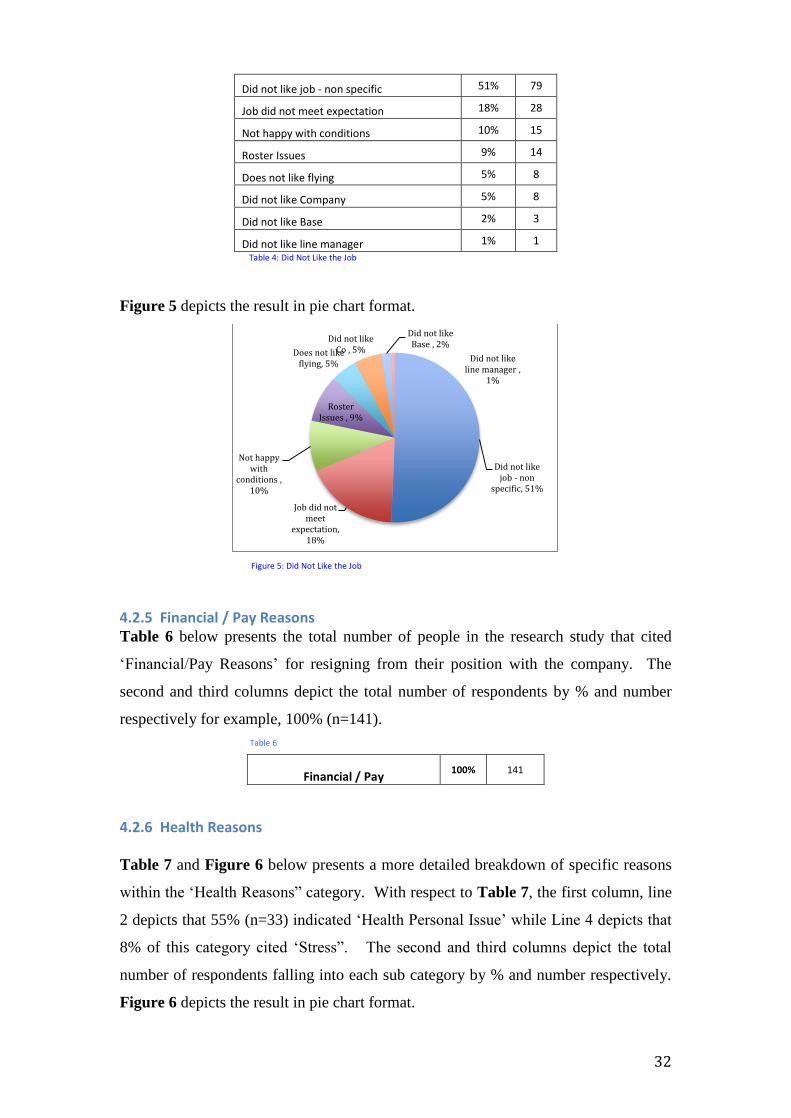
4.2.4 Did Not Like Job Table 4 and Figure 5 presents a detailed breakdown of specific reasons within the ‘Did
not like Job’ category. Table 4, first column, “Did not like job – non specific” line 2
depicts that 51% (n=79) didn’t provide a more in depth reason, line 3 depicts that 18%
of this category cited ‘Job did not meet expectation”. The second and third columns
depict the total number of respondents falling into each sub category by % and number
respectively.
Top Reasons Percentage Count
Did not like job 18% 156
Family Reasons - not
specified, 51%
Returning Home, 42%
Family Reasons, Moving
Country, 2%
Children, 2% Marriage, 2%
32
Did not like job - non specific 51% 79
Job did not meet expectation 18% 28
Not happy with conditions 10% 15
Roster Issues 9% 14
Does not like flying 5% 8
Did not like Company 5% 8
Did not like Base 2% 3
Did not like line manager 1% 1
Table 4: Did Not Like the Job
Figure 5 depicts the result in pie chart format.
Figure 5: Did Not Like the Job
4.2.5 Financial / Pay Reasons Table 6 below presents the total number of people in the research study that cited
‘Financial/Pay Reasons’ for resigning from their position with the company. The
second and third columns depict the total number of respondents by % and number
respectively for example, 100% (n=141).
Table 6
Financial / Pay 100% 141
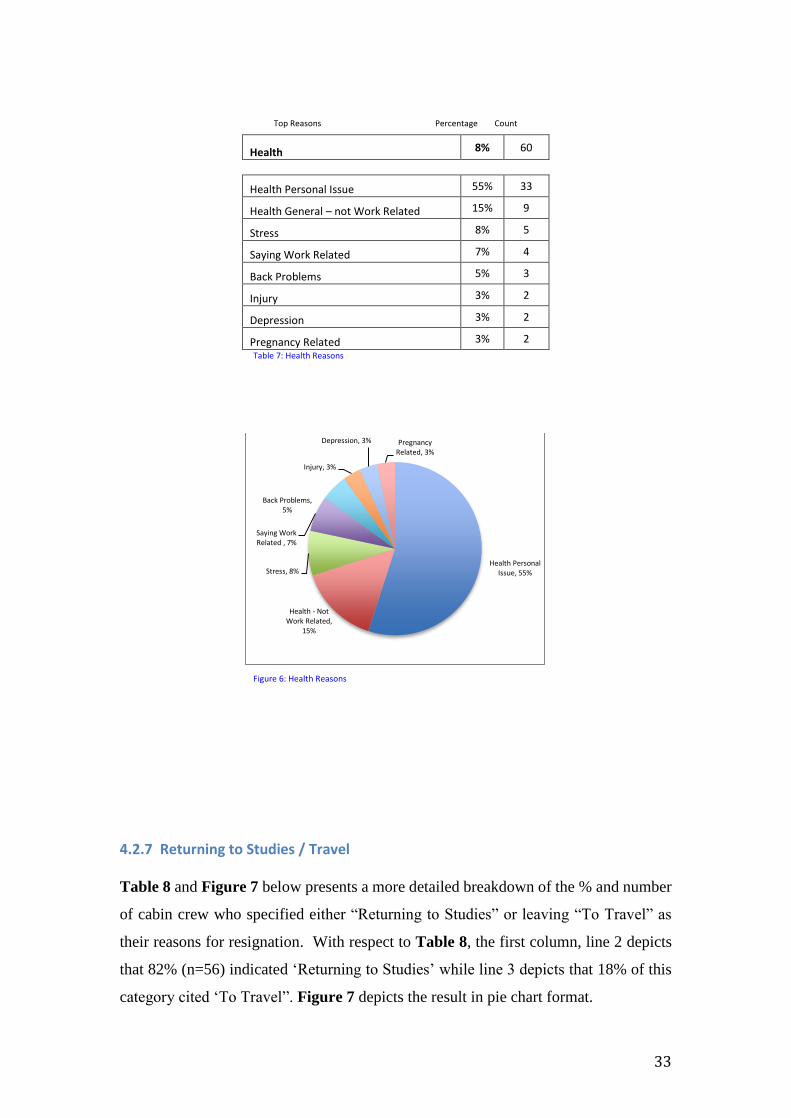
4.2.6 Health Reasons Table 7 and Figure 6 below presents a more detailed breakdown of specific reasons
within the ‘Health Reasons” category. With respect to Table 7, the first column, line
2 depicts that 55% (n=33) indicated ‘Health Personal Issue’ while Line 4 depicts that
8% of this category cited ‘Stress”. The second and third columns depict the total
number of respondents falling into each sub category by % and number respectively.
Figure 6 depicts the result in pie chart format.
Did not like job - non
specific, 51%
Job did not meet
expectation, 18%
Not happy with
conditions , 10%
Roster Issues , 9%
Does not like flying, 5%
Did not like Co , 5%
Did not like Base , 2%
Did not like line manager ,
1%
33
Top Reasons Percentage Count
Health 8% 60
Health Personal Issue 55% 33
Health General – not Work Related 15% 9
Stress 8% 5
Saying Work Related 7% 4
Back Problems 5% 3
Injury 3% 2
Depression 3% 2
Pregnancy Related 3% 2
Table 7: Health Reasons
Figure 6: Health Reasons
4.2.7 Returning to Studies / Travel Table 8 and Figure 7 below presents a more detailed breakdown of the % and number
of cabin crew who specified either “Returning to Studies” or leaving “To Travel” as
their reasons for resignation. With respect to Table 8, the first column, line 2 depicts
that 82% (n=56) indicated ‘Returning to Studies’ while line 3 depicts that 18% of this
category cited ‘To Travel”. Figure 7 depicts the result in pie chart format.
Health Personal Issue, 55%
Health - Not Work Related,
15%
Stress, 8%
Saying Work Related , 7%
Back Problems, 5%
Injury, 3%
Depression, 3% Pregnancy Related, 3%

34
Top Reasons Percentage Count
Returning to Studies / Travel 8% 66
Returning to Studies 82% 56
To Travel 18% 10
Table 8: Returning to Studies / Travel
Figure 7: Returning to Studies / Travel
4.2.8 Further Analysis
In this subsection the researcher presents the results of an analysis of the differences in
relation to gender, age, base location and cost of living in the airport base where the
employee was located with respect to each of the more detailed reasons cited for
resignation namely; “Not Liking Job”, “Family, Health”, “To Return to Study/ or
Travel”, “Financial/Pay”, “Returning Home”, “a New Job with another Airline”,
“Expectation Not Met” and “No Transfer Granted”. The associated proportions at each
Returning to Studies ,
82%
To Travel , 18%

35
group level are presented in Table 9 in Appendix 3 and Tests of Proportion
Templates in Appendix 4.
4.3.1 Differences with respect to gender and reason cited; “Not Liking Job”
In order to ascertain if the proportion of males citing “Not Liking Job” as a reason for
leaving is different to the proportion of females citing “Not Liking Job” as a reason for
leaving, a test of the difference between proportions was undertaken.
The results show that there is no significant difference between the proportion of males
(πm = 0.069) compared to females (πf = 0.09) citing the reason “Not Liking Job” as a
reason for leaving (Z = -1.12; P = 0.26)
4.3.2 Differences with respect to gender and citing of; “Family Reasons”
In order to ascertain if the proportion of females citing “Family Reasons” as a reason
for leaving is different to the proportion of males citing “Family Reasons” as a reason
for leaving, a test of the difference between proportions was undertaken.
The results show that there is no significant difference between the proportion of
females (πf = 0.10) compared to males (πm = 0.12) citing “Family Reasons” as a
reason for leaving (Z = 0.83; P = 0.41)
4.3.3 Differences with respect to gender and citing of; “Health Reason”
In order to ascertain if the proportion of females citing “Health Reason” as a reason for
leaving is different to the proportion of males citing “Health Reason” as a reason for
leaving, a test of the difference between proportions was undertaken.
The results show that there is a significant difference between the proportions of
females (πf = 0.08) who cited “Health Reason” compared to males (πm = 0.04) who
cited “Health Reason” (Z = 2.05; P = 0.04).

36
4.3.4 Differences with respect to gender and reason cited; “To Study / Travel”
In order to ascertain if the proportion of males citing “To Study / Travel” as a reason
for leaving is different to the proportion of females citing “To Study / Travel” as a
reason for leaving, a test of the difference between proportions was undertaken.
The results show that there is no significant difference observed between the
proportions of males (πm = 0.62) who cited “To Study / Travel” as a reason compared
to females (πf = 0.35) who cited “To Study / Travel” (Z = 1.65; P = 0.10) at the 5%
significant level, however there was a significant difference observed at the 10% level.
4.3.5 Differences with respect to age and reason cited; “To Return to Study”
In order to ascertain if the proportion of under 23 year olds citing “To Return to Study”
as a reason for leaving is different to the proportion of over 23 year olds citing “To
Return to Study” as a reason for leaving, a test of the difference between proportions
was undertaken.
The results show that there is no significant difference observed between the
proportions of under 23 year olds (π<23 = 0.62) who cited “To Return to Study” as a
reason compared to over 23 year olds (π >23= 0.35) who cited “To Return to Study” (Z
= 1.65; P = 0.10) at the 5% significant level, however there was a significant difference
observed at the 10% level.
4.3.6 Differences with respect to age and reason cited; “To Travel”
In order to ascertain if the proportion of under 23 year olds citing “To Travel” as a
reason for leaving is different to the proportion of over 23 year olds citing “To Travel”
as a reason for leaving, a test of the difference between proportions was undertaken.

37
The results show that there is no significant difference observed between the
proportions of under 23 year olds (π<23 = 0.62) who cited “To Study” as a reason
compared to over 23 year olds (πf = 0.35) who cited “To Study” (Z = 1.65; P = 0.10)
at the 5% significant level, however there was a significant difference observed at the
10% level.
4.3.7 Differences with respect to length of tenure and citing of; “Financial Reasons”
In order to ascertain if the proportion of crew with less than 3 months service citing
“Financial Reasons” as a reason for leaving is different to the proportion of crew with
more than 3 months service citing “Financial Reasons” as a reason for leaving, a test of
the difference between proportions was undertaken.
The results show that there is no significant difference observed between the proportion
of crew with less than 3 months service (π<3m = 0.62) who cited “Financial Reasons”
compared to crew with more than 3 months service (π>3m = 0.35) who cited “Financial
Reasons” (Z = 1.65; P = 0.10) at the 5% level, however, there was a significant
difference observed at the 10% level.
4.3.8 Differences with respect to crew located in more expensive countries and citing of; “Financial Reasons”
In order to ascertain if the proportion of crew living and working in more expensive
locations citing “Financial Reasons” as a reason for leaving is different to the
proportion of crew living in less expensive locations citing “Financial Reasons” as a
reason for leaving, a test of the difference between proportions was undertaken.
The results show that there is a significant difference between the proportions of crew
living and working in more expensive locations (πe = 0.08) who cited “Financial
Reasons” compared to crew living in less expensive bases (πn = 0.04) who cited
“Financial Reasons” (Z = 3.08; P < 0.00).

38
4.3.9 Differences with respect to gender and reason cited; “Returning Home”
In order to ascertain if the proportion of females citing “Returning Home” as a reason
for leaving is different to the proportion of males citing “Returning Home” as a reason
for leaving, a test of the difference between proportions was undertaken.
The results show that there is no significant difference observed between females (πf
= 0.06) who cited “Returning Home” compared to males (πm = 0.04) who cited
“Returning Home”. (Z = 1.65; P = 0.10), there was a significant difference observed at
the 10% level.
4.3.10 Differences with respect to age and reason cited; “New Job Another Airline”
In order to ascertain if the proportion of crew over 23 years of age citing “New Job
Another Airline” as a reason for leaving is different to the proportion of crew under 23
years of age citing “New Job Another Airline” as a reason for leaving, a test of the
difference between proportions was undertaken.
The result shows that there is a significant difference between the proportions of crew
over 23 years of age (π>23 = 0.10) who cited “New Job Another Airline” compared to
crew who were aged under 23 years of age (π<23 = 0.05) who cited “New Job Another
Airline” (Z = 2.48; P = 0.01).
4.3.11 Differences with respect to age and reason cited; “Expectation Not Met”
In order to ascertain if the proportion of crew under 23 years of age citing “Expectation
Not Met” as a reason for leaving is different to the proportion of crew over 23 years of
age citing “Expectation Not Met” as a reason for leaving, a test of the difference
between proportions was undertaken.
39
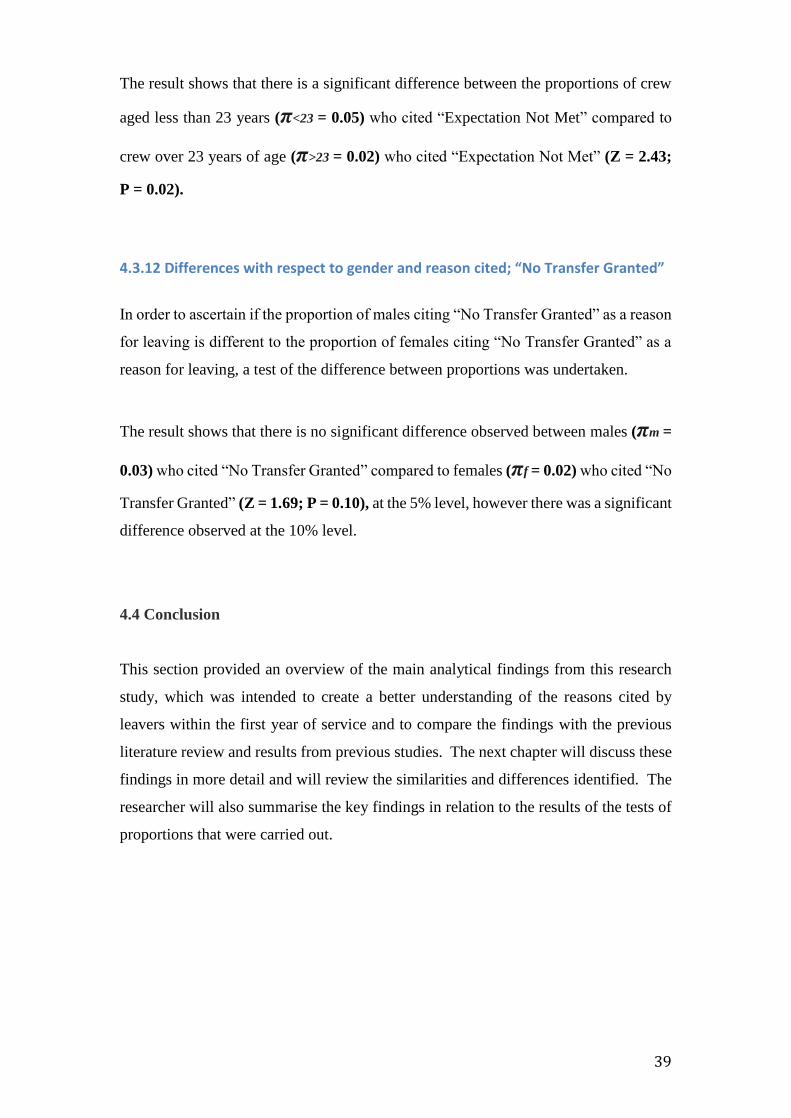
The result shows that there is a significant difference between the proportions of crew
aged less than 23 years (π<23 = 0.05) who cited “Expectation Not Met” compared to
crew over 23 years of age (π>23 = 0.02) who cited “Expectation Not Met” (Z = 2.43;
P = 0.02).
4.3.12 Differences with respect to gender and reason cited; “No Transfer Granted”
In order to ascertain if the proportion of males citing “No Transfer Granted” as a reason
for leaving is different to the proportion of females citing “No Transfer Granted” as a
reason for leaving, a test of the difference between proportions was undertaken.
The result shows that there is no significant difference observed between males (πm =
0.03) who cited “No Transfer Granted” compared to females (πf = 0.02) who cited “No
Transfer Granted” (Z = 1.69; P = 0.10), at the 5% level, however there was a significant
difference observed at the 10% level.
4.4 Conclusion
This section provided an overview of the main analytical findings from this research
study, which was intended to create a better understanding of the reasons cited by
leavers within the first year of service and to compare the findings with the previous
literature review and results from previous studies. The next chapter will discuss these
findings in more detail and will review the similarities and differences identified. The
researcher will also summarise the key findings in relation to the results of the tests of
proportions that were carried out.

40
Chapter 5 - Discussion
5.0 Introduction
The main objective of this research study is to investigate the reasons cited by low cost
airline cabin crew for resigning within the first year of service and to explore whether
significant differences exist between the reasons cited by cabin crew leavers for
resignation compared with findings identified in the literature review and previous
studies. This chapter sets out to discuss the findings in chapter four and to compare
them to the literature review and previous studies identified in chapter two. As the data
in the study was gathered over the period 2003 to 2015 the researcher decided to review
trends in relation to the reasons why employees voluntarily leave their employment
from other literature and results from studies during the same period. For example,
findings from a 2005 CIPD study identified “Promotion outside the organization” as
the number one reason cited by leavers. Other reasons cited were “lack of career
development”, “change of career” and “level of pay” (CIPD, 2005). More recent studies

41
by CIPD (2013) show that while voluntary employee turnover has reduced over the last
decade with a significant reduction around 2008 due to recessionary times, the top
reasons why employees leave continue to include; the attraction of a new job, a lack of
career opportunity, better pay and dissatisfaction in present position.
Whilst there is a vast range of literature and research available in relation to employee
turnover and retention issues in various industries over the years, the researcher
identified that there is a lack of research that specifically analyses the reasons cited by
employees within low cost business models. Whilst Boyd (2001) and Hochschild
(1983) completed studies in relation to the low cost airline industry and the effect on
the working life of cabin crew, they did not contribute to an analysis of specific
quantitative data relating to reasons cited by cabin crew for resignation. A further
review of existing literature failed to address the phenomenon that there are significant
differences in the reasons cited by cabin crew leavers during the 1st year of service
compared with leavers in other industries and the researcher would like to attempt to
fill this gap.
The researcher will present the findings from this research study and review the reasons
cited by cabin crew within the following categories; “Promotion Outside Organization
/ Career Change and Level of Pay”, “Health Reasons”, “Family Reasons / Children”,
“Job Dissatisfaction”, “Returning to Study or Travel”, “Airport ID / Transport Issues”,
“No Transfer Granted” and finally “Push and Pull Theories”.
5.0.1 Promotion Outside Organization / Career Change and Level of Pay Existing research (CIPD, 2005 & 2013) indicate that the top four reasons why
employees resign are; “Promotion outside the Organization”, “Lack of Career
Development”, “Change of Career” and “Level of Pay”. In comparison, the findings
of this research study showed similarities identifying the following reasons; “Better
Position / Career Change” (30%) and “Level of Pay” (13%).
The researcher’s findings are in line also with the consensus view of Mackay (2007);
Armstrong & Taylor (2014) and Mooney (1999) who lend support to the claim that
“Better Salary”, “Career Advancement” and “Better Job Security” are the top three
reasons why employees leave. Further investigation into more specific details provided

42
on the resignation forms in this study indicate that 31% of cabin crew who cited “New
Job” left to join another airline and a test of two proportions identified that over 23
years olds were proportionally more likely to cite “New Job with Another Airline” as
their reason for leaving. These findings present overwhelming evidence to suggest that
18 year old recruits use low cost airlines to gain valuable experience until they reach
the qualifying entry level age to apply to airlines such as Qatar, Etihad and Emirates
some of which are known for paying higher salaries, offering unlimited personal travel,
generous concessions for family and friends and in the case of Etihad, free
accommodation, uniforms, tax free salaries and other “Perks”
(https://www.etihad.com/en/careers/cabin/cabin-crew/). As a matter of interest it was
identified in the research study that 2% of cabin crew who resigned progressed to pilot
training.
In relation to cabin crew members who resigned citing pay, on further investigation a
test of proportions showed that there was a significant difference between the
proportions of cabin crew members who were located in expensive cities citing
“Financial Reasons” as a reason for leaving compared to the proportion of cabin crew
employees who were located in less expensive cities. For the purposes of this study the
researcher used a list from Eurostat (Europa.eu – Appendix 1) to determine which
countries had more expensive living costs. This finding would suggest that the cost of
living may have a negative impact in relation to retaining staff in more expensive airport
base locations, to put it into context a total 141 out of 919 resignations cited “Financial
Reasons”, 130 were based in countries which were ranked as having high living
expenses.
6.0.2 Health Reasons CIPD (2005) findings indicate that “Health Reasons” account for 13% of the
reasons why employees resigned in their study (a combination of “Ill Health”- 7%
and “Stress of Job” – 6%). The findings of this study depict that “Health Reasons”
account for 8% of reasons cited which is lower than CIPDs findings and presents
evidence that contradicts the arguments of Boyd (2001), Chen (2012) and
McNeely et al. (2014) who put forward the claim that cabin crew employees
experience a greater prevalence of health issues. A test of proportions of the
findings identified that female cabin crew employees are proportionally more

43
likely than male cabin crew to cite “Health Reasons” as their reason for
resignation. Whilst 70% of the cabin crew who cited “Health Reason” failed to
depict the exact type of health issue, of those who specified a reason 8% cited
stress, 7% cited work related health issue, 5% back problems and 3% cited
depression. These types of health conditions were identified in McNeely et al.’s
study (2014) in America which argued that a greater prevalence of certain health
conditions exists amongst flight attendants than the general population. It is
important to note that McNeely et al.’s findings were the result of an analysis on
an older population with a mean age of 47 years (McNeely et al. 2014). Based on
the findings of this study I put forward the argument that while the type of health issues
correspond with the findings of McNeely, the volume of health issues being cited in
this study did not appear to be higher than other industries and in the case of CIPD
(2005) findings, the results of this study depict lower levels of health related reasons,
therefore the evidence suggests that the role of cabin crew is not any more stressful than
other customer facing roles within other industries or indeed is not a driver of more
health related issues.
5.0.4 Family Reasons / Children CIPD (2005) results indicate that leaving to look after children and to look after family
members accounted for 15% of reasons cited in their study, broken down as follows;
“Leaving to have / look after children” (11%) and “Looking after other family
members” (4%).
Our research findings depict that a higher quantity of 21% of cabin crew leavers cited
“Family Reasons”. Whilst this is higher than the previous studies, it must be taken into
account that cabin crew employees in this study were more likely to be working abroad,
in airport bases away from home. A further analysis of this category found that 44%
who cited “Family Reasons” were returning to their home country to care for family or
to join a partner/spouse, 2% left to get married whilst a further 2% left to have children.
A test of proportions showed that there was no statistical significant difference between
the proportions of females citing “Family Reasons” as a reason for leaving compared
to the proportion of males citing this reason. However, a second test of proportions
signified that females in this study were proportionally more likely to cite “Returning

44
Home” as their reason for leaving compared to males observed at a 10% significant
level.
5.0.5 Job Dissatisfaction The findings of this study indicate that 18% of cabin crew who left within the first 12
months fell into categories in relation to “Job Dissatisfaction / Did not like job”. A
further analysis into the full reasons provided on the resignation forms outlined that
18% of the employees within this category cited “Job did not meet expectation”, 10%
were unhappy with conditions, 9% with roster issues, 5% cited that they did not like
the company, 2% did not like where they were based and remarkably 5% cited that they
did not like flying. The data appears to suggest the notion that candidates are entering
into this profession without fully researching what the role entails and the evidence
would lead the reseracher to be of the opinion that the candidates concerned may have
unrealistic expectations regarding this profession. The view that unrealistic
expectations need to be managed at the selection stage is shared with IDS (2005) who
argue that “bad” recruitment decisions and “poorly designed and executed” induction
processes could contribute to the reasons why employees leave organizations.
Donnelly & Quirin, (2006), argue that if an employee’s individual expectations are not
met they would be more likely to prematurely withdraw from their position.
A test of proportions identified that under 23 year olds in the study were significantly
more likely than over 23-year-olds to cite “Expectation Not Met” which could
strengthen the case in relation to airlines having an age limit of 21/23 years and over as
qualifying criteria for new applicants. These findings could foster debate regarding
whether 18-year-old recruits are mature enough to be able to carry out this role,
particularly in relation to possibly being placed abroad, this is an area that requires
further review and examination.
Another factor that was evident from the findings suggests that there was a small
proportion of disappointment and unrealistic expectations regarding the internal
transfer process, where cabin crew can apply to be redeployed to another. The reason
“No Transfer Granted” was cited by 2% of cabin crew who left within 1 year. This
finding suggests that an unrealistic expectation may exist in relation to how quickly a

45
new recruit can expect to qualify for a transfer. Again this finding lends support to the
argument of Donnelly & Quirin, (2006), who argue that the effects of not setting
realistic expectations or not meeting expectations will result in early leavers. To put
the data into context, a total of 20 employees out of 919 resignations cited “No Transfer
Granted” so it is not a massive problem but can be reviewed.
5.0.6 Return to Study
The findings identified that the reason “Return to Study/Travel” was cited by 6% of
cabin crew employees and a further test of proportions identified that cabin crew who
resigned to return to study or to travel were proportionally more likely to be under 23
years of age at a 10% significant level. This might convincingly contribute to the
argument in relation to whether or not it is a good idea to set the qualifying entry-level
age in low cost airlines at 18 years rather than 21/23 years as in other airlines. Other
reasons identified in the research study were “Airport ID /Transport Issues” at 2%, in
relation to this reason - the nature of the job and Airport Security regulations make this
a significantly different reason in comparison to other professions where police
clearance and secure environment identity cards are not required.
5.0.6 Push and Pull Theories Donnelly & Quirin (2006) outlined Lee & Mitchell’s 1994 theory that ‘push and pull”
factors exist in relation to why employees leave their employment. Push factors are
described as internal factors within the organization, whilst pull factors can be defined
as attractive job alternatives and market orientated factors. On the other hand, personal
reasons could also result in employees assessing their need to resign. The findings from
this study indicate that there were both push and pull factors involved in the reasons
cited by cabin crew employees. Push factors identified in this study are “No Transfer
Granted”, “Airport ID Issues” and “Job Dissatisfaction / Did not like job” and some
pull factors identified are “Better Position / Career Change” and “Return to
Study/Travel”. “Family Reasons” and “Health Reasons” depicted in the study are in
line with the personal reasons identified in the literature review. (Donnelly, D. P. &
Quirin, J, 2006)
46
The majority of reasons cited by cabin crew in this study were similar to the reasons
identified in the literature review and previous studies, for example “Level of Pay”,
“Promotion outside the Organization / Change of Career”, “Health Reasons” and
“Family Reasons”. Reasons identified that were significantly different are “Airport ID
/ Transport Issues”, “No Transfer Granted” and remarkably “Did not like flying”. In
light of the findings and on logical grounds there seems to be a compelling reason to
argue that a review of the screening process is required to ensure adequate probing and
communications exist in relation to clarifying and setting realistic expectations
regarding the duties and nature of this role as well as the reality of moving and working
abroad but to put it into context, the reasons associated with this category only applies
to approx. 140 employees out of the 919 that were reviewed.
5.1 Implications of the Research
This study aimed to check if the reasons cited by cabin crew employees working in an
organization with a low cost model were significantly different than those identified in
previous studies, whilst the researcher achieved this goal, the study highlighted that
there is more scope for further exploration of this phenomenon. For example another
aspect to review could be the level of education that recruits had and whether or not
recruiting based on personality and aptitude was a more efficient method of screening.
Further discussion and research is also recommended regarding the entry-level age in
low cost airlines and whether or not this is having an impact on early leavers. Another
area for further examination could be a review of whether being based in your home
country rather than an airport base abroad could reduce the number of early leavers and
also further discussion and research in relation to expectations set at the pre-recruitment
stage should be reviewed.
The results of this study have implications to different stakeholders particularly
recruiters and decision makers within the low cost airline industry. Continued
monitoring of reasons cited is advised so that on-going changes can be made to the
recruitment and pre-employment process going forward and results can be monitored

47
to check for progress.
5.2 Limitations of the research
As discussed in the research methodology in light of the findings from the literature
review it was difficult to know for certain that the reasons cited on the resignation forms
reviewed were completely honest. The timeframe involved and the word count were
another limitation. Another limitation was the lack of data relating to whether or not
the cabin crew employees in the study were living and working in their home country
or not to determine if it had any significant effect on their reason for resignation.
5.3 Future Recommendations
This study was conducted through a quantitative method; the researcher would
recommend that conducting a study with a mix of methods of both qualitative and
quantitative techniques should be considered in the future. By using both qualitative
and quantitative methods further research could gather a lot more information in
relation to this area.
I would recommend that going forward this organization should also use an online
questionnaire to capture data regarding reasons cited for leaving. A link could be sent
to the ex-employee with their final Payslip/P60. Results of this questionnaire could be
statistically monitored more efficiently going forward. Review and analysis regarding
the level of education of candidates and the qualifying entry level age could also be
reviewed as discussed previously along with communications regarding setting realistic
expectations.

48
Chapter 6 - Conclusion
The main goal of this research was to identify and examine the main reasons cited by
cabin crew employees who resigned from an airline with a low cost business model and
to compare the findings against previous studies in relation to why employees resign.
The researcher analysed the reasons cited on over 900 resignation forms and completed
a quantitative analysis where variables were numerically measured and examined and
tests of proportions conducted to identify if there were any significant differences
between age, gender and airport bases in countries with higher living expenses.
Based on the results of the study it emerged that there were similarities between the
reasons cited by the cabin crew employees in this research study compared with the
reasons cited in the literature review and previous studies such as “Promotion Outside
Organization”, “Change of Career” and “Pay”, other similarities exist in relation to
“Health Reasons” but our research findings returned a lower % rate in relation to
number of times “Health Reason” was cited in comparison with CIPD findings,
evidence from the study also contradicted the arguments of Boyd (2001), Chen
(2012) and McNeely et al. (2014) who put forward the claim that cabin crew
employees experience a greater prevalence of health issues due to the nature of
the role.

49
Some significantly different reasons were also identified for example the reason “No
Transfer” that relates to an employee’s unmet request for a transfer to another airport
base to work, normally to return to their home Country. The findings provide a
convincing argument that a small proportion of new recruits may have an unrealistic
expectation with regard to the duties and reality of this role and also in relation to what
it is like to live and work abroad, particularly under 23-year-olds in the study who were
proportionally more likely to cite “Expectation Not Met” as their reason for leaving,
they were also proportionally more likely to return to education. As outlined by
Donnelly & Quirin (2006) if an employee’s individual expectations are not met they
are more likely to prematurely withdraw from their position.
It was identified that female cabin crew employees are proportionally more likely to
cite “Health Reasons” than their male counterparts for leaving, whilst another test of
proportions determined that there was no significant difference between the proportion
of males compared to females in relation to the citation of “Family Reasons”. While
“Family Reasons” ranked higher in the top reasons for resignation in this study
compared with previous studies, the researcher determined that on logical grounds it
could be argued that due to cabin crew employees being based abroad at airport bases
it could be reasonable to expect that this reason would be higher in aviation.
Findings from the literature review show that the labour market is improving and
employers are becoming more focused on retention due to the increase in the strength
of labour markets as we recover from recessionary times. Although views on the
effectiveness of pay in retaining staff is mixed, it has been argued that there is a greater
role for non-financial and intangible rewards like recognition, praise and awards (CIPD,
2015b), these are areas that this organization can continue to address. Further research,
review and debate is advised by the researcher in relation to the entry level qualifying
age currently in place in low cost airlines for cabin crew applicants. Further review
would also be recommended in relation to managing and screening the expectations of
potential candidates at the recruitment stage although it was highlighted that this was
not a significant problem but none the less it is an area that could possibly be easy to
address. A final recommendation is for the organization to consider implementing
employee satisfaction surveys if they do not already have them, to obtain useful,
actionable results from current employees in an effort to reduce early leavers and
leavers in general.

50
Chapter 7 - Personal Learning
Although I have worked for the last 28 years in various industries, primarily in the
area of HR, I left school early without immediately progressing into third level
education. Working in the field of HR certainly gave me a lot of valuable
information and experience but this opportunity and particularly this research
project has opened up a whole new world to me in relation to the subject matter
and it will absolutely stand to me going forward. I learned how to be patient,
research, academically write and meet tight deadlines. I also learnt a lot about
data analysis and software packages and met some great people along the way.
Above all, participating on this programme has developed my quantitative
research skills and taught me a lot about research methodology in general, all of
which I will certainly apply to future research projects both academically going
forward and in my professional capacity at work.

51
References
Acas (2014) ‘Managing attendance and employee turnover advisory booklet’.
[Online] Acas available from: http://www.acas.org.uk/media/pdf/q/k/Managing-
attendance-and-employee-turnover-advisory-booklet.pdf
Addis, M., & Podesta, S. (2005). ‘Long life to marketing research: a postmodern
view’. European Journal of Marketing, 39(3/4), 386-412.
Aliaga, M. & Gunderson, B. (2002). Interactive statistics. 2nd ed. New Jersey:
Prentice Hall
Andrews, E. (2007). ‘’Green’ BA flying empty ‘ghost planes’ across the Atlantic’”.
[Online] Daily Mail, 14th November. Available from:
http://www.dailymail.co.uk/news/article-493357/Green-BA-flying-ghost-planes-
Atlantic.html [Access 5 June 2015]
Argyris, C. (1960) Understanding Organizational Behaviour. Homewood, Il: Dorsey
Press.
Armstrong, M, & Taylor, S (2014). Armstrong’s Handbook of Human Resource
Management Practice 13th ed. London. UK: Kogan Page Limited.
Barnard, Chester I. (1938). The Functions of the Executive. Cambridge, MA: Harvard
University Press.
Box, T.M. & Byus, K. 2009, "Southwest Airlines 2007", Journal of the International
Academy for Case Studies, vol. 15, no. 1, pp. 21-27.

52
Boyd, C., 2001. ‘HRM in the airline industry: Strategies and outcomes’. Personnel
Review, 30(4), pp. 438-453.
Bryman, A., & Bell, E. (2011). Business Research Methods. 3rd ed. Oxford: Oxford
University Press.
CAPA – Centre for Aviation, 2013, European airlines' labour productivity. Oxymoron
for some, Vueling and Ryanair excel. European airlines' labour productivity.
Available at: http://centreforaviation.com/analysis/european-airlines-labour-
productivity-oxymoron-for-some-vueling-and-ryanair-excel-on-costs-97635.
Chen C. (2012) ‘Burnout and Work Engagement Among Cabin Crew; antecedents
and Consequences.’ International Journal of Aviation Psychology. 22(1): 41-58.
CIPD (2005). ‘Recruitment, Retention and Turnover – Survey Report, (Online) CIPD
Available from; http://www.cipd.co.uk/NR/rdonlyres/8A034D9F-B54E-44D1-B198-
71026BB3DAAA/0/recruitretntsurv05.pdf
CIPD (2013) ‘Mega Trends: Has job turnover slowed down?” (Online) CIPD
Available from; http://www.cipd.co.uk/hr-resources/research/megatrends-job-
turnover-slowed-down.aspx
CIPD (2014). ‘Employee turnover and retention’ - Factsheets. [ONLINE] CIPD
Available from: http://www.cipd.co.uk/hr-resources/factsheets/employee-turnover-
retention.aspx
CIPD (2015) ‘Resourcing and Talent Planning Survey Report 2015. CIPD (Online)
Available from: http://www.cipd.co.uk/binaries/resourcing-talent-planning_2015.pdf
CIPD (2015b) ‘Show me the Money’ CIPD (Online) Available from:
http://www.cipd.co.uk/hr-resources/research/show-money-behavioural-science-
reward.aspx
53
CIPD (2015c). History of HR and the CIPD - Factsheets - CIPD . 2015. ‘History of
HR and the CIPD’ (Online) CIPD Available at: http://www.cipd.co.uk/hr-
resources/factsheets/history-hr-cipd.aspx
Easyjet (2015). ‘Cabin crew Recruitment Process’ [Online] Emirates Group Careers.
Available from: https://careers.easyjet.com/cabin-crew/recruitment-process/.
[Accessed 19 April 2015].
Economic Times (2010) ‘Recruitment gathers pace in aviation sector’ [Online]
Economic Times. Available from: http://articles.economictimes.indiatimes.com/2010-
07-09/news/27578099_1_cabin-crew-flight-attendants-airline-industry
Emirates, Cabin crew Requirements. 2015. Cabin crew Requirements. [ONLINE]
Available from:
http://www.emiratesgroupcareers.com/english/careers_overview/cabin_crew/require
ments.aspx. [Accessed 19 April 2015].
Donnelly, D. P. & Quirin, J (2006), ‘An extension of Lee and Mitchell's unfolding
model of voluntary turnover.’ Journal of Organizational Behaviour, (27) Issue 1,
59-77.
Higgins, C. 1997. ‘Saying Goodbye: A guide to exit interviewing’ Industrial
Relations News, 22 (June).
Hochschild, Arlie (1983). The managed heart: commercialization of human feeling.
Berkeley and Los Angeles, California: University of California Press.
Hosford, S. (2013). “We don’t want boy racers flying our planes – Michael O’Leary
hits back.” Available from; http://www.thejournal.ie/oleary-has-no-concerns-over-
ryanair-fuel-policy-1034330-Aug2013/
Incomes Data Services – IDS (2004). ‘HR studies update 787, December 2004’.
London: Incomes Data Services.

54
Incomes Data Services – IDS (2005). ‘IDS HR studies update: recruitment &
retention’. London: Incomes Data Services.
Kent, R,. (2007) Marketing Research: Approaches, methods and application in
Europe. Rotolito. Italy.
Khuong, M.N. & Le Truc Mai Uyen (2014). ‘The Factors Affecting Vietnam Airlines
Service Quality and Passenger Satisfaction - A Mediation Analysis of Service
Quality’, International Journal of Innovation, Management and Technology, vol. 5,
no. 5, pp. 327.
Kroon, B. & Freese, C. (2013),"Can HR practices retain flexworkers with their
agency?", International Journal of Manpower, Vol. 34 Iss 8 pp. 899 - 917
Levinson, H., Price, C.R, Munden, K.J., Mandl, H.J. and Solley, C.M. (1962) Men,
Management and Mental Health, Boston: Harvard University Press.
Lowe-Holmes, A. R. (1971). ‘Research note: Factors involved in the short-term
labour turnover of air Cabin crew’. British Journal of Industrial Relations, 9(1): 415-
418.
Mackay A. (2007). ‘Recruiting, Retaining and Releasing People: Managing
Redeployment, Return, Retirement and Redundancy’. London: Butterworth
Heinemann.
Malhotra, N. K., & Birks, D. F. (2007). Marketing research: an applied approach:
Harlow: Pearson Education.
McNeely, E., Gale, S., Tager, I., Kincl, L., Bradley, J., Coull, B., & Hecker, S.
(2014). The self-reported health of U.S. flight attendants compared to the general
population. Environmental Health: A Global Access Science Source, 13(1), 13-23.
Doi: 10.1186/1476-069X-13-13
Mooney,P. (1999). ‘Keeping your best staff: The Human Resource Challenge in a
Competitive Environment’. Dublin: Oak Tree Press.

55
Pennington, R.G. (2003). ‘Keep Good People’. Executive Excellence, 20(3):9.
Quinlan, Christina. (2011) ‘Business research method’s. Hampshire: Cengage
Learning.
Rousseau, D.M. (1989) ‘Psychological and implied contracts in organizations’
Employee Responsibilities and Rights Journal, 2 (2): 121-139.
Ryanair (2015) ‘Q1 2015 Results’. [Online] Ryanair. Available from:
http://corporate.ryanair.com/docs/corp/investor/2015/q1_2015_doc.pdf.
Ryanair, (2015b) Ryanair launches customer charter & unveils 2015 (year 2) “Always
Getting Better” plan’.
Saunders, M., Lewis, P., & Thornhill, A. (2009). Research methods for business
students. 5th ed. Harlow: Financial Times Prentice Hall.
Shaw, J.D., Delery, J.E., Jenkins, G.D. and Gupta, N. (1998), “An organization-level
analysis of voluntary and involuntary turnover”, Academy of Management Review,
Vol. 41 No. 5, pp. 511- 25
Singh, S. (2014). ‘MY BIZ: Air India hit by cabin crew shortage’. [Online] Daily
Mail, 5th November. Available from:
http://www.dailymail.co.uk/indiahome/indianews/article-2821126/MY-BIZ-Air-
India-hit-cabin-crew-shortage.html
Strategic Direction (2006). ‘Easyjet and Ryanair flying high on the Southwest model’.
Strategic Direction, 22(6): 18-21.
Sweeney, T. (2002). ‘Exit Interviews’. Credit Union Management, 25(11): 38-39.
World Travel Market (2014). ‘2014 WTM Global Trends Report’. (Online) World
Travel Market. Available at: http://go.euromonitor.com/WTM-2014-global-trends-
report.html.

56
Appendices Appendix 1 – Eurostat List
Eurostat - Most expensive countries in Europe:
1. Switzerland
2. Norway
3. Luxembourg
4. Iceland
5. Denmark
6. The United Kingdom
7. Ireland
8. Netherlands
9. Finland
10. France
Least expensive countries in Europe:
1. Macedonia
2. Bosnia and Herzegovina
3. Albania
4. Serbia
5. Romania

57
6. Bulgaria
7. Kosovo
8. Montenegro
9. Hungary
10. Poland
11. Turkey
(Source: Europa.eu Website)
Appendix 2 – Coding Charts
Coding Charts – Used by Researcher
NATIONALITY AT STARTDATE AT END DATE AT END DATE
NATIONALITY KEY AGE
YEARS KEY AGE
YEARS KEY AGE
CATEGORY KEY
BELGIUM 1 18 1 18 1 18-20 1
UK 2 19 2 19 2 21-23 23
CZECH 3 20 3 20 3 24-26 4
DANISH 4 21 4 21 4 27-29 5
DUTCH 5 22 5 22 5 30-32 6
FINNISH 6 23 6 23 6 33-35 7
FRENCH 7 24 7 24 7 36-38 8
GERMAN 8 25 8 25 8
GREECE 9 26 9 26 9
HUNGARIAN 10 27 10 27 10
FLEMISH 11 28 11 28 11
IRISH 12 29 12 29 12
ITALY 13 30 13 30 13
LATVIAN 14 31 14 31 14
LITHUANIAN 15 32 15 32 15
MALTESE 16 33 16 33 16
NORWEGIAN 17 34 17 34 17
POLISH 18 35 18 35 18
PORTUGAL 19 36 19 36 19
ROMANIAN 20 37 20 37 20
SLOVAKIAN 21 38 21 38 21
SPANISH 22 39 22
SWEDISH 23
TURKISH 24

58
Appendix 3 – Summary of Total Data
Summary of Totals Chart used by Researcher following analysis.

59
Summary of Totals Chart used by Researcher following analysis Ctd.,.
Total Males Females <23 >23Expensive
Country
Not
Expensive
Base
<3 <6 <9
Transfer
No Transfer
(PUSH)20 20
No Transfer
Granted 20 9 11 13 7 16 4 4 12 17
Disciplinary
Disciplinary
(PUSH)
6 6
Going
through
Disciplinary
Issues when
resigned. 6 2 4 6 0 6 0
Did not l ike job / not met expectation / Conditions
Did not like
job (PUSH)79
18 61
Did not l ike job / not met expectation / Conditions
Did not
meet
expectation
(PUSH)
28
7 21 18 10 20 8
Did not l ike job / not met expectation / Conditions
Not happy
with
conditions
(PUSH)
15
Did not l ike job / not met expectation / Conditions
Roster
Issues
(PUSH)
14
Did not l ike job / not met expectation / Conditions
Did not like
Base (PUSH)3
Did not l ike job / not met expectation / Conditions
Does not
like flying
(PUSH)
8
4 8
Did not l ike job / not met expectation / Conditions
Did not like
Co (PUSH)8
Did not l ike job / not met expectation / Conditions
Did not like
line
manager
(PUSH)
1
Did not like job / not met expectation / Conditions
Lack of
Motivation
(PUSH)
0 156 Did not like
job 156 40 116 80 76 135 21 112 134 146
Financial / Pay / Benefits
Financially
struggling to
survive(PUS
H)
141 141Financial /
Pay 141 41 100 70 71 130 11 53 88 128
Health / Pregnancy
Saying Work
Related -
HEALTH
(PUSH)
4
Health / Pregnancy
Stress
(PERSONAL)5
Health / Pregnancy
Back
Problems
(PERSONAL)
3
Health / Pregnancy
Injury
(PERSONAL)2
Health / Pregnancy
Health
(PERSONAL)33
Health / Pregnancy
Non work
relatied -
HEALTH
(PERSONAL)
9
Health / Pregnancy
Pregnancy
(PERSONAL)2

60
Appendix 4 – All Figures and Tables
Figures and Tables:
Total Males Females <23 >23Expensive
Country
Not
Expensive
Base
<3 <6 <9
Health / Pregnancy
Depression
(PERSONAL)2 60
Health 60 10 50 27 33 49 11 2 22 54
Family / Children / Relationship / Returning Home
Family
Reasons
(PULL)
101
(<30 - 95) 32 69 19 82
Family / Children / Relationship / Returning Home
Returning
Home (PULL)
91
22 69
Family / Children / Relationship / Returning Home
Moving
(PULL)7
Family / Children / Relationship / Returning Home
Children
(PERSONAL)7
Family / Children / Relationship / Returning Home
Marriage
(PULL)7 213
Family etc., 213 50 163 79 134 178 35 73 35 179
ID / Transport Issues
ID Issues
(PUSH)12
ID / Transport Issues
Transport
Issues (
PUSH)
8 20 ID Issues /
Transport 20 8 12 9 11 18 2 14 8 19
Studies
Returning to
Studies
(PULL)
56
17 39 25 31To Travel 10 4 6
Travel
To Travel
(PULL)10 66
Study /
Travel 66 20 46 29 37 54 12 10 17 50
Better Position / Career Change
Pilot
Training
Position
(PULL)
5
Better Position / Career Change
Change
Career
(PULL)
10
Better Position / Career Change
New Job
(PULL)148
With Airline 74 (40 < 25 ) 24 50 21 53 4
Better Position / Career Change
New Job
Airline
(PULL)
74 237
Better
Position /
Career
Change 237 79 158 73 164 154 83 30 48 168
919 259 660 386 533 740 179 298 364 761
Personal
Reasons
(PERSONAL)
160 160
Ryanair
Contract ??859 859
FR Contract 859 286 168 15 53 604
No Reason 0 133
2071

61
Table 1 – CIPD (2005)
Airlines - Labour costs as % of Revenue
Source: CAPA – Centre for Aviation analysis of airline company financial and traffic statements.
Table A
CAPA - European airlines revenue (EUR) per employee: 2012
(CAPA, 2012). Table B
Top Reasons Percent Count
Better Position / Career Change
30% 237
53%42%
41%37%
20%
19%11%
11%
10%9%
7%6%
4%
3%
0% 10% 20% 30% 40% 50% 60%
Lack of career development.
Level of Pay.
Redundancy.
Leaving to have / look after…
Level of working hours.
Stress of Job / Role
Relocation

62
Family Reasons 21% 213
Did not like job 18% 156
Financial / Pay 13% 141
To Return to Study or Travel 6% 66
Health Reasons 8% 60
Airport ID / Transport Issues 2% 20
No Transfer Granted 2% 20
Going through Disciplinary Issues when resigned.
1% 6
100% 919
Table 1: Top Reasons
Figure 2: Top Reasons - Percentages
Top Reasons Percentage Count
Better Position / Career Change 30% 237
New Job 62% 148
New Job with Another Airline 31% 74
Change of Career 5% 10
Pilot Training Position 2% 5
Table 2: Better Position / Career Change
Figure 3: Better Position / Career Change Chart
Top Reasons Percentage Count
0% 5% 10% 15% 20% 25% 30% 35%
Better Position / Career Change
Family Reasons
Did not like job
Financial / Pay
To Return to Study or Travel
Health
Airport ID / Transport Issues
No Transfer Granted
Going through Disciplinary Issues…
To take on a New Job ,
62%
New Job with
Another Airline, 31%
To Change Career, 5%
Pilot Training,
2%
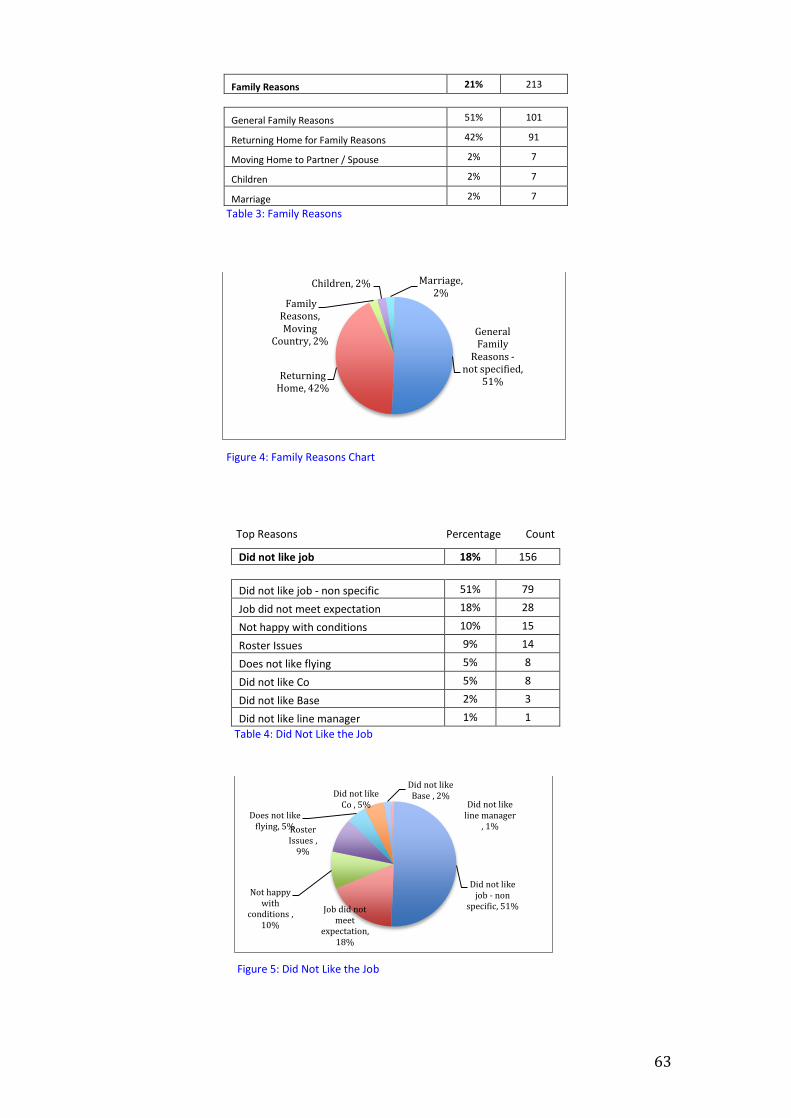
63
Family Reasons 21% 213
General Family Reasons 51% 101
Returning Home for Family Reasons 42% 91
Moving Home to Partner / Spouse 2% 7
Children 2% 7
Marriage 2% 7
Table 3: Family Reasons
Figure 4: Family Reasons Chart
Top Reasons Percentage Count
Did not like job 18% 156
Did not like job - non specific 51% 79
Job did not meet expectation 18% 28
Not happy with conditions 10% 15
Roster Issues 9% 14
Does not like flying 5% 8
Did not like Co 5% 8
Did not like Base 2% 3
Did not like line manager 1% 1
Table 4: Did Not Like the Job
Figure 5: Did Not Like the Job
General Family
Reasons -not specified,
51%Returning
Home, 42%
Family Reasons, Moving
Country, 2%
Children, 2% Marriage, 2%
Did not like job - non
specific, 51%Job did not meet
expectation, 18%
Not happy with
conditions , 10%
Roster Issues ,
9%
Does not like flying, 5%
Did not like Co , 5%
Did not like Base , 2%
Did not like line manager
, 1%

64
Top Reasons Percentage Count
Health 8% 60
Health Personal Issue 55% 33
Health General 15% 9
Stress 8% 5
Saying Work Related 7% 4
Back Problems 5% 3
Injury 3% 2
Depression 3% 2
Pregnancy Related 3% 2
Table 7: Health Reasons
Figure 6: Health Reasons
Top Reasons Percentage Count
Returning to Studies / Travel 8% 66
Returning to Studies 82% 56
To Travel 18% 10
Table 8: Returning to studies / travel.
Figure 7: Returning to studies / travel.
Health Personal
Issue, 55%
Health General, 15%
Stress, 8%
Saying Work Related , 7%
Back Problems,
5%
Injury, 3%
Depression, 3%
Pregnancy Related, 3%
Returning to Studies ,
82%
To Travel , 18%
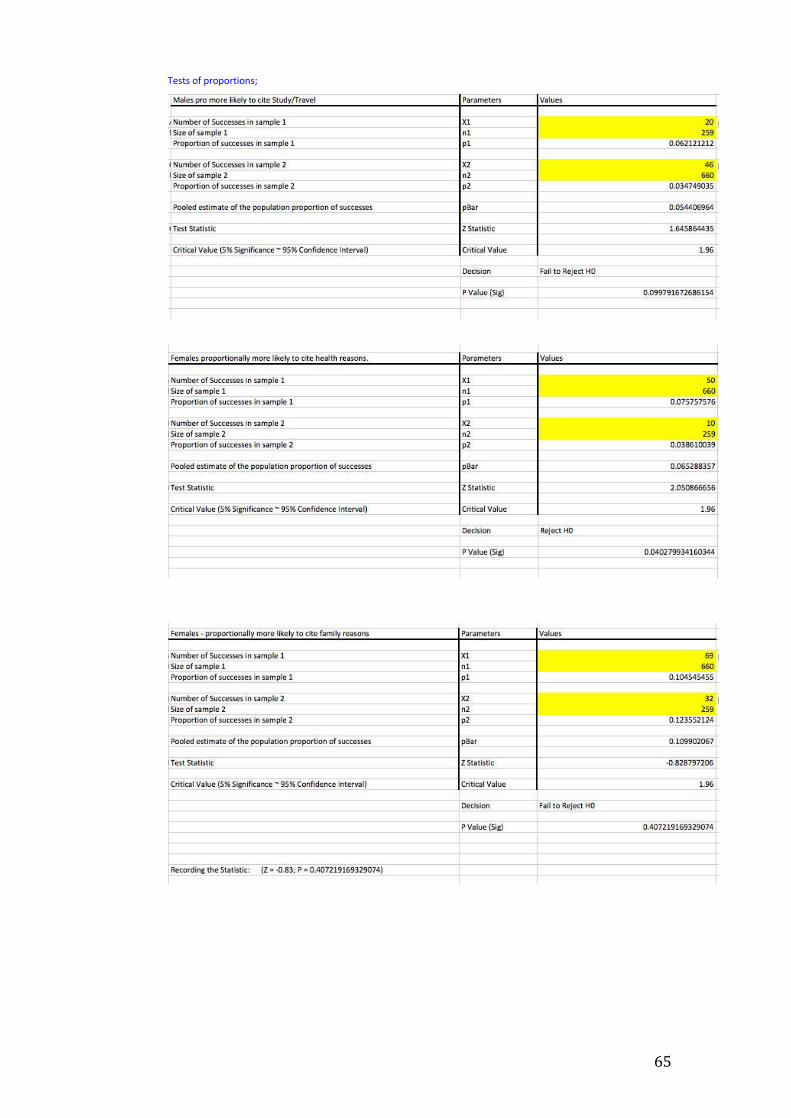
65
Tests of proportions;

66

67

68

69