An Investigation into the Mechanical Properties of FDM ... · Moreover, mechanical tests were...
62
1 Ain Shams University Faculty of Engineering Materials Engineering Program MDP 391: Industrial Project An Investigation into the Mechanical Properties of FDM Fabricated Specimens Submitted to: Prof. Dr. Samy Jimmy Ebeid Submitted by: Farida Elhamy Loutfy Boulos (14P2011) Michael Sherif Talaat Hakim (14P8114) Mohamed Ahmed Waheed Mohamed (14P8160) Shehab El-Din Mohamed Ashraf Zaki (14P1076)
Transcript of An Investigation into the Mechanical Properties of FDM ... · Moreover, mechanical tests were...

1
Ain Shams University
Faculty of Engineering
Materials Engineering Program
MDP 391: Industrial Project
An Investigation into the Mechanical Properties of FDM
Fabricated Specimens
Submitted to:
Prof. Dr. Samy Jimmy Ebeid
Submitted by:
Farida Elhamy Loutfy Boulos (14P2011)
Michael Sherif Talaat Hakim (14P8114)
Mohamed Ahmed Waheed Mohamed (14P8160)
Shehab El-Din Mohamed Ashraf Zaki (14P1076)

2
Table of Contents Table of Contents .......................................................................................................................................... 2
List of Figures ................................................................................................................................................ 4
Acknowledgment .......................................................................................................................................... 6
Abstract ......................................................................................................................................................... 7
Introduction .................................................................................................................................................. 8
What is AM? .............................................................................................................................................. 8
What is FDM? .......................................................................................................................................... 10
Objective ..................................................................................................................................................... 11
Experimental Section and Choosing Tools .................................................................................................. 11
Manufacturing Phase .................................................................................................................................. 12
Maintenance of Polylab’s FDM Machine ................................................................................................ 12
Drawing ................................................................................................................................................... 14
Machine .................................................................................................................................................. 16
Overview about the Machine ............................................................................................................. 17
Used Filament ..................................................................................................................................... 18
Successive manufacturing ....................................................................................................................... 19
Product Specimens ................................................................................................................................. 20
Tensile Specimens: .............................................................................................................................. 20
Impact Specimens ............................................................................................................................... 26
Mechanical Tests ......................................................................................................................................... 31
Tensile Test ............................................................................................................................................. 31
Introduction ........................................................................................................................................ 31
Material and Specimen ....................................................................................................................... 31
Experimentation ................................................................................................................................. 31
Photos for the Tensile Samples after Testing ..................................................................................... 33
Testing Results .................................................................................................................................... 34
Impact Test.............................................................................................................................................. 37
Introduction ........................................................................................................................................ 37
Materials Samples and Testing Equipment......................................................................................... 38
Photos after Impact Test ..................................................................................................................... 39

3
Testing Results .................................................................................................................................... 40
Discussion ............................................................................................................................................ 40
Microstructure Analysis .............................................................................................................................. 40
Macrostructure Analysis ............................................................................................................................. 44
Fracture Mode ........................................................................................................................................ 44
Fracture Surface .................................................................................................................................. 46
Honeycomb Structure ............................................................................................................................. 49
Printing of Honeycomb Structure ....................................................................................................... 50
Statistical Analysis ....................................................................................................................................... 52
Introduction ............................................................................................................................................ 52
Guidelines for Designing Experiments .................................................................................................... 52
Objectives Setting ............................................................................................................................... 52
Process Variables Selection ................................................................................................................. 52
Experimental Design Selection. .......................................................................................................... 53
Experiment Execution. ........................................................................................................................ 53
Results Analysis and Interpretation. ................................................................................................... 53
Conclusions and Recommendations. .................................................................................................. 53
Design of Experiment .............................................................................................................................. 54
DOE Analysis of ABS Polymer .................................................................................................................. 55
Conclusion ................................................................................................................................................... 60
References .................................................................................................................................................. 61
Signature ..................................................................................................................................................... 62
4
List of Figures Figure 1: CAD sketch ..................................................................................................................................... 8
Figure 2: STL converted sketch ..................................................................................................................... 9
Figure 3: Basic FDM machine and technique .............................................................................................. 10
Figure 4: FDM used materials ..................................................................................................................... 11
Figure 5: Experimental steps ....................................................................................................................... 11
Figure 6: Printing attempts after maintenance .......................................................................................... 14
Figure 7: Tensile specimen sketch drawn on Inventor ............................................................................... 14
Figure 8: Impact-Charpy specimen sketch drawn on Inventor ................................................................... 15
Figure 9: STL format of tensile specimen sketch ........................................................................................ 15
Figure 10: STL format of impact-Charpy specimen sketch ......................................................................... 16
Figure 11: New Creator pro 3D printer 2016 .............................................................................................. 16
Figure 12: Various operating programs installed to the FDM machine & ventilation direction in the
machine ....................................................................................................................................................... 17
Figure 13: Metal stand of the machine to avoid any tiny dimensional errors ........................................... 18
Figure 14: White dissolvable material used in drawing supports & brassFill material ............................... 18
Figure 15: Tensile sample number (1) ........................................................................................................ 20
Figure 16: Tensile sample number (2) ........................................................................................................ 22
Figure 17: Tensile sample number (3) ........................................................................................................ 23
Figure 18: Tensile sample number (4) ........................................................................................................ 24
Figure 19: Tensile sample number (5) ........................................................................................................ 25
Figure 20: Impact-Charpy sample number (1) ............................................................................................ 26
Figure 21: Impact-Charpy sample number (2) ............................................................................................ 27
Figure 22: Impact-Charpy sample number (3) ............................................................................................ 28
Figure 23: Impact-Charpy sample number (4) ............................................................................................ 29
Figure 24: Impact-Charpy sample number (5) ............................................................................................ 30
Figure 25: ASTM D638 specifications .......................................................................................................... 31
Figure 26: Zwick/Roell Z010 tensile machine ............................................................................................. 32
Figure 27: Samples after tensile test .......................................................................................................... 33
Figure 28: ASTM D6110 specifications ........................................................................................................ 37
Figure 29: Zwick Roell Impact System ......................................................................................................... 38
Figure 30: Samples after impact-Charpy test ............................................................................................. 39
Figure 31: Sample 2 ..................................................................................................................................... 40
Figure 32: Sample 5 ..................................................................................................................................... 41
Figure 33: Sample 2 ..................................................................................................................................... 42
Figure 34: Sample 5 ..................................................................................................................................... 42
Figure 35: Sample 2 (layer built on bed) .................................................................................................... 43
Figure 36: Honeycomb structure magnified ............................................................................................... 44

5
Figure 37: Sample 4 ..................................................................................................................................... 45
Figure 38: Sample 5 ..................................................................................................................................... 45
Figure 39: Fracture surface sample 5, tension ............................................................................................ 46
Figure 40: Fracture surface sample 4, tension ............................................................................................ 46
Figure 41: Values aimed for comparison .................................................................................................... 47
Figure 42 Fracture surface, sample 4, impact ............................................................................................ 47
Figure 43 Fracture surface, sample 5, impact ............................................................................................. 48
Figure 44: Honeycomb structure ................................................................................................................ 49
Figure 45: Hexagon vs. other shapes .......................................................................................................... 49
Figure 46: Honeycomb structure ................................................................................................................ 50
Figure 47: Single nozzle printing technique ................................................................................................ 50
Figure 48: Double nozzle printing technique .............................................................................................. 51

6
Acknowledgment
We would like to express our sincere thanks to Prof. Dr. Samy Jimmy Ebeid for his
great patience and cooperation with us in our project, allowing us to have one of
our best opportunities to go through a great project. Furthermore, sincere thanks
are to be given to Eng. Hussein Zahran & Eng. Mohamed Abouzaid for their
complete cooperation with us in the industrial and testing phases, and for their
great participation and supervision, also we would like to thank Etba3ly 3D
Company for their generosity and munificence help and cooperation for obtaining
best of specimens used in our industrial research study. Finally we would like to
thank our parents for being supportive and cooperative with their knowledge,
contribution, and love.

7
Abstract The purpose of this study is to manifest the mechanical properties of ABS FDM printed
specimens, passing through macro and micro structures with their impact on the material
properties of ABS polymer, with respect to applied industrial parameters. Two printing
parameters where studied simultaneously, namely, printing temperature and extruder speed.
Moreover, mechanical tests were applied on specimens in order to study their results and
conclude the desired properties, the tests are tensile test and impact-charpy test. The Design of
Experiments (DOE) full factorial approach was adopted. The tensile strength, elongation and
modulus of toughness of the thermoplastic polymer were the responses measured to identify
the most influencing parameter and the best settings. The experimental results show that an
increase in the printing temperature increases both tensile strength and modulus of toughness,
and decreases the elongation of the thermoplastic polymer. Compared to printing speed, the
printing speed reduces tensile strength, elongation and modulus of toughness properties.

8
Introduction
What is AM?
Additive manufacturing (AM) is a revolutionary industrial techniques that started at 1981 by
Hideo Kodama of Nagoya Municipal Industrial Research Institute invented two additive methods
for fabricating three-dimensional plastic models with photo-hardening, passing through a series
of successful evolutions ending with multiple efficient techniques as FDM (fused deposition
modelling), SLA (stereo lithography), SLS (selective laser sintering), and LOM (laminated object
manufacturing) and many other additive manufacturing techniques.
Additive manufacturing describes the technologies of constructing 3D models or parts by adding
layer upon layer of specified special materials. Additive manufacturing uses wide ranged
materials of different categories from metals to polymers, even passing through inorganic
materials as pure white sand. Any AM process passes through arranged steps, that we have
passed through in our manufacturing period:
CAD preparation: using wide ranged modelers as AutoCAD, Inventor, and other programs
to describe needed design, or using 3D scanning techniques for existing parts that need
to be scanned.
Figure 1: CAD sketch
STL convert: 3D CAD model made by wide ranged modelers should be converted to (.stl)
mode (standard triangle language) to be read by the printing software, as it helps in
forming basis for the calculation of the slices. (.stl) format simple divides the geometry
into triangular slices to ease the printing route calculation to be able to know amount of
material will be used and printing duration.

9
Figure 2: STL converted sketch
File transfer to machine: (.stl) should be adapted for correct suitable size, position and
orientation
Machine setup: this step is concerned by parameters adjusting for manufacturing such
as material constrains, energy source, layer thickness, building angle, building duration,
resolution, extruder speed, flow speed…etc.
Part build up: it’s an automatic step with no supervision needed, only supervision may
be needed for material feed as not to run out of material or power.
Part removal: skills may be needed at this step as removal of part from the main
platform or the excess material may cause ripping of lower surfaces and cause part
damage.
Post processing: it’s the finishing step where part outer surface should be cleaned, and
polished carefully so not to change part’s dimensions upon polishing, then remove any
supports made upon manufacturing (as in FDM techniques)
AM is considered also as a wide application ranged technology that may be used in different
various fields as: prototyping, biomedical applications, artistic parts and sculptures, civil
models, clothes, frames…etc., because it is a technology of wide advantages as:
Non-conventional machining technique with no tool required so no friction occur upon
manufacturing
One shot operation
Economical
Green manufacturing: no pollutant gases released

10
User friendly: can be used easily by anyone
High accuracy
Easily controlled by different parameters.
What is FDM?
FDM or fused deposition modelling is an additive manufacturing technology commonly used for
prototyping, which uses layer by layer way of building using material wire forced by extruder to
enter heater way to exceed Tg (transition temperature) for polymers or melting temperature for
metals and then expelled out through a nozzle to be deposited on machine’s bed. Printing head
is controlled by 3D mechanical motor mechanism allowing it to move in vertical and horizontal
directions to be able to build in 3D manner.
Figure 3: Basic FDM machine and technique
As material layer is deposited, it starts hardening immediately after extrusion from the nozzle as
it touched much cooler surface, then laminas formed are combined or fused together to form
the desired shape. Material’s filament or wire is extruded from a wire spool sufficient enough to
build the desired shape with a specific diameter that meets machine and design requirements.
With FDM being the most used technology among all AM techniques, PLA and ABS dominate the
top two polymer materials used, with PLA used twice as often when compared to second place
ABS. This difference is likely caused by the ease of printing with PLA and ABS, having lower
printing temperatures and less strict ventilation requirements.

11
Figure 4: FDM used materials
Objective The objective of our project is to make an experimental study concerned with changing industrial
parameters of printing as temperature and extruder head speed and study its impact on
mechanical properties, as ultimate tensile strength, % elongation, fracture strength,
toughness…etc. of Z-ABS. Industrial parameters were chosen according to specific statistical
model in order to obtain the best statistical reliable result to our research.
Experimental Section and Choosing Tools Our research study consists of multiple consecutive phases that are dependent on each other.
First, experimental industrial parameters where established based on statistical design and
research papers study, then ASTM standardized samples were chosen according to specified
choices as different manufacturing technique of FDM and Z-ABS material used, then
manufacturing phase begins after converting the drawn file to (.stl) format in order to be
readable by the FDM machine.
Figure 5: Experimental steps

12
After manufacturing the samples, series of mechanical tests which are tensile tests, impact
Charpy test, and hardness test where made in order to build complete study about the impact of
industrial parameters chosen over the mechanical properties of the chosen material, then
statistical analysis is made to ensure reliable and precise study of impact and to determine the
most significant parameters that have severe impact on the material properties.
Specimen number Temperature (degree Celsius)
Extruder speed (mm/second)
1 220 25
2 220 35
3 250 30
4 280 35
5 280 25
Manufacturing Phase
Maintenance of Polylab’s FDM Machine
At first, we have chosen to print our specimens in college’s FDM machine located in the Polylab.
Although we haven’t really completed our industrial phase using this machine but we have
learned much about FDM machines over a full month of maintenance, that is worth
documentation and discussion.
The college FDM machine consists of several parts as:
Extruder part: consists mainly of pulley, nozzle inlet, heater, and nozzle outlet.
Bed: glued bed to allow first polymer layer to be held in its place, and in some cases
heated to ensure dimensional stability of the product and to ensure effective fusion of
the drawn lines.
Motors: XYZ motors controlled by G-code, which is the coding language that allows the
machine to move through a series of different coordinates in order to draw a layer.
Cooling system: in order to control coil temperatures rates.
Power source.
At first the machine was totally unable to extrude any polymer ABS due to several problems
found after several printing trials made by the machine:
Blocked nozzle by accumulated ABS.
No glue consistency over the bed.
Bad feed rate.

13
Hanged thermocouple causing false temperature readings.
Broken filament.
Shortage in G-code knowledge.
No continuity of fused filament among printing.
Bed is not reliable in its thickness.
So throughout a month of maintenance we have discovered that series of different solving
techniques should be applied simultaneously which allowed us to print some distorted shapes
after being totally unable to extrude any polymer, and those solving techniques are:
We have cleaned nozzle by a grinded welding steel rod, by pushing accumulated polymer
to be expelled out of the nozzle while heating the coils to ease the process.
Tried to remove glue using acetone but nothing new is offered by this opinion, but water
removal showed a better result as we can redistribute new glue layer, to ensure best
distribution among the bed so constant quality of product is achieved over different parts
of the bed.
Feed rate was solved by applying some enhancements and updates on the G-code, of the
controlling program, made by trial and error technique.
Hanging disassembled thermocouple was a major problem that caused severe lack of
work for about week due to shortage of insulation tape (koptan) from market, which is
used in insulating heaters and furnaces, so we had to buy it online, in order to reassemble
it, after our fails in assembling it using ordinary tape that melts due to coil temperature
we finally solved this issue completely by the koptan tape.
Broken filament was reentered to its tube way in the nozzle inlet and reassembled
efficiently
G-code knowledge shortage was solved by experience studying to multiple codes written
before by Eng. Michael Dawood on the program itself.
Lack of fused ABS continuity within the extruder among printing was the unsolved
problem until now, and this problem caused severe deformity in the drawn layers by the
machine, which made us choose to find an external commercial FDM machine to print on.
Thickness of bed table isn’t reliable as shown, and this was a tricky observation that we
have detected by multiple prints, that we have solved using manual home dimensions
adaptation on the controlling program of the machine.

14
Figure 6: Printing attempts after maintenance
As shown from the figure above that shows trials after maintenance of the Polylab FDM machine.
In the next parts of the manufacturing phase we will be discussing the real successive industrial
phase.
Drawing
After choosing the ASTM standardized test specimens, drawing phase begins using Autodesk
inventor pro 2017, which is considered as a wide range modeler program used for modelling
and analysis, where dimensions were decided according to the standards chosen.
Drawing 3D shapes is divided into 2 steps, the first one is to draw a cross section on a 2D plane
with the dimensions needed to this design, then extrude order is used with the desired
thickness in order to form the 3D desired design.
Figure 7: Tensile specimen sketch drawn on inventor

15
Figure 8: Impact-Charpy specimen sketch drawn on inventor
Then designs are converted into (.stl) format to be readable by the FDM machine.
Figure 9: STL format of tensile specimen sketch

16
Figure 10: STL format of impact-Charpy specimen sketch
Machine
Printing service was offered by ETBA3LY 3D company which offers wide range of precise and
reliable machines of different additive manufacturing techniques. Machine used is New creator
pro 3d printer 2016 offered by Flashforge 3D printer company.
Figure 11: New creator pro 3D printer 2016

17
Overview about the Machine
Creator Pro is a very reliable 3D printer with excellent precision and professional quality. The
sturdy metal frame increases stability of the printer’s moving parts. Metal platform support and
10mm Z-axis guide rods allow for precise movement of the z-axis to ensure better dimensional
control. The build plate is made from 6.3mm thickness alloy of Aluminum —the same grade used
in the aerospace industry. This high level aluminum can always stay flat, even after continued
exposure to high heat. excellent heat distribution and never deformed due to effiecient coil-
cooling system. The versatile chamber provides different printing environment for different
materials. As a result, precise and top-tier print quality shows up.
The 2016 Creator Pro comes with stylish and user-friendly design. All the metal and plastic parts
go together with each other so well because they are molded. Thoughtful design details include
unibody top cover, external handles, 180°opening front panel, plastic leveling knobs, 45°viewing
control interface and full-range power supply are added to its friendly user experience.
Creator Pro is a straightforward 3D printer based on open source technology, which is editing
allowed controlled program. It allows for flexible upgrades and various modifications.
Meanwhile, you are able to choose your favorite software such as FlashPrint, Simplify3D, Cura
and more to use.
Creator Pro features a closable door and removable top cover to keep out dust and foreign
particles. This fully enclosed chamber also eliminates temperature interference from the exterior
environment and stabilizes the printing temperature for more successful and accurate ABS prints,
less warps. Open the door, remove the top cover, and let air flows in. The chamber is ventilated
to cool down extruded PLA quickly. This yields out smoother curves on finished prints, less hung
materials. Ventilation direction is shown in figure below.
Figure 12: Various operating programs installed to the FDM machine & ventilation direction in the machine

18
Creator Pro features a metal frame instead of wooden one of original Creator. It is optimized for
the printing process by adding much needed stiffness to reduce vibration. The metal support and
10mm Z-axis guide rods work together to increase precision of vertical movement.
Figure 13: Metal stand of the machine to avoid any tiny dimensional errors
Used Filament
Creator Pro comes with a proprietary dual-extruder structure. It allows you to print the main part
with ABS filament and the support with dissolvable filament which can be melt in limonene. And
this gives a solid infill for delicate overhangs and objects with internal moving parts. Also, it can
be tuned to print with a wide range of experimental materials such as Flex, T-glass and composite
materials such as woodFill, copperFill, and brassFill.
Figure 14: White dissolvable material used in drawing supports & brassFill material

19
Technical Specification P
rin
tin
g sp
eci
fica
tio
n Printing technology FFF (Fused Filament Fabrication)
Build Volume 227 L X 148 W X 150 H mm Layer Resolution 100 to 50 microns
Positioning Precision XY: 11 microns [0.0004 in], Z: 2.5 microns
Filament Diameter 1.75 mm
Nozzle Diameter 0.4 mm
Me
chan
ical
an
d
dim
en
sio
nal
sp
eci
fica
tio
ns Frame and bode Powder coated steel + PVC panel
Number of extruders Two Machine dimensions 476 x 332 x 383 mm
Machine weight 17 Kg
Soft
war
e a
nd
e
lect
rica
l sp
eci
fica
tio
ns
Software ReplicatorG
Firmware Sailfish File type STL, OBJ
Operating system Windows7, MAC OSX, Linux
Connectivity USB, SD card AC input 100-240 V, approx. 2 Amp, 50-60 Hz, 350
W
Successive manufacturing
After sending all industrial specification needed, and (.stl) format files as mentioned in
experimental section to ETB3LY 3D company with some labelling instructions, so as not to mix
specimens, the printing step began. Industrial period was about 12 minutes for each tensile
specimen and 10 minutes for each impact specimen.
With great layer resolution mentioned in the technical specification of the machine, great finish
and great accuracy were observed in the made specimen products.

20
Product Specimens
Tensile Specimens:
ASTM standard used for those tensile specimens were ASTM D638 type I, and this standard
specimen will be lately discussed in testing section for its dimensions, and specific reason of
choosing it.
Sample number (1):
Figure 15: Tensile sample number (1)

21
Sample number (1) was printed with mixed specifications of 220℃ (lowest temperature) and 25
mm/sec. (lowest extruder speed). The first observation is the obvious ripping on the grip head of
the specimen which is approximately 30% of the specimen total surface area. This ripping issue
is considered to be a weak spot in the design performance, so this specimen is predicted to have
one of the lowest mechanical properties, due to this ripping deformity.
Ripping is a common problem in FDM manufacturing, and it is mainly caused due to very
unsuitable low temperature which is not sufficient to allow successful fusion to take place
between the drawn layers with each other in order to form the desired 3D shape needed, and
according to our chosen specifications this specimen was printed with a temperature of 220℃,
which is considered to be the lowest temperature chosen among the whole experiment.
The suitable temperature chosen is decided by the material formula sheet offered by the
manufacturer, which states that Z-ABS should be printed with specific temperature between 250-
260 degrees Celsius.
Sample number (2):

22
Figure 16: Tensile sample number (2)
As we can see from this specimen, ripping area covers a larger percent than sample number (1),
as it covers about 37% of the total volume of the specimen, and this larger ripping area is due to
low industrial temperature of 220℃ and highest extruder speed of 35 mm/sec. which causes
much ripping effect because no sufficient time is given for the layers drawn to completely fuse,
in addition to the already existing low temperature problem.
Sample number (3):

23
Figure 17: Tensile sample number (3)
This specimen is made by temperature of 250℃ and 30 mm./sec. extruder speed, which are
considered as center point of all desired values, because they are half way through the maximum
and minimum values of the temperature and extruder speed.
The sample’s texture is totally smooth with no abnormal roughness over any region or any
surface, also dimensional stability of the product seems to be good, but with some deformity on
one of the grip heads as shown in the figures above, and this deformity is a common problem in
FDM process, where thinning occur due to faulty disassemble of the specimen from the bed with
extra force, that changes the dimensions of the printed part while still soft due to the heat
exerted by the bed itself.

24
Sample number (4):
-
Figure 18: Tensile sample number (4)
this sample is having the best dimensional stability with no deformities or ripping over its surface,
which is an obvious proof that its industrial parameters are nominated to be the most suitable

25
among all of the printed specimens, and its industrial parameters are 280℃ (the highest
temperature), and 35 mm./sec. extruder speed (the highest speed)
Sample number (5):
Figure 19: Tensile sample number (5)
This sample is also having the best dimensional stability with no deformities or ripping, but
random flow lines occur on surface showing extra fusion due to high temperature and low speed

26
that increases the fusion period to a very high value that even exceeds the desired one causing
high surface roughness, and its industrial parameters are 280℃ (the highest temperature), and
25 mm./sec. (lowest extruder speed).
Impact Specimens
Sample number (1):
Figure 20: Impact-Charpy sample number (1)
Failed specimen with total ripping effect, and isolated layers caused by the small standing area
of the specimen on the bed, so stress applied by the moving extruder exceeds the ultimate tensile
strength of the drawn soft layer on the bed causing it to be pulled from the bed easily. Industrial
parameters of this specimen are 220℃ (lowest temperature) and 25 mm/sec. (lowest extruder
speed).

27
Sample number (2):
Figure 21: impact-Charpy sample number (2)
This sample was an external trial to enhance the expected product with severe ripping failure,
so not to be as sample number (1), where bed temperature was increased from 100 to 125
degrees Celsius, which is the glass transition temperature of Z-ABS, and this step was made to
ensure that the bed will successively hold the drawn layer into it without being ripped of the bed
easily as the extruder moves along the bed drawing the rest of the shape.

28
This way of enhancing the product seems to be partially successful as it partially made a better
product, even for the ripping and deformities in the specimen shown in the pictures above. The
industrial parameters used in this specimen are 220℃ (the lowest temperature) and highest
extruder speed of 35 mm/sec., in addition to the bed temperature of 125℃.
Sample number (3):
Figure 22: Impact-Charpy sample number (3)
This sample shows and extreme failure in the industry, where as shown in the figure above, no
single inner layer is completely drawn, which is a proof of failure in the combination of
temperature and extruder speed chosen for this specimen. Its industrial parameters are 250℃
and 30 mm./sec, which are considered as center point of all desired values, because they are half
way through the maximum and minimum values of the temperature and extruder speed.

29
Sample number (4):
Figure 23: Impact-Charpy sample number (4)
This specimen showed smooth surface, best dimensional stability, best notch positioning, and no
plastic debris in the notch. Which can lead us to consider industrial parameters of this sample to
be nominated as the best among all of the samples of this shape and its industrial parameters
are 280℃ (the highest temperature), and 35 mm./sec. extruder speed (the highest speed).

30
Sample number (5):
Figure 24: Impact-Charpy sample number (5)
This sample shows some deformities as described in tensile sample 3, where sample is smooth
with no abnormal roughness, but faulty disassemble of specimen from the bed causes thinning
deformity as shown in the figures above changing some minor dimensions. Industrial parameters
of this specimen are 280℃ (the highest temperature), and 25 mm./sec.(lowest extruder speed).

31
Mechanical Tests
Tensile Test
Introduction
Engineering plastics are used in instrument panels, interior trim, fuel tanks and other vehicle applications. Due to their viscoelastic nature, plastics exhibit important rate dependence in their stress–strain responses. The strain rate dependent stress–strain curves of these materials are mandatory input in dynamic finite element (FE) analysis for crashworthiness prediction. The experimental technique to create data at these strain rates is a research topic of practical importance. Modelling and predicting the behavior of these structures made of polymers require the knowledge of mechanical response of the materials. To obtain valid stress–strain data in a material test, the specimen should be in a state of stress equilibrium and undergo homogeneous deformation in the gage section. Usually, necking in the polymeric specimen arises at relatively small strain, which results in the inhomogeneous deformation of polymers.
Material and Specimen
Polymeric material used in this study was Acrylonitrile Butadiene Styrene (ABS). Material was specified according to ASTM D638, Type I the specimen has dumbbell shape. The test dumbbells were injection molded by the material supplier. Table below shows the geometric dimensions of the test specimen as per ASTM D638 standards.
Experimentation
Experimental tests to sort out the tensile strength of ABS material were conducted in Static Mechanical Properties Testing Laboratory of Harbin Engineering University by using Universal Testing machine Zwick/Roell Z010 (Fig.1). The Zwick/Roell Group is the world’s leading supplier of static materials testing machines, developed by experts for use in demanding testing situations and in a wide range of applications. Their static testing machines have made them ideal for the most rigorous materials and component testing requirements. Max. test load 10kN, work space height 1050mm, work space width 440mm, Maximum crosshead speed 1000 mm/min.. this experiment was made by strain rate of 5 according to ASTM standards for polymers.
Figure 25: ASTM D638 specifications

32
Figure 26: Zwick/Roell Z010 tensile machine

33
Photos for the Tensile Samples after Testing
Figure 27: Samples after tensile test

34
Testing Results
Sample number (1) stress strain curve and mechanical properties
Ultimate Tensile Strength: 9.497 MPa
Fracture Strength: 9.497 MPa
Tensile Modulus at 0.2% offset: 1.82 MPa
Elongation: 6.77%
Toughness: 62.1 MJ/m3
Resilience: 3.3 MJ/m3
Sample number (2) stress strain curve and mechanical properties
-2
0
2
4
6
8
10
12
-2 0 2 4 6 8 10 12 14 16
stre
ss/M
Pa
strain
sample 1 (Tensile test): Stress-strain curve
0
1
2
3
4
5
6
7
8
0 2 4 6 8 10 12
stre
ss/M
Pa
strain
sample 2 (tensile test): stress-strain curve

35
Ultimate Tensile Strength: 7.2 MPa
Fracture Strength: 7.2 MPa
Tensile Modulus at 0.2% offset: 2.96 MPa
Elongation: 4.87%
Toughness: 13.6 MJ/m3
Resilience: 2.5 MJ/m3
Sample number (4) stress strain curve and mechanical properties
Ultimate Tensile Strength: 17.6 MPa
Fracture Strength: 17.6 MPa
Tensile Modulus at 0.2% offset: 4.2 MPa
Elongation: 3.5%
Toughness: 56.5 MJ/m3
Resilience: 2.54 MJ/m3
-5
0
5
10
15
20
0 1 2 3 4 5 6 7 8
stre
ss/M
Pa
strain
sample 4 (tensile test): stress-strain curve

36
Sample number (5) stress strain curve and mechanical properties
Ultimate Tensile Strength: 17.18 MPa
Fracture Strength: 17.18 MPa
Tensile Modulus at 0.2% offset: 3.75 MPa
Elongation: 2.67%
Toughness: 43 MJ/m3
Resilience: 1.35 MJ/m3
Discussion
From the mechanical properties obtained and the stress strain curves for the following 4 samples,
both samples 1&2 seems so different from samples 4&5 and the main reason for this difference
is the deformation in the grip section which made the breakage occur in this section rather than
on the gage length for the samples 1&2. The calculated ultimate strength for both samples 4 & 5
are of optimum results compared to lots of other papers as "Solid Freeform Fabrication 2016:
Proceedings of the 26th Annual International Solid Freeform Fabrication Symposium – An
Additive Manufacturing Conference Reviewed Paper" which is certified from the university of
Texas, proving that our results are of good accomplishment.
The material was tested for certain properties. This research is based on international standards about testing tensile strength of plastic materials, carrying out making samples, taking experiments on testing tensile strength of 4 different samples. The result showed that the tensile strength of the material had decreased obviously in comparison with the material itself before printed. This tolerance is in permitted range and could be foundation for more accurate
-5
0
5
10
15
20
-1 0 1 2 3 4 5 6
stre
ss/M
Pa
strain
sample 5 (tensile test): stress-strain curve

37
calculations of designing printing samples, to reduce time and experiences expenditure in future tests.
Impact Test
Introduction
This section presents the Charpy impact tests on the Acrylonitrile- Butadiene-Styrene (ABS) polymeric material parts. The Charpy impact test, also known as the Charpy V-notch test, is a standardized strain rate test which determines the amount of energy absorbed by a material during fracture. This is a typical method described in ASTM Standard D 6110. We use for testing zwick roell equipment which have a fully integrated hardware and software package that let us capture load information at very high speed from the impact tests. Impact performance can be one of the most important properties for a component designer and also the most difficult to quantify. Charpy test on polymeric material is an impact tests which measure the resistance to failure of a material to a suddenly applied force. The Charpy test measures the impact energy or the energy absorbed prior to fracture. In this paper we measure the impact energy for a test specimen made by molded polymeric material, called Acrylonitrile-Butadiene- Styrene (ABS). We used the method described in ASTM Standard D6110 to study the impact behavior on samples made by ABS molded polymeric material. When the striker impacts the samples, the sample absorbed the energy until it yields. At that point, the sample began to undergo plastic deformation. The test specimen continued to absorb energy and worked hardens at the plastic zone. At the moment when the ABS sample couldn’t absorb more energy, fracture occurred. We observe that polymeric material behaves very differently at high rates of loading and for that we cannot use static strength tests to predict impact behavior. Regarding the author’s further research is to measure the impact on different polymeric material and to make a comparative study between them.
Figure 28: ASTM D6110 specifications

38
Materials Samples and Testing Equipment
Tests were done on polymeric material made from ABS and the samples measure 80±0.2, 10±0.2, 4.9±0,1 (mm), with respect to ASTM D 6110 or SR EN ISO 179 Charpy plastics testing. The testing machine that we used is a Zwick Roell Impact System with data Acquisition and Control. This Impact Test Instrument meets the need for a small mass drop weight impact test instrument with a wide range of adjustable energies and velocities. The method is applicable to sample without notch. The sample is placed horizontally on two supports, and it is the subject to disruption by a striker one-shot, applied at a distance equal support. ASTM D6110 Charpy plastics testing. A support table is included for testing large or odd-sized specimens. The impact testing system have: maximum gravity mode velocity up to 5.0 m/s, maximum spring assisted high velocity up to 20 m/s, maximum physical drop height of 1.25 meters.
Figure 29: Zwick Roell Impact System

39
Photos after Impact Test
Figure 30: Samples after impact-Charpy test

40
Testing Results
Sample 2 Sample 4 Sample 5
Absorbed energy (J) 1.437 1.194 2.935
Impact strength (KJ/M^2) 11.497 9.553 23.481
Discussion
Standard test method such as Charpy is an important tool for raw material research and quality control. The total energy, W [J] accumulates over time and increased to achieve a level of constancy, then it is absorbed in the polymeric material and the sample with the highest absorbed energy and corresponding to the highest impact strength is sample 5. Reminder: impact samples (1) and (3) were totally failed because of their chosen industrial parameters, so no Charpy impact tests were applied on them. Note: tensile sample (3) was totally excluded from the tensile test, as we have faced problems with transferring data from the machine’s computer.
Microstructure Analysis Microstructure pictures aimed of obtain clear pictures of the print lines, and to show us whether or not
the lines printed next to each other are properly fused together.
From the theoretical background we know that Z-ABS has a completely amorphous structure, and so,
the use of an etchant is not useful, as the function of an etchant is to react with the high energy grain
boundaries and show the grains. In our case, we have no grains and grain boundaries.
No preparation was made on the samples before the pictures were taken.
An important result was the following:
Figure 31: Sample 2

41
Figure 31 and figure 32 are both of the same magnification for samples 2 and 5 respectively. It is
now, form this comparison, even more clear that the print lines were not properly fused together
in sample 2, while in sample 5 they are well fused. It was clear, without taking microstructure
pictures that the print lines of sample 2 are not well fused together, however, we could not have
been sure about the degree with which those of samples 5 are fused together without doing the
microstructure. This conclusion is reinforced by a higher magnification pictures shown in figures
33 and 34 for samples 2 and 5 respectively.
Figure 32: Sample 5

42
Even on the bigger magnification the print lines are clear for sample 2, and good fusion in clear
for sample 5.
Figure 33: sample 2
Figure 34: sample 5

43
However, the following figure (figure 35), shows a part of sample 2 that has good fusion. This
might be the layer built on the bed, where the temperature of the bed might have helped the
print lines do better fusion together.
Figure 35: Sample 2 (layer built on bed)

44
The following picture (figure 36) is taken after uncovering two layers of sample 2. This uncovering
revealed a honeycomb structure, which lead us to study this structure in the next section of
macrostructure analysis.
Macrostructure Analysis
Fracture Mode
In this section, we will discuss the main features of fracture in both tensile and impact tests. By
this, we aim to determine whether the FDM printed tensile samples have shown any unexpected
behavior in their fracture mode.
Sample Pictures and Discussion
The review is made on the chosen samples 4 and 5 as they were processed by and near to the optimum
values for the printing temperature and printing speed.
Figure 36: Honeycomb structure magnified

45
Tensile Samples
As shown in figures 37 and 38, sample 4 and 5, and also all the other samples showed no necking (no
plastic deformation) before fracture. This is a key feature of brittle fracture. This is also clear is the stress
and strain curves of the samples, where the elastic region was directly followed by fracture, with no plastic
deformation region. Brittle Fracture was the expected mode or ABS parts tested under tension. From this
we conclude that fabrication by FDM has not affected this property of the material.
Figure 37: Sample 4
Figure 38: Sample 5

46
Fracture Surface
The fracture surface reveals the honeycomb structure’s cross-sectional shape. It here reveals that
the fracture plane is not fully packed with material. And so, it was expected that we obtain lower
values for the tensile strength than those of a fully packed sample. However, this is not what
happened. On comparing our results with those published by R. Hernandez et al [10], we found
that the values for sample 4 and 5 showed similar values to those published in their paper. The
following figure (41) is their summary of the values they have obtained. A red square is placed
around values for the tensile strength. This consistency in results shoes experimentally that the
honeycomb structure has not affected the tensile strength.
Figure 40: Fracture surface sample 4, tension
Figure 39: Fracture surface sample 5, tension

47
Impact Samples
Sample 4 showed a defect in the printing
near the notch. There is a cavity in the
material.
Proposed reason:
This might have happened due to an error in
the early stages of manufacturing
(mentioned in the introduction). Perhaps in
the development of the G-code or the STL
file. These errors may include that there
existed an unclosed triangle in the STL file,
that was not read by the printing machine,
and so the machine has skipped and area
without printing.
Figure 42: Fracture surface, Sample 4, impact
Figure 41: Values aimed for comparison

48
Figure 43 shows the fracture
surface of sample 5.
The surface is composed to two
regions. A region where the layers
seem to be one part (middle of the
fracture plane), and another
region surrounding it where the
layers are distinctive from one
another.
Proposed reasons for the presence of the area marked in red:
It could be that in this region, the layers where better fused together because it is the
region in the middle. Heat was trapped in the middle for a longer time than on the
surface. This allowed for more time and energy for the blending of the layers in the core
of the part.
The propagation of the crack that started at the notch has occurred first in the area
marked in red, causing the polymer chains to stretch and show this smooth surface, in
the same manner that a piece of transparent plastic turns white when bent due to chain
stretching and ordering.
Figure 43: Fracture surface, sample 5, impact

49
Honeycomb Structure Honeycomb structure is repeated hollow cells formed between
thin vertical walls in the shape of hexagons, usually sandwiched
between inside two thin layers that provide tensile strength.
Why Hexagons?
This question is answered through the “The honeycomb
Conjecture” which is a debate that roots down to 36 BC.
The honeycomb conjecture states that a regular hexagonal
grid or honeycomb is the best way to divide a surface into regions
of equal area with the least total perimeter. The conjecture was
proven in 1999 by mathematician Thomas C. Hales.
Figure 44: Honeycomb structure
Figure 45: Hexagon vs. other shapes

50
As shown in the above image, the only 2D shapes that fit together without any gaps are the triangles,
squares and hexagons. However, a hexagon can actually include triangles inside it, so drawing triangles
inside it would only be increasing the net perimeter (and in our case, the material). Moreover, squares
have a higher perimeter to space ratio, and are thus less efficient in filling up space than hexagons.
In the same way for a 3D structure, Hexagons are the most efficient shape that can fill up a space, using
the least amount of material, and thus minimizing weight and material cost, and adding value to the
specific strength of the part.
Our samples were printed in honeycomb structure with two layers on top and below printed in 45˚.
The following picture (figure 46) was taken after uncovering the two layers on top of sample 2.
Figure 46: Honeycomb structure
Printing of Honeycomb Structure
Figure 47: Single nozzle printing technique

51
Figure 48: Double nozzle printing technique
There are two FDM printing techniques, single nozzle technique and double nozzle technique. As
we can see from figure 47, single nozzle printing depends on drawing the outer frame of the
multiple hexagonal structure that forms the layer forming the orange housing shown in the
figure, then green straight lines are drawn after total layer construction in order to close the main
honeycomb structure.
As we can see from figure 48, double nozzle printing technique depends on drawing two separate
hexagons in a single round, followed by drawing two hexagons in a second round forming closed
honeycomb structure as shown in the figure, then the extruder nozzle moves three steps and
repeats the whole two round technique again.
In our manufacturing phase we have used the double nozzle printing technique as it follows the
fastest route for the machine to build the desired shapes in only 11 minutes for every tensile
specimen, and 8 minutes for every impact specimen. Those print timing values are not a general
trend for the speed of the two processes, but the chosen technique is used according to the
design shape and material.
-

52
Statistical Analysis
Introduction
The term experiment is defined as the systematic procedure carried out under controlled conditions in order to discover an unknown effect, to test or establish a hypothesis, or to illustrate a known effect. When analyzing a process. Experiments are used widely in the engineering world
Process characterization & optimization.
Evaluation of material properties.
Product design & development.
Component & system tolerance determination. Statistical design of experiments refers to the process of planning the experiment so that appropriate data will be collected and analyzed by statistical methods, resulting in valid and objective conclusions. In case the experiment involves data that are subject to experimental errors, statistical methods are the only objective approach to analysis. Thus, there are two aspects to any experimental problem: the design of the experiment and the statistical analysis of the data. These two subjects are closely related because the method of analysis depends directly on the design employed.
Guidelines for Designing Experiments
To use the statistical approach in designing and analyzing an experiment, it is necessary for everyone involved in the experiment to have a clear idea in advance of exactly of what is to be studied, how the data are to be collected, and at least a qualitative understanding of how these data are to be analyzed. Obtaining good result from a DOE involves these six steps:
Objectives Setting.
Process Variables Selection.
Experimental Design Selection.
Experiment Execution.
Results Analysis and Interpretation.
Conclusions and Recommendations.
Objectives Setting
Planning an experiment begins with carefully considering what the objectives (or goals) are. All the objectives should be written down, even the "unspoken" ones. It is usually helpful to prepare a list of specific problems or questions that are to be addressed by the experiment. A clear statement of the problem often contributes substantially to better understanding of the phenomenon being studied and the final solution of the problem.
Process Variables Selection
Process variables include both inputs and outputs - i.e., factors and responses. The selection of these variables is best done as a team effort. The team should
Include all important factors (based on engineering judgment).

53
Decide the region of interest for each variable (that is, the range over which each factor will be varied) and on how many levels of each variable to use. Process knowledge is required to do this. This process knowledge is usually a combination of practical experience and theoretical understanding.
Check the factor settings for impractical or impossible combinations - i.e., very low temperature and very high speed.
Include all relevant responses.
Experimental Design Selection.
The choice of an experimental design involves and depends on
The objectives of the experiment.
The number of factors to be investigated.
Number of replicates.
Selection of a suitable run order for the experimental trials
Determination of whether or not blocking or another randomization
Restrictions are involved.
Experiment Execution.
When running the experiment, it is vital to monitor the process carefully to ensure that
everything is being done according to plan. Errors in experimental procedure at this stage will
usually destroy experimental validity.
Results Analysis and Interpretation.
If the experiment has been designed correctly and performed according to the design, then we
can answer the questions in our experimental objectives easily by using statistical techniques
such as graphical methods. Statistical methods cannot prove that a factor (or factors) has a
particular effect. They only provide guidelines as to the reliability and validity of results, when
properly applied. Statistical techniques coupled with good engineering or process knowledge and
common sense will usually lead to sound conclusions.
Conclusions and Recommendations.
Once the data have been analyzed, the experimenter must draw practical conclusions about the
results and recommend a course of action. Graphical methods are often useful in this stage,
particularly in presenting the results to others. Finally, it is important to recognize that all
experiments are designed experiments. The important issue is whether they are well designed
or not. Good pre-experimental planning will usually lead to a good, successful experiment. Failure
to do such planning usually leads to wasted time, money, and other resources and often poor or
disappointing results.

54
Design of Experiment
The experiments were conducted based on the full factorial design approach of the Design of
experiments. The full factorials examine every possible combination of factors at the levels
tested. Thus, in the full factorial design, the full information about the main as well as the
interaction effects was obtained. The control factors such as the printing speed and printing
temperature were identified as important variables that may influence the mechanical behavior
of the ABS polymer. The factors and their levels selected are presented in Table 1.
Total number of experimental runs for the full factorial design is indicated in Table 2.

55
DOE Analysis of ABS Polymer
In this work, a commercially available software package (MINITAB 18) was used for the
computation work. The mechanical behavior of the ABS polymer specimens was analyzed in
order to study the effects of the parameters and answering the following questions:
What are the important factors (not including interactions)?
What are the important factors (including interactions)?
What is the best setting for each of the 2-factor?
In the above questions, the terms "important" and “best", need clarification and specificity:
A factor can be "important" if it leads to a significant shift in either the location or the variation
of the response variable as we go from the "-" setting to the "+" setting of the factor.
A factor setting is "best" if it results in a typical response that is closest, in location, to the
desired project goal (maximization, minimization, or target).
Table 3. gives UTS, modulus of toughness, and elongation.

56
The main effects at all levels, on the UTS, elongation and modulus of toughness, are calculated
and listed in Table 4.
From the tensile study, it is revealed that an increase in the printing temperature improves the
tensile strength by 9.082%, while an increase in the printing speed reduces it by 0.989%. From
the elongation study, it is revealed that an increase in the printing temperature reduces the
elongation by 2.73%, while an increase in the printing speed also reduces it by 0.535%. From the
modulus of toughness study, it is revealed that an increase in the printing temperature improves
the modulus of toughness by 11.90%, while an increase in the printing speed reduces it by -
17.50%.

57
A “main effect” is the effect of one of your independent variables on the dependent variable,
ignoring the effects of all other independent variables the main effects and interaction for the
ultimate tensile strength is plotted in Figure above.
The DOE mean plot shows the following:
1. Ranked list of factors:
1- The printing temperature factor (X1) is the most significant factor, because the
difference between the two points is 9 units approximately.
2- The printing speed factor (X2) has minimal effect.
2. Best settings (on average):
(X1, X2) = (280℃, 25 mm/sec)
The Interaction plot reveals that the effect of printing speed is less dominant at elevated temp.
and the temperature factor is a significant no matter the speed.
The more nonparallel the line are, the greater the strength of the interaction. It means that UTS
increases with increasing temp. Decreases with increasing the speed at low temperatures.

58
The DOE mean plot shows the following:
1- Ranked list of factors:
1. The printing speed factor (X2) is the most significant factor, because the difference
between the two points is 17 units approximately.
2. The printing temperature factor (X1) has minimal effect.
2- Best settings (on average):
(X1, X2) = (280℃, 25 mm/sec)
In this interaction plot, the lines are not parallel. This interaction effect indicates that the
relationship between printing temperature and toughness depends on the printing speed
magnitude. For example, if we use printing temperature at 280℃, printing speed at 35 mm/sec
is associated with the highest mean toughness. However, if we use printing temperature at
220℃, printing speed at 25 mm/sec is associated with the highest mean toughness.
We’d say there is no overall effect of either printing speed or printing temperature, but there is
a crossover interaction.

59
The DOE mean plot shows the following:
1- Ranked list of factors:
1. The printing temperature factor (X1) is the most significant factor, because the
difference between the two points is 3 units approximately.
2. The printing speed (X1) has minimal effect.
2- Best settings (on average):
(X1, X2) = (220℃, 25 mm/sec)
The Interaction plot reveals that the effect of printing speed is more dominant at low
temperature and the temperature factor is highly significant.
There is an interaction because the magnitude of the difference between 220 ℃ and 280 ℃ is
different at different levels of the printing speed.

60
Conclusion In this project, the influence of the printing speed and printing temperature on the mechanical
behavior ABS polymer was studied. The following conclusions are derived from this study:
From the tensile study, it is revealed that an increase in the printing temperature
improves the tensile strength by 9.082%, while an increase in the printing speed reduces
it by 0.989%.
From the elongation study, it is revealed that an increase in the printing temperature
reduces the elongation by 2.73%, while an increase in the printing speed also reduces it
by 0.535%.
From the modulus of toughness study, it is revealed that an increase in the printing
temperature improves the modulus of toughness by 11.90%, while an increase in the
printing speed reduces it by 17.50%.
The optimum process parameters are found to be a printing speed of 35 mm/sec and a
printing temperature of 280 ℃. The optimized ultimate tensile strength, modulus of
toughness and elongation values are 17.185 MPa, 56.5 MJ/m3 and 3.50% respectively.
Experimentally, the honeycomb structure had no significant effect on the mechanical
properties, while it had the advantage of minimizing the amount of material used.
61
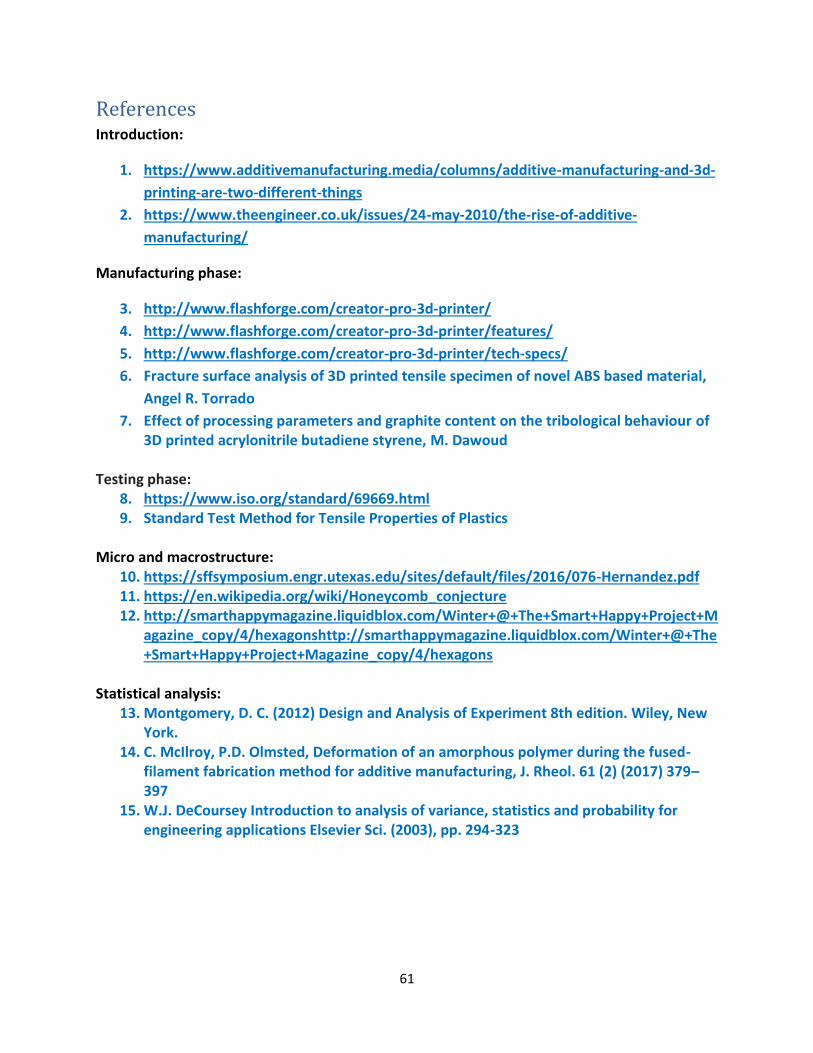
References Introduction:
1. https://www.additivemanufacturing.media/columns/additive-manufacturing-and-3d-
printing-are-two-different-things
2. https://www.theengineer.co.uk/issues/24-may-2010/the-rise-of-additive-
manufacturing/
Manufacturing phase:
3. http://www.flashforge.com/creator-pro-3d-printer/
4. http://www.flashforge.com/creator-pro-3d-printer/features/
5. http://www.flashforge.com/creator-pro-3d-printer/tech-specs/
6. Fracture surface analysis of 3D printed tensile specimen of novel ABS based material,
Angel R. Torrado
7. Effect of processing parameters and graphite content on the tribological behaviour of 3D printed acrylonitrile butadiene styrene, M. Dawoud
Testing phase:
8. https://www.iso.org/standard/69669.html 9. Standard Test Method for Tensile Properties of Plastics
Micro and macrostructure:
10. https://sffsymposium.engr.utexas.edu/sites/default/files/2016/076-Hernandez.pdf 11. https://en.wikipedia.org/wiki/Honeycomb_conjecture 12. http://smarthappymagazine.liquidblox.com/Winter+@+The+Smart+Happy+Project+M
agazine_copy/4/hexagonshttp://smarthappymagazine.liquidblox.com/Winter+@+The+Smart+Happy+Project+Magazine_copy/4/hexagons
Statistical analysis:
13. Montgomery, D. C. (2012) Design and Analysis of Experiment 8th edition. Wiley, New York.
14. C. McIlroy, P.D. Olmsted, Deformation of an amorphous polymer during the fused-filament fabrication method for additive manufacturing, J. Rheol. 61 (2) (2017) 379–397
15. W.J. DeCoursey Introduction to analysis of variance, statistics and probability for engineering applications Elsevier Sci. (2003), pp. 294-323

62
Signature 1) Farida Elhamy Loutfy
2) Michael Sherif Talaat
3) Mohamed Ahmed Waheed
4) Shehab El-Din Mohamed Ashraf Zaki