An Investigation Into The Apparent Over-representation Of ...
158
University of Central Florida University of Central Florida STARS STARS Electronic Theses and Dissertations, 2004-2019 2004 An Investigation Into The Apparent Over-representation Of Blacks An Investigation Into The Apparent Over-representation Of Blacks In Educable Mentally Handicapped Programs In K-12 Schools In Educable Mentally Handicapped Programs In K-12 Schools Within The 67 Florida Public School Districts Within The 67 Florida Public School Districts Arlene H. Thomson University of Central Florida Part of the Educational Leadership Commons Find similar works at: https://stars.library.ucf.edu/etd University of Central Florida Libraries http://library.ucf.edu This Doctoral Dissertation (Open Access) is brought to you for free and open access by STARS. It has been accepted for inclusion in Electronic Theses and Dissertations, 2004-2019 by an authorized administrator of STARS. For more information, please contact [email protected]. STARS Citation STARS Citation Thomson, Arlene H., "An Investigation Into The Apparent Over-representation Of Blacks In Educable Mentally Handicapped Programs In K-12 Schools Within The 67 Florida Public School Districts" (2004). Electronic Theses and Dissertations, 2004-2019. 120. https://stars.library.ucf.edu/etd/120
Transcript of An Investigation Into The Apparent Over-representation Of ...

University of Central Florida University of Central Florida
STARS STARS
Electronic Theses and Dissertations, 2004-2019
2004
An Investigation Into The Apparent Over-representation Of Blacks An Investigation Into The Apparent Over-representation Of Blacks
In Educable Mentally Handicapped Programs In K-12 Schools In Educable Mentally Handicapped Programs In K-12 Schools
Within The 67 Florida Public School Districts Within The 67 Florida Public School Districts
Arlene H. Thomson University of Central Florida
Part of the Educational Leadership Commons
Find similar works at: https://stars.library.ucf.edu/etd
University of Central Florida Libraries http://library.ucf.edu
This Doctoral Dissertation (Open Access) is brought to you for free and open access by STARS. It has been accepted
for inclusion in Electronic Theses and Dissertations, 2004-2019 by an authorized administrator of STARS. For more
information, please contact [email protected].
STARS Citation STARS Citation Thomson, Arlene H., "An Investigation Into The Apparent Over-representation Of Blacks In Educable Mentally Handicapped Programs In K-12 Schools Within The 67 Florida Public School Districts" (2004). Electronic Theses and Dissertations, 2004-2019. 120. https://stars.library.ucf.edu/etd/120

AN INVESTIGATION INTO THE APPARENT OVER-REPRESENTATION OF BLACKS
IN EDUCABLE MENTALLY HANDICAPPED PROGRAMS IN K-12 SCHOOLS WITHIN THE
67 FLORIDA PUBLIC SCHOOL DISTRICTS
by
ARLENE H. THOMSONB.S. University of the West Indies, 1981
M.B.A. Baruch College, 1987M.S.W. University of Central Florida, 1998
A dissertation submitted in partial fulfillment of the requirementsfor the degree of Doctor of Education
in the Department of Educational Foundations in the College of Education
at the University of Central FloridaOrlando, Florida
Spring Term2004
Major Professor: Barbara A. Murray

ii
© 2004 Arlene H. Thomson

iii
ABSTRACT
Placement into educable mentally handicapped (EMH) programs is necessary for some
students in order to allow them the opportunity to receive an education appropriate for their
special needs. Nonetheless, identification as EMH is often perceived as negative and demeaning.
Decades of research have substantiated the over-representation of black students into certain
categories of special education, including EMH, in comparison to white and Hispanic students.
This disparity has raised questions within schools, academe and research communities, and
legislative and governing bodies as to the causes, compelling factors, and related variables
impacting the phenomenon.
This study investigated the apparent over-representation of blacks identified as EMH in
the 67 public school districts in Florida in 2001–2002. It also analyzed the effects certain school
district characteristics had on the identification of white, black, and Hispanic students as EMH.
Analysis of data derived from the Florida Department of Education database for school
year 2001–2002 led to the following findings: (1) there was over-representation of blacks in
EMH within the 67 public school districts in Florida, since results showed that blacks were
identified as EMH 2.5 times more often than whites and Hispanics; (2) socioeconomic status of
school districts had a significant effect on the identification of black students as EMH; for
example, when the school district was identified as a high socioeconomic status district, there
was a greater likelihood that a larger proportion of black students would be identified as EMH;
(3) as the wealth of school districts rose, there was a significant likelihood that the proportion of

iv
black students identified as EMH would also rise; (4) black students had a greater likelihood of
being identified as EMH in suburban school districts; (5) blacks were over-identified in school
districts that had 60,000 to 89,000 students; (6) when there was a high percentage of white, full-
time, non-instructional staff (80% or more) in school districts, blacks had a greater likelihood of
being over-identified as EMH; (7) blacks were three times more likely to be identified as EMH
regardless of the type of degrees teachers had; and, (8) as district expenditure per student (FTE)
increased, the tendency for over-identification of blacks as EMH decreased. For every variable
analyzed, the proportion of black students identified as EMH was significant when compared to
the proportions of white and Hispanic students also identified as EMH.

v
ACKNOWLEDGMENTS
My sincere thanks go to all my committee members, especially to my committee
chairperson, Dr. Barbara Murray. She believed in me from the very onset of my doctoral classes
and encouraged me to keep striving to complete this dissertation even when I was at the breaking
point. Her tireless hours spent reading and correcting my paper forced me to try harder at each
re-write. I extend special thanks to Dr. Lea Witta, who taught me the intricacies of statistics and
research and who held my hand through this research analysis and interpretation. I thank Dr.
Rose Taylor for keeping me focused on the topic. Her objective reading of the drafts and her
astuteness re-shaped my passion for this topic and helped me to strive for balance throughout this
process. Many thanks go to Dr. Cheryl Green who kept me inspired when I felt discouraged and
who maintained my sense of humor through her words of wisdom. I thank Dr. Carl Balado who
whetted my thirst for the discipline of school psychology and for the extended loans of his texts.
Special thanks are extended to my editor, Ms. Karen Lane, who spent numerous hours
proofreading, editing, and correcting this document. Her many emails drove me to ferret out the
correct documentation and references. I also thank the counselors at the University of Central
Florida's Writing Center who edited my first rough draft and helped me immensely with their
insights on writing.
I owe a special vote of thanks to my supervisors and colleagues at the Urban Cohort
Learning Community of Orange County Public Schools. I thank my family and friends who were
my cheerleaders, coaches, prayer partners, and support group. Finally, I thank my husband,

vi
Patrick, and my two teenage sons, Malcolm and Duncan, for being so helpful, cooperative, and
understanding, especially when Mom had no time to cook dinners, help with homework, read a
book with you, listen to your issues, or spend quality time with you.

vii
TABLE OF CONTENTS
LIST OF FIGURES ....................................................................................................................... ixLIST OF TABLES.......................................................................................................................... xCHAPTER 1. THE PROBLEM AND ITS CLARIFYING COMPONENTS................................ 1
Introduction................................................................................................................................. 1Problem Statement ...................................................................................................................... 4Purpose of the Study ................................................................................................................... 5Definitions of Terms................................................................................................................... 5Limitations of This Study ........................................................................................................... 7Delimitation ................................................................................................................................ 8Conceptual Framework............................................................................................................... 8Research Questions................................................................................................................... 10Methodology............................................................................................................................. 11Data Collection and Analysis ................................................................................................... 12Significance of the Study.......................................................................................................... 12Organization of the Study ......................................................................................................... 13
CHAPTER 2. REVIEW OF LITERATURE................................................................................ 14Introduction............................................................................................................................... 14Historical Perspectives.............................................................................................................. 14Demographic Characteristics.................................................................................................... 19Causes for Over-Representation ............................................................................................... 22Environmental and Socioeconomic Factors ............................................................................. 28Psychological Testing, Assessment, Classification, and Placement......................................... 33Measures of Intelligence........................................................................................................... 40
Wechsler Scales of Intelligence ............................................................................................ 41Stanford-Binet Intelligence Scale Fourth Edition (SB: FE) ................................................. 42Kaufman Assessment Battery for Children (K-ABC): Mental Processing Scales ............... 43Kaufman Adolescent and Adult Intelligence Test (KAIT)................................................... 44The Kaufman Brief Intelligence Test (KBIT) ...................................................................... 45Cognitive Assessment System (CAS)................................................................................... 46Woodcock-Johnson Psycho-Educational Battery-Revised: Tests of Cognitive Ability (WJ-R)................................................................................... 46Differential Abilities Scales (DAS) ...................................................................................... 47Columbia Mental Maturity Scale (CMMS) .......................................................................... 48McCarthy Scales of Children’s Abilities (MSCA) ............................................................... 49Slosson Intelligence Test- Revised (SIT-R) ......................................................................... 50Otis-Lennon School Ability Test (OLSAT) ......................................................................... 50Comprehensive Test of Nonverbal Intelligence (CTONI).................................................... 51

viii
Test of Nonverbal Intelligence – Third Edition (TONI-3) ................................................... 51Universal Nonverbal Intelligence Test (UNIT) .................................................................... 52
Legislation and Court Cases ..................................................................................................... 53Obstacles to Change.................................................................................................................. 58Ideas for Reducing the Over-Representation of Blacks in EMH.............................................. 60
CHAPTER 3. METHODOLOGY ................................................................................................ 67Introduction............................................................................................................................... 67Problem Statement .................................................................................................................... 67Research Questions................................................................................................................... 68Methodology............................................................................................................................. 69Data Collection and Analysis ................................................................................................... 73Summary................................................................................................................................... 74
CHAPTER 4. DATA ANALYSIS ............................................................................................... 75Introduction............................................................................................................................... 75Description of the 67 Public School Districts........................................................................... 75Research Question 1 ................................................................................................................. 78Research Question 2 ................................................................................................................. 83Research Question 3 ................................................................................................................. 86Research Question 4 ................................................................................................................. 89
Population Density (Urbanicity) ........................................................................................... 90School District Size............................................................................................................... 92Racial Composition of Staff.................................................................................................. 95Teachers’ Degrees................................................................................................................. 99District Expenditure on Students ........................................................................................ 102
Summary................................................................................................................................. 104CHAPTER 5. SUMMARY, CONCLUSIONS, IMPLICATIONS, AND RECOMMENDATIONS ............................................................................................. 105
Introduction............................................................................................................................. 105Problem Statement .................................................................................................................. 105Methodology........................................................................................................................... 105
Population and Data Collection .......................................................................................... 105Data Analysis ...................................................................................................................... 106
Summary and Discussion of Findings .................................................................................... 106Research Question 1 ........................................................................................................... 106Research Question 2 ........................................................................................................... 107Research Question 3 ........................................................................................................... 109Research Question 4 ........................................................................................................... 109
Conclusions............................................................................................................................. 114Implications and Recommendations for Practice ................................................................... 116Recommendations for Future Research.................................................................................. 118
APPENDIX. DATABASE TABLES ......................................................................................... 120LIST OF REFERENCES............................................................................................................ 139

ix
LIST OF FIGURES
Figure 1: Plot for the Average Proportions of EMH Whites, EMH Blacks, and EMH Hispanics Within Three Levels of Socioeconomic Status Within the 67 Public School Districts...................................................................................... 86Figure 2: Plot for the Average Proportions of EMH Whites, EMH Blacks, and EMH Hispanics Within Four Ranks of Public School District Wealth ............................ 89Figure 3: Plot for the Average Proportions of EMH Whites, EMH Blacks, and EMH Hispanics Within Urban, Suburban, and Rural School Districts ............................ 92Figure 4: Plot for the Average Proportions of EMH Whites, EMH Blacks, and EMH Hispanics Within Four Ranks of Public School District Size................................. 95Figure 5: Plot for the Average Proportions of EMH Whites, EMH Blacks, and EMH Hispanics Within Five Ranks of White, Full-Time, Non-Instructional Staff in Public School Districts ........................................................................................................ 98Figure 6: Plot for the Average Proportions of EMH Whites, EMH Blacks, and EMH Hispanics Within Three Ranks of Teachers With Bachelor’s Degrees in Public School Districts ...................................................................................................... 101Figure 7: Plot for the Average Proportions of EMH Whites, EMH Blacks, and EMH Hispanics Within Four Ranks of Public School District FTE............................... 104

x
LIST OF TABLES
Table 1. Total Student Enrollment, Total EMH Students, and Total Students on Free/Reduced Lunch for Florida’s 67 Public School Districts for School Year 2001–2002..................................................................................................... 76Table 2. Classification of School District Wealth, Number, and Percentage of Districts in Each Category................................................................................................... 77Table 3. Hispanics in General Enrollment and Hispanics in EMH for 13 School Districts ......... 79Table 4. Ratio of Whites, Blacks, and Hispanics Identified as EMH to Eight Variables Under Study Within Florida’s 67 Public School Districts for School Year 2001–2002..................................................................................................... 82Table 5. Percentages of Students on Free/Reduced Lunch for School Year 2001–2002 ............. 84Table 6. School District Rank Based on Wealth........................................................................... 87Table 7. School District Urbanicity Rank..................................................................................... 90Table 8. School District Rank Based on Student Enrollment for School Year 2001–2002 ......... 93Table 9. School District Ranks Based on White, Full-Time, Non-Instructional Staff Within Public School Districts for School Year 2001–2002................................................... 96Table 10. School District Ranks Based on the Percentage of Teachers With Bachelor’s Degrees ......................................................................................................... 99Table 11. School District Rank Based on Full Time Equivalency (FTE) for School Year 2001–2002................................................................................................... 102Table 12. Racial Composition of Students in General and EMH Enrollment (Numbers).......... 121Table 13. Racial Composition of Students in Total Enrollment and EMH Enrollment (Percentages) ...................................................................................... 123Table 14. Proportion of White, Black, and Hispanic Students Identified as EMH for 67 School Districts ........................................................................................................... 125Table 15. Percentage of Students on Free/Reduced Lunch for the 67 School Districts for School Year 2001–2002................................................................................................... 127Table 16. School District Ranks Based on Wealth ..................................................................... 129Table 17. Population Density (Urbanicity) and District Size ..................................................... 131Table 18. Racial Composition of Full-Time Staff ...................................................................... 133Table 19. Degree Level of Teachers ........................................................................................... 135Table 20. School District FTE .................................................................................................... 137

1
CHAPTER 1
THE PROBLEM AND ITS CLARIFYING COMPONENTS
Introduction
Over-representation of black students in the educable mentally handicapped (EMH)
category of special education has been of concern to many educators for about thirty years. Since
the edict of the 1975 Public Law 94-142 mandated free and appropriate education for all
children, many students, especially black students, are being over-identified and served under the
umbrella of EMH. The revised Individuals with Disabilities Act (IDEA) of 1997 mandates that
the local and state level of education monitor and report disproportionality of racial student
placement into special education. Several researchers have also called on district, state, and
national-level administrators to monitor special education placements and the nature of
instructional services offered, with particular attention to racial concerns (Lambert, 1988;
Oswald, Coutinho, Best, & Singh, 1999; Zhang & Katsiyannis, 2002).
Increasingly, a disproportionate number of black students is labeled EMH (MacMillan &
Reschly, 1998). Approximately 3% of the American population has a mental handicap, ranging
from mild to severe. Research findings indicate that between 2.75% and 5.41% of black students
tend to be identified as EMH, which is a mild form of mental handicap (Henson, 2003;
Ysseldyke & Algozzine, 1990). Students who have an intelligence quotient (IQ) score of less
than 70 but more than 55 are classified as EMH and thus qualify for special education services
(Harper & Harper, 1998).

2
Approximately 41% of special education students are from linguistically and culturally
diverse backgrounds. Based on a review of the literature, black students experience over-
representation in EMH programs (Civil Rights Project, 2002; Grossman, 1998; Moore & Cooper,
1984). Although in 1998 they accounted for only 12% of the nation’s elementary and secondary
school population, they constituted 28% of the total enrollment in special education (Grossman,
1998; Harper & Harper, 1998; Zhang, & Katsiyannis, 2002).
According to the Civil Rights Project (2002), certain states and school districts tend to
exhibit an over-representation of black students with the label of EMH. Southern states
constituted nearly three-quarters of the states with unusually high incidence levels; between
2.75% and 5.41% of black students enrolled in schools were classified as EMH. These states
include Mississippi, South Carolina, North Carolina, Florida, and Alabama.
Since approximately 1.4% of the school-age population is identified with a mild
(educable), moderate (trainable), severe, or profound mentally handicap (Ysseldyke &
Algozzine, 1990), it would therefore seem quite unlikely that such large percentages of black
students (2.75% to 5.41%) would be classified as EMH. The reasons cited for this over-
representation of black students and other minority students thus labeled include prejudice and
discrimination, teacher bias, and cultural bias within the testing instruments (Grossman, 1998;
Harry, 1992; Low & Clement, 1982; Moore & Cooper, 1984; Simpson & Erickson, 1983).
Other researchers, such as MacMillan & Reschly (1998), alluded to the idea that black
students might have been over-identified into this category because of poverty. Since a
disproportionate number of black students live in poverty, there is a greater likelihood they
would be identified as EMH. These authors stated, “When ethnicity is the only independent
variable, interpretations tend to emphasize the ‘figment of the pigment’” (p. 6).

3
Oswald et al. (1999) conducted a study using a nationally representative sample of 4,902
school districts comprising more than 43,000 schools across the nation and found that the six
environmental variables they selected for measurement (housing, income, poverty, at risk,
dropout, and Limited English Proficiency – LEP) were all significantly related to the probability
of being in the EMH program. These researchers also found that when demographics and
poverty were held constant, the evidence overwhelmingly substantiated that over-identification
into EMH was significantly influenced by race.
The literature review discusses several causes for EMH. These include hereditary factors,
alterations of embryonic development, pregnancy and prenatal problems, physical disorders
acquired in childhood, and environmental influences, especially poverty (Algozzine, Ysseldyke,
Kauffman, & Landrum, 1991; American Psychiatric Association, 1994; Henson, 2003;
MacMillan & Reschly, 1998; Oswald et al., 1999).
All students with handicapping circumstances are legally entitled to free and appropriate
education under IDEA. However, these children are often relegated to services in non-
inclusionary classroom settings that reduce the time they spend with non-disabled peers. While
there is certainly a need to provide EMH students with special educational services to help them
learn and develop, services should be of the very best quality possible to meet students’ needs
and to help them grow and develop as other, non-disabled students. Nevertheless, it would
appear that too many students, including black students, might be misdiagnosed and mislabeled
as EMH and thus placed into special education classes that provide them with less of a chance to
succeed in today’s competitive society. Patton (1998) pointed out that many students are
inappropriately staffed into special education and as a result, they “fail to receive a quality and

4
life-enhancing education” since they “miss essential general education academic and social
curricula” (p. 25).
Problem Statement
Over-representation of black students is a problem when it comes to EMH, because of the
perceptions and stigma it evokes for the individual students, their families, the community, and
the wider population (MacMillan & Reschly, 1998). It also gives the impression that black
students in general are not intelligent. This identification creates an assumption that they cannot
learn and for the most part are deemed to lead a substandard existence, especially since
intelligence, via education, has its greatest effect in the assortment of individuals into
occupational roles (Jensen, 1969).
The literature suggests that the socioeconomic status of students bears a significant
relationship to the identification and placement of students into EMH. Children who live in
poverty have a greater likelihood of being recognized as EMH (Artiles & Trent, 1994;
MacMillan & Reschly, 1998; Monson, 2003; Newman, 1995; Oswald et al., 1999; Yeargin-
Allsopp, Drews, Decoufle, & Murphy, 1995).
Characteristics of the public school district may also influence identification of these
children. In measuring socioeconomic status, White, in his 1982 analysis of more than 70
different variables used to measure SES, found that the top three variables in the school
resources category were instructional expense per pupil, salary of teachers, and percentage of
teachers with master’s degrees (Valencia & Suzuki, 2001). Hence, two of these variables,
namely, expenditure on students’ education or FTE and teachers’ advanced learning, along with
school district’s wealth, population density (urbanicity), size, and racial composition of full-time,

5
non-instructional staff have been included as the characteristics of school districts that will be
analyzed to measure their effects on the identification of black students in EMH.
Purpose of the Study
The purpose of this study is two-fold. One is to investigate relevant data to see if over-
representation of black students existed in Florida’s 67 public school districts in 2001–2002. The
other is to analyze the effects of certain characteristics of Florida public school districts on the
identification of black students in programs for EMH. The desired outcome of this investigation
is to produce information relevant to educational leaders in Florida public school districts that
will help to produce dynamic strategies resulting in the reduction of the over-identification of
black students as EMH if this situation is occurring.
Definitions of Terms
The following definitions are provided for terms that have application for this study.
Over-representation of a given racial group: a situation in which the proportion of a racial
group enrolled in a given category of special education exceeds the proportion of that racial
group in the school population at the school, district, state, or national level (MacMillan &
Reschly, 1998).
Special education: specially designed instruction, provided at no cost to the parent, to
meet the unique needs of a child with a disability, particularly a child with mental handicap
(Harper & Harper, 1998).
Mentally handicapped: significantly subaverage general intellectual functioning existing
concurrently with deficits in adaptive behavior and manifested during the development period,

6
which adversely affects a child’s educational performance (Harper & Harper, 1998). The IQ
score on a psychoeducational test will be less than 70.
Educable mentally handicapped (EMH): the classification assigned to a person whose IQ
score falls in the range of 55 to 69 (Sattler, 2001).
Adaptive behavior: the effectiveness or degree with which the individual meets the
standards of personal independence and social responsibility expected of his or her age and
cultural group (Ysseldyke & Algozzine, 1990). These personal independence and social
responsibility categories are further broken down into areas of communication, home living,
community use, health and safety, leisure, self-care, social skills, self-direction, functionality,
academics, and work (Henson, 2003).
Black: a non-white, non-Hispanic person having origin in any of the black racial groups
in Africa (Florida Department of Education, 1994). This researcher is using this term
consistently throughout this paper. However, when referring to other authors, this term is used
interchangeably with “minorities” and “African Americans.”
White: a non-Hispanic person having origin in any of the original peoples of Europe,
North Africa, or the Middle East (Florida Department of Education, 1994).
Hispanic: a person of Mexican, Puerto Rican, Cuban, or South or Central American
origin or other Spanish culture or origin, regardless of race (Florida Department of Education,
1994).
Environmental deprivation: social, biological, and cultural influences that are withheld
from, or are minimally afforded to children that can result in a mental handicap (Jensen, 1969).

7
Socio-economic status: an indicator measured by the percentage of enrolled students who
are receiving free or reduced lunch for the school year 2001–2002 as reported by the Florida
Department of Education database.
School district: a public school district.
School district wealth: the non-exempt, assessed valuation of property divided by the
total student enrollment within that school district (wealth of the district per student).
Rural school district: a public school district identified by the Florida Department of
Education as one of the 37 public school districts within the three rural regional consortia. These
consortia are the Heartland Educational Consortium, the North East Florida Educational
Consortium, and the Panhandle Area Educational Consortium.
Urban school district: a public school district in Florida not defined by the Florida
Department of Education that has within it a major metropolitan city. The five metropolitan
cities are Fort Lauderdale, Jacksonville, Miami, Orlando, and Tampa.
Suburban school district: a public school district not identified by the Florida Department
of Education as rural and which does not meet the criteria for an urban public school district.
School district expenditure per student: the expense per full-time equivalency (FTE) for
the 2001–2002 school year.
Limitations of This Study
Data were collected from the 67 public school districts in Florida over a one-year period,
that is, school year 2001–2002, as reported to the Florida Department of Education (DOE). The
organization of public school districts that coincide with the 67 counties tends to concentrate
wealth. The actual numbers for whites, blacks, and Hispanics might overlap due to racial

8
classification given by parents or school officials regarding the racial groups in which some
students might be included. For example, a black Hispanic student might be classified as black or
as Hispanic. Certain school districts’ data might have skewed the results of the research analysis,
but these were not excluded, because the analysis was intended to include all 67 school districts.
Dade, with its large student enrollment, and Monroe, with its large wealth base, are just two
examples of school districts that might have skewed the results of the analysis. The definitions of
rural, urban, and suburban school districts might be unique to the state of Florida.
Delimitation
This study was delimited to include all 67 public school districts in Florida.
Conceptual Framework
The effects of poverty, race/ethnicity, and limited English proficiency complicate the
identification and assessment of students for EMH. IDEA, the federal law that guarantees
students with disabilities the right to free and appropriate education in the least restrictive
environment, was reauthorized, in part, to address race-based disproportionality in special
education programs (Paolino, 2002). The section of the law relevant to this topic reads as
follows:
300.755 Disproportionality
(a) General. Each State that receives assistance under Part B of the Act, and the Secretaryof the Interior, shall provide for the collection and examination of data to determine ifsignificant disproportionality based on race is occurring in the State or in the schoolsoperated by the Secretary of the Interior with respect to -
(1) The identification of children as children with disabilities, including theidentification of children as children with disabilities in accordance with a particularimpairment described in section 602 (3) of the Act; and (2) The placement in particular educational settings of these children.

9
(b) Review and Revision of Policies, Practices, and Procedures. In the case of adetermination of significant disproportionality with respect to the identification ofchildren with disabilities, or the placement in particular educational settings of thesechildren, in accordance with paragraph (a) of this section, the State or the Secretary of theInterior shall provide for the review and, if appropriate, revision of the policies,procedures, and practices used in the identification or placement to ensure that thepolicies, procedures, and practices comply with the requirements of Part B of the Act(Authority:20 U.S.C. 1418(c)).
Several court cases have dealt with over-representation in EMH over the years. Perhaps
the most notable was the Larry P case of 1972. In the court settlement, the state of California
was ordered to stop using any standardized intelligence tests with black students when they were
referred as possible candidates for EMH. Other well-known cases include the Diana v.
California State Board of Education (1970), PASE v. Hannon (1980), and Marshall et al. v.
Georgia (1984) (Reschly & Bersoff, 1999; Swanson & Watson, 1989). These cases are discussed
in detail in the literature review.
The U.S. Office of Civil Rights (OCR) tracks the proportionality of black children in
several categories of special education among the 50 largest school districts in the United States.
Notwithstanding the legal precedence, these school districts have consistently shown over-
representation of black students in the EMH and emotionally handicapped categories of special
education. However, since a disproportionate number of black students who live in large
metropolitan cities also live in poverty, the research seems to infer that disproportionality of
blacks into these categories of special education has to do less with race and more with poverty
(MacMillan & Reschly, 1998). In an earlier investigation, another researcher, Hodgkinson
(1995), came to similar conclusions.
To some extent, race diverted our attention from the most urgent issue: poverty reducesthe quality of the lives of all children, regardless of race or ethnicity. Had we spent the 40years since the Brown decision systematically seeking to lower the poverty level of allAmerican children, we would be in a different, and probably better, condition today. As

10
racial and ethnic characteristics blur over the coming decades, poverty will become aneven more obvious problem than it has been. (pp.178–179)
The relationship between poverty and race and the placement of students into EMH are also
discussed at great length in the literature review.
Since one aspect of the identification and placement of students into EMH relies on the
role that IQ tests play, these protocols also came under discussion. Those who are critical of
using IQ tests argue that these tests are culturally loaded (Cummins, 1984), reflect a stylistic
mismatch between students and schools (Hilliard, 1987/1992), are standardized on a sample of
American students that does not sufficiently represent black students and what they know
(Kaufman, 1975), and do not inform teaching and learning (Hilliard, 1987/1992). Those
defending the use of IQ tests for identifying students with EMH agree that while they may not
measure the learning potential of black students, they may accurately predict the academic
performance of students in a mainstream setting and consequently have predictive validity
(Sattler, 2001).
Research Questions
1. Is there an over-representation of black students in EMH in the 67 public school
districts in Florida?
2. Does the socioeconomic status of school districts affect the proportions of white,
black, and Hispanic students identified as EMH?
3. Does the wealth of school districts affect the proportions of white, black, and
Hispanic students identified as EMH?
4. How do the characteristics of public school districts (population density or urbanicity;
size of districts based on student enrollment; racial composition of the full-time, non-

11
instructional staff; percentage of teachers with bachelor’s degrees; and districts’
expenditure per student) affect the proportions of white, black, and Hispanic students
identified as EMH?
Hypothesis 1: There is no statistically significant over-representation of blacks in EMH in
the 67 public school districts in Florida at the .05 significance level.
Hypothesis 2: There is no statistically significant difference between the proportions of
white, black, and Hispanic students identified as EMH when the socio-economic status of school
districts is the independent factor of measurement at the .05 significance level.
Hypothesis 3: There is no statistically significant difference between the proportions of
white, black, and Hispanic students identified as EMH when school district wealth is the
independent factor of measurement at the .05 significance level.
Hypothesis 4: There is no statistically significant difference between the proportions of
white, black, and Hispanic students identified as EMH when the characteristics of the school
districts are the independent factors of measurement at the .05 significance level.
Methodology
Data were collected from all 67 public school districts in Florida as reported to the
Florida Department of Education database for the school year 2001–2002. The Statistical
Package for Social Science (SPSS) Graduate Package (11.0) was used to analyze the data. Other
calculations were done to analyze the school districts’ variables measured in this research. These
variables included socioeconomic status; wealth; population density (urbanicity); size; racial
makeup of full-time, non-instructional staff; degree status of teachers; expenditure per student
(FTE); and the proportions of white, black, and Hispanic students who were identified as EMH

12
in all 67 school districts. Further analyses were done using the general linear model with
repeated measures.
Data Collection and Analysis
SPSS Graduate Package (11.0) was the main statistical tool used to analyze the data that
were collected from the Florida Department of Education database. The first purpose of the
research was to determine if there was an over-representation of black students in EMH in
Florida in 2001-2002, based on the definition presented previously. Second, the researcher
sought to identify any significant difference between the proportions of white, black, and
Hispanic students identified as EMH when socioeconomic status of school districts was the
independent factor of measurement. Third, this investigator sought to identify any significant
difference between the proportions of white, black, and Hispanic students identified as EMH
when public school district wealth was the independent factor of measurement. Finally, this
researcher examined some of the characteristics of the school districts and sought to identify any
significant difference in the proportions of white, black, and Hispanic students identified as
EMH when these characteristics were the independent factors of measurement.
Significance of the Study
From this analysis of Florida’s public school districts, a determination was made
concerning whether disproportionality of black students identified as EMH occurred in school
year 2001–2002. This analysis will support school districts in meeting the requirements of the
IDEA law. It will also fulfill the mantra of education that all children can learn and that no child
should be left behind.

13
Organization of the Study
Chapter 1 contains a statement of the purpose of the study, its components, and the
research questions. Chapter 2 presents a review of the related literature and research relevant to
the problem. Chapter 3 describes the methods and procedures used in the collection of data.
Chapter 4 includes the data analysis with an emphasis on the results obtained from the study.
Chapter 5 contains conclusions, recommendations, and implications of the study along with
recommendations for future research.

14
CHAPTER 2
REVIEW OF LITERATURE
Introduction
This literature review establishes a foundation for analyzing the over-representation of
blacks in educable mentally handicapped (EMH) programs that are served by special educational
services within the school setting. The review is divided into nine parts: historical perspectives;
demographic characteristics; causes for the over-representation; environmental and
socioeconomic factors; psychological testing, assessment, classification, and placement;
measures of intelligence; legislation and court cases; obstacles to change; and researchers’
thoughts for reducing over-representation of blacks in EMH.
Historical Perspectives
The history of mental handicap dates back to the beginning of human life on earth. The
first written documentation on mental handicap dates back to Egypt around 1500 BC. Although
somewhat vague due to difficulties in translation, documents written on papyri clearly refer to
mental handicap due to brain damage (Sheerenberger, 1983). The plight of people with mental
handicap depended upon the mores of the era and the culture or locale. In ancient Greece and
Rome, infanticide was a common method to do away with mentally handicapped young children.
In the second century AD, individuals with a mental handicap who lived in the Roman Empire
were usually sold for entertainment or amusement. It was during the early rising of Christianity

15
that many of these barbaric practices declined, as great religious leaders advocated more humane
treatment for the mentally handicapped and the infirm.
During the Middle Ages, the status and care of people with a mental handicap varied
greatly. Many children were sold into slavery, abandoned, or left out in the cold (Sheerenberger,
1983). By the 1800s, residential training schools were set up in many states in the U.S. to instruct
these individuals in basic self-care skills and to provide vocational training (Biasini, Grupe,
Huffman, & Bray, 2003).
During the early part of the twentieth century, residential training schools proliferated,
and individuals with a mental handicap were enrolled in large numbers. This trend was partly
influenced by the availability of intelligence tests such as the Stanford- Binet. The standard
belief at the time was that people with a mental handicap could be cured with proper training.
When training schools were unable to “cure” these individuals, they became overcrowded, and
many of the students returned to their home environment. The training schools eventually
became custodial living centers (Biasini et al., 2003).
As a result of the disillusionment with residential treatment, advocacy groups, such as the
National Association of Retarded Citizens and the Presidents’ Commission on Mental
Retardation, were established in the 1950s through the 1970s. The Wyatt-Stickney federal court
action in the 1970s was a landmark class-action lawsuit in Alabama establishing the right to
treatment of individuals living in residential facilities (Biasini et al., 2003).
Concurrent with this case, the U.S. Congress passed the Education for All Handicapped
Children Act in 1975, better known as Public Law 94-142. Public Law 94-142, the first
compulsory special-education law, came into being to address the services that students with
handicaps needed to be successful in school. It mandated the following conditions: (a) a free,

16
appropriate, public education for handicapped students between the ages of 3 and 21, (b) well-
planned school programs tailored to meet students’ unique learning needs, (c) protection of the
rights of handicapped students under the same legal provisions that protect the rights of non-
handicapped students (due process), (d) the right of exceptional students to have decisions made
about them in an unbiased manner, and (e) educational environments similar to those provided to
non-handicapped students (Ysseldyke & Algozzine, 1990). Public Law 94-142 guaranteed “free
appropriate public education” for all children with a broad range of handicaps and called for
school districts to provide such schooling in the “least restrictive environment” possible (Biasini
et al., 2003; Pardini, 2002).
Reauthorized in 1990 and 1997, Public Law 94-142 was renamed the Individuals with
Disabilities Education Act (IDEA). This act has spawned the delivery of special education
services to millions of students who were previously denied access to an appropriate education
(Pardini, 2002). Today, most states guarantee intervention services to children with handicaps
from birth to 21 years of age (Biasini et al., 2003).
Current classification practices in mental handicaps are traceable back to the nineteenth
century. Very derogatory terms like “idiot” and “imbecile” were used to describe people with a
mental handicap at that time. In 1910 Goddard developed the term “moron” to categorize feeble-
minded people. An idiot was an individual whose development was arrested at the level of a 2-
year-old; imbecile, an individual whose development was equivalent to that of a 2- to 7-year-old
at maturity; and moron, an individual whose mental development was equivalent to that of a 7-
to 12-year-old at maturity (La Griffe du Lion, 2000; Sheerenberger, 1983). These terms are now
obsolete and considered offensive.

17
Binet and Simon, under the commission of the Minister of Public Instruction in Paris,
France, developed the IQ test in 1905, for the explicit purpose of identifying children who were
less likely to fail in school (Jensen, 1969; La Griffe du Lion, 2000). However, Goddard first
popularized the use of intelligence testing to measure differences among people, linking their
performance on tests to diagnostic classification labels for various conditions (Ysseldyke &
Algozzine, 1990).
States now use a variety of terms to label students who are EMH. These labels include
mentally retarded, educationally retarded, educationally handicapped, mentally handicapped, and
significantly limited intellectual capability. For educational purposes, distinctions are usually
made between mild, moderate, severe, and profound mental handicaps (Ysseldyke & Algozzine,
1990). About 1% of the school-age population is identified as EMH (a mild form of mental
handicap) and thus receives special education services.
Five general causes of mental handicap are offered in the literature:
1. Hereditary factors (inborn errors of metabolism, genetic abnormalities, chromosomal
abnormalities, Rh blood-factor incompatibility). Downs syndrome is the best known
of these factors (American Psychiatric Association, 1987; Henson, 2003).
2. Alterations of embryonic development due to maternal ingestion of toxins (alcohol,
drugs, and radiation), infections (maternal rubella, measles), cerebral malformation,
or unknown causes (American Psychiatric Association, 1987; Henson, 2003).
3. Pregnancy and prenatal problems (prematurity, trauma, fetal malnutrition, prolonged
birth, and reduction of oxygen to the infant’s brain) (American Psychiatric
Association, 1987; Henson, 2003).

18
4. Physical disorders acquired in childhood (lead poisoning, infections, traumas, brain
disease, chicken pox, measles, meningitis, whooping cough, fever, lack of certain
chemicals in the blood, or glandular imbalance) (American Psychiatric Association,
1987; Henson, 2003).
5. Environmental influences (psychosocial deprivation, sensory deprivation, severe
neglect, malnutrition, and complications of severe mental disorders) (American
Psychiatric Association, 1987; Ysseldyke & Algozzine, 1990).
The characteristics of EMH are circular, because students are identified and diagnosed
based on the criteria that are used later to describe them. Their mental or intellectual skills are
subaverage, so this is the primary feature. Since adaptation to one’s social and physical
environment depends on intellectual ability, it follows that persons with EMH are likely to
demonstrate significant differences from others. If they do not, then classification as EMH is
erroneous, despite the IQ (Henson, 2003).
Due to subaverage intellectual functioning, persons with EMH are likely to be slower in
reaching levels of academic achievement equal to their peers. Notwithstanding, many of these
students are ultimately able to reach some level of literacy but over a longer period of time. Due
to diminished intellectual functioning and associated neurological conditions, many children
with EMH have delayed language and speech problems, have slower physical development, and
may even have some forms of associated physical problems. They may also have difficulty
focusing, which is more noticeable in terms of developmental delay, than that of their age peers.
Children with EMH also have impairments in memory, particularly short-term memory,
especially if the facts or complexities of the learning situation are not readily apparent. They also
have difficulty with generalization of skills because of their limited ability to think abstractly.

19
Finally, because of their limited intellectual ability, children with EMH manifest limitations in
adaptive skill areas. They have difficulties in making important or reasonable decisions that
would allow them to adjust to new circumstances and problems (Henson, 2003).
Many parents have negative feelings about the labeling of their children as EMH. Parents
and children often have difficulty overcoming the stigma and the negative views that have been
historically and socially attached to this label. Many studies reported negative effects including
bias for the EMH label (Ysseldyke & Algozzine, 1990). However, without the labeling, the
children would not have been identified for special services.
Gallagher in his 1976 study and Algozzine and Mercer in their 1980 research reported
that there are some presumed advantages in labeling. They suggested that labeling serves as a
means for beginning a classification, diagnosis, and treatment sequence to intervene and
overcome certain negative conditions. Therefore, the major advantage for labeling is the
admission to some form of special or differential treatment. Labeling also serves as the basis for
further research into the etiology of the condition and into prevention and possible treatment
applications of this condition in the future. Finally, these researchers felt that labeling is a means
of calling attention to a specific problem in order to obtain additional resources through special
legislation and funding (Ysseldyke & Algozzine, 1990).
Demographic Characteristics
The Center for Education Reform (2004) retrieved data from the U.S. Department of
Education that showed that the total number of students in public schools in 1998–1999 was 46.5
million. National enrollment indices projected by the U.S. Bureau of Census indicated that by the
year 2000, minority enrollment in the U.S. would be between 40% and 60% of the population of

20
all children in public schools. The enrollment projections are between 57% and 60% for the
states of New York and California. According to a 1986 article in Education Week, the greatest
increases for black children in public school are in New York State, along the eastern seaboard
states and through Mississippi, Alabama, and westward to California (Agbenyega & Jiggetts,
1999).
By 1986, black children were in the majority in elementary schools in California. In
Texas, black and Hispanic children made up 46% of students at all levels in the public school
system. In fact, according to Education Week, minority children made up majorities in the 25
largest school systems in the nation as of 1986 (Agbenyega & Jiggetts, 1999). They are now
considered the “majority minorities” (Benner, 1998). In the autumn of 1993, the minority student
figure for Chicago was 89%; Houston, 88%; Los Angeles, 88%; Baltimore, 84%; Miami 84%;
and Philadelphia, 78% (Oswald et al., 1999).
According to Henson (2003), only 3% of the total U.S. population has all types of mental
handicap, from mild to profound. Persons with EMH represent approximately 0.45% of the total
U.S. population. About 11% of all students nationwide receive special education services. In
1998, approximately 1.5 million minority children were identified as having some type of mental
handicap, emotional disturbance, or specific learning disability (Fine, 2001). Of this figure, more
than 876,000 were blacks or Native Americans. A large percentage, perhaps as much as 41%, of
special education students are from linguistically and culturally diverse backgrounds (Civil
Rights Project, 2002).
Blacks experience the greatest over-representation in most special education programs.
Although blacks accounted for only 12% of the nation’s elementary and secondary school
population, in 1998 they constituted 28% of the total enrollment in special education. They are

21
also over-represented in programs for students with EMH and behavior disorders (Grossman,
1998; Harper & Harper, 1998).
Researchers have found that minority students tend to be over-represented in special
education programs in states or school districts with high proportions of ethnic or linguistic
minorities or poor individuals (Harry, 1992; Noel & Fuller, 1985). According to a report by the
Civil Rights Project at Harvard University, black students are classified as needing special
education more often than white students and are less likely, once they have been identified as
having handicaps, to be placed in mainstream classrooms (Fine, 2001).
The data also revealed that there is massive regional disproportion in minority
representation. A disproportionate minority over-representation of students classified as EMH
occurs most frequently in the southern states and in states bordering the south. Southern states
constituted nearly three-quarters of the states with unusually high incidence levels, where
between 2.75% and 5.41% of black students were labeled as EMH (Civil Rights Project, 2002).
In Mississippi, South Carolina, North Carolina, Connecticut, and Nebraska, black students are
more than four times as likely to be identified as EMH as are white students living in those
states. In Florida, Alabama, Delaware, New Jersey, and Colorado, the number of black students
identified as EMH was more than three times that of white students. With some notable
exceptions, minority disproportion does not appear to be as general a problem in the Northeast or
the Midwest as it is in the South. Minority disproportion is also relatively low in the West
(Heller, Holtzman & Messick, 1982). In contrast, the prevalence of EMH for whites nationally
was approximately 0.75% in 2001, and in no state did the incidence of EMH among whites rise
above 2.32 % (Civil Rights Project, 2002).

22
Zhang and Katsiyannis (2002) also reported similar findings in their study. They found
that black students and American Indian/Alaskan students were over-represented in all major
categories of special education (mental handicap, emotional disabilities, and learning
disabilities). These researchers also found that the percentages of blacks with EMH in the
Northwest and East Central states such as Ohio, Tennessee, and West Virginia were significantly
higher than the percentages in the West and Northeast regions (Zhang & Katsiyannis, 2002).
Despite litigation, monitoring, and compliance activities, Congress has found
disproportionate representation to be particularly troubling because racial and ethnic diversity is
increasing. In 1990 the U.S. population consisted of 75% whites, 12% blacks, 9% Hispanics, 3%
Asians and Pacific Islanders, and 0.8% Native Americans (U.S. Bureau of Census, 1992a). By
the year 2050, the percentage of whites is expected to decrease to 52.7%; blacks will increase to
16.2%, Hispanics to 21.1%, Asian and Pacific Islanders to 10.7%, and Native Americans to 1.2%
(U.S. Bureau of Census, 1992b).
Causes for Over-Representation
Over-representation is a problem when it appears in special education enrollments,
because of the perceptions held regarding the effectiveness of treatment by the various programs
and the perceived stigma associated with specific labels (MacMillan & Reschly, 1998). It is also
a problem if children are invalidly placed in programs for EMH students. Disproportion may also
become a serious issue if children are unduly exposed to the likelihood of EMH placement by
being in schools or classes with poor quality regular instruction. Disproportion may even have
negative effects on students’ lives if the quality and academic relevance of instruction in special
classes block students’ educational progress or decrease the likelihood of their return to the

23
regular classroom (Heller et al., 1982). Disproportion can also have deleterious consequences
with regard to the growing use of high-stakes tests that burden poorly taught children with grade-
level retention and diploma denial (Civil Rights Project, 2002).
Artiles and Trent (1994), in their review of the disproportionate percentage of minority
students in special education, identified a number of variables that affect the referral,
identification, and placement process. These include
1. Litigation and the growth of understanding by educators of students’ rights to an
education.
2. The ongoing debate about systemic issues such as the pre-referral, referral, and
assessment processes, and the possible biases inherent in these procedures.
3. The debate surrounding the basic constructs (i.e., learning disabilities and mental
handicaps) and their definitions.
4. Socioeconomic status of the home and family environment and its effect on learning
and the learning process.
5. Characteristics of the students.
6. School success and school failure as seen in the quality of instruction received.
7. The correlation between historical contexts, cultural diversity, and disability (Artiles
& Trent, 1994; Heller et al., 1982).
Another researcher, Grossman (1998), suggested that one of the main causes of inequality
in special education is bias. In some areas, biased white students who are in the majority make it
difficult for minority students to learn, because they become very anxious about the treatment
they receive from their white peers.

24
While many teachers do not discriminate against students, some teachers might practice
discrimination unconsciously if they believe that different racial groups have different
intellectual capacities and that black children, in particular, inherit lower intellectual ability.
Therefore, they might have low expectations for them (Grossman, 1998; Samuda, Kong,
Cummins, Pascual-Leone, & Lewis, 1989). A few school administrators, teachers, and
psychologists might even treat poor students and certain black students differently, and their
treatment reflects the biases that exist in the larger society (Fine, 2001; Grossman, 1998).
Teacher expectation for some students tends to be prejudicial (Harry, 1992). Many
special educators and even special education students expect white students in their classes to do
better academically than minority and poor students. This phenomenon begins in preschool and
continues through college (Grossman, 1998). Some educators also expect minority students to be
more disruptive and deviant than white students, and these expectations become self-fulfilling
prophecies.
Black and poor students are at greater risk to be on the receiving end of teacher bias.
Teachers, for example, are 3.5 times more likely to identify poor black students as EMH than
they are to identify white students as EMH (Fine, 2001; Meier, Stewart, & England, 1989;
Oswald et al., 1999). When evaluating black students, some teachers tend to judge their work,
performance, intellectual abilities, and social skills to be lower than objective data would
indicate (Frame, Clarizio, Porter, & Vinsonhaler, 1982).
Many studies show that some teachers tend to treat minority and poor students unfairly.
In relation to white pupils, teachers praise black students less and criticize them more, and the
praise these students receive is usually routine, rather than feedback for a particular achievement
or behavior (Moore & Cooper, 1984; Simpson & Erickson, 1983; Washington, 1982). Some

25
teachers interact more with white students than with black students. A number of teachers give
black students less attention, and some are less likely to respond to black students’ questions or
to direct questions to them (Moore & Cooper, 1984).
Some instructors also appear to use different classroom management styles with black
and white students. In general, some teachers of classes with high percentages of black students
tend to be more authoritarian and less likely to use the open classroom approach (Moore &
Cooper, 1984). They also spend more time watching for possible misbehavior by black students,
especially males. When male students misbehave, some teachers tend to criticize black males’
behaviors more harshly and use more severe punishment, including corporal punishment and
suspension. When females are disruptive, the educators treat black females more harshly than
they do white females (Moore & Cooper, 1984; Simpson & Erickson, 1983; Washington, 1982).
Taylor (1979) reported that some educators also discriminate against students who are
unlike them because they fear them. White teachers may be aware of the ways in which blacks,
Hispanics, Native Americans, and poor people in general were and continue to be treated by
society. They are usually aware of the unemployment, poverty, racism, and discrimination these
students and their families face. Some teachers often sense the resentment, anger, and mistrust
these students harbor towards the white establishment, and so they may be afraid of the periodic,
angry explosions students release when their tolerance levels have been reached.
Samuda et al. (1989) argued that the curricula need to be addressed. Often the curricula
do not include the multicultural backgrounds or contributions of minorities to the society as a
whole, and the system is so rigid that the curricula cannot be modified to use cultural diversity as
a positive teaching resource. In addition, the pedagogy is primarily based on a passive model of
teaching and learning as opposed to interactive teaching-learning styles. Moreover, there is a

26
lack of guidance counselors at the elementary and high school levels with adequate training in
diversity, including non-biased assessment. Finally, parents are often uninvolved in their
students’ assessment and program placement decisions, making it easier for their children to be
placed in special education learning modalities.
While these issues might be experienced in the regular classroom setting as well, many of
these researchers reported their findings on special education settings. Grossman (1998) reported
that many of the factors mentioned previously contribute to some educators’ continuing the
process of treating students unfairly. He believed their mistreatment appeared to be rooted in bias
and discrimination. Grossman opined that people seem to be programmed to discriminate against
others who do not belong to their group, or who look, talk, think, or act differently from them.
He felt much of the bias is unconscious, and teachers may not notice that they call on one group
of children more often than they call on another. Sometimes when people become aware of the
discrimination, they might justify and rationalize the behavior by attributing characteristics like
aggressiveness, cultural inferiority, laziness, and linguistic inferiority to the students that are
discriminated against (Simpson & Erickson, 1983; Taylor, 1979). While these teacher behaviors
are not systemic within all classroom settings, the research findings tend to portray concern in
this area.
When students are being considered for placement into special education services, there
is a predetermined protocol for this procedure. The referral process for placing a child in special
education is as follows: after pre-referral interventions are conducted by the regular-education
teacher, he or she then makes a referral to the school psychologist for a psychological evaluation.
The evaluation is followed by a multidisciplinary team assessment, and it is the qualification of
this committee that determines the eligibility for special education placement (MacMillan &

27
Reschly, 1998). These researchers contend that discrimination can occur at virtually any step in
this sequence. Other researchers found that when teachers and school psychologists refer
students to special education programs, their evaluations of minority students and poor students
might be biased (Argulewicz, 1983; Low & Clement, 1982). In a 1986 study, Collier found that
teachers are more likely to refer poor and minority students for evaluation for possible placement
in programs for students with handicaps and less likely to refer them to programs for the gifted
and talented.
In a later study, Podell and Soodak (1993) found that among 240 regular-education
teachers in the New York metropolitan area who had taught for at least one year, some teachers’
decisions about low socioeconomic students were susceptible to bias when the teachers
perceived themselves as ineffectual. These teachers considered regular education inappropriate
for underachieving students from low socioeconomic families. On the other hand, teachers who
considered themselves effective did not differentiate students by their socioeconomic status. In
these researchers’ study, teachers’ referral actions thus appeared to be biased by variables that
were not related to the specific academic difficulties of the student.
When selecting the most appropriate placement for students with academic problems,
some educators and psychologists are more likely to choose a special education program for
minority students and a regular education program for white, middle-class students (Grossman,
1998). When they choose a special education program for students, the multi-disciplinary teams
are likely to select a special education program for minority and poor students identified as EMH
but a learning disabilities program for white students. They also tend to recommend a more
restrictive environment for minority and poor children than for white, middle-class pupils. Given
that students with special needs benefit most when they are educated in the least restrictive

28
environment to the maximum extent appropriate, the data on educational settings raise serious
questions about the quality of special education provided to minority students (Civil Rights
Project, 2002).
Research has reached mixed conclusions regarding children who are labeled EMH. Some
researchers found that when teachers work with EMH students, some teachers expect them to
perform poorly in reading, writing, and math, while others found no differences in teacher
behaviors towards those labeled students (Foster & Ysseldyke, 1976; Ysseldyke & Algozzine,
1990). Other research showed that in wealthier school districts, black children, especially males,
were more likely to be labeled EMH (Civil Rights Project, 2002).
Overall, the research suggests that observed racial, ethnic, and gender disparities are the
result of many complex and interacting factors. These factors include unconscious racial bias on
the part of some school authorities, large resource inequalities (such as the lack of high quality
teachers) that run along lines of race and class, unjustifiable reliance on IQ and other evaluation
tools, some educators’ inappropriate responses to the pressure of high-stakes testing, and power
differentials between minority parents and school officials. The dramatic over-representation of
black children labeled EMH compared to whites or other minorities is very pronounced. To the
extent that minority students are misclassified, segregated, or inadequately served, special
education can contribute to a denial of equality of opportunity, with few positive results within
communities throughout the nation (Civil Rights Project, 2002).
Environmental and Socioeconomic Factors
In investigating the link between socioeconomic status (SES) and identification of EMH,
several studies show that there is a definite association between this factor and EMH. For

29
example, in a 1994 study Herrnstein and Murray found that SES correlates positively to
intellectual performance (Valencia & Suzuki, 2001). As one’s SES increases, there is a tendency
for one’s intellectual performance to increase. Conversely, low SES tends to correlate with low
intellectual performance. In an earlier 1973 study conducted by Nichols and Anderson, these
researchers found that SES was largely responsible for the black–white differences in intellectual
performance (Valencia & Suzuki, 2001).
While the term “environment” reflects the social and cultural influences on the
individual, it also includes other more strictly biological influences such as the prenatal
environment and nutritional factors early in life (Jensen, 1969). Socioeconomic status, on the
other hand, was described by Slavin as a social construction describing human subgroups in a
society. Typically, it is viewed as a measure of prestige within a social group frequently based on
schooling attainment, income, and occupation (Valencia & Suzuki, 2001). Environmental
deprivation and low SES have been shown to be empirically and persistently linked to EMH,
which has no boundaries. It cuts across racial, ethnic, educational, social, and economic
backgrounds (Artiles & Trent, 1994; Jensen, 1969; Yeargin-Allsopp et al., 1995).
Jensen (1969) referred to studies conducted by Skeels and Dye in 1939 and Davis in 1947
in which they found that children living in orphanages had very little sensory stimulation of any
kind and little contact with adults. This extreme social isolation early in life led to great
deficiencies in their IQ. However, when these children were removed from social deprivation
and placed in good, social environments, they showed large gains in their IQ. The orphanage
children gained in IQ from an average of 64 at 19 months of age to 96 at age 6 as a result of
being placed in good homes and given social stimulus between 2 to 3 years of age. As adults,
these subjects were performing satisfactorily, and their children’s IQ averaged 105. These studies

30
highlight the fact that extreme environmental deprivation does not necessarily result in
permanent, below-average intelligence.
Children in poor families may be identified as EMH because of malnutrition, disease-
producing conditions, deleterious postnatal factors such as ambient lead or anemia, inadequate
medical care, and environmental health hazards (Limon-Luckett, 1999; The Arc, 1998; Yeargin-
Allsopp et al., 1995). Studies have shown that proper nutrition is critical to brain development.
Severe undernourishment before 2 or 3 years of age, especially a lack of proteins, vitamins, and
minerals essential for children’s anabolism, results in lowered intelligence (Jensen, 1969). In
1963, Stoch and Smythe found that extremely malnourished South African black children tested
about 20 points lower in IQ than children of similar parents who had not suffered from
malnutrition (Jensen, 1969). If the nutrients are absent during critical periods of brain growth,
development is permanently slowed (Monson, 2003). This relationship between nutrition and
development is one of the reasons the school breakfast and lunch programs are crucial to poor
children’s academic success.
Children in disadvantaged areas may also be deprived of many common cultural and day-
to-day experiences that other children receive. Such under-stimulation can result in slowing the
growth of nerve cells or, worse, can cause irreversible damage and can serve as a cause for EMH
(Monson, 2003; The Arc, 1998). Jensen (1969) mentioned that culturally disadvantaged children
usually show a slight gain in IQ after their first few months of exposure to the environmental
enrichment afforded by school attendance, but they soon lose this gain. A sizeable proportion of
these children with initial gains in IQ tend to show a gradual decline in IQ throughout the
subsequent years of school. Jensen posited that as children got older, their IQ increasingly
resembled their parents’ rank order in intelligence.

31
Garber’s 1998 research findings indicated that most parents with EMH also have low
income (Feldman & Walton-Allen, 1997). Individuals with EMH are more likely to live in
poverty, including having poorer housing conditions and higher exposure to high crime areas in
which they are particularly vulnerable. In 1994, Newman reported that persons with EMH have
worse housing and neighborhood conditions than do those who do not have handicaps (Robinson
& Rathbone, 1999). Additionally, according to Cornelius’ 1993 research, individuals living in
poverty are less likely to be insured, are less likely to have access to a full range of quality
services in the community, and are less likely to benefit from existing services than are
individuals who have better financial resources (Robinson & Rathbone, 1999).
Newman (1995) stated that federal researchers found that children in Washington, D.C.,
born to poor black women and to uneducated mothers of all races are more likely than others to
be identified as EMH. Mothers who are high-school dropouts are four times more likely to have
EMH children than mothers who are not high-school dropouts. The researchers concluded that in
comparison to white children, black children are more than twice as likely to be identified as
EMH.
According to research reported by Graves, Freeman, and Thompson in 1968, other
disadvantageous factors most highly associated with poor social conditions include pregnancies
at an early age, teenage deliveries, pregnancies in close succession, large number of pregnancies,
and pregnancies that occur late into the woman’s reproductive life (Jensen, 1969). These
conditions are related to low birth weight, prematurity, increased infant mortality, prolonged
labor, toxemia, anemia, malformations, and mental deficiency in the offspring. All of these
factors have high incidence rates in low socioeconomic groups and in certain racial groups such
as blacks, American Indians, and Mexican Americans, and probably account for some proportion

32
of the group differences in IQ and scholastic performance (Jensen, 1969). The poverty rate for
black families in the United States is about three times that of the rate for all families. This
situation places black children at greater risk of poor school performance (Oswald et al., 1999).
Socioeconomic factors, especially poverty, have therefore been closely linked to the
over-representation of black students in certain categories of handicap, including EMH (Oswald
et al., 1999). These researchers found that as poverty increased, more black students were
identified as EMH. Thus, EMH appears to be linked to environmental deprivation and unequal
distribution of wealth, and lack of power and opportunity (Weiner & Davis, 1995). Jorge
Amselle, a spokesman for the Center for Equal Opportunity, a Washington-based group, stated
that more minorities are in special education, not so much because of prejudice and bias, but
more so because they are poorer. He felt it is “more a matter of apathy than racial
discrimination” (Fine, 2001). Mercer’s 1965 study posited that EMH children were really the
consequence of children in poverty not being able to succeed in school. Outside of school, many
of these children so labeled were able to care for siblings, wash their clothes, do errands and take
leadership positions within their peer groups. Mercer called these children “six-hour mentally
retarded” because they were deemed EMH in school (Weiner & Davis, 1995).
Similarly, children who live in rural communities face daunting challenges in achieving
academic success. A report in 1992 indicated that 22.9% of rural children live in poverty
compared to 20% of non-rural children and 20.6% of all American children (Sherman, 1992).
This author also revealed that 41% of poor, rural children live in extreme poverty; that is, their
family income is below 50% of the federal poverty threshold. These children are also more likely
than non-rural children to live in poverty for a much longer time. In lower-income, rural
communities, expectations for student achievement varied according to the level of poverty and

33
population sparsity. Capper (1990) found that the lower the income level and the more rural the
community, the lower the expectations teachers had for students.
Children who live in rural communities also tend to score significantly lower on psycho-
educational tests than their urban and suburban peers. Hilton (1991) conducted a study among
children from middle-class rural farm homes, and middle-class suburban metropolitan homes. He
found that a significantly higher proportion of the rural children failed a wide range of the verbal
ability and auditory comprehension items. Rural children were reported to feel ill at ease in the
strange testing environment, were quieter, would not venture to guess as often as their suburban
peers, and were less willing to interact with the unfamiliar adult examiners. Hilton argued that
the culturally biased nature of standardized tests might have led to low test scores among these
students, whose rural life experiences negatively affected their performance. The characteristics
of rural communities therefore place tremendous pressure on students to succeed in their
environment. Approximately 312,000 (12.5%) students lived in rural Florida in 2001–2002 and
could have been affected by these trends.
Psychological Testing, Assessment, Classification, and Placement
The understanding of the term “intelligence” has sparked many definitions and theories.
Valencia and Suzuki (2001) briefly discussed several definitions for intelligence. In 1927,
Spearman viewed intelligence as the “g factor” or general intelligence with verbal ability and
fluency. Several researchers, including Jensen, support this definition. Thurstone, in 1941,
challenged the g factor and instead defined intelligence as seven primary mental abilities that
included verbal comprehension, word fluency, number facility, spatial visualization, reasoning,
perceptual speed, and memory. In 1950, Vernon defined intelligence as A, B, and C. According

34
to Vernon, intelligence A represents innate capacities of the individual that are primarily
genetically determined. Intelligence B represents behavior that society recognizes as being
intelligent and that might be more closely linked to behaviors that are culturally reinforced.
Intelligence C includes those cognitive abilities that are measured by traditional intelligence
tests. Cattell, in 1963, suggested that intelligence could be divided into two parts: crystallized
and fluid abilities. Crystallized intelligence involves established cognitive functions related to
achievement that are influenced by formal and informal education. Fluid intelligence is the
capacity required for problem solving. In 1983, Gardner argued for the idea of multiple
intelligence, including interpersonal, intrapersonal, linguistic, logical-mathematical, bodily
kinesthetic, musical, and spatial. Sternberg, in 1996 cited the importance of creative and practical
areas of intelligence not commonly evaluated in traditional measures. In 1997, Coles linked
intelligence to morals and coined the term “moral intelligence,” noting that people grow morally
as a consequence of learning how to deal with others and how to behave in the world (Valencia
& Suzuki, 2001).
School personnel believe intelligence is related to how much students profit from
schooling. They believe that students who have more intelligence will profit more from
instruction than will students who have less intelligence. Much of the intelligence measured in
the school setting tend to reflect Spearman’s general intelligence, Thurstone’s primary abilities,
and Cattell’s crystallized and fluid abilities. The intelligence tests tend to measure how much
intelligence a student has, based on the premise and theories of the tests’ developers. The results
from these psychological tests help to classify students and determine if special education
services are needed (Ysseldyke & Algozzine, 1990).
35
Testing, classification, and placement into EMH are unavoidable. They are also major
activities in America’s schools. Testing refers to sampling of behaviors in students to obtain
quantitative scores of relative standings. Assessment is the process of collecting data to make
decisions about students. Classification is the process through which the collective interpretation
of the data has been formalized. Placement refers to a multi-disciplinary decision concerning the
student based on the results of the testing, assessment, and classification (Ysseldyke &
Algozzine, 1990).
The U.S. Congress requires nondiscriminatory assessment procedures. First, the
requirements of the mandate state that tests should be conducted in the child’s native language or
other appropriate mode of communication. Second, the test and evaluation materials should show
areas of academic need rather than just IQ. Third, the test should demonstrate the child’s aptitude
and not the child’s deficits. Fourth, different procedures should be used to determine an
appropriate program. Fifth, a multidisciplinary team should participate in the assessment.
Finally, the child should be assessed in all aspects of the handicap in question (de la Cruz, 1996).
One of the main tools used to assess students is the intelligence test. The intelligence test
yields numerical scores (IQ). The IQ is assumed to be normally distributed in the population; that
is, the distribution of IQs conforms to the normal or the familiar “bell-shaped curve.” The IQ,
which is now the universal “unit” in the measurement of intelligence, was originally defined as
the ratio of the individual’s mental age to his or her chronological age. Mental age was simply
the typical or average score obtained on a test by children of a given age, and therefore the
average child had an IQ of 100. Since there were difficulties with the mental age concept,
modern test constructors no longer measure mental age but rather convert raw scores into IQ for

36
each chronological age group. The average IQ is arbitrarily set at 100 and is defined as a
normally distributed variable with a mean of 100 and a standard deviation of 15 (Jensen, 1969).
Once the referral process begins and the psychoeducational assessment is completed, the
multidisciplinary team meets to determine eligibility for placing a child in EMH. The results of
the psychological test tend to have great input in the decision of the student’s placement
(MacMillan & Reschly, 1998). Students are considered EMH when their IQ score is in the range
of 55 to 69. The upper limit can be extended to 75 or more, depending on the reliability of the IQ
test used (Grossman, 1983). Adaptive behaviors must also be considered. A student with an IQ
score higher than 70 may be classified as EMH because of deficient adaptive behaviors (Hunt &
Marshall, 1994). This IQ-achievement discrepancy formula is perhaps the most common
placement procedure in the U.S. This formula is used in 37 (74%) of the states’ school systems
(Payette & Clarizio, 1994). The current cut-off IQ score of less than 70 is a figure that has
evolved over time.
In 1959 the American Association on Mental Disabilities (AAMD) set the IQ threshold
for EMH at less than 85. In the mid- to late-1960s, classes for EMH students were populated
very heavily by minority students who were from poor families. Professionals, parents, and
advocacy groups expressed concern about over-representation of these students in these EMH
classes. In addition, the label of EMH was thought to stigmatize students and limit their future
educational and employment opportunities (Ysseldyke & Algozzine, 1990). The civil rights
movement of the 1960s forced psychologists to rethink this boundary, because half the black
population fell below it (La Griffe du Lion, 2000).
In 1973 the AAMD (by then the American Association on Mental Retardation - AAMR)
changed the threshold for EMH from an IQ of less than 85 to an IQ of less than 70 along with

37
deficits in adaptive behavior. The proportion of black students below this threshold instantly
dropped from about 50% to 12%. Tucker’s 1980 investigation found that these changes occurred
only due to social and political pressure mounted on behalf of students labeled with this
diagnosis (Ysseldyke & Algozzine, 1990). The change in the IQ criterion resulted in removing a
large number of black students from this label. Many of these students were no longer eligible
for EMH services. While some met with academic challenges in their mainstream classrooms,
others were more successful. Several were reclassified with other learning disabilities and
provided with the appropriate services.
Evaluation instruments such as the intelligence test are written in Standard English.
When used with black students, these protocols appear to give negative and poor results to them.
The vast majority of research shows that nonstandard, dialect-speaking students who are poor,
black, Native American, Hispanic American, or from the Appalachian areas, perform poorly
when they are assessed in Standard English. Many consider this issue to be “test bias” (Bliss &
Allen, 1981; Bryen, 1976; Burke, Pflaum, & Knafle, 1982; Harber, 1980; Ross, 1979;
Thurmond, 1977; Wartella & Williams, 1982).
The preponderance of literature points to test bias as one of the major contributors to the
over-representation problem of black students in EMH classes (Bailey & Harbin, 1980;
Greenwood, Preston, & Harris, 1982; Oakland, 1977). The concern with bias stems from the
ways in which the American society evaluates the worth of individuals. Ysseldyke and
Algozzine (1990) proffered three reasons for the concern over bias in assessment. First, they
believe that people are evaluated based on their presumed intelligence and since the IQ has
become a very potent yardstick, educators have become increasingly concerned when a student’s
achievement is not commensurate. Second, different racial groups achieve different average

38
scores on intelligence test and the professionals are at a loss to explain the reasons for the
observed differences. Finally, there is a disproportionate representation of black students in EMH
classes, which is a concern in litigation as well as legislation.
Discussions about test bias are therefore often accompanied by much debate that
frequently expresses strong disapproval of using psychological tests with any minority group,
since these groups have not been exposed to the cultural and environmental circumstances and
the values of the so-called white middle class (Reynolds, Lowe, & Saenz, 1999). The process by
which items are selected for inclusion in standardized tests, the standardization sample used in
norming measures, and the test validation processes are major concerns to minority groups
(Greenwood et al., 1982; Ysseldyke & Algozzine, 1990). IQ tests rely heavily on the values of
white, middle-class culture and thus discriminate against people from differing racial
backgrounds (Maheady, Towne, Algozzine, Mercer, & Ysseldyke, 1983).
In 1978 Mercer and Lewis performed a review of early studies dealing with
psychological evaluations of black children and concluded that their potential as students had
been systemically shrouded by bigotry, aloofness, and insensitivity (Swanson & Watson, 1989).
The Stanford-Binet test, for example, is widely used as a psychological IQ test for students.
However, it exposed inaccuracies and biases based on cultural and racial factors from as early as
1910 (Blanton, 1975). Blanton called for the development of special population norms to correct
for these problems but without much success.
Another early study compared white, Indian, and Mexican children with regard to their
intelligence. This study indicated differences between the races that reflect differences in mental
attitude toward the white person’s way of thinking and living (Garth, 1923). Researchers found
that many problems developed because educators were often administering English language test

39
to students who did not speak English, and tests were often normed on a population of white
middle-class students (Bersoff, 1982; Reschly, Kicklighter, & McKee, 1988).
Other critics have argued that tests are biased against blacks because the unequal
treatment they have received from society is not taken into consideration. In 1981, for example,
Gordon and Terrel reported that the abilities of this group are not accurately assessed when using
psychological tests that are norm referenced on the values and cultures of the white, middle class
(de la Cruz, 1996).
Some researchers continue to press for the use of intelligence tests but suggest that they
should be administered differently. For example, Jensen (1969) suggested that examiners testing
children from a different race or from a poor background should take time to be better acquainted
with the students and even perform two tests with them. The first should be considered a practice
test and the second would be the real test. He argued that little confidence should be placed in a
single test score of disadvantaged children.
Other investigators also added that less emphasis should be placed on IQ scores
generated from psychological tests. Miller-Jones (1989), for example, stated that continued
dependence on IQ scores for diagnosis of mental handicaps should be further examined. Instead,
this researcher advocated the use of other criteria, such as adaptive behavior, in addition to the
intelligence level. Multiple indicators to assess intelligence across racial groups should be used
because of certain individual differences such as in communication, reasoning, cognitive, and
learning styles, are greatly shaped by culture.
Gardner (1999) concurred with Miller-Jones by reiterating that the IQ score measuring
only the linguistic and logical-mathematical intelligences are insufficient in assessing human
cognitive abilities. He emphasized that while assessment is necessary and important, it should

40
encompass multiple measures. He further stated that all assessments and resulting interventions
should be sensitive to individual differences and developmental levels. He also advocated that
the assessment’s primary goal should be to aid students instead of classifying or ranking them
(Gardner, 1993).
Measures of Intelligence
The discussion on the major intelligence tests in this section helps to shed some light on
protocols that show promise among black students, which may possibly help to reduce the
disproportionality of black students in EMH. Other tests may be less effective with this group of
students because the tests may be more culturally loaded. Intelligence tests can be grouped in
several ways. The discussion will focus first on the major, traditional intelligence tests and then
on some less well-known tests. Finally, the discussion will examine recently developed,
nonverbal protocols that seem to be less culturally loaded and may be more suitable for
evaluating black and Hispanic children.
The most commonly used protocols for the identification of EMH are the Wechsler
Scales of Intelligence, the Stanford-Binet Intelligence Scale Fourth Edition (SB: FE), the
Kaufman Assessment Battery for Children (K-ABC) Mental Processing Scales, the Kaufman
Adolescent and Adult Intelligence Test (KAIT), the Kaufman Brief Intelligence Test (KBIT), the
Cognitive Assessment System (CAS), the Woodcock-Johnson Psycho-Educational Battery-
Revised: Tests of Cognitive Ability (WJ-R), and the Differential Abilities Scales (DAS)
(Cheboygan-Otsego-Presque Isle Educational Service District, n.d.; Kaufman, Lichtenberger, &
Naglieri, 1999; Pierangelo & Giuliani, 1998). Obringer’s 1987 national survey of school

41
psychologists showed that the Wechsler scales were the most frequently used, followed closely
by the K-ABC and then the Stanford Binet tests (Kaufman et al., 1999).
Other less well-known testing instruments include the Columbia Mental Maturity Scale
(CMMS), the McCarthy Scales of Children’s Abilities (MSCA), the Slosson Intelligence Test –
Revised (SIT-R), the Comprehensive Test of Nonverbal Intelligence (CTONI), the Test of
Nonverbal Intelligence-Third Edition (TONI-3), the Otis-Lennon School Ability Test (OLSAT),
and the Universal Nonverbal Intelligence Test (UNIT) (Pierangelo & Giuliani, 1998; Riverside
Resource Bulletin, 2003).
Wechsler Scales of Intelligence
Wechsler (1974) defines intelligence as “the overall capacity of an individual to
understand and cope with the world around him” (p. 5). These scales comprise three separate
tests that measure a variety of intellectual areas and compute a Verbal, Performance, and Full
Scale IQ (Kaufman et al., 1999). The verbal areas measure auditory/vocal tasks, while the
performance areas assess visual/vocal and visual/motor tasks. The three tests include the
Wechsler Preschool and Primary Scale of Intelligence (WPPSI-R) for ages 4½ to 6½; the
Wechsler Intelligence Scale for Children – III (WISC-III) for ages 6½ to16½; and the Wechsler
Adult Intelligence Scale – (WAIS-III) for ages 16 and over. These scales are standardized,
individualized, norm-referenced tests that take approximately 60 to 75 minutes for a psychologist
to administer to an individual (Pierangelo & Giuliani, 1998). Based on the results of the
Wechsler Scale, a person would be deemed EMH if: the Verbal, Performance, and Full Scale IQ
score fell within the mentally deficient range (69 and below); there is no indication of greater
potential; the student also had a low score on a measure of Adaptive Behavior; and there is a

42
history of academic performance that is commensurate with low intellectual ability (Pierangelo
& Giuliani, 1998). These authors contend that the strengths of the Wechsler Scales include the
following:
1. Strong evidence of the test’s reliability and validity
2. Thorough interpretation in the manual of information regarding interpretation of
scales score differences
3. High correlation between scores on the tests and academic achievement
4. Valuable information as one of the measures in the diagnosis of learning disabilities
5. Strong organization and ease of use
6. Strong objective and projective potential.
Weaknesses of the scales include the fact that some of the test questions exhibit cultural
bias; the tests do not allow for the distinction of full-scale IQs below 40, making them less than
useful than other tests in distinguishing among levels of handicap; and the tests cannot be used
alone in the diagnosis of EMH (Pierangelo & Giuliani, 1998).
Stanford-Binet Intelligence Scale Fourth Edition (SB: FE)
First developed by Binet in 1905 and revised by Terman at Stanford University to
become the Stanford-Binet test, this was the first test to compute a true IQ. The SB:FE helps to
differentiate between EMH children and those who have a specific learning disability. Now in its
fourth edition, it is generally regarded as the standard for the measurement of intelligence
(Jensen, 1969; Niolon, 2002). It also helps teachers and psychologists understand why a
particular child is having trouble learning in school (Pierangelo & Giuliani, 1998). The test helps
in the study of the development of cognitive skills in individuals from ages 2 to adulthood,

43
although it is generally used with younger children and with intellectually limited youngsters.
The Stanford-Binet requires approximately 45 to 90 minutes to administer on an individual basis
and is used to ascertain a measure of global or general intelligence by producing an IQ score.
The battery comprises 15 tests divided into four areas: verbal reasoning, quantitative reasoning,
abstract/visual reasoning, and short-term memory. An IQ score between 50 and 67, inclusive,
rates the individual as EMH.
The strengths of the test include rating scales on the cover of the test booklet for ease and
convenience and an “adaptive-testing” format that prevents excessive frustration or boredom for
the very dull, or the very bright, child. Its weaknesses are that the norming samples for some
tests at some age levels are inadequate; “time limits” are suggested, but the examiner may have
to rely on clinical judgment regarding enforcement of the limits; some of the subtests have a
ceiling that is much too low for older or very smart individuals; and it is not a particularly
valuable test for children with developmental delays (Pierangelo & Giuliani, 1998).
Kaufman Assessment Battery for Children (K-ABC): Mental Processing Scales
The purpose of the K-ABC is to measure intelligence and achievement. Developed in
1983, the K-ABC attempts to minimize the influence of language and acquired facts and skills on
the measurement of a child’s intellectual ability. It is predicated on the distinction between
problem solving and knowledge of facts. The former set of skills is interpreted as intelligence;
the latter is defined as achievement. This definition distinguishes the K-ABC from other
intelligence tests in that a person’s acquired factual information and applied skills greatly
influence the obtained IQ. A standardized measure, it is individually administered to students
ranging in age from 2½ to 12½ and is usually completed within 35 to 85 minutes, depending on

44
the age of the student. The K-ABC contains 10 subtests divided into two major areas: the
sequential processing scale and the simultaneous processing scale. A standard score of 69 and
below is considered to be “lower extreme” intelligence and achievement (Kaufman et al., 1999).
Strengths of the K-ABC include its excellent norming sample; the excellent reliability
and validity of its data; the provision of substantial data profiles of various groups of exceptional
children, profile differences related to gender, socioeconomic status, and racial group
membership; and the provision of suggestions for educational programming. The non-verbal
scale, in particular, significantly contributes to the effort to address the diverse needs of minority
groups and language-handicapped children (Kaufman et al., 1999).
On the other hand, the K-ABC should not be used in the intellectual diagnosis of EMH in
the preschool years because low scores at this age are very difficult to obtain. Since the test also
relies heavily on short-term memory, the scores of children with attention and short-term recall
difficulties may be skewed (Pierangelo & Giuliani, 1998).
Kaufman Adolescent and Adult Intelligence Test (KAIT)
The KAIT is an individually administered test for people between the ages of 11 and 85
and over. It yields three standard IQ scores: the Fluid, Crystallized, and Composite, each with a
mean of 100 and a standard deviation of 15. Fluid intelligence measures “a person’s adaptability
and flexibility when faced with new problems, using both verbal and nonverbal stimuli”
(Kaufman & Kaufman, 1993, p. 7). In other words, “fluid” intelligence is the capacity for new
conceptual learning and problem solving, relatively independently of education and experience,
which can be invested in the particular learning opportunities that the individual wishes to pursue
in accordance with his or her motivations and interests (Jensen, 1969). Crystallized intelligence,

45
on the other hand, measures the acquisition of facts and problem -solving ability using stimuli
that are dependent on formal schooling, cultural experiences, and verbal conceptual development
(Jensen, 1969; Kaufman et al., 1999).
Results from three fluid and three crystallized subtests are used to compute the IQ. This
test is standardized, very reliable, and valid. Based upon Piaget’s developmental theories and
Luria’s neuropsychological models, it is theoretically sound. The test materials are well
constructed, attractive, and stimulating to examinees; and the manual is well organized and
helpful. One of the weaknesses of the KAIT is that it can be difficult for borderline individuals
and for some older people who may be affected with poor eyesight, poor hearing, or poor
memory (Kaufman et al., 1999).
The Kaufman Brief Intelligence Test (KBIT)
The KBIT is intended as a brief measure of verbal and nonverbal intelligence, and it is
especially valuable as an assessment device for developing and evaluating remedial programs for
EMH students. It takes about 15 to 30 minutes to administer and may be given to persons
ranging in age from 4 to 90. Consisting of two subtests, vocabulary and matrices, it provides
percentiles, standard scores, and an IQ composite. This test is a good, quick screening measure
of intelligence that is simple and easy to score, yet still yields a psychometrically sound measure
of verbal, nonverbal, and composite intelligence. Nevertheless, its manual lacks clarity and
organization, and further validation studies are needed (Pierangelo & Giuliani, 1998).
46
Cognitive Assessment System (CAS)
The CAS is based on the planning, attention, simultaneous, and successive (PASS) theory
of intelligence. According to this theory, the human cognition includes four components.
“Planning” processes provide cognitive control, utilization of processes and knowledge,
intentionality, and self-regulation to achieve a desired goal. “Attentional” processes provide
focused, selective, cognitive activity over time. “Simultaneous” and “successive” processes are
the two forms of operating on information. The CAS yields standardized scores for these four
subtests, with an additional Full Scales score with a mean of 100 and a standard deviation of 15.
The CAS has high reliability and validity estimates. This test’s fairness was demonstrated by a
series of studies of the prediction of achievement for whites, blacks, Hispanics, non-Hispanics,
males, and females (Kaufman et al., 1999).
Naglieri and Rojahn (2001) conducted a study of 78 white and 78 black students who
were all placed in special education programs for EMH students. Their findings revealed that the
WISC-III Full-scale IQ scores were significantly lower than the CAS Full Scale scores. The
WISC-III thereby identified more children as EMH than the CAS (83.3% to 57.7%). The WISC-
III also classified more black students than white students as having EMH as compared to the
CAS (WISC-III: 88.9% vs. 75.8%, CAS: 53.3% vs. 63.6%, respectively). These researchers
concluded that the problem of over-representation of black children in EMH programs might be
addressed if the CAS were used instead of the WISC-III.
Woodcock-Johnson Psycho-Educational Battery-Revised: Tests of Cognitive Ability (WJ-R)
The WJ-R is one of the most comprehensive test batteries for the clinical assessment of
children and adolescents. It is administered to persons from age 2 to 90 and above and comprises

47
two sections: cognitive and achievement. The cognitive section comprises 21 subtests, seven of
which make up the Standard Battery (long-term retrieval, short-term memory, processing speed,
auditory processing, visual processing, comprehension-knowledge, and fluid reasoning). The
remaining 14 make up the supplemental battery. The cognitive test yields two composite scores:
the Broad Cognitive Ability and the Early Developmental (for preschoolers), and both are
comparable to an overall IQ score. Computer software is essential for scoring this test. It is also a
very lengthy test. It could take a minimum of 40 minutes just to complete the Standard Battery
and up to a maximum of 5 hours to complete both the cognitive and the achievement sections
(Kaufman et al., 1999).
However, the standardization of the test appears to be sound, and the various age groups
are adequately represented. Nonetheless, some researchers (McGrew, Werder, & Woodcock,
1991) critiqued its standardization procedures. These authors mentioned that paraprofessionals
and substitute teachers collected the original data, not psychologists. In addition, students with
handicaps were not included in the standardization sample but were only included if they
happened to attend the regular classes that were been sampled. Nevertheless, the cognitive test
can provide the psychologist with a wealth of information about a student’s intellectual
functioning and abilities. The test materials and manuals are user friendly and well designed
(Kaufman et al., 1999).
Differential Abilities Scales (DAS)
DAS is a relatively new test developed by Elliot in 1990 (Kaufman et al., 1999). It is
individually administered to persons ranging in age from 2½ to 17. It has a combined total of 17
cognitive and achievement subtests. The cognitive section has a preschool level and a school-age

48
level. Although the developer of this test views it as “eclectic,” McGhee’s 1993 findings showed
that it has its theoretical underpinnings in the “g” view of intelligence. The cognitive portion of
the DAS consists of “core” and “diagnostic” subtests. The “core” measures complex processing
and conceptual ability, while the “diagnostic” measures short-term memory and processing
speed. The scores of the core subtests are averaged to produce the General Conceptual Ability
(GCA) score, where the mean is 100 and the standard deviation is 15. Score information allows
the psychologist to ascertain information about aptitude–achievement discrepancies. Elliot
standardized this test on 3,475 children between 1987 and 1989. Over and beyond this number,
he added 600 cases of black and Hispanic children to analyze for item and prediction bias. There
is no evidence that the DAS is biased against blacks or Hispanics. This test is viewed as one of
the least biased tests available today. It also appears to be relatively culture fair. However, there
are issues with the way it is administered to children who are not proficient in English. It has
poor instructions for this group and for those who are hearing impaired (Kaufman et al., 1999).
The descriptions of protocols listed below are for less well-known or newer psychological tests
that are used for assessing cognitive and achievement abilities.
Columbia Mental Maturity Scale (CMMS)
CMMS is intended to measure the intelligence of children suspected of being EMH by
using a pictorial type of classification. It is an individual type scale, with 92 items of general
reasoning abilities that require perceptual discrimination involving color, shape, size, use,
number, kind, missing parts, and symbolic material. The student responds by selecting the
picture in each series that is different from, or unrelated to, the others. Administration time is
about 15 to 30 minutes and may be given to 3½-year-olds to 10-year-olds. The test mean is 100

49
and standard deviation is 16. The measured IQ range is from 50 to 150. Most children enjoy
taking this easy-to-administer test that can generate quality judgments of the child and his or her
method of attacking problems. However, the manuals need to be updated. The test has been
standardized on a non-disabled population only and little has been determined about the test’s
possible educational or clinical value (Pierangelo & Giuliani, 1998).
McCarthy Scales of Children’s Abilities (MSCA)
This test seeks to determine general intellectual level as well as strengths and weaknesses
in important abilities for children ranging in age from 2 years and 4 months to 8 years and 7
months (Pierangelo & Giuliani, 1998). It consists of 18 separate tests that are grouped into six
scales: verbal, perceptual-performance, quantitative, composite (general cognitive), memory, and
motor. The general cognitive raw score is converted into a standard score with a mean of 100 and
a standard deviation of 16. This score is called the General Cognitive Index and is equivalent to
an IQ score. The strengths of the MSCA include the following: it creates a framework within
which the child being tested can function comfortably; it is game-like with non-threatening
material; and it appears to be reliable and valid, thus making it a good determinant of
achievement for children in school (Pierangelo & Giuliani, 1998).
Its weaknesses are as follows: it excludes exceptional children from the standardization
sample; it lacks social comprehension and judgment tasks; it may not be appropriate for older or
gifted children because of a low ceiling level; and it may take a long time to administer and
interpret, thus requiring a lengthy scoring procedure that may be problematic for new users
(Pierangelo & Giuliani, 1998).

50
Slosson Intelligence Test- Revised (SIT-R)
The SIT-R is designed to provide a quick screening measure of verbal intelligence. It
measures six different categories with 187 oral questions that are arranged in order of difficulty.
No reading or writing is required. The SIT-R may be administered to persons aged 4 to 65. The
test has excellent reliability, can be administered and scored quickly, and can provide useful
information about probable level of mental ability. However, it is of limited use for young
children with language difficulties, it does not contain any performance tasks, and visual spatial
difficulties may be problematic to assess with the test (Pierangelo & Giuliani, 1998).
Otis-Lennon School Ability Test (OLSAT)
This test seeks to measure abstract thinking and reasoning ability. It consists of seven
different levels covering ages 5 to 18. Twenty-one different types of subtests are organized into
five clusters, and an equal number of verbal and non-verbal items is included at each level. The
psychologist, special education teacher, or classroom teacher may administer it in a group
format. The administration for students in grades K to 2 is 75 minutes over two sessions and for
grades 3 to 12, 60 minutes. The five clusters of testing are verbal comprehension, verbal
reasoning, pictorial reasoning, figural reasoning, and quantitative reasoning. The test is hand or
machine scorable and yields percentile rank, stanine, scaled scores, and NCEs by age and by
grade. The test is standardized on a large representative sample of the school population within
the U.S. and provides a variety of derived scores for separate age and grade groups.
Nevertheless, there are some concerns about the validity of the test, and examiners are cautioned
about using the upper three levels with students who are poor readers or are easily distractible
(Pierangelo & Giuliani, 1998).

51
Comprehensive Test of Nonverbal Intelligence (CTONI)
The CTONI is designed to measure the nonverbal intelligence of students who are
bilingual, speak a language other than English, or are socially/economically disadvantaged, deaf,
language disordered, motor impaired, or neurologically impaired. This test may be individually
administered to children ages 6 to 18 years and normally requires approximately 60 minutes for
testing. There are six subtests arranged according to three ability areas: analogical reasoning,
categorical classification, and sequential reasoning. The test provides standard scores,
percentiles, age equivalents, and three composite scores: a nonverbal intelligence quotient, a
pictorial nonverbal intelligence quotient, and a geometric nonverbal intelligence quotient
(Pierangelo & Giuliani, 1998). The CTONI is designed and documented to be unbiased with
regard to gender, race, and handicap. The directions can be administered orally or through simple
pantomime, and the test can be administered in less than 60 minutes. However, given the
newness of the test, further study is required to determine the limitations, if any, of its validity
and reliability.
Test of Nonverbal Intelligence – Third Edition (TONI-3)
Like the CTONI, this test also measures the nonverbal intelligence of students who are
bilingual, speak a language other than English, or are socially/economically disadvantaged, deaf,
language disordered, motor impaired, or neurologically impaired. The TONI-3 is a major
revision of the popular and well-designed Test of Nonverbal Intelligence. There are 50 items that
measure intelligence, aptitude, abstract reasoning, and problem solving that are completely free
of the use of language. The test requires no reading, writing, speaking, or listening skills on the
part of the student. It is norm-referenced, can be administered in about 15 to 20 minutes, and is

52
applicable to people from age 5 to 85. The test is quick to score, easy to administer, requires
responses that are motor reduced, and is particularly well suited for individuals with multiple
handicaps. However, because of its relative newness, further study is required to determine the
limitation, if any, of its validity and reliability (Pierangelo & Giuliani, 1998).
Universal Nonverbal Intelligence Test (UNIT)
The UNIT is a set of individually administered specialized tasks. These tasks are
designed to measure fairly the general intelligence and cognitive abilities of children and
adolescents from ages 5 to 17 who may be disadvantaged by traditional verbal and language-
loaded measures. The administration and response are entirely nonverbal. It measures a broad
range of complex memory and reasoning abilities. It contains six subtests: symbolic memory,
spatial memory, object memory, cube design, analogic reasoning, and mazes. The memory
subtests measure recall of content, location, and sequence. The reasoning subtests measure
pattern processing, problem solving, understanding of relationships, and planning abilities. Each
of the subtests yields an age-appropriate, scaled score with a mean of 10, and a standard
deviation of 3. The UNIT then provides five scales with a standard score with a mean of 100 and
a standard deviation of 15 for each of the five scales. These five scales are memory quotient,
reasoning quotient, symbolic quotient, nonsymbolic quotient, and full-scale intelligence quotient.
The UNIT is intended to provide a fair assessment of intelligence for children who have
speech, language, or hearing impairment; color-vision deficiencies; different cultural or language
backgrounds; and those who are verbally uncommunicative. It is a standardized, norm-
referenced measure that was standardized in a stratified random sampling plan that closely

53
matched the U.S. population according to the 1995 census data. Technical analyses provide
evidence that the UNIT’s reliability, validity, and test properties are sound for the different types
of children that it evaluates (Bracken & McCallum, 1998; Riverside Resource Bulletin, 2003).
Legislation and Court Cases
Legislation and court rulings set regulations and precedence in the treatment of over-
representation of blacks in special education, including EMH. This section reviews the most
recent amendments to IDEA 1997 as they relate to disproportionate representation of blacks in
EMH and court rulings that are relevant to over-representation of blacks in EMH.
IDEA and many associated judicial decisions require districts to implement
nondiscriminatory procedures that ensure that children with handicaps, rather than racial
differences, are appropriately identified. IDEA expanded congressional intent to be more
responsive to the growing needs of an increasingly more diverse society (Oswald et al., 1999).
This law reads as follows:
300.755 Disproportionality
(a) General. Each State that receives assistance under Part B of the Act, and the Secretaryof the Interior, shall provide for the collection and examination of data to determine ifsignificant disproportionality based on race is occurring in the State or in the schoolsoperated by the Secretary of the Interior with respect to -
(1) The identification of children as children with disabilities, including theidentification of children as children with disabilities in accordance with aparticular impairment described in section 602 (3) of the Act; and
(2) The placement in particular educational settings of these children.
(b) Review and Revision of Policies, Practices, and Procedures. In the case of adetermination of significant disproportionality with respect to the identification ofchildren with disabilities, or the placement in particular educational settings of thesechildren, in accordance with paragraph (a) of this section, the State or the Secretary of theInterior shall provide for the review and, if appropriate, revision of the policies,

54
procedures, and practices used in the identification or placement to ensure that thepolicies, procedures, and practices comply with the requirements of Part B of the Act(Authority:20 U.S.C. 1418(c)).
Whether or not this law can be enforced becomes a matter of debate. However some
court cases that preceded this amendment have helped to resolve the issue of over-representation
of blacks in EMH in some states.
A number of court and monitoring actions have challenged and attempted to influence the
evaluation and placement of black students and other minority students into special education
(Oswald et. al. 1999). Court cases concerning disproportionate placement of black and Hispanic
students first appeared around 1970. These cases centered on challenges to the use of
individually administered IQ tests, special education programming, and other aspects of
psychological services. Typical facts in these cases included the over-representation of black
students in special education programs usually with a diagnosis of EMH and placement into self-
contained classes (Reynolds & Gutkin, 1999).
Well-known cases include Diana v. California State Board of Education (1970),
Guadalupe Organization v. Tempe Elementary School District No. 3 (1972), and Larry P. v.
Riles (1972). Diana was a class-action suit filed on behalf of nine Mexican American students in
the Monterey County Schools of California. At the time, 18.5% of the total student enrollment in
the school district was Hispanic, but 33.3% of the EMH enrollment was Hispanic. Similar issues
existed in the Guadalupe case, a class-action case filed on behalf of Hispanic and Native
American students. The plaintiffs claimed that over-representation violated the equal protection
principle, the civil rights statutes, and due process rights. The view of these plaintiffs was that
students were being denied educational opportunities based on some inherent characteristic (race
or ethnicity) that was invalid (Reschly & Bersoff, 1999).

55
Both Diana and Guadalupe were settled by consent decrees; that is, the court approved a
settlement negotiated between the parties. The consent decrees centered on the kind of IQ tests
used with minority students who had limited English proficiency (LEP) or the manner in which
the test was administered (in the student’s primary language) (Reschly & Bersoff, 1999). The
California Department of Education agreed to do the following as per the Diana case: (a) test
bilingual children in both English and their primary language; (b) remove unfair verbal items
from tests; (c) re-evaluate all Mexican American and Chinese students enrolled in classes for
individuals with EMH, use nonverbal items, and test them in their native language; and (d) make
IQ tests that incorporate Mexican American culture and are standardized only on a Mexican
American population (Swanson & Watson, 1989; Ysseldyke & Algozzine, 1990). The Diana and
Guadalupe consent decrees are also important in the evolution of the legal rights of parents and
issues of nondiscrimination in assessment, classification, and placement. The IDEA incorporated
verbatim much of the language of the Diana and Guadalupe consent decrees (Reschly &
Bersoff, 1999).
The Larry P. v. Riles was a class-action case filed on behalf of black elementary students
in the San Francisco Public Schools who allegedly were inappropriately placed in classes for
EMH students. The major facts included over-representation data, showing that although black
children constituted 28.5% of the district’s overall enrollment, 66.6% of the pupils in EMH were
blacks (Reschly & Bersoff, 1999). In the court settlement, California was ordered to stop using
any standardized intelligence tests such as the Wechsler Intelligence Scale for Children or the
Stanford-Binet, unless they were proved to be free of racial or cultural bias. In addition, all tests
were to be conducted in a non-discriminatory way. Comparative black and white students’ data
on referrals and placement decisions were to be maintained. Disproportionate placements were to

56
be monitored and eliminated. Finally, all black students were to be evaluated without using
standardized intelligence/ability tests (de la Cruz, 1996; Swanson & Watson, 1989; Ysseldyke &
Algozzine, 1990). In the Larry P case, Judge Peckham concluded his opinion with the following:
Whatever the future, it is essential that California’s educators confront the problem of thewidespread failure to provide an adequate education to underprivileged minorities such asthe black children who brought this lawsuit. Educators have too often been able torationalize inaction by blaming educational failure on an assumed intellectual inferiorityof disproportionate numbers of black children. That assumption without validation isunacceptable, and it is made all the more invidious when “legitimized” by ostensiblyneutral, scientific IQ scores. (Ysseldyke & Algozzine, 1990)
These dramatically altered criteria were created to reduce the racial discrimination
associated with this placement. Nevertheless, there is continued evidence of a statistically
significant over-representation of minorities in these special education categories (Benner, 1998).
Special education pupil count data for California’s 1981–1982 school year, for example, revealed
that 17.5% of black children were classified as EMH, although they made up only 9% to 10% of
the school population (de la Cruz, 1996).
In contrast to the Larry P case, where the ruling was in favor of the plaintiffs, in other
noteworthy cases such as PASE v. Hannon (1980), Marshall et al. v. Georgia (1984), S-1 v.
Turlington (1986), and Crawford v. Honig (1988), the rulings were against the plaintiffs. In
several of these cases, the facts were similar to the Larry P case, but the outcome was the
opposite.
In the PASE v. Hannon case, Parents in Action on Special Education (PASE) brought a
class-action suit on behalf of all black children in the Chicago Public Schools (CPS) who had
been or would have been placed in classes for individuals with EMH. The plaintiffs noted that
black students made up 82% of the enrollment in classes for individuals with EMH, whereas
only 62% of the total CPS enrollment was black (Salvia & Ysseldyke, 1995). The judge sided

57
with the defendants and ruled that IQ tests were not biased and that multifactored assessments
guarded against misplacement in the case of EMH (Turnbull, 1993).
The Marshall et al. v. Georgia (1984) case was another class-action suit filed by the
Georgia Legal Services, Inc., and the Georgia State Conference of Branches of National
Association for the Advancement of Colored People (NAACP) on behalf of all black students in
Georgia public schools, alleging violations of sundry statutory and constitutional rights (Reschly
& Bersoff, 1999). The plaintiffs alleged that Georgia schools had a statistically significant over-
representation of black students in the EMH program. The judge opined that socioeconomic
conditions of poverty among black students in Georgia provided a sufficient explanation for their
over-representation, thus dismissing the plaintiffs’ claim concerning discrimination by race and
improper classification (Reschly & Bersoff, 1999; Swanson & Watson, 1989).
In the S-1 v. Turlington (1986) case, over-representation of black students in EMH
programs in Miami, Florida, served as the emphasis in this class-action trial. The plaintiffs
placed more emphasis on test bias and the interpretation of the sociocultural background of the
federal regulations embodied in the then-current IDEA regulations. The trial court dismissed the
claims of the plaintiffs “with prejudice” and decertified the case, meaning that the plaintiffs did
not establish a prima facie case of discrimination and that re-establishing a similar suit on these
claims in this district would be extremely difficult. The court’s ruling further stated that the
plaintiffs failed to prove that black students had been improperly classified and placed in EMH
(Reschly & Bersoff, 1999; Reynolds & Gutkin, 1999).
The Crawford v. Honig (1988) case was also a class-action suit against the California
Department of Education on behalf of black students whose parents were prevented by the 1986
Larry P. injunction from making decisions about IQ testing in pre-placement evaluations of their

58
children, a right that parents of white children could exercise (Reschly & Bersoff, 1999). The
crux of the case centered on the school’s refusal of a mother’s request to administer an
intelligence test to her son, Desmond Howard. Desmond’s mother was Hispanic and his father
was black, but on the school racial code, the box checked for Desmond was “black.” If his
mother agreed to change his race to Hispanic, he could be tested, but under the prohibition
against testing black students imposed in the Larry P. verdict, he could not be given an
intelligence test (MacMillan & Reschly, 1998). Thus, the verdict was similar to the Larry P.
outcome, but not without some confusion for parents with bi-racial children.
Obstacles to Change
It is natural for people to oppose change, and the literature review bore out some
educators’ reasons for resisting change to resolve the issue of over-representation of blacks in
EMH. The discussion below describes some of the reasons proffered in the literature.
According to Grossman (1998), many professors of education bear some of the
responsibility for the lack of diversity among educators. He noted that professors spend little
time recruiting poor and minority students into their teacher preparation programs. He suggested
that special education professors must recruit into their teacher preparation programs individuals
who are devoted to improving the education of all students: minorities, poor, migrant, immigrant,
and rural students, as well as middle-class, white students. The recruitment of bilingual
individuals, who understand and appreciate students’ cultural and linguistic characteristics,
should also be given special attention.
Grossman (1998) suggested five reasons many special educators resist learning about
students’ cultural, contextual, and linguistic characteristics that could influence their attitudes

59
towards minority students and reduce the large percentage of children being referred to EMH.
These reasons are
1. The lack of diversity among special educators
2. Their prejudicial attitudes
3. Their reluctance to “rock the boat” because of the risks involved
4. Their unwillingness to expend the energy involved in teaching in a multicultural
manner
5. Their lack of preparedness for working with the diverse group of students in EMH
programs.
Special education teachers usually are not representative of the students they work with.
Teachers from poor backgrounds and from minority backgrounds are scarce. Although 32% of
students in special education programs are from culturally diverse backgrounds, only 14% of
their teachers are from minority groups. Even here, many of these minority teachers are
significantly more likely to leave this field of teaching (Cook & Boe, 1995). Spellman (1988)
suggested that if the current decline in minority educators continues, the numbers would decrease
to 6% by the year 2000.
Marlowe (2001) stated that another problem with special educators is that many are
reluctant to work as special educators particularly when they can secure regular education
teaching positions. He categorized the disincentives to working in the field to include a
staggering amount of paperwork; overwhelming caseloads; endless meetings; escalating
disciplinary problems; and increasingly adversarial, uncivil, and litigious parents. Many of the
teachers feel that the job requires almost daily compromising of one’s integrity, since special
educators must often choose between protecting the fiduciary interests of the school that

60
provides them with a job and the educational needs and civil rights of their charges. Marlowe
stated that all too often, the most highly trained special educators “wallow in a sea of paperwork,
while well-meaning, but undertrained and underpaid paraprofessionals, volunteer grandmothers,
and special education aides provide direct service to the nation’s neediest students” (p. 43).
Paraprofessionals turn over just as quickly as special education teachers, because, despite their
hard work and dedication, they often lack the skills needed to work with these challenging
pupils, especially when they work for barely more than minimum wage.
Grossman (1998) also asserted that many special educators do not want to know that their
teaching methods are culturally, contextually, and linguistically inappropriate for some of their
students. Some of these educators may think that doing right by their students will put them at
risk with other teachers and may also jeopardize their job security. They may also be unwilling
to commit themselves to the additional time and effort that are necessary to adapt their teaching
styles to their students’ different needs (Grossman, 1995; Suzuki, 1984).
Ideas for Reducing the Over-Representation of Blacks in EMH
Several researchers have proffered suggestions for resolving over-representation of
blacks in EMH. While some of the proposals might sound draconian and impractical, others
appeared to be feasible and could be implemented. The ideas ranged from recruiting culturally
diverse teacher-preparation students, changing the curricula in teachers’ colleges to embody
more multicultural studies, re-assessing how students are evaluated and the testing protocols that
are used to appraise them, overhauling the entire special education system, implementing a
“systems” approach of early detection and intervention, and working with families to provide as
much support and services as possible. Some suggestions are more teacher focused, while others

61
are student centered. The discussion in this section proceeds with those proposals that are teacher
focused and then to others that are more child centered.
One of the more beneficial areas to explore in this search for more effective education for
black students in EMH might be the incorporation of multicultural education principles in the
pre-service preparation of general and special education teachers. The studies of Banks and
Grant and Sleeter focused on teaching content about cultural pluralism, teaching culturally
different students, and using cultural pluralism to teach other academic subjects and intellectual
skills (Gay, 1994). If those components of teacher training that have to do with curriculum,
classroom management, and evaluation are broadened to include diversity, cultural pluralism,
and culturally relevant modalities and strategies, teachers in regular education would be prepared
more effectively to work with a broader cross-section of students and their differing abilities.
With the acquisition of cultural and linguistic knowledge and new perceptions and practices,
teachers would probably make fewer referrals of black children for EMH services and therefore
reduce the disproportionate number of black children in these programs. If the special education
teachers also incorporated this body of knowledge into their work, they would be better prepared
to offer appropriate educational services to black students (Valles, 1998).
Other researchers suggested that special education personnel preparation programs
should offer multicultural modality training (Patrick, 1986; So, 1987). They suggested that
during their teacher-training programs, special educators should have firsthand experience with
poor and black students, so that they may understand more effectively how these students live.
Attempts should be made to identify and utilize training sites where pre-service teachers can
develop their budding practices while working in these diverse settings (Valles, 1998).

62
Teachers must also be taught to change their expectations regarding student achievement,
evaluation procedures, instructional techniques, curriculum materials, and classroom
management techniques to make them as free from bias as possible (Benner, 1998; Bernal &
Bernal, 1974; Grossman, 1995; Patrick, 1986; So, 1987). The pre-referral process leading up to
EMH identification should also be systemically studied. This process has not been fully utilized
to confirm or disconfirm EMH diagnoses for blacks (Serna, Forness, & Nielsen, 1998). Special
educators must be willing to re-examine their role and re-evaluate how they can improve on the
services they provide, especially in light of the fact that the student body will continue to be
more diverse in the future (Valles, 1998).
Ewing (1995) stated that student learning could be enhanced through an educator’s
awareness and knowledge of racial differences. Educators should have a more heightened regard
and authentic knowledge of various races and cultures and a greater understanding of the impact
of cultural variances upon student behavior. In addition, a diverse teaching force might assist in
reducing the number of students who are mislabeled, which would lead to the lowering of the
over-representation of black students in EMH. High quality teachers for EMH students would
also be beneficial. The Civil Rights Project (2002) recommended that the federal government
should insist that states receiving Title I and IDEA grants make substantial progress toward
ensuring black students in both general and special education have equitable access to high
quality teachers.
While Payne (2001) did not focus specifically on EMH children, she suggested that
teachers and educators who work with poor children (as many blacks are) should seek to develop
positive relationships with these students, because these relationships become significant
motivators for poor students. Relationships can be developed by establishing a caring

63
environment for them, promoting student achievement, providing role modeling, and insisting on
successful behaviors.
Marlowe (2001) recommended that a radical overhauling of special education is needed
to keep talented individuals in the field of special education. He advocated the elimination of
paraprofessionals at this level. He proffered the idea of using paralegals to do the massive
amount of federal and state mandated paperwork, thus allowing the special educators to teach the
neediest students; and providing expert consultation to help regular teachers grant students with
handicaps the appropriate education warranted.
Some researchers recommended a “systems” approach to reduce the disproportionate
representation of blacks in EMH. This approach includes early detection and primary prevention,
assessment, culturally sensitive instruction, and school–home–community relationships (Serna et
al., 1998). Early detection implies recognition of a child’s problem before it becomes a matter of
referral. Parents, teachers, or doctors could make the detection. Primary prevention includes
developmental or incremental stages as a means of intervention and is meant to forestall
emotional and academic problems in children. Investments in high-quality special education and
early intervention are also sorely needed and could reduce the likelihood that black students with
EMH will develop serious discipline problems or eventually drop out of school (Civil Rights
Project, 2002).
Jensen (1969) suggested that the intensity and specificity of the instructional aspects in
early childhood programs could help boost academic gains. He argued not only for ordinary
preschool attendance but also for enrichment programs with special cognitive training, especially
in verbal skills to be added to programs to increase IQ gains by as much as 10 points. Jensen was
of the opinion that highly concentrated, direct instruction emphasizing basic skills is more

64
effective in improving academic success than the more diffuse cultural enrichment. He believed
that educators should concentrate on these types of instructional methods and the use of direct
tests of the skills the instructional programs are intended to inculcate, and they should de-
emphasize IQ tests as a means of assessing student gains.
Other diagnosticians have taken another look at intelligence testing and are pressing
forward with changes. One such model is the Kaufman Assessment Battery for Children (K-
ABC). This model shifts assessment from content to process. Another is the Planning, Attention,
Simultaneous, Successive Model or PASS that was developed by Naglieri, Das, and Jarman for
discriminatory assessment and intervention planning. The PASS model incorporates a series of
questions in the analysis of a child’s planning processes during the act of problem solving. These
investigators cited research confirming that simultaneous, successive, and planning processes are
related to achievement, including measures of reading comprehension, reading decoding,
performance in college-level English courses, and mathematics (Benner, 1998).
Artiles and Zamora-Duran (1997) continued in this vein by suggesting the use of
performance-based testing and portfolio assessment. They suggested that performance-based
testing is especially critical for special educators in light of the traditional and central role that
assessment has played in EMH practice. They argued that portfolio evaluation can be used to
support primary language instruction; document students’ funds of knowledge; function as a
reflective tool; support high level, complex problem solving; show that teachers and students are
making a difference; and demonstrate to parents and the larger community the growth and
achievement of students. In similar fashion, others have argued that examining Gardner’s
concept of multiple intelligence would declare that students should be measured not only by
linguistic and reasoning ability but also by other modalities of intelligence (Benner, 1998).

65
Jensen (1969) mentioned that possibilities for greater rewards for all concerned exist
when various student abilities and different modes of learning are explored to fulfill the
objectives of educating children. He declared:
If diversity of mental abilities is a basic fact of nature, and if the ideal universal educationis to be successfully pursued, it seems a reasonable conclusion that schools and societymust provide a range and diversity of educational methods, programs, and goals and ofoccupational opportunities, just as wide as the range of human abilities. Accordingly, theideal of equality of educational opportunity should not be interpreted as uniformity offaculties, instructional techniques, and educational aims for all children. Diversity ratherthan uniformity of approaches and aims would seem to be the key to making educationrewarding for children of different patterns of ability. The reality of individualdifferences thus need not mean education rewards for some children and frustration anddefeat for others. (p. 82)
Bill East, the executive director of the National Association of State Directors of Special
Education, said that school districts and states should be concerned about the way they identify
EMH students. “They need to look at programs and practices very closely, and do everything
they can to make sure that the problems the Civil Rights Project at Harvard University brought
out are not happening in their districts” (Fine, 2001, p.6). School and program administrators
should be including in-service training of multicultural and bilingual education for all teachers,
so as to generate systemic support strategies, and fostering policy development for encouraging
these practices in the classrooms and in the schools (Sexton, Lobman, Constans, Snyder, &
Ernest, 1997).
Artiles, Aguirre-Munoz, and Abedi (1998) suggested that professionals must assess
family size when working with black students. They should determine whether family members
know how to use existing resources and, if not, assist them in identifying and maximizing
resources to benefit themselves. These researchers also noted that special educators must help
parents develop systems that will strengthen their children’s study and work habits and educate
parents about family structures and rules. Black parents should also be empowered to seek

66
remedies in addressing the disproportionate placement of their students in EMH classes. Federal
legislation should include a private right or action and an opportunity for judicial review for
individuals and classes of complainants specific to racial disproportionality, but structured so
that these rights and remedies would not detract from, or delay, the exercise of rights or
opportunities for private action that exist under the current state or federal law (Civil Rights
Project, 2002). Finally, educators must get to know their black students in order to understand
how they perceive themselves and the school culture (Artiles et al., 1998).
The continued misuse of the education bureaucracy in fostering and encouraging a
system of tracking that result in an inferior education for black students should be eliminated.
Alternative approaches to meeting the educational needs of all children, regardless of race,
culture, poverty level, or linguistic preferences, can be offered without the necessity of labeling
children merely because they are different. Simultaneously, diagnostic measures that are
designed to eliminate the current biases inherent in some psychological evaluations must be
established so black children who are identified EMH can be properly identified and served
(Benner, 1998).

67
CHAPTER 3
METHODOLOGY
Introduction
The purpose of this chapter is to describe the methods and procedures used in the
collection and analysis of data of this study. The four sections of this chapter are organized as
follows: (a) statement of the problem, (b) research questions, (c) methodology, (d) data
collection and analysis of data.
Problem Statement
Over-representation of black students is a problem when it comes to EMH, because of the
perceptions and stigma it evokes for the individual students, their families, the community, and
the wider population (MacMillan & Reschly, 1998). It also gives the impression that black
students in general are not intelligent. This identification creates an assumption that they cannot
learn and, for the most part, are deemed to lead a substandard existence, especially since
intelligence, via education, has its greatest effect in the assortment of individuals into
occupational roles (Jensen, 1969).
The literature suggests that the socioeconomic status of students bears a significant
relationship to the identification and placement of students into EMH. Children who live in
poverty have a greater likelihood that they will be recognized as EMH (Artiles & Trent, 1994;

68
MacMillan & Reschly, 1998; Monson, 2003; Newman, 1995; Oswald et al., 1999; Yeargin-
Allsopp et al., 1995).
The characteristics of the public school district may also influence identification of these
children. In measuring socioeconomic status, White, in his 1982 analysis of more than 70
different variables used to measure SES, found that the top three variables in the school
resources category were instructional expense per pupil, salary of teachers, and percentage of
teachers with master’s degrees (Valencia & Suzuki, 2001). Two of these variables—expenditure
on students’ education or FTE and teachers’ advanced learning—along with school district’s
wealth, population density (urbanicity), size, and racial composition of full-time, non-
instructional staff have been included as the characteristics of school districts that will be
analyzed to measure their effects on the identification of black students in EMH.
Research Questions
1. Is there an over-representation of black students in EMH in the 67 public school
districts in Florida?
2. Does the socioeconomic status of school districts affect the proportions of white,
black, and Hispanic students identified as EMH?
3. Does the wealth of school districts affect the proportions of white, black, and
Hispanic students identified as EMH?
4. How do the characteristics of public school districts (population density or urbanicity;
size of districts based on student enrollment; racial composition of the full-time, non-
instructional staff; percentage of teachers with bachelor’s degrees; and district

69
expenditures per student) affect the proportions of white, black, and Hispanic students
identified as EMH?
Hypothesis 1: There is no statistically significant over-representation of blacks in EMH in
the 67 public school districts in Florida at the .05 significance level.
Hypothesis 2: There is no statistically significant difference between the proportions of
white, black, and Hispanic students identified as EMH when the socio-economic status of school
districts is the independent factor of measurement at the .05 significance level.
Hypothesis 3: There is no statistically significant difference between the proportions of
white, black, and Hispanic students identified as EMH when school districts’ wealth is the
independent factor of measurement at the .05 significance level.
Hypothesis 4: There is no statistically significant difference between the proportions of
white, black, and Hispanic students identified as EMH when the characteristics of the school
districts are independent factors of measurement at the .05 significance level.
Methodology
Data were collected from all 67 public school districts in Florida as reported to the
Florida Department of Education database for the school year 2001–2002. The Statistical
Package for Social Science (SPSS) Graduate Package (11.0) was used to analyze the data.
Percentages and proportions were calculated to determine whether there was over-representation
of black students in EMH. Further analysis was done using the general linear model with
repeated measures.
The number and percentage of students on free and reduced lunch were calculated to
determine the socioeconomic status of public school districts. The proportion of students

70
receiving free and reduced lunch in the three major races was calculated by dividing the total
number of students receiving free and reduced lunch in each major racial group by the total
number of students in the corresponding racial group for each public school district. These
proportions were then ranked into these three categories:
• 0–39 % of students on free/reduced lunch - High SES school districts
• 40–59 % of students on free/reduced lunch - Medium SES school districts
• 60–100% of students on free/reduced lunch -Low SES school districts
The general linear model with repeated measures was used to analyze the data to see if
there was a statistically significant difference between the proportions of white, black, and
Hispanic students identified as EMH when socio-economic status of school districts was the
independent factor of measurement. A plot was generated to demonstrate visually the difference
between the proportions of white, black, and Hispanic students identified as EMH when
socioeconomic status was the independent factor of measurement.
The wealth of public school districts was based on non-exempt, assessed valuation of
property divided by the total student enrollment within that public school district. This
calculation determined the wealth of the school district. School districts were arbitrarily ranked
in the following manner based upon their wealth:
• $0–$199,999 -Poor district
• $200,000–$349,999 -Middle district
• $350,000–$599,999 -Upper middle district
• $600,000 and above -Wealthy district
The general linear model with repeated measures was used to determine whether there
was a statistically significant difference between the proportions of white, black, and Hispanic

71
students identified as EMH when the wealth of school districts was the independent factor of
measurement. A plot was generated to demonstrate visually the difference between the
proportions of white, black, and Hispanic students identified as EMH when public school district
wealth was the independent factor of measurement.
The districts were grouped into regions based on their population density (urbanicity).
Five school districts were categorized as urban, 25 as suburban, and 37 as rural. The general
linear model with repeated measures was used to analyze the data. A plot was generated to
demonstrate visually the difference between the proportions of white, black, and Hispanic
students identified as EMH when public school district population density (urbanicity) was the
independent factor of measurement.
Public school districts were also classified based on size. Size of school district was
defined by student enrollment in that public school district. School districts were arbitrarily
ranked based on the number of students enrolled for 2001-2002 as follows:
• A small district had 1 to 29,999 students
• A medium-sized district had 30,000 to 59,999 students
• A large district had 60,000 to 89,999 students
• A very large district had 90,000 and more students
The general linear model with repeated measures was used to analyze the data. A plot
was generated to demonstrate visually the difference between the proportions of white, black,
and Hispanic students identified as EMH when the size of public school districts was the
independent factor of measurement.
Because of its large representation within the majority of school districts, white, full-
time, non-instructional staff was grouped and ranked within the 67 school districts. A percentage

72
of white, full-time, non-instructional staff was calculated for each district and that percentage
became the basis of the ranking. School districts’ white, full-time, non-instructional staff was
arbitrarily ranked as follows:
• School districts with 0.00 to 59.99 percent white, full-time, non-instructional staff
• School districts with 60.00 to 69.99 percent white, full-time, non-instructional staff
• School districts with 70.00 to 79.99 percent white, full-time, non-instructional staff
• School districts with 80.00 to 89.99 percent white, full-time, non-instructional staff
• School districts with 90.00 to 100.00 percent of white, full-time, non-instructional
staff
The general linear model with repeated measures was used to analyze the data. A plot
was generated to demonstrate visually the difference between the proportions of white, black,
and Hispanic students identified as EMH when white, full-time, non-instructional staff of public
school districts was the independent factor of measurement.
To test the hypothesis on whether teachers’ degrees affected the proportions of white,
black, and Hispanic students identified as EMH, school districts were categorized based on the
percentage of teachers with a bachelor’s degree. There were three categories within this
characteristic. The percentage of teachers with a bachelor’s degree in the school districts were
ranked as follows:
• School districts with 1.00 to 59.99% of teachers with a bachelor’s degree
• School districts with 60 to 69.99% of teachers with a bachelor’s degree
• School districts with 70% or more of teachers with a bachelor’s degree
The general linear model with repeated measures was used to analyze the data. A plot
was generated to demonstrate visually the difference between the proportions of white, black,

73
and Hispanic students identified as EMH when the percentage of teachers with a bachelor’s
degree was the independent factor of measurement.
The average FTE within school districts were categorized and ranked. The categories are
as follows:
• School districts with FTE between $5,000 to $5,499
• School districts with FTE between $5,500 to $5,999
• School districts with FTE between $6,000 to $6,499
• School districts with FTE between $6,500 and above
The general linear model with repeated measures was used to analyze the data. A plot
was generated to demonstrate visually the difference between the proportions of white, black,
and Hispanic students identified as EMH when public school districts’ FTE was the independent
factor of measurement.
Data Collection and Analysis
SPSS Graduate Package (11.0) was the main statistical tool used to analyze the data that
were collected from the Florida Department of Education database. The first purpose of the
research was to determine if there was an over-representation of black students in EMH in
Florida in 2001–2002 based on the definition presented previously. Second, the researcher
sought to identify any significant difference between the proportions of white, black, and
Hispanic students identified as EMH when socioeconomic status of school districts was the
independent factor of measurement. Third, this investigator sought to identify any significant
difference between the proportions of white, black, and Hispanic students identified as EMH
when public school district wealth was the independent factor of measurement. Finally, this

74
researcher examined some of the characteristics of the school districts and sought to identify any
significant difference in the proportions of white, black, and Hispanic students identified as
EMH when these characteristics were the independent factors of measurement.
The first hypothesis was that there was no statistically significant over-representation of
blacks identified as EMH. The second hypothesis was that there was no statistically significant
difference between the proportions of white, black, and Hispanic students identified as EMH
when the socioeconomic status of public school districts was the independent factor of
measurement. The third hypothesis was that there was no statistically significant difference
between the proportions of white, black, and Hispanic students identified as EMH when school
district wealth was the independent factor of measurement. The final hypothesis was that there
was no statistically significant difference between the proportions of white, black, and Hispanic
students identified as EMH when the characteristics of the school districts (population density or
urbanicity, size of the districts based on student enrollment, racial composition of full-time, non-
instructional staff, the percentage of teachers with a bachelor’s degree, and the district
expenditure per student) were the independent factors of measurement.
Summary
Chapter 3 presented the methodology used in the collection of data for this study. The
research design and method of analysis were also explained. Subsequent chapters contain data
analyses, findings of the data analyses, discussion of quantitative data gathered, and implications
of the results of this study for further research.

75
CHAPTER 4
DATA ANALYSIS
Introduction
This study examined the representation of black students in EMH in K–12 schools within
the 67 public school districts of Florida. The analysis of data from the Florida Department of
Education database for school year 2001–2002 is presented in this chapter.
Description of the 67 Public School Districts
Computation from the public school districts in Florida illustrated interesting results
concerning the demographic characteristics of student enrollment and district characteristics.
Table 1 depicts data on total student enrollment, EMH enrollment, and total students on
free/reduced lunch.

76
Table 1
Total Student Enrollment, Total EMH Students, and Total Students on Free/Reduced Lunch forFlorida’s 67 Public School Districts for School Year 2001–2002
White Black Hispanic Totalstudents
# % # % # %
Total enrollment 1,282,231 51.4 611,384 24.5 504,639 20.2 2,495,426
Total EMH 9,650 32.7 15,791 53.5 3,673 12.4 29,521
Total onfree/reduced lunch
336,628 30.6 417,715 38.0 310,788 28.2 1,100,623
The largest school district was Dade with 374,806 students, and the smallest was
Lafayette with 1,030 students. The school district that had the largest percentage of EMH white
students was Holmes (94.6% of the total EMH student population was white). The district with
the largest percentage of EMH black students was Gadsden (89.4%). The district with the largest
percentage of EMH Hispanic students was Hardee (54%).
Five school districts were classified as “urban” (Broward, Dade, Duval, Hillsborough,
and Orange), 25 as “suburban,” and 37 as “rural.” Based on the wealth of the school districts, 22
were classified as “poor,” 25 as “middle,” 12 as “upper middle,” and 8 as “wealthy.” The eight
“wealthy” school districts in descending order were Monroe, Collier, Walton, Franklin, Sarasota,
Martin, Indian River, and Lee. (See Table 2.) (For a complete list of school districts, their wealth
and rank, urbanicity, and size, see Tables 16 and 17 in the Appendix.)

77
Table 2
Classification of School District Wealth, Number, and Percentage of Districts in Each Category
District wealth # ofdistricts
Percent oftotal
districts
$0–$199,999 22 32.8
$200,000–$349,999 25 37.3
$350,000–$599,999 12 17.9
$600,000 and above 8 11.9
Total Floridadistricts
67 99.9
Note: Total percent less than 100 due to rounding error.District wealth = non-exempt, assessed valuation of property / total student enrollment for eachschool district. Source for non-exempt, assessed valuation of property: 2001–02 Funding forFlorida School Districts—Statistical Report of Florida Department of EducationNumber of districts = number of public school districts that fit into each categoryPercent of total districts = percent of public school districts that represents each category
The faculty of Florida’s school districts comprised the following degreed personnel:
89,970 (60.3%) teachers had a bachelor’s degree; 53,621 (35.9%) had a master’s degree; 4,019
(2.7%) had a specialist degree; and 1,664 (1.1%) had a doctoral degree. There were 189,350
white, full-time, non-instructional staff members; 57,683 black, full-time, non-instructional staff
members; and 30,091 Hispanic, full-time, non-instructional staff members for a total of 279,894
full-time, non-instructional staff employees.

78
Research Question 1
Is there an over-representation of black students in EMH in the 67 public school districts
in Florida?
In this study, “over-representation” of a given racial group occurs when the proportion of
that racial group enrolled in a given category of special education exceeds the proportion of the
racial group in the school population at the local, district, state, or national level (Macmillan &
Reschly, 1998). In Tables 12 and 13 in the Appendix the data were presented for all 67 school
districts regarding the number and percentage of students enrolled in the general school
population classified by race and the corresponding number and percentage of students enrolled
in EMH also classified by race for school year 2001–2002.
In two school districts, the percentage of whites in EMH was greater than the percentage
of whites in the general school enrollment: Gadsden (6.0% vs. 5.7%) and Holmes (94.6% vs.
94.2%). These differences were not important for this study because the percentage differences
were minuscule.
For Hispanic student enrollment in EMH compared with the general student population,
the picture was different. In 17 school districts, the percentage of Hispanic enrollment in EMH
was greater than the percentage of Hispanic students in the general student body. However, only
13 cases were considered important for this study because the percentage differences between
Hispanics in general enrollment and Hispanics in EMH programs were considerable, as shown in
Table 3.

79
Table 3
Hispanics in General Enrollment and Hispanics in EMH for 13 School Districts
School district General enrollment EMH# % # %
Bradford 51 1.3 3 2.3Dixie 16 0.7 2 2.9Franklin 11 0.8 9 2.8Hardee 2155 45.1 61 54.0Hernando 1219 6.8 11 8.3Highlands 2082 18.4 47 21.9Lafayette 103 10.0 4 20.0Liberty 36 2.7 2 4.4Manatee 6041 15.8 98 20.9Martin 2243 13.4 49 28.8Monroe 1947 21.0 28 26.4Santa Rosa 431 1.9 12 3.1Union 36 1.7 1 3.3
Note: Percentage of Hispanic students in general enrollment = total number of Hispanics ingeneral enrollment / total student enrollment x 100.Percentage of Hispanic students in EMH = total EMH Hispanic / total students in EMH x 100.
The situation among black students was different from those of white and Hispanic
students. (See Tables 12 and 13 in Appendix.) In all 67 school districts, the percentage of black
students in EMH was greater than the percentage of black students in the general school
enrollment. In 15 public school districts, the percentage of blacks in EMH was equal to or
slightly greater than the percentage of blacks in the general enrollment. In 35 public school
districts, the percentage of blacks in EMH was twice the percentage of blacks in the general
enrollment. In 16 of the public school districts, the percentage of blacks in EMH was three times
the percentage of blacks in the general enrollment. In one public school district (St. Johns), the
percentage of blacks in EMH was four times the percentage of blacks in the general school

80
population. The smallest difference between the percentage of blacks in EMH and the percentage
of blacks in the general enrollment occurred in Gadsden (89.4% vs. 84.3%) and Holmes (5.4%
vs. 3.0%). In all the other 65 public school districts, the difference between these two figures was
stark. In 52 (77.6%) of the 67 public school districts, the percentage of blacks in EMH was more
than two times the percentage of blacks in the general school enrollment. (See Table 13 in
Appendix.)
SPSS –11.0 was used to further analyze the data. A proportion of each major race in the
general student enrollment was calculated initially by dividing the total number of white, black,
and Hispanic students, respectively, by the total student enrollment for each school district. Then
a proportion was calculated for EMH students in each of the three major racial groups in the 67
school districts. This proportion was calculated by dividing each major racial group with EMH
by the total EMH enrollment of each public school district. The proportion of each of the three
major racial groups for EMH students was then divided by the corresponding racial proportion of
students in the general student population to yield ratios that could then be analyzed by the
general linear model with repeated measures.
For example, in school year 2001–2002, Escambia school district had 25,441 white
students, 16,375 black students, and 743 Hispanic students, or 56.98%, 36.68%, and 1.66%,
respectively, for whites, blacks, and Hispanics in student enrollment. There were 531 total EMH
students. White students identified as EMH were 164 or 30.89% of this total. EMH blacks
equaled 358 (67.42%) of the total. There were three (0.56%) EMH Hispanics. Therefore, the
resulting calculations were 30.89/56.98, 67.42/36.68, and .56/1.66, respectively, for whites,
blacks, and Hispanics. The resultant proportions calculated were: 0.54, 1.84, and 0.34 for EMH
whites, EMH blacks, and EMH Hispanics, respectively. When the proportion of students with

81
EMH in any given racial group is greater than the proportion of that racial group in the general
student enrollment, then that racial group is over-represented in EMH, as is the case for blacks in
the Escambia school district. (See Table 14 in the Appendix for a complete list of the proportions
of EMH whites, blacks, and Hispanics in the 67 school districts.)
The proportions of the three major racial groups with EMH were used as the dependent
variables for all of the analyses that follow. For Research Question 1, the ratios of the racial
groups for general school enrollment were the independent variables. For Research Question 2,
socioeconomic status (percentage of students on free/reduced lunch) was the independent
variable. For Research Question 3, wealth of the school districts was the independent variable.
For Research Question 4, district urbanicity, district size, number of white, full-time, non-
instructional staff, percentage of teachers with a bachelor’s degree, and district FTE were the
independent variables that were analyzed individually.
A significance level of .05 was selected for all questions. It was hypothesized that there
would be no statistically significant difference in the proportions of white, black, and Hispanic
students identified as EMH when measuring these different variables. Using F adjusted by
Greenhouse Geisser, the cumulative results of all the analyses appear in Table 4.

82
Table 4
Ratio of Whites, Blacks, and Hispanics Identified as EMH to Eight Variables Under StudyWithin Florida’s 67 Public School Districts for School Year 2001–2002
Tests of within-subject effects:Analysis performed df Mean
Square
F PartialEtasq.
EMH racial proportions to general enrollment 1.697 80.646 180.46** .732
EMH racial proportions to free/reduced lunch
students
1.735 55.568 148.18** .698
EMH racial proportions to school district wealth 1.633 1.801 4.12** .062
EMH racial proportions to school district urbanicity 1.665 39.668 91.35** .588
EMH racial proportions to school district size 1.697 48.723 108.52** .633
EMH racial proportions to white, full-time staff 1.655 46.911 106.27** .632
EMH racial proportions to teachers with bachelor’s 1.730 59.304 137.46** .682
EMH racial proportions to school district FTE 1.711 50.844 115.30** .647
* p < .05. ** p < .01.
The results showed that the mean of the ratio of EMH white students to the proportion of
total white students in the general enrollment was .663, SD = .167. The mean of the ratio of
EMH black students to the proportion of total black students in the general enrollment was
2.504, SD = .713. The mean of the ratio of EMH Hispanic students to the proportion of total
Hispanic students in the general enrollment was .860, SD = .809.
The test of within-subjects effects showed that F (1.697, 111.992) = 180.46, p = .000;
therefore we can reject Hypothesis 1 and conclude that there is a statistically significant over-

83
representation of blacks in EMH in the 67 public school districts in Florida. Of the variance in
the repeated measure, 73% is explained by the proportional differences. In the pair-wise
comparisons, the mean difference between EMH whites and EMH blacks was statistically
significant (mean difference = 1.841; standard error = .089; p < .01); the mean difference
between EMH blacks and EMH Hispanics was also statistically significant (mean difference =
1.643; standard error = .126; p < .01); but the mean difference between EMH whites and EMH
Hispanics was not statistically significant. The test of within-subject contrasts was not
statistically significant.
Research Question 2
Does the socioeconomic status of school districts affect the proportions of white, black,
and Hispanic students identified as EMH?
Socio-economic status (SES) is measured by the percentage of enrolled students who
were receiving free and reduced lunch for the school year 2001–2002, as reported by the Florida
Department of Education database. (See Table 15 in Appendix.) The proportion of students
receiving free and reduced lunch in the three major races was calculated by dividing the total
number of students receiving free and reduced lunch in each major racial group by the total
number of students in the corresponding racial group for each public school district. This
proportion was then arbitrarily ranked into three categories, as shown in Table 5.

84
Table 5
Percentages of Students on Free/Reduced Lunch for School Year 2001–2002
Percentage of studentsin school districts onfree/reduced Lunch
Rank # of public school districtsin each rank
0–39 (High SES) 1 21
40–59 (Medium SES) 2 35
60 and above (Low
SES)
3 11
A significance level of .05 was selected. The proportions of EMH whites, EMH blacks,
and EMH Hispanics were the dependent variables. The rank of the students receiving free and
reduced lunch was the independent variable. It was hypothesized that there would be no
statistically significant difference between the proportions of white, black, and Hispanic students
identified as EMH when the SES (free/reduced lunch) of the school districts was analyzed. The
general linear model with repeated measures was used to analyze the data. The results of the test
of within-subject effects are displayed in Table 4 above.
The results showed that the mean of the ratio of total EMH white students across all three
ranks of students on free/reduced lunch was .663, SD = .167. The mean of the ratio of total EMH
black students across all three ranks of students on free/reduced lunch was 2.504, SD = .713. The
mean of the ratio of total EMH Hispanic students across all three ranks of students on
free/reduced lunch was .860, SD = .809.
The test of within-subjects effects revealed that F (1.735, 111.023) = 148.179, p = .000;
therefore we reject Hypothesis 2 and conclude that there is a statistically significant difference

85
between the proportions of EMH whites, EMH blacks, and EMH Hispanics when the
socioeconomic status of school districts is analyzed. In the repeated measure, 69.8% of the
variance is explained by socioeconomic status (free/reduced lunch).
The test of within-subjects contrasts was also statistically significant: F (1, 66) = 501.93,
p < .01. Pair-wise comparisons were also statistically significant between the mean difference of
EMH whites, EMH blacks, and EMH Hispanics. The plot in Figure 1 shows that the estimated
marginal mean of the proportion of EMH blacks is almost 3 times greater than those of EMH
whites and EMH Hispanics when SES is high (0% to 39% of students on free/reduced lunch),
about 2.5 times greater than the proportions of EMH whites and EMH Hispanics when SES is
medium (40% to 59% of students on free/reduced lunch), and is just under 2 times greater than
the proportions of EMH whites and EMH Hispanics when SES is low (more than 59% of
students on free/reduced lunch). The plot shows that the greatest estimated marginal mean of the
proportion of EMH blacks occurs in school districts with high SES. The greatest estimated
marginal mean of the proportion of EMH Hispanics occurs in school districts with low SES. The
estimated marginal mean of the proportion of EMH whites remains constant for all levels of
SES.

86
Levels of Socioeconomic status (SES)
Low SESMedium SESHigh SES
Est
imat
ed M
argi
nal M
eans
of P
ropo
rtion
s
3.5
3.0
2.5
2.0
1.5
1.0
.5 EMH whites
EMH blacks
EMH hispanics
Figure 1: Plot for the Average Proportions of EMH Whites, EMH Blacks, and EMH HispanicsWithin Three Levels of Socioeconomic Status Within the 67 Public School Districts
Research Question 3
Does the wealth of school districts affect the proportions of white, black, and Hispanic
students identified as EMH?
The data that determined school-district wealth were gathered from the Florida DOE
database. (See Table 16 in Appendix.) School-district wealth was computed by taking the non-
exempt, assessed valuation of property within each school district divided by the total student
enrollment for that district. This calculation determined the wealth of the district. School districts
were then arbitrarily classified and ranked in Table 6 based on their wealth.

87
Table 6
School District Rank Based on Wealth
$ Rank Category name # of schooldistricts
$0–$199,999 1 Poor 22
$200,000–$349,999 2 Middle 25
$350,000–$599,999 3 Upper Middle 12
$600,000 and above 4 Wealthy 8
Note: Wealth = non-exempt, assessed valuation of property /total student enrollment for eachschool district. Source: 2001–2002 Funding for Florida School Districts Statistical Report ofFlorida Department of Education.
EMH whites, blacks, and Hispanics were then grouped in the wealth-based ranks of the
school districts. In other words, all EMH white students were grouped within these four ranks, all
EMH black students were grouped within the four ranks, and all EMH Hispanic students were
grouped within these four ranks. It was hypothesized that there would be no statistically
significant difference between the proportions of white, black, and Hispanic students identified
as EMH when school district wealth was measured.
A general linear model with repeated measures was used to analyze the data. A
significance level of .05 was selected. The proportions of EMH whites, EMH blacks, and EMH
Hispanics became the dependent variable. Rank of wealth was the independent variable. The
results of the test of within-subject effects are displayed in Table 4 above.
The results showed that the mean of the ratio of total EMH white students across all four
ranks of district wealth was .663, SD = .167. The mean of the ratio of total EMH black students

88
across all four ranks of school district wealth was 2.504, SD = .713. The mean of the ratio of
total EMH Hispanic students across all four ranks of school district wealth was .860, SD = .809.
The test of within-subjects effects showed that F (1.633, 101.266) = 4.122, p < .05;
therefore we reject Hypothesis 3, concluding that there is a statistically significant difference
between the proportions of whites, blacks, and Hispanics identified as EMH when school district
wealth is measured. In the repeated measure, 6.2% of the variance is explained by the wealth of
school districts. Pair-wise comparisons were also statistically significant between the means of
the proportions of EMH whites and EMH blacks and between the means of the proportions of
EMH blacks and EMH Hispanics.
The plot in Figure 2 shows that the estimated marginal mean of the proportion of EMH
blacks is more than 1.5 times that of EMH whites in poor, middle, upper middle, and wealthy
school districts and is more than 1.5 times that of EMH Hispanics in poor, middle, and upper
middle school districts. The estimated marginal mean of the proportion of EMH blacks is only 1
time greater than that of EMH Hispanics in wealthy school districts. The plot shows that the
greatest estimated marginal means of the proportions of EMH blacks and EMH Hispanics occur
in wealthy school districts. The estimated marginal mean of the proportion of EMH whites
remains almost constant across all school districts.

89
School Districts' Wealth
wealthyupper middlemiddlepoor
Est
imat
ed M
argi
nal M
eans
of P
ropo
rtion
s3.5
3.0
2.5
2.0
1.5
1.0
.5
0.0
EMH whites
EMH blacks
EMH hispanics
Figure 2: Plot for the Average Proportions of EMH Whites, EMH Blacks, and EMH HispanicsWithin Four Ranks of Public School District Wealth
Research Question 4
How do the characteristics of public school districts (urbanicity; size of the district based
on student enrollment; racial composition of full-time, non-instructional staff; percentage of
teachers with a bachelor’s degree; district expenditure per student) affect the proportions of
white, black, and Hispanic students identified as EMH?
It was hypothesized that the proportions of white, black, and Hispanic students identified
as EMH would not be significantly affected by the characteristics of public school districts. Each
component of the public school districts’ characteristics was examined individually to assess its
influence on the proportions of white, black, and Hispanic students identified as EMH.

90
Population Density (Urbanicity)
An urban school district was classified as a public school district in Florida not defined
by the Florida Department of Education that has within it a major metropolitan city. The five
metropolitan cities are Fort Lauderdale, Jacksonville, Miami, Orlando, and Tampa. There were
five urban school districts, namely Broward (Fort Lauderdale), Dade (Miami), Duval
(Jacksonville), Hillsborough (Tampa), and Orange (Orlando). A suburban school district was
defined as a public school district not identified by the Florida Department of Education as rural
and which does not meet the criteria for an urban public school district. Twenty-five school
districts met this category. A rural school district was defined as a public school district included
as one of the 37 public school districts within the three rural regional consortia of the Florida
Department of Education. These consortia are the Heartland Educational Consortium, the North
East Florida Educational Consortium, and the Panhandle Area Educational Consortium. (See
Table 17 in Appendix.) The districts were ranked into three groups as shown in Table 7.
Table 7
School District Urbanicity Rank
Urbanicity Rank # ofschool districts
in each rank
Urban 1 5
Suburban 2 25
Rural 3 37

91
It was hypothesized that there would no statistically significant difference between the
proportions of whites, blacks, and Hispanics identified as EMH when school district urbanicity
was measured.
A general linear model with repeated measures was used to analyze the data. A
significance level of .05 was selected. EMH whites, blacks, and Hispanics were grouped in the
three-urbanicity ranks of the school districts (i.e., 1 for urban, 2 for suburban, and 3 for rural). In
other words, all EMH white students were grouped within these three categories, all EMH black
students were grouped within these three categories, and all EMH Hispanic students were
grouped within these three categories. The proportions of EMH whites, EMH blacks, and EMH
Hispanics were the dependent variables. The independent variable was the rank of the school
district urbanicity. The results of the test of within-subject effects are displayed in Table 4 above.
The results showed that the mean of the ratio of total EMH white students across all
three ranks of district urbanicity was .663, SD = .167. The mean of the ratio of total EMH black
students across all three ranks of school district urbanicity was 2.504, SD = .713. The mean of
the ratio of total EMH Hispanic students across all three ranks of school district urbanicity was
.860, SD = .809.
The test of within-subjects effects revealed that F (1.665, 106.591) = 91.348, p = .000;
therefore we reject the hypothesis, concluding that there is a statistically significant difference
between the proportions of EMH whites, EMH blacks, and EMH Hispanics when school district
urbanicity is measured. Of the variance in the repeated measure, 58.8% is explained by the
urbanicity of the school district. Pair-wise comparisons were also statistically significant between
the means of the proportions of EMH whites and EMH blacks and between the mean of the
proportion of EMH blacks and that of EMH Hispanics. The plot in Figure 3 shows that the

92
greatest estimated marginal mean of the proportion of EMH blacks occurs in suburban school
districts. The estimated marginal mean of the proportion of EMH whites and EMH Hispanics
rose gradually in suburban and rural school districts, but never rose above 1.0.
Districts' Urbanicity
RuralSuburbanUrban
Est
imat
ed M
argi
nal M
eans
of P
ropo
rtion
s
3.5
3.0
2.5
2.0
1.5
1.0
.5
0.0
EMH black
EMH hispanicEMH white
Figure 3: Plot for the Average Proportions of EMH Whites, EMH Blacks, and EMH HispanicsWithin Urban, Suburban, and Rural School Districts
School District Size
School districts were placed in ascending order from smallest to largest, based on total
student enrollment for school year 2001–2002. (See Table 17 in Appendix.) They were then
arbitrarily categorized and ranked. There were four ranks of school districts based on student
enrollment as depicted in Table 8.

93
Table 8
School District Rank Based on Student Enrollment for School Year 2001–2002
Total student enrollment School district size Rank # of public schooldistricts in category
1–29,999 Small 1 44
30,000–59,999 Medium 2 11
60,000–89,999 Large 3 5
90,000 and above Very large 4 7
The seven smallest school districts were Lafayette with 1,030 students, Glades (1,099),
Liberty (1,321), Franklin (1,442), Jefferson (1,709), and Union (2,130). The seven largest school
districts were Dade with 374,806 students, Broward (262,027), Hillsborough (169,682), Palm
Beach (159,862), Orange (156,905), Duval (126,919), and Pinellas (114,251).
EMH whites, blacks, and Hispanics were grouped in the size-based ranks of the school
districts. In other words, all EMH white students were grouped within these four ranks, all EMH
black students were grouped within these four ranks, and all EMH Hispanic students were
grouped within these four ranks. It was hypothesized that there would be no statistically
significant difference between the proportions of whites, blacks, and Hispanics identified as
EMH when school district size was measured.
A general linear model with repeated measures was used to analyze the data. A
significance level of .05 was selected. The dependent variable was the proportions of EMH
whites, EMH blacks, and EMH Hispanics. The independent variable was school district size. The
results of the test of within-subject effects are displayed in Table 4 above.

94
The results showed that the mean of the ratio of total EMH white students across all four
ranks of district size was .663, SD = .167. The mean of the ratio of total EMH black students
across all four ranks of district size was 2.504, SD = .713. The mean of the ratio of total EMH
Hispanic students across all four ranks of district size was .860, SD = .809.
The test of within-subjects effects showed that F (1.697, 106.902) = 108.517, p = .000;
therefore we reject the hypothesis, concluding that there is a statistically significant difference
between the proportions of EMH whites, EMH blacks, and EMH Hispanics when school district
size is measured. Of the variance in the repeated measure, 63.3% is explained by school district
size. Pair-wise comparisons were also statistically significant between the means of the
proportions of EMH whites and EMH blacks and between the means of the proportions of EMH
blacks and EMH Hispanics. The plot in Figure 4 shows that the estimated marginal mean of the
proportion for EMH whites fell gradually from .7 in small districts to .4 in very large districts.
The estimated marginal mean of the proportion for EMH blacks gradually increased from 2.4 in
small districts to 2.9 in large districts then fell to 2.1 in very large districts. The estimated
marginal mean of the proportion for EMH Hispanics started at .9 in small districts and gradually
fell to .6 in very large districts.

95
School District Size
very largelargemediumsmall
Est
imat
ed M
argi
nal M
eans
of P
ropo
rtion
s
3.5
3.0
2.5
2.0
1.5
1.0
.5
0.0
EMH black
EMH hispanicEMH white
Figure 4: Plot for the Average Proportions of EMH Whites, EMH Blacks, and EMH HispanicsWithin Four Ranks of Public School District Size
Racial Composition of Staff
The total, full-time, non-instructional staff for each school district was analyzed. (See
Table 18 in Appendix.) White, full-time, non-instructional staff represented the majority of
public school district staff in 64 of the 67 school districts. In only three districts did whites
account for less than 50% of the total non-instructional staff. These districts were Gadsden
(24.71%), Dade (26.31%), and Jefferson (40.93%). Black staffers represented 72.88% of the full-
time, non-instructional staff in Gadsden and 59.07% in Jefferson. Hispanics made up 36.94% of
full-time, non-instructional staff in Dade school district, followed closely by black staffers at
35.56%. The districts that had the highest percentage of white, full-time, non-instructional staff
were Santa Rosa (95.12%), Lafayette (96.58%), and Holmes (99.54%).

96
Full-time, non-instructional staff within the 67 school districts was arbitrarily ranked
based on the percentage of white, non-instructional staff to the total non-instructional staff
because of their large representation within the majority of school districts. The ranking is shown
in Table 9.
Table 9
School District Ranks Based on White, Full-Time Staff Within Public School Districts forSchool Year 2001–2002
Percentage ofwhite, full-timestaff members
Rank # ofpublic school
districts
0.00–59.99 1 5
60.00–69.99 2 8
70.00–79.99 3 12
80.00–89.99 4 30
90.00–100.00 5 12
EMH whites, blacks, and Hispanics were then grouped in the staff-based ranks of the
school districts. In other words, all EMH white students were grouped within these five ranks, all
EMH black students were grouped within these five ranks, and all EMH Hispanic students were
grouped within these five ranks. It was hypothesized that there would be no statistically
significant difference between the proportions of whites, blacks, and Hispanics identified as
EMH when school district white, full-time, non-instructional staff was measured.

97
A general linear model with repeated measures was used to analyze the data. A
significance level of .05 was selected. The dependent variable was the proportions of EMH
whites, EMH blacks, and EMH Hispanics. The independent variable was the rank of white, full-
time, non-instructional staff within the school districts. The results of the test of within-subject
effects are displayed in Table 4 above.
The results showed that the mean of the ratio of total EMH white students across all five
ranks of district white, full-time, non-instructional staff was .663, SD = .167. The mean of the
ratio of total EMH black students across all five ranks of school district white, full-time, non-
instructional staff was 2.504, SD = .713. The mean of the ratio of total EMH Hispanic students
across all five ranks of school district white, full-time, non-instructional staff was .860, SD =
.809.
The test of within-subjects effects showed that F (1.655, 102.592) = 106.265, p = .000;
therefore we reject the hypothesis, concluding that there is a statistically significant difference
between the proportions of EMH whites, EMH blacks, and EMH Hispanics when school district
white, full-time, non-instructional staff is measured. Of the variance in the repeated measure,
63.2% is explained by the percentage of white, full-time, non-instructional staff in public school
districts. Pair-wise comparisons were also statistically significant between the means of the
proportions of EMH whites and EMH blacks and between the means of the proportions of EMH
blacks and EMH Hispanics. The plot in Figure 5 showed that the greatest estimated marginal
means of the proportions of EMH whites and EMH Hispanics occurred where 90% or more of
the full-time, non-instructional staff was white and for EMH blacks where 80% to 89% of the
full-time, non-instructional staff was white. The estimated marginal means of the proportions of
EMH whites and EMH Hispanics rose gradually through 60% to 89% of white, full-time, non-

98
instructional staff. However, the estimated marginal mean of the proportion of EMH Hispanics
rose steeply between 89% to 100% of white, full-time, non-instructional staff to 1.33. The
estimated marginal mean of the proportion of EMH whites continued its gradual rise between
89% to 100% of white, full-time, non-instructional staff .6. The estimated marginal mean of the
proportion of EMH blacks declined between 89% to 100% of white, full-time, non-instructional
staff, but was consistently greater than the estimated marginal means of the proportions of EMH
whites and EMH Hispanics (2 to 3 times greater than the estimated marginal means of the
proportions of EMH whites and EMH Hispanics).
Percentage of Non-teaching, White, Full-time Staff
90-10080-8970-7960-690-59
Est
imat
ed M
argi
nal M
eans
of P
ropo
rtion
s
3.0
2.5
2.0
1.5
1.0
.5
0.0
EMH black
EMH hispanic
EMH white
Figure 5: Plot for the Average Proportions of EMH Whites, EMH Blacks, and EMH HispanicsWithin Five Ranks of White, Full-Time Staff in Public School Districts

99
Teachers’ Degrees
Dade, Broward, and Hillsborough school districts had the largest number of teachers with
bachelor’s, master’s, specialist, and doctoral degrees. The total number of bachelor’s-level
teachers in Dade school district totaled 10,941; master’s-level teachers totaled 8,041; specialist-
level teachers totaled 1,985; and doctoral-level teachers totaled 485. In contrast, the smallest
school district, Lafayette, had 51 teachers with bachelor’s degrees and 20 with master’s degrees.
No faculty had specialist or doctoral degrees in the Lafayette school district in the 2001–2002
school year. The percentage of teachers with a bachelor’s degree was calculated for all 67 school
districts by dividing the total number of teachers with a bachelor’s degree by the total number of
teachers for each school district, multiplied by 100. The percentages for the 67 school districts
were then arranged in ascending order, arbitrarily ranked, and displayed in Table 10. (See also
Table 19 in Appendix.)
Table 10
School District Ranks Based on the Percentage of Teachers With Bachelor’s Degrees
Percentage of teacherswith bachelor’s degrees
Rank # ofpublic school
districts
1.00–59.99 1 17
60.00–69.99 2 40
70.00 and above 3 10

100
EMH whites, blacks, and Hispanics were then grouped in the bachelor’s degree–based
ranks of the school districts. In other words, all EMH white students were grouped within these
three ranks, all EMH black students were grouped within these three ranks, and all EMH
Hispanic students were grouped within these three ranks. It was hypothesized that there would be
no statistically significant difference between the proportions of whites, blacks, and Hispanics
identified as EMH when the percentage of teachers with a bachelor’s degree within the school
districts was measured.
A general linear model with repeated measures was used to analyze the data. A
significance level of .05 was selected. The dependent variable was the proportions of EMH
whites, EMH blacks, and EMH Hispanics. The independent variable was ranks of teachers with a
bachelor’s degree. The results of the test of within-subject effects are displayed in Table 4 above.
The results showed that the mean of the ratio of total EMH white students across all three
ranks of teachers with a bachelor’s degree was .663, SD = .167. The mean of the ratio of total
EMH black students across all three ranks of teachers with a bachelor’s degree was 2.504, SD =
.713. The mean of the ratio of total EMH Hispanic students across all three ranks of teachers
with a bachelor’s degree was .860, SD = .809.
The test of within-subjects effects showed that F (1.730, 110.694) = 137.456, p = .000;
therefore we reject the hypothesis, concluding that there is a statistically significant difference
between the proportions of EMH whites, EMH blacks, and EMH Hispanics when teachers’
bachelor’s degrees are measured. Of the variance in the repeated measure, 68.2% is explained by
teacher bachelor’s degree level within school districts. Pair-wise comparisons were also
statistically significant between the means of the proportions of EMH whites and EMH blacks
and between the means of the proportions of EMH blacks and EMH Hispanics. The plot in

101
Figure 6 demonstrated that the greatest estimated marginal mean of the proportion for EMH
blacks occurs in school districts where the percentage of teachers with at least a bachelor’s
degree was between 1 and 59%. In other words, 40% of these teachers had degrees higher than a
bachelor's degree. The estimated marginal mean decreased slightly between 59% and 69% and
remained constant between 69% and 100%. The estimated marginal mean of the proportion for
EMH whites was almost constant among the three grouped percentages of teachers with
bachelor’s degrees. However, the estimated marginal mean of the proportion for EMH Hispanics
rose between 1% and 69% and leveled off between 69% and 100% of teachers with a bachelor’s
degree.
Percentage of Teachers with at least a bachelor's degree
70 & above60-691-59
Est
imat
ed M
argi
nal M
eans
of P
ropo
rtion
s
3.0
2.5
2.0
1.5
1.0
.5
0.0
EMH blacks
EMH hispanics
EMH whites
Figure 6: Plot for the Average Proportions of EMH Whites, EMH Blacks, and EMH HispanicsWithin Three Ranks of Teachers With Bachelor’s Degrees in Public School Districts

102
District Expenditure on Students
The school district expenditure per student is defined as the expense per full time
equivalency or FTE for the 2001–2002 school year. Clay school district had the lowest FTE
expense ($5,172) and Monroe had the highest ($6,858). (See Table 20 in Appendix.) The FTE
for all 67 school districts was arranged in ascending order from the lowest to the highest,
arbitrarily ranked, and displayed in Table 11.
Table 11
School District Rank Based on Full Time Equivalency (FTE) for School Year 2001–2002
FTE forschool districts
Rank # ofpublic school
districts
$5,000–$5,499 1 13
$5,500–$5,999 2 36
$6,000–$6,499 3 11
$6,500 and above 4 7
EMH whites, blacks, and Hispanics were then grouped in the FTE-based ranks of the
school districts. In other words, all EMH white students were grouped within these four ranks, all
EMH black students were grouped within these four ranks, and all EMH Hispanic students were
grouped within these four ranks. It was hypothesized that there would be no statistically
significant difference between the proportions of whites, blacks, and Hispanics identified as
EMH when school district FTE was measured.

103
A general linear model with repeated measures was used to analyze the data. A
significance level of .05 was selected. The dependent variable was the proportions of EMH
whites, EMH blacks, and EMH Hispanics. The independent variable was the district rank of
FTE. The results of the test of within-subject effects are displayed in Table 4 above.
The results showed that the mean of the ratio of total EMH white students across all four
ranks of district FTE was .663, SD = .167. The mean of the ratio of total EMH black students
across all four ranks of school district FTE was 2.504, SD = .713. The mean of the ratio of total
EMH Hispanic students across all four ranks of school district FTE was .860, SD = .809.
The test of within-subject effects showed that F (1.711, 107.780) = 115.295, p = .000;
therefore we reject the hypothesis, concluding that there is a statistically significant difference
between the proportions of EMH whites, EMH blacks, and EMH Hispanics when school district
FTE is measured. Of the variance in the repeated measure, 64.7% is explained by school district
FTE. Pair-wise comparisons were also statistically significant between the means of the
proportions of EMH whites and EMH blacks, EMH whites and EMH Hispanics, and EMH
blacks and EMH Hispanics. The plot in Figure 7 demonstrated that the estimated marginal mean
of the proportion for EMH whites remained consistent for all four ranks of FTE at about .6. The
estimated marginal mean of the proportion for EMH blacks (2.8) peaked when FTE expense was
less than $5,499 and gradually fell when FTE expense was between $5,500 and $6,500 and
above. The estimated marginal mean of the proportion for EMH Hispanics started at 1.06 when
FTE expense was less than $5,499, fell to .70 when FTE expense was less than $5,499, and
gradually rose to 1.1 when FTE expense rose above $6,000.

104
School Districts' Expenditure Per Student
$6500 & above$6000-6499$5500-5999<$5499
Est
imat
ed M
argi
nal M
eans
of P
ropo
rtion
s3.0
2.5
2.0
1.5
1.0
.5
0.0
EMH blacks
EMH hispanics
EMH whites
Figure 7: Plot for the Average Proportions of EMH Whites, EMH Blacks, and EMH HispanicsWithin Four Ranks of Public School District FTE
Summary
This chapter has presented an analysis of data collected from the Florida Department of
Education database for the school year 2001–2002. The data were analyzed using the statistical
package SPSS-11 and results were provided. Findings and conclusions drawn from the data
analysis and recommendations for reducing the overrepresentation of blacks in EMH are
presented in Chapter 5, along with suggestions for further research.

105
CHAPTER 5
SUMMARY, CONCLUSIONS, IMPLICATIONS, AND RECOMMENDATIONS
Introduction
This chapter provides an overview of the problem statement, methodology, and data
analysis. In addition, a summary and discussion of the findings regarding each research question
is included, as well as conclusions drawn from the findings, related implications,
recommendations for practice, and suggestions for future research.
Problem Statement
This study sought to investigate relevant data to see whether over-representation of black
students existed in Florida’s 67 public school districts in 2001–2002 and to analyze the effects of
certain factors on the identification of black students as EMH.
Methodology
Population and Data Collection
Data were collected from the 67 public school districts in Florida over a one-year period,
that is, school year 2001–2002, as reported to the Florida Department of Education database. The
data were accessed through the DOE website. Data about district wealth, free and reduced lunch,
teachers’ professional degrees, the racial composition of school district staff, and school district
population density (urbanicity) were also culled from DOE.

106
Data Analysis
Data analysis in this study was conducted using the statistical analysis software SPSS
Version 11.0 for Windows. The data were entered into the SPSS database to create a platform for
analysis. Data sorting and computational functions were used to develop several variables
necessary for the analysis. The general linear model with repeated measures was the main model
used in the analysis of the data. Plots were included in the analysis to provide a visual display of
the findings for some of the research questions.
Summary and Discussion of Findings
The summary of findings and discussion of the data collected for the four research
questions of this study are presented below.
Research Question 1
Is there an over-representation of black students in EMH in the 67 public school districts
in Florida?
Total enrollment for students during the 2001–2002 school year was approximately 2.5
million students in the state of Florida. Whites, blacks, and Hispanics represented 51.4%, 24.5%,
and 20.2%, respectively. The analysis showed that of the total enrollment in EMH in the 67
public school districts, whites, blacks, and Hispanics were 32.7%, 53.5%, and 12.4%,
respectively. The statistical analyses showed that the percentage of black students in EMH was
two times the percentage of black students in the general school enrollment in all 67 public
school districts in Florida. The results of the analyses also demonstrated that blacks were
identified as EMH 2.5 times more often than were whites and Hispanics. The identification of

107
whites and Hispanics as EMH did not differ significantly from each other. This breakdown
would indicate that there is over-representation of black students in EMH in the 67 public school
districts in Florida. These findings were consistent with the works of the Civil Rights Project
(2002); Grossman (1998); Harry (1992); MacMillan and Reschly (1998); Noel and Fuller (1985);
Oswald et al. (1999); and Zhang and Katsiyannis (2002). The report of the Civil Right Project
indicated that between 2.75% and 5.41% of black students were labeled EMH. In Florida the
number of blacks identified as EMH was more than three times that of white students.
MacMillan & Reschly, among others, found that blacks and Hispanics tend to be over-
represented in EMH programs in school districts with high proportions of linguistically diverse
minorities or poor individuals. Overall, in Florida during the 2001–2002 school year,
approximately 25% of the general student enrollment was black, and 20% was Hispanic. Thirty-
eight percent of black students were on free/reduced lunch, indicating a high level of poverty
among blacks within the state school system. These facts might predispose the over-
representation of blacks in EMH in Florida.
Research Question 2
Does the socioeconomic status of school districts affect the proportions of white, black,
and Hispanic students identified as EMH?
In 1994, Artiles and Trent reported that low socioeconomic status and environmental
deprivation were persistently linked to EMH identification. Socioeconomic status, as defined by
the percentage of students on free/reduced lunch within school districts, was a variable that was
analyzed to see its impact on the proportions of white, black, and Hispanic students identified as
EMH. The results of the analyses indicated that there was a statistically significant difference in

108
the proportions of white, black, and Hispanic students identified as EMH when the
socioeconomic status of the school districts was measured. Almost 70% of this difference
between these three groups was explained by the socioeconomic status of school districts.
Oswald et al. (1999) found a positive relationship between poverty and disproportionate
representation of blacks in EMH. That is, the higher the socioeconomic status, the higher the
EMH rates for blacks. Conversely, the lower the socioeconomic status, the lower the EMH rates
for blacks. The results of the analysis for Florida public school districts showed that in high SES
districts (with less than 39% of students on free/reduced lunch), black students were found to be
eligible for EMH at almost three times the rate of white and Hispanic students. However, in low
SES school districts, (when 60% or more of the students were on free/reduced lunch), blacks
were found to be eligible for EMH about 1.5 times the rate of white students and 0.5 times the
rate of Hispanic students. This research, therefore, confirmed the findings of Oswald et al.
(1999). The data analysis also indicated that a greater proportion of Hispanic students seem to be
identified as EMH as the percentage of students receiving free/reduced lunch increases to 60% or
more of the total school district’s student enrollment.
The findings of this research also indicated that in wealthy school districts (as signaled by
a lower percentage of students on free/reduced lunch, or by an indicator of high socioeconomic
status, such as higher per-pupil expenditures), blacks are identified as EMH twice as often as
whites or Hispanics. In poorer districts (lower socioeconomic status school districts), blacks are
identified about one-and-one-half times as often as whites and Hispanics. These findings appear
similar to those of Artiles and Trent (1994). Jensen (1969), Monson (2003), Oswald et al. (1999),
Valencia and Suzuki (2001), and Yeargin-Allsopp et al. (1995) all shared the opinion that
poverty and malnutrition are possible causes of EMH. Jensen and Valencia and Suzuki implied

109
that one’s IQ has a major impact on one’s socioeconomic status. Socioeconomic status, as
defined by the percentage of students on free/reduced lunch, is therefore significantly aligned
with identification of students into EMH.
Research Question 3
Does the wealth of school districts affect the proportions of white, black, and Hispanic
students identified as EMH?
The analyses showed that there was a statistically significant difference between the
proportions of white, black, and Hispanic students identified as EMH when school district wealth
was measured. Six percent of the difference between the proportions of white, black, and
Hispanic students identified as EMH was explained by the wealth of the school districts. In poor
districts, blacks were three times more likely than whites or Hispanics to be identified as EMH.
In wealthy districts, blacks were four times more likely than whites to be identified as EMH, and
Hispanics were two times more likely than whites to be identified as EMH. These findings are
supported by research from the Civil Rights Project (2002) and from Valencia and Suzuki
(2001), which found that black and Hispanic children and linguistically diverse students were
more likely to be identified as EMH in wealthier school districts.
Research Question 4
How do the characteristics of the public school districts (urbanicity, size of districts based
on student enrollment, racial composition of full-time, non-instructional staff, percentage of
teachers with a bachelor’s degree, district expenditure per student) affect the proportions of
white, black, and Hispanic students identified as EMH?

110
Urbanicity
The majority of students in Florida public school districts attend schools in the five
largest metropolitan areas. Broward, Dade, Duval, Hillsborough, and Orange school districts
include the cities of Fort Lauderdale, Miami, Jacksonville, Tampa, and Orlando respectively. In
the 25 largest school systems in the nation, including Miami-Dade, black children and other
minorities made up the majority of student enrollments (Agbenyega & Jiggetts, 1999). One
would therefore assume that population density or urbanicity would affect the proportions of
white, black, and Hispanic students identified as EMH.
The analyses from the Florida school districts’ data showed that there was a statistically
significant difference between the proportions of white, black, and Hispanic students identified
as EMH when urbanicity was measured. Fifty-nine percent of the difference in the proportions of
white, black, and Hispanic students identified as EMH was explained by the population density
or urbanicity of school districts. In urban and rural school districts, blacks were one-and-one-half
times more likely than whites and Hispanics to be identified as EMH. In suburban school
districts, blacks were two times more likely than whites and Hispanics to be identified as EMH.
These findings are supported by Agbenyega and Jiggetts (1999), Benner (1998), Hilton (1991),
Oswald et al. (1999), and Sherman (1992).
It is also not surprising that the identification of blacks as EMH is greatest in suburban
school districts, when one considers that suburban school districts are usually wealthier and have
a higher socioeconomic status. In the previous research questions, it was shown that blacks have
a greater tendency than whites and Hispanics to be over-identified in wealthier and higher
socioeconomic status school districts.

111
School District Size
The results from the analyses showed that there was a statistically significant difference
between the proportions of white, black, and Hispanic students identified as EMH when school
district size was taken into account. Sixty-three percent of the difference between the proportions
of white, black, and Hispanic students identified as EMH was explained by school district size.
While blacks were one-and-one-half times more likely than whites and Hispanics to be identified
as EMH in small, medium, and very large districts, they were two times more likely than whites
and Hispanics to be identified as EMH in large school districts, that is, in school districts with
60,000 to 89,000 students. These findings are similar to those of Agbenyega and Jiggetts (1999),
Civil Rights Project (2002), and Oswald et al. (1999).
There is a strong possibility that large schools exist in large school districts where black
students might be overlooked or overshadowed. Payne (2001) suggested that a possible winning
strategy to promote learning and reduce the likelihood for over-identification for these students
would include developmental preschool programs, supplemental reading programs such as
Accelerated Reading (AR), smaller class size, and school-wide projects in prevention and
support. Also, she strongly suggested parental training that would assist parents in the provision
of insistence, expectations, and support for their children at home.
Racial Composition of Staff
The results from the analyses showed that there was a statistically significant difference
between the proportions of white, black, and Hispanic students identified as EMH when racial
composition of full-time, non-instructional staff within the districts was taken into account.

112
Sixty-three percent of the difference between the proportions of white, black, and Hispanic
students identified as EMH was explained by the percentage of white, full-time, non-
instructional staff. In school districts with approximately 40% of their full-time, non-
instructional staff consisting of black, Hispanic or other minority staff, blacks were one time
more likely than whites and Hispanics to be identified as EMH. As the percentage of white, full-
time, non-instructional staff increased, the tendency for blacks to be identified as EMH also
increased. When the percentage of white, full-time, non-instructional staff is greater than 80% of
school districts total staff, blacks are three times more likely than whites and two times more
likely than Hispanics to be identified as EMH. Several researchers have argued for greater
diversity among educators and those working with students or greater awareness of cultural
diversity in order for staff to understand the cultures of other races (Gay, 1994; Patrick, 1986;
So, 1987; Valles, 1998).
Gay (1994) posited that despite pluralism in the U.S., most people live in relatively
isolated enclaves and do not necessarily interact with each other on substantive levels. Thus
awareness and sensitivity training are both necessary to bridge misunderstandings that tend to
exist among racial groups of students and staff.
Teachers’ Degrees
The results from the analyses showed that there was a statistically significant difference
between the proportions of white, black, and Hispanic students identified as EMH when
teachers’ bachelor’s degrees were taken into account. Sixty-eight percent of the difference
between the proportions of white, black, and Hispanic students identified as EMH was explained
by the percentage of teachers holding a bachelor’s degree. Blacks were three times more likely

113
than whites to be identified as EMH for all percentages of teachers holding a bachelor’s degree.
However, while blacks were more likely to be identified EMH than were Hispanics, the tendency
for Hispanics to be identified as EMH gradually increased as the percentage of bachelor’s
degreed teachers increased. In other words, when more than 60% of teachers have only a
bachelor’s degree, Hispanics were one time more likely than whites to be identified as EMH.
These findings support earlier research of Benner (1998), Bernal and Bernal (1974), Coutinho et
al. (1999), and Grossman (1995, 1998).
Grossman and others have opined that regular education teachers might have low
expectations for their students, so when students fail to behave appropriately or are not learning
adequately, teachers might be quick to refer them for assessment. This might be a contributing
factor of the high rate of black and Hispanic students being identified when the percentage of
teachers with a bachelor’s degree is above the 60% level in school districts. Coutinho et al.
posited that some teachers might be incorrectly referring black students who are not disabled but
who behave, attend, or learn differently than white, middle-class students. In these cases,
differences in behavior or learning may be interpreted as suspicion for EMH rather than
acknowledged as cultural differences. These cultural conflicts could jeopardize the instructional
process, cause students to be misclassified, and cause teachers erroneously to conclude that black
students have limited critical thinking and reasoning abilities (Gay, 1994).
Grossman (1998) and Samuda et al. (1989) alluded to the fact that some teachers might
have low expectations for black and Hispanic students. This low expectation might also be a
factor relating to the over-identification of blacks and Hispanics in EMH when the percentage of
teachers with a bachelor’s degree is above the 60% threshold. While this tendency does not
imply that all teachers with a bachelor’s degree have low expectations for their black and

114
Hispanic students, one might conclude that teachers with higher degrees than the bachelor’s
might have more skills to assist their students in achieving at higher academic levels.
District Expenditures on Students (FTE)
The results from the analyses showed that there was a statistically significant difference
between the proportions of white, black, and Hispanic students identified as EMH when school
district expenditure or FTE was taken into account. Approximately 65% of the difference
between the proportions of white, black, and Hispanic students identified as EMH was explained
by school district FTE. When FTE is less than $5,499, blacks were four times more likely than
whites and two times more likely than Hispanics to be identified as EMH. As FTE increased, the
tendency for blacks to be identified as EMH over whites and Hispanics decreased. So, when FTE
was $6,500 or more, blacks were three times more likely than whites and one time more likely
than Hispanics to be identified as EMH. Hispanics, on the other hand, were one time more likely
than whites to be identified as EMH as FTE increased to $6,500 or more. These findings are
consistent with Coutinho et al., who found a significant, albeit weak, negative relationship
between school district student expenditure (FTE) and disproportionate identification of EMH
among blacks.
Conclusions
This study sought to analyze the apparent over-representation of blacks in EMH within
the 67 public school districts in Florida. From a review of literature and research findings, it was
concluded that:
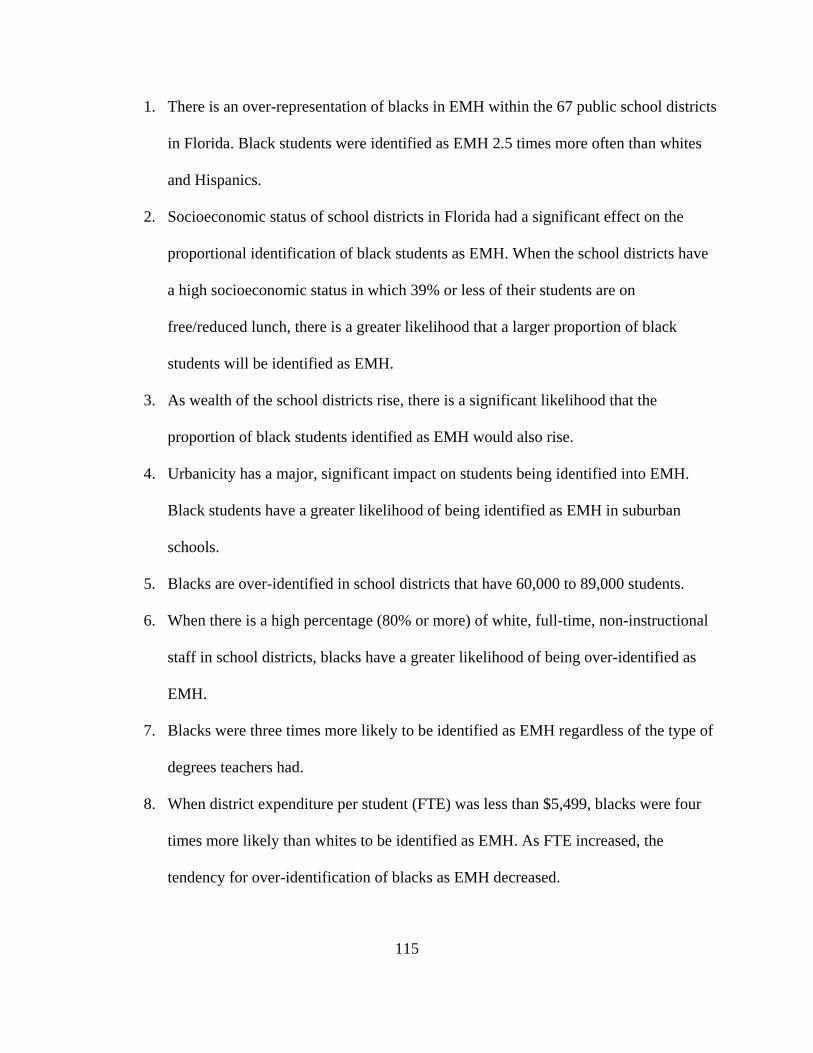
115
1. There is an over-representation of blacks in EMH within the 67 public school districts
in Florida. Black students were identified as EMH 2.5 times more often than whites
and Hispanics.
2. Socioeconomic status of school districts in Florida had a significant effect on the
proportional identification of black students as EMH. When the school districts have
a high socioeconomic status in which 39% or less of their students are on
free/reduced lunch, there is a greater likelihood that a larger proportion of black
students will be identified as EMH.
3. As wealth of the school districts rise, there is a significant likelihood that the
proportion of black students identified as EMH would also rise.
4. Urbanicity has a major, significant impact on students being identified into EMH.
Black students have a greater likelihood of being identified as EMH in suburban
schools.
5. Blacks are over-identified in school districts that have 60,000 to 89,000 students.
6. When there is a high percentage (80% or more) of white, full-time, non-instructional
staff in school districts, blacks have a greater likelihood of being over-identified as
EMH.
7. Blacks were three times more likely to be identified as EMH regardless of the type of
degrees teachers had.
8. When district expenditure per student (FTE) was less than $5,499, blacks were four
times more likely than whites to be identified as EMH. As FTE increased, the
tendency for over-identification of blacks as EMH decreased.

116
9. In every variable or measure analyzed, the proportion of black students identified as
EMH was significantly over-identified when compared to the proportions of white
and Hispanic students identified as EMH.
Implications and Recommendations for Practice
The following improvements, based on the review of research, conclusions, and
limitations of this study, are recommended:
1. Since over-representation of blacks in EMH is occurring in Florida schools, districts
should seek to review and revise policies, procedures, and practices currently being
used in the identification and placement of blacks in EMH to ensure that these
policies, procedures, and practices comply with requirements of IDEA. The pre-
referral and referral processes need to be evaluated to ensure that biases and
misunderstanding of cultures are not affecting the decision-making processes
regarding identification of blacks as EMH.
2. The use of assessment techniques that are less culturally loaded should become more
widespread, especially among blacks who are more prone to be identified as EMH
when traditional assessment protocols are used. Two verbal psychological assessment
protocols, the CAS and the DAS, and several nonverbal psychological batteries
appear to hold promise in assessing black students more fairly than some of the
traditional protocols. Other methods of assessment such as portfolio evaluations,
performance-based testing, and the PASS model deserve trial with black students.
3. Efforts should be made with detection and early intervention techniques to identify
black students who are at risk for becoming EMH, especially in high socioeconomic

117
status and wealthy school districts. These students and their families should be
assisted with early reading programs and stimulating environments that are culturally
diverse and enriching to give students a greater opportunity for learning and
becoming academically successful.
4. In suburban school districts, diversity in the racial composition of teachers and staff
should be encouraged to develop greater cultural awareness for black and Hispanic
students. Professional development regarding cultural diversity could also be
implemented among teachers and staff to help foster understanding of the mores and
values of other cultures within those school districts. Professional development would
have to take into consideration needs assessments of the districts. Attitude surveys
and focus groups could be useful tools to build awareness for school personnel.
Different individuals representative of the diverse cultures from the community of the
school districts could be guest speakers at school events and could share their life
stories and cultural experiences to increase empathy and understanding for different
races within the school system.
5. Incorporation of multicultural education principles could assist regular and special
education teachers and many non-instructional staff members in mostly white school
districts understand black students better. Curriculum and classroom management
strategies could be adopted to include diversity and culturally relevant modalities and
strategies that could assist teachers in their delivery to black and Hispanic students.
The acquisition of cultural and linguistic knowledge and new perceptions and
practices might help teachers make fewer referrals of black children for EMH
services and therefore reduce the disproportion of blacks in EMH.

118
6. The use of observation and feedback during the teacher evaluation process to
determine teacher treatment or attitudes towards individual students and student
groups could be implemented as a gauge to measure effectiveness of professional
development as it relates to multiculturalism, awareness, and sensitivity to cultural
diversity.
Recommendations for Future Research
This study analyzed the apparent over-representation of blacks in EMH within the 67
public school districts in Florida. The following suggestions are made for further research:
1. Further research into the identification of other races in EMH within school districts
in Florida would examine whether over-representation or under-representation is
occurring.
2. A comparative review of other types of student identification such as emotional
handicap and specific learning disability among blacks and other racial groups would
provide information on districts’ accountability and practices in light of IDEA’s
requirements.
3. A qualitative, in-depth study of the pre-referral and referral processes could determine
possible biases that might be influencing the identification of students as EMH.
4. Comparative research is needed within school districts that use non-traditional
assessment protocols with black and Hispanic students for identification as EMH.
5. A study of white, full-time, non-instructional staff of school districts on a national
level would seek to determine this factor’s effects on black and Hispanic students

119
identified as EMH. The results of this study could refute or substantiate this finding
and offer further suggestions to address this issue.
6. An analysis of predominantly urban school districts with a high percentage of black
teachers and black and Hispanic staff could be undertaken to measure the effects of
these factors on the identification of different races of students into EMH or into other
areas of special education.
7. This study could be replicated in other southern states that have a greater number of
school districts. This could be done to examine the relationships of urbanicity and
district size to over-representation of blacks identified as EMH.
8. A study could be conducted to examine the relationship of literacy-rich home
environments to poverty and the identification of blacks as EMH.

120
APPENDIX
DATABASE TABLES

121
Table 12
Racial Composition of Students in General and EMH Enrollment (Numbers)
General Enrollment EMH EnrollmentSchool district Whites Blacks Hispanics Whites Blacks HispanicsAlachua 15889 10981 1253 79 216 10Baker 3754 691 20 39 25 1Bay 20551 4073 417 157 93 5Bradford 2990 1009 51 61 66 3Brevard 55118 9971 3485 325 316 23Broward 100604 94133 54698 376 1393 202Calhoun 1825 305 39 35 20 0Charlotte 14478 1456 723 123 21 4Citrus 13578 697 489 188 28 1Clay 24045 2876 1114 194 51 8Collier 19425 4162 11961 94 105 103Columbia 6759 2264 250 130 119 3Dade 39832 112827 214334 109 1602 1080De Soto 2597 941 1127 18 39 9Dixie 2023 208 16 48 18 2Duval 61187 54360 5190 409 1388 32Escambia 25441 16375 743 164 358 3Flagler 5479 949 415 27 15 1Franklin 1188 233 11 25 10 1Gadsden 425 6263 673 13 194 9Gilchrist 2476 135 41 38 8 0Glades 500 276 304 7 9 3Gulf 1788 393 12 12 21 0Hamilton 943 1041 156 18 65 0Hardee 2151 434 2155 37 15 61Hendry 2807 1345 3227 31 63 43Hernando 14901 1330 1219 87 32 11Highlands 6603 2314 2082 77 90 47Hillsborough 82470 39555 37982 627 1236 343Holmes 3333 106 51 106 6 0Indian River 10725 2599 1650 58 89 16Jackson 4624 2363 134 87 181 3Jefferson 497 1185 15 12 91 1Lafayette 798 119 103 11 5 4Lake 22295 4939 2725 282 288 41Lee 38543 9301 10665 195 207 67Leon 17454 12564 616 83 393 1Levy 4880 1062 229 80 59 1Liberty 1066 193 36 28 15 2

122
General Enrollment EMH EnrollmentSchool district Whites Blacks Hispanics Whites Blacks HispanicsMadison 1417 1954 49 30 162 1Manatee 24825 6535 6041 151 210 98Marion 26485 8275 3414 302 357 45Martin 12322 1751 2243 58 63 49Monroe 6125 835 1947 41 37 28Nassau 9134 1025 132 105 30 0Okaloosa 23851 3862 1078 176 129 6Okeechobee 4564 647 1507 68 37 23Orange 66066 45073 38087 609 1730 437Osceola 17371 3529 14840 190 113 182Palm Beach 74735 46830 29736 372 932 226Pasco 44728 2068 4216 468 79 52Pinellas 80370 21505 6357 497 646 47Polk 50033 18707 10648 676 837 134Putnam 7873 3390 1131 74 94 12St. Johns 17822 2115 475 110 109 4St. Lucie 17027 9000 3573 115 350 43Santa Rosa 20780 1281 431 173 43 7Sarasota 29103 3518 2955 119 77 12Seminole 41663 8525 8371 151 189 55Sumter 4458 1431 401 65 79 3Suwannee 4372 1088 249 87 82 6Taylor 2688 848 30 31 21 0Union 1713 367 36 15 14 1Volusia 44803 9494 6087 329 344 57Wakulla 4009 550 42 52 24 0Walton 5211 528 120 67 32 1Washington 2641 625 32 29 21 0

123
Table 13
Racial Composition of Students in Total Enrollment and EMH Enrollment (Percentages)
School district
Whitepercent of
totalenrollment
Whitepercent of
totalEMH
Blackpercent of
totalenrollment
Blackpercent of
totalEMH
Hispanicpercent of
totalenrollment
Hispanicpercent of
totalEMH
Alachua 53.68 25.24 37.10 69.01 4.23 3.19Baker 83.61 60.00 15.39 38.46 0.45 1.54Bay 78.94 59.92 15.65 35.50 1.60 1.91Bradford 73.00 46.92 24.63 50.77 1.25 2.31Brevard 76.85 47.94 13.90 46.61 4.86 3.39Broward 38.39 18.73 35.92 69.37 20.87 10.06Calhoun 82.50 63.64 13.79 36.36 1.76 0.00Charlotte 83.68 82.55 8.42 14.09 4.18 2.68Citrus 89.21 86.24 4.58 12.84 3.21 0.46Clay 82.88 74.90 9.91 19.69 3.84 3.09Collier 53.26 30.62 11.41 34.20 32.79 33.55Columbia 70.70 50.98 23.68 46.67 2.62 1.18Dade 10.63 3.87 30.10 56.95 57.19 38.39De Soto 55.09 27.27 19.96 59.09 23.91 13.64Dixie 89.36 69.57 9.19 26.09 0.71 2.90Duval 48.21 22.06 42.83 74.87 4.09 1.73Escambia 56.98 30.89 36.68 67.42 1.66 0.56Flagler 76.69 61.36 13.28 34.09 5.81 2.27Franklin 82.39 69.44 16.16 27.78 0.76 2.78Gadsden 5.72 5.99 84.28 89.40 9.06 4.15Gilchrist 92.77 82.61 5.06 17.39 1.54 0.00Glades 45.50 36.84 25.11 47.37 27.66 15.79Gulf 80.61 36.36 17.72 63.64 0.54 0.00Hamilton 43.82 21.69 48.37 78.31 7.25 0.00Hardee 44.98 32.74 9.08 13.27 45.06 53.98Hendry 37.01 22.46 17.73 45.65 42.55 31.16Hernando 83.06 65.41 7.41 24.06 6.80 8.27Highlands 58.42 35.81 20.47 41.86 18.42 21.86Hillsborough 48.60 27.89 23.31 54.98 22.38 15.26Holmes 94.23 94.64 3.00 5.36 1.44 0.00Indian River 69.57 35.37 16.86 54.27 10.70 9.76Jackson 63.25 31.52 32.32 65.58 1.83 1.09Jefferson 29.08 11.54 69.34 87.50 0.88 0.96Lafayette 77.48 55.00 11.55 25.00 10.00 20.00Lake 72.80 45.85 16.13 46.83 8.90 6.67Lee 63.54 40.88 15.33 43.40 17.58 14.05Leon 54.88 17.26 39.51 81.70 1.94 0.21

124
School district
Whitepercent of
totalenrollment
Whitepercent of
totalEMH
Blackpercent of
totalenrollment
Blackpercent of
totalEMH
Hispanicpercent of
totalenrollment
Hispanicpercent of
totalEMH
Levy 78.04 57.14 16.98 42.14 3.66 0.71Liberty 80.70 62.22 14.61 33.33 2.73 4.44Madison 41.20 15.46 56.82 83.51 1.42 0.52Manatee 64.90 32.20 17.08 44.78 15.79 20.90Marion 67.36 42.60 21.05 50.35 8.68 6.35Martin 73.39 34.12 10.43 37.06 13.36 28.82Monroe 66.10 38.68 9.01 34.91 21.01 26.42Nassau 87.53 76.64 9.82 21.90 1.26 0.00Okaloosa 77.29 55.00 12.52 40.31 3.49 1.88Okeechobee 65.99 51.91 9.36 28.24 21.79 17.56Orange 42.11 21.66 28.73 61.54 24.27 15.55Osceola 46.02 38.00 9.35 22.60 39.32 36.40Palm Beach 46.75 24.03 29.29 60.21 18.60 14.60Pasco 84.98 76.47 3.93 12.91 8.01 8.50Pinellas 70.35 40.77 18.82 52.99 5.56 3.86Polk 61.65 40.75 23.05 50.45 13.12 8.08Putnam 62.34 40.66 26.84 51.65 8.96 6.59St. Johns 85.20 49.11 10.11 48.66 2.27 1.79St. Lucie 55.73 22.42 29.46 68.23 11.69 8.38Santa Rosa 89.46 76.55 5.51 19.03 1.86 3.10Sarasota 78.55 56.67 9.50 36.67 7.98 5.71Seminole 66.43 36.30 13.59 45.43 13.35 13.22Sumter 69.90 43.92 22.44 53.38 6.29 2.03Suwannee 75.42 49.71 18.77 46.86 4.30 3.43Taylor 74.07 59.62 23.37 40.38 0.83 0.00Union 80.42 50.00 17.23 46.67 1.69 3.33Volusia 71.87 44.46 15.23 46.49 9.76 7.70Wakulla 85.66 67.53 11.75 31.17 0.90 0.00Walton 87.32 65.69 8.85 31.37 2.01 0.98Washington 78.30 58.00 18.53 42.00 0.95 0.00

125
Table 14
Proportion of White, Black, and Hispanic Students Identified as EMH for 67 School Districts
School district
Proportionof EMH
white
Proportionof EMH
black
Proportion ofEMH
HispanicAlachua 0.64 2.06 1.85Baker 0.79 2.65 0.00Bay 0.90 1.99 0.80Bradford 0.80 1.73 0.00Brevard 0.86 3.45 1.67Broward 0.63 2.90 0.75Calhoun 0.71 3.22 0.54Charlotte 0.31 2.07 0.11Citrus 0.62 3.05 0.79Clay 0.55 3.34 0.99Collier 0.62 3.35 0.70Columbia 0.80 2.57 0.39Dade 0.88 2.23 0.00De Soto 0.58 4.81 0.79Dixie 0.50 2.62 1.32Duval 0.58 2.82 0.69Escambia 0.49 1.93 0.48Flagler 0.59 3.87 1.26Franklin 0.51 3.22 0.91Gadsden 0.46 3.55 2.16Gilchrist 0.72 3.86 0.72Glades 0.71 2.16 2.00Gulf 0.77 2.28 1.63Hamilton 0.62 2.71 1.97Hardee 0.77 2.64 0.00Hendry 0.89 3.44 0.00Hernando 0.74 2.27 0.00Highlands 1.00 1.79 0.00Hillsborough 0.72 2.50 3.45Holmes 0.66 2.50 0.80Indian River 0.73 2.48 0.20Jackson 0.79 3.02 0.81Jefferson 0.50 2.03 0.59Lafayette 0.72 1.97 0.45Lake 0.63 2.38 0.32Lee 0.61 2.04 1.19Leon 0.79 3.25 1.22Levy 0.76 2.27 1.19

126
School district
Proportionof EMH
white
Proportionof EMH
black
Proportion ofEMH
HispanicLiberty 0.47 1.86 0.75Madison 0.40 2.32 0.72Manatee 0.83 2.42 0.93Marion 0.63 2.39 0.73Martin 0.54 1.84 0.34Monroe 0.90 3.29 1.06Nassau 0.66 2.19 0.62Okaloosa 0.46 1.75 0.42Okeechobee 0.57 2.36 0.68Orange 0.36 1.89 0.67Osceola 0.45 3.59 0.00Palm Beach 0.97 2.80 0.14Pasco 0.99 1.67 0.64Pinellas 0.51 2.14 0.64Polk 0.51 2.06 0.78Putnam 0.75 3.55 0.49St. Johns 0.57 3.00 1.02St. Lucie 0.64 2.83 0.80Santa Rosa 0.40 1.26 1.10Sarasota 0.78 2.84 4.10Seminole 0.38 1.47 0.36Sumter 0.50 2.96 0.57Suwannee 1.05 1.06 0.46Taylor 0.61 2.57 0.73Union 0.49 1.62 0.00Volusia 0.73 1.46 1.20Wakulla 0.65 1.92 0.74Walton 0.81 1.89 0.57Washington 0.84 1.72 3.64

127
Table 15
Percentage of Students on Free/Reduced Lunch for the 67 School Districts for School Year2001–2002
School district
Total onfree/
reducedlunch
Percent ofstudentson free/reducedlunch Total enrollment
St. Johns 4330 20.70% 20918Clay 6562 22.62% 29013Bradford 1054 25.73% 4096Seminole 16492 26.30% 62718Okaloosa 8487 27.50% 30858Leon 9502 29.88% 31802Brevard 22186 30.94% 71718Martin 5206 31.01% 16790Santa Rosa 7346 31.63% 23228Wakulla 1496 31.97% 4680Flagler 2313 32.38% 7144Nassau 3535 33.88% 10435Monroe 3176 34.28% 9266Sarasota 12719 34.33% 37048Pinellas 39553 34.62% 114251Taylor 1322 36.43% 3629Manatee 13944 36.45% 38250Broward 98201 37.48% 262027Volusia 23380 37.50% 62339Indian River 5935 38.50% 15417Lake 12098 39.50% 30626Hernando 7190 40.08% 17939Palm Beach 64291 40.22% 159862Baker 1843 41.05% 4490Citrus 6296 41.36% 15221Charlotte 7187 41.54% 17302Union 906 42.54% 2130Lee 26135 43.08% 60661Orange 68478 43.64% 156905Collier 15924 43.66% 36475Alachua 13023 44.00% 29599Pasco 23361 44.39% 52632Bay 11575 44.46% 26033Liberty 597 45.19% 1321Duval 58184 45.84% 126919

128
School district
Total onfree/
reducedlunch
Percent ofstudentson free/reducedlunch Total enrollment
Osceola 17639 46.73% 37744Hillsborough 79929 47.11% 169682Calhoun 1072 48.46% 2212Suwannee 2839 48.97% 5797Lafayette 526 51.07% 1030Marion 20175 51.31% 39319St. Lucie 15738 51.51% 30552Gulf 1146 51.67% 2218Walton 3104 52.01% 5968Columbia 5004 52.34% 9560Polk 42543 52.42% 81163Jackson 3857 52.76% 7311Okeechobee 3665 52.99% 6916Washington 1801 53.39% 3373Gilchrist 1472 55.15% 2669Escambia 24804 55.55% 44648Levy 3503 56.02% 6253Highlands 6367 56.33% 11303Holmes 2031 57.42% 3537Sumter 3714 58.23% 6378Dade 222928 59.48% 374806De Soto 2887 61.24% 4714Putnam 7754 61.40% 12629Franklin 893 61.93% 1442Glades 685 62.33% 1099Dixie 1440 63.60% 2264Hendry 4953 65.31% 7584Madison 2310 67.17% 3439Jefferson 1217 71.21% 1709Hamilton 1555 72.26% 2152Hardee 3551 74.26% 4782Gadsden 5694 76.62% 7431

129
Table 16
School District Ranks Based on Wealth
Schooldistrict Wealth ($) Category RankUnion 76381 Poor 1Holmes 82601 Poor 1Baker 87913 Poor 1Liberty 102759 Poor 1Calhoun 111121 Poor 1Madison 111732 Poor 1Gadsden 119713 Poor 1Gilchrist 126652 Poor 1Wakulla 127212 Poor 1Jackson 129929 Poor 1Bradford 130883 Poor 1Dixie 135826 Poor 1Suwannee 138245 Poor 1Lafayette 144127 Poor 1Washington 146166 Poor 1Columbia 153413 Poor 1Okeechobee 162021 Poor 1Levy 173632 Poor 1Clay 178374 Poor 1De Soto 182670 Poor 1Hendry 197770 Poor 1Jefferson 198733 Poor 1Putnam 202343 Middle 2Escambia 203828 Middle 2Santa Rosa 217306 Middle 2Marion 220936 Middle 2Polk 221541 Middle 2Taylor 226216 Middle 2Hamilton 226376 Middle 2Pasco 232981 Middle 2Hardee 236242 Middle 2Alachua 241613 Middle 2Highlands 270607 Middle 2Hillsborough 273193 Middle 2Brevard 274626 Middle 2Bay 275615 Middle 2Duval 276296 Middle 2Sumter 277204 Middle 2Okaloosa 288806 Middle 2

130
Schooldistrict Wealth ($) Category RankOsceola 291582 Middle 2Leon 293582 Middle 2Hernando 294319 Middle 2Seminole 294994 Middle 2Lake 306076 Middle 2Volusia 307767 Middle 2St. Lucie 309662 Middle 2Dade 311996 Middle 2Broward 355489 Upper Middle 3Orange 373710 Upper Middle 3Glades 385313 Upper Middle 3Nassau 389254 Upper Middle 3Citrus 390824 Upper Middle 3Pinellas 398440 Upper Middle 3Manatee 425370 Upper Middle 3Gulf 494321 Upper Middle 3St. Johns 521559 Upper Middle 3Flagler 524353 Upper Middle 3Charlotte 548088 Upper Middle 3Palm Beach 551656 Upper Middle 3Lee 608305 Wealthy 4Indian River 618189 Wealthy 4Martin 713531 Wealthy 4Sarasota 806073 Wealthy 4Franklin 812392 Wealthy 4Walton 907151 Wealthy 4Collier 1083239 Wealthy 4Monroe 1368044 Wealthy 4

131
Table 17
Population Density (Urbanicity) and District Size
Schooldistrict Urbanicity Total enrollment School size
Lafayette Rural 1030 SmallGlades Rural 1099 SmallLiberty Rural 1321 SmallFranklin Rural 1442 SmallJefferson Rural 1709 SmallUnion Rural 2130 SmallHamilton Rural 2152 SmallCalhoun Rural 2212 SmallGulf Rural 2218 SmallDixie Rural 2264 SmallGilchrist Rural 2669 SmallWashington Rural 3373 SmallMadison Rural 3439 SmallHolmes Rural 3537 SmallTaylor Rural 3629 SmallBradford Rural 4096 SmallBaker Rural 4490 SmallWakulla Rural 4680 SmallDe Soto Rural 4714 SmallHardee Rural 4782 SmallSuwannee Rural 5797 SmallWalton Rural 5968 SmallLevy Rural 6253 SmallSumter Suburban 6378 SmallOkeechobee Rural 6916 SmallFlagler Rural 7144 SmallJackson Rural 7311 SmallGadsden Rural 7431 SmallHendry Rural 7584 SmallMonroe Suburban 9266 SmallColumbia Rural 9560 SmallNassau Rural 10435 SmallHighlands Rural 11303 SmallPutnam Rural 12629 SmallCitrus Suburban 15221 SmallIndian River Suburban 15417 SmallMartin Suburban 16790 SmallCharlotte Suburban 17302 SmallHernando Suburban 17939 Small
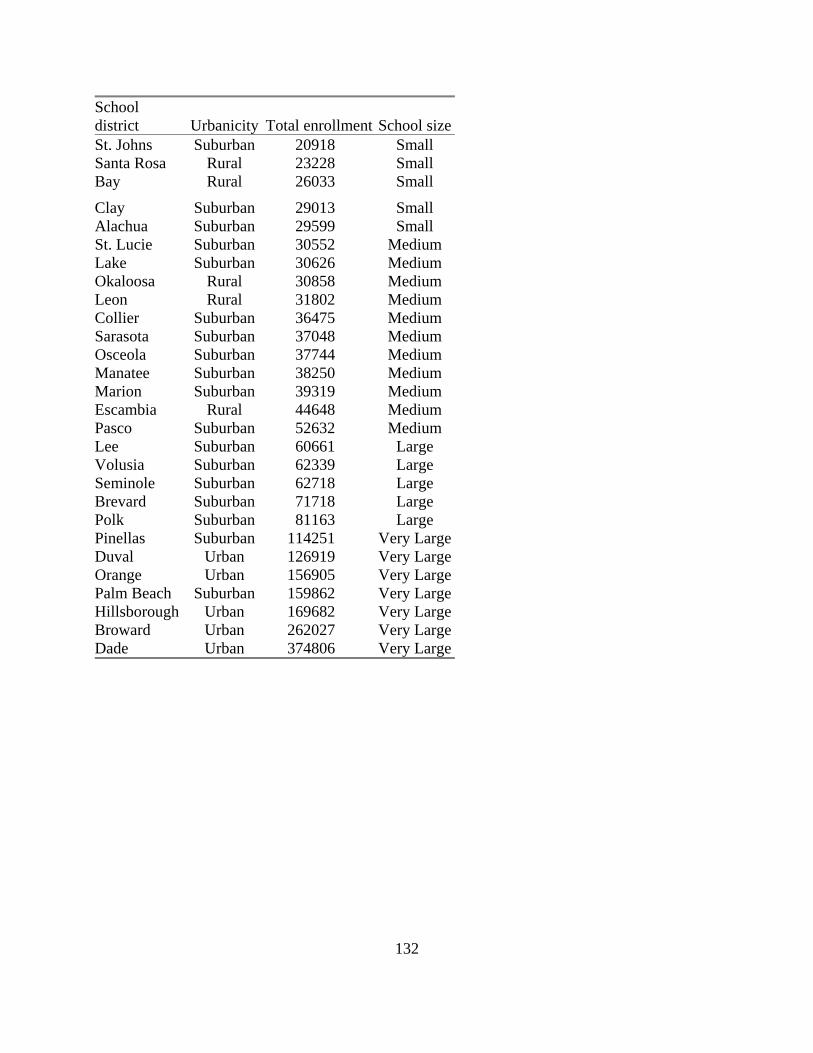
132
Schooldistrict Urbanicity Total enrollment School sizeSt. Johns Suburban 20918 SmallSanta Rosa Rural 23228 SmallBay Rural 26033 Small
Clay Suburban 29013 SmallAlachua Suburban 29599 SmallSt. Lucie Suburban 30552 MediumLake Suburban 30626 MediumOkaloosa Rural 30858 MediumLeon Rural 31802 MediumCollier Suburban 36475 MediumSarasota Suburban 37048 MediumOsceola Suburban 37744 MediumManatee Suburban 38250 MediumMarion Suburban 39319 MediumEscambia Rural 44648 MediumPasco Suburban 52632 MediumLee Suburban 60661 LargeVolusia Suburban 62339 LargeSeminole Suburban 62718 LargeBrevard Suburban 71718 LargePolk Suburban 81163 LargePinellas Suburban 114251 Very LargeDuval Urban 126919 Very LargeOrange Urban 156905 Very LargePalm Beach Suburban 159862 Very LargeHillsborough Urban 169682 Very LargeBroward Urban 262027 Very LargeDade Urban 374806 Very Large

133
Table 18
Racial Composition of Full-Time Staff
School district White staffPercent of white
staff Black staffHispanic
staff Total staff
Alachua 2791 69.32 1124 90 4026Baker 479 93.92 29 1 510Bay 2903 88.05 333 34 3297Bradford 434 82.98 87 2 523Brevard 6793 86.54 760 238 7850Broward 14247 57.38 8006 2171 24829Calhoun 255 88.85 28 1 287Charlotte 1993 92.14 107 43 2163Citrus 1852 93.91 86 25 1972Clay 3156 93.29 185 15 3383Collier 3372 74.93 338 772 4500Columbia 984 79.87 230 13 1232Dade 9901 26.31 13382 13902 37636De Soto 532 83.00 74 30 641Dixie 289 93.83 16 0 308Duval 7462 64.15 3801 196 11633Escambia 4013 75.05 1224 31 5347Flagler 879 85.01 107 38 1034Franklin 164 85.86 22 3 191Gadsden 257 24.71 758 20 1040Gilchrist 330 94.29 19 1 350Glades 93 75.61 26 4 123Gulf 275 86.75 42 0 317Hamilton 223 66.57 109 3 335Hardee 566 84.60 40 62 669Hendry 657 73.57 121 112 893Hernando 2039 86.54 173 130 2356Highlands 1139 81.82 181 67 1392Hillsborough 12405 66.60 3119 2925 18626Holmes 435 99.54 1 0 437Indian River 1432 81.00 273 54 1768Jackson 850 80.57 196 6 1055Jefferson 115 40.93 166 0 281Lafayette 141 96.58 3 2 146Lake 2916 82.86 452 128 3519Lee 5138 80.37 746 459 6393Leon 2509 61.21 1504 56 4099
Levy 712 85.68 98 20 831

134
School district White staffPercent of white
staff Black staffHispanic
staff Total staffLiberty 148 91.36 14 0 162Madison 247 56.91 185 2 434Manatee 4037 84.51 557 165 4777Marion 3875 73.71 1113 219 5257Martin 1602 83.01 216 105 1930Monroe 978 72.12 115 252 1356Nassau 1071 88.15 127 9 1215Okaloosa 2982 88.51 297 42 3369Okeechobee 731 86.20 66 47 848Orange 10947 62.32 3622 2716 17567Osceola 2953 71.23 276 874 4146Palm Beach 10931 63.14 4182 1983 17312Pasco 6390 93.82 180 207 6811Pinellas 11765 83.88 1874 268 14026Polk 8457 79.49 1766 366 10639Putnam 1416 79.42 320 38 1783St. Johns 2118 85.27 319 31 2484St. Lucie 2643 64.83 1284 128 4077Santa Rosa 2183 95.12 83 9 2295Sarasota 3892 89.51 354 73 4348Seminole 4970 75.47 1093 455 6585Sumter 658 81.13 136 13 811Suwannee 535 81.68 116 2 655Taylor 408 79.84 96 2 511Union 318 89.33 33 5 356Volusia 6636 81.06 1088 412 8187Wakulla 488 84.28 84 4 579Walton 731 90.02 66 5 812Washington 509 89.30 55 5 570

135
Table 19
Degree Level of Teachers
School districtBachelor’s
degrees
Percentwith
bachelor’sMaster’sdegrees
Specialistdegrees
Doctoraldegrees
Totaldegrees
Alachua 772 40.33 969 121 52 1914Baker 175 65.54 86 5 1 267Bay 1114 64.32 558 44 16 1732Bradford 189 66.32 87 5 4 285Brevard 2488 60.13 1577 40 33 4138Broward 7790 58.93 4987 285 157 13219Calhoun 96 58.18 67 1 1 165Charlotte 535 51.29 479 19 10 1043Citrus 605 57.95 409 19 11 1044Clay 1254 68.67 552 13 7 1826Collier 1137 55.71 855 30 19 2041Columbia 393 64.43 203 7 7 610Dade 10941 51.00 8041 1985 485 21452De Soto 247 78.91 60 2 4 313Dixie 102 71.33 37 3 1 143Duval 4630 66.01 2289 52 43 7014Escambia 1616 56.07 1197 52 17 2882Flagler 287 64.21 153 2 5 447Franklin 71 65.14 36 1 1 109Gadsden 323 64.73 169 5 2 499Gilchrist 129 70.11 51 3 1 184Glades 53 69.74 22 1 0 76Gulf 102 63.75 57 0 1 160Hamilton 111 76.03 26 6 3 146Hardee 266 81.10 57 3 2 328Hendry 290 75.52 89 4 1 384Hernando 688 62.66 394 9 7 1098Highlands 486 69.23 210 0 6 702Hillsborough 6934 62.29 3947 142 108 11131Holmes 144 60.00 95 0 1 240Indian River 575 66.24 242 44 7 868Jackson 284 52.01 243 18 1 546Jefferson 85 65.89 42 2 0 129Lafayette 51 71.83 20 0 0 71
Lake 1159 65.93 559 25 15 1758Lee 2119 61.60 1233 54 34 3440Leon 1126 52.47 923 65 32 2146

136
School districtBachelor’s
degrees
Percentwith
bachelor’sMaster’sdegrees
Specialistdegrees
Doctoraldegrees
Totaldegrees
Levy 253 64.54 127 10 2 392Liberty 57 66.28 29 0 0 86Madison 145 67.13 70 1 0 216Manatee 1263 59.63 793 43 19 2118Marion 1704 68.49 723 40 21 2488Martin 651 62.54 358 20 12 1041Monroe 375 61.48 230 1 4 610Nassau 388 65.10 200 5 3 596Okaloosa 1073 57.84 714 40 28 1855Okeechobee 306 73.56 103 7 0 416Orange 6430 63.94 3451 97 79 10057Osceola 1266 65.29 634 26 13 1939Palm Beach 5910 63.20 3221 117 103 9351Pasco 2062 63.84 1112 33 23 3230Pinellas 4781 61.70 2779 119 70 7749Polk 3821 71.89 1411 79 4 5315Putnam 543 67.88 245 9 3 800St. Johns 751 59.18 511 0 7 1269St. Lucie 1197 65.99 563 36 18 1814Santa Rosa 925 64.55 483 19 6 1433Sarasota 884 41.48 1196 10 41 2131Seminole 1993 54.78 1475 110 60 3638Sumter 252 70.99 97 6 0 355Suwannee 236 68.21 105 5 0 346Taylor 149 60.08 88 6 5 248Union 82 60.74 48 3 2 135Volusia 2557 60.58 1529 92 43 4221Wakulla 156 56.32 111 9 1 277Walton 246 69.89 100 5 1 352Washington 147 59.76 94 4 1 246

137
Table 20
School District FTE
Schooldistrict FTE ($)Alachua 5,843Baker 5,429Bay 5,597Bradford 5,617Brevard 5,281Broward 5,667Calhoun 5,657Charlotte 5,680Citrus 5,561Clay 5,172Collier 6,348Columbia 5,727Dade 6,246De Soto 5,743Dixie 6,068Duval 5,554Escambia 5,683Flagler 6,146Franklin 6,635Gadsden 6,824Gilchrist 5,815Glades 6,707Gulf 6,014Hamilton 6,500Hardee 6,006Hendry 5,742Hernando 5,446Highlands 5,986Hillsborough 6,161Holmes 5,662Indian River 5,825Jackson 5,788Jefferson 6,583Lafayette 5,802Lake 5,213Lee 5,862Leon 5,901Levy 5,633Liberty 6,147

138
Schooldistrict FTE ($)Madison 6,069Manatee 5,586Marion 5,622Martin 5,933Monroe 6,858Nassau 5,307Okaloosa 5,486Okeechobee 5,685Orange 5,528Osceola 5,185Palm Beach 6,306Pasco 5,747Pinellas 5,698Polk 5,618Putnam 5,739St. Johns 5,736St. Lucie 5,928Santa Rosa 5,453Sarasota 6,589Seminole 5,204Sumter 5,750Suwannee 5,430Taylor 5,842Union 5,436Volusia 5,641Wakulla 5,395Walton 5,783Washington 6,499

139
LIST OF REFERENCES
Agbenyega, S., & Jiggetts, J. (1999). Minority children and their over-representation in specialeducation. Education, 119(4), 619–632.
Algozzine, B., Ysseldyke, J., Kauffman, J., & Landrum, T. (1991). Implications of schoolreform in the 1990s for teachers of students with behavior problems. Preventing SchoolFailure, 35(2), 6–10.
American Psychiatric Association. (1987). Diagnostic and statistical manual of mental disorders(3rd ed., Rev. ed.). Washington, DC: Author.
American Psychiatric Association. (1994). Diagnostic and statistical manual of mental disorders(4th ed.). Washington, DC: Author.
Argulewicz, E. N. (1983). Effects of ethnic membership, socioeconomic status, and homelanguage on LD, EMR, and EH placements. Learning Disability Quarterly, 6(2), 195–200.
Artiles, A. J., Aguirre-Munoz, Z., & Abedi, J. (1998). Predicting placement in learningdisabilities programs: Do predictors vary by ethnic group? Exceptional Children, 64(4),543–559.
Artiles, A. J., & Trent, S. C. (1994). Over-representation of minority students in specialeducation: A continuing debate. The Journal of Special Education, 27, 410–437.
Artiles, A. J., & Zamora-Duran, G. (1997). Reducing disproportionate representation ofculturally diverse students in special and gifted education. Reston, VA: Council forExceptional Children. (ERIC ED 410 736)
Bailey, D. B., Jr., & Harbin, G. L. (1980). Nondiscriminatory evaluation. Exceptional Children,46, 590–596.
Benner, S. (1998). Special education issues within the context of American society. Belmont,CA: Wadsworth.
Bernal, E., & Bernal, H. (1974). Teaching religion to minority groups. Notre Dame Journal ofEducation, 5, 232–236.

140
Bersoff, D. N. (1982). The legal regulation of school psychology. In C. R. Reynolds & T. B.Gutlin (Eds.), The handbook of school psychology (pp. 1043–1074). New York: Wiley.
Biasini, F., Grupe, L., Huffman, L., & Bray, N. (2003). Mental retardation: A symptom and asyndrome. In S. Netherton, D. Holmes, & C. Walker (Eds.), Comprehensive textbook ofchild and adolescent disorders. New York: Oxford University Press, in press. RetrievedFebruary 20, 2003, from http://www.uab.edu/cogdev/mentreta.htm
Blanton, L. (1975). The relationship of organizational abilities to the comprehension connecteddiscourse in educable mentally retarded and non-retarded children. Dissertation AbstractsInternational, 35(9-A), 5961.
Bliss, L. S., & Allen, D. V. (1981). Black English responses on selected language tests. Journalof Communication Disorders, 14, 225–233.
Bracken, B., & McCallum, R. (1998). Examiner’s manual: Universal Nonverbal IntelligenceTest (UNIT). Itasca, IL: Riverside.
Bryen, D. N. (1976). Speech-sound discrimination ability on linguistically unbiased tests.Exceptional Children, 42(4), 195–201.
Burke, S. M., Pflaum, S. W., & Knafle, J. D. (1982). The influence of Black English ondiagnosis of reading in learning disabled and normal readers. Journal of LearningDisabilities, 15(1), 19–22.
Capper, C. (1990). Exploring the influence of community socioeconomic class, location, andculture on effective school linkages for preschool students with disabilities. Madison, WI:Dept. of Educational Administration, Wisconsin University.
Center for Education Reform. (2004). K–12 facts. Retrieved February 1, 2004, fromhttp://www.edreform.com/index.cfm
Cheboygan-Otsego-Presque Isle Educational Service District. (n.d.). Tests most commonly usedby school psychologists. Retrieved March 25, 2003, fromhttp://www.copesd.k12.mi.us/special_ed/Common%20Psych%20Tests.PDF
Civil Rights Project. (2002, November 11). Racial inequity in special education. ExecutiveSummary for Federal Policy Makers, Harvard University. Retrieved February 20, 2003,from http://www.civilrightsprojects.harvard.edu/ research/specialed/IDEA_paper02.php
Collier, C. (1986, April). The referral of Hispanic children to special education: A comparisonof acculturation and education characteristics of referred and nonreferred culturally andlinguistically different children. Paper presented at the annual meeting of the NationalAssociation for Bilingual Education, Chicago, IL. (ERIC ED 271 954)

141
Cook, L. H., & Boe, E. E. (1995). Who is teaching students with disabilities? TeachingExceptional Children, 28(1), 70–72.
Cummins, S. (1984). Assessment of visual memory and learning by selective reminding.Dissertation Abstracts International Univ. Microfilms International, 44(8-B), 2550.
de la Cruz, R. (1996). Assessment-bias issues in special education: A review of literature.Reston, VA: Council for Exceptional Children. (ERIC ED 390 246)
Ewing, N. (1995). Restructured teacher education for inclusiveness: A dream deferred forAfrican American children. In B.A. Ford, F. E. Obiakor, & J. Patton (Eds.), Effectiveeducation of African American exceptional learners. Austin, TX: Pro-Ed.
Feldman, M., & Walton-Allen, N. (1997). Effects of maternal mental retardation and poverty onintellectual, academic, and behavioral status of school-age children. American Journal onMental Retardation, 101, 352–364.
Fine, L. (2001, March 14). Studies examine racial disparities in special education. EducationWeek, 20(6), 6.
Florida Department of Education. (1994). DOE information database requirements. Volume 1:Automated student information system. Tallahassee, FL: Author.
Florida Department of Education Database. (2001). Retrieved on March 6, 2003, fromhttp://www.firn.edu/doe/eias/flmove/florida.htm
Foster, G., & Ysseldyke, J. (1976). Expectancy and halo effects as a result of artificially inducedteacher bias. Contemporary Educational Psychology, 1, 37–45.
Frame, R. E., Clarizio, J. G., Porter, A. C., & Vinsonhaler, J. R. (1982). Interclinician agreementand bias in school psychologists’ diagnostic and treatment recommendations for alearning disabled child. Psychology in the Schools, 19, 319–327.
Gardner, H. (1993). Multiple intelligences: The theory in practice. New York: Basic Books.
Gardner, H. (1999). Intelligence reframed: Multiple intelligences for the 21st century. NewYork: Basic Books.
Garth, T. R. (1923). A comparison of the intelligence of Mexican and mixed and full bloodIndian children. Psychological Review, 30, 388–401.
Gay, G. (1994). A synthesis of scholarship in multicultural education. Retrieved February 3,2004, from http://www.ncrel.org/sdrs/areas/issues/educatrs/leadrshp/le0gay.htm

142
Greenwood, C. R., Preston, D., & Harris, J. (1982). Minority issues in the education ofhandicapped children. Unpublished manuscript, Department of Special Education,University of Kansas, Lawrence.
Grossman, H. (1983). Classification in mental retardation. Washington, DC: AmericanAssociation on Mental Deficiency.
Grossman, H. (1995). Special education in a diverse society. Boston: Allyn & Bacon.
Grossman, H. (1998). Ending discrimination in special education. Springfield, IL: Charles C.Thomas.
Harber, J. R. (1980). Issues in the assessment of language and reading disorders in learning-disabled children. Learning Disability Quarterly, 3(4), 20–28.
Harper, J. A., & Harper, S. R. (1998). Cultural diversity and special education. Dubuque, IA:Kendall/Hunt.
Harry, B. (1992). Cultural diversity, families, and the special education system: Communicationfor empowerment. New York: Teacher College Press.
Heller, R., Holtzman, W., & Messick, S. (1982). Placing children in special education: Astrategy for equity. Washington, DC: National Academy Press.
Henson, L. (2003). Comments on mental retardation. Retrieved February 20, 2003, fromhttp://www.bamaed.ua.edu/spe300/mental_retardation.html
Hilliard, A. (1992). The pitfalls and promises of special education practice. ExceptionalChildren, 59, 168–172. (Original work published in 1987)
Hilton, L. (1991). Cultural bias and ecological validity in testing rural children. Rural Education,12, 16–20.
Hodgkinson, H. (1995). What should we call people? Race, class, and the census for 2000. PhiDelta Kappan, 77, 173–179.
Hunt, N., & Marshall, K. (1994). Exceptional children and youth: An introduction to specialeducation. Boston: Houghton Mifflin.
Jensen, A. (1969). How much can we boost IQ and scholastic achievement? HarvardEducational Review, 39 (1), 1–123. Retrieved March 3, 2003, fromhttp://www.jabpage.com/facts/jensen/jensen.html
Jensen, A. (1981). Straight talk about mental tests. New York: Free Press.

143
Kaufman, A. (1975). Factor-analysis of WISC-R at 11 age levels between 6½ and 16½ years.Journal of Consulting and Clinical Psychology, 43(2), 135–147.
Kaufman, A., & Kaufman, N. (1993). Manual for the Kaufman Adolescent and AdultIntelligence Test (KAIT). Circle Pines, MN: American Guidance Service.
Kaufman, A., Lichtenberger, E., & Naglieri, J. (1999). Intelligence testing in the schools. InC. R. Reynolds & T. B. Gutkin (Eds.), The handbook of school psychology (pp. 307–349). New York: Wiley.
La Griffe du Lion. (2000). The politics of mental retardation: A tail of the bell curve. RetrievedFebruary 26, 2003, from http://www.lagriffedulion.f2s.com/retard.htm
Lambert, N. (1988). Perspectives on eligibility for and placement in special education programs.Exceptional Children, 54, 297–301.
Limon-Luckett, R. (1999). Support of the individual with mental retardation. Retrieved April 28,2003, from http://www.gwc.maricopa.edu/class/e-portfolio/samples/luckett.html
Low, B. P., & Clement, P. W. (1982). Relationships of race and socioeconomic status toclassroom behavior, academic achievement, and referral for special education. Journal ofSchool Psychology, 20(2), 103–112.
MacMillan, D. L., & Reschly, D. J. (1998). Overrepresentation of minority students: The case forgreater specificity or reconsideration of the variables examined. Journal of SpecialEducation, 32(1), 15–24.
Maheady, L., Towne, R., Algozzine, B., Mercer, J., & Ysseldyke, J. (1983). Minorityoverrepresentation: A case for alternative practices prior to referral. Learning DisabilityQuarterly, 6(4), 448–456.
Marlowe, B. (2001, April 18). The special education conundrum. Education Week, 43.
McGrew, K., Werder, J., & Woodcock, R. (1991). WJ-R technical manual. Chicago: Riverside.
Meier, K. J., Stewart, J., & England, R. E. (1989). Race, class, and education: The politics ofsecond-generation discrimination. Madison, WI: University of Wisconsin Press.
Miller-Jones, D. (1989). Culture and testing. American Psychologist, 44, 360–366.
Monson, E. (2003). Mental retardation. Retrieved April 28, 2003, fromhttp://www.lexcie.zetnet.co.uk/retard.html

144
Moore, W. L., & Cooper, H. (1984). Correlations between teacher and student background andteacher perception of discipline problems and disciplinary techniques. Psychology in theSchools, 21, 386–392.
Naglieri, J., & Rojahn, J. (2001). Intellectual classification of African American and whitechildren in special education programs for children with mental retardation using theWISC-III and Cognitive Assessment System (CAS). American Journal on MentalRetardation, 106(4), 359–367.
Newman, N. (1995). Poverty causes retardation, research finds. News/Updates on Organizing todefend Affirmative Action. Retrieved March 25, 2003,from http://www.hartford-hwp.com/archives/45/030.html
Niolon, R. (2002). How have we tested intelligence? Retrieved March 25, 2003, fromhttp://www.psychpage.com/learning/library/intell/iqtesting.html
Noel, M. M., & Fuller, B. C. (1985). The social policy construction of special education: Theimpact of state characteristics on identification and integration of handicapped children.Remedial and Special Education, 6(3), 27–35.
Oakland, T. (Ed.). (1977). Psychological and educational assessment of minority students. NewYork: Brunner/Mazel.
Oswald, D. P., Coutinho, M. J., Best, A. M., & Singh, N. N. (1999). Ethnic representation inspecial education: The influence of school-related economic and demographic variables.Journal of Special Education, 32(4), 194–206.
Paolino, A. (2002). Addressing disproportionality of minority students in special educationprograms. Retrieved March 25, 2003, fromhttp://www.ecs.org/clearinghouse/39/99/3999.htm
Pardini, P. (2002, Spring). The history of special education. Rethinking Schools, An UrbanEducational Journal 16(3). Retrieved March 3, 2003, fromhttp://www.rethinkingschools.org/Archives/16_03/Hist163.htm
Patrick, J. L. (1986). Immigration in the curriculum. Social Education, 50(3), 172–176.
Patton, J. (1998). The disproportionate representation of African Americans in special education:Looking behind the curtain for understanding and possible solutions. Journal of SpecialEducation, 32, 25–31.
Payette, K., & Clarizio, H. (1994). Discrepant team decisions: The effects of race, gender,achievement, and IQ on LD eligibility. Psychology in the Schools, 31, 40–48.

145
Payne, R. (2001). A framework for understanding poverty. Highlands, TX: aha! Process.
Pierangelo, R., & Giuliani, G. (1998). Special educators complete guide to 109 diagnostic tests.West Nyack, NY: Center for Applied Research in Education.
Podell, D., & Soodak, L. (1993). Teacher efficacy and bias in special education referral. Journalof Educational Research, 86, 247–253.
Reschly, D. J., & Bersoff, D. N. (1999). Law and school psychology. In C. R. Reynolds & T. B.Gutkin (Eds.), The handbook of school psychology (pp. 1077–1112). New York: Wiley.
Reschly, D. J., Kicklighter, R. H., & McKee, P. (1988). Recent placement litigation, Part III:Analysis of difference in Larry P. and Marshall S. and implications for future practices.School Psychology Review, 17(1), 9–50.
Reynolds, C., Lowe, P., & Saenz, A. (1999). The problem of bias in psychological assessment.In C.R. Reynolds & T. B. Gutkin (Eds.), The handbook of school psychology (pp.549–595). New York: Wiley.
Reynolds, C. R., & Gutkin, T. B. (Eds.). (1999). The handbook of school psychology. NewYork: Wiley.
Riverside Resource Bulletin. (2003). UNIT comparative features with major nonverbalintelligence measures. Retrieved May 12, 2003, fromhttp://www.riverpub.com/products/clinical/unit/unit_comp.html.
Robinson, E., & Rathbone, G. (1999). Impact of race, poverty, and ethnicity on services forpersons with mental disabilities: Call for cultural competence. Mental Retardation, 37(4),333–338.
Ross, H. W. (1979). Wepman Test of Auditory Discrimination: What does it discriminate?Journal of School Psychology, 17(1), 47–54.
Salvia, J., & Ysseldyke, J. (1995). Assessment (6th ed.). Boston: Houghton Mifflin.
Samuda, R. J., Kong, S. L., Cummins, J., Pascual-Leone, J., & Lewis, J. (1989). Assessment andplacement of minority students. Toronto: Intercultural Social Sciences Publications.
Sattler, J. M. (2001). Assessment of children: Cognitive applications. San Diego, CA: Sattler.
Serna, L. A., Forness, S. R., & Nielsen, M. E. (1998). Intervention versus affirmation: Proposedsolutions to the problem of disproportionate minority representation in special education.Journal of Special Education, 32(1), 48–51.

146
Sexton, D., Lobman, M., Constans, T., Snyder, P., & Ernest, J. (1997). Early interventionists’perspectives of multicultural practices with African American families. ExceptionalChildren, 63, 313–328.
Sheerenberger, R. C. (1983). A history of mental retardation. Baltimore: Brookes.
Sherman, A. (1992). Falling by the wayside: Children in rural America. Washington, DC:Children’s Defense Fund.
Simpson, A. W., & Erickson, M. T. (1983). Teachers’ verbal and nonverbal communicationpatterns as a function of teacher race, student gender, and student race. AmericanEducational Research Journal, 20(2), 183–198.
So, A. Y. (1987). High achieving disadvantaged students: A study of low SES Hispanic languageminority students. Urban Education, 22(1), 19–35.
Spellman, S. O. (1988, July–August). Recruitment of minority teachers: Issues, problems, facts,and possible solutions. Journal of Teacher Education, 39(4), 58–63.
Suzuki, B. H. (1984). Curriculum transformation for multicultural education. Education andUrban Society, 16, 294–322.
Swanson, H. L., & Watson, B. L. (1989). Educational and psychological assessment ofexceptional children (2nd ed.). Columbus, OH: Merrill.
Taylor, M. (1979). Race, sex and the expression of self-fulfilling prophecies in a laboratory-teaching situation. Journal of Personality and Social Psychology, 37(6), 897–912.
The Arc. (1998). Mental retardation. Retrieved April 28, 2003, fromhttp://www.disabilityindia.org/MentalRetardation.html
Thurmond, V. B. (1977). The effect of Black English on the reading test performance of highschool students. Journal of Educational Research, 70(3), 160–163.
Turnbull, H., III. (1993). Free appropriate public education: The law and children withdisabilities (4th ed.). Denver, CO: Love.
U.S. Bureau of Census. (1992a). Census of population and housing – Summary tape file 1:Summary population and housing characteristics. Washington, DC: U.S. GovernmentPrinting Office.
U.S. Bureau of Census. (1992b). Current population reports, P25-1092: Population projectionsof the United States by age, sex, race, and Hispanic origin: 1992–2050. Washington, DC:U.S. Government Printing Office.

147
Valencia, R., & Suzuki, L. (2001). Intelligence testing and minority students. Thousand Oaks,CA: Sage.
Valles, E. C. (1998). The disproportionate representation of minority students in specialeducation: Responding to the problem. Journal of Special Education, 32(1), 52–54.
Wartella, A. B., & Williams, D. (1982). Speech and language assessment of black and bilingualchildren. (ERIC ED 218 914)
Washington, V. (1982). Racial differences in teacher perception of first and fourth grade pupilson selected characteristics. Journal of Negro Education, 51, 60–72.
Wechsler, D. (1974). Manual for the Wechsler Intelligence Scale for Children (Rev. ed.). SanAntonio, TX: Psychological Group.
Weiner, T., & Davis, F. (1995). Sociological theory and mental retardation. InternationalJournal of Sociology and Social Policy, 51, 1–11.
Yeargin-Allsopp, M., Drews, C., Decoufle, P., & Murphy, C. (1995). Mild mental retardation inblack and white children in metropolitan Atlanta: A case control study. American Journalof Public Health, 85(3), 324–328.
Ysseldyke, J., & Algozzine, B. (1990). Introduction to special education (2nd ed.). Boston:Houghton Mifflin.
Zhang, D., & Katsiyannis, A. (2002). Minority representation in special education. Remedial andSpecial Education, 23(3), 180–187.