An investigation into some antibiotics produced by ... University Institutional Repository An...
346
•
Transcript of An investigation into some antibiotics produced by ... University Institutional Repository An...
Loughborough UniversityInstitutional Repository
An investigation into someantibiotics produced by
Pseudomonas antimicrobica
This item was submitted to Loughborough University's Institutional Repositoryby the/an author.
Additional Information:
• A Doctoral Thesis. Submitted in partial ful�lment of the requirements forthe award of Doctor of Philosophy of Loughborough University.
Metadata Record: https://dspace.lboro.ac.uk/2134/10381
Publisher: c© Ernest Attafuah
Please cite the published version.

This item was submitted to Loughborough University as a PhD thesis by the author and is made available in the Institutional Repository
(https://dspace.lboro.ac.uk/) under the following Creative Commons Licence conditions.
For the full text of this licence, please go to: http://creativecommons.org/licenses/by-nc-nd/2.5/

--.. ,.,,----.
. '.\
':'. '
"I LOUGHBOROUGH UNIVERSITY OF TECHNOLOGY .
_______ ...:L:.:..:IB:..:R:.:..:A....:.R....:.Y.:.-. _____ ~. : I . AUTHOR/FILING TITLE J~. i . : -------A:r.TAL~A.H_/ ___ t; ___________________ !!
, ----- - ----- ---_ .. _---------- ----- --- ----- - - -_._--- ......
ACCESSION/COPY NO. I I.
----------------- ~-~-~-~-C:~:t 5:':1 ___ , _________ ~"" _ _ _ :. VOL. NO. CLASS MARK i
i
... ' .. / ..... . . .
. / ,;: .':.-,.J-
~: . r 036000959 X
" 1 11111l1li11111111111111111111
'" :.: ~.-)::, .. - !.'
-..:".
/
AN INVESTIGATION INTO SOME ANTIBIOTICS PRODUCED'
Supervisors:
BY PSEUDOMONAS AN11MICROBICA
by
Ernes.t Attafuah, BSc (Hons), MSc.
A Doctoral Thesis Submitted in Partial Fulfilment of the
Requirements for the Award of the Degree of Doctor of Philosophy
of
. Loughborough University of Technology
September1991 .
W. G. Salt R. J. Stretton
... t. ",
o by Ernest Attafuah, 1991

Loughborough University of Tecnnoi8gy libr~ry
c,,,e -J ..... '\'1.
! (., , .,l
:, ,:0 C~boo~"I)(l .-~ ..... -"-
t..) ~'1 'l-ll ~ I

DEDICATION
To
Almighty God, my mother and father
i

ACKNO~DGEMENTS
I am grateful to Drs. W. G. Salt and R. J. Stretton for their supervision of this· work, and for their advice, helpful comments and constructive criticisms of this manuscript. I am also grateful to Dr. D .. Brown for excellent work done and for his supervision during the X-ray crystallography work. My thanks are also due to my research colleagues in the organic/medicinal chemistry section, for the occasional 'brain storming' sessions we had.
I would like to thank all the technical staff I have been involved with, including Elizabeth AlIen, Jill Thorley, Jane Owens and John Brennan.
I am grateful to my father, without whose discovery, financial assistance, constant encouragement and patience, this project would never have been initiated nor concluded.
Finally, I would like to thank Mrs. M. Brooks for her patience during the excellent . typing of this thesis.
i i

ABSTRACf
Two strains (NCm 9897 and 9898; strains A and B respectively) of a Pseudomonas·
species have been shown to display antifungal and antibacterial activity on solid
media. Biochemical tests indicate that the organisms may be two distinct strains of
a new species. Cell lllorphology was studied using scanning electron microscopy.
Chemically defined media, established for the organisms, indicate non-fastidous
characteristics.
Four liquid media, able to elicit antibiotic production from Strain A have been
developed: a chemically defined medium (antibacterial), a chemically defined
medium and a complex medium (antifungal) and a chemically defined medium
(antibacterial and antifungal).
Nitrogen and magnesium limitation significantly increased yields. Magnesium content
in a medium (without a magnesium salt component) and in whole cell samples grown
in the said medium were assessed using atomic absorption spectroscopy and
elemental analysis respectively.
Optimization experiments for antibacterial and antifungal activity, assessed by a disc
diffusion assay, increased yields, in 250 ml conical flasks by a factor of X9 and 109%
respectively. A 6 litre laboratory-scale fermentor was used for larger batch
cultivations .
. Procedures for extraction of the active compounds from the biological matrices were .
developed leading to the isolation of one antibacterial compound, ABl (yellow
crystalline) and three antifungal compounds, AFl, AF2 and AF3 (pale yellow and
. amorphous).
Structure determination of ABl, involving mass spectrometry, IR/UV spectroscopy,
lH-NMR and x-ray diffraction, indicated it to be 1.6 dimethyl pyrimido[5,4-e ]-1,2,4-
triazine-5,7(IH,6H)-dione (Xanthothricin; Toxoflavin), a toxic metabolite previously
i i i

detected in foods contaminated with Ps. cocovenenans. Selective media, developed '
for Strain Aand Strain B, did not support growth of Ps. cocovenenans. Preliminary
structural analysis suggests that AFl may possess a mono-substituted ring system with
CHz chain and a terminal hydroxyl group; that AF2 may belong to the polyene group
of antifungal antibiotics and that AF3 may be an aliphatic ketone with hydroxyl
group ..
Agar diffusion, minimum inhibitory concentration, assays for the compounds, indicate
activity to be in the ~g!ml range for sensitive microorganisms. Antibiotic challenge
against test microorganisms suggest bacteriostatic activity for ABl, fungistatic activity
for AFl and AF3 and fungicidal activity for AF2.
iv

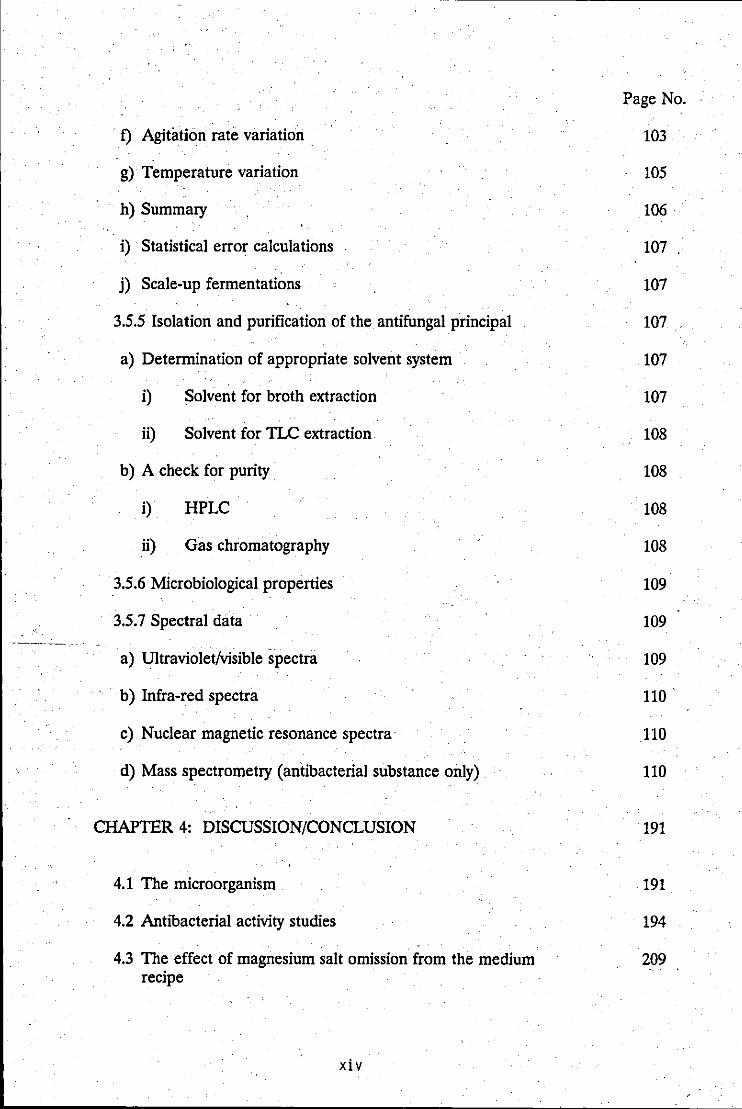
TABLE OF CONTENTS
Page No.
Dedication i
Acknowledgements ii
Abstract iii
Table of Contents v
Index of Tables xvi
Index of Figures xix
Abbreviations xxix
CHAPTER 1 INTRODUcrION
1.1 The Pseudomonads 1
1.2 Antibiotics: a general/historical approach 2
1.3 Sources and production of antibiotics 8
1.4 The fermentation process 19
1.5 Downstream processing and identification· of antibiotics . 23
1.6 Some Pseudomonas antibiotics 25
1.7 A novel Pseudomonas 28
1.8 Aims 29
CHAPTER 2 MATERIALS AND METHODS 32
2.1 MATERIALS 32
2.1.1 Microorganisms 32
2.1.2 Routine media 33
2.1.3 Growth curve media 34
2.1.4 Media tested for antibiotic production 35
v

2.2 GENERAL METHODS
2.2.1 Culture maintenance
2.2.2 Working stocks
2.2.3 Inoculum development
2.2.4 Biochemical/tolerance tests
2.2.5 Transmission electron microcopy (TEM) - Negative straining .
2.2.6 Selective medium development
2.2.7 Growth curves
2.2.8 Freeze drying
2.2.9 Some comparison/acidophily tests (strain A and Ps. cocovenenans)
2.2~1O Preliminary detection of antifungal activity
2.2.11 Preliminary extraction of water-soluble active . substances
2.3 ANTIBACfERIAL ACfIVITY STUDIES
2.3.1 Elicitation of antibacterial activity in liquid media
a) Assay procedure for antibacterial activity
2.3.2 Pigmented inoculum experiments
a) Orbital incubation
b) Static incubation
2.3.3 Preliminary testing of the active broth
a) Heat stability
b) A test for pyrrols
vi
Page No.
38
38
38
38
38
39
39
39
40
40
41
41
42
42
42
43
43
43
44
44
44

2.3.4 Optimization experiments
a) Medium component single-deletion of the basal medium (MCSD) [SLR]
b) MCSD of the basal medium (AR)
c) Variation of nutrient concentration
d) Variation of physical parameters
23.5 Cultivation in a laboratory-scale fermentor
2.3.6 Statistical error calculation
2.3.7 Thin-layer chromatography (TLC) plate preparation
a) Analytical TLC
b) Preparative TLC
2.3.8 Detection of active compound
a) Ultravioletlvisible (direct observation) .
b) Charring
c) Bioautography
.2.3.9 Isolation and punfication of the antibacterial principal
a) Determination of appropriate solvent system for extraction
i). Solvent for broth extraction
ii) Solvent for liquid/liquid extraction
iii) Solvent for TLC extraction
iv) Solvent for trituation
(b) Liquid/liquid extraction procedure
(c) Liquid/liquid/TLC extraction procedure
vi i
Page No.
44
44
45
45
45
47
47
47
47
48
48
48
48
49
49
49
49
51
51
51
51
52
----------------------------------------------,
2.3.10 High pressure liquid chromatography (HPLC) of isolate
2.3.11 Dose-response calibration curve·
2.3.12 Calculation of percentage efficiency of extraction
2.3.13 Physical properties
a) Melting point
b) pH/thermal stability test
. c) Ultraviolet light stability test
d) Retention factor determination
2.3.14 Antimicrobial properties
a) Minimum inhibitory concentration (MIC) determinations .
i) Tube dilution method
ii) Agar diffusion method
b) Assessment of microbistatic/cidal activity
2.3.15 Chemieal properties
2.3.16 Spectral data for antibacterial substance
a) Ultraviolet/visible scan··
b) Infra-red scan
c) Mass spectroscopy
2.3.17 X-ray crystallography.
a) Crystal formation
b) X-ray diffraction·
viii
Page No.
53
54
54
54
54
54
55
55
55
55
55
55
56
56
56
56
57
57
57
57 ..
58

Page No.
2.4 THE EFFECT OF MAGNESIUM SALT OMISSION 58 FROM THE MEDIUM RECIPE
2.4.1 Cell propagation experiments 58
a) Strain A in Med A2 (SLR) 58
b) Strain A in Med A2 (AR) 59
c) Ps. aeruginosa in Med A2 (SLR) 59
2.4.2 Atomic absorption measurements of Mg2+ in Med A2 SLR· 59 and AR .
a) Calibration curve 59
b) Mg2+ measurements (samples) 59
2.4.3 Analysis of Mgz+ in cells of strain A grown in basal medium 60 and Med A2
2.4.4 Viable counts of strain A grown in basal medium and Med 60 A2
2.5 ANTIFUNGAL ACTIVITY STUDIES 61
2.5.1 Elidtation of antifungal activity in liquid media 61
2.5.2 Assay of antifungill activity 61
2.5.3 Construction of PDLM for antifungal production 61
a) Oxoid PDA batch No. 15621497 61
b) Oxoid PDA Lot No. 07040305 61
c) Oxoid Potato Extract 62
d) Potato Liquid Extract 62
2.5.4 Optimization of antifungal activity 62
a) Medium component single-detection of medium q 62
ix

b) Variation of nutrient concentration
c) Variation of physical parameters
2.5.5 Cultivation in a laboratory-scale fermenter
2.5.6 Statistical error calculation
2.5.7 Isolation and purification of the antifungal substances
. a) Determination of appropriate solvent system for broth extraction
b) Development of a solvent system!fLC strategy for extraction
2.5.8 A check for purity
a) HPLC
b) Gas chromatography
2.5.9 Antimicrobial properties
a) MIC determination of an antifungal compound
b) Zone stability comparisons of the 3 antifungal compounds
2.5.10 Spectral data for the antifungal substances
a) Ultraviolet/visible scans
b) Infra-red scans
c) Nuclear magnetic resonance scan
CHAPTER 3: RESULTS
3.1.0 GENERAL
3.1.1 Transmission electron microscopy
3.1.2 Selective media development
x
Page No.
62
63
63
63
63
63
64
64
64
65
65
65
66
66
66
66
67
68
68
68
68

3.1.3 Biochemical/tolerance test
3.1.4 Some comparison studies between strain A and Ps. ocovenenans
Page No.
68
69
3.1.5 Growth curve studies 70
3.1.6 Invasive growth inhibition of A. niger by some Pseudomonas 71 species
3.1.7 Preliminary extraction of water-soluble active substances
3.2.0 ANTffiACfERIAL ACfIVITY STUDIES
3.2.1 Elicitation of antibiotic production in liquid media
3.2.2 Preliminary testing of antibacterial substance/s
a) Heat stability
b) A test for pyrrols
3.2.3 Pigmented inoculum experiment
a) Orbital incubation
. b) Static incubation
3.3.3 Optimization experiments
a) Medium component single-deletion (SLR)
b) Medium component single-deletion (AR)
c) Glucose variation
d) Ammonium chloride variation
e) pH variation
t) Agitation rate (RPM) variation
g) Temperature variation
h) Initial optical density (O.D.) variation
xi
71
71
71
72
72
72
72
72
72
73
72
74
74
76
77
79·
80
81

Page No.
i) Summary 82
k) Statistical error calculation 82
k) Scale-up fermentations 82
3.3.4 Isolation, purification and quantification of the antibacterial 83 principal
a) Determination of appropriate solvent system for extraction 83
i) Solvent for broth extraction 83
ii) Solvent/solvent extraction 83
iii) SolventtTLC extraction 84
b) Calculation of percentage efficiency of extraction 86
c) A check for purity 86 .
d) Assessment of antibiotic concentration in fermentation broth 86
3.3.5 Physical properties 86
a) Melting point 86
b) Retention factor determinations 87 ---_. -,
c) pH/thermal stability test 87 I
d) Ultraviolet light stability test 87
3.3.6 Microbiological properties 87
a) Minimum inhibitory concentrations 87
b) Effect of the antibacterial substance on growth of E. coli 88
3.3.7 Chemical properties 88
3.3.8 Spectral data (antibacterial substance) 88
a) Ultra violet/visible scans 88
b) Infra-red scan 89
xi i

Page No.
c) Mass spectrometry 89
3.3.9 X-ray crystallography 89
a) Solvent crystallization 89
b) X-ray data 89
3.4.0 THE EFFEcr OF MAGNESIUM SALT OMISSION 90 FROM THE MEDIUM RECIPE GROWTH
3.4.1 Cell propagation experiments 90
3.4.2 Atomic absorbtion measurements of Mg2+ in basal media' 90
3.4.3 Analysis of Mg2+ in cells of strain A grown in basal medium 91 and in Med A2
3.4.4 Viable growth CUIVes . 91
3.5.0 ANTIFUNGAL AcrIVITY STUDIES 92'
3.5.1 Elicitation of antibiotic production in liquid media 92
3.5.2 Preliminary testing of antifungal substance/s (Heat stability) 92
3.5.3 Pigmented inoculum experiment 92
a) Orbital incubation 92
b) Static incubation 93
3.5.4 Optimization experiments 93
a) Medium component single-deletion of medium q .93· "
b) Sodium nitrate variation 95.
c) Sucrose variation 98
d) Glycerol variation 99
e) pH variation 102
xiii
----~---.- - .
-------------------------------------------------
1) Agitation rate variation.
g) Temperature variation
h) Summary
i) Statistical error calculations
j) Scale-up fermentations
3.5.5 Isolation and purification of the antifungal principal
a) Determination of appropriate solvent system
i) Solvent for broth extraction .
ii) Solvent for TLC extraction
b) A check for purity
i) HPLC
ii) Gas chromatography
3.5.6 Microbiological properties
3.5.7 Spectral data
a) Ultravioletlvisible spectra
b) Infra-red spectra
c) Nuclear magnetic resonance spectra·
d) Mass spectrometry (antibacterial substance only)
CHAPTER 4: DISCUSSION/CONCLUSION
4.1 The microorganism
4.2 Antibacterial activity studies
4.3 The effect of magnesium salt omission from the medium recipe
xiv
Page No.
103
105
106
107
107
107
107
107
108
108
108
108
109
109
109
110
110
110
191
191
194
209

4.4 Antifungal activity studies
4.5 Conclusion and future trends
APPENDIX: TRACE ELEMENT COMPOSITION OF MEDIA CONSTITUENTS
a) Medium for antibacterial substance production
b) Medium for antifungal substance/s production
PUBLICATION:
BIBLIOGRAPHY:
xv
.. Page No.
211
223
226
.226
·226
227
229

--- -- - -- ------------------------------,
INDEX OF TABLES
TABLE 1.1 Some chemical modifications of PeniciIIins (P) and . Cephalosporins (C)
TABLE 2.1 Construction of media tested for antibiotic production
TABLE 3.1 Zone of inhibition results of muItidisk code V4 tested against strain A, strain B and a range of microorganisms
TABLE 3.2 Biochemical/tolerance test results of strain A and B, with 3 pseudomonads as control
TABLE 3.3 Mean generation times (min) of strain A, Band Ps. aeruginosa (control), growth in various constructed media to obtain respective chemically defined media
TABLE 3.4 Invasive growth inhibition of A. niger by strain A, B and other pseudomonads grown on PDA and on CDA
TABLE 3.5 Result of various media assayed for antibiotic activity
TABLE 3.6 Sequence of optimization experiments with corresponding factorial increases in production
TABLE 3.7(a) Summary of a simple scale-up optimization trial in the laboratory-scale fermentor (variation of agitation and aeration)
TABLE 3.7(b) Summary of a further optimization trial on optimal conditions achieved at table 3.7(a) (variation of time (day))
Page No.
6
37
111
112
116
116
118
137
137
137
TABLE 3.8 Retention factors of spots from active broth filtrates 141 . and fresh, uninoculated medium/control, obtained from analytical TLC elutions, viewed under V.V. light and charred
TABLE 3.9 Retention factor determinations of the antibacterial 142 substance, using a selection of solvent which cover a cross-section of solvent polarities
TABLE 3.10 The effect of pH/temperature on the activity/stability of the antibacterial substance, with increasing time (mins)
xvi
143

------------------------------------------~
Page No.
TABLE 3.11 The effect of V.V. light on the activity/stability of the 143 antibacterial substance, with increasing time (days)
TABLE 3.12 Minimum inhibitory concentration determinations of 143 the antibacterial substance, against a range of microorganisms, assessed by the agar diffusion assay
TABLE 3.13 Probable elemental ratios (empirical formulae) of the 147 antibacterial substance, as generated by the mass spectrometer data system
TABLE 3.14 Positional parameter and equivalent isotropic, 148 temperature factors arising from the X-ray diffraction' of the antibacterial crystal
TABLE 3.15 Bond lengths arising from the X-ray diffraction of the 148 . antibacterial crystal
TABLE 3.16 Bond angles arising from the X-ray diffraction of the 148 antibacterial crystal
TABLE 3.17 Atomic absorbtion measurements of Mg2+ 152 concentration in
a) SLR and AR basal media
b) SLR and AR basal media, previously inoculated with strain A, incubated for 20 mins, then membrane-filtered
TABLE 3.18 Sequence of optimization experiments with corresponding percentage increase in antifungal zone of inhibition
TABLE 3.19(a)
TABLE 3.19(b)
Summary of simple scale-up optimization trials in the laboratory-scale fermentor. (Variation of agitation and aeration)
Summary of further optimization trials . (variation of time (days» on optimal conditions achieved at table 3.19(a)
TABLE 3.20 Retention factor results for the active broth showing progress through a) first tier, b) second tier of the Azzalos and Issaq solvent system strategy, done on analytical TLC plates, viewed under U.V. light and charred.
xvii
178
178
178
179

- - - - -- -------------------~--------------------------------------
TABLE 3.21 Minimum inhibitory concentration de terminations of the antifungal antibiotic, AFl, against a range of microorganisms, assessed by the agar diffusion assay.
xviii
Page No.
183

INDEX OF FIGURES
Page No.
FIGURE 1.1: Structure of some representative antibiotics 8 showing quite a remarkable diversity in . molecular structures
FIGURE 1.2: A pie chart showing percentage distribution of 9 naturally occurring antibiotics and their sources
FIGURE 1.3: Schematic representation of the interplay 10 between the organism and its environment .
FIGURE 1.4: Secondary metabolite· (antibiotic) production 12 during the growth phase of microorganisms
FIGURE 1.5: Use of mutation and selection in the 18 development of improved penicillin producing strains of f. chtysogenum .
FIGURE 1.6: Schematic representation of a stirred tank 22 reactor
FIGURE 1.7: Column chromatography. Successive steps in 24 formation of chromatogram of green leaf pigments
FIGURE 1.8: Schematic diagram of a modern 24 chromatographic instrument
FIGURE 1.9: Structures of some Pseudomonas antibiotics 27
FIGURE 1.10: A photomicrograph of the mealy bug 29 Planococcoides njalensis from which Ps. antimicrohica was first isolated
FIGURE 1.11: ... A flowchart of the project 31
FIGURE 2.1: A Biolafette 6-litre laboratory-scale fermenter 47 in operation
FIGURE 2.2: A modified Aszalos and Issaq solvent system 50 flowchart, used to determine the appropriate solvent system for the active broth filtrate
FIGURE 3.1: An electron-micrograph of an individual cell of 113 strain A. negatively stained with PTA and photographed under TEM
xix

-- -----------------------------------
Page No.
FIGURE 3.2: Control for the selective medium experiment 113 showing growth of strain A and growth of Ps. cocovenenans on NA after 24 hrs at 37°C
FIGURE 3.3: Test of a selective medium showing growth of 113 strain A but no growth of Ps. cocovenenans on NA impregnated with sulphafurazole
FIGURE 3.4: Growth profiles of strain A, obtained from 114 comparison studies done, showing growth in basal medium(SLR) at pH 4.0; growth in basal medium (SLR) at pH 7.2 and growth in Med A2 (AR) at pH 7.2
FIGURE 3.5: Growth profiles of Ps. cocovenenans, obtained 114 from the comparison studies done, showing growth in basal medium (SLR) at pH 4.0, growth in basal medium (SLR) at pH 7.2 and growth in Med A2 at pH 7.2
FIGURE 3.6: Control for the comparison studies (acidophyly) 11S done, showing growth of strain A and of Ps. cocovenenans on NA at pH 7.2 after 24 hrs, at 37°C
--- _. FIGURE 3.7: Test for the comparison studies (acidophyly) 11S done, shoWing profuse growth of strain A and no growth of Ps. cocovenenans, on NA, at pH 4.0 after 24 hrs, at 37°C
FIGURE 3.8: Control for the invasive growth of A. niger after 117 7 days incubation at 30°C
FIGURE 3.9: Inhibition of A. niger invasive growth by strain 117 A after 7 days incubation at 30°C
FIGURE 3.10: Inhibition of A. niger invasive growth by Ps.cocovenenans after 7 days incubation at 30°C
117
FIGURE 3.11: Summation of growth profiles of strain A, 119 grown in the basal medium (SLR) MCSD experiment
FIGURE 3.12: Summation of antibacterial antibiotic 119 concentration/time profiles, produced by strain A in the basal medium (SLR) MCSD experiment
xx

Page No.
FIGURE 3.13: Summation of growth. profiles of strain A grown 120 in the basal medium (AR) MCSD experiment
FIGURE 3.14: Summation of antibacterial> antibiotic 120 concentration/time profiles, produced by strain A in the basal medium (AR) MCSD experiment
FIGURE 3.15: Summation of growth profiles of strain A, 121 grown in Med A2 of various percentage glucose concentrations (0.3 - 1.0%)
FIGURE 3.16: Summation of growth profiles of strain A grown 121 in Med A2 of various percentage glucose concentrations (0.0 - 0.3%)
FIGURE 3.17: Summation of antibacterial antibiotic 122 concentration/time profiles, produced by strain A in Med A2 of various percentage glucose concentrations (0.3- 1.0%)
FIGURE 3.18: Summation of antibacterial antibiotic 122 concentration/time profiles, produced by strain A in Med A2 of various percentage glucose concentrations (0.0 - 0.3%)
------ FIGURE 3.19: Summation of antibacterial antibiotic 123 concentration/glucose concentration profiles, produced by strain A in Med A2 at various times
FIGURE 3.20: Growth profile, antibacterial antibiotic 124 concentration profile and pH profile of strain A, grown in Med A2
FIGURE 3.21: Summation of growth profiles of strain A, 125 grown in Med A2 of various percentage NH.CI concentrations (0.06 - 0.3%)
FIGURE 3.22: Summation of growth profiles of strain A, 125 grown medium A2 of various percentage NH.CI concentrations (0.0 - 0.06%)
xxi

Page No.
FIGURE 3.23: Summation of antibacterial antibiotic 126 concentration/time profiles, produced by strain A in Med A2 of various percentage NH4CI concentrations (0.06 - 0.3%)
FIGURE 3.24: Summation of antibacterial antibiotic 126 concentration/time profiles, produced by strain A in Med A2 of various percentage NH4CI concentrations (0.0 - 0.06%)
FIGURE 3.25: Summation of antibacterial antibiotic 127 concentration/percentage NH4CI concentration profiles, produced by strain A in Med A2 at various times
FIGURE 3.26: Growth profile, antibacterial antibiotic 128 concentration profile and pH profile of strain A, grown in medium 1
FIGURE 3.27: Summation of growth profiles of strain A, 129 grown in medium 1 at various pHs
FIGURE 3.28: Summation of antibacterial antibiotic 129 concentration/time profiles, produced by strain A in medium 1 at various pHs
FIGURE 3.29: Summation of antibacterial antibiotic 130 concentration/pH profiles, produced by strain A in medium 1 at various times
FIGURE 3.30: Growth profile, antibacterial antibiotic 131 concentration profile and pH profile of strain A, grown in medium 2
FIGURE 3.31: Summation of growth profiles of strain A, 132 grown in medium 2 at various r.p.ms.
FIGURE 3.32: Summation of antibacterial antibiotic 132 concentration/time profiles, produced by strain A in medium 2 at various r.p.ms.
FIGURE 3.33: Growth profile, antibacterial antibiotic 133 concentration profile and pH profile of strain A, grown in medium 2 at 120 r.p.m.
xxi i

Page No .
.
FIGURE 3.34: . Summation of growth profiles of strain A, 134 grown in medium 2 (120 r.p.m.) at various temperatures
FIGURE 3.35: Summation of antibacterial antibiotic 134 concentration/time profiles, produced by strain A in medium 2 (120 r.p.m.) at various temperatures
FIGURE 3.36: Summation of antibacterial antibiotic 135 concentration/temperature profiles, produced by strain A in medium 2 (120 r.p.m.) at various times
FIGURE 3.37: Summation of growth profiles of strain A, 136 grown in medium 2 (120 r.p.m.) at various initial O.Ds.
FIGURE 3.38: Summation of antibacterial antibiotic 136 concentration profiles, produced by strain A in medium 2 (120 r.p.m.) at various initial O.Ds.
FIGURE 3.39a: Determination of an appropriate solvent system 138 for broth extraction using the Aszalos and Issaq solvent system strategy
--~----- -.. -- FIGURE 3.39b: Determination of an appropriate solvent system 138 for the liquidJIiquid extraction
FIGURE 3.40: Determination of appropriate solvent systems 138 for the liquidffLC extraction
FIGURE 3.41: Constructed flow chart for the isolation and 139 purification of the antibacterial substance, using a liquidJIiquid extraction route
FIGURE 3.42: Constructed flow chart for the isolation and 140 . purification of the antibacterial substance using
a liquidffLC extraction route
FIGURE 3.43: A chromatogram of an active concentrate of 141 solvent 1, derived from active broth, eluted with solvent 3 and as viewed under UV light
FIGURE 3.44: Antibiotic concentration/zone of inhibition log- 142 dose response calibration curve, used for quantitative assessment of the· antibacterial substance present in active broth filtrates
xxiii

- - - --------------------
Page No.
FIGURE 3.45: . The effect of mid-log phase antibacterial 144 . antibiotic MIC challenge against E. coli grown
in basal medium: microbistatic/cidal assessment
FIGURE 3.46: A uv/vis spectrum of the antibacterial, basal 145 medium broth filtrate'
FIGURE 3.47: A uv/vis spectrum of the purified antibacterial 145 substance, dissolved in UV ethanol
FIGURE 3.48: A KBr. disc infra-red scan of the antibacterial 146 substance
FIGURE 3.49: A high resolution mass spectrum of the 147 antibacterial substance
FIGURE 3.50: Molecular structure of the antibacterial crystal. 149 as generated by the X-ray diffractometer, from bond lengths and angles and from an atomic numbering scheme
FIGURE 3.51: Unit cell contents of the antibacterial substance 150 as generated by the X-ray diffractometer
FIGURE 3.52: (A) The 'effect of cell propagation on growth and 151
(B)
antibiotic production of strain A, from basal . medium, along:
i) a series of Med A2 (SLR) ii) a series of Med A2 (AR)
The effect of cell propagation on growth of Ps. aeruginosa from basal medium, along a series of Med A2 . (SLR)
FIGURE 3.53: Atomic absorbtion calibration curve used for Mg2+ assessment
FIGURE 3.54:
FIGURE 3.55: .
Viability of strain A grown in basal medium and in Med A2
Growth profile, zone of inhibition profile and pH profiel of strain A, grown in pDLM-l
xxiv
151
152
153
154.

- -------------------------------------------------------------------------,
FIGURE 3.56:
FIGURE 3.57:
FIGURE 3.58:
FIGURE 3.59:
FIGURE 3.60:
FIGURE 3.61:
FIGURE 3.62:
FIGURE 3.63:
FIGURE 3.64:
FIGURE 3.65:
FIGURE 3.66:
Growth profile, zone of inhibition profile and . pH profile of strain A, grown in PDLM-1 under static conditions
Summation of growth profiles of strain A, grown in the Med B1 MCSD experiment
Summation of antibacterial zone of inhibition/time profiles, produced by strain A in the Med Bl MCSD experiment
Summation of antifungal zone of inhibition/time profiles, produced by strain A in the Med B1 MCSD experiment
Summation of growth profiles of strain A, grown in medium 3 of various NaND! percentage concentrations
Summation of antibacterial zone of inhibition/time profiles, produced by strain A in medium 3 of various percentage concentrations
.. Summation of antifungal zone of inhibition/time profiles, produced by strain A in medium 3 of various percentage concentrations
Summation of antibacterial zone of . inhibition/percentage NaND! concentration profiles, produced by strain A in medium 3, at various times .
Summation of antifungal zone of inhibition/percentage NaND! concentration profiles, produced by strain A in medium 3, at various times
Growth profile, antibacterial zone of inhibition profile, antifungal zone of inhibition profile and pH profile of strain A, grown in medium 4
Summation of growth profiles of strain A, grown in medium 4 of various sucrose percentage concentrations
xxv
. Page No.
154
155
156
156
157
158
158
159
159
160
161

-- -----------------------------------------------------------
Page No.
FIGURE 3.67: . Summation of antibacterial zone of 162 inhibition/time profiles, produced by strain A in medium 4 of various sucrose percentage concentrations
FIGURE 3.68: Summation of antifungal zone of inhibition/time 162 profiles, produced by strain A in medium 4 of various sucrose percentage concentrations
FIGURE 3.69: Growth profile, antibacterial zone of inhibition 163 profile, antifungal zone of inhibition profile and pH profile of strain A, grown in medium 4
FIGURE 3.70: Summation of growth profiles of strain A, 164 grown in medium 4 of various glycerol percentage concentrations
FIGURE 3.71: Summation of antibacterial zone of 165 inhibition/time profiles, produced by strain A in medium 4 of various glycerol percentage concentrations
FIGURE 3.72: Summation of antifungal zone of inhibition/time 165 profiles, produced by strain A in medium 4 of various glycerol percentage concentrations
----_ .. ,. FIGURE 3.73: Summation of antibacterial zone of 166 inhibition/percentage glycerol concentration· -profiles, produced by strain A in medium 4 at various times
FIGURE 3.74: Summation of antifungal zone of 166 inhibition/percentage glycerol concentration profiles, produced by strain A in medium 4, at various times
FIGURE 3.75: Growth profile, antibacterial zone of inhibition ~ 167 profile, antifungal zone of inhibition profile and pH profile of strain A, grown in medium 5
FIGURE 3.76: Summation of growth profiles of strain A, 168 grown in medium 5 at various pHs
FIGURE 3.77: Summation of antibacterial zone of 169 inhibition/time profiles, produced by strain A, in medium 5 at various pHs
xxvi

FIGURE 3.78:
FIGURE 3.79:
FIGURE 3.80:
FIGURE 3.81: .
FIGURE 3.82:
FIGURE 3.83:
FIGURE 3.84:
FIGURE 3.85:
FIGURE 3.86:
FIGURE 3.87:
FIGURE 3.88:
FIGURE 3.89:
FIGURE 3.90:
Summation of antifungal zone of inhibition/time profiles, produced by strain A in medium 5 at . various pHs
Growth profile, antibacterial zone of inhibition profile and pH profile of strain A, grown in medium 5 at pH 3
Growth profile, antifungal zone of inhibition profile and pH profile of strain A, grown in medium 6
Summation of growth profiles of strain A, grown in medium 6 at various r.p.ms.
Summation of antifungal zone of inhibition/time profiles, produced by strain A in medium 6 at various r.p.ms,
Summation of antifungal zone of inhibition/r.p.m. profiles, produced by strain A in medium 6, at various times
Growth profile, antifungal zone of inhibition profile and pH profile of strain A. grown in medium 6 at 120 r.p.m.
Summation of growth profiles of strain A. grown in medium 6 at various temperatures
Summation of antifungal zone of inhibition/time . profiles, produced by strain A in medium 6 at various temperatures
Growth profile, antifungal zone of inhibition profile and pH profile of strain A. grown in medium 6 (120 r.p.m.) at 32°C
Growth profile, antifungal zone of inhibition profile and pH profile of strain A. grown in medium 6 (120 r.p.m.) at 37"C
. Determination of an appropriate solvent system for broth extraction, using the Aszalos and Issaq solvent system stragety
Determination of an appropriate solvent system for broth extraction using an array of solvent systems of high polarity
xxvi i
Page No.
169
170
171
172
172
173
174
175
175
176
177
180
180

Page No.
FIGURE 3.91: Flow chart arising from determination of 181 appropriate solvent systems for liquidfTLC extraction
FIGURE 3.92: Constructed flow chart for the isolation of the 3 182 . antifungal antibiotics using a liquid(fLC
extraction route
FIGURE 3.93: Stable zones of inhibition created by antifungal 184 antibiotic, AF1, against T. mentagrophytes
FIGURE 3.94: Stable zones of inhibition created by antifungal 184 antibiotic, AF1, against A. niger
FIGURE 3.95: Stable zones of inhibition created by antifungal 184 antibiotic, AF1, against f. chrysogenum
FIGURE 3.96: Stable zones of inhibition created by antifungal 185 antibiotic, AF1, against ~. aureus
FIGURE 3.97: . Stable zones of inhibition exhibited by 185' antifungal antibiotics AF2, but not AF1 and AF3, against C. albicans, after' 5. days incubation at 30°C
FIGURE 3.98: A uv/vis spectrum of antifungal antibiotic, AF1 186
FIGURE 3.99: A uv/vis spectrum of antifungal antibiotic, AF2 186
FIGURE 3.100: A uv/vis spectrum of antifungal antibiotic,AF3 186
FIGURE 3.101: An infra-red spectrum of antifungal antibiotic, 187 AF1
FIGURE 3.102: A 60MHz INMR spectrum of antifungal 188 antibiotic, AF1
FIGURE 3.103: An infra-red spectrum of antifungal antibiotic, 189 AF2
FIGURE 3.104: An infra-red spectrum of antifungal antibiotic, 190 AF3
xxviii

ABBREVIATIONS
General
AA Atomic absorbtion
Ab Antibacterial substance
ABl Antibacterial substance 1 "
AcOH Ethanol
ADP Adenosinediphosphate
Af Antifungal substance/s
AFl Antifungal substance 1
AF2 Antifungal substance 2
AF3 Antifungal substance 3
AMP Adenosinemonophosphate
AP Activator protein
AR Analar reagent
--~-.
kg Arginine·
ATCC American type culture collection
ATP Adenosinetriphosphate
cAMP Cyclic adenosinemonophosphate
CCR Carbon catabolite repression
CDA Czapek Dox Agar
CDLM . Czapek Dox Liquid Medium
CDM Chemically defined medium
CV Coefficient of variation
D.N.A. Deoxyribonucleic acid
xxix

-- -----------------------------------------------------
E.C. Energy charge
elm Electron/mass ratio
E.T.G. Electron transfer chain
EtOAc Ethylacetate .
FAD Flavin adenine dinucleotide
G.C. Gas chromatography
GDH Glutamate dehydrogenase
Gr Greek
GS-GOGAT Glutamine synthetase-glutamate aminotransferase
His
HPLC
IMI
IR
IJSB
IV
LDso
LVCC
Lys
MCSD
MeOH
Met
MIC
MR/VP
MS
NA
Histidine
High pressure liquid chromatography
International Mycological Institute
Infra red
. International Journal of Systematic Bacteriology
Intra venous
Median lethal dose
Log viable cell count
Lysine
Medium component single deletion
Methanol
Methionine
Minimum inhibitory concentration
Methyl redNoges-Proskauer
Mass spectrometer
Nutrient agar
xxx

NAD Nicotinamide adenine dinucleotide
NADH Reduced NAD
NADPH Reduced nicotinamide adenine dinucleotide phosphate
NB Nutrient broth
NCIB National collection of industrial bacteria
NCIB 9897 Strain 'A
NCIB 9898 Strain B
NCfC . National collection of type cultures
NCYC
IHNMR
NspA
NspB
OD
ONPG
Om
PABA
PDA
PDLM
PDLM-1
Phe
Pi
PrOH
PTA
QSAR
Rf
National collection of yeast cultures
Proton nuclear magnetic resonance
Neurospora Medium Agar
Neurospora Medium Broth
Optical density
O-nitrophenol beta D-galactopyranoside
Ornithine
Para amino benzoic acid
Potato Dextrose Agar
Potato Dextrose Liquid Medium
Potato Dextrose Liquid Medium of batch No. 15621497
Phenylalanine
Inorganic phosphate
Propanol
Phosphotungstic acid
Quantitative structure activity relationship
Retention factor
xxxi

R.P.M.
SLR
TEM
TLC
TIC
uv/vis
-- ._---------------------
Revolutions per minute
Standard laboratory reagent
Transmission electron microscopy
Thin layer chromatography
TriphenyltetracoIium chloride
Ultra-violet/visible _
xxxi i

------ ------------------------
Media used for optimization (Abbreviated nomenclature)
a) Basal medium
Glucose
omitted from the basal medium recipe
omitted from the basal medium recipe
omitted from the basal medium recipe
omitted from the basal medium recipe
omitted from the basal medium recipe
b) Czape.k Dox Liquid Medium - modified (Med q)
Magnesium glycerol phosphate
KC!
. Sucrose
Glycerol
Carbon source
MedB2
Optimization sequence
Medium I
. Medium 2
Medium 3
Medium 4
Medium 5
omitted from Med q recipe
omitted from Med q recipe
omitted from Med q recipe
omitted from Med q recipe
omitted from Med q recipe
. omitted from Med q recipe
omitted from Med q recipe .
Med A2·of 0.06% NH4C! concentration
Medium I at pH 6
:MedB8
Medium 3 of 0.05% NaN03 concentration
Medium 4 of 2% glycerol concentration
xxxiii
-MedAl·
.- MedA2
- Med A3
- Med A4
- Med AS
-Med BI·
- Med B2
- Med B3
- Med B4
- Med B5
- Med B6
~ Med B7
- Med B8
-- -_._._---------------,
CHAPTER 1
INmODUCflON

1. INTRODUCfION
1.1 The Pseudomonads
Organisms in the genus Pseudomonas (false unit; Gr) are mostly free-living
bacteria, widely distributed in soil and water and, in general, are so versatile that , . .
they have been known to multiply in almost any moist environment containing
trace amounts of organic compounds. While some are plant pathogens, a smaller
number is associated with specific diseases in man. The most important of this
latter group include Ps. aeruginosa (urinary tract infection), Ps. pseudomallei
(melioidosis) and Ps. mallei (glanders; MacFaddin, 1983). Ps. aeruginosa in
particular, is now becoming increasingly important as a source of general infection
and has also become an important pathogen among debilitated, burned and
immuno-compromised individuals. (Bennett, 1974; Bodey, 1983).
The Pseudomonads are Gram negative microorganisms, usually occurring as single
cells which are straight or curved rods but not helical. . Their dimensions are
generally 0.5-1 I'M by 1.5-4 I'M. They are, with rare exceptions, motile by polar
flagella and may be monotrichous or multitrichous. They do not produce sheaths
or prosthecae and no resting stages are known.
The metabolism of the genus is respiratory and never fermentative. Some are
facultative chemolithotrophs, able to use H2 or CO as an energy source.
Molecular oxygen is the universal electron acceptor though some can denitrify
using nitrate as an alternative acceptor in the presence of specific substrates.
Except for the latter, they are strict aerobes. They are catalase positive and with
the exception of Ps. maltiphilia are classically oxidase positive. The G & C
content of the· DNA of those species so far examined ranges from 58 - 70 moles
%. The type species is Pseudomonas aeruginosa (Palleroni, 1984).
Most pseudomanads morphologically resemble the enteric bacilli, the aeromonads
and the vibrios and tend to grow well in differential enteric media. Also, some
Pseudomonas spp. resemble and are often confused with members of the genus
Xanthomonas (MacFaddin, 1983).

There are strains which produce water-soluble, yellow green, fluorescent pigments
while others synthesize in addition, various type-specific phenazine pigments.
Many others however, are non-pigmented (Davis et ai, 1980). The Pseudomonads
are now. becoming increasingly important as producers of 'clinically useful'
antibiotics (Hunter and Baumberg, 1989).
1.2 Antibiotics: a general/historical approach
Antibiotics may be broadly defined as substances produced by living organisms
which kill or inhibit the growth of microorganisms. Most are secondary
. metabolites and are produced towards the end of the growth phase, in situations
where the cells have more or less stopped dividing. The role of the antibiotic in
the life-cycle of the producing organism may be manifold although not entirely
clear. They may be secreted during stressful competition with other organisms for
scarce/ depleting nutrients and this may give the producing organism a survival
advantage. It has also been postulated that antibiotics may inhibit those sites
involved in primary metabolism, in order to conserve cellular energy during the
stationary phase of the growth cycle (Khokhlov et ai, 1973). This to some extent
is supported by the observations that with some bacteria which are unable to
. produce secondary metabolites, the viability of the cells during the stationary
phase decreases relatively rapidly, suggesting an antibiotic function which may
result in maintained viability during the stationary phase (Edwards, 1980; Hara,
and Beppu, 1982; Nisbet and Porter, 1989). A further suggestion centres on the
fact that in sporulating antibiotic producing organisms, antibiotics appear at the
time of sporulation. Sporulation requires the de-novo synthesis of the spore coat
and is associated with the break down of the existing cell wall and with the
subsequent release of cell wall components (D-amino acids, novel sugars) which
. are similar in structure to many antibiotics. Hence it could well be that the
altered cell wall metabolism of sporulating organisms might provide the precursors
that results in the biosynthesis of many antibiotics (Davis et ai, 1980).
Although it was known for a long time that some microorganisms are capable of
producing antibiotics, this natural phenomenon was, in the past, merely viewed as
an interesting artefact with a hint of a potential therapeutic application. Thus
2
. i

when Alexander Flemirig in 1929, returning from holiday to his laboratory in St.
Mary's Hospital, made his famous observation on an old, contaminated culture
plate of Staphyloccoci, he was merely one in a long line of workers who had
noticed similar phenomena. It must be noted, however, that it was principally . .
Flemirtg's observationthat initiated events leading to the development of penicillin
as the first non-toxic antibiotic in the strict sense of the term. It must also be
noted, as has now. become clear from subsequent attempts to reproduce the
phenomenon, that the lysis of Staphylococci in the area surrounding a
contaminant Penicillium colony, as on Fleming's original plate, could only have
arisen by an extraordinary coincidence (Greenwood, 1983; MacFarlane, 1984). An
early glimpse was thus caught of the erratic nature of the antibiotic triggering
mechanism in microorganisms.
Although Fleming was hopeful about the possible therapeutic value of his
discovery, he was unable to purify and concentrate the substance. It was left to
the German biochemist, Ernst C.hain, working with Howard Florey, at the Sir
William Dunn School of Pathology in Oxford,. to obtain pure and stable extracts
of the penicillin. The extracts eventually obtained, which were thought to be pure
. but· later shown to contain less than' 1 % penicillin, were used in controlled
.' therapeutic experiments, first on mice then on men, with remarkably encouraging' . . . . . ... _-."
results (Chain et aI, 1940; Abraham et aI, 1941). From all this, it was indeed
fortunate that problems of serious toxicity arising from the. impurities were not
encountered at these early trials, as this might have resulted in the unfortunate
termination of the whole enterprise.
. Further development of penicillin in Britain was difficult because of the 2nd
World War, so Florey visited U.SA in 1941 to enlist the support of the American
authorities and drug firms. Once they were convinced of its potential, all research
on it became classified until after the war. During the war, progress was rapid
and by 1944 - 5, bulk production was in progress and the drug was beginning to
. become readily available (Hoover and Dunn, 1979; Greenwood, 1983). Although
.its chemotherapeutic properties were well known by 1940, it was five years later,
after intensive research effort by workers. at Sir William Dunn School of
Pathology, Oxford, and at both Merck and Pfizer pharmaceutical companies, .
3

U.S.A., directed towards purification and structure elucidation, using chemical
degraqation and x-ray crystallography, that its structure was finally established
(Florey et aI, 1949) .. Its spectrum of activity revealed it to be an antibacterial
agent, particularly effective against Gram positive bacteria ..
Antibiotics derived from soil miCroorganisms now became important and, in 1940,
Selman Waksman initiated a systematic search for non-toxic antibiotics, principally
from the Actinomycetes. This group includes Streptomyces spp. which was later
to yield many therapeutically useful compounds ... It has been postulated that
Waksman may have been influenced in his decision to undertake this study by the
then recent discovery by Rem~ Dubos (an ex-pupil of Waksman) of the antibiotic
complex tyrothricin, in culture filtrates of Bacillus brevis (Dubos and Hotchkiss,
1941). Like Dubos's tyrothricin, Waksman's first discoveries were far too toxic for.
systemic use although they included actinomycin (discovered in 1940 from
Actinomyces antibioticus; Waksman and Woodruff, 1940),a compound later used
in cancer chemotherapy. The first real breakthrough came in 1943 with the
discovery of Streptomycin, the first of the aminoglycoside antibiotics from a ..
fermentation broth of Streptomyces griseus (Schatz et aI, 1944). It was found to
have a spectrum of activity that neatly complemented that of penicillin by
inhibiting many Gram negative bacteria but more importantly at that time, it also
inhibited the growth of Mycobacterium tuberculosis, the. causative organism of
tuberculosis (Greenwood, 1983).
Between 1945 and 1948, Giuzeppe Brotzu of Sardinia, whilst investigating the
. microflora of sewage outflow in the hope of discovering naturally occurring
antibiotic substances, isolated a species of cephalosporium (Brotzu, 1948). This
displayed striking inhibitory activity against several bacterial species including
Salmonella ttohimurium which was at that time considered beyond the reach of .
penicillin. Lacking the means to proceed further, samples were dispatched to the
. Sir William Dunn School of Pathology at Oxford where two antibiotics were
reported to be isolated (Greenwood, 1983). They were called cephalosporin P
and cephalosporin N because the former inhibited Gram positive organisms such
as Staphyloccoci and Streptococci whilst the latter was active against Gram
negative organisms such as Escherichia coli and SalmoneIla ttPhimurium. As it
4

. turned out, neither of these substances was a cepholosporin in the sense that term
is used today: the cephalosporin P fraction proved to be a mixture of 5 antibiotics
(PePs) with steroid like structures (Crawford, et aI, 1952; Burton and Abraham,
1951; Burton et aI, 1956) and cephalosporin N turned out to be a penicillin
(adicillin) (Abraham et aI, 1953; Abraham and Newton, 1954; Abraham et aI,
1954). The forerunner of the cephalosporin now in use, cephalosporin C, was
detected later by Abraham and Newton as a minor component on fractionation
of cephalosporin N. (Newton and Abraham 1955; Newton and Abraham 1956).
It was also apparently present, in minor quantities, in the original fermentation
. mixture.
Overall, it was the appearance of Streptomycin which really triggered the general . hunt for naturally occurring antibiotics and when the pharmaceutical companies
joined the chase, soil samples by the thousand, from all over the world, were
screened for antibiotic producing microorganisms. Subsequently, hundreds of
antibiotic substances were discovered and rediscovered. Although most failed
preliminary toxicity tests, by the mid 1950's representatives of most of the major
families of antibiotics, including the aminoglycosides, chloramphenicol, tetracycline
and the macrolides had been discovered. Indeed it has been argued that by 1960,
practically all the antibacterial agents required by modern medicine were known
(Greenwood, 1983).
New antibiotics, however, keep cropping up in unusual places and it is now
apparent that discoveries of important novel bioactive compounds often depend
upon the development of strategies for the isolation and characterization of novel
and rare microorganisms. (Nolan and Cross 1988). It has to be emphasised
nevertheless, that since 1960, only a very few truly novel antibiotic substances have
been discovered and the rate of discovery has been falling. Furthermore, with
regard to discoveries made over the last 20 years, clinical success rate has dropped
from 5% to less than 1% (Primrose, 1987).
In contrast to the above situation, a surprising number of naturally occurring
antibiotic substances, displaying molecular variations on established antibiotic
structures, have recently emerged and these include a total number of 20
5

Position
I . 2·P
Z·C
2·". i3 3-C 3'
3P."C
5P.6C
penicillins, 20 actinomycins, 10 polymyxins, 10. bacitracins and 3 neomycins
(Primrose, 1987).
An important alternative approach to obtain new antimicrobial agents has been
to . modify the chemical structures of existing antibiotics and thus obtain
compounds with enhanced active properties. Here, a rationale based on
quantitative structural activity relationships (QSAR) is used (Nogrady, 1988).
Previously active compounds which have now been made obsolete by resistant
strains may also be given a new lease of life with this approach and on this point,
QSAR has proved most successful with the penicillin and cephalosporins where
numerous semi-synthetic derivatives exist. (Flynn, 1972). Table 1.1.
Table 1.1:
From"
5 ICH,): H,
H
Some Chemical Modifications of Penicillins (P) and'
Cephalosporins (C); after Hoover and Dunn, (1979).
Si CH,Q
'.-¥ -.v p- L~-j;CH,jl ~. ~
To
so. SO,. SCH, H, =CHSAr: H. OAc: H. CH,: CH,. H: =CH,: Br. CH,Br:
H. CH,SR: CH,SR. H: =CHSR: =0. OAc. Br. OCH.
CH,OAc CHO. CO,H.-.=CH,I. OH. OR. Cl. F. :->H,. :'<HCOOR OAc
CO,H
H
H. OH. OCOR. OR. SR. :--IC,H,X. S,O,Na. :'oi" :'oIH,. C:--I. SO., CH,. S,C=NHII<'R,. SiC=S·,:'oIR,. SiCS,OR. SCOR. SO,Ar. Br. OCONH,. OCONHR. S·hetorocycle. ",CS. Ar. heteroc::cle
H. CO,R. CO,CH,OCOR. CONH,. CO,OCOR. CONHCHI RICO,H. CO,SiR •. CO:'i,. CH:OH. CH,CO,H. ·::OCH:'oI:. COCH,CI. C:"l. retr:J.zole
CH,.OCH, 6·/3·P.7·13·C RCONH H. "'H,. R'CO:'iH. R':--I-CH=:-I .. "'rC=:-I. R,:'i. R.'1H. RSO,:-IH.
R.PONH. R:--<HCONH. R:--IHCS:--iH, KOCO!'H. RCOO. RCOCH,. RCONI"'H .. '
6·",·P.7·",·C H CH,. OCH;. RCONH. :'-IH,. Cl. OH. OCOR. CH:OH. CH,CI. CH:F. CH,NH,. CH,CH,C:'oI. SCH,. (H,COOCH,. CH,M. CO,H. CH,COAr. CHIOHlle..".,. NHCOOC,H! =s 7·?8·C =0
Medicinal chemists and chemotherapists have also been active in exploiting the
antimicrobial potential of fully synthetic substances, although as yet only a very
small number have been devised by premeditated attack on known biochemical
pathways. Of the antimicrobial drugs presently used therapeutically, only the
6

diaminopyrimidines, trimethoprims and pyrimethamines really fall into this
category (Greenwood, 1983). An example of others under development and study
is a family of amino acid derivatives (at present under investigation by Hoffman
La Roch), one of which is alaphosphin (L-alanyl-L-amino-ethylphosphonic acid),
a synthetic cell wall attack drug (AlIen et ai, 1978). Other established synthetic
antimicrobial agents intended for chemotherapy include the nitrofurans, the
quinolones, the imidazoles, the naphthyridines (and related compounds of the
nalidix acid type) (Greenwood, .1983). The underlining motive of the researchers
has always been selective toxicity by which the drug specifically targets the .
invading pathogen whilst leaving the host cells unaffected.
Without question, the appearance in the late 1930's and early 1940's, of potent,
non-toxic, antimicrobial agents, selectively active against bacteria, revolutionised
the treatment of infection. Indeed the discovery of the. first 'miracle drugs' the
sulphonamides, penicillin and streptomycin was declared by some to herald the
disappearance of bacterial infection as a disease entity of any importance
(Greenwood, 1983). At present, with over 50 years hindsight and hundreds of
chemotherapeutic agents available for use, a more modest and dispassionate view
of the benefits and limitations of antimicrobial drugs is possible:
1. . bacterial pathogens have not been eradicated by chemotherapeutic agents
and many now show a remarkable resistance to them;
2. the pattern of bacterial disease, particularly hospital-acquired infection has
altered considerably, mainly due to new operation procedures,
instrumentation techniques and treatment regimens which tend to severely
compromise the patients·own capacity to withstand infection;
3) the use of antibiotics often disrupts the delicately balanced bacterial flora
of the body, allowing for the proliferation of resistant species and
sometimes initiating potentially more serious new infections;
4) no antibacterial drug is entirely free from deleterious side-effects and as
such, the use of these agents has its own attendant risks.
Finally, it should be borne in mind that most successes in the battle against
diseases have tended to be limited to the treatment of those caused by bacteria
and that those other numerous infections caused by viruses, protozoa, helminths
7

--.. ---c----~------------------------
and fungi are, \Vith some notable exceptions (imidazoles with candidal infections,
nitroimidazole with protozoan infections), less amenable to chemotherapy.
1.3 Sources and Production of Antibiotics
. To date, the total figure of antibiotics so far· discovered is well over 2,500 and the
diversity of molecular structures is immense (Fig. 1.1). Many are produced as
mixtures of related compounds (Berdy, 1974; Primrose, 1987; Berdy,1988). The
majority are produced by the Actinomycetales, accounting for over 58%. This
group contains ten classes of which· three are of importance· as antibiotic
. OH CH,OH 0 . ~II 11
NO,~CH-CH-NH-C-CHCI, HO
CH, CH,
01H H'~ OH. OH
Chloramphenicol COOH o OH OH OH OH 0 OH
Amphotericin 8
H,C, ..... CH,
~'" H,C CH, ..
o ~... H H"yC 05CH,
CH, ... ~_~OH . . 0 CH,
CH, I CH,
H OH
NHCNH, Erythromydn
OH H OH " H. NH
Streptomycin
OH . 0 . CONH,
OH 0 0- " . ,,5, .... CH, . ~ A CH,-C-NH:- TH-TH T ...... CH,.
. O=C-N--CH-COOH
Fig. 1.1:
" Tetracycline Penicillin G
Structures of some representative antibiotics showing quite· a
remarkable diversity in molecular structures (After Primrose, 1987).
8

------- -- --------------------------,
producers and ofthese three, the Streptomycetes is clearly the most significant;
Fungi also produce a large number of antibiotics, contributing approximately 18%
of the total and here, the sole group responsible is the· Aspergillales. True
bacteria are also significant producers, yielding almost 9% of all antibiotics and
of these,· the two families Bacillaceae and Pseudomonads predominate. The
remaining bacteria produce only a very small number of antibiotics. Other
antibiotic producers include the higher plants, with 12% and algae, lichens and
animals, all together producing 3% (Edward, 1980; Hunter and Baumberg, 1989;
Fig. 1.2).
ACTINOMYCETALES ___
(Streptomyces)
58%
_ FUNGI --'-1-:8%~ (Aspergi llales)
__ - BACTERIA 9% (Bac i 11 aceae and
Pseudomona )
----OTHER SOURCES
Fig. 1.2: A pie chart showing percentage distribution of naturally occurring antibiotics and their sources.
The elicitation and consistent production of secondary metabolites such as
antibiotics and pigments has been revealed by many workers to be one of the
most erratic of all phenotypic properties of microorganisms (Holliman, 1961;
Hellinger, 1951). Antibiotic and pigment production are often linked and may in
many cases be acutely sensitive to anyone of, or a combination of, variations in
pH, time, temperature, aeration (oxygenation) nutrient/trace element
concentration and inoculum level (Goodhue et aI, 1986; Fig. 1.3).
9

Carbon and energy Oxygen sources ._-_ .. ----.---. -~ ___ , ____ . ___ _ other nutrients ' /" + _ ~
A9ito~ Aerotio~ )lSure
1'~,uPpIY I , C02 -remoyol- -----,1 Lt fEl~.;;;;;;;;jjt =Rheology'..; ---.=.'=-_____ Temperoture
~" rJ ~--------l conce,ntration .~ ~ ?hOI0
9y
Fig. 1.3:
L, __ -'-____ .. Production _----------1 Schematic representation of the interplay between the organism and
its environment. (After Hutter et al. 1978)
For example, Jamieson (1942) using tap water of lake origin in the preparation
of his media,ended up after culturing,with blue green pigments from organisms
'he had previously considered to be Achromobacterspp. Even cultivation, in '
, media containing proteose-peptone which is known to enhance pigmentation
(McCombie and Scarborough, 1923; Wrede, and Strack, 1924; Elema and
Sanders, 1931; Swan et aI, 1957), when prepan~dwith distilled water, had failed
toyield pigment and this therefore suggested that it was the trace elements in the
lake water that may have initiated pigment production. He consequently
recommended a modification of the classification of the microorganisms by
suggesting they be placed under Pseudomonas spp. (SW"" ~,1~5})
Schoental (1941) and Young (1947) also found that no pigmentation was
produced from the pigment producer, Ps. reptilovora,. in 'media containing over
1 % glucose: the'inhibition being attributed to the production of excess acid.
del-Rio et al (1972), whilst investigating the optimal conditions for the production
of antimicrobial substances from Ps. reptilovora, found that not all the commercial
peptones employed in the optimal medium gave the same antibiotic yield. They
further found that when different batches of thesame kind of peptone was used, ,
a marked difference in antibiotic activity was observed. Atomic absorption
spectroscopy of the iron, manganese, zinc and copper content (trace metals) of
10

the commercial peptone and peptone-like products showed a remarkable
difference in the copper content between peptones which gave good antibiotic
yields and those which inhibited production. Copper was subsequently shown,
during the same investigation, to be directly associated with the antibiotic, YC-73,
also known as fluopsin (Fig. 1.9).
It has been noted that though antiboitic production may readily occur when a
producer organism is grown on solid medium, when grown in an equivalent liquid
medium (minus the agar) very little or no antibiotic production occurs (Holliman,
1961). The explanation for this may be that on solid media, colonial growth, in·
most cases, creates extreme conditions where availability of nutrient in the agar
in the immediate area is soon exhausted. This is especially so for cells near and
around the centre of the colony where diffusion of nutrients from the agar to the
uppermost cells in the colony is limited and where waste products do not readily
diffuse away and therefore accumulate in the colony and in the agar beneath
(Frobisher, 1959). Such adverse conditions, (coupled with availability of the
required nutrients/trace elements) may stress the organism, triggering certain
metabolic pathways associated with antibiotic production. In thewild this would
be a useful survival advantage in face of keen competition. The stress
factor/triggering hypothesis may go some way to explain why antibiotic/pigment
production is more difficult to elicit in . liquid cultures in which such extreme
conditions are not readily found. It may also help to explain why in those liquid
. media capable of supporting antibiotic production, production usually occurs late
in the growth cycle (idiophase) where conditions of stress become prevalent (Fig.
1.4). The terms 'trophophase' (growth phase) and 'idiophase' (production phase)
were first coined by Bulock (1961, 1967) during batch mode studies of antibiotic
production in submerged cultures.
11
-- - - -- - --- < --I
I

-- -- -- --- --------------:----------------
Fig. 1.4:
No, of cells per ml culture
A
c o
I I I I
Time
Secondary metaboIite (antibiotic) production during the growth
phase of micoorganisms. The shaded area represents the zone of
secondary metabolite production. A indicates the lag phase; B
indicates the logarithmic (log) or exponential phase (trophophase);
C indicates the stationary phase (idiophase); D indicates the decline
or death phase (After Edwards, 1980).
A school of thought exists (Davis, et aI, 1980) which disagrees with the notion that
stress factors necessarily trigger antibiotic production thereby challenging the
subsequent inference of a survival advantage for antiboitic producers. The main
reasons cited are as follows:
1) antibiotic producing organisms constitute only a tiny fraction of the
microbial population in soil samples and thus do not appear to have a
striking advantage;
2) The strains found in nature excrete only small amount of an antibiotic;
heavy excretion is an artefact dependent on selection of regulatory
mutants;
3) Antibiotics appear only after growth has ceased rather than during
competition for growth. _
At first glance these 3 points may appear quite valid but dealing with each point
in numerical order, a deeper analysis may suggest alternative explanations:
12

-- .----------------------------~------------------------------------
1) in the wild, normal soil environments may contain such an over-abundance
of essential nutrients (PeppIer, and Perlman, 1979; Reed, 1981; Goodhue
et aI, .1986) that true conditions ~of stress needed to trigger antibiotic
production may in fact be rare,
2) . as already discussed above, antibiotic. production is markedly enhanced
when a microorganism is grown on solid medium as opposed to when
grown in an equivalent liquid medium and it therefore seems that there
may be a need to stress the wild-state organism in order to enhance
production (HoIIiman, 1961);
It should also be noted here tliat having developed an optimized medium
and conditions for antibiotic production for a wild-type strain, growth of its
mutant under the same conditions might well result in Iow to zero yields
(Calam, 1986). AIl this suggests that in the wild, conditions must be just
right before any significant excretion can take place;
3) although point 3) above, subscribes to conventional ideas of antibiotic
production, this may not necessarily be true for all cases as pf9aue~iBR
production can also occur during the trophophase where antibiotic
p~oduction can be triggered quite early on (Demain, 1986; Vining et aI, .
1986; Doull and Vining, 1988). Furthermore, it can be argued that
triggering, occurring just before entry into stationary phase (idiophase) , ".
supports the contention of stress factor elicitation as adverse conditions
becQme more prevalent here due to depleting nutrients/trace elements and
increasing toxic end-products.
To date the stress-factor associated, survival-advantage role of the antibiotic in
nature, remains controversial and some contemporary writers, though clearly in
support, tend to handle it hypothetically (GottIieb, 1976; Katz et aI, 1977; Martin
and Demain, 1980). It is important to note that a survival advantage has already
been clearly demonstrated in Cephalosporium gramineum (Bruehl, et al 1969).
13

A study of how nutritional factors affect antibiotics production is important in any·
yield· improvement study. It is well known that a carbon source is essential for
growth and can provide a source of energy required to drive the cell's metabolic
processes. It has also been noted that at the earlier growth stages of some
antibiotic producing microorganisms, a direct relationship exists between cell mass
and lowlevel antibiotic production (Shehata et aI, 1971). However, as the carbon
source concentration is further increased, antibiotic production and growth may
became depressed via the processes of carbon catabolite repression and substrate
inhibition (Young, 1947; del-Rio et aI, 1972; Bushell, 1989).
Much work has been published on carbon catabolite repression (CCR) as it .
affects antibiotic production (Gallo, et al. 1972; Aharonowitz, et aI, 1978; Revilia,
et ai, 1984; Lebrihi, et ai, 1988) and it has been suggested that CCR in some
microorganisms involves Cyclic adenosine monophosphate (cAMP) as a positive
effector (Pastan et aI, 1976). In antibiotic production, cyclic AMP is thought to
interact with a cAMP receptor protein (activator protein) to form a complex
which binds to the promoter sites of operons coding for inducible enzymes. These
enzymes then go on to activate gene transcription leading to the production of
antibiotic biosynthetic enzymes. High levels of cAMP in many organisms tends
to increase antibiotic production. For example, the addition of cAMP to
Streptomyces kanamyceticus cultures has been reported to relieve the glucose
repression of kanamycin production: apparently acting on kanamycin synthetase
repression (Satah, et ai, 1976). Increasing tylosis production by mutational means
in Streptomyces fradiae resulted in a 20 - 50% increase in intracellular cAMP
levels. (Colombo, et ai, 1982). However, evidence against a lac-operon-like
. system comes from observations of non-reversible glucose repression by cAMP in
actinomycin producers (Brown, et ai, 1983). Furthermore, the rise and fall of
cAMP levels during the course of batch culture is also inconsistent with a lac
operon-type model and it has therefore been suggested by Demain (1986) that
carbon source repression in Streptomyces species may in fact be operated by a
completely different mechanism, possibly involving glucokinase or its catabolic
products (Demain, 1986; Lebrihi et ai, 1988). It should be noted that no
molecular level evidence has yet been presented to confirm repression of the
14

-- ------------------------:----------------
transcription of genes coding for inducible enzymes by glucose mediated cAMP _
reduction.
Another nutritional factor of importance in antibiotic production is nitrogen, also
essential for cell growth as it is used to build up amino acids, nucJeotides -and -
hence essential proteins. It has been observed that low nitrogen concentrations
in a medium may significantly increase the antibiotic production whereas high
concentrations decreases production. To explain this, Aharonowitz (1980) has
suggested a form of ammonium repression of secondary metabolic productioD<
which occurs in many cultures where the ion is present in excess. He also
observed two mechanisms under ammonium assimilation in Streptomyces
clavuligerus cultures (Aharonowitz, 1979): a high affinity glutamine synthetase
glutamate aminotransferase (GS-GOGT) enzyme system which operated under
ammonium limitation, and glutamate dehydrogenase (GDH) which was very active
during ammonium excess. He revealed that high cephalosporin rates coincided
with peak GS-GOGAT activity whereas high rates of ammonium assimilation
decreased the production rate. Similar effects have _ been observed in
Streptomyces cattleya (Wax et aI, 1982)) and in Streptomyces venezulae (Vining
. and Chatterjee, 1982). Finally, Shapiro and Vining (1983) also suggested that
GDH and or GS-GOGAT may indeed be linked to a system for repressing
secondary metabolism. -How this system actually works at the molecular/genetic
level remains unresolved. -(Bushell, 1989).
Phosphorus has a role in the cell's energy metabolism and is present in ATP,
NAD and FAD. It is also a constituent of nucleic acids, phospholipids and
nucJeotides, (van Demark, 1986). -Phosphates are also known to regulate_
antibiotic production in many organisms and. an excess can often depress
production. -Two mechanisms have . been proposed to account for this:
repression/inhibition of biosynthetic phosphatases and indirect regulation via
adenosine phosphates which may act as intracellular effectors (Janglova, et aI,
1969; Madry, et al 1979).
-There has been for some time, controversy about which parameter is, in fact; the
intracdlular effector that governs antibiotic biosynthesis .. For example, Atkinson
15

I
I
~-- -~-----------:----------
et al in 1969, proposed an energy charge (E.C.) definition which they maintain
is the regulatory parameter governing all energy utilization/generating pathways
E. c. = ATP + V, ADP ATP+ADP+AMP
.This view however has not been universally accepted (Purich et ai, 1973; Curdova
et ai, (1976). According to Rickenberg (1974) and Bu'Lock (1974), synthesis of
secondary metabolites may well be regulated by cAMP which may be the
fundamental intracellular effector. Again, this view is not well established as
cAMP has not been reported in the Actinomycetales nor the bacilli (Rickenberg,
1974; Hanson, 1975). Finally, both Behal et al (1969) and Martin (1977) have
proposed that intracellular levels of NADPH is the limiting factor in antibiotic
biosynthesis, especially during idiophase.
To date, existing models to explain the regulatory mechanisms of antibiotic
production remain ambiguous in parts (Aharonowitz, 1980; Martin and Demain,
1980; Hunter and Baumberg 1989).
Unlike primary metabolites, such as amino acids, secondary metabolites became
important as products, at a time when little was known about their biosynthetic
pathways and this ~ greatly hamp~red efforts to increase yields by specific
addition/deletion techniques (Primrose, 1987). Even ~oday, details of antibiotic
biosynthesis in many organisms still remain unresolved (Nisbet and Porter, 1989).
One of the techniques (nutritional approach) involves the screening of hundreds
of nutrient additives as possible precursors of the desired product. Occasionally
a precursor is identified that increases production of the secondary metabolites:
an example being the addition of a-aminoadipate which stimulates penicillin
production (Baldwin et ai, 1987). Alternatively, the precursor may direct the
formation of one specific product (directed biosynthesis): an example being the·
addition of phenylacetic acid which promotes the formation of benzylpenicillin
over other penicillins (Primrose et ai, 1987).
Another technique involves a mutational approach and this is based upon the fact
that the. primary determinant of antibiotic type and of product yield, is the
16

organism itself. Consequently a major consideration is strain development in
, which random and induced mutation, fol1owedby selection procedures, are used
to obtain a superior antibiotic production strain. Mutants may be obtained via a
variety of means including X-ray and U.V. light bombardment, application of
mutagenic drugs (Fig. 1.5), continuous subjection to normal drugs at sub-MIC • • -f.
(minimum inhibitory concentration) levelsand the reaping of cells found growing
as secondary colonies on top of senescent colonies (Frobisher, 1959; Greenwood, c,
1984; Primrose, 1987).
Altogether, both nutritional and mutational approaches have been quite successful
but investigations into these can be quite labour and time intensive. Occasionally
they can be combined: for example, where addition of an amino acid has been
shown to be stimulatory, mutational efforts are focused on removing regulatory
controls on the biosynthesis of that amino acid.
Although, in general, research into mutational and selection procedures has been
hampered by lack of information on both the biosynthetic pathways for antibiotic ,
production and on pathway regulation, selective recombinant DNA technology has
recently been successfully exploited. Here, genes controlling entire biosynthetic
pathways can be cloned and the DNA sequenced. This will permit identification
of the number of gen~s i~~olved and would aiso be a good indicator' of the
, number of biosynthetic steps in the pathway. By deleting one or more of the
genes in the pathway, intermediates would accumulate and these can be identified
by conventional analysis. In this way, a clearer picture of the biosynthetic pathway
can be built up which reveals the normal regulatory circuits of the biosynthesis.
To enhance productivity, detrimental regulatory circuits can be eliminated and
additionally, some of the cloned genes can be placed under the control of a known
promoter (Primrose, 1987).
If genes involved in antibiotic biosynthesis are to be cloned, then methods for
their selection are required and here, a number of ways have been developed.
One method is illustrated by candicin biosynthesis in which a key step is the
conversion of chorismate by the enzyme P ABA synthetase. Cloning of the gene
for this synthetase was facilitated by the availability of a, direct selection method
17. I
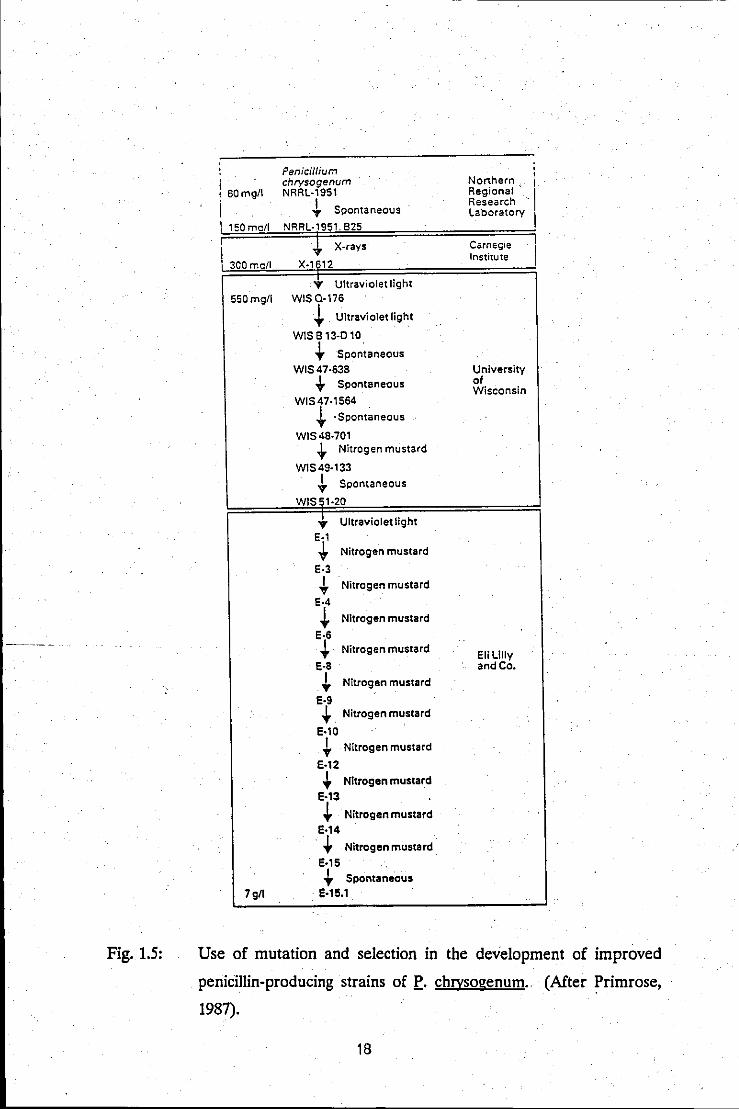
------
Fig. 1.5:
Penicillium i chrysogenum Northern. ! 60 mgll NRRL-1951 Regional
i I Spontaneous Research
I "I' Laboratory 1 150me/l NRRL-1951,825 I t X-rays Carneo;ie
X-"'2 Institute
300 me/l
T Ultraviolet light
550 mgll WIS 0-176
~ , Ultraviolet light
wise 13-0 la
+ Spontaneous
WIS47-638 University
.t Spontaneous of Wisconsin
WIS47-1564
~ ·Spont~neous WIS48-701
~ Nitrogen mustard
WIS49-133
~ Spontaneous
WIS51-20
... Ultraviolet light
E-l
t Nitrogen mustard
E-3 I Nitrogen mustard "I'
E-4
~ Nitrogen mustard
E-6
+ Nitrogen mustard EIiLilly •
E-8 and Co.
+ Nitrogen mustard
E-9
+ Nitrogen mustard
E-l0
+ Nitrogen mustard
E-12
+ Nitrogen mustard
E-13
+ Nitrogen mustard
E-14
+ Nitrogen mustard
E-1S
{- Spontaneous
7911 E-1S_l
Use of mutation and selection in the development of improved
penicillin-producing strains of f. chrysogenum., (After Primrose,
1987).
18

using the restoration of P ABA Independence to a strain requiring P ABA for ..•
· growth (Gil and Hopwood, 1983). A second method involves the isolation of
mutants, which no longer produce the desired antibiotic and the identification of .
DNA fragments which then restore antibiotic synthesis (McAlpine et aI, 1987) ..
The third method is to determine whether the genes for antibiotic synthesis are
plasmid borne, as is the case of methylenomycin (Chater and Bruton, 1983;
Kinashi et aI, 1987) and if so, this would facilitate their subsequent manipulation.
Finally, another method relies on the fact that an antibiotic producing organism .
· has to be resistant to its own antibiotic otherwise it would be self limiting. Here,
in some cases, the genes specifying antibiotic resistance are linked to those
specifying antibiotic production. For example, Streptomyces IiVidans is not known
to produce any antibiotic related to erythromycin but when the Streptomyces·
erythreus gene for erythromycin resistance was cloned and transferred to it, s.. Iividans became an erythromycin producer (Stonzak, 1986).
· Just as novel proteins can be produced by recombinant DNA techniques, so can
novel antibiotics. The Streptomyces coelicolor gene cluster which is responsible
for the biosynthesis of the isochromanequinone antibiotic, actinorhodin, has been
cloned. When the cloned genes were introduced into a variety of other
Streptomyces spp., producing different isochromanequinones, at least three new .' ,.. -- .
antibiotics were detected. Actinorhodin or one of its precursors, thus appears to·
be a novel metabolite in these other Streptomyces spp, and is subject to further
or different enzymatic modifications (Malpartida and Hopwood, 1986).
A similar approach is used in the synthesis of (j-Iactam antibiotics in which a key ..
step is thecyclization of a tripeptide precursor. When the purified enzyme is fed
novel tripeptides, novel (j-Iactams are produced (Pratt, 1989).
1.4 The fermentation process
Shake culture is an aerated process which represents an important microbiological
technique and provides . a convenient· method of growing microorganisms in
submerged culture' (Calam, 1986). Generally, such aerated processes are
19

I
colloquially known as fermentations though sensu strictu, fermentation is a
biological process occurring in the absence of air (Primrose, 1987).
The shake culture method began to emerge in the 1930's and developed with the
rise of the' antibiotic industry as a small-scale testi~g method for ~edia
optimization in laboratory cultures (Calam, 1986). In industry, shaken cult~res are'
often used for the initial stages of inoculum production (Drew, 1981) and in cases
where it is aimed at screening or yield improvements, rather than at theoretical
studies, complex media are, used. With complex media, growth is at first rapid,
becoming visually apparent after approximately 24 hours for fungi and after
approximately 12 hours for bacteria. After this, the growth rate reduces at cell
concentrations of 10 to 30 gm/litre and this occurs after 5 - 7 days for mycelial
microorganisms and after 24-48 hours for bacteria. Product formation may also
begin 1 - 3 days after inoculation and continue for 3 - 4 days or more. The
duration of production may depend upon the number of viable cells present, the
pH, toxic end-products and product stability ..
The composition of the complex medium used (which could later be translated
to larger scale fermentations) is based on carbohydrates, various proteinaceous .
materials, vegetable oils and a few inorganic salts. During the fermentation, the - ,-.-'
medium components are metabolised at different rates and this provides a long
period during which conditions become. suitable for optimal growth and
metabolism (Calam, 1986). A simple chemically defined medium is however
preferred for studies on the physiology, biochemistry and regulatory mechanisms
of the producer organism, since it minimizes the probability of complicated
interactions between components of more complex medium fermentations.· The
composition of such a medium would, typically, have a specific basis of
carbohydrates, ammonium ions, phosphates, metal salts and vitamins (where
applicable), all of which are deemed essential for antibiotic production (Williams
and Katz, 1977; Greasham and Inamine, 1986;).
The shake and stirred fermentor culture techniques are two important examples
of the generalised technique of submerged culture. Both are much used and
involve aeration and agitation. They are extensively used with filamentous
20

microorganisms. The growth of the cells and the production of metabolites
involve a number of cellular processes such as the dissimilation of substrate
carbohydrates, the formation of intermediates and the generation of energy.
Results can be affected by the pattern of aeration and agitation, the characteristics
of the cells themselves, their efficiency and productivity and their response to
conditions in the fermentor. In the stirred fermentor culture where air is bubbled
through, the consequent agitation stirs and mixes the medium thus enabling
uptake of oxygen by the medium, mainly via diffusion from the air bubbles.· In the
shaken culture on the other hand, the medium obtains oxygen largely by direct
absorption from the air as the culture swirls around the walls of the flask in a thin
layer of large surface area (Calam, 1986). When 100 ml of medium in a 500 ml
flask is incubated in a rotary shaker, oxygen uptake rates of 0.3 to 9.5
mmol/litre/min can be achieved depending on the type of flask used (Miller,
1986). Overall, shaken flasks give much better growth and production than could
be expected from the rate of oxygen uptake (Cooper et aI, 1944) and this may be
due to the fact that there is less. shear stress than in the stirred fermentor
situation.
Differences in agitation and aeration between shakers and stirred cultures tend
to create different metabolic patterns which in turn can give rise to different yields
of the desired product. Mutants can be selected which respond well in one or the
other system and, as is often the case, conditions optimized in shaken flasks will
. not· be transferable to larger-scale vessels. In industry, a highly trained
interdisciplinary team has to be used to solve these problems associated with
scaling-up as experimental runs at this level would need to be, for reasons of cost,
understandably limited in number (Trilli, 1986).
In industry, tanks of 10-500,000 litre capacities are. normally used. The basic
fermentor design consists of a closed vessel fitted with an air inlet and an agitator.
Many other features however, are required and some of these are as represented
at Fig. 1.6. Addition of baffles to the vessel walls can improve the efficiency of
O2 transfer by increasing the turbulence of the agitated culture medium (Primrose,
1987).
21

Inoculum or nutrients
Temperature record and control
~ Steam
Antifoam probe
Anti· foam Alkali
Pumps
.. .. :.:~,~.: . .':t:~ ~;:', . .' " .' '. ,·;··:'~··;"".t:-tr;:~~-::-:· ~ ~.;.~:
Pressure
pH record and control
Filter
9l!2~!E ~ Cooling g; water
~Air
Cooling --"t~;m!ll!llillll& water
A1r-+-==I . Filter
Fig. 1.6:
Harvest line
Schematic representation of a stirred tank reactor. For clarity no
seal is shown between the agitator shaft and the fermenter body and
baffles have been omitted. (Mter Primose, 1987)
22

---- ------c--------;------------
1.5 Downstream processing and identification of antibiotics
Downstream processing is the term commonly used to describe the isolation and
purification of secondary metabolites from fermentation broths and other
biological matrices (Primrose, 1987). The difficulties often encountered at this
stage are legendary and may require several steps in order to effect separation,
(Fig. 1.7). This is because both contents of differentiated plant cells and of
microbial cells and the medium in which the latter has been grown, often presents
an extraordinarily complex mixture of primary and secondary metabolites (some
quite closely related). These metabolites often occur at concentrations which
range from nanograms to milligrams per millilitre where usually, only one of the
compounds may be of interest (White et aI, 1986). Common tools for separation
include thin layer chromatography, liquid phase/liquid phase chromatography,
column chromatography, ion exchange chromatography, high pressure liquid
chromatography and. gas chromatography. When· investigating unknown
antibiotics, especially from novel sources, researchers in this field prefer the first
three techniques as different mobile/solid phases can be more easily manipulated
in the ·search for the appropriate liquid and solid phases for isolation (Calton,
1986). A generalised diagram of a modern chromatographic instrument is shown
at Fig. 1.8. Of late, a new analytical/separation tool, known as super critical fluid
chromatography, has appeared on the market and this constitutes a significant
advance on existing instruments (Ndiomu and Simpson, 1989).
After isolation, certain properties of the antibiotic are investigated and this may
include accurate melting point determination which may help with identification;
pH and thermal stability. tests; efficacy against a range of microorganisms which
constitutes a test of its potential usefulness, and toxicity tests all intended to aid
in ascertaining its use as a chemotherapeutic agent (Arima, 1959 and del Rio et
l!!,1972).
To determine the structure of an unknown antibiotic, spectral analysis is necessary
and this may include ultravioletMsible spectroscopy: able to identify
chromaphores; infrared spectroscopy; not only able to identify functional groups
but valued for the unique "finger-print" it provides; mass spectrometry (MS): able
23

Fig. 1.7:
-- ------------------------------------
j •• ,. 1 .,' I .1 • ~ •••• ' ,/G
i ... ~'"",-i-j_y "j i j-.:.-l ......... " j •• • - y ! '. ~_'( t::::::::l·-Yneoxanthin I r.'!~·"dg"""'YG I I ." f..... I
~ Y . ~""""G
(b)
t::::=J.-Yvio1axanthii1
~a--YG chlorophyll b
lutein + zeaxanthin
chlorophyll a
carotenes
Colum chromatography. Successive. steps in formation of
chromatogram of green leaf pigments. G signifies green: Y, yellow;'
YG, yellow green. (a) Sorption of mixture on powdered sugar from
petroleum ether. (b) Partial separation after washing with petroleum
ether plus n-propanoI. (c) Further separation produced by continued
, washing. (After McGraw and Hill, 1987).
pressure or flow regulation
, s~urc' of . '---Q\o--i mobile phase r
chromatographic column
.. ~.. ;. . "~' . ~.:-":~'.;::::;;., . fraction .~0.L
Fig. 1.8:
sampling port
,~;:.~ignal-j.,-" ,::processing .... --~ =ac:cessories .
recorder
Schematic diagram of a modern chromatographic instrument. The
source of the mobile phase in gas chromatography is a gas cylinder;
in liquid chromatography, a high-pressure pump. Interconnecting
broken lines indicate the parts often used, but not essential to the
basic function. (After McGraw and Hill, 1987).
24

to determine with good confidence, the molecular weight; nuclear magnetic
resonance spectroscopy' (NMR): able '. to . give additional information on the
structural environment around atoms such as hydrogen, fluorine and phosphorous
(Aszalos, 1986 and Dudley et aI, 1987). However, where practical,by far the best
tool for, complete structure elucidation remains X-ray crystallography where
confidence limits of well over 90% are regularly achieved (Glusker and Trueblood,
1972).
1.6 . Some Pseudomonas antibiotics
Pseudomonas aeruginosa has been of interest since the early days of microbial
in.vestigation because it provided one of the first reported examples of microbial
antagonism when Bouchard showed in 1889, that it was antagonistic to some .
species of bacteria. Emmerich and Louw (1899) claimed it 'produced a substance
called pyocyanase in the belief that it was an enzyme which could cure
experimental anthrax. It is also well known from host-parasite inter-relationship
. studies that, as part of the normal flora on man, it can produce substances which
inhibit the growth of Candida species (Wistreich et aI, 1984).
Common strains of Ps. aeruginosa are known to produce a phenazine pigment,
pyocyanine· (Fig. 1.9), the blue colour of which, superimposed upon yellow
pigments also present, produce the typical blue-green colour of pus (Stokes et aI,
1946; Holliman, 1961). . Other examples of phenazine pigments include
hemipy ocyanine, also from Ps. aeruginosa (Schoental, 1945; Hays, et aI, 1945)
iodinin, from Ps. iodina (Gerber and L€:chavalier, 1964) and oxychlororaphine
from Ps. chlororaphis (Miller, 1961). Although at one time the known naturally.
occurring phenazines were all from the Pseudomonads or closely related.
organisms, at least two examples are now known from mould metabolism: These
include Calonuclria erubesai which produces phenazine-1-carboxylic acid, Coriolus .
sanguineus which produces cinnaborin, Streptomyces thioluteus which produces .' .
1,6-dihydroxyphenazine and Streptomyces grisofulvus which produces the
griseofulvins a and b (Cavill, et aI, 1953; Kluyver, 1956; Akabori and Nakamura,
1959; Holliman, 1961). Phenazines are generally known to exhibit a wide
spectrum of antibiotic activity; inhibiting the growth of bacteria, actinomycetes and
25

--- ---~~~~~~~~~---:~~~~~~~---c--
fungi with near to equal effectiveness (Gerber and Lechevalier, 1964). However,
in general, they are highly toxic and are intercalators by mode of action
(Albaraller et aI, 1985; Schafer et aI, 1985).
The genus Pseudomonas also produces other interesting heterocyc1ic compounds
which have antibiotic activity. The 'Pyo' compounds (Fig. 1.9) studied by Hays et
ill. (1945) and by Wells, (1952) are closely related 2-alkyl or alkenyl~4-quinolenes,
the N-oxides of which have been shown to be responsible for the streptomycin-like
activity of Ps. aeruginosa culture filtrates (Holliman, 1961). Others include
comirin (Forsyth, 1959), glyco-lipide (Jarvis and Johnson, 1949; Hawer and
Karnovsky, 1954) and viscosin (Groupe et aI, 1951; Ohno et aI, 1955).
In 1958, Takeda et al isolated a new antibacterial substance, pyoluteorin, from a
strain of Ps. aeruginosa. It turned out to be one of the first known antibiotics to
contain chlorine (Fig. 1.9). Then Arima et al (1964) isolated a new antifungal
antibiotic, pyrrolnitrin (Fig. 1.9), from Ps. pyrrocinia. This also contained chlorine
and is similar in structure to pyoluteorin. It is now commercially available under
the trade name of Pyro-Ace (Japan) and is administered topically against
dermatophytic fungi (Gorman and Lively, 1967) .
. Eg~wa (1970) isolated an antibiotic, referred to as YC-73 (later to be mown as
fluopsin; Fig. 1.9), from a Pseudomonas species. This same antibiotic with its
wide spectrum of activity was also found among three antibiotic substances
produced by Ps. reptilivora.
Fuller et al (1971) isolated an antibacterial substance, referred to as Pseudomonic
acid (Fig. 1.9), from cultures of Ps. fluorescens. It is now marketed under the ~
trade name of Mupirocin and is effective against bacterial skin infections.
Pseudomonic acid is also used in nasal ointment preparations (British National
Formulary, 1991).
In 1981, Kintaka et aI, isolated a novel p-lactam antibiotic, isosulfazecin (Fig. 1.9),
from an acidophilic pseudomonad, Ps. mesoacidophilia. The antibiotic is not as
powerful as existing p-lactam antibiotics.
26

Cl
PYOCYANINE
.r-r.--:T'-CI
PYRROLNITRIN
Cu++
FLUOPSIN
. OH Cl .
&:. c n-I 8 --(N)-CI
~ OH ~
PYOLUTEORIN
OH
~ UN~R
PYO COMPOUNDS [1b) R= (CH2)SCH3 [1c)R= (~aOil
[Ill) R= CH,:,CH(CH2lsO-b
HOOC H . HN . OCH3 ·
HN~CO"X HN~ 2 CO" N
. . 0 . 'S03H
ISOSULFAZECIN
~H OH OH
OH
CH3 H H
.' H R o
R = H
PSEUDOMONIC ACID A
Fig. 1.9: Structures of some Pseudomonas antibiotics.
27

More recently, at least four new antibiotics have been isolated from Pseudomonas
species, three in Japan and one in the UK. They include antibiotic CB-104, an
antibacterial substance (Takeda, 1983); antibiotic Tan 447, a novel macrocyclic
lactone effective against both Gram positive and Gram negative bacteria (Takeda,
1984); antibiotic Tan 456, a polyene antifungal substance (Takeda, 1984) and
MM42842, a novel monocyclic ,8-lactam antibiotic (Gwynn, 1988).
Pyocin, a bacteriocin produced by Pseudomonas, was first reported by Jacob in
1952. It is regarded as a protein with a structure which resembles the lower part
of a bacteriophage (Ishii, 1965; Shinomiya, 1983). It is thought to attack the cell
wall of members of the same or allied species forming pits and thereby causing
cellular leakage. This phenomenon has been exploited in the taxonomy of the
pseudomonads and is known as "pyocin-typing" (Gillies, 1984). Pyocin is stable
. at 55°C but exposure at 70°C for ten minutes completely inactivates it (Kageyama
and Egami, 1962).
1.7 .A novel Pseudomonas
In the early 1960's, in Ghana, during research studies into the control of the
'Black Pod' disease of cocoa, caused by the fungus Phvtophthora palmivora, a
baCterhim was isolated from the gut of the mealy bug Planococcoides njalensis
(Fig. LlO}. It was first identified as a local strain of Ps. aeruginosa by Dr. Y.
Tanada, of the University of California (Auafuah, 1965) but later, during the
course of the present study, reclassified as a new species of Pseudomonas, to be
known as Ps. antimicrobica (Attafuah and Bradbury, 1989; I.J.S.B., 1990). Work
on the organism showed that it was capable of producing substances with a wide
spectrum of antibiotic activity, over and above that displayed by Ps. aeruginosa
itself. Its first application (mid-1960's) was as the antagonist in a carefully
monitored, pilot biological-control programme against Phytophthora. Here,
compared to the controls, it proved quite successful as the development of 'black
pod' disease was not detected on Phytophthora inoculated pods (Attafuah and
Bradbury, 1989).
28

I
Fig. 1.10: A photomicrograph (Mag. X4) of the mealy bug Planococcoides
njalensis from which Ps. antimicrobica was first isolated.
(Reproduced with kind permission from Attafuah, A.).
1.8
The aims (Fig. 1.11) of this study was to:
i) examine the culturallbiochemical characteristics of the
microorganism;
ii) develop a liquid medium able to elicit production of active - -- -- ------ ---- - --._- - ---- ._-.- ----- .. --- .
substance/s from strain A;
Hi) . optimize production of the active substance/s;
29

---- ------~--------------------~--------------
iv) . develop a procedure/s for the separation and isolation of the active
substance/s;
v) investigate some physical, chemical and biological properties of the
active. substance/s;
vi) . attempt an· elucidation of the structure/s of the active substance/so
~.' ..
30

w -
Fig. 1.11
ClASSIFICATION OF BACTERIUM (BIOCHEM TESTS)
..
-... ,- - -
X·RAY CRYSTALLOGRAPHY
STRUCTURAL FORMUlA
r-
r-
I-
A FLOWCHART OF THE PROJECT
MEDIA FOR CONSISTENT . ANTIBIOTIC PROD.
SPECTRAL ANALYSIS MASS SPEC.
.
CHEMICAL TESTS .
EMPIRICAL FORMULA
MEDIUMB (Antibacterial) AB -
MEDIUMC AF/AB
EFFICACY AGAINST MICROORGANISMS
OPTIMIZATION . APPROPRIATE OF ANTIBIOTIC SOLVENT PRODUCTION - EXTRACTION .-
SYSTEM FOR ANTIBIOTIC IS
PREP.TLC . r ISOlATION
OF ANTIBIOTIO-
STABILITY 1- -TESTS
.
SOLVENT EXTRAC-TION
"- STRATEGY-ISOlATION OF ANTI-BIOTIC

CHAPTER 2
MATERIALS.AND METHODS

MATERIALS AND METHODS
2.1 MATERIALS
2.1.1 Microorgariisms
a) Bacteria
Pseudomonas spp; NCIB 9897 - strain A
Pseudomonas spp. NCIB 9898 - strain B
Pseudomonas aeruginosa NCIB 6749
Pseudomonas antimycetica NCIB 8641
Pseudomonas maltiphilia NCIB 9201
Pseudomonas cocovenenans NBIC 9450
Escherichia coli NBIC 9001
Salmonella abony NCfC6017
Serratia marcescens NCfC 11879
Bacillus cereus NCIB 9373
Staphylococcus aureus NCIB 8625
---~ -,---Staphylococcus epidermidis NCIB 7944
Clostridium sporogenes NCIB 532
b) Fungi
Saccharorrwces cerevisiae NCYC 345
Candida albicans NCYC 597
Aspergillus niger IMI 31821
Sporothrix schenckii IMI77984
Penicillium chtysogenum IMI26211
32

I
I
2.1.2 Routine Media.
a) Nutrient Broth (NB)
Substance
Lab lemco
Peptone
NaCI
Amount (g!!itre of deionised H20)
10.0
10.0
5.0
b) . Neurospora Broth (Nsp B)
Substance
Maltose
Yeast extract
Amount (g!!itre of deionised H2Q)
38.0
2.5
Mycological peptone 3.0
Malt extract 2.0
c) Ringer's Solution
. Substance Amount· (g!!itre of deionised H~
NaO 2.25
KO 0.105.
CaCI2 0.12
NaHC03 0.05 ,
FeS04 ·0.01
~S04 0.35
33

d) . Potato dextrose liquid medium (PDLM)·
Substance Amount (gIIitre of deionised H20)
Potato extract.
Glucose
4.0
20.4
Where appropriate, solidified versions of the above media were made by the
addition of Technical Agar (No. I) at 1.5-2.0% (w/v).
Ail media (unless otherwise stated in text) were sterilised by autoclaving at·
121°C, 15 lb/sq in for 15 minutes.
The Lab Lemco was obtained from London Analytical and
Bacteriological Media Ltd., Salford U.K.. The NaCl, KOH and glycerol were
obtained from East Anglia Chemicals, Hadleigh, Ipswich, u.K. Magnesium
glycerolphosphate was from Hopkin and William Ltd., Essex, U.K. The Yeast
Extract, Technical Agar (No. 1), Potato Dextrose Agar, Potato Extract, and.
Bacteriological Peptone were obtained from Oxoid Ltd., Basingstoke,U.K.
. The remaining substances. came from.. Fisons Scientific Apparatus,
Loughborough, U.K.
Ail chemicals (unless otherwise stated in text) were of standard laboratory'
reagent (SLR) grade.
, .. 2.1.3 Growth Curve Media
a) Basal medium (Cruickshank, 1972).
Substance Amount (gIIitre of deionised H20)
NH.Q 3.0
MgCI2.6H20 0.2
34
I

- ------------------------------------------
Na:zSO.
KH2PO.
K2HPO.
Glucose
b) Strain A's Medium
0.2
13.6
17.4
3.0
Basal medium plus histidine and phenylalanine each at 0.1 !iJIitre.
c) Strain B's Medium
Basal medium plus methionine, arginine, lysine and ornithine each at
0.1 g/Iitre. '
d) Ps. aeruginosa's Medium (Guirard, 1970)
Basal medium plus alanine, leucine, lysine, ornithine, histidine each at
0.1 g/Iitre.
e) Yeast Extract Medium
Basal medium plus Yeast Extract at 5 g/Iitre.
2.1.4 Media tested for antibiotic production (See Table 2.1)
a) Nutrient Broth (NB)
b) Neurospora medium broth (NspB)
c) Basal medium minus glucose (BM1)
35

-----------------------------------------------
d) Medium MSl
Substance Amount (glIitre of deionised HJU
KN03 ·5.00
~HPO. 0.40
MgSO •. 7H20 2.00
FeSO. 0.Q1
e) Medium MS2
Substance Amount (gIlitre of deionised H20)
NH.CI 0.40
MgSO •. 7H20 0.25
~HP04 0.25
f) Czapek Dox Liquid Medium minus sucrose (CD1)
Substance Amount (gIlitre of deionised H20)
NaN03 2.00
KO 0.50
Magnesium glycerolphosphate 0.50
FeSO. 0.01
g) Potato Extract (PE)
Variations of the above media were also made by making various
additions/adjustments to their basic formulae (See Table 2.1).
36
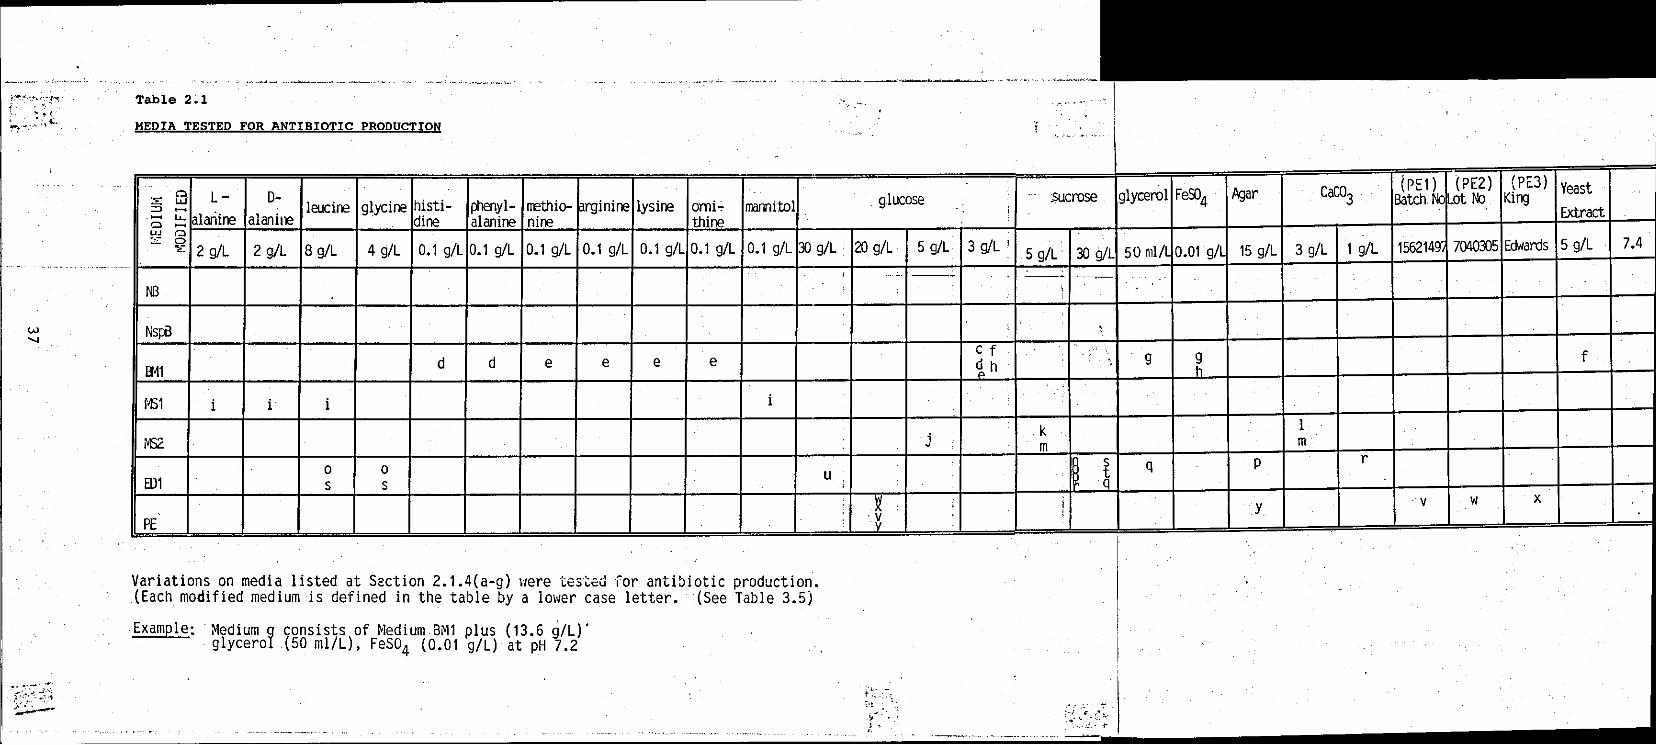
';><:":·',:."~"·.·'r~ -i" ,: .. -i . .. ~ I ~:~ .. :,:~t.:..
w "
Table 2.1
MEDIA TESTED FOR ANTIBIOTIC PRODUCTION
.., L- D-:E LW leucine glycine phenyl- rrethio- omi':' => - alanine Cl WJ :s
2 g/L 2 g/L 8g/L 4 g/L 0.1 g/L 1 g/L 0.1 g/L 0.1 g/L 0.1 0.1 g/L
NB
Nspa
fJ~1 d d e e e e
t-lS1 i i i i
M3.2
0 0 8)1 s s
Variations on media listed at Section 2.1.4(a-g) tlere tes;;ed for antibiotic production. (Each modified medium is defined in the table by a 10vler case letter. (See Table 3.5)
Example: ~ledium 9 consists of ~Iedium BMl plus (13.6 gill" glycerol (50 ml/L), FeS04 (0.01 gill at pH 7.2
glucose
g/L 5 g/L
j
u
~'V' _
-. ..,.'." ,;,. .-.
,~ ,
3 g/L I
~sucrose
5g/L 30 --- ~-
k
;·t· .. ~. ::', . . . .]. ;-
.
I ,
Fe9J4 Agar CaC03
15 g/L 3 g/L 1 g/L 5 g/L 7.4
9 f
I m
q p r
y ·V W x
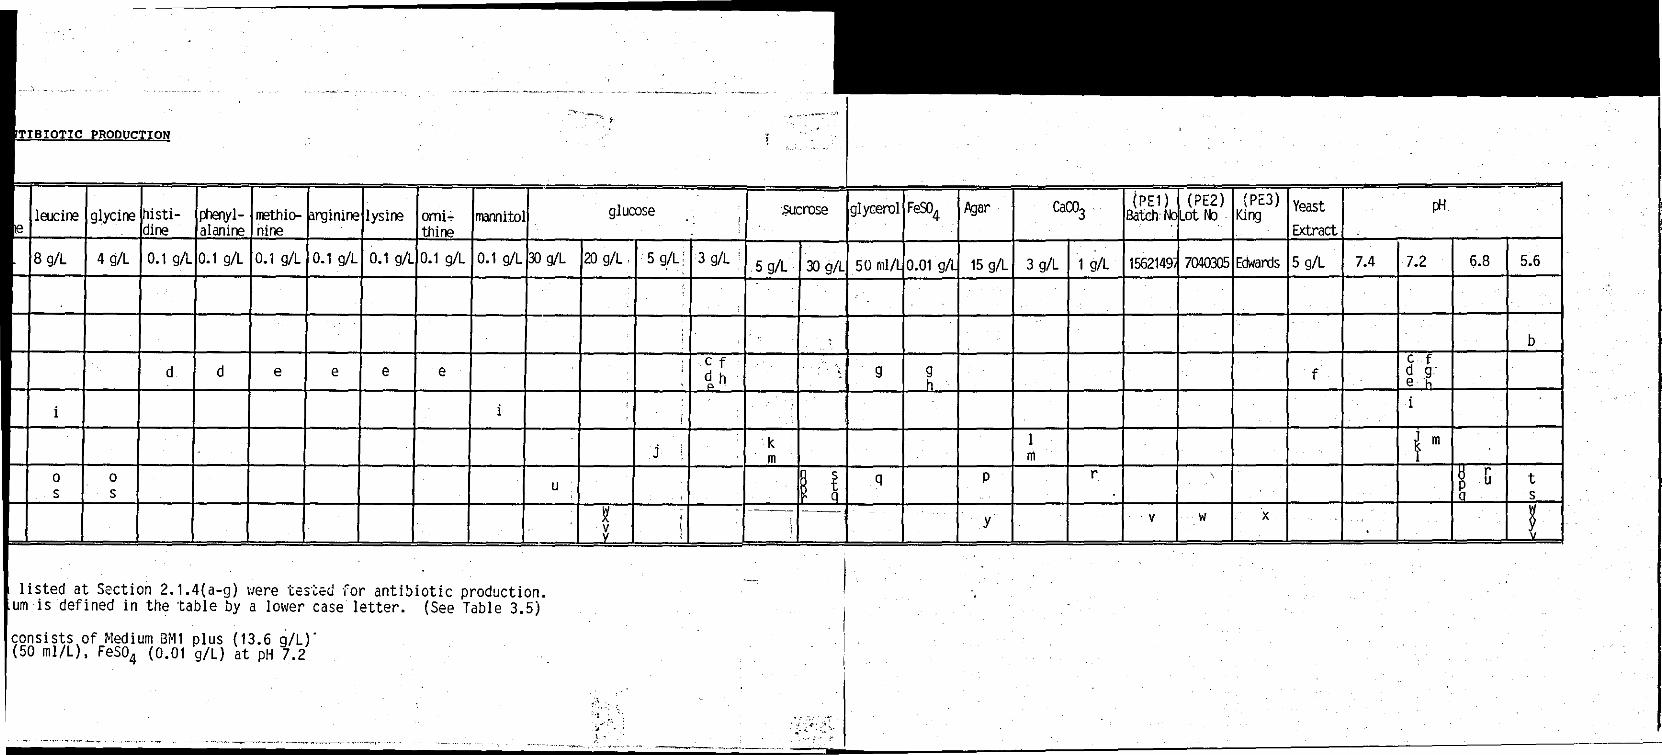
g/L
i
o s
glycine
4g/L
o s
d
0.1 g/L 0.1 g/L 0.1
d e e e e
i
I isted at Section 2.1.4{a-g) \'Iere tes'~ed for antibiotic production. um is defined in the table by a IO~ler case letter. {See Table 3.5}
consists of ~Iedium BMl plus {13.6 giLl" (50 mIlL). FeS04 (0.01 g/L) at pH 7.2
u
glucose .sucrose
g/L, 5 g/L: 3 g/L • ,5 g/L 30
~':\ ". " ... ' . . ,-.-, : ~~ .. ;
,~ -,
j
f h
k
. i- .. ~' ". "--.. -......--, ' -~ ------------~-------- ..
9
q
I
Agar
15 g/L 3 g/L 1 g/L
p
y
I m
r
1562149A 7040305 1 >rlw'rYk
'v w x
Yeast
Extract
5 g/L
f
7.4 7.2
i
6.8 5.6
b
m
t

2.2 GENERAL METHODS
2.2.1 Culture maintenance
Cultures were obtai~ed as freeze-dried powders and were resuscitated according to
the supplying culture collection instructions. All bacteria used were grown on nutrient
agar (NA) slants at 31lC and all fungi used were grown on neurospora medium agar.
(NspA) slants at 30"C. After static incubation to sustainable growth they were all
stored in the dark at 4°C and subcultured every four weeks~ Culture purity was
routinely checked by subculture on selective media and/or by microscopic (X100 to
. XIOOO oil immersion) examination of the morphology and Gram staining attributes
(Gillies and Dodds, 1984).
2.2.2 Working Stocks
The organisms to be used were first inoculated from NA master slants onto fresh NA . 11., A- . .
slants and incubated overnight at 31lC for bacteria, or ontolslants and incubated·
ovemight at 30"C for fungi .. These were then subcultured at regular intervals to serve
as working stocks. Inoculi (colonies for bacteria and spores for fungi) from these
were then transferred into NB for bacteria, NspB for fungi and grown ovemight.
under static conditions at 37°C and 30"C respectively, prior to being used.
2.2.3 Inoculum development
Strain A, obtained from the working stock, was streaked onto a NA plate which was.
incubated ovemight at 37°C. Colonies· from these were then inoculated into basal, .
medium and grown at 37°C in a rotary incubator to an optical density (OD; 650 nm;
1 cm path) of 0.3 - 0.5. Samples of this culture were used as standard inocula .
. 2.2.4 Biochemical(folerance tests
Altogether, 31 biochemical/tolerance tests we~e performed on strain A. With the
exception of urease, haemolysis, nitrate reduction and ONPG tests, which were after
38

--------------------,-------------------
Cowan and Steel (1974), all the rest were after MacFaddin (1983): Strain B (P9898),
· Ps. aeruginosa, Ps. antimycetia ~nd Ps. maltiphilia were also tested at the same time,
and acted as controls.
2.2.5 Transmission Electron Microscopy (TEM) Negative Staining
The specimen was thoroughly washed with deionised water by centrifuging and
· resuspending (X5) at 4000 revolutions/minute (r.p.m.) for 15 minutes. Next, the
negative stain, phosphotungstic acid was added. A droplet of this suspension was
· then put onto a carbon-stabilised formvar coated grid and allowed to dry. Finally, the
grid was viewed and photographed using the AEl EM6B transmission electron
microscope (60 or 80 Kv accelerating voltage and Agfa 70 mm Rapidoline F071P
Film).
2.2.6 Selective Medium Development
Multidisk code U4 (Oxoid Ltd., Basingstoke, U.K.) was used to obtain information
on the antibiotic sensitivities of the test bacterium imd also· of a number of other· .
microorganisms. From these two sets of information, a selective medium for the
bacterium was made by including in the growth medium, an antibiotic or a
. combination of antibiotics (at the stated concentrations), that permitted growth of the
subject but decisively inhibited the growth of others tested.
2.2.7 Growth curves
Using a Pasteur pipitte, two drops (approximately 60 Ill) from the broth culture of the
test microorganism was used to inoculate 50 ml of basal medium in a 250 ml conical
flask. This was incubated in a Gallenkamp Compenstat orbital incubator, set at 37°C
and 90 r.p.m., for 18 hours. A portion of the culture was then poured into a sterile
centrifuge tube and centrifuged at 4000 r.p.m. for 15 minutes at 30°C, using a MSE
39

Mistral 6L· centrifuge. After this, the supematant was decanted and the pellet.·
resuspended in a small portion of the appropriate liquid medium. Using a sterile
pipette, some of this culture suspension was inoculated into an autoclaved 250 ml
conical flask containing 50 mls of the same liquid medium, until the required starting
optical density (D.D.) was obtained (typical D.D. = 0.06). The flask was then
incubated in the rotary incubator at the desired temperature and r.p.m. Samples of
the medium were taken out at set time intervals and the O.D. monitored on a
Unicam S.P. 500, series 2, u.v.Msible spectrophotometer, ata wavelength of 650 nm,
. using a 1 cm plastic cuvette.
2.2.8 Freeze drying
An aqueous sample in an uncapped container was slope frozen in a freezer and then.
placed inside the perspex chamber of a SB6, 3 litre condenser freeze drying unit. The
air in the chamber was evacuated until all the ice had sublimed leaving behind the
freeze-dried sample.
2.2.9 . Some comparison/acidophily tests (Strain A and Ps.cocovenenans) ..
The method described by Gwynn et al (1988) was used. . Basically, the test
microorganism was streaked out on N.A. (acidified with the addition of Hel to pH
4.0) and then incubated. Growth of strain A in standard laboratory reagent (SLR)
constituted basal medium, pH 7.2; in analar reagent (AR) constituted basal medium
from which MgQ2.6H20, had been omitted, pH 7.2 and in the former medium but this
time at pH 4.0, were also assessed. The growth assessment method was as described.
at 2.2.7. Pseudomonas cocovenans was grown in tandem for comparison.
40

2.2.10 Preliminaty detection of antifungal activity
Petri dishes were placed on a Shandon Scientific spirit-levelled, flat-top table and
molten agar (SO°C) poured into the dishes. After the agar had set, the plates were
surface dried (open and inverted) in a 37°C incubator for 20 minutes. A drop of A.
niger spore suspension was.-then put at one end of the plate. Using a sterile loop, the
test Pseudomonad was streaked onto the opposite half of the plate. A control was
made just as described above but this time no Pseudomonad was applied. After 7
days incubation at 300C, the plates were examined for invasive growth inhibition and' '
compared with the control.
2.2.11 Preliminatyextraction of water-soluble, active substances
Four agar plates were prepared: 2 of NA and 2 of PDA Using a sterile loop,
colonies of the test Pseudomonad were streaked onto 3 quadrants (3/4) of one NA
plate and then streaked onto 2 quadrants (1/2) of the other NA plate. The same was
done for the PDA plates. All the plates were then incubated at 30°C for 7 days.
After this time, a flame sterilised knife was used to carefully cut the unstreaked areas
into small cubes and these were aseptically transferred into pre-autoc1aved,
appropriately labelled universals containing 10 ml of deionised water. The universals '
were left to stand for 24 hours. Then, using a 1 in diameter membrane filtration unit,
they were filtered into sterile universals containing Whatmans discs (Whatman's Ltd.,
Maidstone, U.K.). The filtrates were then freeze-dried and redissolved in 1 ml of
deionised H20. Two seeded NA plates were made by adding one drop each of E. coli '
suspension into a universal containing molten NA (48 - S2°C). They were then gently
shaken, poured into petri dishes and allowed to set. The same procedure was
followed for ~. aureus, A. niger and C. albicans but for the latter two, molten NspA
was used instead of NA. Ethanol-flamed forceps were used to transfer the Whatman
41

discs onto the agar plates and sterile Pasteur pipettes were used to transfer samples
of the liquid into corresponding cork-bored holes (9.4 mm diameter). Finally, the
plates were incubated at 37°C for the seeded bacteria and 30°C for the seeded fungi.
They were examined after 18 hours for growth and zones of inhibition.
2.3 ANTIDACfERIAL ACTIVITY STUDIES .
2.3.1 Elicitation of antibacterial activity in liquid media
During the . search for a suitable Iiquid~edium. enabling production of the
antibacterial substance, all the media as outlined at table 2.1 were tried. ·The assay
method described below was used to test for activity.
Assay Procedure for Antibacterial Activity
i) An overnight (12 - 18 hr) culture of the organism in basal medium was grown
at 90 r.p.m., 37°C.
ii) A portion of this was then centrifuged at 4000 r.p.m. for 15 minutes at 30°C
and the pellet resuspended in some of the medium to be inoculated.
iii) The medium was inoculated (50 mls in a 250 ml conical flask) to give the
desired O.D.
iv) It was incubated in an orbital incubator at 90r.p:m., 31lC for a set time.
v) 3 ml samples were taken out at set times and theO.D. and pH measured.
42

--------------------------
vi) The samples were centrifuged at 4000 r.p.m. for 15 minutes at approximately
2°C and the supematants were membrane-filtered (1 inch diameter membrane-·
filtration unit) directly into sterile universals containing 13 mm Whatman's.
discs.
vii) Ethanol-flamed forceps were used to pick up the wet discs and these were
drained, then placed onto pre-seeded (one drop of test organism culture into
molten agar (48 - 52°C)) agar plates.
viii) A pre~incubation time of 3 hours at 4°C was allowed before incubating at 37°C
for bacteria and 30°C for fungi.
2.3.2 Pigmented inoculum eXJleriments
a) Orbital incubation
Colonies of strain A from a NA plate were inoculated into basal medium and
groWn overnight at 90r.p.m., 37°C to achieve pigmentation. Samples of this
was then used to inoculate the test medium so as to give the desired starting
. O.D. Procedural steps iv) to viii) of 2.3.1 were then followed.
b) Static incubation
This experiment was as described at a) but without shaking.
43
I
I
---- --- -------------------------
2.3.3 Preliminary Testing of the Active Broth
a) Heat stability
Procedural steps i) to vi) of 2.3.1 were followed and 2 samples (3 ml) from the
same flask, having detectable antibiotic activity, were taken out. One was
heated in a boiling water-bath for 30 minutes at 100°C and the other acted as
a control. Using sterile forceps, sterile Whatman's discs were placed in each·
of the universals. Procedural steps vii) to viii) of 2.3.1 were then followed.
b) A test for pyrrols
Using a pasteur pipette, 10 drops of Ehrlichs reagent were added to 2 mls of
a membrane-filtered, biologically active filtrate in a test tube. The test tube
was shaken vigorously and then left to stand for a few minutes. A violet
colour is indicative of pyrrols.
2.3.4 Optimization experiments
a) Medium component single-deletion from the SLR basal medium.
This is a variation of the method used by Guirard (1970) in which instead of
amino acid single deletion, medium component single deletion (MCSD) was·
made: . one ingredient was omitted from the basal medium to constitute the .
new test medium. Procedural steps i) to viii) of 2.3.1 were than followed.
44
b) MCSD from the AR basal medium
The same procedure as at 2.3.4 a) was followed but this time chemicals of AR
grade were used instead of SLR grade.
c) 'Variation of nutrient concentration
The concentrations of the following sequence of medium components were
varied with associated screening (2.3.1) at each concentratiori and the nutrient,
concentration which gave the best antibiotic production was carried forward
along the sequence:
i) Glucose (0.0 - 1.0%)
ii) NH4Cl (0.0 - 0.3%)
d) Variation of physical parameters
, , The effects of varying the following seque~ce of parameters on antibacterial
agent production were also studied, in like manner, as at ) and here again the
optimum conditions for antibiotic production, obtained at each step along the
sequence, was carried forward to the next:
i)" pH (3.0 - 9.0)
ii) Agitation/aeration (0.0 - 180 r.p.m.)
iii) Temperature (27 - 47°C)
iv) Initial inoculum level (O.D. 650 nm; 0.0 - 0.2)
45

2.3.5 . Cultivation in a laboratoty-scale ferinentor
A 6-litre Biolafitte, type BL06/l, laboratory-scale fermentor, with temperature,
airflow, Rushton-type impellor and pH monitoring/regulating device was used (Fig.
2.1). Four litres of the appropriate medium, optimised for antibiotic production, was
poured into the fermentor and this was then autoclaved. The inoculum, a culture
already producing antibiotic in basal medium and previously grown in the orbital
incubator at 31lC, 90 r.p.m. for 18 hours, was added until an initial D.D. of = 0.06
was achieved~ The airflow rate, temperature and stirring rate were as determined by
prior experimentation. Monitoring of antibiotic production took place by collecting
samples of broth at various times and then assaying against E.coIi (agar-plate
diffusion).
2.3.6 Statistical error calculation
Stochastic error calculations (involving coefficient of variations) for the whole
experimental procedure, starting from shake-flask cultivation to measurement of
.. zo~es of inhibition, were don~. Standard deviation error-bar calculations were· also
computed for each datum point.
2.3.7 Thin layer chromatography (TLC) plate preparation
a) Analytical TLC
A number of 5 cm x 20 cm analytical TLC plates were made with Keisegel
G60 silica of 0.25 mm thickness using a Shandon Unoplane apparatus. Prior.
to being used, the plates were put into a 110°C oven for 2 hours to activate
them. They were allowed to cool, then 'cleaned' by eluting right to the top
with methanol/chloroform (1/9) in a glass, Shandon Southern Chromatank.
46

Turn s/m i n indi cator _____
Temperatore __ i ndicator
Air fl ow ________ indi ca tor
Fig. 2.1 : A Biolaffette 6-l itre laboratory-sca le fermentor in operation.
Precautionary inlet a nd outlet air filtering devices have been fitt ed to
the fermentor and then connected in series to 2 dresder nasks .
Ai r out l et (\~l i te rubber tub ing to out side)

b) Preparative TLC
Basically the same procedure as at a) was followed but here, a single large
glass plate of 100cm x 20 cm dimension was used and the silica spreader was
set to give a thickness of 1 mm. After drying, it was put in a Shandon
activator oven, set at. 150°C for 2 hrs, to activate it. It was then 'cleaned' as
before.
2.3.8 Detection of active compound
a) Ultra-violet light observation
150 mls of methanol/chloroform (1/9) was poured into the glass Chromatank
which had placed in it, 2 (3" x 7") filter papers. After covering the tank, it was.
left for 2 hours for the solvent vapour to achieve saturation. Using a capillary
tube (601'1), an analytical TLC plate was spotted and dried (20 mm from the·
end) several times with the active broth filterate. The plate was then put into
the tank and elution allowed to commence until the solvent front had reached
a pre-determined mark (typically 15 cm from the baseline/original spot).
After this, it was taken out and dried. The position and colour of any eluted
spots visible under normal light was recorded. The position, colour and
fluorescence/colour of any spot viewed under a BTL U.V. light viewer at 253.7
nm and then at 356.0 nm were recorded.
b) Charring
The same procedure as per a) was repeated. The eluted analytical TLC plate
was then carefully sprayed in a fume cupboard, using a Universal Aerosol
spray with a 1:1 ratio of cone. H2S04 and glacial acetic acid. The plate was
48

.. finally put in a 110°C oven and left for 30 minutes to char so as to reveal spot
locations.
c) Bioautography
The method described by Aszalos & Issaq (1980) was initially tried but,
because results were inconclusive, the following procedure was used: first, the
procedure as outlined at a) was repeated. Then positions of the spots as they
. appeared at a) and b) above, on a single plate, were identified and the plate·
appropriately sectioned to include all the spots. Each section was then·
scraped into appropriatelly labelled sample tubes containing a set yolume (5
mls) of ethanol. The sample tubes were stoppered and thoroughly shaken.
The decants from these mixtures were then assayed against E.coli by using
samples from them to fill cork-bored wells (No.5) in seeded N.A. plates and
then incubating these overnight at 37°C.
2.3.9 Isolation and purification of the antibacterial principal
a) Determination of appropriate solvent systems for extraction
i) Solvent for broth extraction
An approach, based on the use of the solvent system strategy developed by
Aszalos and Issaq (1980), for identification of antitumour antibiotics (Fig. 2.2)
was followed. With this approach, however, the main object was to see which
solvent system caused best separation when the analytical TLC plates ·were
spotted with the active broth filtrate. This gave rise to solvent 1.
49

(}1 o
PrOH:3 AcOH:1
(1.)
Fig. 2.2:
MOVED IN NONE
PrOH:8 PrOH:8 H 2O:2 H2O:2
AcOH:l AcOH:2 Pyridine:l Pyrldine:l
(lb) (lc)
CHCI3
(A)
'·4 PrOH:IO H20 : 8:
AcOH:I! Pyridinru:1i
(til)'
ACTIVE BROTH FILTERATE I
EIOAc (8)
11
AcOH:l0 EIOAc:90
(3al
I MeOH:l0 (C) CHCI
3: 90
III
MOVED IN C.D
MeOH (0)
111-4
NH.t0H:5 Acetonitrile CHC13 :33
Acelone:95 (3c) Acetone:67
(3b) (3d)
tV V
MOVED IN A. B. C. D.
MOVED IN 0 MOVED IN B. C. 0 11·1 11·2 11·3 IV·1 IV·2 IV·3
Acelone AcOH:l0 NH4OH:4 MeOH:2 MeOH:4 MeOH:8 (2.)
MeOH:20 MeOH:20 Benzene:98 Benzene:96 Benzene:92
CHC1 3:70 CHC13:76 (40) (4b) (4c)
(2b) (2c)
A modified Aszalos and Issaq solvent system'flowchart (after Chan and Aszalos, 1986), originally developed for the
identification of antitumour antibiotics but used here to determine the appropriate solvent system for the active broth
filtrate.

ii) Solvent for Iiquid/liquid extraction (see b below)
Analytical TLC plates were again used in the manner described at i) to obtain
. the appropriate solvent system but this time the following solvent systems were
tried: ethylacetate, acetone/ethylacetate (1/9), hexane, acetonelhexane (1/9)
hexane/acetone/ethylacetate (9/1/9). This gave rise to solvent 2.
iii) Solvent for TLC extraction (see c below)
The same procedure as at ii) was repeated but this time using the following
solvent systems: ethylacetate, H20, methanol, methanol/chloroform (1/9).
This gave rise to solvent 3.
iv) Solvent for trituation (washing)
The same procedure as at ii) was repeated but this time using the following
. solvent systems: hexane/acetone/ethanol . (90/10/45) and (90/10/1),
hexane/ethylacetate (9/1), hexane. This gave rise to solvent 4.
b) Liquid/liquid extraction procedure
Three, 2 litres samples of solvent 1 were separately shaken with equal volumes
of the same acidified (pH 2 with 5 M HCI) broth supernatant in a 5 litre
bottle .. In each case the solventJayer was separated in a separating funnel and
reduced in volume to approximately 10 mls under vacuum, using a Rotavopor
R, type KRvr 65/45, rotary evaporator.
All 3 solvent reductates were added together then washed 5 times with 1%
NaHC03 in a 9:1 ratio (solvent:NaHC03). The NaHC03 layer was acidified
51

--- ---------------
to pH2 then extracted 3 times with solvent 1. The solvent was then washed
with 1 % NaHC03 exactly as before. After separation, it was added to the
reductates, ,completely evaporated under vacuum and the residue re-dissolved
in 50 ml of deionised water. A small amount of activated charcoal was added
and stirred before membrane filtration, using a 0.45 I'm WCN, Whatman's
cellulose acetate membrane filter. The filtrate was finally extracted 2 times
. with an equal volume of solvent 2.
Solvent 2 was discarded and the aqueous layer freeze-dried to obtain a yellow
powder.
c) A liquid/liquidfTLC extraction procedure
Two litres of solvent 1 was shaken with an equal volume of broth supernatant
in a 5 litre conical flask. Using a separating funnel, the solvent layer was
separated and reduced in volume (10 mls) under vacuum, with the rotary
evaporator. This procedure was repeated 3 times and the 3 solvent reductates
mixed. A small amount of activated charcoal was added and the mixture
stirred, then membrane filtered using a 0.45 I'm cellulose acetate filter. The
filtrate was applied (3/4" from the end) onto a Keisegel G60 preparative TLC
plate, using a System TNO Delft (Desaga Heidelberg) with a mounted, sliding,
glass, air pressure applicator. The plate was then placed in a stainless steel
preparative TLC tank containing 1.5 litres of distilled ethylacetate. After
elution, the plate was dried and first viewed under ordinary light, then U.V.
light, using a portable model UV5-11 mineral light lamp with shortwave UV
(254 nm), to identify the characteristic antibiotic band. This band was then
scraped off into a conical flask containing a magnetic stirrer. Distilled ethanol
was added and it was then stirred for 10 minutes using a Stuart Scientific
magnetic stirrer. After allowing the silica to settle, the decant was filtered
using 0.45 I'm cellulose acetate membrane filter.
52

---- _. - --------------------~-
The residual silica was resuspended in fresh ethanol and magnetic stirred. The
whole procedure was repeated once more. All 3 filtered decants were then
added together and reduced under vacuum. The concentrated solvent solution.
was allowed to slowly evaporate giving rise to crystals. Finally, the crystals .
were trituated with distilled hexane .
. 2.3.10 High pressure liquid chromatography (HPLC) of isolate
In order to check for purity, an HPLC run of the isolate was made. Initially
it was important to find out whether the unknown antibiotic would be retained
in the HPLC column thus causing column contamination problems. This was
done by spotting an analytical TLC plate with a solution (5 x 60 1'1) of the
antibiotic. The spot was then eluted with a solution A, (26 mM trifluoroacetic
acid, buffered to pH 3 with triethylamine). The same procedure was repeated
with a solution B, (49% acetilenitrile in 13. mM of tritluoroacetic acid, buffered
to pH 3 with triethylamine). Any movement of the antibiotic spots in either
of these solutions, strongly suggests that it. might safely pass through the
column.
A uv/vis scan of the purified antibiotic, between 200 to 700 nm was made, so
as to reveal a characteristic U.V. profile. The wavelength at which the most'
significant peak occurred was noted and used to set the HPLC u.v. detector.
A Gilson HPLC apparatus with 2 pumps, model 302; . dynamic mixer, model
811; manometric module, model802C; holochrome U.V. apparatus and chart
recorder, N.I., was used. The HPLC was attached to an Apple lIc personal
computer with an automatic gradient facility and programmed for a fixed
gradient between 20% solution A to 80% solution B in 20 minutes. The
column type was Altex ODS, C18 reverse phase (internal diameter, 4.6 mm., .
length, 25 cm., particle size, 5 I'm). The volume of injection of the aqueous
antibiotic solution was 100 1'1 and the flow rate was set at 1 ml/minute ..
53 I
I

.2.3.11 Dose-Response calibration cutve
A dose-response calibration cutve was made by first assaying the following antibiotic
concentrations: 1.0,0.1,0.05, 0.025, 0.0125, against E. coli, as previously (see section.
2.3.1). From this, a graph of zone of inhibition versus log of antibiotic concentration
w~s plotted and this enabled assessment of antibiotic concentration in fermentation·
broths.
2.3.12 Calculation of percentage efficiency of extraction
Using the dose-response cutve, a calculation of the percentage efficiency of the whole
extraction procedure was made.
2.3.13 Physical properties
. a) Melting point
A melting point determination of a crystal of the antibiotic was carried out using the
Reichart-]ung melting point apparatus.
b) pH/thermal stability test
The was similar to the method used by Arima et al (1965). The antibiotic crystals
were dissolved in a series of K1/Kz orthophosphate buffers which had already been
made up to the desired pHs, to give each an antibiotic concentration of 1 mg/mI. Set
volumes of these were dispersed into appropriately labelled, small sample tubes which
were then stoppered with plastic caps. Next, they were placed in a water bath at the
desired temperature for set times. Aliquots taken out after these times, were.·
individually assayed for strength of activity against E. coli (agar-plate diffusion) ..
54

c) . U.V. light stability test
Three mls of an aqueous solution, of the antibacterial substance, at a concentration
of 1 mg/ml, was put into a Unicam 10 mm U.V. silica cuvette. The cuvette was
placed in a Bassaire U.V. sterilization chamber with a TUV 15 watts U.V. fluorescent 'I light, producing a surface impact intensity of 400 lux. At set time intervals, 200 ILl
aliquots were taken out and assayed for activity against E. coli as before. A similar
'experiment using tetracycline was run in tandem for comparison.
d) Retention factor determination
Using the following solvents, the retention factors of the antibiotic, as eluted on silica
(Keiselgel 60G) were found: hexane, chloroform, pyridine, acetone, ethanol,
methanol, water, ethylacetate, methanol/chloroform (1:9).
2.3.14 Antimicrobial properties
a) Minimum inhibitory concentration (MIC) determination
i) Tube dilution method .
Two fold dilutions of the antibiotic in basal medium were used and the tubes were
incubated at 31lC for 2 - 5 days. E. coli was the test organism.
ii) Agar diffusion method
This was after the method described by Platt and Isaa~son (1973). A starting
concentration of 2 mg/ml of aqueous antibiotic solution, diluted down 2-fold to 0.0625
mg/ml, was used. The cork-bore was 9.4 mm diameter and the MIC of the
55

-------------
microorganisms tested were found by extrapolation, via a best line fit, supported by
a Pearson's correlation programme, on an ACT Sirius personal computer.
b) Assessment of microbistatic/cidal activity
E. coli was grown in basal medium to obtain an O.D. growth curve as described at
2.1.7. In the middle of log phase, a concentrated aqueous solution of the antibiotic
was added to the culture to give a final antibiotic concentration, equivalent to that of
the MIC, as determined above. Subsequent monitoring of the O.D. was continued
until no further change occurred and loopfuls taken out at this stage were streaked
out on NA plates and incubated overnight. A control growth curve was made where
no antibiotic was added ..
2.3.15 Chemical properties
Qualitative chemical analytical tests done on the antibiotic included Schiffs!Fuchsin
test for aldehydes (Nauman, et aI, 1960); ninhydrin test for amino acids (Ruhemann,
1911; Schoenberg and Moubacher, 1952); anthrone test for carbohydrates (Koehler,
1952); Erhlich test for pyrrols; Feigl test for ketones (Feigl, 1960) and
formalinJH2S04 test for alkyl or aryl halides (Berry, 1955).
2.3.16 Spectral data for antibacterial substance
a) Ultra viol~tMsible (uvMs) scan
Antibiotic crystals were dissolved in U.V. grade ethanol (96% ethanol) and
transferred into a Pye 10 mm U.V. silica cuvette. It was then scanned (200-700 nm)
using a Shimadzu UV-160 spectrophotometer.
56

~- - ------~------
b) Infra red (I.R.) scan
A KEr disc was prepared by adding antibiotic crystal to KEr granules in a 1:1000
ratio (0.1 - 0.2 mg/100 - 200 mg) and grinding with mortar and pestle under a Thorn
Reflector Display, 150 watts heat lamp~ The fine powder was then put into a die
press and compressed to a disc using a vacuum press, producing 12 -15 tons/sq in .
. The disc was scanned using a Pye Unicam SP3-100 I.R. spectrophotometer with a
pathlength of 1 cm and air as the reference.
c) Mass spectroscopy
A few crystals were used to obtain a mass spectrum, first at low resolution electron
impact, then at high resolution electron impact. The instrument used was a Kratos
MS80/05-55C spectrometer. 'I
2.3.17 X-ray ctystallography
a) Ctystal formation
Some crystals of the antibiotic were dissolved to saturation in a small volume of
various solvents, which were then left in a cupboard and the solvent allowed to
evaporate. The crystals thus formed were mounted on a microscope slide and viewed
under phase-contrast microscopy to see if twinning had occurred. (NOTE: There are
certain types of twinning which cannot be detected by phase contrast microscopy
alone and these only became apparent after the initial stages of X-ray
crystallography). To obtain the best crystals for X-ray diffraction, the following
solvents were tried: ethanol, methanol, methanol/chloroform (119), and chloroform.
57

-----------------------------------------
b) X-ray diffraction
The suitable crystal was mounted on a X-ray goniometer head. Using a series of .
oscillations, the crystal was oscillated about the crystallographic C axis and .
Weissenbe~g· photographs using CuKa radiation, enabled crystal settings, preliminary
determinations of cell dimensions and space groups to be made. The crystal was then
transferred to a 2-circle Stoc Stadi-2 Weisenberg diffractometer.The programme
used was the Shelx X-ray 72 for bonds and angles (Steward, et aI, 1972). Another
Shelx programme was used for structure solution and refinement (Sheldrick, .1976) .
. Molecular drawings were made by the ORTEP facility (Johnson, 1965).
2.4 THE EFFECT OF MAGNESIUM SALT OMISSION FROM THE
. MEDIUM RECIPE
. Though peripheral to the aims of this study, the observed ability of strain A, not only
to grow, but to grow with enhanced antibacterial substance production, in a .
chemically defined medium (basal medium) without an added Mg salt component
(Med A2), warranted further study. -
2.4.1. Cell propagation experiments
a) Strain A in Med A2 (SLR)
A 'washed' (centrifugation/decanted) culture of Strain A, previously grown in basal
rnedium, was inoculated into 50 rnls of basal medium minus the Mg salt component
(Med A2) and then grown at 371C, 90 r.p.m., to mid-log phase. A sample of this was
'washed', inoculated into a fresh batch of Med A2 and then grown as above. This;
procedure was repeated for a set number of times, constituting a set number of
propagations. Cultural characteristics were observed and noted at each propagation.
58

b) . Strain A in Med A2 (AR.)
The whole experiment as at a) was repeated but this time using analytical reagent·
basal medium and analytical reagent Med A2 ..
c) Ps. aeuroginosa in Med A2 (SLR)
The experiment at a) was repeated again but this time using Ps. aeruginosainstead
of strain A
2.4.2 Atomic absorbtion measurements of Mg2+ in Med A2
a) Calibration curve
A calibration curve was made by first diluting with deionised H20, a 1000 ppm stock
solution of Mg(N03)2.6H20 (Mg2+ source), in order to obtain a concentration series,
ranging from 0.5 ppm to 0.1 ppm, with 0.1 ppm decrements. Next, the absorbances
at these 5 concentrations were found on an atomic absorbtion spectrometer and these,
were plotted against their corresponding concentrations. The instrument used was
a Shandon Southern A3400 with air/acetylene inlets and a holocathode Mg lamp.
The wavelength chosen was 285.5 nm ..
b) Mg2+ measurements (sample)
i) The trace concentrations of Mg2+ in Med A2 of SLR grade and that ofAR.
grade were measured.
ii) The SLR medium was inoculated with cells 'washed' with SLR medium, to
give a final 0.0. (650 nm) of.= 0.065. It was then incubated for 20 minutes
59

-- ~------------------------------------------
at 3'flC, 90 r.p.m. The cells were spun down (4000 r.p.m./15 minutes) and the
supernatants assayed for Mg2+ content. The same procedure was repeated but
this time using AR medium and inoculating with cells washed with AR
medium.
2.4.3 Analysis of Mg2+ in cells of strain A grown in basal medium and in Med A2 .
A 250 ml conical flask containing 50 mls of basal medium was inoculated with
colonies of strain A from a slant. It was incubated at 37°C, 90 r.p.m., overnight. A
portion of this culture was washed 3 times with sterile saline. After resuspending in
saline, it was used to inoculate 50 mls of basal medium and 50 mls of Med A2 in
separate 250 ml conical flasks. These were then incubated as previously and after 24
hrs, taken out. The cells from the basal medium were washed 3 times with saline and
the peliet transferred to a small crucible which had previously been weighed .. The
crucible was heated until the pellet was totally charred. It was allowed to cool before
weighing again. Four mls of 5MHQ was poured into the crucible and using a glass
rod thoroughly stirred for 5 mins. The mixture was centrifuged (4000 r.p.m.; 15
minsYand the supernatantassayed for Mg2+ as previously (2.4.2).
The same procedure as above was repeated but this time using cells grown in Med
. A2.
2.4.4 Viable counts of strain A grown in basal medium and Med A2
The method described by Miles and Misra (1938) was used to monitor viable growth
. of strain A in basal medium and Med A2. A Y. strength Ringer solution was used for
the dilutions and a Finnpipette micropipette, delivering 50 1'1 quantities onto pre-dried
(20 minutes in a 37°C incubator) NA plates was also used. The plates were incubated
at 37°C for 12 hrs. Set times at which aliquots were taken out of the culture to
monitor growth were: 0,24,36,48, 72 and 84 (hrs).
60
I

2.5 ANTIFUNGAL ACTIVITY STUDIES
2.5.1 Elicitation of antifungal activity in liquid media
During the search for a suitable liquid medium capable of eliciting antifungal activity, .
all the media as outlined at Table 2.1 were tried.
. 2.5.2 Assay of antifungal activity
The method previously employed for the assay of antibacterial activity (2.3.1) was
used but here, the test microorganism of choice was C. albicans.
2.5.3 Construction of PDLM for antifungal production
a) Oxoid PDA batch No. 156 21497
3.9 gms of Oxoid PDA batch No. 156 21497 was suspended in 100 mls of deionised .
water. Using a magnetic stirrer, it was stirred for one hour, allowed to sediment then
decanted. The decant was membrane-filtered (0.45 I'm) giving rise to sterile PDLM.
The procedure as at 2.3.1 iii) to viii) was then followed.
b) Oxoid PDA Lot No. 070 40305
The procedure as at a) was repeated but this time using Oxoid PDA Lot No. 070
40305.
61

--- -- -----------------
. c) Oxoid Potato extract
0.2 gms of potato 'extract plus 1 gm of glucose were dissolved in 50 ml· of deionised
water. and this was sterilised by membrane-filtration before inoculation. The
procedure as at 2.3.1 iii) to viii) was then followed.
d) Potato liquid extract
The Commonwealth. Agricultural BureauxlIntemational Mycological Institute's
(CAB/lMI; Smith and Onions, 1983) procedure for making potato liquid extract,
including boiling of diced raw potatoes, was closely followed. Leicestershire grown
King Edwards potatoes were used. The procedure as at 2.3.1 iii) to viii) was then
followed.
2.5.4 Optimization of antifungal activity
a) Medium component single-deletion of medium q (Table 2.1).
The medium component single-detection method used at 2.3.4 a was used here.
Magnesium glycerophosphate which afforded the only buffering capacity of the ·ZIl"" original medium was eventually substituted for NaH2P04@t a concentration of 0.5 gIL.
b) Variation of nutrient concentration
Optimal concentrations for antifungal activity for the following sequence of medium
components were determined in the manner already described at 2.3.4 b): NaN03
(0.0 to 0.3%), sucrose (0.0 to 5.0%), glycerol (0.0 to 8%).
62

c) Variation of physical parameters
The optimal factors of pH, agitation/aeration and temperature were sequentially
determined in the mann~ralready described at . 2.3.4 c but in this sequence, the
. shaking speed was further increased to 210 r.p.m. and the temperature range was
22°C-42°C.
2.5.5 Cultivation in a laboratory-scale fermentor
The same fermentor used at 2.3.5 was used here. Four litres of the medium
optimised for antibiotic production was poured into the fermentor vessel and this was
autoc1aved. An optimized medium culture of strain A, previously grown in the orbital
incubator, set at 37°C, 90 r.p.m. and for 18 hours (log phase), was used to obtain an
initial OD of = 0.06. The airflow rate, temperature and stirring rate were determined
by experimentation. Monitoring of antibiotic production took place as before
(Section 2.3.5) but here, the test microorganism was C. albicans.
2.5.6 Statistical error calculation
These were done, as previously described at 23.6 ..
2.5.7 Isolation and purification of the antifungal substances
a) Determination of appropriate solvent system f~r broth e~traction
The solvent system strategy developed by Aszalos and Issaq (1985) was initially tried
and the procedure as described ~t 2.3.9 aii) was also tried. During the latter, the
following solvents were used: dichloromethane, acetone, methanol/chloroform (1/9),
ethon.Vchloroform (1/9), ethanol/acetone (1/9),· acetone/chloroform (1/9).
63
b) Development of a solvent system(TLC strategy for extraction
Preliminary investigations to find suitable solvents for the various separation stages
were done on analytical TLC (Kieselgel P60) plates ..
After determination of the appropriate solvent system to be used, the essence of the
procedure as at 2.3.9 c) was followed for each of the following stages:
i) 1st stage - the following solvents were tried: ethanol, methanol, water.
ii) 2nd stage - the active fraction eluted at stage 1 was found to be composed of
several components, so different solvents were again tried in order to obtain
best separation. The solvents tried included, ethylacetate, acetone/chloroform
(1/9).
iii) 3rd stage -. the resultant 2 active fractions eluted at stage· 2 were also
individually found to be composed of more than one component. One fraction - . ' .
was finally separated after trying the following solvents: methanol/chloroform
(1/9) acetone/chloroform (1/9) and ethylacetate. The other one. was also
. finally separated after trying the following solvents: methanol/chloroform (1/9) .
.. acetone!chlorofonri (1/9) and ethylacetate.
2.5.8 A check for purity
a) HPLC
The same initial test procedure, involving elution of the antibiotic spot on TLC, as at
2.3.10, was used for the antifungals to see if they can be safely flushed through the
64

HPLC column. Any movement of the spots on the TLC would be indicative of safe
passage through the column ..
b) Gas Chromatography (G.C.)
0.9 ILl of the solvent in which the antibiotic was to be dissolved was injected into the
G.C. using a S.G.E. 1 ILl syringe. This resulted with a characteristic G.C. profile on .
the chart recorder and constituted the control. The same procedure was followed as
per the 'neat' solvent but this time using the solvent antibiotic solution. A single peak
. recorded on the chart is indicative of G.C. purity. The G.C. instrument was a
Pye/Unicam series 104 chromatograph-type 1 analyser with a Pye oven programmer
and an ionization amplifier. The 3 gas inlets were of air, nitrogen (carrier) and
hydrogen. The coiled column size was 1.S metres x 4 mm with a solid phase of
chromosorb W (chalk) [100 - 120 Mesh] and a liquid phase of 10% carbowax 20 M.
The recording instrument was an Omni Scribe chart recorder. The G.C. settings were
as follows: attenuator: S x 102; temperature range: SO - lS0oC; gas flow rates: air =
400 ml/min., nitrogen and hydrogen, both 40 ml/min; chart recorder speed: 2.S
----. cm/min.
2.S.9. Antimicrobial Properties
a) M.I.C. determination of an antifungal compound
Only one antifungal compound (AF1) was isolated in sufficient quantity to facilitate
wide screening. The agar diffusion method as described at 2.3.14 aii) was used. A
starting concentration of 1 mg/ml was made with a SO/SO, water/ethanol solution.
From this a series of 4, 2-fold dilutions were made using water. The MICs against
the fungi, listed at 2.1.1 b) plus E. coli,~. marcescens and~. aureus, were calculated.
65
b) Zone stability comparisons of the 3 antifungal compounds
A 13 mm Whatman disc was dipped into a 1 mg/ml solution of AFl then placed on .
a C. albicans seeded agar plate before incubating overnight at 30°C. The procedure
was repeated for the other 2 antifungal compounds. Mter overnight incubation and
measurement of zones of inhibition, the plates were further incubated for 4 days to
test for zone stability.
2.5.10 Spectral data for the antifungal substances
a) UV /vis scans
. Samples of all the antibiotics were individually dissolved in UV ethanol and each
scanned as before (2.3.16 a)).
b) I.R. scans
A drop of concentrated ethylacetate antibiotic solution was placed on one I.RNaCl
disc, under the Thorn Reflector display lamp. When the solvent had evaporated, the
above procedure was repeated 2 times. The other I.R NaCl disc was then placed
on top of the antibiotic coated face of the first disc and the 2 gently rubbed against
each other in order to obtain an even spread. They were then placed in a silica gel
dessicator and left overnight. The pair were then mounted in a cell holder and
scanned using a Pye Unicam PU 9516 I.R spectrophotometer, attached to an IBM
personal computer, with a Philips B.I.RD.S. programme, a Philips computer monitor
80 imd an Epsom FX 800 printer. All the antifungal antibiotics were scanned.
66
c) Nuclear magnetic resonance (NMR) scan
A sample of AFl was dissolved in duetriated chloroform and this was used to obtain
a proton NMR (IHNMR) spectrum. The instrument used was a 60 MHz Varian EM
360A NMR spectrometer.
67

CHAPTER 3
RESULTS

I I
I
3. RESULTS
3.1 GENERAL
3.1.1· Transmission Electron Microscopy (TEM)
An electron micrograph of an individual cell of P9897 (Strain A) is shown at Fig.
3.1. It has been negatively stained with phosphotungstic acid (PTA) and
photographed under TEM. The cell is rod shaped and slightly curved, with one
polar flagellum.
3.1.2 Selective Medium Development
.. The results of the antibiotic sensitivities of 14 microorganisms to multidisk U4 is
given at Table 3.1. From this, a selective medium for strain A was made,
comprising colistin sulphate and sulphafurazole in NA, at concentrations of 10
J.tg/ml and 500 J.tg/ml, respectively. This selective medium proved ineffective
against the 2 fungi (~. cerevisiae and £. chrysogenum )tested.
The growth of strain A on half of a NA plate and growth of Ps. cocovenenans on
the other half are shown at Fig. 3.2. The side of the plate containing colonies of
strain A appear faintly yellow in colour. This plate constituted the control. Fig.
3.3 shows some growth of strain A on the selective medium plate but no growth
of Ps. cocovenenans.
3.1.3 Biochemical/tolerance tests
Thirty one biochemical/tolerance tests, performed on both strains A and B, and
on Ps. aeruginosa, Ps. antimycetica and Ps. maltiphilia are shown at Table 3.2.
Strain A gave positive acid production results for· glucose, fructose, sucrose,
galactose and mannitol but gave negative results for lactose and maltose. Positive
results were also observed for ONPG, catalase, nitrate, urease, aesculin, lipase and
lecithinase. Of the tolerance growth tests done with strain A, only MacConkey
68

agar encouraged growth and here, it was relatively slow (36 hrs incubation at
37"C). Negative results were also observed with strain A for oxidase, methyl red,
Voges-Proskauer, indole, starch hydrolysis, deoxyribonuclease (DNase), haemolysis
and, ornithine and lysine decarboxylase activity. Of the tolerance growth tests
done, the following gave negative results: 1% TIC, 6.5% NaCI, 0.03% cetrimide,
Pseudomonas agar, 42°C and minimal medium. Strain A also gave a polymyxin
MIC of 10 ~g!mI.
Strain B gave a very similar biochemical test profile to that of strain A, the only
. exceptions being aesculin and lecithinase which were both negative, and a
polymyxin MIC of 0.1 ~g!mI.
Ps. aeruginosa differed from strain A in that it gave positive results for oxidase,
heamolysis (sheep's blood not horses'), 1 % TIC, 0.03% cetrimide, Pseudomonas
agar, fast growth in MacConkey agar (18 hrs incubation at 37°C) and 42°C; but
negative results for sucrose, ONPG, aesculin and lecithinase.
Ps. antimycetica differed from strain A in that it gave positive results for maltose,
starch hyqrolysis, 1% TIC, 0.03% cetrimide, fast growth on MacConkey agar (18
hrs incubation at 37°C) and 42°Cj but gave negative results for mannitol,
. galactose, ONPG and aesculin.
Ps. maltiphilia differed from strain A in that it gave positive results for maltose,
DNase, haemolysis (horse's blood not sheeps'), 0.03% cetrimide, fast growth on
MacConkey agar (18 hrs incubation at 37°C) and 42°Cj but gave negative results
for mannitol, sucrose. and lecithinase.
3.1.4 Some Comparison Studies between Strain A and Ps.cocovenenans
The growth profile of strain A, grown in basal liquid medium (Cruickshank's
medium) at pH 4.0 (i), at pH 7.2 (ii) and again at pH 7.2 but this time, with a
medium component single deletion of MgCI2.6H20 (A.R.) (iii) are shown at Fig.
3.4. All 3 are similar in overall shape in that they describe conventional growth .
curve profiles, however, growth in medium i was much slower and achieved a
69

lower optical density (0.0.) maximum (0.8) at 48 hrs, compared to 0.0. maxima
of 2.2 at 36 hrs for media ii and Hi. With medium ii, yellow pigmentation was
observed after 36 hrs.
. The growth profiles of Ps. cocovenenans, grown in the 3 media described above
are shown at Fig. 3.5. Medium ii gave rise to a conventional growth curve profile
but both media i and Hi exhibited long lag phases where the 0.0. of Hi rose after
24 hrs and that of i rose after 48 hrs. Ps. cocovenenans in mediumi did not attain
the growth levels achieved in the other 2 media (0.0. maxima of 1.026 for i, of
1.78 for ii and of 2.18 for Hi. In medium ii yellow pigmentation was observed after
48 hrs.
Growth of strain A on one half of a NA plate and growth of Ps. cocovenenans on
the other half, after 24 hrs incubation, at 37°C are shown at Fig. 3.6. The side of
the plate containing colonies of strain A appear faintly yellow in colour. This
constituted the control. Fig. 3.7 shows good growth of strain A on one half of a
NA plate at pH 4.0 with strong yellow pigment exudation but Ps. cocovenenans
failed to grow on the other half of the plate. The plate was incubated for 24 hrs
at 37°C.
3.1.5 Growth Curve Studies
The mean generation times (mgt) for both strain A and Band Ps. aeruginosa are
shown at table 3.3. Strain A, grown in media 1-6, gave mgts of 170, 99, 84, 134,
106, 110 (coefficient of variation, 6%) respectively and strain B, grown in media
1-6, gave mgts of 156, 97, 81, 104, 106, 161 (coefficient of variation, 5%)
respectively. . Additions of the vitamins, riboflavin and nicotinic acid at
concentrations of 0.001 % and 0.01 % respectively, made no difference to the mgts
of either strain. Ps. aeruginosa grown in media 1 and 6 gave mgts of 100 and 88
(coefficient of variation, 5%) respectively.
70

3.1.6 Invasive Growth Inhibition of Aniger by some Pseudomonas species
From table 3.4, inhibition zones of A niger on PDA by strain A, strain Band Ps.
aeruginosa were 15 mm each (coefficient of variation, 3%) but Ps. cocovenenans
produced a zone of inhibition of 7 mm (coefficient of variation, 3%). No zones
of· inhibition were seen with Ps. antimycetica and Ps. maltiphilia and infact,
invasive growth of the A niger swamped these 2 organisms. With the CzaF~k
Dox Agar (CDA) experiments, the zones of inhibition created by strain A against
A niger was 23 mm (coefficient of variation, 5%), accompanied by an intense
. yellow exudate; strain B was 18 mm (coefficient of variation, 5%) but Ps.
aeruginosa hardly grew, so results here were invalid. Ps. antimycetica and Ps.
maltiphilia showed no zones of inhibition and here again, A niger swamped the
2 pseudomonads. Figs. 3.8 - 10 shows examples of invasive growth inhibition of A
niger by strain A and Ps. cocovenenans. All the plates were incubated at 30·C
for 7 days.
3.1.7 Preliminary Extraction of Water-soluble Active Substances
After following the procedure outlined at 2.2.11, no zones of inhibition were
observed with this experiment.
3.2.0 ANTmAcrERIAL ACfIVITY STUDIES
3.2.1. Elicitation of Antibiotic Production in Liquid Media
From table 3.5, the only liquid media to give rise to zones of inhibition for
antibacterial activity were basal medium (c), strain A's medium (d), Czapek Dox
Liquid Medium (CDLM), (n) and CDLM-modified (q), all occhrring on the
secondl but not on the seventh day of incubation.
71

I
----------
3.2.2 Preliminary Testing of Antibacterial (ab) Substance/s _
a) Heat stability
After heating in a boiling water-bath for 30 mins,the activity of the broth
filtrate against E.coli, as measured by the disc diffusion assay, had dropped
by 10%.
b) A test for pyrrols
The experiment with Erhlich's reagent on -the active broth filtrate was
negative (no colour change).
3.2.3 Pigmented Inoculum Experiment
a) Orbital incubation
After 24 hrs incubation at 37°C, 90 r.p.m., the basal liquid medium had
developed intense yellow pigmentation which upon assay gave a disc zone
of inhibition of 23.6 mm against E.coli. Further incubation did not increase
visual pigmentation.
b) Static incubation
Although some faint yellow pigmentation was observed, a sample of the
basal medium broth, taken out after 24 hrs incubation at 37°C, did not
register a zone of inhibition upon assay. Further incubation failed to _ .
increase visual pigmentation.
72

. 3.3.3 Optimization experiments
a) . Medium component single deletion (MCSD) [SLR]
The growth profiles (O.D.) and the antibiotic concentration profiles
(mg/~1)of strain A, at 90 r.p.m., 37°C,grown in the 'complete', MCSD
NH4CI (Med AI), MCSD-MgCI2.6H20 (Med A2), MCSD-Na2SOdMed
A3), MCSD~KH2POJK2HP04 (Med A4) and MCSD-glucose (Med AS)
media are shown at Figs. 3.11 and 3.12. The 'complete', Med A2 and Med
A3 profiles describe conventional growth curve profiles with maximum
stationary phase O.Ds. of 2.00. Med Al growth profile rises to O.D. 0.33
in 24 hrs, then levels out with increasing time and Med A4 growth profile
rises to O.D. 0.48 in 24 hrs then falls with increasing time to 0.0. 0.28 in
60 hrs. Med A5 growth profile, after inoculation, remains constant
throughout the period of incubation.
The pH profiles for all the media with the exception of Med A4, falls only
slightly with time. Med A4's pH profile falls fairly steeply to 3.5 in 36 hrs
and then levels out, reaching 3.7 in 60 hrs .
. No alltibiotic production was deteCted in Med AI, and Med A5 throughout
the period of incubation. The complete, Med A2 Med A3, all produced
detectable amounts of antibiotic during the incubation, with production
peaking at ,24 hrs but then falling away with time. Med 2 gave rise to the
greatest antibiotic concentration, 0.065 mg/ml in 24 hrs, steeply falling to
0.034 mg/ml in 48 hrs then levelling off, reaching 0.028 mg/ml in 60 hrs.
The 'complete' medium was next, with 0.03 mg/ml in 24 hrs, falling to 0.015
mg/ml in 48 hrs then continuing to 0 mg/ml in 60 hrs. Finally, Med A3 was
the smallest, with a rise to 0.018 mg/ml in 24 hrs which thereafter gradually
fell to 0 mg/ml in 48 hrs.
73

b) Medium component single deletion (AR)
Results of the MCSD (AR) experiments are shown at Figs. 3.13 and 3.14 .
. The experiment is a repeat of the MCSD (SLR) experiments but this time
using A.R. grade chemicals. All the growth profiles are similar to their
SLR counterparts except for those of Med A3 and A4. The· former rises
to about O.D. 0.3 then begins to level out, barely rising with time, and then
falls slightly after inoculation, with increasing time, to an 0.0. of 0.04 in
60 hrs.
The pH profiles were also similar to their SLR counterparts, however,
overall antibiotic production was dissimilar in that production was only
detected in the' complete' medium. Here, it was first detected after 36 hrs,
describing a peak of 0.33 mg/ml which then fell to 0.017 mg/ml in 48 hrs
before levelling off to 0.011 mg/ml in 60 hrs.
c) Glucose variation
The growth profile (O.D.; 650 nm) of strain A, grown in Med A2, at 3?-C,
90 r.p.m. and at the following percentage concentrations of glucose: 0.3,
0.4, 0.5, 0.6, 0.7, 0.8, 0.9, 1.0 are shown at Fig. 3.15. The curves of each
concentration describe conventional growth curve profiles with O.D.
maxima of 2.0.
The continuation of the above O.D. profiles with the following percentage
concentrations of glucose: 0.3, 0.24, 0.18, 0.12, 0.06, 0.0 are shown at Fig.
3.16. The 0.3 to 0.06% curves all follow conventional growth curve profiles
but with progressive decreases in stationary phase OD's, with decreasing
glucose concentration (0.3%, O.D. 2.1; 0.2%, O.D. 1.9; 0.18%, O.D. 1.7;
0.12%, O.D. 1.1; 0.06%, O.D. 0.46). The 0.0% profile very gradually falls
away with time to O.D. 0.052 in 60 hrs.
74

I
I
The antibiotic concentration/time profiles of strain A, grown in Med A2 at
the concentrations and conditions cited at Fig. 3.15 are shown at Fig. 3.17.
All the concentrations gave rise to similar Ab concentration profiles where
production increased to a peak at 36 hrs then fell away with time. The
highest Ab concentration measured was 0.067 mg/ml and this occurred at
0.3% in 36 hrs.
The Ab concentration/time profiles of strain A, grown in Med A2 at the
concentrations and conditions cited at Fig. 3.i6 are shown at Fig. 3.18.
The 0.3% and 0.12% curves are similar in profile to those at Fig. 3.21 but
the 0.24% and 0.18% curves, though similar in profile to the rest, begin to
level at 36 hrs, reaches a peak at 48 hrs then falls away with time.
Altogether there is a progressive increase in Ab concentration with
increasing glucose percentage. Peaks occur at 36 hrs both for 0.12% (0.32
mg/ml) and for 0.3%, (0.067 mg/ml), and at 48 hrs both for 0.18% (0.04
mg/ml) and for 0.24% (0.045 mg/ml). Here again, the highest
concentration achieved occurred at 0.3% and at 36 hrs. Antibiotic activity
was not detected at 0.06% and 0.0% glucose concentration throughout the
period of incubation .
. The Ab concentration of strain A, grown in Med A2 of various percentage
glucose concentrations and measured. at set times are shown at Fig. 3.19.
The curves all indicate a rapid increase in antibiotic production with initial
increases in percentage glucose concentrations to 0.3% which then broadly
levels off thereafter. The levelling off at 24 hrs occurs at 0.035 mg/ml
antibiotic concentration and is relatively steady as the glucose
concentration increases, whereas at 36 hrs, there is a rise to 0.067 mg/ml
followed by a fall to 0.053 mg/m!. It then fluctuates between 0.047 to 0.06
mg/ml with increasing glucose concentration. At 48 and 60 hrs there are
significant drops from 0.058 mg/ml and 0.047 mg/ml respectively to 0.034
mg/ml and 0.025 mg/ml respectively at 0.5% glucose concentration. Both
profiles then level out again with increasing glucose concentration.
75
------ ------- - --- --- ---- ---.----------~-----
The growth curve (0.0. (650 nm)/time), the Ab concentration profile and
the pH profile of strain A. grown in Med A2 (0.3% glucose), at 90 r.p.m.,
37°C are shown at Fig. 3.20. The pH profile barely falls with increasing
time. From the glucose variation experiment done, this graph represents
" the optimum conditions which gave rise to the highest level of Ab
production (0.067 mg/ml) achieved so far in small (50 ml) batch cultures.
d) Ammonium chloride variation
. The growth profiles (0.0.; 650 nm) of strain A, grown in Med A2, at 90
r.p.m., 37°C and at the following NH4CI percentage concentrations: 0.3,
0.24, 0.18, 0.12, 0.06 are shown at Fig. 3.21. The curves of each
concentration are similar and describe conventional growth curve profiles
with 0.0. maxima of 2.0.
A continuation of Fig. 3.21 at the following NH4CI percentage
. concentrations: 0.06, 0.05, 0.04, 0.03, 0.02, 0.01, 0.0 is shown at Fig. 3.22.
All the curves follow conventional growth curve. profiles, with 0.0. maxima
of 2.0, the exception being the 0.0% curve which plateaus with an 0.0.
maximum of 0.2.
The Ab concentration profiles of strain A. grown in Med A2, at the
concentrations and conditions cited at Fig. 3.21 are shown at Fig. 3.23. All
the Ab concentration profiles show increases in Ab production with time
which rises to a peak at 36 hrs then falls away with increasing time. The
0.06% profile however, shows a tendency toward levelling before and after
the peak. The 0.06% medium which gave rise to the highest concentration
of Ab at 36 hrs (0.126 mg/ml), was closely followed by the 0.12% medium
(0.115 mg/ml) also at 36 hrs (0.115 mg/ml).
The antibiotic concentration profile of strain A. grown in Med A2, at the
concentrations and conditions cited at Fig. 3.22 are shown at Fig. 3.24.
The 0.01%,. and 0.02% profiles suggest gradual increases in antibiotic
76

production with time, to a peak of 0.03 mg/ml and 0.066 mg/ml
respectively, in 48 hrs, then a falling away with time. The 0.03% to 0.06%
curves suggest that increases in concentration coirolated with increases in
production which peaked at 0.072 mg/ml and 0.126 mg/ml, respectively, in
-36 hrs, then fell away with time. By far the greatest Ab concentration was
measured at 36 hrs from the 0.06% medium.
The Ab concentrations of strain A, grown in Med A2 of various percentage
NH4C1 concentrations and measured at set times are shown at Fig. 3.25.
From the 24 hrs to 48 hrs profiles, there appears to be a rapid increase in
. production with increasing NH4CI concentration,· all peaking at 0.06% (24
hrs, 0.115 mg/ml; 36 hrs, 0.126 mg/ml; 48 hrs, 0.112 mg/ml) and gradually
falling with increasing NH4C1 concentration. At 60 hrs, there occurs an
initial, rapid rise in production which begins to level then gradually rise to
0.06 mg/ml at 0.024% before gradually falling to 0.048 mg/ml at 0.03%.
The O.D. growth profile (O.D.; 650 nm), the Ab concentration profile and.
the pH profile of strain A, grown in Med A2 of 0.06% NH4C1 (medium 1)
at pH 7.2, 90 r.p.m., 37°C are shown at Fig. 3.26. The pH profile
produces a slight 'trough' between 24-48 hrs but barely changes throughout
the incubation period. From the NH4CI variation experiment done, this·
graph represents the optimum conditions giving rise to the highest Ab
concentration (0.126 mg/ml) achieved so far in small (50 ml) batch
cultures.
e) pH variation
The growth profiles (O.D.; 650 nm) of strain A, grown in various medial
which have been buffered to pHs 3, 4, 5, 6, 7, 8 and 9, at 90 r.p.m., 37°C
are shown at Fig. 3.27. The pH 6 and 7 profiles are similar and show
conventional growth curve profiles with O.D. maxima of 2.0. pH profiles
5 and 4 also describe conventional growth curve profiles but both occur at
lower stationary phase O.D.s. (O.D.s 0.9 and 0.53 at 36 hrs respectively).
77

After inoculation, pH profiles J and 9 fall away with time to 0.0. 0.01 and
0.005 at 60 hrs, respectively. pH profile 8, afterinoculation, does not grow
until after 36 hrs whereafter it grows rapidly, reaching a peak of 1.49 in 48
hrs, then falls away sharply with time.
The Ab concentration/time profiles produced by strain A, grown in
medium 1 at the pHs and conditions cited above are shown at Fig. 3.28.
Antibiotic activity was only detected in the pH 6 and 7 media and both
profiles are similar. The Ab concentration in both media increases with
time and peak between 36 and 48 hrs before falling away with time. Of
the two, the pH 6 medium consistently gave rise to the highest Ab .
concentration (0.178 mg/ml in 48 hrs).
The Ab concentration profiles of strain A, grown for set time periods in
various media 1,· buffered to the pHs mentioned above are shown at Fig.
3.29. All the curves have a similar profile in that after the first detection
of Ab concentration at pH 6, there is a fairly steep fall which passes
thro~gh pH 7. The highest Ab concentrations were detected in the pH 6
medium and were measured between 36 and 48 hrs (0.174 mg/ml to 0.178
mg/ml respectively).
The growth curve (0.0.; 650 nm), the Ab concentration profile and the
pH profile of strain A, grown in medium 1 at pH 6 (medium 2), at 90
r.p.m.; 37°C are shown at Fig. 3.30. The pH profile barely changes, falling·
very slightly with time. From the pH variation experiment, this graph
represents the optimum· conditions which gave· rise to·· the highest Ab
concentration (0.178 mg/ml) achieved so far in small (50 ml) batch
cultures.
78
I
I
I
I
i
I

.- --------------- ----
t) Agitation rate (RPM) variation
The 0.0. growth profiles (O.D.; 650 nm) of strain A, grown in medium 2,
at the following r.p.m.s: 40, 60, 90, 120, 150, 180, all at 37°C are shown at
Fig. 3.31. The 90, 150 and 180 r.p.m. curves are shnilar in that all describe
conventional growth curve profiles but are dissimilar in that the maximum
O.D.s achieved, progressively decrease with increasing r.p.m. The 60 and
40 r.p.m. profiles are also similar to the above but here, there is a tendency
for the stationary phase O.D. to fall slightly then begin to rise and in
addition to this, as the r.p.m. decreases, there is a drop in stationary phase
O.D. The .120 r.p.m. curve is different from all the others and describes
typical biphasic growth.
The Ab concentration/time profiles of strain A, grown in medium 2, at the
r.p.ms and conditions cited above are shown at Fig. 3.32. Ab
concentrations were detected only at 90, 120 and 150 r.p.m. At 90 r.p.m., .
the Ab concentration rises steeply to 0.174 mg/ml in 36 hrs, levels off to
0.178 mg/ml in 48 hrs before falling sharply to 0.008 mg/ml in 72 hrs. At
120 r.p.m. the Ab concentration rises to 0.072 mg/ml in 24 hrs, falls to
0.066 mg/ml in 36 hrs, barely rises to 0.063 mg/ml in 48 hrs then rises
steeply to 0.372 mg/ml in 72 hrs before falling steeply to 0.195 mg/ml in 84 .
hrs. At 150 r.p.m., the Ab concentration rises exponentially to 0.096 mg/ml
in 60 hrs, begins to rise again to 0.138 mg/ml in 72 hrs before levelling to
0.135 mg/mUn 84 hrs.
The growth curve. (O.D.; 650R .. )the Ab concentration profile and the pH
profile of strain A, grown in medium 2 at 37°C, 120 r.p.m. are shown at
Fig. 3.33. The pH profile falls gradually to 5.4 in 24 hrs, barely changing
at this level to 48 hrs before rising slightly to 5.7 in 60 hrs and maintaining
this level throughout to 84 hrs. From the r.p.m. variation experiments, this
graph represents the optimum conditions which gave rise to the highest Ab
concentrations (0.372 mg/ml) achieved so far in. small (50 ml) batch
cultures.
79

g) Temperature variation
The growth profiles (O.D.; 650m¥>f strain A, grown in medium 2, at 120
r.p.m. and at the following temperatures: 27, 32,37, 42, 47°C are shown
at Fig. 3.34. The organism, grown at 42°C, describes a classic growth curve
profile, with a maximum stationary phase O.D. of 0.98 at 36 hrs, followed
by a slow decline phase. At 32°C, the profile, although fairly similar in .
shape to that at 42°C, occurs at lower stationary phase O.D.s which
exhibits fluctuations within an O.D. range of 0.328 to 0.563. At 37°C, a
biphasic growth profile is described. At 27°C, the O.D. barely rises above
that produced by the inoculum in 24 hrs but after this time, rises fairly
steeply to 0.209 in 36 hrs and levels out gradually with increasing time to
0.260 in 72 hrs. The 47°C profile fell fairly steeply to O.D. 0.023 in 24 hrs
and maintained this level throughout the incubation period. Cell
aggregation/clumping was seen, after 24 hrs, in all the flasks incubated at
27°C and 37°C.
The antibiotic concentration/time profiles of strain A, grown in medium 2,
at the temperatures and conditions cited above are shown at Fig. 3.35.
Throughout the incubation period, no significant production was obsedrved
at 47°C and 27°C. The Ab concentration profiles of the 42°C and 32°C
were similar and rose very gradually with increasing time to 0.04 mg/ml and
0.033 mg/ml in 84 hrs, respectively. At 37°C, the Ab concentration rose
to 0.072 mg/ml in 24 hrs, dipped slightly to 0.063 mg/ml in 48 hrs, rose
steeply to 0.372 mg/ml in 72 hrs then fell steeply with time to 0.195 mg/ml
in 84 hrs.
The antibiotic concentration produced by strain A in medium 2 when
grown at various temperatures and measured at set times are shown at Fig.
3.36. Ab concentrations were detected from 24 hrs to 84 hrs and only
between 32°C and 42°C. The Ab/temperature profiles at the above times
were similar in that all peaked at 37°C. The 24-48 hrs profiles we.re
similar in that they all had peak Ab concentrations of the same order ( -
0.065 mg/ml). The 60-84 hrs profiles were similar in that they all had peak
Ab concentrations of the same order (0.2 mg/ml). The 72 hrs profile had
80

by far the highest Ab concentration peak (0.372 mg/ml). The optimum
conditions for· Ab production arising from the temperature variation
experiment is essentially similar to those giving rise to the profiles at Fig.
3.33.
h) Initial 0.0. variation
The growth profiles (0.0.; 650 nm) of strain A, grown in medium 2, at 120
r.p.m., 37°C and at the following initial O.o.s: 0.200, 0.150, 0.100, 0.6,
0.060, 0.030, 0.015 are shown at Fig. 3.37. The curves of initial O.D.s 0.015
and 0.030 are similar and' follow classical growth curve profiles with
maximum stationary phase O.D.s of 1.789 and 1.992 respectively. The
decline phase O.D.s of these curves start from 48 hrs and fall to 1.029 and
1.173 in 84 hrs, respectively. The 0.203, 0.150 and 0.100 initial O.D.·curves
first rise to 0.0. 0.989, 1.447 and 1.673 in 24 hrs respectively then all fall
exponentially to a trough at 72 hrs, and thereafter begin to rise' to 0.909,
0.7 and 0.793 in 84 hrs, respectively. The 0.06 initial 0.0. curve followed
a biphasic growth profile with mid stationary phase 0.0. of 0.388 in 36 hrs
and final stationary phase 0.0. maximum of 1.34 in 72 hrs.
_. The Ab concentration/time profiles of strain A, grown in medium 2, at the
inoculum levels and conditions cited above are shown at Fig. 3.38. Only
initial 0.0. 0.06, 0.03 and 0.015 profiles gave rise to detectable Ab
concentrations. In the initial O.D. 0.015 flask, an Ab concentration of
0.096 mg/ml is first detected at 36 hrs then falls away to 0.035 mglml in 60
hrs, levelling out to 0.044 mg/ml in 84 hrs. In the initial O.D. 0.03 flask,
'. an Ab concentration of 0.012 mg/ml is first detected at 24 hrs, rises steeply
toO.091 mg/ml in 36 hrs, then gradually falls away with time to 0.065
mglml in 84 hrs. In the initial O.D. 0.06 flask, the Ab concentration rises
to 0.072 mg/ml in 24 hrs, dips slightly to 0.063 mglml in 48 hrs, rises steeply
to 0.372 mg/ml in 72 hrs before falling steeply with time to 0.195 mg/ml in
84 hrs.
81
The optimum conditions arising from the initial O.D. variation experiment
are essentially similar to those giving rise to the profiles at Fig. 3.33.
i) Summmy
A summary of the sequence of optimization experiments with
corresponding factorial increases in production, starting from the
control/complete medium is shown at Table 3.6. . An overall. factorial
increase of 9.3 was finally obtained giving rise to a yield of 0.372 mg/m!.
The greatest single increase in Ab concentration occurred during the r.p.m.
variation experiment.
j) Statistical Error Calculation
The O.D. measurements were found to have a stochastic coefficient of
variation, of 12.3%, the pH measurements, of 1.2%, the zones of inhibition
measurements, of 9.7% and the dose-response calibration curve
assessments of antibiotic concentration in broth culture, of 21.9%.
k) Scale-up fermentations
Two sequences of optimization trials for the 6-litre fermentor, culminating
in the optimum conditions of 150 tr/min, 4L/min, in 3 days and at 37°C are
shown at Table 3.7a and b. A rating system based on visual colour
(yellow) observation was used to obtain the above conditions at set times
of 72 hrs (a). These conditions' were then carried forward for another·
sequence of optimization trails, based on time (b) and here, zones of
. inhibition were used to monitor progress.
82

3.3.4 Isolation. Purification and Quantification of the Antibacterial Principal
a) Determination of appropriate solvent system for extraction /
i) Solvent for broth extraction
The path taken during determination of a solvent system for broth
extraction, using the Aszalos and Issaq flowchart (Aszalos and Issaq
1980) is shown at Fig. 3.39a. This resulted in methanol/chloroform
(1/9; solvent 1).
After elution in various solvents the spots and their retention
factors (Rfs) as derived from of the above flowchart (Fig. 3.39a) are
described at Table 3.8. The vertical columns show the Rf results of
. active filtrate (AF)' spots and of fresh medium (FM) spot on
analytical G60 TLC plates, eluted with chloroform (CHCI3),
ethylacetate (EtOAc), methanol (MeOH) and methanol/chloroform
(MeOH/CHCI3; 119). Identification of any eluted spots present
were by charring at 110°C after spraying with cone. H2S04 and
glacial acetic acid (1), by visual assessment (2), and by UV light
(253.7 nm and 356 nm) (3). Two charred spots both with Rfs of 0.7
(1) wer~ found· only after methanol elution of the AF and FM
spots. A yellow active spot (2) was found for each AF spot after
elution with CHCI3, EtOAc, MeOH and MeOH/CHCI3, and these
gave rise to Rfs of 0.13, 0.01, 0.64, and 0.67, respectively. No eluted
spots were observed for the FM spots here. A fluorescent, , . .
yellow/green; non-active (by the assay method 'at section 2.3.1)
material was only observed (3) with the methanol elution of AF
spots. The FM spots acted as controls.
ii) Solvent/solvent extraction
A flowchart for the determination of solvent 2 is shown at Fig.
3.39b. The active spot from. the solvent l/broth extraction was
83

- ----------~
eluted with ethylacetate and gave a yellow spot, Rf 0.29; a <
yellow/green fluorescent spot, Rf 0.58; a dark spot, RfO.72 and··
another dark spot, Rf 0.93. It was eluted with acetone/ethylacetate
(1/9) and gave a yellow spot, Rf 0.25; a fluorescent blue spot, Rf
0.7 and a 'fluorescent yellow/green spot, Rf 0.78. It was eluted with
hexane but no movement was observed. It was eluted with
acetonelhexane (1/9) and gave one yellow/green fluorescent spot, Rf
.. 0.02. Fifnally, it was eluted with hexane/acetone/ethylacetate(9/1/9;
solvent 2) and gave a yellow spot, Rf 0.04; a fluorescent blue spot,
Rf 0.22 and a fluorescent yellow/green spot Rf, 0.46.'
All developed chromatograms were viewed under u.v. light (253.7
nm and 356 nm) and the yellow spot was the only active spot.
The constructed flowchart for the isolation and purification of the
. antibacterial substance using the solvent/solvent extraction route
. and culminating in a freeze-dried powder of the yellow antibiotic is .
shown at Fig. 3.41.
A yield of 50 mg/10L was obtained from the laboratory-scale
ferrilentor.
iii) SolventtrLC extraction
A flowchart for the. determination of solvents for TLC extraction is
shown at Fig. 3.40 .. The active spot (an analytical TLC plate)
obtained from methanol/chloroform (1/9) (solvent 1) broth
. extraction, was eluted with ,ethylacetate (solvent 2) and gave a
yellow spot, Rf 0.29; a yellow/green fluorescent spot, Rf 0.58; a
dark spot, Rf 0.72; and another dark spot, Rf 0.93. After elution
with H20, it gave a dark spot, Rf 0.23; . a yellow spot, Rf 0.56; a
fluorescent blue spot, Rf 0.62 and a fluorescent yellow/green spot, .
. Rf 0.77. Elution with methanol gave a yellow spot, Rf 0.75 and a
84

, fluorescent yellow/green spot, Rf 0.81. Finally, after elution with
methanol/chloroform- (1/9) it gave a yellow spot, Rf 0.77 and a
fluorescent yellow/green spot, RfO.85.
After prep TLC elution with ethylacetate; -a solvent for trituation
was also sought and the Rf results of' those solvents' tried were as .
follows: Hexane/acetone/ethanol (90/10/45), gave a yellow spot, Rf·
0.02; a fluorescent blue spot, Rf 0.04 and a yellow/green fluorescent
spot, Rf 0.05: hexane/acetone/ethanol (9/1/1), gave a yellow spot,
Rf 0.01; a fluorescent blue spot, Rf. 0.02 and a yellow/green
fluorescent spot, Rf 0.04: hex~ne/ethylacetate (9/1) gave a yellow
. spot, Rf 0.005; a fluorescent blue spot, Rf 0.01 and a yellow/green
spot, Rf 0.02: hexane alone gave a yellow/green fluorescent spot, Rf .
0.1 but did not move the yellowspot.
All developed chromatograms were viewed under UV light (253.7 .
nm and 356 nm). The yellow spot was the only active spot.
The constructed flowchart for the isolation and purification of the
antibacterial substance using the solvent{fLC route and culminating
in pure yellow crystals is shown at Fig. 3.42.
A diagram of the developed chromatogram of the active substance,
eluted on prep TLC and as viewed under U.V. light (254 nm) is
shown at Fig. 3.43. It also shows a Rf ofO.29±0.06 for the yellow
band, a Rf of 0.58+0.03 for the yellow/green fluorescent band, a Rf
of 0.72±0.05 for the dark band (I) and a Rf of 0.93+0.06 for the
dark band (11).
A yield of 236 mg/l0L was obtained from the lab-scale fermentor;
85

----- - ._---
b)· Calculation of percentage efficiency of extraction
The percentage efficiency of extraction from active broth to
antibiotic crystals was 62% for the solvent(TLC extraction and 13%
for the solvent/solvent extraction.
c) A check for purity
The initial experiment to find out whether the antibiotic was of a
type which was likely to be adsorbed to the silica in the HPLC
column gave a Rf of 0.64 with solution A (26 mM trifluoroacetic
acid, buffered to pH 3 with triethylamine), a Rf of 0.88 with
solution B (49% acetilenitrile in 13 mM of trifluoroacetic acid) and
a Rf of 0.83 with solution NB (50/50). The wavelength at· which
the most significant peak occurred on the uv/vis scan was 256 nm
and this was used to set the HPLC instrument. The resulting
chromatograph revealed a single peak of retention time 10.4 mins.
d) Assessment of antibiotic concentration in fermentation broth
The log-dose response calibration curve used for assessing the
amount, in mg/ml, of the antibacterial substance present in the
broth situations is shown at Fig. 3.44.
3.3.5 Physical Properties
a) Melting point
The melting point of the antibiotic was 171-173°C and melting occurred with
decomposition as indicated by a browning of the yellow crystals on the hot plate
of the Reichart-Jung melting point apparatus.
86

b) Retention factor determinations
The Retention factor (Rf) determination results are shown at Table3.9. It shows
methanol to be the best eluent with Rf of 0.67 foIlowed by pyridine with Rf of
0.63 then methanol/chloroform (1:9) with Rf of 0.6 .. Hexane, however, did not
move the antibiotic spot and chloroform barely did so (Rf, 0.07).
c) pH/thermal stability tests
. The pH/thermal stability test results are shown at Table 3.10. It shows progressive
loss in activity/stability with increasing time when subjected to concurrent increases
in temperature and pH. There is good stability at Iow pH (29% loss in· activity
after 1000 e incubation for 60 mins at pH 2) but poor stability at high pH (100%
loss activity after 60°C incubation for 60 mins at pH 9)
d) Ultraviolet light stability test
The UV light stability test results are shown at Table 3.11. There is significant
loss in activity/stability (19%) after the first day and this value remains constant
throughout the 7 days. With the tetracycline control, the loss in activity/stability
after the first day is not as pronounced (14%) as the antibacterial substance but
from then on, loss is of the same order (18%).
3.3.6 Microbiological Properties
a) Minimum inhibitOlY concentration (MIC)
The tube dilution method gave an MIC of S 0.5 /Lg/ml against E. coli in
basal medium, incubated at 37°C. The agar diffusion method gave MICs
against a range of microorganisms as shown at table 3.12. From this, C.
albicans and Cl. sporogenes were uninhibited up to 2000 /Lg/ml and the
fungi were generaIly less inhibited than the bacteria. E. coli's MIC by this
method was 1.3 /Lg/ml.
87

- -----------
b) Effect of the antibacterial substance on growth of E.coli
A graph of 0.0. against time, depicting antibiotic challenge against E.coli
growing in basal medium at 90 f.p.m., 37 Q C is shown at Fig. 3.45. The
control curve describes a conventional growth curve profile with maximum
stationary phase O.D. of 1.75. The test curve initially followed the control
curve but levelled off, achieving a mioomum stationary phase O.D. of
0.402. This occurred soon after addition of enough of the antibiotic to give
a MIC equivalent in the 50 ml culture. A1iquois taken out, at times 3, 3.5
and 4 hrs and individually streaked onto NA plates, registered growth after .
overnight incubation at 37Q C.
3.3.7 Chemical properties
All the qualitative chemical analytical tests but one, done on the antibiotic, proved
negative. The positive result obtained was for Feigl test (slight red) but negative
results were obtained for the following: SchiffsIFuschsin test (no wine purple
colouration) Formalin test, ninhydrins test (no colour change) Anthrone test (no
. colour change); Kovac's test (no colour change); Ehrlichs test (yellow colour
rather than violet).
3.3.8 Spectral data
. a) Ultra violetMsible scans
The scan of the impure (broth filtrate) and purified antibiotic are shown
at Fig. 3.46 and Fig. 3.47 respectively. At Fig. 3.46 there is a large peak
at 210 nm with absorbance 2.3, a smaller peak at 257 nm with absorbance
0.85 and a broad peak at 380 nm with absorbance 0.175. At Fig. 3.47 there
is a peak at 258 nm with absorbance 1.175 and a broad peak at 400 nm
with absorbance 0.25.
88
-------------------
b) Infra-red scan
The scan of the antibacterial substance is shown at Fig. 3.48. The main
absorption bands are at 3120, 2980, 1680, 1620, 1540, 1440, 1390, 1305,
1260, 1220; 1160, 1060, 975, 930, 880, 825, 785, 740, 725 cm· l•
c) Mass spectrometIY
The scan at Fig. 3.49 shows the first electron/mass (e/m) ratio to be.193.
Subsequente/m ratios ~f significance detected, include: 179, 165, 151, 136,
123, 109, 93, 83, 67, 56. Table 3.13 shows a list of the arithmetically
possible atomic compositions of the compound as generated by the mass
spectrometer data system.
3.3.9 X-ray cIYstallography
a) Solvent cIYstallization
Twinning was clearly evident under phase-contrast microscopy when using'
ethanol and' methanol but under this scrutiny, was not apparent with
'methanol/chloroform (1/9). Itwas'only after preliminary X-ray diffraction
that the latter was revealed to be unsuitable as twinning had occurred.
The solvent best suited for crystal formation was chloroform.
b) X-ray data
C,HP2NS' Mr= 193.1, monoclinic, PZ/C, a = 9.675 (5), b = 14.028 (5),
C = 6.873 (5), B = 116.4 (2), V = 835.24, Z = 4, Dx = 1.536 gcm,3,
(>-.(MoKa) = 0.71069 A, Jl. = 0.69 cm'l, F(OOO) = 512, T = 293K.
The positional parameters and equivalent isotropic temperature factors are
listed at Table 3.14. Bond lengths and angles are listed at Tables 3.15 and
3.16, respectively. Using the above data and an atomic numbering scheme,'
89

the molecular structure, Fig. 3.50, and the unit cell contents, Fig. 3.51, were "
draWn by the ORTEP facility of the X-ray diffractometer.
3.4.0 THE EFFECf· OF MAGNESIUM SALT OMISSION FROM THE
MEDIUM RECIPE
3.4.1 Cell Propagation Experiments
A flowchart/result, of the experiments done on strain A and Ps. aeruginosa in AR
and SLR basal medium is shown at Fig. 3.52. It showed that starting from the
'complete' (basal) medium situation, growth and an increased production of yellow .
pigment (visually assessed; + +) from strain A was perpetuated by 'washed' .
inocula transfer (initial OD -= 0.06) in a series of Med A2 (SLR) (50 ml/flask).
However, when AR grade chemicals were substituted in the same experiment, .
although pigmentation was detected (visually assessed; . +) in the 'complete'
medium, growth without pigmentation occurred in Med A2 (AR), ceasing
altogether after first generation propagation. When Ps. aeruginosa was substituted
for strain A in the SLR experimental situation, a yellow/green pigment, with no
detectable Ab or Af activity was produced after propagation from the complete
medium to Med A2 (SLR). Here, growth ceased after further propagation (first
generation) in Med A2 (SLR).
3.4.2 Atomic Absorbtion (AA) Measurements of Mg2+in Basal Media
The AA calibration curve for Mi+ (Mg(N03)2.6H20) from . which ,deflections on .
the AA instrument are read to give the concentration in ppm is shown at Fig.
3.53 .
. The Mi+ concentration· (ppm and molarity) present in Med 'A2, after the'
inoculation (OD ::: 0.06), incubation (90 r.p.m., 37°C for 20 minutes) and
membrane filteration experiment, using both SLR and AR grade chemicals are
shown at Table 3.17. SLR and AR constituted media controls were also measured
for Mg2+ content.
90
- -----------c----------c---------
All SLR constituted media appear to contain more Mg2+ than the AR constituted
media (0.095 ppm and 0.140 ppm (SLR); 0.038 ppm and 0.102 ppm (AR): 0.095
ppm and 0.038 ppm for the experiment and then 0.140 ppm and 0.102 ppm for
the controls).
3.4.3 Analysis of Mg2+ in cells of strain A grown in basal medium and in Med
A2
The results of experiments at 2.4.3 are as follows:
1) weight of charred cell pellets (basal medium) = 9.0 mg·
2) weight of charred cell pellets (Med A2) = 7.0 mg
3) [Mg2+] from pellets dissolved in 4 ml of HCL
(basal medium) = 0.7 ppm
4) [Mg2+] from pellets dissolved in 4 mls of HCL
(Med A2) ~
= 0.2 ppm
. Mg2+ in cells of strain A basal medium = 0.7 x 1 = 0.31ppm/mg of cells 9.0 1
Mg2+ in cells of strain A basal medium = 0.2 x 1 = 0.11ppm/mg of cells 7.0 1
3.4.4 Viable Growth Curves
The viable growth curve profiles (log viable cell count/time) of the complete
medium and of Med A2, plotted on the same axis is shown at Fig. 3.54. They are
generally similar but the MedA2 profile appears to have grown to a log viable
cell count (L VCC) of 11.8 in 36, hrs immediately followed by a steep fall, whereas
the fall from a LVCC of 11.1 in 36 hrs, in the complete medium profile, is gradual
at first, reaching a LVCC of 10.8 in 48 hrs, finally followed bya steep fall.
91

3.5.0 ANTIFUNGAL ACfIVITY STUDIES
3.5.1 Elicitation of Antibiotic Production in Liquid Media·
From Table 3.5, the only liquid media which gave rise to detectable (disc diffusion
. assay) antifungal activity against C. albicans were Potato Dextrose Liquid Medium·
-1 (PDLM-1!medium v) CzapG!.k Dox Liquid Medium - modified (medium q).
Activity 'was detected for all, after day 7 but with medium q activity was also
detected after day 2.
3.5.2 Preliminaty Testing of Aritifungal (AD Substance/s
Heat stability
After heating in a boiling water-bath for 20 mins, the activity of the broth
filtrate against C.albicans, as measured by the disc diffusion assay, had
dropped by 5%.
3.5.3 Pigmented Inoculum Emeriment
a) Orbital Incubation
After 2 days incubation at 90 r.p.m., 37°C, the medium q had developed
an intense yellow pigmentation with antifungal (Af) disc zone of inhibition.
of 24.2 mm against C. albicans and antibacterial' (Ab) disc zone of
inhibition of 25.0 mm against E. coli. Further incubation failed to increase
pigmentation.
The O.D. growth profile, the zone of inhibition profile and the pH profile
of strain A, grown in PDLM batch number (No.) 15621497 (PDLM-1), at
90 r.p.m., 37°C are shown at Fig. 3.55. The O.D. describes a conventional
growth curve profile with good growth (O.D. 2.0 in 24 hrs, maintaining this
level to 288 hrs). The zone of inhibition profile rose steeply from about.
92

130 hrs to 36.1 mm in 144 hrs, began to level, reaching a peak of 41.6 mm
in 264 hrs before dropping to 35 mm in 288 hrs. The pH profile started
. at 5.6, dropped steeply in 24 hrs, remained at this level to 144 hrs then
gradually rose again, eventually reaching 7.7 in 288 hrs.
b) Static incubation
After a 10 day ambient (20°C) incubation, the medium q culture had
developed yellow pigmentation, giving Af disc zone of inhibition of 20.2
mm and Ab disc zone of inhibition of 23.4 mm. Further incubation
increased pigmentation.
The O.D. growth profile, the zone of inhibition profile and the pH profile
of strain A, grown in PDLM batch No. 15621497, at static condition and at 37°C,
against time are shown at Fig. 3.56. The O.D. rose to about 0.7 in 24 hrs,
plateaued before gradually rising to 1.7 in 288 hrs. The only zone of inhibition
detected was at 288 hrs and was only of 14.5 mm diameter. The pH profile rose
slightly before dropping to 3.8 in 48 hrs then maintained this level throughout the
period of incubation. A similar experiment with PDLM of the same batch No.
gave no activity with Ps. aeruginosa.
3.5.4 Optimization Eweriments
a)' Medium component single detection (MCSD) OF medium q
Results of the MCSD experiment are as shown 'at Fig. 3.57-59 inclusive.
They show the O.D. growth profiles, the antibacterial (Ab) and Af zone of
inhibition profiles of strain A, grown in complete, MCSD-NaN03 (Med
B1), MCSD-Mg glyP (Med B2), MCSD-FeS04 (Med B3), MCSD-KCl,
(Med B4), MCSD-sucrose (Med B5), MCSD-glycerol (Med B6) and
MCSD-carbon source (Med B7) media.' The complete and Med B4 growth
profiles are very similar and describe conventional growth curve profiles
with stationary phases which after 12 hrs at about O.D. 0.6 increased
93

exponentially to about 1.2 in 96 hrs. Med B3's CUIVe is also similar but
occurs with lower stationary phase O.D., from 0.33 in 12 hrs to 0.839 in 96
hrs, as is also Med B7's CUIVe which occurs with even lower stationary
phase O.D., from 0.227 in 12 hrs to 0.29 in 96 hrs. Med B2's CUIVe is fairly
similar to the Med B3's CUIVe except that it rises gradually to 0.648 in 36
hrs then rises exponentially to 0.960 in 96 hrs. Med B6's growth CUIVe
initially rises steeply to 0.838 in 12 hrs but thereafter falls away
exponentially. Med B5's profile appears to have a biphasic character with
a mid-stationary phase occurring between 40 to 60 hrs at O.D.s 0.218 to
0.228. Finally, Med B1's CUIVe initially shows a very small rise in O.D. to
0.140 which plateaus and then very gradually falls away with time to 0.106
in 96 hrs.
The pH profiles of Med B4 and Med B7 showed a similar trend, rising
gradually to peak at about 7.6 in 36 hrs and barely maintaining this level
in 96 hrs. Med B5's profile also followed this general trend but here,
.described a more even keel, whereas Med B6's pH profile which also
showed this general trend, was more accentuated. The complete medium
pH profile was also similar but displayed a steep initial rise to 7.5 which
levelled out after 12 hrs and had no marked dip at 60 hrs. The pH profile
of Med B3 dipped initially to 5.8 but after 12 hrs rose back to the original
level (6.8), maintaining this throughout the incubation period. Med Bl's
profile also had an initial drop but was much more steep, falling to 3.9
then levelling· out after 12 hrs and maintaining this throughout the
incubation period. Med B2's pH profile was more erratic. Initially it fell
to 4.5 in 12 hrs, rose gradually back again to 7.6 in 48 hrs then fell to 6.5
in 60 hrs, levelling out with time.
No zones of inhibition were detected in Med B1, Med B3, Med B5 and
Med B7. Of all the antibiotic producing media here which were able to
trigger production of both Ab (E. coli) and Af (C,. albicans) substances,
only Med B2, initiated the production of the antibacterial substance first
(with the exception of Med B6) whereas it was the other way round for the
94

rest. Med B6 appeared to have initiated the production of both antibiotics
about the same time (12 hrs). From Fig. 3.58 the Ab zone of inhibition
profile, produced by the complete medium, describes a semi-circle between
12-72 hrs with an apex of 17.3 mm in 36 hrs. Med B4's Ab profile rises
from 24 hrs to a peak of 19 mm at 36 hrs then falls fairly steeply to 14 mm
in 48 hrs. Med B2's Ab profil~ rises from 24 hrs to 17.6 mm, levels out at
72 hrs then rises again to 22.3 mm in 84 hrs before falling to 17.3 mm in
96 hrs. Med B2's peak zone of inhibition was by far the largest Ab zone
of inhibition and occurred at 84 hrs.
During the MCSD experiments, Af zones of inhibition were detected in the
complete medium, Med B4 and Med B6 at 12 hrs only. Of these, Med B4
gave the largest zone of inhibition, (19 mm) whilst the other 2 zones were
of the same order (.=.17 mm) Fig. 3.59 Med B2 Af zone of inhibition
profile however, was first detected at 84 hrs and continued to rise from
17.5 mm to 18.5 mm in 96 hrs. The last detected zone size here was
comparable to that of Med B4.
b) Sodium nitrate variation
The growth profiles (0.0.; 650 nm) of strain A, grown in Med B2 plus
NaH2P04 (0.5 gm/L; medium 3) at 37°C, 90 r.p.m. and at the NaN03
percentage concentrations of 0.00, 0.05, 0.10, 0.15, 0.20, 0.25 and 0.30 are
shown at Fig. 3.60. As the concentration of NaN03 increases there seems
to be a tendency towards the formation of biphasic growth curves between
0.0 to 0.15% and between 0.25 to 0.3%. This biphasic tendency is best
expressed at the lower concentrations. The best overall growth occurred
at 0.2%. However, although best initial growth occurred in the 0.3%
medium, achieving an 0.0. of 1.15 in 24 hrs, this fell away to 0.0. 0.618
in 96 hrs and only later rose again to 0.0. 1.125 in 192 hrs. It should be
noted that the 0.0% curve rose very gradually to 0.0. 0.147 in 96 hrs, but
fell away with time to 0.095 in 192 hrs.
95

The Ab (E. coli) zone of inhibition/time profiles of strain A, grown in
medium 3 at the NaN03 concentrations and at ~he conditions cited above
are shown at Fig. 3.61. No Ab zones of inhibition were detected in the 0.2
and 0.0% media throughout the incubation period. The 0.3% profile first·
appears with a zone of 16.6 mm at 96 hrs, rises fairly steeply to 19.1 mm
in 120 hrs then maintains this level throughout to 192 hrs. This same trend
is followed by the 0.25 to 0.1% profiles. However, it is to be noted that
the 0.1 % zone of inhibition profile begins to rise after 168 hrs to 20.3 mm
in 192 hrs, that the 0.15% zone of inhibition profile first appears at 72 hrs.
and that the 0.25% profile falls away after 168 hrs to 16.1 mm in 192 hrs.
The 0.05% profile appears quite different from the rest in that it first
appears with a zone of 15.7 mm at 120 hrs and continues rising steeply to
24.1 mm in 192 hrs. The last detected Ab zone size here, was the largest
so far produced by any medium in the present series.
The Af zone of inhibition/time profiles of strain A, grown in medium 3, at
the concentrations and conditions cited above are shown at Fig. 3.62. No
Af zones of inhibition were detected in the 0.25, 0.2, 0.15 and 0.0% media
throughout the incubation period. The 0.05 % profile first appears with a
zone of 19.4 mm at 120 hrs, rises to a peak of 23.3 mm at 144 hrs then
falls away steeply to 16.6 mm in 192 hrs. A similar though lower profile
level is seen with the 0.1 % curve but here, it starts with a zone of 18.7 mm .
at 96 hrs and rises steeply only after 120 hrs, to 21.5 mm in 144 hrs before
falling steeply to 14 mm in 192 hrs. The 0.3% profile also appears similar
but occurs at a lower profile level than that of 0.1 %. Here, it starts with
it zone of 14.6 mm at 72 hrs and again only rises steeply after 120 hrs to
19.1 mm in 144 hrs, falls steeply to 15 mm in 168 hrs before plunging to
zero hi 192 hrs.
A graph of Ab zone of inhibition profiles for strain A, measured at 0 hr,
24 hrs, 96 hrs, 120 hrs, 144 hrs, 168 hrs, 192 hrs, against NaN03 percentage.
concentrations is shown at Fig. 3.63. No zones of inhibition were detected
in the 0.2% medium and, also, at all NaN03 concentrations up to 24 hrs
96

incubation. The largest zone, 24.1 mm, was detected at the lowest
concentration, 0.05%, only after the longest time, 192 hrs. It should also
be noted that apa.rt from the. 72 hrs profile, and at times beyond this,
increasing the concentration beyond 0.2% gave rise to production of the
antibacterial substance/s which increased with increasing concentration.
The zone of inhibition profiles of 96 hrs and 120 hrs are similar, though
the former occurs at lower levels. The profiles of 144 hrs, 168 hrs and 192
hrs are also similar to the above two, but register zones of inhibition
occurring at 0.05%, which all appear to increase with time from 15.7 mm
at 120 hrs, to 24.1 mm at 192 hrs.
The graph of Af zone of inhibition profiles, measured at the same times
and conditions cited above is shown at Fig. 3.64. No zones of inhibition
were detected from the media containing 0.15, 0.2 and, 0.25%
. concentration of NaN03 and, also, at all NaN03 concentrations up to 24
hrs. As with the Ab profiles, the largest Af zone, 23.3 mm, was detected
at the lowest concentration,0.05%, falling as the NaN03 concentration is
increased. However, unlike the Ab profile, the largest Af zone occurred
at 144 hrs. Here, increasing the NaN03 concentration beyond 0.25%
resulted in detectable production of the antifungal substance/s and it is to
be -noted that before 72 hrs,. ill concentrations lower than 0.3%, no
significant production was detected. Production was also only detected at
96 hrs in the 0.1% and the 0.3% media.
The growth profile (0.0.; 650 nm), the Af and Ab zone of inhibition
profiles imd the pH profile of strain. A, grown in medium 3 of 0.05%
NaN03 (medium 4), at pH 6.8, 37°C and 90 r.p.m are shown at Fig. 3.65.
The pH profile initially falls to 3.9 in 24 hrs; plateaus and begins to rise
again to 6.2 in 96 hrs, levelling out to 6.4 in 192 hrs. The biphasic
character of the growth curve is clearly evident. It should be noted that
production of both the Af and Ab substances appear to begin during the
second log phase of the growth curve and concurrent with the increases in
pH from 4 in 72 hrs to 6.4 in 120 hrs. From· the NaN03 variation
97
experiment, this represents the optimum conditions for the largest zones
of inhibition achieved so far: Ai, 23.3 mm; Ab, 24.1 mm.
c) Sucrose variation
The growth profile (O.D.; 650 nm) of strain A, grown in medium 4, at
. 37°C, 90 r.p.m. and at the sucrose percentage concentrations of 0, 0.5, 1,
2, 3, 4 and 5 are shown at Fig. 3.66. The media containing 0.5 and 1 per
cent sucrose gave conventional growth .curves with the 0.5% curve
occurring at lower stationary phase O.D.s. The 0.0% curve which has only
glycerol as a carbohydrate source, rises steeply to O.D. 0.60 in 48 hrs then
falls to O.D. 0.402 in 72 hrs before gradually rising with increasing time to
.O.D. 0.75 in 192 hrs. From 2.0 to 3.0%, there is a tendency towards
biphasic growth which has its best expression at 3.0%. The 4 and 5%
media gave rise to similar growth profiles: there is an initial O.D. rise to
about 0.116 in 24 hrs, followed by a further, gradual rise with increasing
time to about O,D. 0.350 in 192 hrs. These last two media gave by far the
poorest overall growth.
The Ab zone of inhibition/time profiles of strain A, grown in medium 4, at
the sucrose concentrations and conditions cited above are shown at Fig.
3.67. No zones of inhibition were detected at the 0, 0.5 and 5.0%
concentrations throughout the incubation period. The zone of inhibition
profiles of the 2 and 3% media are similar in that production seems to
increase with time but are different in that the first detected zone of
inhibition for the 2.0% medium occcurred at 120 hrs, and that of the 3.0%
medium occurred after 144 hrs. The 4.0% and 1.0% profiles appear at the
same time (192 hrs) but much later than the 2 and 3% media .. Of the
above four profiles, the 4% zone of inhibition curve is comparatively
greater and rises to 21.5 mm in 192 hrs, followed by the 3% and 2% which
rises from 15.7 mm in 144 hrs to 19.7 mm in 192 hrs and from 16 mm in
120 hrs to 19.1 mm in 192 hrs, respectively (of the same order). Last of
all comes the 1%, which rises to 14.4 mm in 192 hrs.
98
The Af zone of inhibition/time profiles of strain A, grown in medium 4, at
the sucrose concentrations and conditions cited above are shown at Fig ..
3.68. No zones of inhibition were detected at 5.0% concentration
throughout the incubation period and at 4.0%, evidence of antifungal
production was only detected after 192 hrs. Zones of botli the 0% and
0.5% sucrose media, which were of the. same order (15 mm), were first
detected at 168 hrs. Production in the latter appeared to increase with
time whereas the former's zones of inhibition remained at the same level
throughout. The 1 % and 2% concentrations, with similar profiles, also
gave zones of inhibition of the same order. (17.5 mm) which when they
once appeared, stayed level with increasing time. However, though similar,
the 1% zone of inhibition appeared much earlier, at 48 hrs and the 2%
. first appeared at 96 hrs. The initial zones of the 1% medium were also
noticably larger: 15.8 mm, compared to 14.3 mm. In contrast to the
general trend, the 3% profile starts with a zone of inhibition of 17.2 mm
at 120 hrs, rises with increasing time to a peak at 19.3 mm in 144 hrs then
gradually falls to 17.7 mm in 192 hrs. As can be seen, zones here (3%),
are much larger than the zones of all the other profiles.
The growth profile (O.D.; 650 nm), the Ab and Af zone of inhibition
profiles and the pH profiles of strain A, grown in medium 4, at 90 r.p.m.,
37°C are shown at Fig. 3.69. The graph is similar to that of Fig. 3.
(medium 3), the only significant difference being the Af zone ·of inhibition
profile which appears 24 hrs later ..
d) Glycerol variation
The growth curve profiles (O.D.; 650 nm) of strain A, grown in medium
4, at 37°C, 90 r.p.m. and at the glycerol percentage concentrations of 0, 1,
2, 3, 4, 5, 6, 7 and 8 are shown at Fig. 3.70. The 0 and 5% profiles are
similar and describe biphasic growth profiles where the final stationary
phase falls away with time. However, final stationary phase O.D. of the
0% curve occurs at a lower level (O.D. 0.401 as opposed to O.D. 0.608 for
99

5%, all at 144 hrs). Profiles 1 to 4% also exhibit some biphasic growth
. where the initial log phase is followed by a fall in O.D. to a 'trough',
between 120 hrs - 144 hrs, after which time they rise again with increasing
time .. After an initial log phase, rising to O.D. 0.56 in 48 hrs, the. 6% .
profile attempts a stationary phase but this begins to fall from 72 hrs, to
0.0. 0.295 in 120 hrs. This fall is followed by a second short log phase,
rising to O.D. 0.416 in 144 hrs which then falls to O.D. 0.233 in 192 hrs.
The 7% profile is not unlike the 6% but manages a longer stationary
phase, reaching O.D. 0.56 in 96 hrs, after an initial log phase rise to O.D.
0.416 in 144 hrs. Here, it also fails to achieve any form of secondary log
phase but falls fairly steeply to O.D. 0.208 in 192 hrs. As can be seen, this
profile occurs at lower O.D.s than the 6% profile.
The Ab zone of inhibition/time profiles of strain A, grown in medium 4, at
the glycerol concentration and conditions cited above are shown at Fig.
3.71. Throughout the incubation period, no zones of inhibition were
detected for the 0, 1, 2, 3% concentrations and at 4%, evidence of Ab
production was detected only after 192 hrs. With the remaining . ,
concentrations, there appears a general increase in Ab production with
increasing time, though the 8% profile levels out to 19.7 mm in 192 hrs .
. Other differences lies in the first detection of zones which often occurred
at different times: the 7 and 8% profiles first appear with zones of the
same order (=. 16 mm) at 72 hrs; the 6% profile, at 120 hrs (15.8 mm) and
the 5%, at 144 hrs (14.9 mm). The 8% medium gave rise to the largest
zone of inhibition (20.2 mm) at 168 hrs.
The Af zone of inhibition/time profiles of strain A, grown in medium 4, at
the concentrations and conditions cited above are shown at Fig. 3.72. No
zones of inhibition were detected for the 0 and 1% concentrations
throughout the incubation period and at 2% concentration, evidence of Af
production was detected only after 192 hrs. The 3% concentration profile
first appeared with a zone of 19.6 mm at 168 hrs and rises with increasing
time to 23.6 mm in 192 hrs. The appearance of the 4 to 7% profiles do
100

not genera\Iy continue to rise with increasing time but rather tends to
stabilize between a 17-20 mm zone of inhibition band and here, the initial
rise of the 7% profile above 20 mm, is the exception. First detection ofAf
activity for each of the 4-7% media occurred at different times: the 7 and
8% profiles, first occurs at 48 hrs, the 6% profile at 96 hrs, the 5% profile
at 120 hrs and the 4% profile at 144 hrs. The 2% and 3% mediadearly
produced the largest zones of inhibition after the longest recorded time
(24.4 mm and 23.6 mm respectively after 192 hrs).
A graph of Ab zone of inhibition profiles measured at 0 hr, 4~ hrs, 72 hrs,
96 hrs, 120 hrs, 168 hrs, 192 hrs, against percentage glycerol concentration
is shown at Fig. 3.73. No zones of inhibition were detected up to 48 hrs
at aU concentrations. There is a general trend of a gradual increase in
production with increasing percentage concentration, at a\I times, after 72
hrs. The 192 hrs profile however, shows increases in zone of inhibition
with increasing concentration to 6% (19.3 mm) then levels out, reaching
19.7 mm at 8%. The largest zones of inhibition were exhibited at 8% after
144 hrs to 192 hrs. Up to 144 hrs, there is a progressive increase in zone
sizes with increasing incubation time, mainly from 72 hrs to 120 hrs.
A graph of Af zone of inhibition profiles measured at the same times,
glycerol concentrations (medium 4) and conditions cited above is shown at
Fig. 3.74. Zone size measurements between 2 to 8% concentration, and
after 72 to 168 hrs, tend to lie between a 16-20 mm zone of inhibition
band. The zones of inhibition, measured in ascending glycerol percentage
concentration media, at 48 hrs, were first detected at 7% and thereafter,
zone size feU with increasing glycerol concentration. The zone of inhibition
profiles at 192 hrs, first appears with a zone of 24.4 mm at 2%
concentration, faUs graduUy with increasing concentration to 19.5 mm at
4% then levels out within the zone of inhibition band described above as
the glycerol concentration is increased further. The 7 and 8% profile first
appears at 48 hrs, the 6% at 96 hrs, the 5% at 120 hrs, the 4% at 144 hrs,
the 3% at 168 hrs and the 2% at 192 hrs. No zones of inhibition were
101

detected in the 0 and 1% media throughout the incubation period. The
largest zone of inhibition, 24.4 mm, was detected in the 2% medium at 192
hrs, closely followed by that detected in the 3% medium (23.6 mm) also at
192 hrs.
The O.D. growth profile, the Ab and Af zones of inhibition profiles and
the pH profile of strain A, grown in medium 4 of 2% glycerol (medium 5),
at 90 r.p.m., 37°C are shown at Fig. 3.75. The pH profile falls very
gradually from 6.8 to 5.5 at 96 hrs and then very gradually rises to 6.6 in
192 hrs. The biphasic character of the O.D. profile is clearly evident and
here again, the time of detectable production of the antifungal substance/s
coincide with the rise of the second log phase. No antibacterial activity
was detected throughout the incubation period. From the percentage
glycerol variation experiment, this represents optimum conditions for the
largest Af zone of inhibition, 24.4 mm, achieved so far.
e) pH variation
The growth profiles (O.D.; 650 nm) of strain A, grown in medium 5, at
37°C and at initial pHs of 3,4, 5, 6, 7, 8 imd 9 are shown at Fig. 3.76" At
. pH 3 there was hardly any change in the initial O.D. throughout the
incubation period. The pH 4, 5, 6 and 7 profiles all exhibit some biphasic
character. The pH 4 and 5 profiles have a relatively short mid-stationary
phase (24 to 96 hrs) followed by a gradual rise in O.D. but the pH 6 and·
7 profiles, after the initial log phase; exhibit a longer mid-stationary phase
. (24 to 144 hrs). Growth in media of pH 8 and 9, follow a conventional
growth curve profile with a hint of biphasic character in early stationary
phase (72 hrs) for 9 and mid-stationary phase (120 hrs) for 8.
The Ab zone of inhibition/time profiles of strain A, grown in medium 5, at
the pHs and conditions cited above are shown at Fig. 3.77. Only the pH
3 media registered zones and this started with 18.6 mm at 48 hrs and
gradually rose to 29.1 mm in 192 hrs.
102

The Af zone of inhibition/time profiles of strain A, grown in medium 5, at
the pHs and conditions cited above are shown at Fig. 3.78. No zones of
inhibItion were detected for pHs 3 to 5 throughout the incubation period.
The remaining pHs alI gave rise to zones of inhibition but only at 192 hrs .
. By far the largest zone of inhibition, 25.4 mm,occcurred with the pH 8
medium, folIowed by pH 7, 20.5 mm; pH 9, 17 mm and pH 6, 15 mm.
The growth profile (0.0.; 650 nm), the Ab and Af zone of inhibition
profiles and the pH profile of strain A, grown in medium 5, at pH 3, 90
r.p.m., 37°C are shown at Fig. 3.79. The pH profile remains steady, barely
faIling with time. No antifungal zones of inhibition were detected
throughout the period of incubation. Peak Ab zone of inhibition (29.1
mm) occured at 192 hrs.
The 0.0. growth profile, the Ab and Af zone of inhibition profiles and the
pH profile of strain A, grown in medium 5 of pH 8 (medium 6), at 90
r.p.m., 37°C are shown at Fig. 3.80. The pH profile initially falIs to 4.4 in
48 hrs then levels out to 72 hrs, climbs to about 5.8 and maintains this level
throughout. A statisticaIly significant though small biphasic character is
evident as shown by a rise in 0.0. from 144 hrs which then levels off
reaching at 192 hrs. Antifungal activity was only detected at 192 hrs and
Ab activity was detected throughout the incubation period. From the pH
variation experiments, this represents the optimum conditions for the
largest Af zone of inhibition (25.4 mm) achieved so far in smaU 50 ml
batch cultures.
f) Agitation rate (RPM) variation
The growth profiles (0.0.; 650 nm) of strain A, grown in medium 6, at
37°C and at the r.p.ms of 0, 40, 60, 90, 120, 150, 180 and 210 are shown
at Fig. 3.81. The 180 and 150 r.p.m. curves describe conventional growth
curve profiles and although the 210 r.p.m. curve is similar to the above
two, it differs in that there is a 24 hrs lag phase. The 120 r.p.m. is also
similar to the above but dips to 0.0. 1.507 at 168 hrs before gradually
103

rising. to O.D. 1.549 in 192 hrs. The 90 r.p.m. is also similar but exhibits
, a statistically significant, though small biphasic tendency, with mid-
. stationary phase around 120 hrs. The 60, 40 and 0 r.p.m. curves, though
initially following a conventional growth curve profile, begin to gradually .
fall away after 72 hrs, and here, stationary/decline phase O.D. increased
with increasing r.p.m.
The Af zone of inhibition/time profiles of strain A, grown in medium 6, at
the r.p.ms and conditions cited above are shown at Fig. 3.82. No zones of
inhibition were detected at 210 r.p.m. throughout the period of incubation.
The 0 r.p.m. (static incubation) profile was first detected with a zone of 16
mm at 24 hrs. It then remainsvirtually constant until after 144 hrs where
it begins to rise, peaking at 17.8 mm after 168 hrs, then falls to 16.1 mm
at 192 hrs. The 40 r.p.m. profile is similar but after a zone of 15.7 mm at
24 hrs, it rises to the higher level of 19.5 mm in 72 hrs before levelling out
and following a similar profile to that of 0 r.p.m .. The 60 r.p.m. profile is
similar to the 40 r.p.m's, up to 17.8 mm in 144 hrs where it dips slightly to
17 mm in 168 hrs before rising to 20.9 mm in 192 hrs. Zones of inhibition
were at first not detected during the period of incubation at 90 r.p.m. until
at 192 hrs where a zone of 25.4 mm was detected. The profiles of 120
r.p.m., 150 r.p.m. and 180 r.p.m. are all similar to each other in that, with
the exception of 180 r.p.m. which starts late at 72 hrs, they were all first
detected after 24 hrs and generally rose with increasing time. By far the
largest zone of inhibition (29.8 mm) was detected at 120 r.p.m. (192 hrs)
followed by 25.9 mm at 150 r.p.m.; 25.4 mm at 90 r.p.m. and 24.9 mm at
180 r.p.m., all at 192 hrs.
A graph of Af zone of inhibition profiles of strain A, measured at 0 hrs, 24
hrs, 72 hrs, 120 hrs, 144 hrs, 168 hrs, 192 hrs, against the shake rate
(r.p.m.) is shown at Fig. 3.83. At 24 hrs, a zone of inhibition of 16 mm was
registered at 0 r.p.m. and this remained constant with increasing r.p.m. to
60 r.p.m. It then dropped to zero at 90 r.p.m., rising again to 16 mm at
120 r.p.m., falling to 14.5 mm at 150 r.p.m. before finally falling to zero at
104

---- - ------------------
180 r.p.m. This general profile pattern is repeated after 24 hrs to 168 hrs
with small differences, that is to say, from 0 to 40 r.p.m., there occurs an
increase in antifungal production with increasing r.p.m., followed by a fall
at 60 r.p.m. It is to be noted here that the final fall in zone of inhibition,
occurs at 210 r.p.m. (not 180 r.p.m. as per the 24 hrs profile) and, from
120 r.p.m. to 180 r.p.m., zone of inhibition profiles progressively increase
in level with increasing time. The zone of inhibition profile measured at
192 hrs, starts to increase with increasing r.p.m. to a peak of 29.8 mm at
120 r.p.m., begins to fall to 25.9 mm at 150 r.p.m., then falls to zero at 210
r.p.m. It is to be noted that unlike the rest, the zone of inhibition profile
here, does not fall at 90 r.p.m.
The growth profile (O.D.; 650 nm), the Af zone of inhibition profile and
the pH profile of strain A, grown in medium 6 at 120 r.p.m., 37°C are
shown at Fig. 3.84. The pH profile begins at 8 and gradully falls to 5.7 at
144 hrs, levels out thereafter to 168 hrs before gradually rising to 6.1 in 192 .
hrs. From the r.p.m. variation experiment, this represents the optimum
conditions for the largest Af zone of inhibition (29.8 mm) achieved so far
in small 50 ml batch cultures.
g) Temperature variation··
. The growth profiles (0.0.; 650 nm) of strain A, grown in medium 6, at 120
r.p.m. and at 22°C, 27"C, 32°C, 37°C and 42°C are shown at Fig. 3.85.
The 22°C profile rises gradually to O.D. 0.571 in 216 hrs. The 32°C and
27°C curves describe conventional growth curve profiles with the latter occurring at a lower stationary phase 0.0. (2.1 and 1.55 in 216 hrs,
respectively). The 37°C profile is similar to that of 32°C but dips to 0.0.
1.507 in 168 hrs and gradually rises to O.D. 1.737 in 216 hrs. Of the two,
the 32°C profile has overall the best growth. The 42°C growth profile
initially follows the 32°C profile, up to 24 hrs, falls steeply to O.D. 0.281 .
in 72 hrs then levels out to O.D. 0.280 in 216 hrs. Cell
aggregation/clumping was seen, after 72 hrs, in all the flasks incubated at
105
I
22°C and 27°C. A malodour was emitted, after 96 hrs, from flasks
incubated at 42°C.
The Af zone of inhibition/time profiles of strain A, grown in medium 6, at
the temperatures and conditions cited above are shown at Fig. 3.86: No
zones of inhibition, were detected at 22°C and 47°C throughout the
incubation period. At 37"C the production generally increases with
'increasing time. At 27°C the profile initially increases to 22.4 mm ill 72
hrs, but levels out to 120 hrs, rises to 24.6 mm in 144 hrs, then after 168
hrs, begins to fall away to 20.2 mm in 216 hrs. At 32°C, there is rapid production at the early stages of the incubation period with a rise to 25.8
mm in 24 hrs which levels out and then begin to rise again to 30.6 mm in
192 hrs, levelling to 31.4 mm in 216 hrs. The largest zone of inhibition,
35.5 mm, was detected at 37°C and at 216 hrs. It should also be noted
that at 192 hrs, both the 32°C and 37°C situations gave rise to comparable
zone sizes.
The growth profile (O.D.; 650 nm/time), the Af zone of inhibition profile
and the pH profile of strain A, grown in medium 6, at 120 r.p.m., 32°C are
shown at Fig. 3.87. The pH profile falls steeply within 24 hrs to 5.9 and , ' ,
levels out, maintaining this value throughout the remaining period of
'incubation. The Af zone of inhibition profile indiCates high initial levels of
production.
The growth profile (O.D.; 650 nm/time) of the Af zone of inhibition profile
and the pH profile of strain A, grown in medium 6, at 120 r.p.m., 37°C are " shown at Fig. 3.88. It is similar to Fig. 3.84 but shows further increases in
, antifungal production with increasing time (35.5 mm at 216 hrs).
h) SummaI)'
A summary of the optimization experiments with corresponding percentage
increases in zone of inhibitions sizes, starting from the complete medium
is shown at Table 3.18. An increase of 109% was finally achieved and the
106

. greatest single increase in zone size occurred during the r.p.m. variation
. experiment.
i) Statistical error calculations·
The 0.0. measurements were found to have a stochastic coefficient of
variation of 33%, the pH measurements of 7.3%, the Ab zones of .
inhibition measurements of 11.2% and the Af zone of inhibition
measurements of 12.4%. The stochasic error of variation experiment,
repeated for the final medium and conditions, gave rise to the.foIIowing
variations: OD, 6.9%; pH, 2.8% and Af zone of inhibition, 4%, done at
pH 8 and 120 r.p.m.
j) Scale-up fermentations
Two sequences of a simple scale-up optimization trial (variation of
agitation turns/min (tr/min) and aeration, Jitres/min (Umin)) in the 6-litre
laboratory scale fermentor are shown at Table 3.19(a) and (b). Optimum
conditions o~ 100 tr/min, 4 Umin, at 37°C in 6 days, were eventuaIIy obtained, using visual colour assessments, based on a rating system of +;
++; and ++:+- (where the intensity of yeIIow colour corresponds with
activity of the broth filtrate).
3.5.5 Isolation and Purification of the Antifungal Principals
. a) Determination of appropriate solvent systems
i) Solvent for broth extraction
Results of the first tier of the Aszalos and Issaq solvent system strategy
(Aszalos and Issaq, 1980) were as at Table 3.20 a) and b) Fig. 3.89. It
shows at the first tier, some 'rocket' movement of the antibiotic spot on
analytical TLC plate for the MeOH/CHCI3 (l/9) elution and subsequent
107

sparse movements at the second tier. Of the solvents tried at Fig. 3.90,
only. AcOH/CHCI3 (1/9) gave best separation and subsequently, best
immiscibility for the aqueous broth.
ii) Solvent for TLC extraction
A stage by stage development of solvents for the TLC extraction of the
antibiotics is shown at Fig. 3.91. This in essence constitutes the skeleton
of the 'isolation of antifungal antibiotic flowchart' and may therefore be
read in conjunction with Fig. 3.92.
A flowchart for the isolation and purification of the antifungal and
antibacterial substances using a liquidffLC route is shown' at Fig. 3.92.
Three, light yellow, amorphous, antifungal substances AF1, AF2 and AF3
were extracted and a yellow, crystalline, antibacterial substance, AB1, was
also extracted. Yields of 50 mg/lOL, 19 mg/lOL and 19 mg/lOL were
obtained for AF1, AF2 and AF3, respectively, from the lab-scale
fermentor.
b) A check for purity
i) HPLC
The initial test on analytical TLC plate (3.3.4; C), to ascertain whether the
antibiotic substances were likely to pass safely through the HPLC column
showed some 'rocket' movement of the antibiotic spots in solution B but
no movement in solution A.
ii) Gas chcromatography
The G.C. antibiotic/ethanol solution scan, substracted from the control
ethanol scan, indicated a single peak of retention time 12.8 mins for AF1.
108

- .- -----c--:----
Single peaks were also obtained in the same way for AF2, retention time,
16.3 mins and for AF3, retention time 21.8 mins.
3.5.6 Microbiological Properties
The minimum inhibitory concentrations (MICs)of AF1 against 9 microorganisms
are shown at Table 3.21. The antibiotic generally shows strong antifungal activity
but is also. potent against ~. aureus. It appears most potent against T.
mentagrophytes.
Four sets of inhibition results left over from the agar diffusion MIC experiments,
featuririg T. mentagrophytes; A. niger, f. chasogenum and ~. aureus, are shown
at Figs. 3.93, 3.94, 3.95, 3.96, respectively; After daily observation to monitor
stable zone size, the photographs were taken after 5 days incubation at 30°C for
fungi and at 37°C for bacteria. T. mentagrophytes gave the largest stable zones
per concentration (mg/ml) followed by~. chasogenum than A. niger.
Thirteen millimetre Whatman's disc zones of inhibition produced by the 3
antifungal antibiotics, against seeded C. albicans which had been left incubating
at 30°C for 4 days are shown at Fig. 3.97. After 24 hrs, the zones of inhibition of
AF1, AF2 and AF3 were 21.3 mm, 24.6 mm, 23.3 mm respectively. After"the 4
days, AF3's zone had been completely overcome, AFl's zones nearly overcome
but AF2's zone remained intact.
3.5.7 Spectral Data
a) uvMs spectra
The uvMs scan of AF1 is shown at Fig. 3.98. There are two large peaks
at 218.5 nm and 243 nm with absorbances of 1.88 and 1.86 respectively,
and a smaller peak at 287 nm with an absorbance cif 0.934.
The uvMs scan of AF2 is shown at Fig. 3.99. The peaks which occur one
after the other at 216.5 nm, 244 nm,· 269 nm, 290 nm, 328 nm, 348.9 nm
109

have corresponding absorbances of 0.981, 0.650, 0.437, 0.248, 0.165 and
0.115.
The uv/vis scan of AF3 is shown at Fig.3.100. There is one peak at 209 nm
with an absorbance of 0.783.
The uv/vis scan of ABl was identical to that at Fig. 3.42 ..
b) I.R. Spectra
The IR spectra of AFl is shown at Fig. 3.101. Salient peaks include those
at 3540, 3428, 3060, 3024, 2924, 1710, 1582, 1478, 1460, 1434, 1272, 1180,
1154, 754, 700.
The IR scan of AF2 is shown at Fig. 3.103. Salient peaks include thoseat
3364, 2920, 2852, 1732, 1508, 1454, 1376, 1362, 1066, 672.
The IR scan of AF3 is shown at Fig. 3.104. Salient peaks include those at
3300, 2956, 2920, 2852, 2332, 1732, 1566, 1520, 1462, 1420, 1308, 1260,
1152, 1120, 854, 796.
The IR scan of ABl was identical to that at Fig. 3.55.
c) NMR Spectra
The NMR scan of AFl is shown at Fig. 3.102. Salient peaks are to be
found at 7.4 a (d), 7.2 a (d), 3.8-4.3 (m) 1.9 a (d), 1.25 a (m) 0.75 a (d).
d) Mass spectrometIY
A low resolution mass spectrometry scan of ABl was similar to that at Fig.
3.49.
110

Table 3.1: Zone of inhibition results (mm) of multi disk code U4, tested against strain A (P9897), strain B (P9898) and. a range of microorganisms.. These. results were used in the development of selective media. The antibiotics, with their corresponding concentrations,' are as listed. Bacteria were incubated on NA at 37°C and fungi on NspA at 30°C.

Table 3.1: SELECJ1VE MEDIUM DEVELOPMENT
MULTIDISK CODE U4
.
ORGANISM/AN P 9897 P 9898 Ps.aeruginosa· Ps.antim~cetica Ps.malti~hilia . Ps.cocovenenans E.coli TIBIOTIC
TE 17 mm 21 mm Omm Omm Omm 24 mm 23 mm CN 21 mm 23 mm 33 mm 25 mm 31 mm 12 mm 29 mm CR Omm Omm Omm Omm Omm Omm 23 mm CT Omm Omm 15 mm 17 mm 19 mm Omm
'.' 15 mm
SF Omm Omm Omm Omm 13 mm 28 mm 10 mm AMP Omm Omm Omm Omm Omm Omm 27 mm CAR 19 mm 27 mm 15 mm Omm 15 mm Omm >40 mm SXT Omm 13 mm Omm Omm Omm 26 mm >40 mm
ORGANISM/ Sal.abon~ S.aureus S.e~idermis B.cereus S.marcescens S.cerevisiae P.chmogenum ANTIBIOTIC .
.
TE 29 mm >40 mm >40 mm 35 mm 23 mm Omm 'Omm
CN 13 mm >40 mm 25 mm 16 mm 18 mm Omm Omm CR 16 mm >40 mm >40 mm 21 mm 13 mm Omm Omm CT 11 mm 15 mm 28 mm ·Omm 14 mm Omm Omm SF ,21 mm 19mm· 31 mm 13 mm 35 mm Omm Omm . AMP 33 mm >40 mm >40 mm 23 mm 20 mm . Omm Omm CAR
-33 mm >40 mm >40·mm· 23 mm >40 mm Omm Omm .
SXT 18 mm >40 mm 33 mm Omm 37 mm Omm , Omm
KEY: Abbreviation Antibiotic Concentration
TE Tetracycline 50,,8 CN Gentamicin 10,,8 CR Cet!'alOridine 25 ,,8 CT Co ' tin sulphate 10 ,,8 SF Sulphafurazole 500,,8 AMP Amgicillin 25,,8 CAR Car enicillin 100,,8 SXT Co-Trimoxawle . 25 ,,8

ORGANISM P 9897 P 9898 P,aeruginosa P.antimvcetica P.maltiEhitia TEST
OXlDIFERM (OiF)
~ ~ ~ r--:----: ~ GLUCOSE
FRUCTOSE I~+ ~+ ~ + F~ + F~ + SUCROSE I~+ ~+ ~ - F'-Z. + F~ + GALACTOSE I~+ .~+ ~- + I~ - I~ + LAcroSE ~ - ~ -~ r _ - ~ - ~ -MALTOSE ~- I~ - ~ - ~ + ~ + MANNITOL N + I~ + ~ + ~ 1". _. - N - :
OXIDASE + · ·
ONPG + + · · + .
CATALASE + + + + +
MR · ·
VI> · · · · INDOLE · · · · ·
NITRATE + + + + +
STARCH HYDRO' · · · + ·
UREASE + + + + +
AESCULIN + · · · +
LIPASE . + + + + +
LECITIIlNASE + · · + ·
~ BOXYLASE
ORNmtINE · · · · · LYSh'ffi · · · DNase · · . · +
HEAMOLYSIS · · + · +
TOLERANCE TTCl% · · + + · NaC16.5% · · · · 4Z'C · · + + +
Polymy.aa MIC ID"' 10'" 10-' 10-' ID"' [mymI]
· · + + + Cetrimide 0.03%
· · + · · Pseudomon8ll agar
+ + + + + MacConkg: agar
+ + + + + Minimal Med
Table 3.2: Biochemical/tolerance test results of strain A and B with 3 pseudomonads as controls (Cowan & Steel, 1974; MacFaddin, 1983; Palleroni, 1984).
112
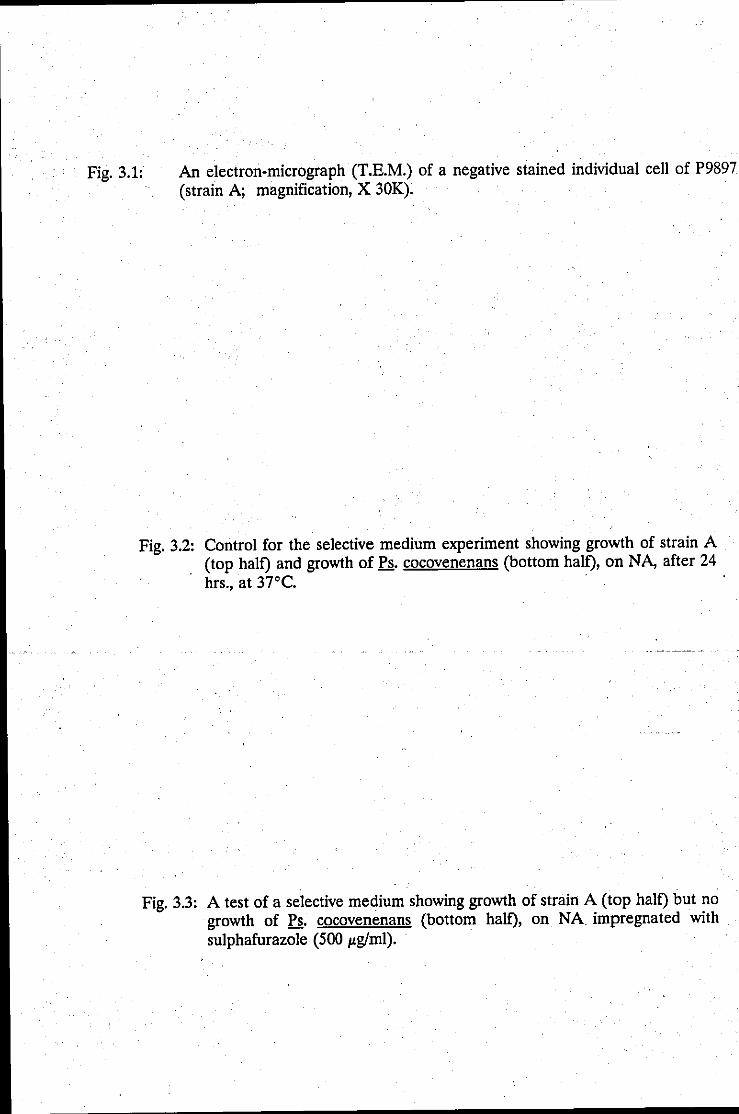
Fig. 3.1: An electron-micrograph (T.E.M.) of a negative stained individual cell of P9897 (strain A; magnification, X 30K).
Fig. 3.2: Control for the selective medium experiment showing growth of strain A (top half) and growth of Ps. cocovenenans (bottom half), on NA, after 24 hrs., at 37°C.
Fig. 3.3: A test of a selective medium showing growth of strain A (top half) but no growth of Ps. cocovenenans (bottom half), on NA impregnated with sulphafurazole (500 /Lg/ml). .

Fig. 3. 1
Fig. 3.2
Fig. 3.3
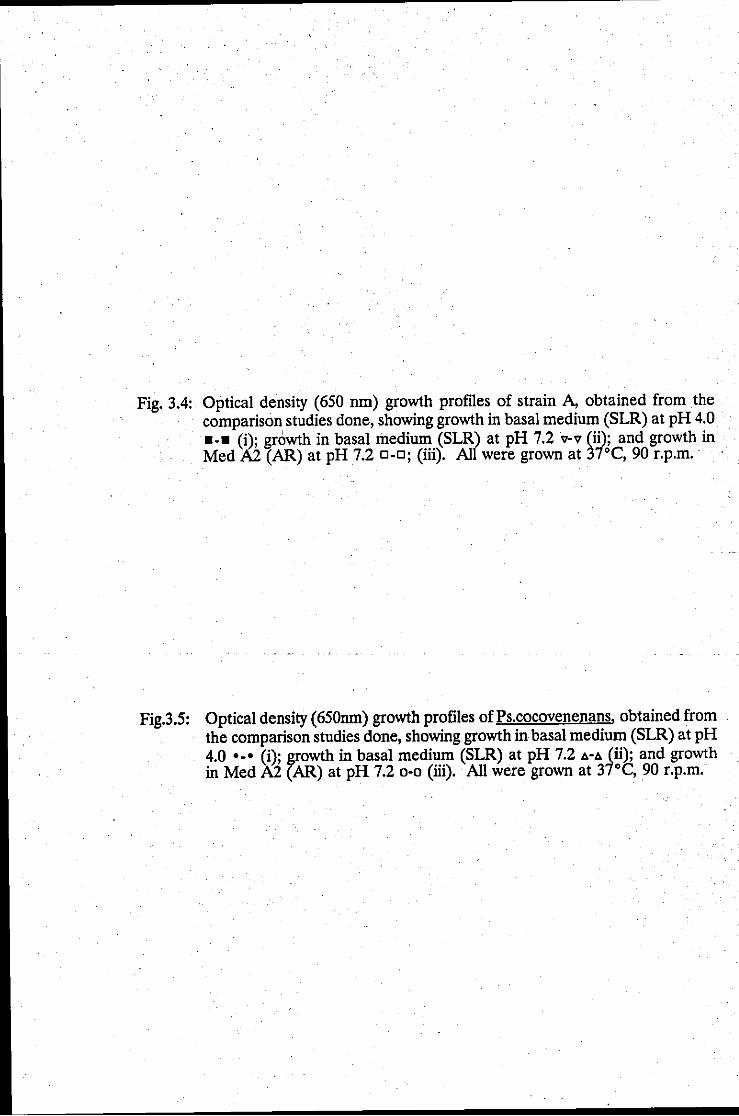
Fig. 3.4: Optical density (650 nm) growth profiles of strain A, obtained from the comparison studies done, showing growth in basal medium (SLR) at pH 4.0 _-_ (i); growth in basal medium (SLR) at pH 7.2 v-v (ii); and growth in Med A2 (AR) at pH 7.2 0-0; (iii). Alf were grown at 31oC, 90 r.p.m. . .
Fig.3.5: Optical density (650nm) growth profiles ofPs.cocovenenans, obtained from the comparison studies done, showing growth in basal medium (SLR) at pH 4.0 0_' (i); ~owth in basal medium (SLR) at pH 7.2 b.-b. (ii); and growth in Med A2 (AR) at pH 7.2 0-0 (iii). All were grown at 31o C, 90 r.p.m.

~ ~
§ ~
GJ • I
f ~
r rJJ? • n I err ~. ~".~,- .. .- .... ::--.... ~ " ......... :::::::::::-,.. ::,.....
'. '" ..... """, """,
S! d·
q (lUUOSS) Aj!SUaa IO~!!dO • M .
Cl .~
IJ..
114
/ I
;; 0
" S!
" ..
" ..
" ..
~
"
" S!
" ..
" ..
'? '-' ., E' !=
:5 ., ,,~ ..
" ...
" . -" o.

Fig . 3.6
Fig. 3.6: A control for the comparison studies (acidophyly) done, showing growth of strain A (top half) and growth of Ps.cocovenenans (bottom half), on NA at pH 7.2, after 24 hrs. incubation at 37°C.
Fig. 3.7
Fig. 3.7: Test for the comparison studies (acidophyly) done, showing profuse growth of strain A (top half) and no growth of Ps.cocovenenans (bottom half), on
A at pH 4.0, after 24 hrs. incubation at 37°C.

Table 3.3: Mean generation times (mgt) (min) of strain A (P9897) and B (P9898) and Ps.aeruginosa (control), grown in various constructed media to obtain their respective chemically defined medium (c.d.m.) ..
Table 3.4: Invasive growth inhibition of A.niger by strain A, B and other pseudomonads, grown on potato dextrose agar (PDA) and on Czapek dox agar, for 7 days, at 3D·C.

Table 3.3
GROwm CURVE STUDIES
MEDIA OGRANISM MEAN GENERATION TIME [MINS)
1 [A) Cruickshank's P 9897 170 + 6
basal P 9898 150 + 5
medium f··aeruginosa .. 100 + 5
2 [B) A + His. P 9897 99 + 6
Phenyl P 9898 104 + 5
3 [e) A + Arg. Orn P 9897 134±6
Lys Mdk. P 9898 97. + 5
4 P 9897 110±6 B+C P 9898 101 + 5 ..
5 A + Yeast P 9897 84±6 Extract P 9898 81 + 5
6 A + Ala, leu P 9897 106 + 6
.
Lys, His. P 9898 106 + 5
Orn ~.aeruginosa 83 + 5
Table 3.4
INVASIVE GROwm INHIBITION OF A. NIGER
ORGANISM . ZONE OF INHIBITION [MM)
POTATO DEXTROSE CZAPEK DOX AGAR AGAR
P 9897 15 ±..3 23 + 5
P 9898 15 ±3 18 + 5
U .. aeruginosa 15 .
Ps. antim~cetica 0 0
Ps. inaltiphilia >
0 O·
Ps. cocovenanans
Ps. cocovenanans 7+3 . .
116

Fig. 3.8:
Fig. 3.9:
Control for the invasive growth inhibition experiment, showing invasive growth of Aniger from the apex of the top half of the PDA plate, after 7 days incubation at 30·C.
A test experiment for invasive growth inhibition, showing inhibition of Aniger invasive growth, by strain A which had been streaked onto the bottom half of the PDA plate and incubated for 7 days at 30·C.
Fig. 3.10: A test experiment for invasive growth inhibition, showing inhibition of Anigerinvasive growth by Ps.cocovenenans which had been streaked onto the bottom half of the PDA plate and incubated for 7 days at 30·C.

Fig. 3.8
Fig. 3.9
Fig. 3.10

.
ANTIBIOTIC ACTIVITY/INCUBATION TIME [DAYS] ·
TEST BACTERIA FUNGI MEDIUM·
DAY 2 DAY? DAY 2 DAY 7
a · · · · ..
b · · · · c + · · · d + · · · e · · · · f · · · · g · · · · h · · · · i · · · · j · · · · k · · · · I · · · ·
·m · · · · n + · · · 0 · · · · p · + · + q + · + + r · · · · s · · · · t · · · · u · · · · v · · · + w · · · · x · · · · y · · · +
.
KEY: + ACTIVITY • NOACTMTY
Table 3.5: Results of the various media assayed for antibiotic activity: . c = basal medium; d = constructed c.d.m. for strain A; n = Czapek Dox liquid medium (CDLM); q ':" CDLM • modified and v = PDLM·1. Test· microorganisms used for the assay include E. coli (antibacterial) and C. albicans (antifungal).
118

Fig. 3.11:
Fig. 3.12:
A summation of optical density,(650 nm) growth profiles of strain A, grown in the basal medium (SLR) MCSD experiment: basal/complete medium, _-_; Med A1, 0-0; Med A2, 0_0; Med A3, 0-0; Med A4, .6.-.6.; .. Med AS, v-v; all at 37°C, 90 r.p.m., with an initial OD of.= 0.06. Standard deviations computed for each datum point are shown, where applicable, as error bars.
A summation of antibacterial (E.coli) antibiotic concentration (mg/ml x 1O"2)/time (h ) profiles, produced by strain A in the basal medium (SLR) MCSD experiment: basal/complete medium, ---; Med A1, 0-0; Med A2, 0_0; Med A3, 0-0; Med A4, .6.".6.; Med AS; v-v; all grown at 37°C, 90 r.p.m., with an initial OD. of .= 0.06. Standard deviation computed for each datum point are shown, where applicable, as error bars.

. M . "" .-'.l.
N
• M . Cl .-u..
5!
I
" I ..
•
...
~ . ..,..
~\
I
'"
-o-<l
\ / -o:r
~ ~
/\ <l-o-'
.,;
(WUOS9) ~!SuaQ IOO!ldO
I ..
119
I ...
'i>-
I 'i>-
I N
;; .,;
o
., ..
., .,
., ~
z '-'
., CD
... E ;::
., "
5!
.,
z '-'
., CD
... E ;::

Fig. 3.13:
Fig. 3.14:
A summation of optical density (650 nm) growth profiles of strain A, grown in the basal medium (AR) MCSO experiment: basal/complete medium, _-_; Med A1, 0-0; Med A2, e_e; Med A3, 0-0; Med A4, ~_~; Med AS, .... v;all at 37°C, 90 r.p.m., with an initial 00 of.=:. 0.06. Standard deviations computed for each datum point are shown, where . applicble, as error bars .
. A summation of antibacterial (E.coli) antibiotic concentration (mg/mI x 10 -z)/time (h) profiles, produced by strain A, grown in the basal medium· (AR) MCSO experiment: basal/complete medium, ---; Med A1, 0-0;
Med A2, e_e; Med A3, 0-0; Med A4, ~-~; Med AS, v-v; all grown at ... 37°C, 90 r.p.m., with an initial 0.0. of = 0.06. Standard deviations computed for each datum point are shown, where applicable, as error bars.

• M
· til ,~
LA ...
· en ,~
"-
•• ITT I • o O<i
~ \'1/ - o=t:r=-
\.~
>-!>-<
/ -!>o
I >-!>o
I -i>'
!jl.
0 .,
0 ...
'? ...... o CD ... E
1=
0
'"
!l
[:
~ 6:
o CD ... E
1=
r'----~'----~,----_., ----_., -----_~,-----.,------.o n ~ ~ N n_, ., 0 ~ N 0
120

Fig. 3.15: A summation of optical density (650 nm) growth profiles of strain A, grown in Med A2 of various percentage glucose concentrations: 0.3%, ___ ; 0.4, 0-0; 0.5%, ._.; 0.6%,0-0; 0.7%, t.-t.; 0.8%, .,.-.,.; 0.9%, v-v; 1.0%, +-+; all at 37°C, 90 r.p.m., with initial O.D. of = 0.06. Standad deviations computed for each datum point are shown, where applicable, as error bars.
Fig,3.16: A summation of optical density (650 nm) growth profiles of strain A, grown in Med A2 of various percentage glucose concentrations: 0.3%, ___ ; 0.24%, 0-0; 0.18%, ._.; 0.12%,0-0; 0.06%, t.-t.; 0.0%, v-v; all at 37°C, 90 r.p.m., with initial O.D. of =. 0.06. Standard deviations,
. computed for each datum point are shown, where applicable, as error bars.
.

.' .
• 0 .. 0
• '"
\ 0 ~ ..
. \.~ ~
o ., .., E ;:::
0 .. g
g 1.0 . (V) . Cl .-LL..
lIJe 0 <J --1>--. 0 OD
1/ I I / 0 "' . .:le 0 <J ~r:-
\/ I I I 0 ..
-~ <J 0;>-0
/ -:? ~
o ., .., E
;:: O~<J
0 .. 0 ~
<0
• '" . Cl g .~
LL..
~~~~~--~~~~~~--~~~~~----+o o ci
121

Fig. 3.17: A summation of antibacterial (E.coli) antibiotic concentration (mg/ml x lO-~/time (h) profiles, produced by strain A in Med A2 of various percentage glucose concentration: 0.3%, _-_; 0.4%, 0-0; 0.5%, 0_0; 0.6%, 0-0; 0.7%, .10.-.10.; 0.8%, ,,-,,; 0.9%, v-v; 1.0%, +-+; an grown at 37°C, 90 r.p.m.,· with initial 0.0. of =- 0.06. Standard deviations computed for each datum point are shown, where applicable, as error bars.
_ Fig. 3.18: A summation of antibacterial (E.coli) antibiotic concentration (mg/ml x lO-Z)/time (h) profiles, produced by strain A in Med A2 of various percentage glucose concentrations: 0.3%, ---; .0.24%, 0-0;0.18%, 0_0; 0.12%,0-0; 0.06%, .10.-.10.; 0.0%, v-v; an groWn at 37°C, 90 r.p.m. with initial. 0.0. of =- 0.06. Standard deviations computed for each datum point are shown, where applicable, as error bars.

• M
• Cl'> .-
• M
· Cl'> .-LL
o .. o .,
? ~
o CD ., E >=
.------r------.------r------.------r------.-----~O .. ., ... ., N·
122
o
o .. o .,
o ...
? ~
o CD ., E >=

Fig. 3.19: A summation of antibacterial (E.coli) antibiotic concentration (mg/ml x 10-2)1 glucose concentration profiles, produced by strain A in Med Al, at various times (h): 0 h, _-_; 24 h, 0-0; 36 h, 0_0; 48 h, 0-0; 60 h, 1>-1>;
all wown at 31oC, 90 r.p.m., with initial O.D of =- 0.06. Standard deVIations computed for each datum point are shown, where applicable, as error bars.

en . M . Cl .-Lo..,
---~..L
en o
co o
'" Cl) .m o 0
(.J ::l (3
Ill. Cl) • Cl
o C ..... C Cl)
e 'I; Cl) 00..
-o
r-----_r------,-----~r_----_r------,_------r_----_IJ0
~-OLX) (lw/6w) 'ouo:) ogO!QUu'V
123
- o

'E' c o t.()
e >--'r;;; c Q)
c 13 o
!;:C-
·0
10
•
0.1
16
.---...... ---
/ .r '0 .-c. 0
-E. 0)
g, •
0 C 0
U 0
:;:: 0 .-
..0 :;:: c
" .-.-- <C
a
---"""?"'-~-.+---+---+ -'----
O.Olr---r-----'".----.... ---,,----.----I-o 6 o 10· ~. ,30 ~ 50 60
Fig. 3.20:
Time Ch)
Optical density (650 nm) growth profile, - --; antibacterial (E. coli) antibiotic concentration (mglml x 1O-~ profile, A-A and pH profile, +-+ of strain A, grown in Med A2 (0.3% glucose concentration), at 37°C, 90 r.p.m., with an initial O.D. of =- 0.06. Standard deviations computed for each datum point are shown, where applicable, as error bars.
124

Fig. 3.21: A summation of optical density (650nm) growth profiles of strain A,. grown in Med A2 of various percentage NH4CI concentrations: 0.3%,-_; 0.24%, 0-0; 0.18%, e_e; 0.12%, 0-0; 0.06%, A-A; all at 37°C, 90 r.p.m., with initial 0.0. of.=:. 0.06. Standard deviations computed for each datum point are shown, where applicable, as error bars.
Fig. 3.22: A summation of optical density (650 nm) growth 'profiles of strain A, grown in Med A2 at various percentage NH4Cl concentrations: 0.06%, _-_; 0.05%, 0.0; 0.04%, e_e; 0.03%,0-0; 0.02%, A-A; 0.-01%, y-y; 0.0%, v-v; all at 37°C, 90 r.p.m. with initial 0.0. of.=:. 0.06. Standard deviations computed for each datum point are shown, where applicable, as error bars.

• 0
'"
l 0 ., • ~ 0 .. • ~
Z '-'
o CD ..... E i= ......
0 .. S!
N · •
Ol .-u..
•
• ~ • \\
N N
• '" • S! Ol .-u..
125

Fig .. 3.23: A summation of antibacterial (E.coli) antibiotic concentration (mg/ml x 1O"2)/time (h) profiles, produced by strain A in Med A2 of various percentage NH40 concentrations: 0.3%, _-_; 0.24%, 0-0; 0.18%, 0_0; 0.12%, 0-0; 0.06%, 4-4; all grown at 37·C, 90 r.p.m., with initial O.D. of =. 0.06. Standard deviations computed for each datum point are shown, where applicable, as error bars.
Fig. 3.24: A summation of antibacterial (E.coli) antibiotic concentration (mg/ml x 1O-2)/time (h) profiles, produced by strain A in Med A2 of various percentage NH4Cl concentrations: 0.06%, ---; 0.05%, 0-0; 0.04%, 0_0; 0.03%,0-0; 0.20%,4-4; 0.01%, T-T; 0.0%, v-v; all grown at 37°C, 90 r.p.m., with initial O.D. of· =. 0.06. Standard deviations computed for each datum point are shown, where applicable, as error bars.
i
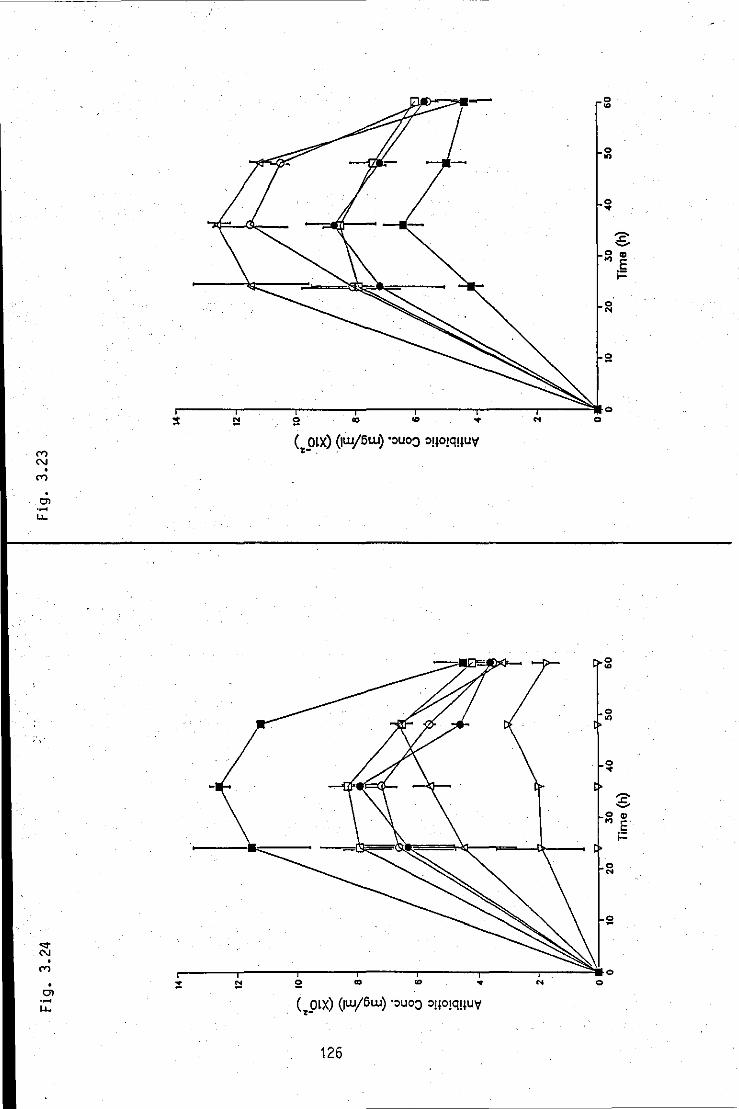
M N . .
Cl .~
w..
"
od' N
• M
• Cl .~
w..
o '"
o
'"
~ o CD ., E
i=
r------r------r-----,------.------,-----~r_--~~O .. .. .. o
( OLX) (lwj6w) ·~UO:> ~!I0!q!fUV %-. .
0
'"
0
'"
0 .. ~
0 " .., ~
0 .. S
r_----,-----~r_----,------.-------r------r_--~ .. O o
126

Fig. 3.25: A summation of antibacterial (E. coli) antibiotic concentration (mglml x _ 1O-2)/percentage NH4CI concentration profiles produced by strain A in Med A2, at various times (h); 0 h, _._; 24 h, 0 0 0; 36 h, 0.0; 48 h, 000; 60 h, ,\,.,\,; all grown at 37°C, 90 r.p.m., with initial O.D. of.=:. 0.06. Standard deviations computed for each datum point are shown, where applicable, as error bars. .

~-------.---
""' N o
M
o .., o
(])
0-0 N°.... o 0
..c ()
E :::J 01: o
~ E o E
« (]) 0') c
"E g e ocf
III o o
o en ' r-----~----_r----_r----_.------r_----~~~~g
00 .-
N - o to -(r_mx) (lw/Bw) °Ouo::> O!tO!q!WV
127
'N

10 32
.---------------------.r-10
1'. ..... 0
c o LO e >... -'in c Cl)
Cl
"6 o ~ o
-::::-
~ Cl
.§. • 0
C 0
U 0 :;:: 0
0.1 :0 :;:: c «
8
----+----+------+- -
O.Ol~---r__--_r"---r_--__r---...,_--_l_O 6 o 10 20 30 . 40 SO 60
Time (h)
Fig. 3.26: Optical density (650 nm) growth profile, ---; antibacterial (E.coli) antibiotic concentration (mg/ml x 1O-~ profile, A-A and pH profile, +-+ of strain A, grown in Med A2 of 0.06% NH.CI concentration (medium 1), at 37°C, 90 r.p.m., with an initial OD of -=. 0.06. Standard deviations . computed for each datum point are shown, where applicable, as error bars.
128

Fig. 3.27:
Fig. 3.28:
A summation of optical density (650 nm) growth profiles of strain A. grown in medium 1, buffered at various pHs: 3, ---; 4, 0-0; 5, 0_0; 6, 0-0; 7, A-A; 8, '1'-'1'; 9, v-v; all at 37°C, 90 r.p.m., with initial O.D. -=- 0.06. Standard deviations computed for each datum point are shown, where applicable, as error bars.·
A summation of antibacterial (E. coli) antibiotic concentration (mg/ml x . 1O-2)/time (h) profiles, produced by strainAin medium 1, buffered at . various pHs: 3, _-_; ·4, 0"0; 5, 0_0; 6,0-0; 7, A-A; 8, '1'-'1'; 9, v-v; all grown at 37°C, 90 r.p.m., with initial OD. -=- 0.06. Standard deviations computed for each datum point are shown, where applicable, as error bars. .

-------- --
..... N · '" · Ol .-u...
co N
• CV)
• Ol .-u...
kf 1\ <>~. \\ \ \ o ~ .. -0-. ~
129
• t> 0 .. /1 0
on • t>
I 0 .. • t>
11 '? ~
o ID .., E ;:::
0 «
g

Fig. 3.29: A summation of antibacterial (E. coli) antIbiotic concentration (mg/ml x. 1O·2)/pH, produced by strain A in Medium 1, at various times (h): 0 h, ___ ; 24 h, 0-0; 36 h, ._.; 48 h, 0-0; 60 h, A-A; all grown at 3JOC, 90 r.p.m., with initial C.D. of =. 0.06. Standard deviations computed for each datum point are shown, where applicable, as error bars. .

'" N •
'" . Cl ,~
u..'
'"
<o:c a.
r-----------.-----------~----------_r----------~~ 10 ~
o ~
10 o
130

--------------------~------~---- -- ----
'E' c: o Lt)
e >-
== CIl c: Q)
Cl
"5 0 :;: c.. 0
10 32
11 11 11
......... 1
0 ...... 0 c-
'E "'" Ol E
16 '= • 0 c: 0 u 0
1 :;: 0 .-
0.1 ..c 1 :;:
c: <
----'~------+------~~----+.------~
0.01l¥----,---.,----,----r----,----l- 0 o 10 20 30 40 50 60
Time (h)
7
::t CL
5
Fig. 3.30: Optical density (650 nm) growth profile, ---; antibacterial (E. coli) . antibiotic concentration (mg/ml x 10.2) profile, ~-~ and pH profile, +-+ of strain A, grown in medium 1 at pH 6.0 (inedium 2), at 3rC, 90 r.p.m., with an initial O.D. of =- 0.06. Standard deviations computed for each datum point are shown, where applicable, as error bars.
131

Fig. 3.31: A sUIIlIl}ation of optical density (650 nm) growth profiles of strain A,. grown in medium 2, at various r.p.m.: 40 r.p.m., ---; 60 r.p.m., 0-0;
90 r.p.m., 0_0; 120 r.p.m., 0-0; 150 r.p.m., A-A; 180 r.p.m., x-x; all at 37°C, with initial O.D. of =- 0.06. Standard deviations computed for each datum point are shown, where applicable, as error bars.
Fig. 3.32: A summation of antibacterial (E.coli) antibiotic concentration (mg/ml x 1O·2)/time (h) profiles, produced by strain A in medium 2, at various r.p.m.: 40 r.p.m., _-_; 60 r.p.m., 0-0; 90 r.p.m., 0_0; 120 r.p.m., 0-0;
150 r.p.m., A-A; 180 r.p.m., x-x; all grown at 37°C, with initial O.D. of =- 0.06. Standard deviations computed for each datum point are shown, where applicable, as error bars.
..-
I

'" • '" • '" .~
u.
N
'" · '" • '" .~
u.
o 5l
o ..
o .. z '-"
'" • E ~~ ;::
I r'
r---~----~--~----~----~--~----~--~O o .,. on
'" o
'" on N
132
o N
o

l' c
0 LO ~ >-....
'00 C III
Cl
""6 ,g .... a.. 0
10
0.1
, T T,/'"'-. • 1 '/1
• T ~
~.--T
64
,....., ",.
'0 ..--.0 c--€.. Cl
E 32~
.0 c o u o . B
=0 :0 :;: c <
_____ J . . L V+-t-+. i-+'-T/ .. ~---l---~ . .
0,"/ , o 100
4 o
Fig; 3.33:
20 40 60 BO TIme Ch)
Optical density (650 run) growth profile, .-.; antibacterial (E.coIi) antibiotic concentration (mg/ml x 1O.~ profile, 4-4 and pH profile +-+ of strain Po. grown in medium 2 at 120 r.p.m., 37°C, with an initial O.D. of =- 0.06. Standard deviations, computed for each datum point are shown, where applicable, as error bars.
133

Fig. 3.34:
. Fig. 3.35:
A summation of optical density (650 nm) growth profiles of strain Po. grown in medium 2 at various temperatures: 27°C, ---; 32°C, 0-0; 37°C, ._.; 42°C, 0-0; 47°C, A-A; all at 120 r.p.m., with initial 0.0. of =- 0.06. Standard deviations computed for each datum point are shown, where applicable, as error bars.. . .
A summation of antibacterial (E.coli) antibiotic concentration (mg/ml x lO-~/time (h) profiles,produced by strain A in medium 2 at various temperatures: 27°C, _-_; 32°C, 0-0; 37°C, ._.; 42°C, 0-0; 47°C, A-A; . all grown at 120 r.p.m., with initial 0.0. of =- 0.06. Standard deviations computed for each datum point are shown, where applicable, as error bars. -

... ~ OD <l
I /\ I .... 0 CJ • <l
\ / . / \ I ~CJ\r'
<l
I o ___ []I <l
I \/ \ I 000 • • ......:J-
\// ~. 1 ~
~/ g .; ...
'" (WUOS9) AI!SUaO ICO!ldO · C',
· 01 .~
L'-
· 01 ,~
u..
134
, -0 .;
0 g
0 ..
0 .. 0 ..
0
'"
0
o '"
'? ....-CD
.5 .....

Fig. 3.36: A summation of antibacterial (E.coli) antibiotic concentration (mg/ml x lO'2)/temperature (0C), produced by strain A in medium 2 at various times: 0 h, _-_; 24 h, 0-0; 36 h, e_e; 48 h, 0-0; 60 h, .1.-.1.; 72 h, T-T; 84 h, v-v; all grown at 120 r.p.m., with initial 0.0. of =- 0.06. Standard deviations computed for each datum point are shown, where applicable, as error bars.

ID CV) , CV)
, 01 ..... u..
o '<t
o t<)
, , r------.-------r,------"-------r,------"-------,r------.,-------rl ~ 0 III '<t t<)
o ~ 0 III Q III 0 tor) ~.. N ,.... ~
(t_OLX) (lLUjBw) 'ouoJ 0aO!qaU'v' 135

Fig. 3.37:
Fig. 3.38:
A summation of optical density (650 nm) growth profiles of strain A, grown in medium 2 at various initial O.Ds.: 0.200, ---; 0.150, 0-0;
0.100, e_e; 0.060, 0-0; 0.030, A-A; 0.015, v-v; all at 37°C, 120 r.p.m. Standard deviations compued for each datum point are shown, where applicable, as error bars. .
A summation of antibacterial (B.coli) antibiotic concentration (mg/ml x 1O-2)/time (h) profiles, produced by strain A in medium 2 at various initiaIO.Ds.: 0.200, _-_; 0.150, 0-0; 0.100, e_e; 0.060,0-0; 0.030, A
A; 0.015, v-v; all grown at 37°C, 120 r.p.m. Standard deviations . computed for each datum point are shown, where applicable, as error bars.

· 01 .-u..
00 CV')
• CV')
• 01 .-""
~--~----~~~-----r----~,----~--~----~o o .. '" ., o
" !!! o
136

Table 3.6: Sequence of optimization experiments with corresponding factoral increases in production, starting from the controVcomplete medium. MCSD stands for medium component single deletion of the complete medium.
Table 3.7(a): Summary of a simple scale-up optimization trial (variation of agitation . (tr./min) and aeration (Umin)) in the laboratory-scale fermentor.
Corresponding visual colour assessments where increase in intensity relates to increase in antibiotic activity are based on a rating system of + 1 to + 6 which was used to monitor sequential progress, each at 72 hrs.
Table 3.7(b): Summary of a further optimization trial (variation of time (days)) on optimal conditions achieved at table 3.7(a). An antibiotic assay against E. coli (zone of inhibition (mm)) was used to monitor progress.

Table 3.6
SEQUENCE OF OPTIMIZATION FACTORlALINCREASE EXPERIMENTS EXPERIMENTS IN PRODUCTION
1 Medium A 1 ..
(Control)
2 MCSD 1.8 Experiment (Medium B)
3 Variation of glucose • (Medium B)
4 Variation of 2.8 NH,C1 (Medium C)
5 Variation of pH 4.3 (Medium E)
6 Variation of r.p.m. 9.3
7 Variation of temperature •
8 Variation of initial O.D. " .
Table 3.7
a) b)
OPTIMIZATION IN THE LAB-SCALE 150 tr./min. 4l)min FERMENTOR
AGITATION AERATION VISUAL TIME ZONE OF COLOUR I INHIBITION OBSERVATION
(TURNS/MIN) (LITRES/MIN) (RATING) (DAYS) (MM)
100 1 + 1 0.0
200 1 ++ 2 18.5
150 1 +++ 3 21.5
150 2 ++++ 4 19.0
150 3 +++++
150 4 ++++++
150 5 +++
137

Fig. 3.39(a): Determination of an appropriate solvent system for broth extraction, showing pathway taken when using the Aszalos and Issaq solvent system strategy (Aszalos and Issaq (1980), resulting in MeOH/CHCI3 (1/9) (Solvent 1) [See table 3.8) .
. Fig. 3.39(b): Determination of an appropriate solvent system for the Iiquid/liquid extraction route resulting in HexlAcOH/EtOAc (9/1/9).
Fig. 3.40: Determination of appropriate solvent systems for the IiquidffLC· extraction, resulting in:
(i) EtOAc (Solvent 3)
(ii) Hex. (Solvent 4).

Fig. 3.39 a: !JE!W1INATI(}I Cf .APPROPRIATE SQVENT SYSTEMS
LlOJID EXTRACTION
.
EtOJIc
Broth SI rematent
'---- ---
(~lvent 1)
rw-vCl-tl (1/9) 3
, j
1 I
(A)
Fig. 3.39b: .--____ ....-____ -+=1-:::....;;,-...:-...:-;,.;-:....::.-.:..-.:,-.:..-...:-;,.;-...:-...:-;,.;-;,.;-;,.;-;,.;-:..;;;- I , I. I
E
Fig. 3.40: LIQJID/TLC EXrnJ!CTI(}I
rw-vcrcLJIiltibiotiC concentrate .
(~l~~ 1) . : I I , I 1-- ----.
.
EtoJlc
kO-I (1/9)
, (Solvent 3)
I
fe</ EtoJlc (9/1/9) Solvent 2
(B)
.. - - - - - - - - - - - - - - - - - -I
fe</ kO-!/Eta-I fe</ kO-!/Eta-I (90/10/45) (9/1/9)
138
I I
I I :
fe</EtOAc (9/1)
!-'ex (~lvent 4)

Fig. 3.41: Constructed flow chart for the isolation and purification of the antibacterial substance using a liquid/liquid extraction route.
'1
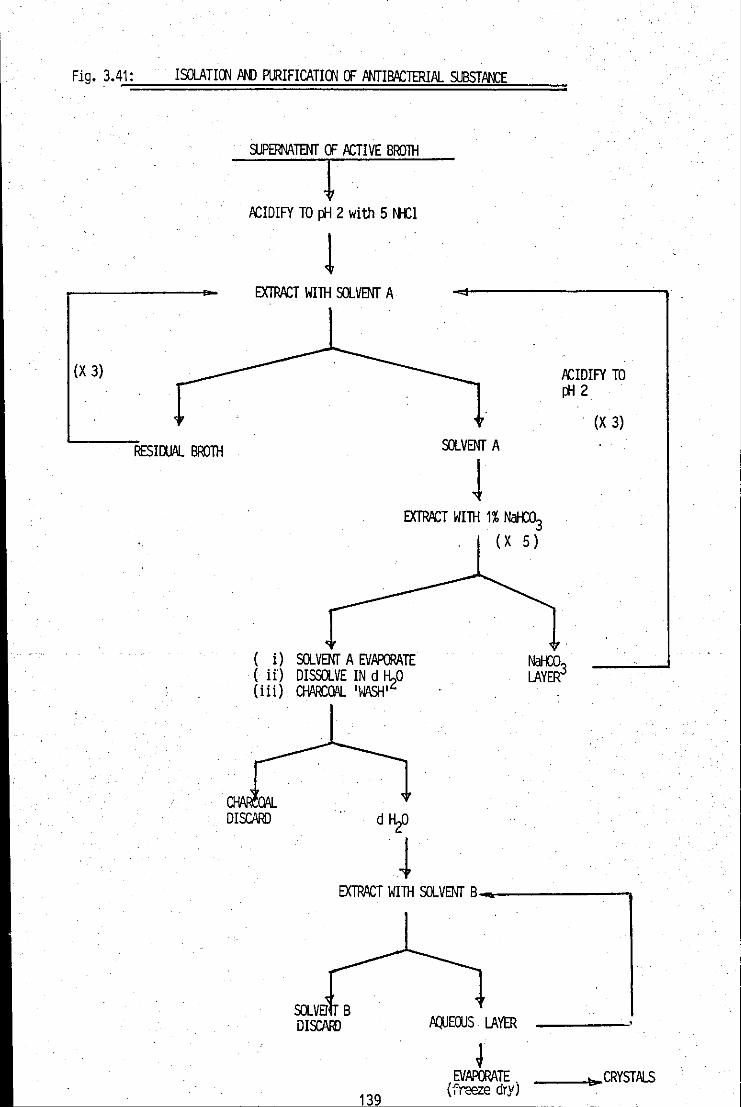
Fig. 3.4~1 :==~I~SOLA;;;J,;;:I(J.I~JIN)=PIJ~R;,IF~ICA=J=I(J.I=OF=IWT=I=BJlC=TER~I=AL=SUBST==:::fJf[=E ===
(X 3)
RESIIl..V\I.. BrolH
SUPffi'JATENT OF JlCTIVE BROlH
r PCIDIFY TO p-i 2 with 5 rtCl
1 EXTRPCT WIlH SOLVENT A
SOLVENT A
! EXTRPCJ WIlH 1% NaJ-ro3
(X 5)
( i) SOLVENT A EVAPORATE (if) DISSOLVE IN d. H_O ( ii i) CJ-IIl.RCQI\L' WASH" <!
PCIDIFY TO i1i2
, (X 3)
EXTRPCJ WIlH SOLVENT B __ -----......
139
JlQJECXJS lJ\YER
J EVAPORATE ,
(freeze dry) __ -I"'~CRYSJALS

Fig. 3.42: Constructed flow chart for the isolation and purification of the antibacterial substance, using a IiquidffLC extraction route.
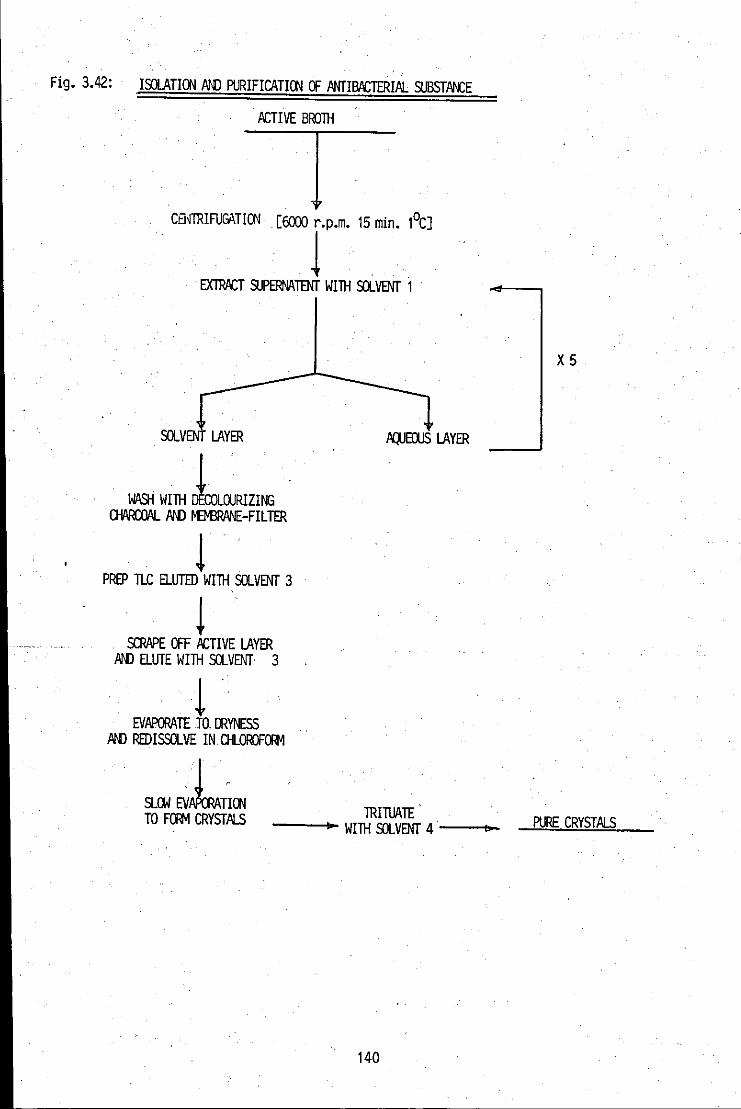
~~-- ~-----
Fig. 3.42: ISOlATIOO I'm PURIFICATI(JIJ OF IV'ITIBJlCTERIAL SUBSTMtE
JlCTIVE B~lH
CEi;"fRIFUffiTION [6000 r.p.m. 15 min. 1°C]
1 ~ EXlRPCT SUPERNATENr WIlH s:x.VENT 1
X5
s:x.v LAYER PQJEaJS LAYER
WASI-i WIlH D10LCXJRIZING OWIDIL fID M:MlRJINE-FIL TER
l PREP TLC ELUTED WIlH s:x. VENT 3
~ SCRJIPE OFF JlCTIVE LAYER·
fID ELUTE WIlH s:x. VENT 3
1 EVJIJlORATE TO DRYNESS
fID REDISSOLVE IN. CJ-lOROFm1
J SLOtI EVJIJlORATIOO
TRIllVITE TO Fm1 CRYSTJIJ..S ~ WIlH 5n.VENT 4 I> PURE CRYSTJIJ..S
140

Table 3.8: Retention factors of active broth filtrates (AF) and fresh, uninoculated medium/control (FM), obtained from analytical TLC elutions, viewed under UV light (253.7 - 356 nm) and charred after spraying with conc. H2SOJglacial acetic acid (see Fig. 3.39 (A)).
Fig. 3.43:· Developed pr~p TLC of an a~tive concentrate cif solvent A, eluted with· solvent 2 imd as viewed under UV light (254 nm).

Table 3.8
SOLVENT/ ELUTED CHCl3
SUBSTANCES
AF FM AF
Charred spot 0.00 . 0.00 0.00
(Active) 0.13 0.00 0.09 Yellow pigment
(yellow/green) 0.00 0.00 0.00 Fluorescent material
.
Fig. 3.43
EtOAc
FM AF
0.00 0.70 .
0.00 0.64
0.00 0.22
SOLVENT FRONT
. PIGMENT 5 dark PIGMENT 4 dark PIGMENT 3 yellow/green
(fluorescent) ANTIBIOTIC 2 yellow PIGMENT 1 dark
[start]
MeOH MeOH/CHI3 (1/9)
FM AF FM
0.70 0.00 0.00
0.00 .. 0.67 0.00
0.00 0.00 0.00

Table 3.9: Retention factor de terminations of the antibacterial substance, using.a selection of solvents which cover a cross-section of solvent, polarities.
Fig. 3.44: Antibiotic concentration/zone of inhibition log-dose response calibration curve, used for assessing the amount (mg/ml) of the antibacterial substance present in active broth filtrates. Standard deviations computed for each datum point are shown, where applicable, as error bars.
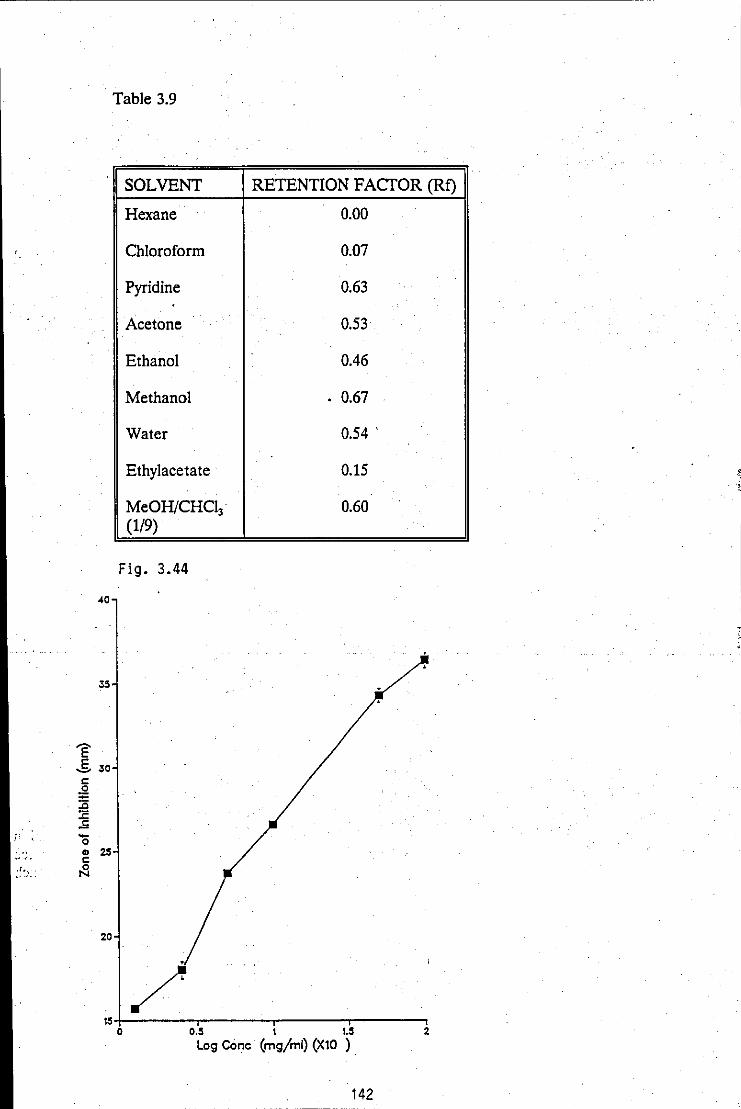
Table 3.9
SOLVENT RETENTION FAcrOR (Rf)
Hexane 0.00
Chloroform 0.07
Pyridine 0.63
Acetone 0.53
Ethanol 0.46
Methanol . 0.67
Water 0.54 '
Ethylacetate 0.15
MeOH/CHCI3 0.60 (1/9)
Fig. 3.44
40
J5
'E' g JO c:
.2 :3 :;: S
(' -0 .. 25 c:
:: '). ~
20
15-1----.,----.-----~---__, o 0.5 1 1.5 2
Log Cone (mg/ml) (Xl0 )
142

Table 3.10: The effect of pH/temperature (QC) on the activity/stability of the . antibacterial substance with increasing time (mins). The microorganism
used for the antibiotic assay was E.coli.
Table 3.11: The effect of UV light (sterilization chamber with TUV 15 watts U.V. fluorescent light) on the activity/stability of the antibacterial substance with increasing time (days). The microorganism used for the antibiotic assay was E.coli. Tetracycline was used for comparison.
Table 3.12: Minimum inhibitory concentration (MIC) determinations of the antibacterial substance, against a range of microorganisms, grown on NA at 37°C (bacteria) and on NspA at 30°C (fungi). Assessment was by the agar diffusion assay ..

Table 3.10
1CMPERATURE TIME (MINS) PERCENTAGE LOSS IN ACTIVITI ("Cl
pH:z.O pH 7.0 pH 9.0
10 0 I 33
60 30 0 4 SS
60 0 16 lOO
10 12 33 lOO
80 30 26 S2 lOO
60 32 S9 . lOO
10 21 39 lOO
lOO 30 28 S6 lOO
60 29 60 . lOO
Table 3.11
TIME (DAYS) . . . PERCENTAGE LOSS IN ACI1VITY
ANTIBACTERIAL SUBSTANCE 1CTRACYCLINE
0 0 0
I 19 14
3 19 18
5 19 18
7 19 18
Table 3.12
MICROORGANISM MIC ("GIML)
Escherichia coli , 1.3
Salmonella abony 1.0
Bacillus cereus ,26.6
Clostridium sporogenes '. >2000
Staphyloccus auenu 11.9
Staphyloccus epidermis 10.8 .
Saccharomyces cerevisiae 621.3
Serratia marscescens 540.6
Candida albicans >2000
Penicil/ium cluysogenum 238.7
143

'E' c o 1[)
e >-.-'iii c Q)
Cl
"0 o :a. o
10
A
I / JZi'
/rzf /
/
,.)a-El J2i"
0.1 "I'----..... -----,--'----;..------r------, o 1 2 3 4 5
TIme (h)
Fig. 3.45: The effect of mid-log phase, antibacterial antibiotic, MIC challenge against E.coli, grown in basal medium, at 37°C, 90 r.p.m.: control optical density
. (650 nm) growth profile, 0-0; test optical density (650 nm) growth profile, .-•. 'A' denotes point at which the antibiotic was added.
144

Fig. 3.46
+2.~Ar-------------------------------~
0.500 (NDIV)
O.OOA ~------;'M'7~mmIT======-mI 200 ~~
Fig. 3.46: A uv/vis spectrum of the antibacterial, basal medium broth filtrate, after 36 hrs incubation at 37"C, 90 r.p.m.
Fig. 3.47
+ 2.5OA r-----------------~.,
0.500 (NDIV)
I
.
. i'J '------- ~ O.OOA 2/;vOO;-----------:-:100t:".-=0-;(7':"f'.f-V:-:::D~IV",.)--'--........ ----7...100 I'M
Fig. 3.47: A uv/vis spectrum of the purified antibacterial substance, dissolved in UV ethanol. .
145

Fig. 3.48
I I
--r·····
%0 '~--j'-+--i.c.,+:"+~+·"':'-:~··l~
I I
0 ..... .1 . :4(1O()cJ!' .. ~_ ... ___ 3500
,.
L
, ·~·i· .. - ~ .. -. I·: ::" . \ : .• , .
.. ' ."
.;;: I .• !
':"1' .: ..... :." .!"
.. , .
. L. . , .!:' .. ::."
.. ".'--" .1.:-_ .
i: ".-.
1 :;;····:,!l··· i'
Fig. 3.48: A KBr. disc infra-red scan of the antibacterial substance.
,;
•• ! •

· Fig. 3.49: A high resolution mass spectrum of the antibacterial substance.
Table 3.13: Probable elemental ratios (emperical formular) of the antibacterial substance, as generated by the mass spectrometer data system.

Fig. 3.49·
'" ~ Z < 0 I J ~ (
'tl > ,: j "
" S
:DB ~
.. J S.
?a
••
5.
••
3.
2.
,.
Table 3.13
C 3a
12 11 11 14 13 13 7
17 6 9 9 e
113 4 4 3
.,
CI3 H N I 5
El 7 3 I 6 3 a 5 4 a 9 El 1 S 0
.0 7 I I 8 4 El 7 5 I 6 5 1 la I a 9 :1 1 :3 2 El 9 £)
1 113 ~ ~
El 9 4 1 B 4
IO.
i 03 I
I
:I. 1"
'" 11
I ..:r
... 11 11''''1'
'00 ,., "0 , ..
0 DE'! ~ns I'."lSS <)PTS ~IHT
5
a -4.1 193.6599 71 laa.ea a 9.3 El 8.4 I -5.5 I -1.0 I 7.1 2 -8.2 2 -6. ! 1 2 4.3" 3 -9.5 3 -1.5 :; 3.8 "'- 9.:3 5 -5.5 5 2.G 5 7.£1
147

Table 3.l4: Positional parameters and equivalent isotropic temperature factors arising from the x-ray diffraction of the antibacterial crystal. N, C, 0 represents nitrogen, carbon and oxygen, respectively and the numbers in parenthesis represents the atomic numbering used for the construction of the molecular structure. [See Fig. 3.49].
Table 3.15: Bond lengths (A) arising from the x-ray diffraction of the antibacterial crystal. N, C, 0 represents nitrogen, carbon and oxygen, respectively and the numbers in parenthesis represents the atomic numbering used. for the construction of the molecular structure. [See Fig. 3.49].
Table 3.16: Bond angles (0) arising from the x-ray diffusion of the antibacterial crystal. N, C, 0 represents nitrogen, carbon and oxygen, respectively and the numbers in parenthesis represents the atomic numbering used for the construction of the molecular structure. [See Fig. 3.49].

Table 3.14
• UEQ = '. ',ATOM X' Y Z UEQ
N (l) .312 .( 3) 57'36 ('31 7312 ( 5) 51 ( 4l CC" 1645 ( 4) 5961 .(':3)' 7166 (·'.n 53 ( 5) N(2) 1592 ( 3) 6392. ( .3) 5285 ( 6)' 52 ( 4) C (2) 259 ( 51 6657 <..:n 3517,(.71 53 , 5) C (31 -1177 .( .4) 6430 .(. 31 3721 .{. 6)· 48 ( 5~ C(4) ·991 ( 4) 5993 ( 31 5692 .( 6). 46 ( 5): K(3) -a.340 ( 3) 5847 .( 3). 5836· ( 6)· 54 ( 4) K (4) .3735 ( 4) 6037. ~;.31 4209 (. 6) 67 ( 5) C(5) -3760 (·5) 6395 (' 4) 2460 ( 8) 69 ( 6) jH51 -2512 ..L 41 6637.·'(' .3) 2122 ·C· 6) 61 ( 51 0(' , 2909.( 3) 518' ( 3) 8645 <. 5) 75 ( 5) C (6) 3084 ( .. n 666.3, (.6) 5343 (14) 79. ( '9) .0 (2) 258· ( 4) 7022 ( 2)· 19<7 ( .5). 69 ( S) C(7)' -2.306 ( 7)' 5469 , 6) 7848 ( 9). 75 ( 8)
Table 3.15
CC, ) NC·1) '.'374 ( 5) C(4) COl 1.423· ( 6). C (4) - N<·' ) '~308 C 5) NCSl - C(3) 1.302 ( 5) H(2)' C(., l ,_407 .. ( 5) NC.3) - C(4) ",368 ·C 5·) OC'1) - ( (Il 1.2'9·( ft.) N(4) . N(3) "'·34' C " C (2)' N(2) 1.372 , 5) ccn - N(3) '';'467 ( 6) C<6) N<2) '.476 (. 6) CCS) - NC4l 1.2S3.C 6l C (3) C(2) '.491·.C 6) NC5l - C (S) 1.370 C 6) o (2) C(2) '.207 C S)
Table 3.16
. C (4). -' N (1) - C·(ll 117.0 C 4) HCS) -. C(3)' -C·(2) ".9'.-2 ( . .4) N(2) - CC,) ~ NC·ll 120.9 ( 3) N(51 . C(3) - C(4) '23.8 .( 4) OC') - .. C·('.l· .,. H (·1) 121~2. , 4) C(3) - ~'4) - N·C 1) 126.5 ( 3) . O(1) - C (,) - N(2) 11-7.9 ( 4) N(.n - CI4) · NC') ~ 1-9.,1 ( 4) C(2) - N(2) .,. CCll 124.4 (. 3) N(3) - C(4) - C(3) 11·4 .. 4 ( 3) C (6)· _. N(2) .,. C(1) '16.8 ( 4l N(4) - N(3) - C (4)' 123.·2 ( 4). C(6) - H(2) .,.' C (2) 118.4 C 5). C(7) - N(3)· • C (4) 120.0 ( 4) C (3) .,., C c;n ". N·(2) 114.0 C 4) c(n - NO) - N(4) ~16.8 C 4) 0(2) - C (2) ::- N(2) 122.6 C .4) C(S) - NI4) · N(3) .116.06 ,'(.4) 0(2) - C (2) .,.' C (3). '23.4 ( 4i N(S) - C(5) - N(4) . ,26.·9_(,4). C(4) - C(3) - C(2) 110.9 .( 3) CC';) - N CS) - C(3) " 4.8 C 4)
148

c
01
Fig. 3.50: Molecular structure of the antibacterial crystal, as generated by the x-ray diffractometer, from bond lengths and angle, and from an· atomic numbering scheme.

Fig. 3.51: Unit cell contents of the antibacterial substance, as generated by the x-ray diffractometer.
150

Fig. 3.52: . A) The effect of cell propagation on growth of strain A. from basal medium, along:
i) a series of Med A2 (SLR).
ii) a series of Med A2 (AR).
B) The effect of cell propagation on growth of Ps.aeruginosa, from basal medium, along a series of Med A2 (SLR)
Strain A and Ps.aeruginosa were grown at 37°C, 90 r.p.m., with initial OD levels of =- 0.06. Static, overnight incubation to obtain colonies on NA was at 37°C. The times (h), inbetween the 'blocks', represents duration of incubation before. propagation. A visual colour assessment of. the pigments produced were obtained using a rating system of + 1 to + 2.

... <.11 -
Fig, 3.52
(A)
(B)
GROWI'll P 9897 COLONIES ON N.A.
GROWI'll Ps.aerugiDosa COLONIES ON N.A.
GROWI'll BASAL MED
ill!!.... (SLR)
l!.!!!!..
YEllOW PIGMENTATION [+ I)
GROWI'll BASAL MED
. (SLR) NO PIGMENTATION
I)
11)
.l!!!!..
GROWTH BASAL MED. (SLR) YELLOW PIGMENTATION [+ I)
GROWTH BASAL MEDIUM (AR) YEUOW PIGMENTATION [+ I)
GROWTH BASAL MED (SLR) NO PIGMENTATION
GROWI'll MEDAl
.!!l!!! (SLR) l!1!!! YELLOW PIGMENTATION [+ 2)
ISh.. (AR) ~ NO PIGMENTATION
GROWI'll MEDAl
.l!!!!.. (SLR) ~ YEllOW,GREEN PIGMENTATION
.
~~)Al .
YEllOW PIGMENTATION [+ 2)
NO GROWI'll MEDAl (AR)
NOGROWTII MEDAl (SLR)
!il!!

Fig. 3.53: Atomic absorbtion calibration curve for Mg2+: Absorbance (285.5 nm); Mg2+ concentration (p.p.m.). Standard deviations computed for each datum point are shown, where applicable, as error bars.
Table 3.17: Atomic absorbtion measurements of Mi+ concentration in
a) SLR and AR basal media
b) SLR and AR basal media, previously inoculated with strain A (0.0. (650 nm) 0.06), incubated for 20 min at 37°C, 90 r.p.m., then membrane filtered. .

. Fig. 3.53
Table 3.17.
? c: c: "
C.5
L'; Co."; co ~ o
" c: X ;: O.~ o ~
<1
0.:
• . 0.1
"".C'~--'---~r-__ ~ ____ .-__ ~ ", . .1',.- i. i 0.0 0.1 0.2. C.3 0.4 0.5
!.Ig'. C~nc. (ppm)
ATOMIC ABSORBTIONMEASUREMENTS
BASAL .. MAGNESIUM ION MEDIUM CONCENTRATION
. PARTS PER MILLION MOLARITY
SLR 0.095 3.9 X 10⁻⁶ a) .
AR 0.038 1.6 X 10⁻⁶
SLR FILTRATE 0.140 5.8 X 10⁻⁶
b) AR FILTRATE 0.102 4.2 X 10⁻⁶ .
.
152
I
I
I
I

13
.11
~ ..... C :J 0 ()
(j). ()
Q)
::c Cl '> Cl o·
..:.i 9 , \ \ \ \ \
1 7~----------------~----------------------~ o 20 40 60 80 100
Time (h)
Fig. 3.54: Viability of strain A, grown in basal medium,"'" and in Med A2, •.• ; all at 37°C, 90 r.p.m. Standard deviations computed for each datum point are shown, where applicable,· as error bars. .
1.53

Fig. 3.55: Optical density (650 nm) growth profile, ---; antifungal CC.albicans) zone of inhibition (mm) profile, A-A and pH profile, +-+ of strain A, grown in PDLM-1, at 37°C; 90 r.p.m., with an initial O.D. of = 0.06. The antibiotic disc used was 13 mm in diameter. Standard deviations computed for each datum point are shown, where applicable, as error bars.
Fig. 3.56: Optical density (650 nm) growth profile, ---; antifungal (C.albicans) zone of inhibition (mm) profile, A-A and pH profile, +-+ of strain A, grown in PDLM-1 at 37"C, 0 r.p.m. (static) with an initial O.D. of.::::. 0.06. The antibiotic disc used was 13 mm in diameter. Standard deviations computed for each datum point are shown, where applicable, as error bars.

lid .. '" , , ,
(ww) uomQ!4UI }O auoz .. ~
~ ~ 00 ID •
0 • /<i' +: ., I I' • --<1-'-0 +'
I \ \ 0
'" '"
• <:i '+
:\ 0 0
'" '? ~
o Cl) • <I ' + ~ E , ;::
0 5!
• -El + " '" I 1 , .- /+
0
5! cl 0 cl
Lt") (WUOS9) -4!SUaa ID~!ldO
Lt")
• er>
· 'Cl .~
......
HJ .. '" , , ,
(ww) UO!~!Q!4UI }O auoz .. J;i ;; ", 0 0
ID
0
• <30' + .,
\ \. ! • 4 +
\ I \ 0
'" '" • .<j +
\ 0 0
'" ~
o Cl) • ~ + ~ E ;::
0 5!
ID , 0 Lt") • f /+ '" · \ er> .- <I + • I \ 10 Cl -.~ ,. , , .!.' I • 1
, ,!." ,. , <;I I, ...... S! ;; cl
cl
154
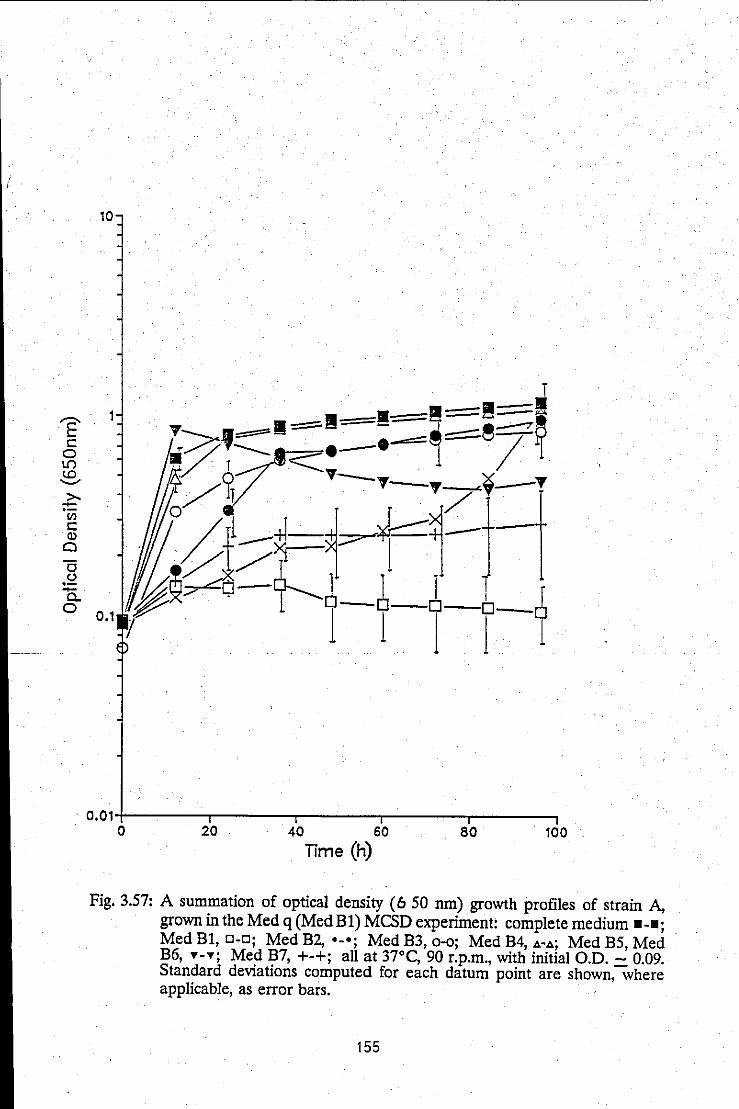
/
'E' c o lC)
e ~ 'in c Q)
Cl
"8 o =s.. o
10
. 0.01+-------.--------.-------.-------.-------, o 20 40 60 SO 100
Time Ch)
Fig. 3.57: A summation of optical density (6 50 nm) growth profiles of strain A, grown in the Med q (Med B 1) MCSD experiment: complete medium ___ ; Med B1, 0-0; Med B2, e_e; Med B3, 0-0; Med B4, A-A; Med B5, Med B6, T-T; Med B7, +-+; all at 37°C, 90 r.p.m., with initial O.D. = 0.09. Standard deviations computed for each datum point are shown, where applicable, as error bars.
155

Fig. 3.58: A summation of antibacterial (E.coli) zone of inhibition (11lm)/time (h) . profiles, produced by strain A in the Med q (Med B1) MCSD experiment:
complete medium _-_; Med B1, 0-0; Med B2, 0_0; Med B3, 0-0; Med B4, to·to; Med B5, x-x; Med B6, y-y; Med B7, +-+; all at 37<C, 90. r.p.m., with initial 0.0. =. 0.09. The antibiotic disc used was 13 mm in. diameter. Standard deviations computed for each datum point are shown, . where applicable, as error bars.
Fig. 3.59: A summation of antibacterial (C.albicans) zone of inhibition (mm )/time (h) . profiles, produced by strain A in the Med q (Med B1) MCSD experiment: . complete medium _-_; Med B1, 0-0; Med B2, 0_0; Med B3, 0-0; Med
B4, to-to; Med B5, x-x; Med B6, y-y; Med B7, +-+; all at 37°C, 90 r.p.m., with initial 0.0. =. 0.09. The antibiotic disc used was 13 mm in diameter. Standard deviations computed for each datum point are shown, where applicable, as error bars. . .. ... ..
[NB. Symbols for Med B5, Med B6 and Med B7, all lie superimposed upon each other, along the 13 mm time axis],

co ll') .
• en .~
u..
-.- t-'
'" ll') . .
en
(ww) UO!I1Q!4UI 10 8UOZ
,0\ T
'·'~i • I • I • I • I ••
·~I ~i
156
..
• N 0
0: S!
o S!
o ..
" N

>---'en c: <I>
Cl
'0 ()
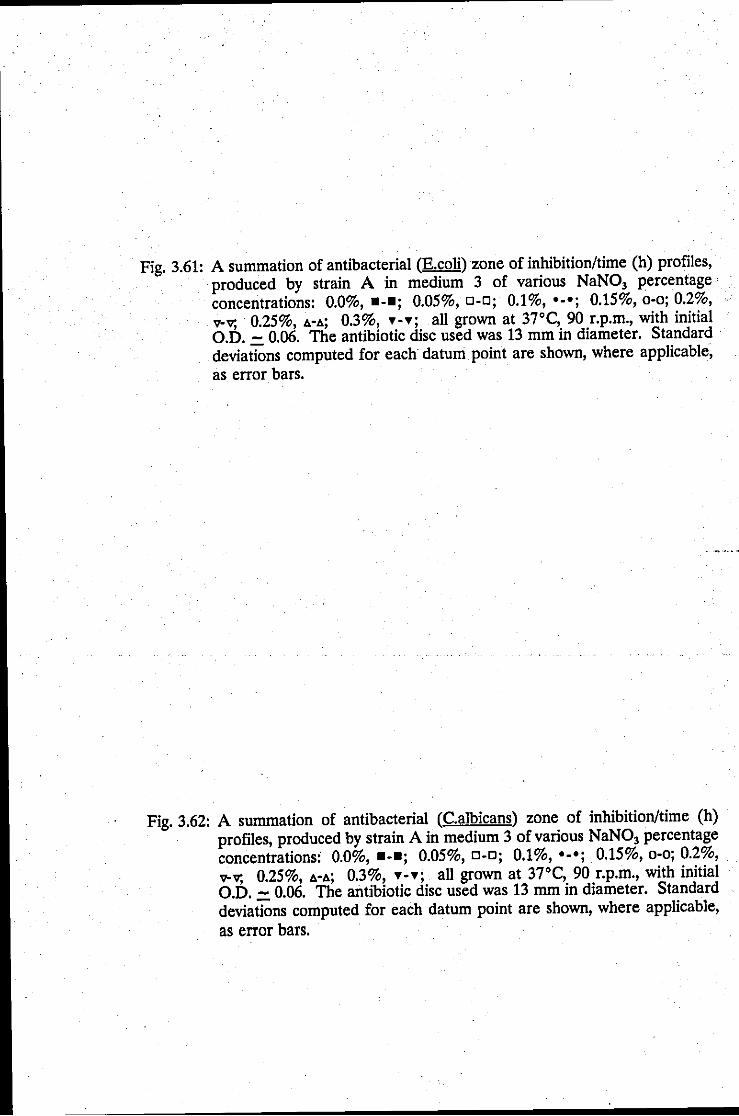
Fig. 3.61: A summation of antibacterial (E.coli) zone of inhibition/time (h) profiles, produced by strain A in medium 3 of various NaN03 percentage·· concentrations: 0.0%, _-_; 0.05%, 0-0; 0.1%, 0_0; 0.15%,0-0; 0.2%, v-v; 0.25%, A-A; 0.3%, ,.-,.; all grown at 37°C, 90 r.p.m., with initial O.D. = 0.06. The antibiotic disc used was 13 mm in diameter. Standard . deviations computed for each datum point are shown, where applicable, as error bars.
Fig. 3.62: A summation of antibacterial (C.albicans) zone of inhibition/time (h) profiles, produced by strain A in medium 3 of various NaN03 percentage concentrations: 0.0%, _-_; 0.05%,0-0; 0.1%, 0_0; 0.15%,0-0; 0.2%, v-v; 0.25%, A-A; 0.3%, ,.-,.; all grown at 37°C, 90 r.p.m., with initial O.D. = 0.06. The antibiotic disc used was 13 mm in diameter. Standard deviations computed for each datum point are shown, where applicable, as error bars.
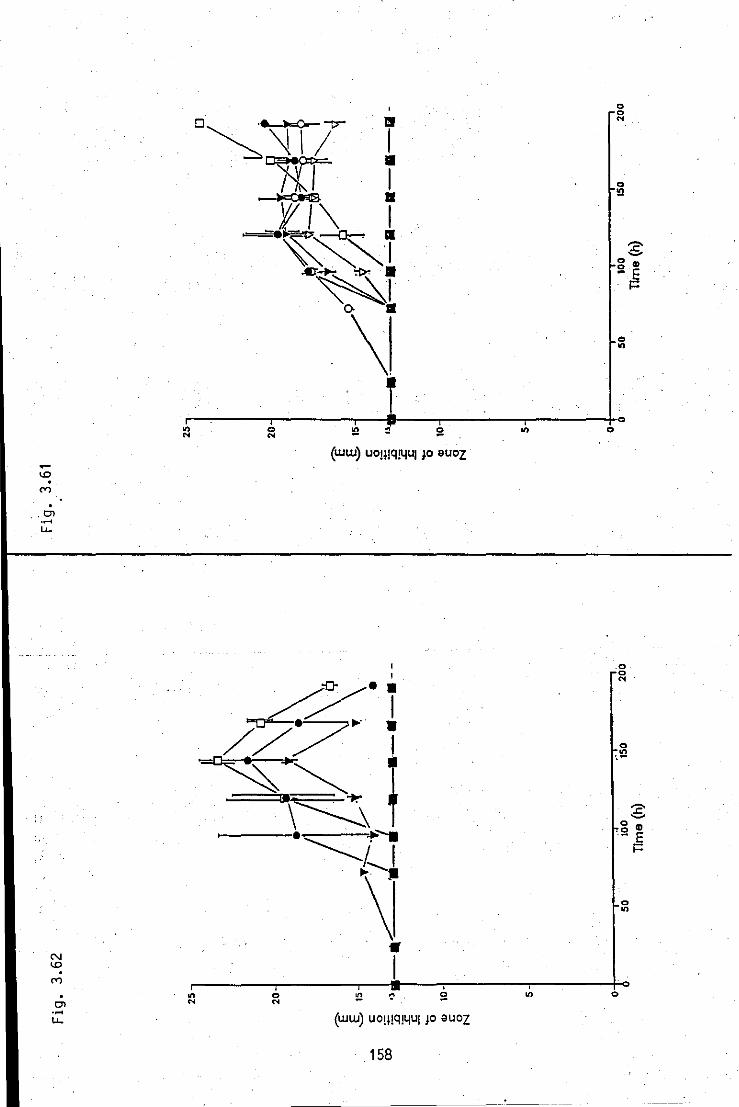
. " Cl .~
u..
N <.D . CV') . Cl .~
u.. '" N
, o N
(ww) UO!!!q!4ul la suoz
on
(ww) UO!I!Q!4UllO suoz
158
----------~~-----------------.--
o o N
z ~
o Cl)
S! E 'i=
o "
.0 o N
z ~
o Cl)
'.9 E
o
o on
i=

Fig. 3.63: A summation of antibacterial (E. coli) zone of inhibition (mm)/percentage NaND3 concentration profiles, produced by strain A in medium 3, at various times (h): 0 h, ---; 24 h, 0-0; 72 h, ._.; 96 h, 0-0; 120 h, ~-~; 144 h, x-x; 168 h, v-v; 192 h, +-+; all grown at 37°C, 90 r.p.m., with initial D.D. = 0.06. The antibiotic disc used was 13 mm in diameter. Standard deviations computed for each datum point are shown, where applicable, as error bars.
Fig. 3.64: A summation ofantifungal (C.albicans) zone of inhibition (mm)/percentage NaND3 concentration profiles, produced by strain A in medium 3, at various times (h): 0 h, ---; 24 h, 0-0; 72 h,·_·; 96 h, o~o; 120 h, ~-~; 144 h, x-x; 168 h, v-v; 192 h, +-+; all grown at 37°C, 90 r.p.m., with initial O.D. = 0.06. The antibiotic disc used was 13 mm in diameter. Standard deviations computed for each datum point are shown, where applicable, as error bars.

25
20
'E' -5. ,5 c o
:B ., ~ -o ,0
CD
~
5
Fig. 3.63
o'4---------.r~------~--------~·~-------.~------~--------~·,·~ 0.00 0.05 0.'0 0.15. . 0.20 0.25 0.30
25
20
'E' -5. c ~ .2
Percentage Sodium nitrate
Fig. ·3.64
:is ·,'.::.------1(------ ~! -==::::..]11----181----. .--
~ -0 CD
10 c ~
5
. o. 0 0.05 0.10 0.15 0.20 0.2S 0.30
Percentage Sodium nitrate
159

'? c
0 L() lO '-"
>---Vi ; c <I)
Cl
"0 (J .--a.. 0
10 64
.--.~ .
·~r 'l-3
'? • g J
C 0
• =+= /~ :c
:c .£
• • --0 CD
!,/Y:::~<" c 0
:I. • N
. 5rA \1 9
~-1!l.v.. -- -- -- ---------- '3
.~ ;j--+-+--+ I
+/ 5= C-
0.011-1-:-: --'-----r--.:..-----,-----__ :------+ 0 o . 50 100 150 200
Time Ch)
Fig. 3.65: Optical density (650 nm) growth profile, ---; antibacterial (E.coli) zone of inhibition (mm) profile, .to-.to; antifungal (C.albicans) zone of inhibition (mm) profile, v-v and pH profile, +-+ of strain A, grown in medium 3 of 0.05% NaN03 concentration (medium 4), at 37°C, 90 r.p.m., with an initial 0.0. of =. 0.06. The antibiotic disc used was 13 mm diameter. Standard deviations computed for each datum point are shown, where applicable, as error bars.
160

O.ot+-----r------r------.------, o 50 100
Time Ch) 150 200
Fig. 3.66: A summation of optical density (650 nm) growth profiles of strain A, grown in medium 4 of various sucrose percentage concentrations: 0.0%, ---; 0.5%, 0-0; 1%, e_e; 2%,0-0; 3%, A-A; 4%, v-v; 5%, T-T; all at 37°C, 90 r.p.m., with initial OD of =. 0.06. Standard deviations computed for each datum point are shown, where applicable, as error bars.
[NB. All variants of medium 4 in this series contain glycerol].
161

Fig. 3.67: A summation of antibacterial (E. coli) zone of inhibition (mm)/time (h) profiles, produced by strain A in medium 4 of various sucrose percentage concentrations: 0.0%, ---; 0.5%, 0-0; 1%, ._.; 2% 0-0;' 3%, A-A; . 4%, v-v; 5%, T-T; all ~own at 37°C, 90 r.p.m., with initial O.D. of =: 0.06. The antibiotic dISC used was 13 mm in diameter. Standard deviations computed for each datum point are shown, where applicable, . as error bars.
Fig. 3.68: A summation of antifungal (C. albicans) zone of inhibition (mm)/time (h) .. profiles, produced by strain A in medium 4 of various sucrose percentage
concentrations: 0.0%, _-_; 0.5%, 0-0; 1%, ._.; 2% 0-0; 3%,.11.-.11.; 4%, v-v; 5%, T-T; all ~rown at 37°C, 90 r.p.m., with initial O.D. of =: 0.06. The antibiotic dIsc used was 13 mm in diameter. Standard· deviations computed for each datum point are shown, where applicable, as error bars. .

· Ol .~.
lL.
co <.0 .
• "M
· . Ol .~
lL.
~.o_ .• It
~I "="' • . ~ I
~., . \ ""I -0,-- •.
"~I i • I • I •
o .~
o ...
'" '"
I r-------r-------r-_.----r-------r-------to
o '"
162
z '-'
0 .. . S! E
o
'"
;:

10
• • . .......--.......... . . "" ./ ..•
1
£ Cl)
s::: Q)
Cl
64
"3 'E' E
'-'" s:::
·0 :;:: :c
, :2 .E -/---------
8 •
:a I o <D s:::
o 0.1. .
~~~~~ ./ ~~ Ji----':;.;'l ·Zf-· 7l-]K-~---:"--------
~ +-+-+-+ t . ~ . /-+-+. . .
. +
;I.,
13
0.0~ .•. --------~.11----------r---------.-----------r0 o 50 100 150 2.00
Time Ch)
~
. 9
1 .
Fig. 3.69: Optical density (650 nm) growth profile, ---; antibacterial (E.coli) zone of inhibition (mm) profile, A-A; antifungal (C.albicans) zone of inhibition (mm) profile, and pH profile, +-+ of strain A, grown in medium 4 at 37°C, 90 r.p.m.,with initial O.D. of = 0.06 The antibiotic disc used was 13 mm diameter. Standard deviations computed for each datum point are shown, where applicable, as error bars. ..
163

'E' t:
0 L()
.s. >" --'(ij t: Q)
a "'6 .2 -0. 0
0.1
I
11
0.01-1---.:....---.-----.------.--------, o 50 100
Time Ch) 150 200
Fig. 3.70: A summatIOn of optical density (650 nm) growth profiles of strain A, grown in medium 4 of various glycerol percentage concentrations: 0%, ---, 1%, 0-0; 2%,0_0; 3%,0-0; 4%, A-A; 5%, x-x; 6%, v-v; 7%, +-+; 8%, 0 - 0; all at 3rC, 90 r.p.m., with initial 0.0. = 0.06. Standard deviations computed for each datum, point are shown, where applicable, as error bars.
[NB. AIl variants of medium 4 in this series contain sucrose].
164

Fig. 3.71: A summation of antibacterial (E.coli) zone of. inhibition (mm)/time (h) profiles, produced by strain A in medium 4 of various glycerol percentage concentrations: 0%, ••• , 1%, 0.0; 2%, ••• ; 3%,0-0; 4%, A·A; 5%, x.x; 6%, 'l"V; 7%, +.+; 8%, 0-0; all at 37°C, 90 r.p.m., with initial 0.0. = 0.06. The antibiotic disc used was 13 mm in diameter. Standard deviations computed for each datum point are shown, where applicable, as error bars.
Fig. 3.72: A summation of antifungal (C.albicans) zone of inhibition (mm)/time (h) profiles, produced by strain A in medium 4 of various glycerol percentage concentrations: 0%, ••• , 1%, 0.0; 2%, ••• ; 3%, 0-0; 4%, A·A; 5%, x.x; 6%,'I"V; 7%, +.+; 8%, 0-0; all at 37°C, 90 r.p.m., with initial· 0.0. = 0.06. The antibiotic disc used was 13 mm in diameter. Standard deviations computed for each datum point are shown, where applicable, as error bars.

-...... · '" · Cl .~
u.. .
N ......
• '" • Cl .~
u..
~\ ~",r i+~~ i <>'\ i\ ~"" i
-<>-\-\~~i -<><+ a ,L .. I
• •
.. (ww) uomQl4uI )0 suoz
. S!
(ww) UOl!!Ql4ul )0 auoz
165
.. ..
'"
0 0 N
0 l2
:b o ., SJi
0 ..,
l-
? c-o " S E
;=
'" '"

Fig. 3.73: A summation of antibacterial (E. coli) zone of inhibition (mm)/percentage glycerol concentration profiles, produced by strain A in medium 4, at various times (h): 0 h, ---; 48 h, 0-0; 72 h, e_e; 96 h, 0-0; 120 h, A-A; 144 h, x-x; H;8 h, v-v; 192 h, +-+; all grown at 37°C, 90 r.p.m., with . initial O.D. = 0.06. The antibiotic disc used was 13 mm in diameter. Standard deviations computed for each datum point are shown, where applicable, as error bars.
Fig. 3.74: A summation of antifungal (C.· albicans) zone of inhibition (mm)/percentage glycerol concentration profiles, produced by strain A in medium 4, at various times (h): 0 h, ---; 48h, 0-0; 72 h, e_e; 96 h, 0-0;
120 h, A-A; 144 h, x-x; 168 h, v-v; 192 h, +-+; all grown at 37°C, 90 r.p.m., with initial O.D. = 0.06. The antibiotic disc used was 13 mm in diameter. Standard deviations computed for each datum point are shown, where applicable, as error bars ..
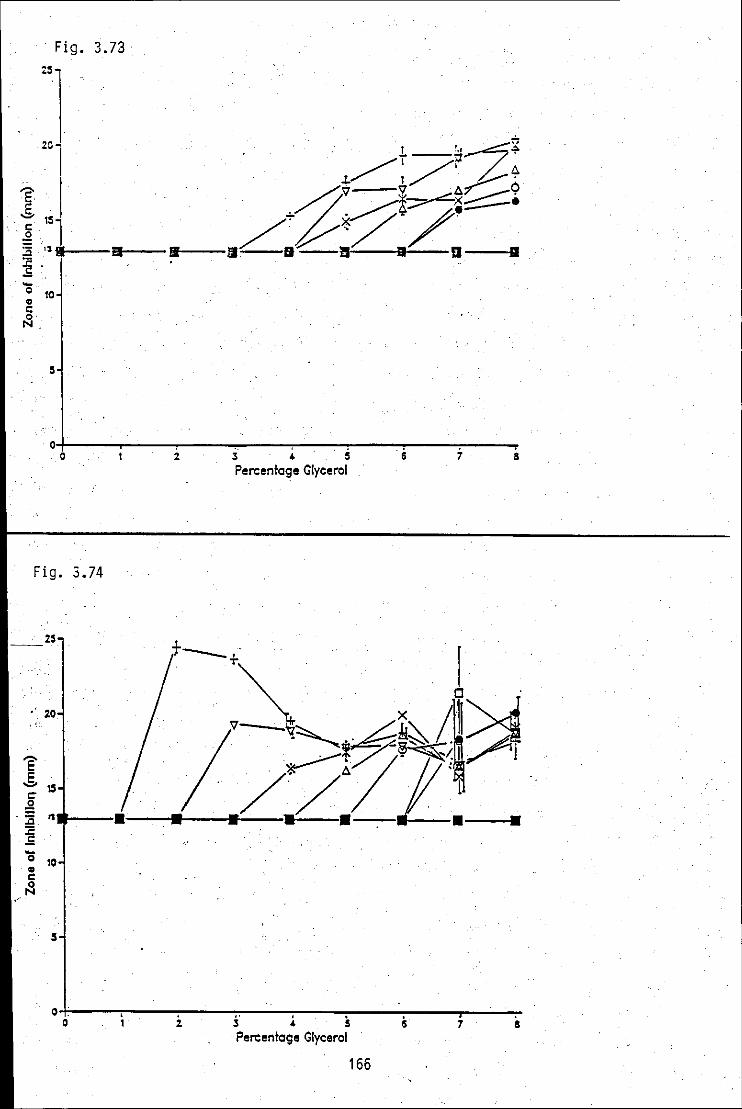
0~~2 -----=:::~-3 . . .'
Percentage CIYCero~ . S 7 8
Fig. - 7 ~. 4
.' 20 , ~ <
'E' E . ""15 .§
':a ", .,...-~ . '0 10
5
o : o •
1 2 i . P • • ercentag8 Cl 5 ycerol
7 a
166
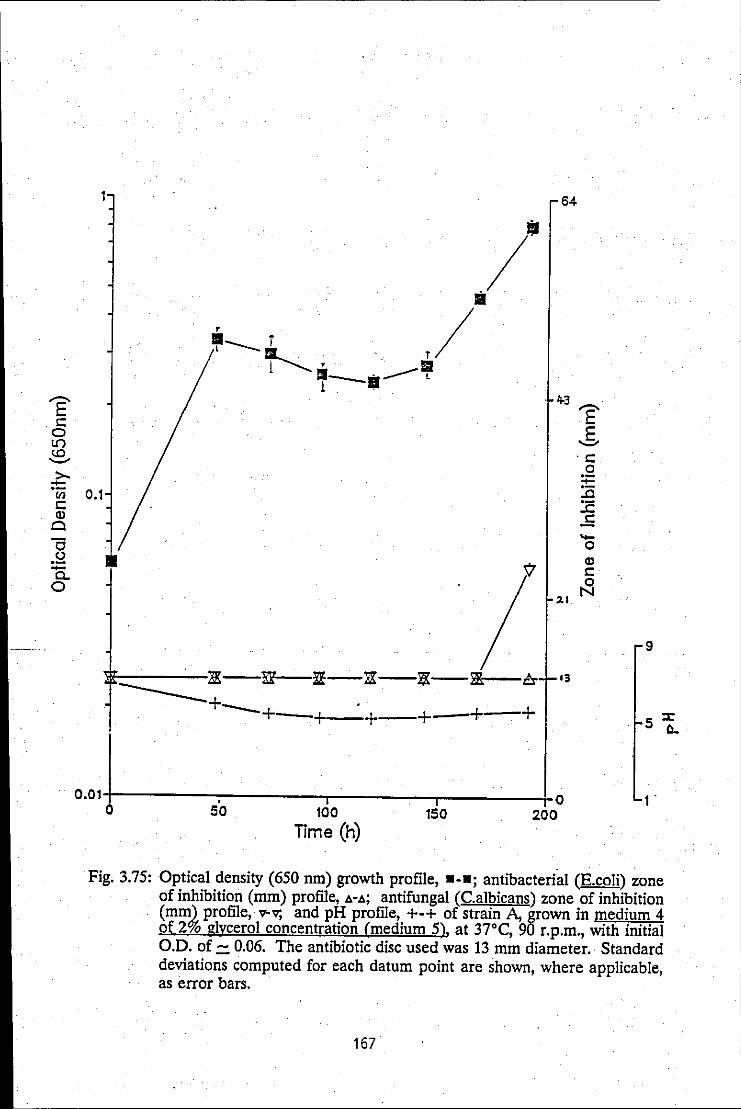
E' .1: 0 L() <.0 '-' >--'Cij I: Q)
Cl
"'6 ,g -a. 0
64
0.1
:i!t:'--_. -]K--!\ll ~-jK--~-lll!: b- 13
----+ . ---+---+--+---+---+---+
0,01+-----:-. -----,-------,-----!-o 50 100 150 200
Time Ch)
9
5:1: 0..
1 .
Fig. 3.75: Optical density (650 nm) growth profile, ---; antibacterial (E.coli) zone of inhibition (mm) profile, .6.-.6.; antifungal (C. albicans) zone of inhibition (mm) profile, v-v; and pH profile, +-+ of strain A, grown in medium 4 of 2% glycerol concentration (medium 5), at 37°C, 90 r.p.m., with initial 0.0. of.= 0.06. The antibiotic disc used was 13 mm diameter. Standard
. deviations computed for each datum point are shown, where applicable, as error bars.
167

'E' s:: o L() to
. '-'
>---'(ij s:: Q) 0·
"0 .~ --a. o
10
0.011-1-------r------,--------,---_--, o 50 100 150 200
. TIme Ch)
Fig. 3.76: A summation of optical density (650 nm)growth profiles of strain A, grown in medium 5, at various pHs: 3, .~.; 4, Cl-Cl; 5, ._.; 6% 0-0; 7, A-A;
8, x-x; 9, v-v; all at 37°C, 90 r.p.m., with initial 0.0. of =. 0.06. Standard deviations computed for each datum point are shown, where applicable, as error bars.
168
I
I

Fig. 3.77: A summation of antibacterial (E.coli) zone of inhibition (mm)/time (h) profiles, produced by strain A in medium 5, at various pHs: 3, ---; 4 0-0; 5, e_e; 6,0-0; 7, A-A; 8, x-x; 9, v-v; all grown at 37°C, 90 r.p.m., with initial O.D. = 0.06. The antibiotic disc used was 13 mm in diameter. Standard deviations computed for each datum point are shown, where
. applicable, as error bars.
[NB. Symbols for pHs 4, 5, 6, 7 and 8, all lie superimposed upon each other along the 13 mm time axis].
Fig. 3.78: A summation of antifungal (C. albicans) zone of inhibition (mm)/time (h) profiles, produced by strain A in medium 5, at various pHs: 3, ---; 4 0-0; 5, e_e; 6, 0-0;. 7, A-A; 8, x-x; 9, v-v; all grown at 37°C, 90 r.p.m.,
with initial O.D. = 0.06. The antibiotic disc used was 13 mm in diameter. Standard deviations computed for each datum point are shown, where applicable, as error bars.
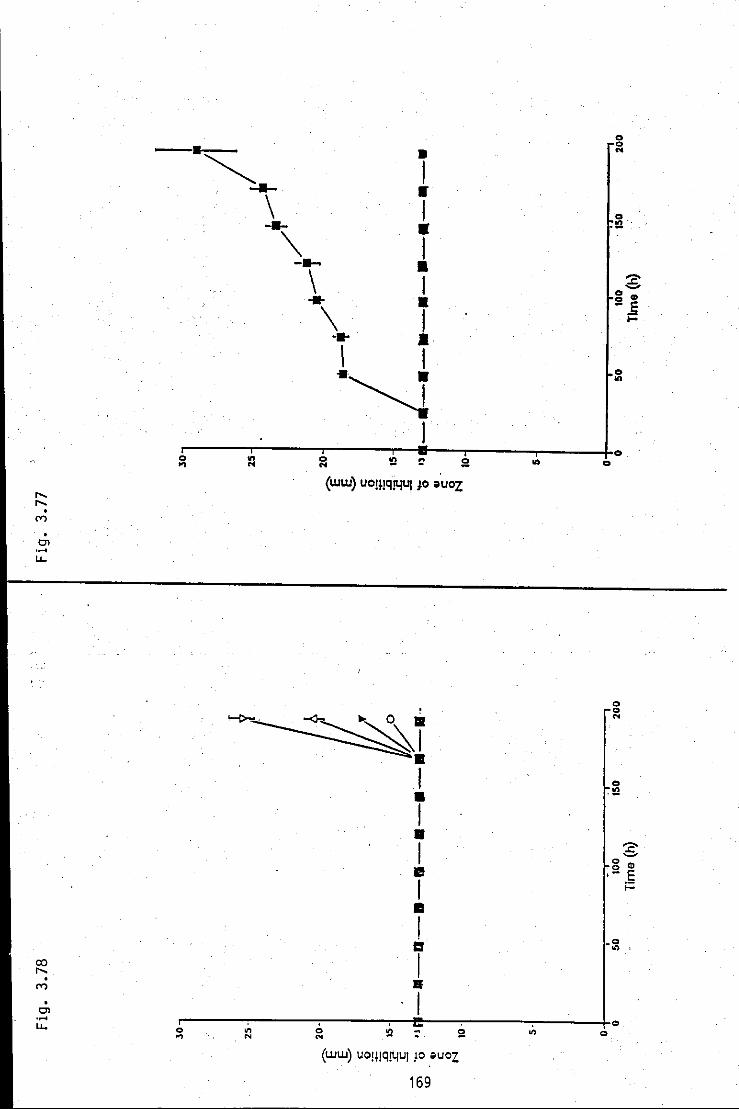
,..., ,..., •
M
· Cl
co ,..., •
M
• Cl .~
u...
- .... ~-
.~ \ ---"'---\
• I • I • I • I .. \ ••
\ I
• I • .. . ~ . I
o o ..
o .!l .
z ....., o CD $! E
;::
o VI
r-----~------r_----_r~._--~----~------TO o ... (ww) UO!l!QJ4UI 10 auoz
~~ I • I • I
I!I
I • I 1:1 ,
•
VI o
o o ....
o .\Q
z ....., g CD
.- E i=
. I r-----~~~-----o~-----.. _~~-_~--~-----.. ~·------o+o
:s: N N ~
(ww) u0!l!Q!4UI }O .auoz
169

'E c o LO ~ >
;!:: en C ID
Cl
"'8 o ~ o
0.1 64
.~."'.---.---.---.---. / . "" • • •
'1-3
-+--+-+1---+-+---+-+-+
0.0';------" -----..-----...,....,r------+O o 50 100 150 200
Time (h)
'E -.S ·C
o :;:: :c :I:: ..5 ...... o
5
3== Q.
1
Fig. 3.79: Optical density (650 nm) growth profile, - --; antibacterial (E. coli) zone of inlubition profile, b.-b. and pH profile +-+ of strain A, grown in medium 5, at pH 3, 37°C, 90 r.p.m., with mitial 0.0. of = 0.06. The antibiotic disc used was 13 mm diameter. Standard deviations computed for each datum point are shown, where applicable, as error bars:
170

'E' c o
_ U1
e >--'Vi c Q)
Cl
"6 t) .--_ a. o
10
. 0.1
• .J
T T .,.._JI -----. '/' .. ,/J f l--f __ :l.· • • 1 . -. 1
64
'+3
21
O.OH-----.,------;------;--"--__ +O o 50 100
Time Ch) 150 200
'E' g c o
:;:: :c :c £ -' o III C
~
9
5 :z: Q,.
Fig. 3.80: Optical density (650 nm) growth profile, _._; antifungal (C.albicans) zone of inhibition profile, v-v and pH profile of strain A,. grown in medium 5. at pH 8 (medium 6), 37°C, 90 r.p.m., with initial O.D. of = 0.06. The antibiotic disc used was 13 mm diameter. Standard deviations computed for each datum point are shown, where applicable, as error bars.
171
I I
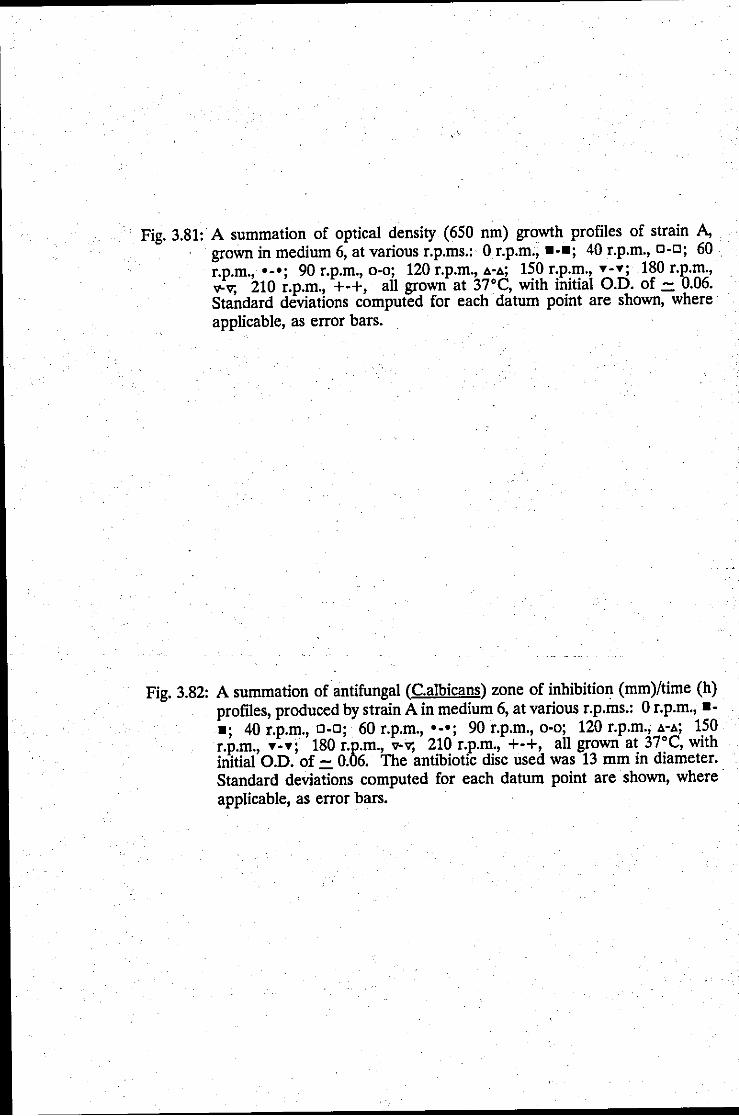
Fig. 3.81: A summation of optical density (650 nm) growth profiles of strain A, grown in medium 6, at various r.p.ms.: 0 r.p.m., ---; 40 r.p.m., 0-0; 60 . r.p.m., ._.; 90 r.p.m., 0-0; 120 r.p.m., A-A; 150 r.p.m., T-T; .180 r.p.m., v-v; 210 r.p.m., +-+, all grown at 37°C, with initial O.D. of = 0.06. Standard deviations computed for each datum point are shown, where applicable, as error bars.
Fig. 3.82: A summation of antifungal (C.albicans) zone of inhibition (mm)/time (h) profiles, produced by strain A in medium 6, at various r.p.Ins.: 0 r.p.m., -_; 40 r.p.m., 0-0; 60 r.p.m., ._.; 90 r.p.m., 0-0; 120 r.p.m., A-A; 150 r.p.m., T-T; 180 r.p.m., v-v; 210 r.p.m., +-+, all grown at 37°C, with initial O.D. of = 0.06. The antibiotic disc used was 13 mm in diameter. Standard deviations computed for each datum point are shown, where· applicable, as error bars.

~
CO •
M
· 0'> ,~
w...
N CO · M
· 0'> ,~
w... o ..,
~ 'OJI-.
I \\\\ 1/ \ t> -lE! 0 «J-tI'"
L[\LLJ.\\ ~ A \ I
WT7~ ~
172
o
? ......-o CD 2 E
;:
o on
? ~
o CD 2 E
i=
o on

Fig. 3.83: A summation of antifungal (C. albicans) zone of inhibition (mm)/r.p.m. profiles, produced by strain A in medium 6, at various times (h).: 0 h, ___ ; 24 h, 0-0; 72 h, 0_0; 120 h, 0-0; 144 h, 1.-.1.; 168 h, x-x; 192 h,
. v-v; all grown at 37°C, with initial O.D. of = 0.06. The antibiotic disc used was 13 mm in diameter. Standard deviations computed for each datum point are shown, where applicable, as error bars.

M CO
° M
° Cl .~
U.
! • •
• Ii
0
'" '" 0 0
'" 0 al -0 CD -o (]) -t_ - ::l
c °E
0 ... . !::! (]) Co Cl!
o c 0.2 --::l
"0 > o (])
ale::
o CD
o -t
o N
r-------.--------r~~~~~~----r_------_r------~o 0 t<)
o N
(LULU) uOjUqlyul JO suoz
173
o

l' s:: o L()
. !.O '-" >-'in s:: Cl)
Cl
"6 o 
Fig. 3.85: A summation of optical density (650 nm) growth profiles of strain A, grown in medium 6, at various temperatures (0C): 22°C, .-.; 27°C, a-a; 32°C, '-'; 37°C, 0-0; 42°C, 1.-1.; all shaken at 120 r.p.m., with initial O.D. of = 0.06. Standard deviations computed for each datum point are shown, where. applicable, as error bars.
Fig. 3.86: A summation of antifungal (C. albicans) zone of inhibition (mm)/time (h) profiles, produced by strain A in medium 6, at various temperatures (0C): 22°C, .-.; 27°C, a-o; 32°C, ._.; 37°C,0-0; 42°C, A-A; all grown at 120 r.p.m., with initial O.D. of = 0.06. The antibiotic disc used was 13 mm in diameter. Standard deviations computed for each datum point are shown, where applicable, as error bars.

0 on N
• '@-. ..... <l
\ \\ \ I 0 0
• "1Ill'""' -.- <l N
\ \I \ 1 • m- -.- <l \ / \ . \1 0
on .0-0-- '1- - ...,. \ 1 1 6
CD .OV oS
\ \\ \ 0 ....
5!
·V<l ~\ . 0 on
--~~ 0
5! 0 0 U'> .,; 00 (WUOS9) ,(!lSUaO IC~l!dO .
(V') . 01 .-
l.L.
~----~
0 on N
..
~ .Q. • / 0
0 -.0:- .0 • ·N
.~/ ' .
.. CJIJ:: I-
'" 1, , 0 ,
..-m- • on -...,. \'\ 6
• CD
T\~ .S
0 ....
5!
---- -<>-~: 0 on
'" -.~ co . cV') , , , , , 0 . ' ,
" 0 on 0 '" 0 !!l ~ 5! '" 0> .. ., ., N N
. -L.I.. (ww) uOll!qlyul to auoz
175

'E s::
0 10 to '-"
>--'[i; s:: Q)
Cl
0 .2 -c.. 0
10 64
11 ____ -11-11- 11 - 11
1 / 43
•
~
~
A-~ V l
l-~/ 1
0.1 ~,
!\..-.-.. -~- - -- -- -- --- - ---- -- ----- ---- - - -- -- - -_._. ~ + +--+--+--+--+
13
0.01+----.------,----r----..----+0 o 50 100 150 200 250
Time Ch)
'E' g,
s:: 0
:;:: :c :.2 .£ .... 0 Q) s:: 0
N
9
5 :::: 0.
1
Fig. 3.87: Optical density (650 nm) growth profile, ••• ; antifungal (C.albicans) zone of inhibition (mm) profile, 10.-10. and pH profile, +-+ of strain A, grown in medium 6, at 32°C, 120 r.p.m., with initIal O.D. of:= 0.06. The antibiotic disc used was 13 mm in diameter. Standard deviations computed for each datum point are shown, where applicable, as error bars.
176
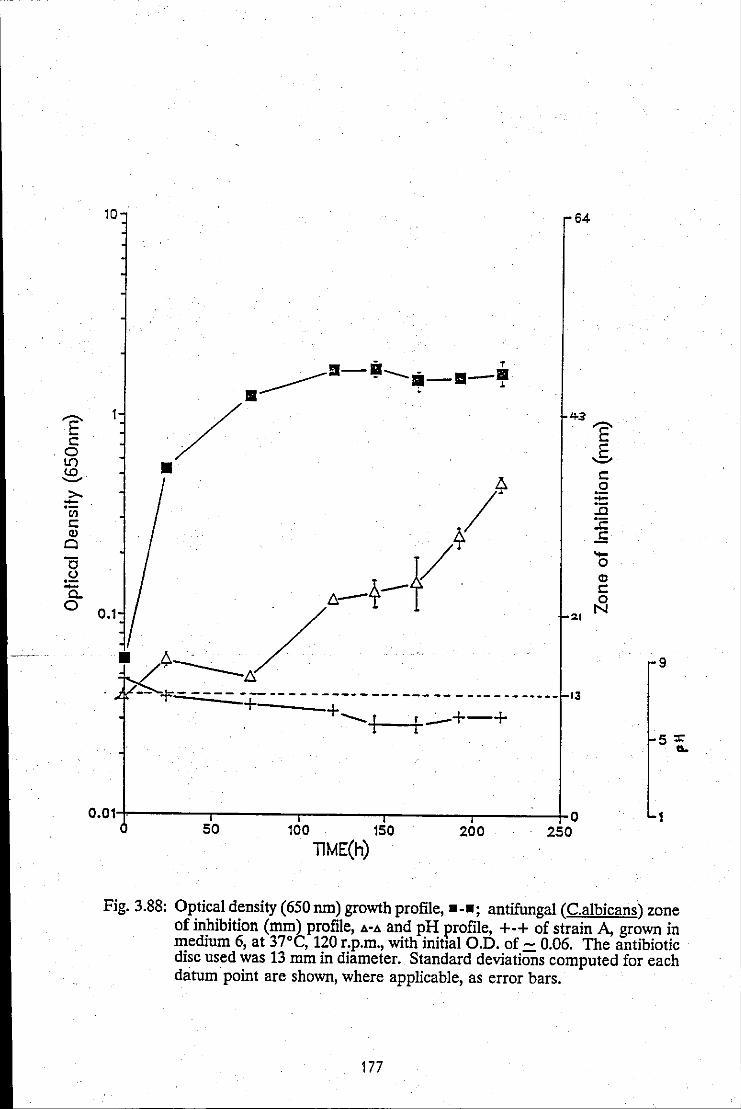
'E' c
.0 I.!")
~.
>. 0+-
'Uj C Q)
Cl
'0 .2 0+-
CO
10 64
43
'E'
• g, c 0
:;:: :c :c ..5 '>-0 CD C 0
0.1 21 N
9
-- '1='-------------------------------------- 13 + , "1' __ I 1"':'-+-+
0.011~-------_r------~------_.------_.~------rO 1 50 100 150 200 250
TIME(h)
Fig. 3.88: Optical density (650 run) growth profile, --_; antifungal (C.albicans) zone of inhibition (mm) profile, 10.-10. and pH profile, +-+ of strain A, grown in medium 6, at 37°C, 120 r.p.m., with initial O.D. of = 0.06. The antibiotic disc used was 13 mm in diameter. Standard deviations computed for each datum point are shown, where applicable, as error bars.
177

Table 3.18: Sequence of optimization experiments with corresponding percentage increases in antifungal (C. albicans) zone of inhibition, starting from the control!complete medium/med q (Czapak dox liquid medium modified). MCSD stands for medium component single deletion of the complete
. medium.
Table 3.19(a) Summary of simple scale-up optimization trials (variation of . agitation (tr./min) and aeration (Umin)) in the laboratory-scale
Table 3.19(b)
. fermentor. Corresponding visual colour assessments where increase in intensity relates to increase in antibiotic activity are based on a rating system of +1 to +3, was used to monitor.· sequential progress, each at 72 h.
Summary of further optimization trials (variation of time (days)) on optimal conditions achieved at table 3.19( a). An antibiotic assay using (C. albicans) (zone of inhibition (mm)) was used to monitor P!"ogress.

Table "3.18
. .
SEQUENCE OF OPTIMIZATION PERCENTAGE EXPERIMENTS EXPERIMENTS INCREASE IN
ANTIFUNGAL ZONE OF . INHIBmON
1 MediumB1 0 .. (Control)
2 MCSD Experiment 9 (Medium 3)
.. 3 Variation of NaNO, 37
(Medium 4)
4 Variation of sucrose 37 (Medium 4)
5 Variation of glycerol 44 (Medium 5)
6 Variation of pH 49 (Medium 6)
7 Variation of r.p.m. 109
8 . Variation of temperature 109
Table 3.19
1 ' .. (a) (b)
OPTIMIZATION IN THE LAB-SCALE FERMENTOR (100 tr/min) (4Umiri)
AGITATIO AERATION VISUAL TIME ZONE OF N (LITRES/MI COLOUR (DAYS) INHIBmO (TURNS/MI N) . ASSESSME I N) NT
N (MM)
(RATING)
150 4 ++ 2 0.0
200 4 + 4 . 15.0
100 4 +++ 6 20.5
50 4 ++ 8 15.6
100 3 ++
100 5 ++
178

(a)
RETENTION FACTOR RESULTS (First tier)
SOLVENT/ CHCl3 EtOAc MeOH :1 MeOH OBSERVATION CHCl3 :9
VISUAL 0.00 0.00 0.00 0.00
ULTRA- 0.00 0.00 0.00 Yellow VIOLET fluorescent
.. 'rocket'
CHARRING 0.0 0.0 0.0 Faint 'rocket'
(b)
RETENTiON FACTOR RESULTS (Second tier)
SOLVENT/ 1-11 11-2 11-3 OBSERVATION
VISUAL 0.00 0.00 0.00
ULTRA-VIOLET Small yellow Slight elution Small yellow 'rocket' 'rocket'
CHARRING 0.03 0.08 Slight elution
Table-3.20: Retention factor results for the active broth, showing progress through a) first tier, b) second tier of the Aszalos and Issaq solvent system strategy (Aszalos & Issaq, 1980), done on analytical TLC plates, viewed under U.V.light (253.7 - 356 nm) and cBarred after spraying with conc. H~OJglacial acetic acid (see Fig. 3.89).
179
Fig. 3.89 (A):
Fig. 3.90: (B)
Determination of appropriate solvent system for broth extraction, showing pathway taken when using the Aszalos and Issaq solvent system strategy (Aszalos & Issaq 1980) .
Determination of an appropriate solvent system for broth extraction,using an array of solvent systems of high polarity and resulting in AcOHlCHCl3 (1/9) (solvent A).
Fig. 3.89:
Fig. 3.90
DElER<1INATIOO OF JlPPRa'RIATE SOLVENT SYSTEMS
SOLl(ENT /BROTH EXTRAC!IOO
Broth su lematent
EtQlI(:
A~ : 10 Mal-! : 20 OCl3
11-1 11-2
Broth Supematent
(A)
Mal-I/OCl (First tier solvent) (1/9) 3
4(}l : 4 (Secald tier solvents)
Mal-! : 20 OCl3: 76
11-3
(B)
. r-----.------.--~·~-~--~-~-~--=--~--~-~-=--T-~-~-=--~-=--~--i , ,
lOl"ClTeth E r : 10 E
OCl3 : 90 /J(;(}l
180
:10
:90
/J(;
I I , , ,: 10
C}[lo:9O ~
(Solvent A)

Fig. 3.91: Flow chart arising from determination of appropriate solvent systems for the liquidfTLC extraction. 'x' denotes second 'dip' or 2-dimensional TLC separation. [See Fig. 3.92].

Fig. 3.91: - DETm-1INATI(XII OF APPR(PRIA1E gJLVENT SYSTEMS ------~~~~~~~~~~~-------
EtOA.c
: 1 fWi ._..,---~_ QCl
3 : 9 _.
,
SOLVENT/TLC EX1RACTI(XII
Solvent A Antibiotic concentrate
Etlli (Solyent B)
f20
ka1/QCI3 [1/9] . (Solvent A)
Acai : 1 Et ~
(Solvent A)
X
Meai : 1 _ Etlli QCl3 : 9
(Solvent C)
M:<H : 1 AdH : 1 CI{l3 : 9 _ . _ QCl3 : 9
(Solvent A)
Etlli ~'eOi : 1 EtJ.!\c QCl • 9
3 (Solvent C)
181
. !
EtOA

Fig. 3.92: Constructed flow chart for the isolation of the 3 antifungal antibiotics AF1, AF2 and AF3, using a liquid{fLC extraction route. AF = antifungal activity; AB = antibacterial activity and x = second 'dip' TLC separation denotes separation of active layer on fresh (except for 'x') prep TLC plate, using the preceding solvent. (See Fig. 3.91).

co N
3JLVENT A BROlll
Fig. 3.92:
3JLVENT B
,------, ,
• ~ ... - - - - .-
JlJl lXM'O I (IM>URE)
FLoo-JART FOR THE lSOlJ\TICl'l IF JlNTlFUNGIIL JlNTIBIOTICS
.- --. ~. -- . r-----: F •
E ~VENT A.
D 1- •• _- ••
C
r - - - - . B • •
I
3JLVENT A X A
L.. __ I .. - . - .
-E1 AF1
~ ~
r·~---- -, , X -.. I
gJLVENT C Y
:,Z -- ~ ' .. L _______
~ ('")
-------, AFL Y3 :
AF2 Y2 --_+ __ ~ Y1 I
--- ... ---t

------------------------------~--------~--. .-
ANTIFUNGAL ANTIBIOTIC 1
MICROORGANI§M MIC ~g!ml
E.coli 207
S.aureus 110
S.marsescens 276
S.cerevisia 119
C.albicalls 107
A.lliger 72
S.schenckii 156
P.chrysogenum 83
T.mentagrophytes 12
Table 3.21: Minimum inhibitory concentration determinations of the antifungal antibiotic AFl, against a range of microorganisms, grown on NA, at 37°C for bacteria, and on NspA,at 30°C for fungi. Assessment was by the agar diffusion assay.
183

Fig. 3.93: Stable zones of inhibition, created by antifungal antibiotic AF1, against . T.mentagrophytes, incubated in NspA for 5 days fit 30·C. The . concentration of antibiotic solutions placed into the cork-bore plugs (9.4
mm diameter) were as follows: 1 = 1 mg/ml; 2 = 0.5 mg/ml; 3 = 0.25 mg/ml; 4 = 0.125 mg/ml; 5 = 0.0626 mg/ml; 6 = 0.0 mg/ml (control).
Fig. 3.94: Stable zones of inhibition, created by antifungal antibiotic AF1, against Aniger, incubated in NspA for 5 days at 30·C.. The concentration of antibiotic solutions placed into the cork-bore plugs (9.4 mm diameter) were as follows: 1 = 1 mg/ml; 2 = 0.5 mg/ml; 3 = 0.25 mg/ml; 4 = 0.125 mg/ml; 5 = 0.0626 mg/ml; 6 = 0.0 mg/ml (control).
Fig. 3.95: Stable zones of inhibition, created by antifungal antibiotic AF1, against P.ch!),sogenum, incubated in NspA for 5 days at 30·C. The concentration of antibiotic solutions placed into the cork-bore plugs (9.4 mm diameter) were as follows: 1 = 1 mg/ml; 2 = 0.5 mg/ml; 3 = 0.25 mg/ml; 4 = 0.125 mg/ml; 5 = 0.0626 mg/ml; 6 = 0.0 mg/ml (control).

Fig . 3 .
Fi g . 3. 94
Fi g. 3. 95
164

Fig. 3.96 Stable zones of inhibition, created by antifungal antibiotic AFl, against S.aureus, incubated in NA for 5 days at 37°C. The concentration of antibiotic solutions placed into the cork-bore plugs (9.4 mm diameter) were as follows: 1 = 1 mg/ml; 2 = 0.5 mg/ml; 3 = 0.25 mg/ml; 4 = 0.125 mg/ml; 5 = 0.0626 mg/ml; 6 = 0.0 mg/ml (control).
Fig. 3.97: Stable disc zones of inhibition, created by antifungal antibiotic AF2, against C.albicans, incubated in NspA for 5 days at 30°C. Antibiotic discs (13 mm diameter), dipped in AFl and AF3, initially gave zones after 24 h but have now, after 5 days incubation, virtually no zones.

Fi g . 3.
Fi g . 3. 97
16 5

Fig. 3.98: A uv/vis spectrum of the antifungal antibiotic, AF1, dissolved in U.V. ethanol.
Fig. 3.99: A uv/vis spectrum of the antifungal antibiotic, AF2, dissolved in U.V. ethanol.·
Fig. 3.100: A uv/vis spectrum of the antifungal antibiotic, AF3, dissolved in U.V. ethanol.

Fig. 3.98 -' __ ~ _____________ --, -I< 2.50 Ar
0.5000 (NDIV)
+O.OOA,~~_~====~~~~ __________ ~ 200.0 100.0 (tWDIV) 700 I'M
Fig. 3.99 +2.50A~------__ ~ ______ -.
0.500 -(NDIV)
-+ 0.00 A.I-----'---...::::..::::......---:--'----~--""""'ift700 I'M 200.0 100.0 (tWDIV)
Fig. 3.100 + 2.00 A-"------------------,
0.500 (NDIV)
+ 0.00 AL---...::::=----:--:--'-----'----'rl-I/lu
I'M 200.0 100.0 (tWDIV)
186

90.0
70.0
Fig. 3.101: An infra-red spectrum of antifungal antibiotic, AFl.

Fig. 3.102: A 60MH. INMR spectrum of antifungal antibiotic, AF1, dissolved in CDCI3•
co co
Fig. 3.102
20ppm
10ppm
5ppm
2ppm
1ppm
O.5ppm
I .....
c: w I-w 2 0 c: I-U w a. Vl
c: 2 2 N :r: 2 0 c;:>
C <!l r·' , 2 L1.!

63, '/
xr
40,0
. Fig. 3.103: An infra-red spectrum of antifungal antibiotic, AF2.

40.3
xT
25.e
Fig. 3.104: An infra-red spectrum of antifungal antibiotic AF3.

CHAPTER 4
DISCUSSION/CONCLUSION

4.0 DISCUSSION/CONCLUSION
4.1 The microorganism
Two strains, A and B, of a Pseudomonas spp. (NCIB 9897 and 9898 respectively),
_ both of which are small, rod shaped, Gram negative bacteria with 1-2 polar
fiagelli, have recently been- proffered by Attafuah and Bradbury (1989) as
members of a new species of Pseudomonas.
The classification of novel microorganisms has always proved contentious in the
field of taxonomy and in the case of the Pseudomonas, a significant point of issue
has been its close resemblance to the genus Xanthamonas (MacFaddin J. F., , 1983). However, morphological (optical/electron miscroscopy),
biochemical/tolerance and antibiotic producing properties (antibacterial and
antifungal) of the organism, as revealed by the present study, supports the
contention that - it is a new species of Pseudomonas, to be known as Ps.
antimicrobica (Attafuah and Bradbury 1989; U.S.B. 1990). Important
characteristics which tend to distinguish it from Xanthamonas spp. include:
positive nitrate to nitrite; simple minimal growth requirements; inability to
hydrolyse starch, and the production of diffusible (extracelluar) yellow pigments.
BiochemicaLcharacteristics_ of Xanthamonas spp. are. summarised. in Bergey's_
Manual, (Bradbury, 1984).
The only deviation in biochemical test results of the present study from the
_ published data (Attafuah _ and Bradbury, 1989), is found in the
-oxidative/fermentative test for sucrose which was positive for the former test. This
is supported by the fact that the organism grows fairly well in Czapek Dox
Medium which has sucrose as the sole carbon source (Tables 3.2 and 3.4).
Hitherto unpublished biochemical/tolerance tests include positive results for
ONPG, catalase, urease, MacConkey agar, minimal medium, growth at pH 4
(NA), and negative results for MR/VP, ornithine and lysine decarboxylase, DNase,
haemolysis (sheep's and horse's blood), TIC (1%), cetrimide (0.03%), and
Pseudomonas agar. Furthermore, the two strains may also be distinguished by a
positive aesculin test for strain A but negative for B; a positive lecithinase test for
191

strain A but negative for B; a polymyxin MIC of 10-2 mg/ml for strain A but an
MIC of 10-4 mg/ml for B; no growth in medium (NA) containing co-trimoxazole
(25 /Lg) for strain A but growth in the same medium for B (Table 3.1).
Pseudomonas aeruginosa (tYPe species), Ps. antimycetica (antifungal production)
and Ps. tnaltiphilia (yellow pigment producer) were also tested at the same time
and acted as controls. •
Some of the test results bear a resemblance to those of Ps. cocovenenans which '
has recently been described by Gwynn et al (1988) as a source of antibiotics and
there was therefore a particular need to confirm separate species status for strain
A Subsequent comparison tests revealed a number of differences. These included
. an inability of Ps. cocovenenans to grow in a constructed selective medium for
strain A. containing sulphafurazole (500 /Lg/ml in N.A; Fig. 3.3). Here, this may
suggest that strain A may be impermeable to the drug or that it lacks (or has an
ability to bypass) a biosynthetic pathway for folic acid, and, like lactobacillus, may
be able to obtain its requirements exogenously (Woods, 1962; Wolf and
Hotchkiss, 1963; Hitchings and Burchall, 1965; Edwards, 1980). Very slow
. growth of Ps. cocovenenans in Med A2 at pH7.2 (24 hr lag phase) and at pH 4.0
(48 hr lag phase) was observed whereas strain A gave excellent (pH 7.2) and fairly
good (pH 4.0) growth (Figs. 3.4 and 3.5). Very good growth of strain A (with
strong yellow pigment exudation) on NA at pH 4.0, after 24 hrs, was observed, .- - . --- -, -~- --- --,- -~ , ,--
compared with no growth of Ps. cocovenenans, after the same time (Fig. 3.7).
Growth however, does occur for the latter but only after 48 hrs, as verified by
Gwynn et al (1988). Other differences include growth of Ps. cocovenenans in
medium containing carbenicillin (100 /Lg) but strain A did not grow (Table 3.1);
positive sucrose oxidative/fermentative test for strain A but negative for Ps.
cocovenenans; growth at 42°C was negative for strain A but positive for Ps.
cocovenenans; nitrate to nitrite was positive for strain A, but negative for Ps.
cocovenenans. (Gwynn et aI, 1988; Table 3.2).
From all the above, it seems that these two organisms are indeed different.
The comparison tests done from the present study Fig. 3.7 has also revealed that
Ps .. antimicrobica NCIB 9897 should now be included in a select group of
Pseudomonas, all of which share an ability to grow at pH 4.0. These include
192

Ps. cepacia NCIB 9085, Ps. acidophila ATCC 31363, Ps. mesoacidophila ATCC
31433 Ps. cocovenenans NCIB 9450 and a strain of the latter, designated 326-328 .
(Kintaka et aI, 1981a; Kintaka et aI, 1981b ; Imada et aI, 1982; Gwynn et aI,
1988).
Conditions for optimal growth in chemically defined media (CDM; different
amino acid content for each strain) indicate the organisms to be non-fastidious,
though growth of strain A was stimulated by phenylalanine and histidine and
. similarly for strain B, methionine, ornithine, arginine and lysine encouraged growth
(Table 3.3). With the exception of methionine and phenylalanine, the group of
amino acids chosen for this study, came from Ps. aeruginosa's amino acids
. requirements as defined by Guirard (1974). They were chosen mainly because Ps.
antimicrobica, was once misclassified as a local strain of Ps. aeruginosa (Y.
Tanada, quoted from Attafuah, 1965). Methionine, however, was chosen because
it is a key amino acid involved in many of the biological methylation processes
(Lehninger, 1980). Phenylalanine was chosen because, apart from the fact that
its metabolism is important in Pseudomonas classification (MacFaddin, 1983), it
ultimately gives rise to fumarate or acetyl Co A which enters the tricarboxylic acid
cycle,leading to increasing ATP production for metabolism (Lehninger 1980).
Non~fastidiousness was demonstrated by an inability to alter growth rates with the
vitamins, riboflavin and- nicotinic acid (constituents_ of yeast extract) and this
finding is supported by the observations of Attafuah and Bradbury (1989).
Compared to Ps. aeruginosa, both strains A and B are slow growers in the basal
medium used, with a mean generation time (mgt) of 170+6 mins for strain A, a
mgt of 150+5 mins for strain B and a mgt of 100+5 mins for Ps. aeruginosa.
(Table 3.3). The construction of their specific respective chemically defined
medium (CDM) however, culminated in a mgt reduction of 77+6 mins for strain
Aand a reduction of 53+5 mins for strain B. This compares very favourably with
a mgt reduction of 12 +Smins for Ps. aeruginosa, under the same conditions and
with its own established amino acid requirements (Guirard, 1974; Palleroni,
1984).
193

A preliminary experiment to confIrm inherent antimicrobial activity of both strains
of the microorganism was performed against A. niger. Pseudomonas aeruginosa,
Ps. antimycetica and Ps. maltiphilia were also run in tandem, acting as controls
and for comparison (Table 3.4). Pseudomonas aeruginosa and Ps. antimycetica
were chosen because both had previously been reported as having antifungal
activity (Waksman 1945; Thaysen and Thaysen, 1955). The fact that Ps.
antimycetica did not inhibit fungal growth on Potato Dextrose Agar (PDA) here,
may have been due to a lack of essential trace elements/precursors in the medium,
necessary for the production of its antifungal principal. This observation
emphasizes the need for good medium design in antibiotic production.
The intense yellow pigmentation produced by strain A on Czapek Dox Agar
. (CDA), was accompanied by an inhibition of A. niger which was greater than that
achieved on PDA (Table 3.4). This may suggest that with CDA, a cheinically
defIned medium specifIcally developed for fungi (Smith, and Onions, 1983), the
bacterium was under particular stress due to a scarcity of essential nutrients and
or a h9stile environment (Frobisher, 1959; Holliman, 1961). A similar test with
the comparison organism, Ps. aeruginosa, could not be pursued successfully
because this organism is not able to metabolise sucrose which is the only carbon·
source of CDA (MacFaddin, 1983). This fact also reinforces the present study's
positive· results obtained for the oxidative/fermentative test for sucrose on Ps ....
antimicrobica, as opposed to a negative result obtained by Attafuah & Bradbury
(1989). It is to be noted that under the same test conditions, Ps. aeruginosa gave,
as expected, a negative oxidative/fermentative test for sucrose (Table 3.1).
4.2 Antibacterial activitv studies
The quest for a medium able to elicit consistent antibacterial activity was mostly
influenced by the work of Hellinger (1951) and by Holliman (1961) where a
considerable number of parameters, both medium components/concentration and
environmental, were sequentially altered, in an attempt to elicit production of
secondary metabolites in liquid media. This quest resulted in a basal medium
(Cruickshanks medium; Cruickshank, 1970) which was preferred to Czapek Dox
Liquid Medium (CDLM) mainly because it was simpler and gave a longer lasting
194

production/detection of antibacterial substance at 90 r.p.m., 37°C. (Fig. 3.17 and
Fig. 3.74).
The preliminary heat stability experiment which still showed activity after 20 mins
at 100°C, (Section 2.3.3a) was done in order to establish that the active substance
was probably not an enzyme, a bacteriocin, a toxin or a similar proteinaceous
substance. The test for pyrrols on the active broth which was negative, was done
in order. to establish whether a similarity existed between the antibacterial
substance and two other, well known, pyrrol containing Pseudomonas antibiotics,
. namely pyrrolnitrin and pyolu.teorin (Takeda, 1958; Arima et ai, 1964). The
results of the above two experiments served to establish at this early stage, a
likelihood that the active principal may indeed be of some interest and therefore
worthy of pursuit.
Cultures initiated with a "pigmented inoculum" (Section 2.3.2) showed greater
antibiotic production after 24 hrs than the normal "washed inoculum" situation,
both grown at 90 r.p.m., 37°C. Wrede and Strack (1924) and Swan et ai, (1957)
have reported that the Pseudomonas pigment, pyocyanine, which can also be
reduced to leucopyocyanine, can in this latter form, readily absorb oxygen. It is
possible that oxygen uptake may have occurred during rotary incubation
(aeration/agitation) and upon metabolising the pigment, oxygen was given up for
cell use. Alternatively, or in addition, it is known that many of these pigments are
toxic and can act as bypasses of the cytochrome system resulting in toxic end-e
products of oxygen metabolism (principally peroxides). Consequently, certain cells
which are catalase abundant, protect themselves by splitting H20 2, thus liberating
O2 (Latuassan and Ber. ands, 1961) and this is likely to have a net effect of
increasing the availability of O2, Since many workers agree that good/adequate
aeration is essential for enhanced pigment production (Elema and Sanders, 1931;
Hellinger, 1951; Holliman 1961; Mudgett, 1980), this may explain why antibiotic
production was significantly greater in the "pigmented inoculum" situation than in
the "washed inoculum" situation.
In contrast to the 'shaken' situation described above, the static "pigmented
inoculum" experiment showed no detectable activity and again this suggests that
195

good/adequate aeration is essential for the development of the antibiotic in this
medium.
As an aid to understanding the biochemistry/genetics of the regulatory mechanism
of antibiotic production and of growth during the optimization study, a probable
schematic diagram is proposed. (Fig. 4.1). It has been constructed in light of all
the antibiotic studies undertaken and from current knowledge of the
biochemistry/genetics of antibiotic regulation (Bushell, 1989; Hunter and
Baumberg, 1989). It takes into cognizance Atkinson's energy charge (E.C.)
formulation (Atkinson et aI, 1969) and is predominantly based upon NADH as the
intracellular effector (Behal, et aI, 1969).
Allthe antibacterial optimization studies were initiated with 'washed' inocula, to
give an initial optical density (O.D.) of = 0.06. This was done because trace
metals, unused carbon and· nitrogen sources remaining in the former growth
medium, though diluted after inocular transfer, may still have interacted
metabolically through enzyme repression, induction, inhibition or activation with
substances in the new medium. Together with this metabolic interaction, toxic
end-product transfer and high cell packed volumes may also have inconsistently
affected antibiotic production. (Brown and Zainudeen, 1978; Young, 1979) .
. During optimization, a medium component single deletion procedure was initially_ .
adopted and this was followed by sequential variation of the concentrations of
individual medium constituents, essential for antibiotic production and growth. It
was found that omission of Mg2+ (MgQz.6HzO) from the standard laboratory
reagent (SLR) grade medium recipe, leaving only trace amounts (3.9 x 10⁻⁶M),
significantly increased production (Fig. 3.12). This is surprising because
magnesium is termed a macronutrient, essential for maintaining the integrity of
the ribosomes, for membrane stability and also for the function of many enzymes
(Strange and Hunter, 1967; Mandelstam and McQuillen, 1973). In view of this,
one would not have expected much growth let alone antibiotic production. It is
possible here, that strain A may have already evolved an uptake mechanism with
high affinity for Mg2+ and, an affinity for substitute divalent cations, all present as
trace metals in the medium (see appendix. Though these trace element values are
specifically for AR grade chemicals, one would expect higher values for the SLR
196

situation). Examples of similar uptake mechanisms have been reviewed by
Tempest and Neijssel (1978). A similar experiment, performed as above, using
purer analar reagent (AR) grade chemicals in the preparation of the medium,
stopped antibiotic production though similar growth ensued (Fig. 3.13 - Fig. 3.14).
All this strongly ,suggests some involvement of essential trace elements in the
antibiotic production and this finding is supported by other work done by Foster
et al (1943) on penicillin, Chesters and Rolinson (1951) on streptomycin; Katz
et al (1958) on actinomycin, Kurachi (1958) on pyocyanine andWeinberg and
Tonnis (1966) on bacitracin production.
From Figs. 3.15 - 3.18 it can be seen that the minimum glucose concentration for
achieving maximum growth and antibiotic production was 0.3% and this coincides
with the set value obtained for. optimum growth of bacteria during the
construction of this defined medium. (Cruickshank, 1970). Altogether, this
suggests a direct relationship between growth and antibiotic production and
between glucose concentration and antibiotic production (Fig. 3.19), below a
threshold value of 0.3% .. From this it can be argued that in this fermentation, the
antibiotic concentration may directly relate to the number of actively dividing cells:
a feature often reported by other workers in the field and is known as "growth
associated mode antibiotic production". This production is nearly always 'low
level'/incidental as opposed to produc~ion in the i~iophase which i~ comparatively
. 'high level' (Shehata, et aI, 1971; Drew and Demain, 1977; Aharonowitz and
Demain,1978). Increasing the glucose concentration furthe~ (above 0.3%), from
flask to flask, resulted in a depression in both growth and antibiotic production
and this may have been due to substrate and end-product inhibition for the
former and glucose catabolite repression for the latter (Gallo and Katz, 1972; Hu
et aI, 1984; Revilla et aI, 1984; Lebrihi et aI, 1988; Bushell, 1989).
Unlike glucose variation, no such simple relationship exists with nitrogen (NH4Cl)
variation; that is to say, between growth/concentration of nutrient and antibiotic
production (Fig. 3.21-3.25). Growth here, apparently continued noiTnally with
decreasing NH.Cl concentration, right down to 0.01% where no antibiotic
production was detected. However, peak antibiotic production was detected at
0.06%. From all this, it appears that as the NH4Cl concentration was decreased
197

from flask to flask, strain A might have, while under stress, favoured the glutamine
synthetase~glutamate aminotransferase (GS-GOGAT) enzyme system over that of
the glutamate dehydrogenase (GOH) enzyme system, resulting in increasing
production of the antibiotic (Aharonwitz, 1979). Such a property in the wild,
would give strain A a distinct survival advantage '" .
Variation of the initial pH of the medium showed that in general, as the pH was
i;, creased from flask to flask from a point (7.0), there was a fall in both antibiotiC
production and growth (Figs. 3.27 and 3.29). Furthermore, decreasing the pH
from the usual medium pH of 7.2 (normally associated with good growth of most
bacteria; Miller and Churchill, 1986; van Demark and Batzing, 1987), to pH 6.0,
a significant increase in antibacterial production occurred (Fig. 3.29). It is possible
that decreasing the pH may have imposed stress upon the organism, due to just
enough undissociated weak acids entering the cell to cause a stimulation in
general metabolism and thereby enhancing antibiotic production. (van Demark
and Batzing, 1987). In the wild, this property would be of advantage especially
in a crowded environment where acidic metabolic end-products and contents of
cell lysis such as gluconic, citric and anthranilic acids may abound (Takeda, 1959;
Martin and Demain, 1980) .
.. Increasing or decreasing the pH to excess adversely affected both growth and
antibiotic production and this may have been due to the formation of excess
undissocciated weak acids and bases, both of which are known to readily enter
cells, disrupting the metabolism and physiology (van Oemark and Batzing 1987).
Variation of agitation/aeration of different cultures, incubated at different r.p.ms.,
showed that as the r.p.m. was increased from 90, there was in general, a fall in
both growth and antibiotic production (Figs. 3.31 and 3.32). However, at 120
r.p.m., a tremendous increase in antibiotic production occurred after 60 hrs
incubation (Fig. 3.32). The growth profile for cultures incubated here, was
surprisingly biphasic (Fig. 3.33), since such profiles are normally associated with
2 carbon source media (Monad, 1942; Stainer et aI, 1984; Ooull and Vining,
1988).
198

Cultures incubated at 120 r.p.m. would have received an increase in oxygenation,
(relative to the 90 r.p.m. situation) which may have increased cellular
concentrations of NAD+, leading to feedback inhibition of the electron transfer
chain (ETC), via an allosteric enzyme (Fig. 4.1). Eventually, an increase in
celluhir concentration of cAMP, coupled with a decrease in ATP concentration
(low E.C.) would have resulted. Up to this stage, exponential growth (steady
increase in cell mass) would have been directly proportional to "Iow level"
antibiotic production on account of an already triggered antibiotic biosynthesis at
start of primary log phase (such low level/incidental antibiotic production has been
observed by Hormouchi and Beppu, .1987, and Martin and Demain, 1980).
However, at this stage, when the growth cycle had entered mid-stationary phase,
an antibiotic activator protein may have. combined with the cAMP, forming a
. complex. This complex would then have attached itself to a promotor site of an
operon, initiating coding for antibiotic inducible enzymes, which would ultimately
go on to stimulate transcription. As more NAD+ was used up during
phosphorylation of cAMP to ATP, this would have led to a removal of the NAD+
feedback inhibition and with more ATP produced (high E.C.),cell growth and a
tremendous increase in antibiotic production would have ensued.
Further increases in r.p.m. would not only have increased NAD+ and cAMP levels
~-~~---- on account of excessive oxygenation but would have physically stressed the cells.
Altogether· this would have lead to progressively stronger and earlier occurring
NAD+ feedback inhibition, resulting in a limitation in both growth and antibiotic
production. A similar effect was obtained by Grossowicz, et al (1957) who
observed that pyocyanine production from Ps. aeruginosa was stemmed upon
vigourous shaking during incubation. Cultures incubated at progressively lower
r.p.ms. would have experienced corresponding decreases in oxygenation, resulting
in poor growth and antibiotic production.
Variation of the temperature of incubation for different cultures, shaken at 120
r.p.m., gave 37°C as being optimal for both growth and antibiotic production in
this medium (Figs. 3.34 and 3.36). Cell aggregation or clumping in this minimal
medium, increased as the temperature decreased, clearly illustrating clumping to
be a nutritional/temperature dependant phenomenon (Calleja, et aI, 1979; Calleja
199
I
I

~ NADH is first oxidized to NAD+ by the electron transfer chain (ETC;
Fig. 4.2) involving the reduction of oxygen. The resulting 2H+ are then used in
a phosphorylation process which gives rise to an increased cellular concentration
of ATP (Fig. 4.3) and " decrease in cAMP and NAD' level,. A high energy
charge (EC) situation at the beginning: of log phase is thus obtained.
The high levels of ATP may at first depress antibiotic production (feedback
inhibition) (Janglova, et a1. 1969j Martin, 1976; Manin, et al. 1976) and allow
utilization of ATP for cell metabolism only but, after a threshold value (ATP
concentration), feed·back inhibition is lifted and antibiotic production proceeds.
~ Using ATP cataJ"zed by the enzyme adenyI.ate cyclase, glucose is
phosphorylated to glucose-I-phosphate and this goes on to be used for cen,
metabolism alone, or cell metabolism and antibiotic production. This results in
an increase in cellular cAMP and a decrease in ATP leading to a low E.C .. In
time, end~product inhibition/repression would lead to an increase in the level of
NAD+, resulting in feedback inhibition and subsequent entry into stationary/mid~
lag phase.
~ Cyciic AMP combines, sequentially, with various activator proteins (AP)
including firstly. AP (2nd carbon source) which results in the production of second
carbon source metabolic enzymes (constituting a pathway); secondly, AP (AB1)
which results in the production of antibacterial biosynthetic enzymes and thirdly,
AP (Nn) which results in the prOduction of antifungal biosynthetic enzymes
(Alper, tlAL 1978).
Stage 4 After completion of the metabolic and biosynthctic pathways, the cAMP
is then phosphorylated to ATP and this ultimately leads to the removal of the
NAD+ feedback inhibition and a high E.C. It is possible that the twO antibiotic _
pathways may have different ATP concentration thresholds thus enabling the
feedback inlubition of one to be lifted before that of the other.
~ The ATP thus accumulated here is used for growth alone or growth and
sequential antibiotic production thus giving rise to biphasic growth. In time,
depletion of essential nutrients and end·product inhibition/repression would curtail
production of ATP and hence lead to a low ac and increased NAD+ levels.
This would then effect feedback inhibition resulting in a stationary phase.
"

N o o
PROBABLE SCHEMATIC DIAGRAM FOR REGULATION OF ANTIBIOTIC PRODUCTION AND GROWTH ETC (See FIg 4.2) c ~ ~ ~ AMP ~ ATP ~ NAD + ~ NADH "OJ- ,.- NADH)
(Existing in dynamic equilibria) 2 2
_( NAD + __ (S~ FIg 4.3) Depression of H20 -- r----------------------,
! I ~ . ~ ATP m :. cAMP m : I High E.C. AGE I cAMP A ST
I t Glucose-I-phosphate (ete) ~ Cel! metaboUsm alone or cell metabolism fIrst then antibiotic production
AdenYlate-{ p A- I (strict sequence) cyclase I I L _______________ ~
"-CAMP
Glucose End-product inhibition (NAD +)
AGE 2 ~ :. cAMP m :. ATP ill :. NAD + m:. Feedback Inhibition I Low E.C. ST
nd -V .
genes AP(2 carbon source) I cAMP I AP I
u l operon AP(AbI>
u u
u~u <D 2 nd carbon source metabolic enzymes AP(Af D) chromosomes to
inducer enzymes encoded +- initiate production of :-CD Ab I biosynthetic enzymes
AGE 3 cAMP m . CD Af n biosynthetic enzymes st
£: \\ - Depression of
ATP .. :. ATP +H --r-----------------~-----------------1 I
----I - --- .
I I I I
NAD+ :. NAD + ill :.: Removal of Feedback. Inhibition I . I • I : I AGE 4 NADH ~ :. NADH m I High E.C. ST
.lO~-- --f I , 2 2 L. To be used for growth alone or growth fIrst then antibiotic production
(strict sequence)
<D Depletion of essential nutrients CD End-product inhibition I repression
ST
cAMP
* ~ ATP
.
HV- ~ :. NAD + m:. Feedback Inhibition I AGE 5 --ETC'" NAD+ • Low E.C. I I .. L ____ +----------
F~dback Inhibition
GlROwnI PHASES
LAG PHASE
LOG PHASE
STATIONAR y I MID-LAG
PHASE
BIPHASIC GROWTH
y STATIONAR PHASE

Fig. 4.2:
(After van Demark and Batting, 1987)
The electron transfer chain fETC) in a bacterium. The first carrier, a flavoprotein
(Fp) accepts hydrogen from NADH and passes electrons along to a non·haeme
iron carrier [nhFe]. Thereafter the electrons are passed sequentialIy to coenzyme
A(CoQ), cytochrome·b (Cytb), and finally to cytochrome.O(Cyto 0). The latter
functions as the tenninal member of the respiratory chain to reduce oxygen.' The
flow of one pair of eiectron leads to the extrusion of 2 pairs of protons (H+).
Merr:crcne s:o!enllOt
••••••• Memcrcr .•
~------~-~-~-~-:-:-:-NN~.O;H~+~H~.:'\\=;::::;~-+:2H. NAQ.t;
iE:=:r-+: 2H' Icw proton coneentrotlon
Fig. 4.3:
(After van Demark and Batzing, 1987)
ATPa!ie mediated phosphorylation within a bacterial cel!. As protons arc
extruded they accumulate outside the membrane of the cell. This creates a
proton gradient across the membrane. Protons 3rc then returned to the inside of
the cell through channels provided by the enzyme ATPase which spans the
diameter of the membrane. For each protan pair passing 'through, the ATPase
enzyme generates one ATP molecule from ADP and H}PO,. Thus the potential
energy of the proton gradient is converted into the chemical energy of the 'high
energy' bond ATP (Mitchel, 1968).
201

•
1984). Increasing the temperature of incubation for different flasks, above the
optimal growth temperature, may have progressively increased the rate of
denaturation of certain essential enzymes and certain proteins of the cells,
resulting in death and cell lysis, especially at the longer time periods (van Demark
and Batzing 1987) .. Additionally, high temperatures may have activated the
autolytic enzymes of the cell, causing cell lysis. From Fig. 3.36, the narrow·
temperature range of 32°C - 42°C suggests that the biosynthesis of this antibiotic
may be highly thermoregulatory.
The various initial O.Ds. in different flasks, during incubation, showed that the
optimum antibiotic production occurred at the low initial O.D. of 0.06 (Figs. 3.37 -
3.39) and as the initial O.D. increased along the series, so the antibiotic
production fell to a cut off point at initial O.D., 0.1 (Fig. 3.39). Though the
critical factors here are not yet well understood (Smith and Calam, 1980; Calam,
1986), this phenomenon of high initial O.D. stemming antibiotic production may
have been associated with a low Ozfcell packed volume ratio and to toxic end
products. giving rise te partial NAD± feedback inhibition. Consequently, a low.,.
E.C. situation which favoured growth to the exclusion of antibiotic production
(strict sequence) may have occurred. (AJper et aI, 1978, Fig. 4.1) .. The reason
why no biphasicity occurred as the initial O.D. decreased along the series from
0.06, may have been due to a relatively higher Oz/cell pack volume ratio and a
relatively higher end-product dilution, both cases occurring on account of the
smaller numbers of cells present, especially at the earlier growth stages.
Subsequently, this must have given rise to better growth with no biphasicity and
to low level antibiotic production. In support of the existence of a sensitive role
. for nutritional end-products on growth and subsequently, on antibiotic production,
Martin and Demain (1980) pave revealed the existence of a mechanism, mediated
by cAMP and a specific activator protein, which is highly responsive to catabolite
concentrations. The mechanism, when activated,initiates the production of
substances which can depress carbon source metabolism. It is to be noted that
the fact that not much antibiotic production occurred in the first 24 hrs for initial
O.Ds 0.03 and 0.015 (Fig. 3.38), was probably directly due to the overall number
of antibiotic producing cells present during this time (Fig. 3.37).
202
All the above optimization studies seem to lend particular weight to the group of
workers who support the contention (as discussed at sectionl'3) that stress factors
are important initiators of antibiotic production. (Bruehl, et ai, 1969; Katz and
Demain, 1977; Martin and Demain, 1980; Nisbet and Porter, 1989).
The final optimized medium and conditions were as follows:
NH4CI, 0.6 gmlL; Nai50., 0.2 gm/L; KH2P04, 11.3 gm/L; KzHP04, 2.9 gmlL;
glucose, 3.0 gmlL; pH 6.0; 120 r.p.m. (orbital incubator); 37°C; 72 hrs and this
gave an inferred (log dose-response curve; Fig. 3.44) yield of 0.372 mg/ml. This
yield compares very favourably with other wild-type (non-mutated) optimization
studies (Takeda, 1958; White, et ai, 1986). A factorial increase of 9.3 starting
from the controlfcomplete' medium was achieved (Table 3.6). Variation of r.p.m.
(aeration/agitation) gave the greatest single increase in antibiotic production.
Stochastic errors of variation, inherent in the whole optimization procedure, gave
an O.D. coefficient of variation (C.V.) of 12.3%, a pH C.V. of 1.2%, a zone of
inhibition C.V. of 9.7% and a dose-response calibration curve assessment of
antibiotic concentrations in broth culture C.V. of 21.9%. Altogether these show
good significance (Sussman, 1964). The pH C.V. was particularly low because of .
the strong buffer used .
. A simple scale-up procedure from the orbital incubator. (50 ml in 250 ml conical
flask) to a '6 litre laboratory scale batch fermentor was adopted (Table 3.7 a & b)
because of the need to produce enough quantities of the antibiotic for chemical
analysis. ,This resulted in the optimum conditions of 150 tr/min (Rush ton
impeller), 4Umin (aeration), 72 hrs (incubation time) at 37°C and gave an
inferred yield of 0.038 mg/ml. This yield was poor when compared to the
optimized 'conical flask/orbital incubator. fermentation inferred yield of 0.372
mg/ml and thus reflects directly. on the simplicity of the scale-up procedure. It
- must be stressed, however, that because of the many critical factors that govern
antibiotic production (Fig. 1.5), even slight differences in fermentor design would
inevitably result in some loss of antibiotic production when moving from an
already optimized system (Trilli, 1986).
203

During the fermentation, a black plastic bag was secured around the glass vessel
of the fermenter to cut out sunlight in case the antibiotic was significantly
susceptible to photo-degradation (deleterious range = 290 to 450 nm; U.S.
Pharmacopoeia XIX 1975).
Downstream processing (Fig. 3.40 3.43, Table 3.8), involving
methanol/chloroform (1/9) for broth extraction, ethylacetate for TLC extraction
and hexane for trituation, gave rise" to a yellow crystalline product the purity of
which was confirmed by HPLC (retention time (Rt) 10.4 mins). The solventtrLC
. extraction route (Fig. 3.42) was the preferred extraction route as it gave rise to far
better percentage efficiency of extraction than the solvent/solvent extraction route
(Fig. 3.41): 62% against 13%. Furthermore it was far easier to manipulate.
During the quest for a suitable mobile and stationary phase to isolate the
antibiotic from the broth .culture, the Aszalos and Issaq flow chart (Aszalos and
Issaq, "1980), originally devised as an aid for the identification of established
antitumour agents, was used. The rationale behind using this was centered on the
premise that a solvent, capable of eluting the active substance up a. TLC plate, is
one that was also likely to extract the antibiotic from the broth. The ideal solvent
system to aim for would be one that was immiscible with the aqueous broth and
one that would extract the antibiotic with as least a number of co-extractives as
"" possible. Methanol/chloroform fulfilled these objectives quite well.
During the extraction experiments, a yellow/green, non-active fluorescent material
was often seen on the TLC plates when examined under U.V. light (Table 3.8,
Fig. 3.43). This may well have been a pseudobactin (siderophore) produced by
the cell to chelate trace quantities of Fe2+ from the basal medium. (Wendenbaum
et aI, 1983; Palleroni, 1986). It is interesting to note that in literature (Attafuah
and Bradbury, 1989), strain A is cited as belonging to a Pseudomonas group which
does not produce fluorescent pigments. To account for this anomaly, it is possible
that under these unusual/stressful conditions, a metabolic pathway which can
produce fluorescent pigments may have been triggered. This would suggest that
the existing biochemical test (King, E. O. et aI, 1954) for the ability of an
organism to produce fluorescent pigments, may not be accurate enough to account
for all cases. A similar case was recorded when Jamieson (1942) accidentally
204

triggered the production of blue/green pigments from organisms previously
considered to be Achromabacter spp. He later had to recommend a modification
in the classification of the microorganisms, by suggesting they be placed under
Pseudomonas spp. (Hellinger E., 1951).
Overall, TLC has traditionally been the preferred initial, small scale, extraction
route for this type of antibiotic research as it allows for quick and easy
solid/mobile phase manipulations and can give rise to very good product yields
(Calam et aI, 1986; Chan arid Aszalos, 1986). The final extraction yield of the
antibacterial substance obtained from the lab-scale fermenter was 236 mg/10L and
this compares very favourably with some wild-type bacteria lab-scale fermentation
extractions (Takeda R, 1958; Primrose S. B., 1987) .
. The calculation of percentage efficiency of extraction, (only made possible by the
log dose-response calibration curve) from the lab-scale fermentation, was 62%.
It is interesting to note that although the initial analytical TLC test elution with
solvent A, only eluted 1 spot (Table 3.8), this spot was further split into 5
components after ethylacetate elution (Fig. 3.42). The resulting antibacterial
antibiotic fraction from this, was again split into two further fractions with hexane.
All this clearly illustrates the renowned difficulties associated with isolation and
. purification which are often encountered by investigators working on unknown
compounds derived from novel (particularly natural) sources. Such difficulties
occur because the active broth can often present an extraordinarily complex
mixture of primary and secondary metabolites (some quite closely related),
occurring at concentrations ranging from nanograms to milligrams per millilitre
and in which only one of the compounds may be of interest (White, et aI, 1986) .
. Retention factor (Ri) determinations of the antibiotic in 9 different solvents,
covering an even cross-section of solvent polarities, gave a value of 0.67 for
methanol which was the best eluent, followed by 0.64 for solvent A
(methanol/chloroform) (Table 3.9). However, at the other end of the polarity
scale, hexane did not move the antibiotic spot thus showing why it was such a
good trituating agent. From all the above it was quite evident that the compound
possessed some polar characteristics. It shOlild be noted here that since only one
205 ..

. spot was seen eluted each time, in all the solvents used, this was a further
indication that the isolated antibiotic was pure.
pH/thermal stability tests (Table 3.10) revealed the antibiotic to be thermostable
at low pHs (pH 2,0) but unstable at high pHs (pH 9.0). This again suggests some
polar characteristics for the antibiotic and if later found to be non-toxic, would be
excellent for the preferred oral route, drug administration, mainly because it is
likely to be stable at the lowstomach pHs. Ultra-violet light stability tests (Table
3.11) showed comparable stability with the established drug, tetracycline and
therefore suggests acceptable U.V. stability for the antibiotic as a potential drug.
Minimum inhibitory concentration (MIC) tests (Table 3.12), against a number of
microorganisms, using an agar plate diffusion assay, indicted activity to be in the
pg/ml range for sensitive microorganisms (E. coli 1.3 pg/ml and ~. abony 1.0
pg/ml). Antibiotic challenge against the growth profiles of E. coli (Fig. 3.45) and
'in situ' subculturing, indicated a rapid onset, non-lytic, antibacterial activity. (Fig.
3.45). This therefore, suggests that the antibiotic is bacteriostatic.
During structure determination, qualitative chemical analytical tests, done on the
antibiotic, showed it did not contain a pyrrol ring (Kovac's test); it was not a
carbohydrate (anthrone test) but did contain a ketone (Feigl test); it did not
co~tain aldehyde· (SchiffsJFuschsin . test) nor did it contain an amino·· acid
(ninhydrin test); finally, it did not contain alkyl/aryl halides (formalin test).
It is possible from the uvMs spectrum (Fig. 3.47) that the antibiotic may contain
2-3 conjugated bonds in its structure as exemplified by two peaks below 300 nm
(Dudley and Fleming, 1987).
It was also found from KBr disc I.R. scans (Fig. 3.48) that the structure may
contain saturated C-H groups, 298OCm.l; secondary amide groups of unknown
origin, 312OCm.l; >C = N (imines) groups, 1690-1640,m.1 and conjugated cyclic
systems, 1660-1480,m-l. (Steele, 1971; Dudley and Fleming, 1987). Next, a local
search/comparison of the finger print region, with those of established antibiotics
. was made but this failed to reveal the identity of the compound. (British Pharm.
2116
I
I
I
I
I
I
I. R. Ref. Spectrar., 1980; Keller, R. J. (Sigma I. R. Library) 1986; Pouchart, C ..
J. (Aldrich I. R. Library), 1981).
Mass spectral studies suggested that the first electron/mass (e/m) ratio is 193
(measured accurate mass, 193.0599; Fig. 3.49) and it is therefore highly likely that
ihis, in actuality, is the mass number or atomic mass unit (a.m.u.) of the antibiotic ..
Also, from the list of the arithmetically possible atomic compositions of the
compound (Table 3.13), the ratio which had the least percentage deviation (-0.1
millimass unit (1 millimass unit =. 0.5 p.p.m.)) from the theoretical mass was C
(7), 13C(0), H(7), N(5), 0(2). From all the above considerations this elemental
ratio must strongly suggest the empirical formular (C,H7Ns0 2) of the compound
(Dudley and Fieming, 1987).
Bond lengths and angles (Tables 3.15 and 3.16) of the antibiotic crystal, which had
been very carefully grown in the most suitable solvent (chloroform) to avoid
imperfections such as twinning, were obtained from x-ray diffraction. The results
were used, together with an atomic numbering scheme, to generate the molecular
structure (Fig. 3.50). This final structure was obtained with a R factor of 7.3'(and
is therefore highly likely to be correct.
A structure search for the identity of the antibiotic revealed it to be xanthothricin
(1-6-dimethylpyrimido[5,4-e ]-1,2,4-triazine-5, 7(lH 6H)-dione), also known as
toxoflavin (Fig. 4.2), a powerful but toxic antibiotic (I.V. LDso = 1.7 mglkg and
oral LDso = 8.4 mg/lg against mice), only previously known to be produced by Ps.
cocovenenans and" a streptomyces spp. (van Veen and Mertens, 1934; van
Damme, et ai, 1960;" Bycroft, 1988). Ps. cocovenemins also produces a toxic
antifungal substance known as bonkrekic acid (Nugteren and Berends, 1957).
Although a Cambridge databank search in 1988 revealed that the structure had
not been confirmed by x-ray crystallography, a more recent search (1990) from the
same source, revealed that the structure was confirmed by x-ray crystallography
by the Russian, Aleksandrov et ai, (1986).
It is thought that xanthothricin's mode of action may involve it acting as a highly
efficient electron-carrier which provides a by-pass of the ETC, giving rise to lethal
207

concentrations of toxic end-products of Oz metabolism, such as HzOz (Latuassan
and Berands, 1961; Wolff, et aI, 1986; Kako, 1987). This· may explain why
anearobic ceIIs such as Cl. sporogenes and catalase-abundant ceIIs such as C.
albicans remained unaffected even at high concentrations (> 2000 /,g/ml)."
Fig. 4.2: Xanthothricin
o
[1,6-dim·ethyl pyrimido[ 5,4-e ]·1,2,4,.triazine·5, 7 (lH, 6H)·dione].
Similar structures of interest include the antibiotic, Fervenulin (a), obtained from
Streptomyces fervens (Daves et aI, 1961) and the chemotherapeutic agent
Xanthinol nicotinate (b). AIl 3 have similar methylalloxan rings (KeIIer, R. J.,
(Sigma I. R. Library), 1986).
A VCOOH
(a) (b)
208
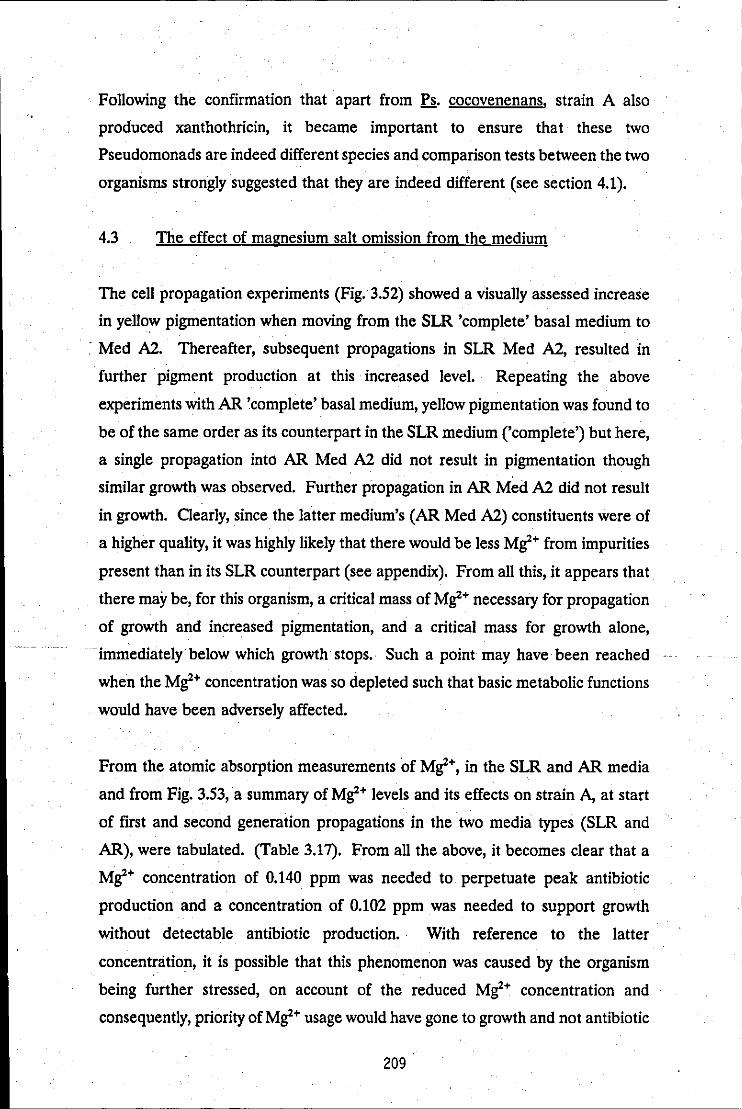
Following the confirmation that apart from Ps. cocovenenans, strain A also
produced xanthothricin, it became important to ensure that these two
Pseudo monads are indeed different species and comparison tests between the two
organisms strongly suggested that they are indeed different (see section 4.1).
4.3 The effect of magnesium salt omission from the medium
The cell propagation experiments (Fig. 3.52) showed a visually assessed increase
in yellow pigmentation when moving from the SLR 'complete' basal medium to
. Med A2. Thereafter, subsequent propagations in SLR Med A2, resulted in
further pigment production at this increased level. Repeating the above
experiments with AR 'complete' basal medium, yellow pigmentation was found to
be of the same order as its counterpart in the SLR medium (,complete') but here,
a single propagation into AR Med A2 did not result in pigmentation though
similar growth was observed. Further propagation in AR Med A2 did not result
in growth. Clearly, since the latter medium's (AR Med A2) constituents were of
a higher quality, it was highly likely that there would be less Mg2+ from impurities
present than in its SLR counterpart (see appendix). From all this, it appears that
there may be, for this organism, a critical mass of Mg2+ necessary for propagation
of growth and increased pigmentation, and a critical mass for growth alone,
immediately below which growth stops. Such a point may have been reached ..
when the Mg2+ concentration was so depleted such that basic metabolic functions
would have been adversely affected.
From the atomic absorption measurements of Mg2+, in the SLR and AR media
and from Fig. 3.53,a summary of Mg2+ levels and its effects on strain A, at start
of first and second generation propagations in the two media types (SLR and
AR)' were tabulated. (Table 3.17). From all the above, it becomes clear that a
Mg2+ concentration of 0.140 ppm was needed to perpetuate peak antibiotic
production and a concentration of 0.102 ppm was needed to support growth
without detectable antibiotic production.· With reference to the latter
concentration, it is possible that this phenomenon was caused by the organism
being further stressed, on account of the reduced Mg2+ concentration and
consequently, priority of Mg2+ usage would have gone to growth and not antibiotic
209

production. These results are similar to those obtained by Grossowicz et al (1957)
in their work on the effect of MgS04 on pyocynine production in Ps. aeruginosa.
Here, it was obselVed that a critical mass of Mg2+ was necessary. for peak
pyocynine production. Furthermore, Young and Kempe (1984) showed whilst
investigating the effect of lincomycin production in Streptomyces lincolnensis that
as initial concentrations of Mg2+ was reduced along a series of shake flasks,
lincomicin production fell but this fall colorated with increases in the biomass.
Using tM. atomic absorption spectometer, the Mg2+ content/mg of washed cells,
previously grown in basal medium was compared to those grown in Med Al. It
was found that for the former, the cells had accumulated a Mg2+ concentration
of 0.31 pprn/mg of cells and the latter,0.11 ppm/mg. These results suggest that
the cells may have an active uptake mechanism for Mg2+.
From all the studies done above it becomes clear that strain A seems to be a far
more efficient scavenger of Mg2+ then either Ps. aeruginosa (control in the SLR
propagation experiments) or Ps. cocovenenans (Fig. 3.51 a?d 3.52 respectively).
In view of all this, it is possible that strain A may have an industrial or scientific
research application where powerful microbial scavengers of Mg2+ are required ,
but further research may be needed to confirm this.
The cell viablity growth cUlVe was constructed to determine how the drop in Mg2+
was affecting the true growth situation. From Fig. 3.54, the control/complete basal
medium shows a short declining stationary phase before a steep decline phase.
The shortness of this stationary phase is probably due to the poverty of the
complete basal medium. However, with Med Al, no stationary phase was
obselVed but excellent growth occurred followed by a sharp fall. This
phenomenon where excellent growth occurs as Mg2+ concentration is decreased
to a cut off point has also been obselVed by Young and Kempe (1984). It may
be argued here that the inevitable reduction in already low Mg2+ with time, thus
bringing the microorganism nearer crisis point may have resulted in a stimulation
in some metabolic processes, giving rise to increased antibiotic production. This
stimulation in metabolism may have been due to the low Mg2+ concentrations
which, as has been reported, enhances the permeability of the cell (Brown, 1975;
210 .

Benz and Hancock, 1981; Yoshimura and Nikaido, 1982; Nicas and Hancock,
1983), and as such, may have resulted in an increase in uptake of nutrients
(Leive, 1965). Consequently, by 36 hrs. (Fig. 3.54), the remaining Mg2+
concentration in Med A2 may have been too low to sustain the microorganism
into stationary phase, thus leading to rapid death. This may have been principally
because Mg2+ are important for ribosomal stability, are critical as co-factors and
are involved in all phosphorylating enzymes, including the enzyme that catalyses .
the conversion of the energy rich molecules, ADP to ATP, which are essential for
metabolism (Lipman, 1941; Alberty, 1968; van Demark and Batzing, 1987).
4.4 Antifungal activity studies
Although cultures grown in PDLM made from Oxoid PDA batch No. 156 21497
gave rise to very large zones of inhibition (Fig. 3.55), Med q was preferred
because it is chemically defined and therefore permited medium component study.
Furthermore, PDLM, per se, proved inconsistent: PDLM made from Oxoid PDA
lot No. 070 40305, and from Leicestershire grown King Edwards' potatoes, both
failed to elicit antibiotic production (Table 3.5). This inconsistency may have been
due to the fact that the production of some antibiotics is acutely sensitive to the
presence/concentration of trace elements. Thus potatoes grown in different
. localities, .. therefore different soil types, .. may accumulate different
. arrays/concentrations of trace elements and thereby affect production .. Many
examples of this erratic elicitation phenomenon exist (Foster, 1943; Chesters and
Rolinson,1951; Katz, 1958; Kurachi,1958; Weinberg and Tonnis, 1966) and can
have serious implications to do with loss of revenue in industry, where complex
media fermentations are the norm. (TriIIi, 1986).
It should be noted that when Ps. aeruginosa was grown in PDLM batch No. 156
21497, it did not, unlike strain A, give rise to zones of inhibition but it did
however, inhibit A. niger invasive growth, on PDA of the same batch,to the same
degree (Table. 3.4). Here, it could well be that the biosynthetic pathways
responsible for producing strain A's particular antifungal compound does not exist
in Ps. aeruginosa, or that being a different organism, different factors were needed
211

------------ ------ ------
to trigger prOduction, or that some antifungal production may have occurred but
the assay method used was not sensitive enough to detect it.
A preliminary heat stability test (20 mins at 100°C) on the antifungal activity of
the brOth (section 3.5.2) resulted in a 5.6% loss in activity. Like the antibacterial
stability test (section 3.2.2a), this low value again suggested that the active
principal was prObably not an enzyme, toxin or similar prOteinacious substance but
rather may be a substance of some interest and therefore worthy of pursuit.
The pigmented inoculum orbital incubator experiment, using Med q, much like its
basal medium counterpart, gave rise to greater zones of inhibition than the
'washed' inoculum situation. The probable reasons for this phenomenon, which
includes reduction of pigment and consequent enhanced uptake of O2 frOm
agitation, as already discussed above (section 4.2), would also be applicable here.
However, unlike the static incubation experiment of the basal medium where no
detectable antibiotic production occurred,' _ Med q gave both antifungal and
antibacterial zones of inhibition after 10 days and further static incubation
increased pigmentation. The probable explanation for the pigmented inoculum
basal medium experiment as already discussed above, may have been in part,
applicable here. However, in addition to this, a respiriltory prOcess, known as
dissimilatory nitrate reduction, involving -conversion of nitrate to nitrite and-·
involving electrOn and hydrogen respiratory carriers, may have ultimately led to
relatively more ATP prOduced to initiate detectable levels of antibiotic production
(Palleroni, 1986; van Demark and Batzing, 1987). (Refer Table 3.2 for nitrate
reduction biochemical test). Static incubation in Med q with 'washed' cells
however, did not give rise to zones of inhibition and this must therefore have been
solely due to the lack of pigmented in the inoculum, as already discussed.
Optimization studies based on the same rationale as previously (medium
component single del ... tion and sequential variation of essential nutrients for
antibiotic prOduction; section 4.2) but this time using Med q, gave results which
were similar to ones achieved with the basal medium study, in that, trace
quantities of Mg2+ and low nitrogen concentrations, both significantly increased
prOduction (Figs. 3.58 and 3.59;', Fig. 3.61 and 3.62).
212

The medium component single deletion (MCSD) experiments, revealed that Med
B3 enabled fairly good relative growth (O.D. 0.49 in 24 hrs) of strain A (Fig.
3.57). Like Mgl+' Fe2+ is traditionally termed a macronutrient and is normally
needed in significant quantities (10.3 - lO-4M) being a key component of heame
containing respiratory enzymes (Mandelstam et aI, 1973; van Demark and
Batzing, 1987). This growth may have therefore been due to the fact that certain
Pseudomonas of which strain A could be one, are capable of producing low
molecular weight Fe2+ chelates known as pseudobactins (siderophores). They are
secreted into the medium in times of low Fe concentrations, chelate trace
quantities of Fe present and transport the resultant complex back into the cell via
specific receptors (Wendenbaum, et aI, 1983; Moores, et aI, 1984; Palleroni,
1986; . van Demark and Batzing 1987). Furthermore, comparing the. curves of
Med Band B3 at Fig. 3.57 and MedB and B3 at Figs. 3.58 and 3.59, where
growth alone occurs in the latter (Med B3), suggests that Fe may be important in
the biosynthesis of the antifungal substance.
Omission of K+ from the medium recipe, (Med B4), also permitted growth of
strain A (Curve of Med B4 at Fig. 3.57). Since potassium is also termed a
macronutrient activating enzymes involved in the formation of peptide bonds
during protein synthesis (Mandelstam and McQuillen, 1973; van Demark and
.. Batzing, 1987) this' may indicate like' for Mgl+ omission; a receptor mediated .
active uptake mechanism for strain A. Here again, like for Mgl+ omission, the
probable stress imposed upon the organism as a consequence, may have resulted
in the production of detectable amounts of both antibiotic types. (Med B4 at
Figs. 3.58 and 3.59).
Analysis of Fig. 3.57, showing growth of strain A in Med BS and Med B6 which
was relatively r pid in the former, indicates that in the complete medium, the
organism would metabolise sucrose first (rapid) before synthesizing new enzymes
to metabolise glycerol (slow). This observation where one carbon source is first
metabolised before the other is well documented (Drew and Demain, 1977;
Martin and Demain, 1980). Also, a pattern seems to be emerging where
antibiotic production occurs at rise in the secondary log phase of biphasic curves.
This phenomenon is supported by the findings of Aharonwitz and Demain 1978
213

From the nitrogen (NaN03) variation experiment (Fig. 3.60), the 0.2% curve
appeared to have the best overall growth, rising to 0.0. 1.68 in 96 hrs and ending
at 0.0. 1.44 in 192 hrs. As the concentration was increased from here, from flask
to flask, overall growth was slightly reduced and this may have been due to
substrate inhibition. As the concentration was decreased, there was a tendency
towards biphasicity with its best expression at 0.05%. In the flask where NaN03
had been omitted from the medium recipe (0.0%), the 0.0. gradually rose to
0.147 in 96 hrs, reducing thereafter to 0.0. 0.08 in 144 hrs. (NB initial OD was
0.9). This small rise in 0.0. may have been due to trace nitrogenous compounds
. from impurities in the SLR constituted medium causing some growth.
All the above may be explained by postulating that initially, as the first carbon
source was being metabolised, this may have resulted in an increase in
intracellular concentrations of ATP, (Fig. 4.1). After giving up its energy to the
cell, ATP eventually turns to cAMP and therefore, a stage would arrive when with
a depleting first carbon source, the cAMP level would have risen to quite high
levels. However, this stage may not have been solely brought about by a depleting
first carbon source (c.f. Fig. 3.57. Med B6 curve, where 0.0. rose to 0.838 in 12
hrs): end-product inhibition may also have played a part here, sending the curve
into a mid-Iag phase at 0.0. 0.2. Here, stages 3 and 4 of Fig. 4.1 might have then
been followed With particular reference to second carbon source metabolism. The
period of time accounting for the mid-Iag phase may represent the time taken for
the initiation and synthesis of enzymes necessary for the new metabolic pathway
(Fig. 3.65).
The fact that the lower nitrate concentration of 0.05% gave rise to optimal
antibacterial and antifungal production strongly suggests that after the two step
nitrate reduction to ammonia during assimilatory nitrate reduction (Hartingsvelt
et aI, 1971; Sias et aI, 1980) there occurs a predominance of the GS-GOGAT
enzyme system over the GDH enzyme system. As already mentioned, the 0.2%
nitrate concentration was optimal for growth and thus, from Figs. 3.63 and 3.64,
one gets very clear evidence in support of nutritional stress encouraging antibiotic
production. This is because on moving away from 0.2%, antifungal activity
become more evident outside the range, 0.1 - 0.3% and this was also true for
214

antibacterial activity but to a lesser degree, outside the range, 0.15 - 0.25%.
Clearly this property of low nitrate concentration, stimulating the antibiotic
production of the microorganism, would, under appropriate conditions in the wild,
be of significant survival advantage.
FoIloWing the gradual trend in loss of biphasity from the 3% to 2% to 1% flasks
. in the sucrose concentration variation experiments, it is possible that at the latter
concentration, an early, smaIl and unfeatured biphasic depression may have
triggered, as previously described, antifungal production which was eventuaIly
detected at the start of stationary phase (Figs. 3.66 and 3.68). It is also possible
that as the organism entered stationary phase, production was triggered by stress,
having gone through stages 1-3 of Fig. 4.1. Such a confluence of log and mid-
. stationary phase has already been reported in 2 carbon source antibiotic
production studies (Pirt et aI, 1967; Lurie, et aI, 1975; Froyshov, 1978).
From the 0.5% and 0.0% sucrose (NB glycerol also present at 5%) media curves
(Fig. 3.66 - 3.68) it can be said that in general, during biphasic growth, antifungal
production seems to occur before antibacterial production. However, during
conventional growth, the reverse is true. These observations contradict the
popularily held view that there is always a strict sequence governing the
production of differeIlt antibiotics by an organism and clearly, this sequence would
not work simply· via set differences in binding affinities of different antibiotic
activator proteins for cAMP (AJper and Ames, 1978; Aharonowitz, 1980).
During the glycerol variation experiment (under orbital incubation conditions)
antibacterial activity was not detected in media containing concentrations of
glycerol below 4% (Fig. 3.71 and 3.73). However, for antifungal activity, there was
no detection of zones below 2%. As the concentration of glycerol was
progressively increased from 0%, stress caused by substrate inhibition, end-product
inhibition and catabolite repression, with increasing time, may have promoted
progressively earlier glycerol metabolism 'switch over' (stage 1-3 of Fig. 4.1) which,
as previously discussed, always seemed to concur with initiation of antibiotic
production. As a result, this may have given rise to the step by step appearance
of first, antifungal activity and then antibacterial activity. (Figs. 3.73 & 3.74).
215

The pH variation gave optimum growth and antibiotic production at the initial
medium pH of 8. As Med q was being sequentially optimized from the NaN03
variation experiment, a clear biphasic trend produced by strain A in successive"
'carry forward' media was seen and this is again evident, albeit not so pronounced,
in the medium of initial pH 8 (Figs. 3.65, 3.69 and 3.75). Another biphasic trerid
is also clearly evident when varying the pH from 6 - 8 (Fig. 3.76). This latter,
apparent biphasicity (120 - 192 hrs) may have signified a 'switch over' to glycerol
metabolism with its customary 'switch on' of antibiotic production and this is
supported by the late occurrence of a zone of inhibition of 25.4 mm at 192 hrs.
(Fig. 3.80). The pH profile here (initially pH8) dropped sharply to levels below
5 before rising and levelling above 5, with time. This drop in pH was a clear
indication of rapid sucrose (first carbon source) metabolism, resulting in excess
acid production (MacFaddin, 1983) which may have consequently caused the weak
buffer to collapse. The rapid growth may have been due to an initially adverse
pH environment, resulting in an influx into the cells, of just enough undissociated
bases to stimulate general metabolism (van Oemark and Batzing 1987). This is
in stark contrast to the basal medium situation which gave excellent growth at pH
6 (0.0. of 2.0 at 24 hrs) but poor overall growth at pH 8 (Fig. 3.27). Here, it is
possible that differences in media co~position may have been solely responsible
for bringing about this disparity in growth and antibiotic production. Further
" increases in the initial pH in the different flasks resulted in a suppression in both
growth and antibiotic production and this must have been due to the toxic effects
of increased levels of undissociated bases entering the cells.
Unlike the basal medium r.p.m. variation experiment, static incubation in this
"medium gave fairly good growth (0.0 0.603 in 72 hrs, Fig. 3.81) with detectable
antifungal production (17.8 mm in 168 hrs, Fig. 3.82». This may have been due
to additional ATP production from dissimilatory nitrate reduction of the NaN03
present in the medium and probably to undissociated bases entering the cell,
causing stimulation of general metabolism. The former postulation is supported
by the fact that the biochemical test study (Table 3.7), indicates the organism to
be capable of reducing nitrate to nitrite, giving rise to free N2 with extra ATP
obtained via dissilimatory respiration (MacFaddin, 1983; Palleroni, 1986; van
Oemark and Batzing, 1987).
216

Like Fig. 3.63 and Fig. 3.64 for nitrogen variation, Fig. 3.83 for aeration/agitation
may also support stress factor triggering of antibiotic production with 90 r.p.m.
being least stressful. Here, with relatively more oxygenation than the 60 r. p.m.
situation, the dynamic equilibrium of NAD+ (feed back inhibition) to ATP
formation/use would have tipped the scale in favour of the latter, thus initiating
a late mid-stationary phase, (Fig. 3.81; Fig.'4.1). As a result, more cAMP may
have been available to initiate a 'switch over' to glycerol metabolism and then
trigger the creation of antibiotic biosynthetic pathways. The 120 r.p.m. situation
(Fig. 82) showed better antibiotic production and to explain this, it is possible that
. at the lag phase, a higher stress may have triggered more production of antifungal
biosynthetic enzymes and this may have given rise to a higher rate of pre-second
log phase antifungal production. During this production, more A TP would have
been used, leading to more cAMP available to mop up any excess NAD+. This
would have prevented NAD+ feedback inhibition and thereby maintain, virtually
. unhindered, growth. NAD+ feedback inhibition of growth may however have
occurred later, between 168 and 192 hrs (Fig. 3.82), triggering a 'switch over' to
glycerol metabolism and thus initiating events which would have ultimately led to
a significant increase in antifungal production.
A similar postulation may be attributed to growth at 150 and 180 r.p.m. but here,
. unlike 120 r.p.m., no sign of biphasicity was obseIVed and this was supported by·
the absence of a steep rise in antifungal activity between 168 to 192 hrs (Fig.
3.82). Consequently, it is possible that stage 3 of Fig. 4.1 may not have been
activated. It is interesting to note that at 180 r.p.m., antifungal activity was only
first detected at 72 hrs. This may have been due to a prolonged but unfeatured
primary lag phase, probably caused by NAD+ feedback inhibition (stress) which
may have staggered pre-second log phase antifungal production. The 210 r.p.m.
CUIVe shows a 24 hrs lag phase before good growth 0.997 in 72 hrs (Fig. 3.81).
This may have been due to stress caused by excess aeration/agitation, leading to
strong or prolonged NAD+ feedback inhibition. The excess NAD+ would have
been eventually moped up by the cAMP, resulting in a high E.C. situation and
subsequently, rapid growth would have ensued. However, because of the high
oxygenation, producing high NAD+ levels, any available cAMP from the resulting
217

growth metabolism would have been phosphorylated by NAD+ thus preventing the
ceIls metabolism entering stage 3 of Fig. 4.1 to initiate antibiotic production.
Although temperature variation gave optimum growth of strain A in medium 6 at
32°C., overaIl, antibiotic production was best at 37°C. (Figs. 3.85 &3.86). This
may have been due to stress, on account of the non-optimum growth conditions.
The 42°C O.D;curve rose to 0.733 in 24 hrs. then feIl steeply to 0.281 in 72 hrs,
before levelling out to 216 hrs (Fig. 3.85). This faIl would have been principaIly
due to the high temperature, which may have caused induction of autolytic
enzymes within the ceIl, although stress caused by nutrient limitation, end-product
inhibition and the high agitation may also have played a part. After 72 hrs at
42°C, a peculiar malodour was emitted from the flask and this may weIl have
resulted from ceIl lysis. It is interesting to note that the organism was able to
. grow fairly weIl at this temperature in the modified Cruickshank's medium (Fig.
3.34). CeIl aggregation was seen at 22°C and 27°C, from 72 hrs onwards and as
previously discussed (pagel'~, this may have been due to nutritional and or low
temperature stress. It is also interesting to note that in contrast to the modified
Cruickshank's medium, no ceIl aggregation occurred at 32°C and this may have
been due to differences in media composition.
Again, all the optimization studies above seem to lend particular weight to the
group of workers, who support the contentionthilt stress factors~a.re important
initiators of antibiotic production. (Bruehl, et al, 1969; Katz and Demain, 1977;
Martin and Demain, 1980; Nisbet and Porter, 1989).
The final optimal medium and conditions for antifungal activity were as foIlows: . . NaN03, 0.5 gm/L; KCl, 0.5 gm/L; NaHzPO •. 2HzO 0.5 gm/L; FeSO., 0.01 gm/L; .
sucrose, 30 gm/L; glycerol 20 mIlL; pH 8; 120 r.p.m. (orbital incubator); 37°C;
216 hrs.
A percentage increase of 109 in antifungal activity was achieved during the orbital
incubator optimization (Table 3.18). Increase in antibiotic production here, was
measured by percentage increase in zone of inhibition instead of the factorial
computation used in the basal medium fermentation (Table 3.6). This was done
because it was impossible to obtain an antibiotic concentration value via log dose-
218
response curve: .it was later found out that more than one antifungal compound .. .
was present (Fig. 3.92). Like the basal medium fermentation, variation of r.p.m.
(aeration/agitation) here, gave the greatest single increase in zone size.
Stochastic errors inherent in the whole orbital incubator optimization procedure,
gave an O.D. C.V. of 33%, a pH C.V. of 7.3%, an antibacterial zone of inhibition
C.V. of 11:2% and an antifungal zone of inhibition C.V. of 12.4%.· The high C.V.
value of the O.Ds., indicating inconsistent growth, may have been due to the fact
that the prototype medium was based on C~e.k Dox I..iquid Medium which was
primarily designed for good fungal growth (Smith and Onions, 1983) and not for
good bacterial growth. From this prototype, the medium was developed with a
view to increasing antifungal activity, however good consistent growth also
eventually resulted. Stochastic errors for the final optimized medium gave an
O.D. C.V. of 6.9%, a pH C.V. of 2.8% and an antifungal zone of inhibition C.V.
of 4%, grown at pH 8 and at 120 r.p.m.
A simple scale-up procedure, from the orbital incubator to the laboratory scale
fermentor, resulted in the optimum conditions of 100 tr/min (Rushton impeller),
4Umin (aeration), at 37°C in 144 hrs. (Table 3:19 a and b). Again, the
differences between the 6-litre fermentor conditions and the 250 ml conical
flask/orbital incubator condition, highlighted the problems associate~with scale-up
and how sensitive antibiotic production can be when subjected to changing
physical parameters.
-Downstream processing, based on the same rationale used previously, (section
4.2), gave acetone/chloroform· (1/9) for broth extraction and ethanol,
acetone/chloroform (1/9) and acetone/chloroform (1/9) again for TLC extraction
(Fig. 3.89 - 3.92, Table 3.20). This resulted in one yellow crystalline antibacterial
substance, AB1 and 3, light yellow, amorphous antifungal substances, AF1, AF2,
and AF3, whose purity were subsequently confirmed by G:C. (Rt 12.8 mins, 16.3
mins and 21.8 mins respectively).
The yields of the antifungal antibiotics, obtained from the lab-scale fermentor
after brothtrLC extractions, were 50 mg/lOL for AF1, 19 mg/10L for AF2 and 19
219

mg/l0L for AF3. AFl's final yield compares favourably with yields obtained from
some wild-type bacteria lab-scale fermentations. (Takeda, 1958; White, et ai,
1986). Antibiotic AF2 and AF3 yields were however poor and this was probably
due to the medium optimization path inadvertently taken which was selectively
optimal for AFl. The extraction procedure may also have adversely affected final
yields. Much higher antibiotic concentrations must have been obtained in the
orbital incubator optimization flasks as shown by the disparity between maximum
zones of inhibition, arising from the 2 fermentation systems: 35.5 mm (orbital
incubator) and 20.5 mi'n (lab-scale fermentor).
AFl was tested for MIC against a range of microorganisms (Table 3.21) and this
generally revealed fairly strong antifungal activity but also revealed some potent
activity against the Gram positive bacterium, s.. aureus, 'a peculiar characteristic
shared with the imidazole drugs (Edwards, 1980). The antibiotic was clearly most
potent against T. mentagrophytes, the causative organism for athletes foot (Fig.
3.93). Further incubation of the agar diffusion MIC assay plates (5 days), reduced
the initial zone of inhibition sizes and this suggests that the antibiotic may well be
unstable and or fungistatic (Fig. 3.93 - 96). Though the solvent extraction had
revealed possible polar characteristics of the antibiotic (on account of its
dissolution in the more polar solvents), it was not easily miscible with water which,
in relation to other solvents, is highly polar.- This immiscibility with water is
characteristic of many antifungal compounds and can make their MIC
determinations particularly difficult especially with the tube dilution technique
(Conner, 1986).
The original zones of all the 3 antifungal antibiotics, against Co albicans, after 24
hrs, were 21.3 mm, 24.6 mm and 23.3 mm for AFl, AF2 and AF3 respectively.
However, after 4 days incubation, at 30°C, only AF2's zone more or less
maintained its size with a clear cut circumference, whilst the other 2 zones had
virtually been overgrown. (Fig. 3.97). This strongly suggests that AF2 may be
fungicidal, and AFl and AF2, fungistatic.
Preliminary structural analysis, including IR/UV spectroscopy and low resolution
mass spectrometry (elm = 193), suggests that the antibacterial substance, ABl,
220

was xanthothricin (toxoflavin). Preliminary structural analysis of the 3 antifungal
compounds, including IRJUV spectroscopy and !H-NMR (AF1 only), were done.
The uv/vis spectra of the 3 antifungal compounds, dissolved in UV ethanol and
shown at Figs 3.98 ~ 100, suggests some conjugation in their structures and it is
known that compounds having one or only a few bands below about 300 nm
probably contain only 2 or3 conjugated units (Dudley and Fleming, 1987). This
seems to apply to antibiotic AF1 and AF3. It is also known that a spectrum with
many peaks stretching into the visible region i.e. from 200 to 400 nm, shows the (hoJl\
presence of a long conjugatedLor polycyclic aromatic chromophore (Edwards,
1980; Dudley and Fleming, 1987) and this seems to apply to antibiotic AF2.
Furthermore, this type of spectrum (AF2) appears to be typical of polyene
antibiotics which may either be of the linearly conjugated acyclic type or macrolide
type (Dinya and Sztaricskai, 1986). It also appears to have some polyene
antifungal characteristics, namely, it is light yellow, amorphous, fungicidal,
sparingly soluble to insoluble in H20 and has a polar/apolar quality (Edwards,
1980).
An I.R. spectrum of AF1, shown at Fig. 3.101, with bands at 752.6 cm-! and 698.5
cm-I, suggests that the structure may contain a mono-substituted ring system.
Further evidence of this is given by bands between 2000 - 1600 cm-! which
although weak, are typical of mono-substituted ring systems. The bands at 3540
cm-! to 3428 cm-! suggest OH groups. The band at 1457.2 cm-! may indicate CH2
or CH) groups and the bands at 2924 cm-! and 2852 cm-! suggest the presence of
saturated aliphatic C-H groups. The band at 752:6 cm-! may be due to a chain of
CH2 units. It is to be noted that there is no absorption in the CH) umbrella
region (1400 - 1350 cm-I) and this'suggests absence of CH) terminal groups
(Steele, 1971; Dudley and Fleming, 1987) Fig. 3.102 shows the NMR spectrum
of AFl. The chemical shifts at 7.4c5(d) and 7.2 c5(d) indicate aromaticity (Ar - H).
Since the doublets do not 'lean' towards each other it may not be correct to
assume that the ring is disubstituted. From the I.R., it appears mono-substituted.
The chemical shifts between 3.8 • 4.3 c5(q) may be Ar-CH2-O-, 0-CH2-O-, Ar-OH,
C-OH; at 1.9 c5(d) may be R-CH2-Ar; at 1.25 c5(m) may be R~CH2-CO, -CH2; at 0.6
c5(d) may be C-OH, C-NH. The integration curves gave a proton ratio of 2:1:1:2
and from this if one is to proceed with mono-substitution, a more realistic proton
221

distribution may be 5:2:2:5. ((Dudley and F1eming, 1987; Sorrell, 1988). From
all the above it is possible that AFl may contain a mono-substituted benzene with
CHi chain and terminal hydroxyl groups. It is to be stressed however that these
findings are tentative and that further work need to be done before· a more ,
comprehensive idea of the structure is known.
The I.R. spectrum of AF2, shown at Fig. 3.103, suggests that the compound may
be non-aromatic, with no clear bands between 1600 - 1500 cm-I; may posses 1,2-
diketones, S trans open chains, 1732 cm-I; may possess CH .. groups,1454 cm-I and
. terminal CH3 groups,1376 cm-I; may possess hydroxyl groups, 3364 cm-I and or
alcohol (C - OH) groups, 1066 cm-I (Steele, 1971; Dudley and F1eming, 1987). All
the above suggests that the antibiotic may be a polyene antifungal compound
(characteristic uvMs scan) of the linearly conjugated acyclic type but again these
postulations are tentative and further work needs to be done on structure
elucidation.
The I.R. spectrum of AF3, shown at Fig. 3.104, suggests that the compound may
possess hydroxyl groups, 3300 cm-I; may possess CH3 and CHz groups, 2920 -
2850 cm-l, supported by 1462 cm-I; but with 1880 cm-I not present, suggests no
terminal CH3 group; may be an aliphatic aldehyde, 2920 cm-I and 2852 cm-I
--- -- ·(ferriiidoublt~t), 1420 cm-I and overlap of the CH stretching bands and may
suggest carboxyl groups, 1732 cm-I. No bands at 750 - 720 cm-I suggests absence
of a chain of 3 or more CHz units (Steele, 1971; Dudley and F1eming, 1987;
Lambert, 1987). Again postulations here are tentative and further work needs to
be done on structure determination.
The present study has established that Ps. antimicrobica (strain A) is an unusual
microorganism. With its ability to· sustain growth under limited Mg2+
concentrations and now being identified with a select group of acidophilic
pseudomonads, it is of potential interest to researchers. Furthermore, with its
array of four antibiotics, Ps. antimicrobica is a microorganism of commercial
interest.
222

4.5 Conclusion/futuretrends
Morphological, biochemical/tolerance and antibiotic producing properties obtained
from the present study tend to support the contention that the two strains A and
B are members of a new species of Pseudomonas. Both strains seem to be slow
growers in basal medium (mgt of 170 ± 6 mins for strain A and mgt of 150 ± 5
mins for strain B) but growth can be stimulated with the addition of phenylalanine
and histidine for strain A and methionine, ornithine, arginine and lysine for strain A ~J
B (mgt reduction of 77 ± 6 mins for strainlmgt reduction of 53 ± 5 mins for
strain B). Acidophibtests for strain A has revealed for the first time that it should
now become the fifth member of a select group of Pseudomonas, all of which
share an ability to grow at pH 4.0.
Four liquid media, able to elicit antibiotic production from strain A were
developed: a chemically defined medium (CDM) for antibacterial activity, a CDM
and a complex medium for antifungal activity, and a CDM for both antibacterial
and antifungal activity~
Optimization of antibacterial and antifungal activities increased yield, by a factor
of x 9 and by 109%, respectively. Nitrogen and magnesium limitation increased
yields and from these optitnization studies, there is clear evidence to support the
contention that stress factors are important initiators of antibiotic production. A
probable scheme for the regulation of antibiotic production is proposed and this
has been constructed in light of all the antibiotic studies done and from current
knowledge of the biochemistry/genetics of antibiotic regulation.
The medium component single deletion 'of MgSO. (MCSD-Mg+2) from the
medium recipe, w\Tue excellent growth" and antibiotic production occurred, was
investigated. From this, it is possible that strain A may be an efficient scavenger
of Mg2+ and may in addition, be able to subsist on low levels of Mg2+.
Three procedures for the isolation of the active substances have been developed:
two for an antibacterial substance, AB 1 and the other for the antifungal
substances, Afl, AF2 and AF3. With the· aid of a log-dose response curve, a
223 I
I

percentage efficiency of extraction of 62, from the broth to the crystals, was·
obtained for AB!.
Agar diffusion, M.I.C. assays for the compounds, indicate activity to be in the
pg/ml range for. sensitive microorganisms. Antibiotic challenge, against test
microorganisms suggest bacteriostatic activity for ABl, fungistatic activity for AFl
and AF3,and fungicidal activity for AF2.
Structure determination involving spectral analysis and X-ray diffraction indicated
ABl to be 1,6- dimethylpyrimido[S,4-ej-l,2,4-triazine-S,7 (1.H, 6H)-dione
(Xanthothricin) a toxic metabolite previously detected in foods contaminated with
&.. cocovenenans. Selective media developed for strains A and B did not support
growth of Ps. cocovenenans. Preliminary structural analysis suggests that AFl may
possess a monosubstituted ring system with CH2 chain and terminal hydroxyl
groups; that AF2 may belong to the polyene group of antifungal antibiotics and
that AF3 may be an aliphatic aldehyde with hydroxyl groups.
Further work needs to be carried out for complete structure elucidation of the 3
• antifungal compounds. A neat way to do this would be first to establish a
functional group on the antibiotic then to derivatise this group with a known
. reagent which upon combination would form a. crystalline product .. This crystal
should then be subjected to X-ray crystallography ... From the final structure
obtained here, the structure of the known reagent should be subtracted, leaving
behind the structure of the unknown.
If novelty is established, then toxicity tests (Tissue Culture MIC and LDso),
stability tests and efficacy against a whole range of microorganisms, including
. viruses and cancer cells, should be done.
The ability of strain A to grow in limited Mg2+ concentrations should be further
investigated· and this may involve continuous culture and electron-microscopic
examination of the ribosomes.
224

Strain B should also be investigated, as per strain A, to see if different antibiotics
are produced.
225

APPENDIX ,
TRACE ELEMENT COMPOSITION OF MEDIA CONSTITUENTS.
a) Medium for antibacterial substance production
Constituents Trace NH4Ci NazSO. K1H2PO. K2HPO. Glucose substances
Mg 5 ppm 50ppm 50ppm 5 ppm -Nitrogenous - 7 ppm 30ppm 10ppm -compounds
P04 . 5 ppm 10ppm - - -Pb 3 ppm 2ppm 5 ppm· 5 ppm 1 ppm
Fe 2ppm 2ppm 20ppm 5ppm 2ppm
Cu 1 ppm 2ppm 10ppm 5 ppm -Ca 10 ppm 50ppm 100 ppm 50ppm . -
b) Medium for antifungal substance/s production
Constituents Trace NaN03 KCl FeS04 NaH2P04 . Sucrose Glycerol substances
Mg 12ppm ~
150 ppm 35 ppm 10 ppm - -Nitrogenous - 10 ppm 10ppm - 20ppm -compounds
.
PO. 5 ppm - 5 ppm - - -Pb 5 ppm 2ppm 25 ppm 10ppm 1 ppm 1 ppm
Fe 3 ppm 3 ppm --- ...
5 ppm 1 ppm 2ppm
. Cu - 2ppm 10ppm - 1 ppm -Ca 12ppm 10 ppm 150 ppm 35 ppm - -Na - 500 ppm 250 ppm - - -K - - 50ppm 200 ppm· . - -
The trace element values of individual medium constituents were of AR quality and were obtained from their respective container labels.
226

EXTRACTED FROM THE PROCEEDINGS OFTHE 16.h INTERNATIONAL CONGRESS OFCHEMOTHERAPY,.JUNE 1989 ISRAEL
Production and characterisation of an antibacterial agent from a pseudomonad isol.ted from an insect vector.
E. Attafuah, W.G. Salt· and R.J. Stretton.
·couespondence
Microbiology Unit, Chemistry Department, University of Technology, Loughborough, -Leicestershire, UK. -
Antimicrobial activity has been demonstrated in cultures of a pseudomonad isolated from an insect vector. The antibacterial agent has been isolated and identified as xanthothricin (toxoflavin) and its production and isolation optimised.
Pseudomonas sp. (NCIB 9897) which produces yellow pIgments in a range of media and which was originally isolated from the gut of the insect virus vector Planococcoides njalensis has been reported to produce both antibacterial and antifungal compounds (1). The organism may warrant separate species status (2). This communication reports investigations of the production and nature of the antibacterial agent.
The organism was initially grown (370C; orbital incubator) in a defined medium, in which preliminary experiments had established growth with good yield. The medium (lOOml batches) contained (g/l): ammonium chloride, 3; magnesium chloride, 0:2; sodium sulphate, 2; glucose, 3; all in 0.2M (potassium) phosphate buffer (final pH 7.2). When necessary the medium was solidified by the addition of 2\w/v agar. Antimicrobial activity in culture supernatant fluid was assessed at various times
'by·the-plate diffusion method using a range of microorganisms to detect activity via growth inhibition zones. Medium composition was varied by single component deletion/addition to produce' a range of media, in each of which the production of an antibacterial compound was as~essed using Escherichia coli as test organism. The medium in which maximum agent yields were obtained was then used in studies ' intended to optimise pH, incubation temperature and shaking rate for best agent yields. During these procedures, batch size was increased to 41 (61 Batch Fermenter; Life Science-Laboratories, UK) and optimisation reconfirmed.
The antibacterial agent was isolated by a combination of solvent extraction and thin layer chromatography. The yellow crystalline product was subjected to analysis by IR/UV spectroscopy , Mass Spectrometry and X-ray Diffraction.
Minimum inhibitory concentrations (MICs) were determined for the pure product against a variety of organisms in routine laboratory media using the agar diffusion method.
RESULTS AND DISCUSSION
In both solid and liquid media the pseudomonad (NeIB 9897) produced diffusable,
227
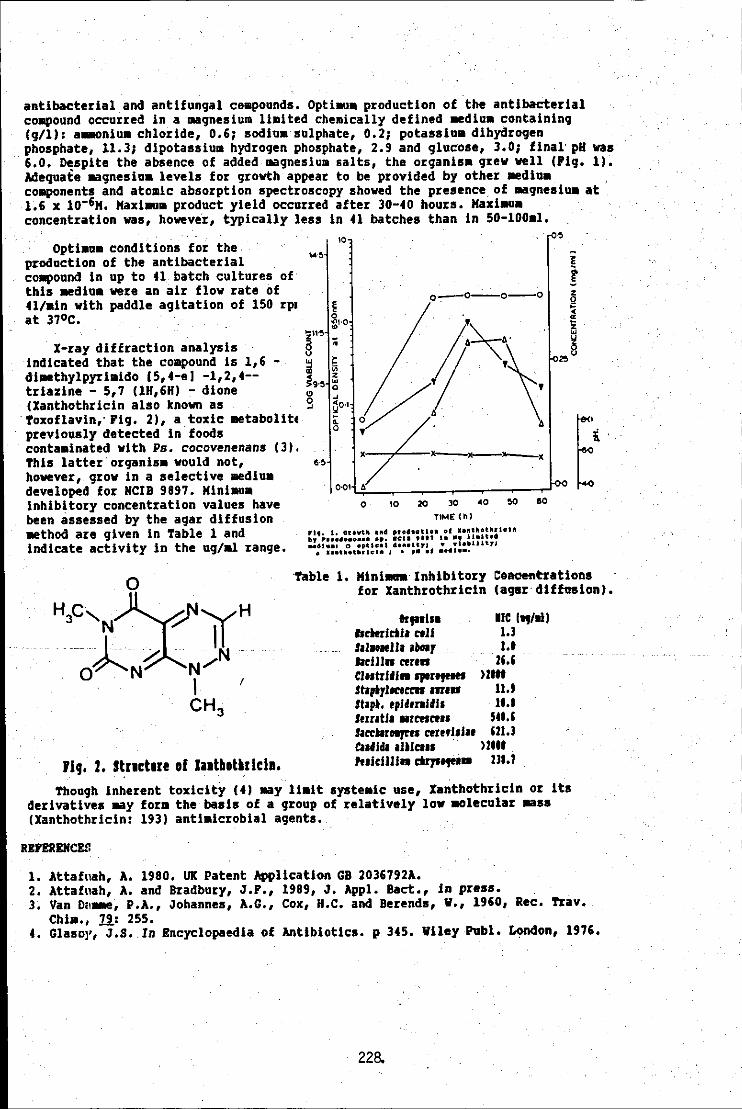
antibacterial and antifunqal ceapounds. Opti ... production of the antibacterial coapound occurred in a maqnesium limited chemically defined aediu. containinq (q/l): a..oniu. chloride, 0.6; sodiu.sulphate, 0.2; potasaiu. dibydroqen phosphate, 11.3; dipotassium hydroqen phosphate, 2.9 and qlucose, 3.0; final' pH was 6.0. Despite the absence of added maqnesiua salts, the orqanis. qrev veIl ('iq. I). Adequate maqnesiu. levels for qrovth appear to be provided by other aediu. coaponents and atomic absorption spectroscopy shoved the presence, of aaqnesiua at 1.6 x 10⁻⁶H. Haxiaum product yield occurred after 30-40 hours. Haxi .... concentration was, hovever, typically less in 41 batches than in 50-l00a! •
Opti.u. conditions for the production of the antibacterial coapound in up to 41 batch cultures of this aediu. vere an air flow rate of 41/ain with paddle aqitation of 150 rpl at 37oC.
X-ray diffraction analysis indicated that the compound is 1,6 -dlaethylpyriaido 15,4-e) -1,2,4-triazine - 5,7 (lH,6H) - dione (Xanthothricin also known as
'Toxoflavin,' 'Iq. 2), a toxic aetabolite previously detected in foods conta.inated with Ps. cocovenenans (3). This latter'orqanis. would not, however, qrow in a selective _diu. developed for HCIB 9897. Hini .... inhibitory concentration values have been assessed by the aqar diffusion _thod are qiven in Table 1 and indicate activity in the uq/.l ranqe.
• 0 ....
e'.
Table 1.
rig. 2. strlctlre of lalthot.rlcla.
0_0--0--0
o 10 20 30 .0 !>Cl eo TIME (1'1)
Hiniaua'lnhibitory CoJlQefttrations for Xanthrothricin (aqar'diffusion).
Gr ... ba lie 1"/aI) fldtrlol, CllI i.) '110011, .Il0l, 1.1 IIdlln nr ... 25.' CI •• trl.l .. rptr.,..,. >2'" ,t,,.,I.r.cror 1If." 11.t It.p' •• ,I'mldls 1 •• ' '.rr.tl, IIretln.' 511.5 ' ..... rOlfttl Clr.,I.I •• m.) C1 •• lds .I.ICI •• )211' , .. Idlll .. orp.,m. m.l
Thouqh inherent toxicity (4) may 1i.it syste.ic use, Xanthothricin or its derivatives may form the basis of a qroup of relatively low .olecular 88SS
(Xanthothricin: 193) anti.icrobial aqents.,
RD'ERENC!!l
1. Attafl1ah, A. 1980. UK Patent Appllcation GB 2036792A. 2. Attafl1ah, A. and Bradbury, J.'., 1989, J. !pp!. Bact., in press. 3. Van D,,_, P.A., Johannes, A.G., Cox, H.C. and Berends, W., 1960, Rec. Trav.
Chi •• , 11: 255. 4. Glaso)" J.B. ,In Encyclopaedia of Antibiotics. P 345. WlleyP1Jbl. London, 1976.
228.
I
I
I
I
BIBLIOGRAPHY
ABRAHAM, E. P., CHAIN, E., FLETCHER, C. M., GARDNER, A. D., HEATLEY, N. G., JENNINGS, M. A & FLOREY, H. W. (1941). Further observations on penicillin. Lancet,~: 177-188.
ABRAHAM, E. P., & NEWTON, G. G. (1954). Synthesis of D-amino-5-carboxyvalerylgIycine (A degradation product of cephalosporin N) and of DL-5-amino-5-carboxyvaleramide. Biochemical Journal, 58: 266-268. .
ABRAHAM, E. P., NEWTON, G. G., CRAWFORD, K., BURTON, H. S.& HALE, C. W. (1953). Cephalosporin N:· a New type of penicillin. Nature (London), 171: 343.
ABRAHAM, E. P., NEWTON, G. G.& HALE, C. W. (1954). Purification and some Properties of cephalosporin N, a new penicillin. Biochemical Journal, . 58: 94-102.
AHARONOWITZ, Y. (1979) .. Regulatory interrelationships of nitrogen metabolism and cephalosporin biosynthesis~ In: Genetics of Industrial Microorganisms, eds, O. Sebek and A. I. Laskin, pp. 210-17. American Society for Microbiology, Washington D.C.
AHARONOWITZ, Y. (1980). Nitrogen metabolite regulation of antibiotic biosynthesis. 34: 209-223.
.. Annual Reviews in Microbiology,
AHARONOWITZ, Y. & DEMAIN, A. L (1977). Influence of inorganic phosphate and organic buffers on· cephalosporin production by Streptomyces c1avuligerus. Archives of Microbiology, 115: 169-173.
AHARONOWITZ, Y. & DEMAIN, A. L (1978). Carbon catabolite regulation of cephalosporin production in Streptomyces c1avuligerus. Antimicrobial Agents Chematherapy, 14: 159-164.
229

AKABORI, H. & NAKAMURA, M. (1959). 1,6-Dihydroxyphenazine, an antibiotic produced by Streptomyces thiolutens. Journal of Antibiotics (Tokyo), Ser. A, 12: 17.
ALBARALLER, J. P. (1985). European Patent 146-815.
ALBERTY, R. A (1968) . . Effect of pH and metal ion concentration on the equilibrium hydrolysis of adenosine triphosphate to adenosine diphosphate. Journal of Biological Chemistry, 243: 1337-1343.
ALDER, J. (1969). Chemoreceptors in bacteria. Science, 166: 1588-1597.
ALEKSANDROV, G. G. & ESIPOV, S. E. (1986). X-ray analysis of xanthothricin and fervenulin, Pyrimido-[5,4-E] 1,2,4-triazine antibiotics. Antibiotiki Medical Biotekhnol, 31: 181-184.
ALLEN, J. G., ATHERTON, F. R., HALL, M. J, HASSALL, C. H., HOLMES, S. W., LAMBERT, R. W., NISBET, L. J. & RINGROSE, P. S. (1978). Phosphonopeptides; a new class of synthetic antibacterial agents. Nature (London), 272: 56-58 ..
ALPER, M. D., AMES, B. N. (1978). Transport of antibiotics and metabolite analogs by systems under cyclic AMP control: positive selection of Salmonella whimurium m and £rP mutants.' Journal of Bacteriology, 133: 149-157.
ARlMA, K., IMANAKA, H., KOUSAKA, M., FUKUTA, A.& TAMURA, G. (1964). Pyrrolnitrin, a new antibiotic substance, produced by Pseudomonas. Agricultural Biological . Chemistry, 28: 575-576.
ASZALOS, A & ISSAQ, H. (1980). Thin-layer Chromatographic systems for classification and identification of antibiotics. Journal of liquid Chromatography~: 867-883.
230

ATKlNSON, D. E. (1969). Regulation of enzyme function. Annual Reviews in Microbiology, 23: 47-68.
ATIAFUAH, A (1965). . Microbial control in the laboratory of a fungus pathogenic to cocoa. Ghana Journal of Science 2,: 92-93.
ATIAFUAH, A & BRADBURY, J. F. (1989). Pseudomonas antimicrobica, a new species strongly antagonistic to plant pathogens;· Journal of Applied Bacteriology, 67: 567-573.
BEHAL, V., CUDLIN, J. & V ANEK, Z. (1969). Regulation of biosynthesis of secondary metabolites: Ill. Incorporation of 1-14C-acetic acid into fatty acids and chlortetracycline in Streptomyces aureofaciens. Folia Microbiology, 14: 117-119.
BENNETI,J. V. (1974). Hospital acquired infections and the altered host. Nosocomial infection due to
. Pseudomonas. Journal of Infectious Disease, 130 (Suppl.): 54-57.
--- BENZ, R. & HANCOCK, R. E. W. (1981). Properties of the large ion-permeable pores formed from protein F. of Pseudomonas aeruginosa in lipid bilayer membranes. Biochemica Biophysica Acta, 646:. 298-308.
BERDY, J. (1974). Recent developments of antibiotic research and classification of antibiotics according to chemical structures. Advances in Applied Microbiology, 18: 309~406.
BERDY, J. (1988). The discovery. of new bioactive microbial metabolites: screening and identification. Communicated at the 2nd International Symposium on New Bioactive Metabolites from Microorganisms. Gera, G.D.R .
. BERRY, B. (1955). \ . .. Classification of aryl and alkyl halides. Proceedings of the Louisiana Academy of Science, 18: 92-94.
231
I

BODEY, G. P., BOLIVAR, R, FAINSTEIN, V. & JADEJA, L (1983). Infections caused by Pseudomonas aeruginosa. Review of Infectious Disease, ,2: 279-313.
BOUCHARD (1889). Cited by F. G. Holliman (1961). In: Some Bacterial Pigments (Phenazines). The South African Industrial Chemist, 15: 233-238.
BRADBURY, J. F. (1984). Genus 11. Xanthamonas In: Bergey's Manual of Systematic Bacteriology, Vol. 1, pp 199-204; eds. N. R Krieg & J. G. Holt. Williams and Wilkins, Baltimore, London.
BRITISH NATIONAL FORMULARY (1991). BNF No. 21, British Medical Association and the Royal Pharmaceutical Society of Great Britain. The Pharmaceutical Press.
BRITISH PHARMACOPOEIA (1980). Infra-red Reference Spectra, H. M.'s Stationery Office. University Press, Cambridge.
BROTZU, G. (1948). Cited by L. J. ~isbet and N. Porter (1989). In: Microbial products: New Approaches, eds. S. Baumberg, I. Hunter and M. Rhodes. Fortyfourth Symposium of the Society for General Microbiology, University of Cambridge, pp. 309-342. Cambridge University Press,
.. Cambridge, New York, Sydney.
BROWN, D., FOSTER, J., HITCHCOCK, M. J., OCHI, K, TROOST, T. & KATZ, E .. (1983). Regulation of tryptophan metabolism and its relationship to Actinomycin D synthesis. In: Proceedings of the Fourth International Symposium on the Genetics of Industrial Microorganisms, eds. Y. Ikeda & T. Beppu, pp 85-91, Kodansha Ltd;, Tokyo.
BROWN, D. E. & ZAINUDEEN, M. A (1978). Effect of inoculum size on the aeration pattern of batch cultures of a fungal microorganism. Biotechnology Bioengineering, 20: 1045-1061.
BROWN, M. R. W. (1975). ·The role of the cell envelope in resistance. In: Resistance of Pseudomonas aeruginosa, pp. 71-107, ed. M. R W. Brown. John Wiley and Sons, London, New York, Sydney.
232

BRUEHL; G. W., MILLAR, R. L. & CUNFER, B. (1969). Significance of antibiotic production by Cephalosporium gramineum to its saprophytic ' survival. Canadian Journal of Plant Science, 49: 235-246.
BU'LOCK, J. D. (1961). Intermediary metabolism and antibiotic synthesis. Advances in Applied Microbiology, J: 293-342.
BU'LOCK, J. D. (1967). , .' Essays in biosynthesis and microbial development, "Squibb Lectures". John WiIey and Sons,
New York.
BU'LOCK, J. D. (1974). Secondary metabolism of microorganisms. In: Industrial Aspects of Microorganism, vol. 1, ed. B. Spencer, pp. 335-345. Elsevier, Amsterdam.
BURTON, H. S. & ABRAHAM, E. P. (1951). Isolation of antibiotics from a species of cephalsoporium: Cephalosporin PuP:z, P 3, P 4 and Ps. Biochemical Journal, 50: 168-174.
BURTON, H. S., ABRAHAM, E. P. & CARDWELL, H. M. E. (1956). Cephalosporin PI and Helvalic Acid. Biochemical Journal, 62: 171-176.
BUSHELL, M. E. (1989). The process physiology of secondary metabolite production. In: Microbial Products: New Approaches, pp. 95-120. Cambridge University Press. Cambridge, New York, Melbourne.
BYCROFT, B. W. (ed) (1988). Dictionary of antibiotics and related substances. Chapman & Hall. London, New York.
CALAM, C. T. (1986). Shake-flask fermentations. In: Manual of Industrial Microbiology and Biotechnology, pp. 59-65, eds. A. L. Demain & N. A. Solomon. American Society for Microbiology, Washington D. C.
CALLEJA, G. B. (1984). Microbial Aggregation. Chemical Rubber Company Press Inc., Florida, USA.
233

CALLEJA, G. B. & JOHNSON, B: F. (1979). The effects of nutritional factors on microbial aggregation, NRCC Contribution No. 16394, Canada Institute for Scientific and Technical Information (CISTI), Ottawa.
CALTON, G. J., COBBS, C. S. & HAMMAN, J. P. (1986). Product recovery. In: Manual of Industrial Microbiology and Biotechnology, pp. 436-445, eds. A. L. Demain & N. A. Solomon. American Society for Microbiology, Washington D.e.
CAVILL,G.W. K, RALPH, B. J. TETAZ, J. R. & WERNER, R. W. (1953). The chemistry of mould metabolites, Part I. Isolation arid characterization of a red pigment from Coriolus sanguineus. Journal of the Chemical Society, 106: 525-529.
CHAIN, E., FLOREY, H. W., GARDNER, A. D., HEATLEY, N. G., JENNINGS, M. A., ORR-EWING, J. & SANDERS, G. A. (1940). Penicillin as a chemotherapeutic agent. Lancet, ~: 226~228.
CHAN, J. A. & ASZALOS, A. (1986). Thin-layer chromatographic techniques and systems. In: Modem Analysis of Antibiotics, pp. 197-238. ed. A. Aszalos. Marcel Dekker, Inc., New York.
CRATER, K F. & BRUTON, C. J. (1983). Mutational cloning in Streptomyces and the isolation of antibiotic production genes. Gene,
------ 26: 67-78.-
CHERONIS, N. D., ENTRIKIN, J. B. & HODNETT, E. M. (1968). Semimicro Qualitative Organic Analysis: The Systematic Identification of. Organic Compounds. 3rd edition, Interscience Publishers, New York, London, Sydney ..
CHESTERS, C. G. C. & ROLINSON, G. N. (1951). Trace elements and Streptomycin production. Journal of General Microbiology, ~: 559-565.
CLARKE, H. T., JOHNSON, J. R. & ROBINSON, R. (1949). The Chemistry of Penicillin Princeton University Press, Princeton, N. J.
COLOMBO, A. L, CRESPI-PERELLINO, N. & MICALIZIO,S. (1982). Relationship between growth, cyclic AMP and tylosin production in two mutants of Streptomyces fradiae. Biotechnology Letters, 1: 747-752.
234

CONNOR, D. T. (1986). Antifungal agents. In: CRC Handbook of Chemotherapeutic Agents, vol. I, pp. 219-259, edin-chief, M. Verderame. Chemical Rubber Company Press, Inc., Florida.
COOPER, C. M., FERNSTROM, G. A, & MILLER, S. A (1944). Performance of agitated gas-liquid contactors. Industrial Engineering Chemistry, 36:504-509.
COWAN, S. T. & STEEL, I(. J. (1974). Cowan and Steel's Manual for the identification of medical bacteria, 2nd edition, revised by
· S. T. Cowan. Cambridge University Press.
CRAWFORD, H., HEATLEY, N. G., BOYD, P. F., HALE, C. W., KELLY, B. 1(., SMITH, G. A, SMITH, N. (1952). Antibiotic production by a species of Cephalosporium. Journal of General Microbiology, 2: 47-59. .
CRUICKSHANK, R. (1970). Cultivation of microogranisms: use of culture media. In: Medical Microbiology, 11th edition, pp 790-811. Uvingstone, Edinburgh, London.
CURDOVA, E., KREMEN, A, VANEK, Z. & HOSTALEK, Z. (1976). Regulation and biosynthesis of secondary metabolites. Folia Microbiologica, 21: 481-487.
DAVES, G. D., ROBINS, R. I(. & CHENG, C. C. (1961). The structure of fervenulin, a new antibiotic. Journal of Organic Chemistry, 26: 5256-5257.
DAVIS, B. D., DULBECCO, R., EISEN, H. N., GINSBERG, H. S. (1980). · Microbiology, 3rd edition, pp 123. .
DEL-RIO, L. A, OLlV ARES, J., BLESA, M. C. & MAYOR, F. (1972). Antibiotics from Pseudomonas reptilivora I. Taxomonic classification and optimal conditions
· of fermentation for antibiotic production. Antimicrobial Agents and Chemotherapy, Z: 186-188.
235

DEMAIN, A. L.(1986). Control of secondary metabolism in actinomycetes. In: Biological, Biochemical and' Biomedical Aspects of Actinomycetes, eds. G. Szabo, S. Biro & M. Goodfellow, Proceedings of the Sixth International Symposium on Actinomycetes. Biology, Debrecan, Hungary, pp. 215-225. Academiai Kiado, Budapest.
DINYA, Z. M. & SZTARICSKAI, F. J. (1986). Ultraviolet andlLight absorption spectrometry. In: Modern Analysis of Antibiotics. pp 19-96, ed. A. Aszalos. Marcel Dekker Inc., New York.
DOULL, J. L. & VINING, L. C. (1988). Nutrient requirements for biphasic production of actinorhodin in cultures of Streptomyces coelicolor A (3) 2. In: Abstracts of the Second International Symposium on Overproduction of Microbial Products, Ceske Budejovice, Czechoslovakia. '
DREW, S. W. (1981). Liquid culture. In: Manual of Methods in General Bacteriology, pp 151-178. American Society for Microbiology, Washington. '
DREW, S. W. & DEMAIN, A. L. (1977). Effect of Primary metabolism on secondary metabolism., Annual Review of Microbiology, 31: 343-356.
DUBOS, R. J. & HOTCHKISS, R. D. (1941). The production, of bactericidal substances by aerobic sporulating bacilli. Journal of Experimental Medicine, 73: 629-640.
DUDLEY, H. W. & FLEMING, I. (1987). Spectroscopic methods in Organic Chemistry, 4th edition. McGraw-HiIl Book Company (UK) Ltd., London, New York, Tokyo.
EDWARDS, D. (1980). antimicrobial Drug Action. The MacMillan Press Ltd., London and Basingstoke.
EGAWA, Y., UMINO, K., AWATAGUCHI, S., KAWANO, Y. & OKUDA, T. (1970). Antibiotic YC 73 of Pseudomonas origin. I. Production, isolation and properties. Journal of Antibiotics (Tokyo), 23: 267-270.
236

ELEMA; B. & SANDERS, A. C. (1931). Oxidation-reduction of pyocyanin. I. The biochemical preparation of pyocyanin. Recueil des travaux chimiques des Pays-Baus, 50: 796-806.
EMMERICH, C. & LOEW, O. (1899). Cited by Holliman F. G. (1961). Some bacterial pigments (Phenazines). The South African Industrial Chemist, 15: 233-238.
FEIGL, F. (1960). Spot Tests in Organic Analysis, pp 236, Elsevier, Amsterdam.
FLOREY, H. W., CHAIN, E., HEATLEY, N. G., JENNINGS, M. A., SANDERS, A. G., ABRAHAM, E. P. & FLOREY, M. E. (1949). Antibiotics, vol. 2. Oxford University Press, London.
FORSYTH, W. G. (1955). Comirin: isolation and properties. Biochemical Journal (London), 59: 500-506.
FOSTER; J. W., WOODRUFF, H. B. & McDANIEL, L. E. (1943). Microbiological aspects of penicillin. Ill. Production of penicillin in surface cultures of Penicillium notatum. Journal of Bacteriology, 46: 421-433.
FROBISHER, M. (1959). . . ... Fundamentals of Microbiology, 6th edition. W. B. Sanders Company, Philadelphia, LOndon. .
. FROYSHOV, O. (1977). The production of bacitracin synthetase by Bacillus licheniformis ATCC 10716. FEBS Letters, 81: 315-318.
FULLER, A. T., MELLOWS, G., WOOLFORD, M., BANKS, G. T., BURROW, K. D. & . CHAIN, E. B. (1971). Pseudomonic acid: an antibiotic produced by Pseudomonas fluorescens. Nature, 234: 416.
GALLO, M. & KATZ, E. (1972). Regulation of secondary metabolite biosynthesis: catabolite repression of phenoxazinone synthetase and actinomycin formation by glucose. Journal of Bacteriology, 109: 659-67.
237

GERBER, N. N. & LECHEV ALIER. Phenazines and Phenoxazinones from Waksmania aerata m. novo and Pseudomonas iodina. Biochemistry, J: 598·602.
OIL, J. A. & HOPWOOD, D. A. (1983). Cloning and expression of a p-amino acid synthetase gene of the candicin producer Streptomyces griseus. Gene, 25: 119-32.
OILLIES, R. R. & DODDS, T. C. (1984). Gillies & Dodds Bacteriology lllustrated. 5th edition, revised by R. R. Gillies. Churchill Livingstone, London, Melbourne, New York.
GLUSKER, J. P., & TRUEBLOOD, K. N. (1972). Crystal Structure Analysis: A Primer. Oxford University Press, New York.
GOODHUE, C. T., ROSAZZA, J. P. & PERUZZOTII, G. P. (1986). Methods for transformation of organic compounds. In: Manual of Industrial Microbiology and Biotechnology, pp. 97·121, eds. A. L Demain and N. A. Solomon. American Society for Microbiology, Washington D.C.
GORMAN, M. & LIVELY, D. H. (1967) .. .. Pyrrolnitrin: a new mode of tryptophan metabolism. Antibiotics,~: 433-435.
GOTTLIEB, S. (1976). The production and role of antibiotics in soil. Journal of Antibiotic, 29: 987-1000.
GREASHAM, R. & INAMINE, E. (1986). Nutritional improvement of processes. In: Manual of Industrial Microbiology and Biotechnology, pp 41-48, eds. A. L Demain & N. A. Solomon. American Society for Microbiology, Washington D. C.
GREENWOOD, D. (1983). Antimicrobial Chemotherapy. BaiIliere TindaIl,London.
GROSSOWICZ, N., HAYAT, P., HALPERN Y. S. (1957). Pyocyanine biosynthesis by Pseudomonas aeruginosa. Journal of General Microbiology, 16: 576-583.
238

GROUPE, V., PUGH, L. H., WEISS, D. W., & KOCHI, M. (1951) . . Observations on antiviral activity of viscosin. Proceedings of the Society for Experimental Biology, 78: 354-358.
GUIRARD, B. (1970).... .. ... The amino acid requirements of microorganisms for growth. In: Handbook of Biochemistry. 2nd edition, pp. 3-19, ed. H. A Sober. The Chemical Rubber Company Press Inc., Qeveland, Ohio.
GWYNN, M. N., BOX, S. J., BROWN, A G., GILPIN, M. L (1988). MM42842, A new member of the monobactam family produced by Ps. cocovenenans I. Identification of the producing organism. Journal of Antibiotics, 41: 1-6.
HANSON, R. S. (1975). Spores VI. eds. P. Gerhardt., R. N. Costilow & H. L Sadoff, p 318. American Society for Microbiology, Washington D.C.
HARA, O. & BEPPU, T. (1982). Mutants blocked in streptomycin production in Streptomyces griseus - the role of A-factor. Journal of Antibiotics, 35: 349-58.
HARTINGSVELT, J., MARINUS, M. G. & STOUTHAMER, A H. (1971) .. . Mutants of Pseudomonas aeruginosa blocked in nitrate or nitrite dissimilation. Genetics, 67: 469-482.
HAUSER, G. & KARNOVSKY, M. L (1954). Studies on the production of glycolipide by Pseudomonas aeruginosa. Journal of Bacteriology (Baltimore), 68: 645-654.
HAYS, E. E., WELLS, I. C., KATYMAN, P. A, CAIN, C. K., JACOB, F. A, THAYER, . S. A, DOISY, E. A, GABY, W. L, ROBERTS, E. c., MUm, R. D.,· CARROL, C. J., . JONES, L R. & WADE, N. J. (1945).
Antibiotic substances produced by Pseudomonas aeruginosa. Journal of Biological. Chemistry, 159: 725-750. .
HELLINGER, E. (1951). Requirements for pyocyanine production by Pseudomonas aeruginosa (Schroeter) Migula. Journal of General Microbiology, 2,: 633-639.
239

HITCHINGS, G. H. & BURCHALL, J. J. (1965) . . Inhibition of folate biosynthesis and function as a basis for chemotherapy. Advances in
Enzymology, 26: 418-68.
HOLLlMAN, F. G. (1961). Some bacterial pigments (Phenazines). The South African Industrial Chemist, 15: 233-238.
HOOVER, J. R. E. & DUNN, G: L. (1979). The ~-lactam antibiotics. In: Burger's Medicinal Chemistry .. Part H. 4th edition, pp. 83-.172, ed. M. E. Wolff. John Wiley & Sons, New York, Chichester, Brisbane, Toronto.
HOPWOOD, D. A, MALP ARTIDA, F., KIESER, H. M., lKEDA, H., DUN CAN, J., FUJII, I., RUDD, B. A M., FLOSS, H. G. & OMURA, S. (1985). Production of hybrid antibiotics by genetic engineering. Nature, 314: 642-644.
HORINOUCHI, S. & BEPPU, T. (1987). A-factor and regulatory network that links secondary metabolism with cell differentiation in Streptomyces. In: Proceedings of the Fifth International Symposium on the Genetics of Industrial Microorganisms (GIM86), part B, pp 41-48, eds. M. A1a~evic, D. Hranueli & Z. Toman~ Pilva, Zagreb. .
HU, W-S., BRANA, A F. & DEMAlN, A L (1984). _ __ .. _. _ Carbon source regulation of cephem antibiotic production by resting cells of Streptomyces
c1avuligerus and its reversal by profein synthesis inhibitors. Enzyme· and Microbial·· Biotechnology, Q: 155-60.
HUNTER, I. S. & BAUMBERG, S. (1989) . . Molecular genetics of antibiotic formation. In:. Microbial Products: New Approaches, pp 121-162. eds. S. Baumberg, I. Hunter & M. Rhodes. 44th Symposium of the Society for General Microbiology - held at Cambridge University. Cambridge University Press, Cambridge, New York, Sydney.
HUTTER, R., LEISINGER, T., NUESCH, J. & WEHRLI, W (1978) .. Antibiotic and other secondary metabolites. . In: Biosynthesis and Production, FEMS Symposium No. 5. Academic Press, London, New York.
I.J.S.B., (1990). International Journal of Systematic Bacteriology, 1Q, No. 3.
240
IMADA, A., KITANO, K., KINTAKA, K., MUROI, M, ASAI, M. (1981). Sulfazecin and isosulfazecin, novell3-lactan antibiotics of bacterial origin. Nature, 289: 590-591.
ISHII, S., NISHI, Y. & EGAMI, F; (1965). The fine structure of a pyocin. Journal of Molecular Biology, 13:.428-431.
JACOB, F. (1954). Induced biosynthesis and mode of action of pyocin antibiotic of Pseudomonas pyocyanea. Ann. Inst. Pasteur,86: 149-160.
JAMIESON, M. C. (1942). Requisites for recognition of the blue-green Pseudomonas. Science & Agriculture, 22: 401-409.
JANGLOV A, Z., SUCHY, J. & V ANEK, Z. (1969) .. Regulation of biosynthesis of secondary metabolites. VII. Intracellular ATP concentration in Streptomyces aureofaciens. Folia Microbiologica, 14: 208-10.
JARVIS, F. G. & JOHNSON, M. J. (1949). A glycolipide produced by Pseudomonas aeruginosa. Journal of American Chemical Society,
. 71: 4124-4126. .
JOHNSON, C. K. (1965). ORTEP. Report (ORNL-3794). Oak Ridge National Laboratory, Tennessee.
KAGEYAMA, M. & EGAMI, F. (1962). On the purification and some properties of a pyocin, a bacteriocin produced by Pseudomonas aeruginosa. Life Science, No. 9. pp 471-476.
KAKO, K. J. (1987). Free radical effects on membrane protein in myocardial ischemia/reperfusion injury. Journal of Molecular Cell Cardiology, 19: 209-212.
KATZ, E. & DEMAIN, A. L (1977). The peptide antibiotics of Bacillus: chemistry, biogenesis and possible. functions. Bacteriological Review, 41: 449-474.
241

KATZ, E., PIENTA, P. & SIVAK, A (1958). The role of nutrition in the synthesis of actinomycin. Applied Microbiology, Q: 236-241.
KELLER, R. J. (1986). The Sigma Library of F.T-IR SPECfRA, edition 1, vol 1 & 2. Sigma Chemical Company Inc., Missouri.
KHOKHLOV, AS., ANISOV A, L N., TOV AROV A, I. I., KLEINER, F. M., KOVALENKO, I. V., KRASILNIKOVA, o. I., KORNITSKAYA, E. YA. & PLINER, S. A. (1973). Effect of A-factor on the growth of asporogeneous mutants of Streptomyces griseus not producing this factor. Z. Allg Mikrobiol, 13: 647-55.
KINASHI, H., SHIMAGI, M. & SAKAI, A (1987). Giant linear plasmids in Streptomyces which code for antibiotic biosynthetic genes. Nature, 328: 454-6.
KING, E. 0., WARD, M. K. & RANEY, D. E. (1954). Two simple media for the demonstration of pyocyanine and fluorescin. Journal of Laboratory and Clinical Medicine, 44: 301-307 .
. KINTAKA, K., HAIBAR, A K., ASAI, M. & IMADA, M. (1981). . . _ ... Isosulfazecin, a new p-lactam antibiotic, produced by an acidophilic pseudomonad. Fermentation, isolation and characterization. Journal of Antibiotics, 34: 1081-1089.
KINTAKA, K., KITANO, K., NOZAKI, Y., KAWASHIMA, F., IMADA, A, NAKAO, Y. & YONEDA, M. (1981). Sulfazecin. A novel p-lactam antibiotic of bacterial origin: Discovery, fermentation and biological characterization. Journal of Fermentation Technology, 59: 263-268. .
KOEHLER, L H. (1952) . . Differentiation of carbohydrates by anthrone reactin rate and colour intensity. Analytical
Chemistry, 24: 1576-1579.
KOSHLAND, D. E. Jr. (1979). A model regulatory system: bacterial chemotaxis. Physiological Review, 59: 812-62.
242

KOSHLAND, D. E. Jr. (1981). Biochemistry of sensing and adaptation in a simple bacterial system. Annual Review of Biochemistry, 50: 765-82.
KLUYVER, A. J. (1956). Pseudomonas aureofaciens novo sp. and its Pigments. Journal of Bacteriology, 72: 406. ,
KURACHI, M. (1958). Biosynthesis of pyocynine. Ill. Effect of iron and other heavy metals. Bulletin of the Institute for Chemical Research, Kyoto University, 36: 188-196.
LATUASSAN, H. E.& BERANDS, W. (1961). On the ·origin of the toxicity of toxoflavin. Biochemica Biophysica. Acta, 52: 502-508.
LEBRIHI, A., LEFEBVRE, G. &GERMAIN, P. (1988). Carbon catabolite regulation of cephamycin C and expandase biosynthesis in Streptomvces clavuligerus. Applied Microbiology and Biotechnology, 28: 44-51.
LEHNINGER, A. (1980). Biochemistry, 2nd edition. Worth Publishers Inc., New York .
. LEIVE, L (1965) .. A nonspecific increase in permeability in Escherichia coli produced by EDTA. Proceedings of the National Academy of Sciences, 53: 745-750.
LIPMANN, F. (1941). Metabolic generation and utilization of phosphate bond energy. Advances in Enzymology, 18: 99-162. .
LURIE, L. M., VERKHOTSEVA, T. P. & LEVITOV, M. M. (1975). Penicillin biosynthesis and two phase pattern of Penicillium chrysogenum development. Antibiotiki (Moscow) 20: 291-295. .
MacFADDIN, J. F. (1983). Biochemical Test for Identification of Medical Bacteria, 2nd Ed.
243

MADRY, N., SPRINKMEYER, R. & PAPE, H. (1979). Regulation of tylosin synthesis in Streptomyces. Effects of glucose analogs and inorganic phosphate. European Journal of Applied Microbiology and Biotechnology, 1: 365-370.
MALPARTIDA, F. & HOPWOOD, D. A. (1986). Physical and genetic characterization of the gene cluster for the antibiotic actinorhodin in . Streptomyces coeIicolar A3(2). Molecular and General Genetics, 205: 66-71.
MANDELSTAM, J. & McQUILLEN, K. (1973). Biochemistry of Bacterial Growth. 2nd edition, Blackwell Scientific Publications. Oxford, London, Melbourne.
MARTIN, J. F. (1976). Phosphate regulation of gene expression of candidicin biosynthesis. In: Microbiology - 1976, ed. D. Schlessinger, pp. 548-52. Amedcan Society for Microbiology, Washington DC.
MARTIN, M J. F. & DEMAIN, A. 1. (1976). Control of phosphate of candidicin production. Communications, 71: 1103-9.
MARTIN, J. F. & DEMAIN, A (1980).
. Biochemical and Biophysical Research
Control of antibiotic biosynthesis. Microbiological Reviews, 44: 230-251.
McALPINE, J. B., TUAN, J. S., BROWN, D. P., GREBNER, K. D., WHITIERN, D. N., BAKO, A. & KATZ, 1. (1987). New antibiotics from genetically engineered actinomycetes. 1. 2-norerythromycins, isolation and structural determinations. Journal of Antibiotics, 40: 1115-1122.
McCOMBIE, H. & SCARBOROUGH, H. A. (1923). The chemical constitution of bacterial pigments. Part I. The isolation of pyocynine and the preparation of its salts. Journal of the Chemical Society, 123: 3279-3285.
McGRAW-HILL (1987). Chromatography .. In: McGraw-HiII Encyclopedia of Science & Technology, Vol. 3, 6th· edition, pp 568-574, ed-in-chief, S. P. Parker. McGraw-HiII Book Company, New York .
. MILES, A. A. & MISRA, S.S. (1938). Journal of Hygiene. (Cambridge) ~ 732.
244

MILLER, M. W. (1961). Pfizer's Handbook of Microbial Metabolites, pp 501-507. McGraw-HilI, New York.
MILLER, T. L & CHURCHILL, B. W (1986). Substrates for large-scale fermentations. In: Manual of Industrial Microbiology and Biotechnology, pp. 122-136. eds. A L Demain & N. A. Solomon. American Society for Microbiology, Washington DC.
MITCHELL, P. (1966). Chemiosmotic coupling in oxidative and photosynthetic Phosphorylation. Biological Review, . Cambridge Phil. Society, 41: 445-506. .
MONAD, J. (1942). La croissance des cultures bacteriennes. Hermann. Paris.
MOORES, J. C., MAGAZIN, M., DITTA, G. S. & LEONG, J. (1984). Cloning of genes involves in the biosynthesis of pseudobactin, a high-affinity iron transport agent of a plant growth-promoting Pseudomonas strain. Journal of Bacteriology, 157: 53-58.
MUDGETT, R. E. (1980). Controlled gas environments in industrial fermentation. Enzyme Microbial Technology, d: 273-280 ..
NAUMAN, R. V., WEST, P. W., TRON, F. & GAEKE, G. C. (1960). A Spectrophotometric study of the Schiff reaction as applied to the quantitative'
. determination of sulpher dioxide. Analytical Chemistry, 32: 1307-1311.
NEWTON, G. G. & ABRAHAM, E. P. (1955). Cephalosporin C, a new antibiotic containing sulpher and D-a-aminoadipic acid. Nature (London), 175: 548. .
NEWTON, G. G. & ABRAHAM, E. P. (1956). Isolation of Cephalosporin C, a penicillin-like antibiotic containing D-a-aminoadipic acid .. BiochemIcal Journal, 62: 651-658. .
245

NICAS, T. I. & HANCOCK, R.E. W. (1983). Alteration of susceptibility· to ethylenediaminetetracetate, polymyxin B and gentamicin in Pseudomonas aeruginosa by divalent cation regulation of protein HI. Journal of General Microbiology, 129: 509-517.
NISBET, L J. & PORTER, N. (1989). The impact of Pharmacology and molecular biology on the exploitation of microbial products. In: Microbial Products: New Approaches, eds. S. Baumberg, I. Hunter & M. Rhodes. Forty-fourth Symposium of the Society for General Microbiology, University of Cambridge. pp. 309-342. Cambridge University Press. Cambridge, New York, Sydney.
NOGRADY, T. (1988). Medicinal Chemistry, a Biochemical Approach, 2nd edition. Oxford University Press. New York, Oxford.
NOLAN, R. D. & CROSS, T. (1988). Isolation and screening of actinomycetes. In: Actinomycetes in Biotechnology, pp. 1-32, eds. M. GoodfeIlow, S. T. WiIIiams & M. Mordarski. Academic Press, London.
NUGTEREN, D. H. & BERENDS, W. (1957). Investigations on bongkekic acid, the toxin from Pseudomonas cocovenenan. RecuciI des travaux chimiques des Pays-Bas, 76: 13-27.
PALLERONI, N. J. (1984). Genus I. Pseudomonas Migula, 1894. In: Bergey's Manual of Systematic Bacteriology. Vol. 1, pp 141-199, eds. N. R. Krieg & J. G. Holt. WiIIiams and Wilkins, Baltimore, London.
PALLERONI, N. J. (1986). Taxonomy of the Pseudomonads. In: The Bacteria: A Treatise on structure and function. Vol. 10: The Biology of Pseudomonas, pp 3-25, ed. J. R. Sokatch. Academic Press Inc. (London) Ltd. .
PASTAN, I. & ADHYA, S. (1976). Cyclic adenosine 5-monophosphate in Escherichia coli. Bacteriological Review, 40: 527-551.
PEPPLER, H. J. & PERLMAN, D. (1979). MicrobialTechnology Vol. 1 & 2. Academic Press, Inc. New York.
246
PIRT, S. J. & RIGHELATO, R. C. (1967). Effect of growth rate on the synthesis of penicillin by Penicillium chlYsogenum in batch and chemostat cultures. Applied Microbiology, 15: 1284-1290.
PLATT, T. B. & ISAACSON, D. (1973) . . Microbiological assays. In: Handbook of Microbiology, vol. 3. Microbial products, pp. 1017-1051, eds. A. I. Laskin and H. A. Lechevalier. The Chemical Rubber Company Press, Inc. Oeveland.
POUCHERT, C. J. (1981). The A1drich Library of Infrared Spectra, edition 3. A1drich Chemical Company Inc., Wisconsin.
PRATT, A. J. (1989). j3-lactam biosynthesis. In: Microbial Products: New Approaches, eds. S. Baumberg, I. Hunter and M. Rhodes. Forty-fourth Symposium of the Society for General Microbiology, University of Cambridge. pp 163-185. Cambridge University Press. Cambridge, New York, Sydney.
PRIMROSE, S. B. (1987). Modern Biotechnology. Blackwell Scientific Publications, Oxford, Boston, Melbourne .
.. ...• PURICHj D.·L & FROMM, H. J. (1973).. . ......... . Additional factors influencing enzyme responses to the adenylate energy charge. Journal of Biological Chemistry, 248: 461-466.
REED, G. (ed) (1981). Prescott & Dunn's Industrial Microbiology, 4th edition. Av. Publishing Co., Westport, Conn.
REVILLA, G., LOPEZ-NIETO, M. J., LEUNGO, J. M. & MARTIN, J. F. (1984). Carbon catabolite repression of penicillin biosynthesis by Penicillum chlYsogenum. Journal of Antibiotics, 37: 781-9.
RICKENBERG, H. V. (1974). Cyclic AMP in procaryotes. Annual Review of Microbiology, 28: 353-369.
247

RUHEMANN, S. (1911). Triketohydrindene hydrate. Part V. The analogues of uramil and purpuric Acid. Journal of the Chemical Society, 99: 792, 1486-1492.
SATOH, A., OGAWA, H. & SATOMURA,Y. (1976). Role and regulation mechanism of kanamycin acetyltransferase in kanamycin biosynthesis. Agricultural Biology and Chemistry, 40: 191-6.
SCHAFER, E. W. Jr. & BOWLES, W, A (1955). Acute oral toxicity and repellency of 933 chemicals to house mice and deer mice. Archives' . of Environmental Contamination Toxicology, ~: 111-129.
SCHATZ, A, BUGlE, E. & WAKSMAN, S. A (1944). Streptomycin, a substance exhibiting antibiotic activity against Gram positive and Gram negative bacteria. Proceedings of the Society for Experimental Biology & Medicine, 55: 66-69.
SCHOENBERG, A. & MOUBACHER, R. (1952) ..
The Strecker degradation of et amino acids. Chemical Review, 50: 261-277.
SCHOENTHAL, R. (1941). The nature of the anti-bacterial agent present in Pseudomonas pyocyanea cultures. British. Journal of Experimental Pathology, 22: 137.
SHAPIRO, S. & VINING, L. C. (1984) .. Suppression of nitrate utilization by ammonium and its relationship to chloramphenicol production in Streptomyces venezuelae. Canadian Journal of Microbiology, 30: 798-804.
SHEHATA, T. E., TALAAT, E. & ALLEN, G. Marc. (1971). Effect of nutrient concentration on the growth of Escherichia coli. Journal of Bacteriology, 107: 210-216.
SHELDRICK, G. M. (1976). SHELX: Program for crystal structure determination. University of Cambridge, England.
248

SHlNOMIYA, K. (1984). Phenotypic mixing of pyocin R2 and bacteriophage P517 in Pseudomonas aeruginosa P AO. Journal of Virology, 49: 310-314.
SIAS, S. R., STOUTHAMER, A. H. & INGRAHAM, J. L. (1980). The assimilatory and dissimilatory nitrate reductases of Pseudomonas aerul!inosa are encoded by different genes. Journal of General Microbiology, 118: 229-234 .
. SMITH, D., ONIONS, A. H. S. (1983). The Preservation and Maintenance of Living Fungi. Commonwealth Agricultural Bureaux. Page Bros., Norwich.
SMITH, G. M. & CALAM, C. T. (1980). Variations in inocula and their influence on the productivity of antibiotic fermentations. Biotechnology Letters, ~: 261-266.
SORRELL, T. N. (1988). Interpreting Spectra of Organic Molecules. University Science Books, California.
STAINER, R Y., DOUDOROFF, M. & ADELBERG, E. A. (1984). General Microbiology, 5th edition. Macmillan and Company Ltd., London, New York, Madras ..
STANZAK, R, MATSUSHIMA, P., BALTZ, R H. & RAO, R N. (1986). Cloning and expression in Streptomyces lividans of clustered erythromycin biosynthesis genes for Streptomyces etythreus. Biotechnology,~: 229-32.
STEELE, D. (1971). . The Interpretation of Vibrational Spectra. W. Oowes & Sons Ltd., London.
STEWARD, J. M., KRUGER, G. J., AMMON, H. L, DICKINSON, C. W. & HALL, S. R (1972). The X-RAY 72 system. Version of June 1972 Technical Report. (TR-192). Computer Science Centre, University of Maryland, College Park, Maryland.
STOKES, J. L., PECK, R L & WOODWARD, C. R Jr. (1942). . . .. Antimicrobial action of pyocynine, hemipyocyanine, pyocyanase and tyrothricin. Proceedings of the Society for Experimental Biology and Medicines, 51: 126-130.
249

· STRANGE, R. E.& HUNTER, J. R. (1967). Effect of magnesium on the survival of bacteria in aqueous suspension. In: Microbial Physiology and Continuous Culture, 3rd International Symposium on Continuous Culture, pp 102-116, C;ds. E. O. Powell, C. G. T. Evans, R. E. Strange and D. W. Tempest. H. M. Stationery Office, London.
SUSSMAN, A S. (1964). Microbes: Their growth, nutrition !\nd interaction. American Institute of Biological Science. D. C. Heath & Company, Boston.
SWAN, G. A., FELTON, D. G. (1957). Phenazines (Chapter X - The Bacterial Pigments: 1 Pyocyanine) 174-191. Interscience, New York.
TAKEDA, R. (1958). Pseudomonas pigment. I. Isolation and properties of pyoluteorin. Journal of Fermentation Technology, Osaka, 36: 281-286.
TAKEDA, R. (1959). Pseudomonas pigment-7. Journal of Fermentation Technology, 37: 59-63.
TAKEDA CHEMICAL INDUSTRIES (1983) . .. JP 58, 189, 194 [83, 189, 194].
TAKEDA CHEMICAL INDUSTRIES (1984). JP 59, 156, 287 [84, 156, 287].
TAKEDA CHEMICAL INDUSTRIES (1984). JP 59, 173, 085 [84, 173, 085].
TEMPEST, D. W. & NEIJSSEL, O. M. (1978). Eeo-physiological aspects of microbial growth in aerobic nutrient-limited environments. Advances in Microbial Ecology, ~: 105-153.
THA YSEN, A. C. & THA YSEN, I. (1955). Coumirin, a new fungistatic antibiotic. Atti del VI Congresso Internazionale di Microbiologia, Roma 1: 638.
250

TRILLI, A. (1986). Scale-up of fermentations. In: Manual of Industrial Microbiology and Biotechnology, pp. 277-307, eds. A. L Demain and N. A. Solomon. American Society for Microbiology, Washington D.C.
U. S. PHARMACOPOEIA (1975). General Notices and Requirements. U. S. Pharmacopoeia XIX,· p. 7. United States Pharmacopeial Convention, Mack Publishing Company, Easton PA.
VAN DAMME, P. A., JOHANNES, A. G., COX, H. C. & BERENDS, W (1960). . On toxofIavin, the yellow poison of Pseudomonas cocovenenans. Recueil des travaux Pays
Bas, 79: 255-267.
VAN VEEN, A. G. & MERTENS, W. K. (1934). Recueil des Travaux Chimiques des Pays-Bas, 58: 277.
VINING, L C. & CHATTERJEE, S. (1982). , Catabolic repression and control of secondary metabolism. In: Overproduction of Microbial Products, eds; V. Krumphanzl, B. Sikyta & Z. Vanek, pp. 35-40. Academic Press, London.
VINING, L C., SHAPIRO, S., AHMED, Z, U., VATS, S., DOULL, J., & STUTTARD, C . . (1986). . ~ ....
Genetic and physiological control of chloroamphenicol production. In: Regulation of Secondary Metabolite Formation, Workshop Conference, HoechstNol. 16, eds. H. Kieinkauf, . H. von DCihren, H. Domauer & G. Nesemann, pp. 208-224. VCH, Weinheim, FDR.
WAKSMAN, S. A. (1945). Microbial Antagonisms and Antibiotic Substances. New York, The Commonwealth Fund.
WAKSMAN, S. A. & WOODRUFF, H. B. (1940). Bacteriostatic and bacteriocidal substances produced by a soil actinomyces. Proceedings of the Society for Experimental Biology & Medicine, 45: 609-614.
WAX, R., SNYDER, L & KAPLAN, L (1982). Inactivation of glutamine synthetase by ammonia shock in the Gram positive bacterium Streptomyces cattIeya. Applied and Environmental Microbiology, 44: 1004-1006.
251

WEINBERG, E. D. & TONNIS, S. M. (1966). Action of chloramphenicol and its isomers on secondary biosynthetic processes of Bacillus. Applied Microbiology, 14: 850-856.
WELLS, I. C. (1952). Antibiotic substances produced by Pseudomonas aeruginosa; synthesis of Pyo lb, Pyo le and Pyo Ill. Journal of Biological Chemistry, 196: 331-340. .
WENPENBAUM, S., DEMANGE, P., DELL, A, MEYER, J. M. & ABDALLAH, M. A (1983). The structures of pyoverdine Pa, the siderophore of Pseudomonas aeruginosa. Tetrahedron Letters, 24: 4877-4880.
WHITE, R. J., MAIESE, W. M .. & GREENSTEIN, M. (1986). Screening for new products from microorganisms. In Manual of Industrial Microbiology and Biotechnology, pp. 24-31, eds. A L Demain and N. A. Solomon. American Society for Microbiology, Washington D.C.
WILLIAMS, W. K, & KATZ, E. (1977). Development of a chemically defined medium for the synthesis of actinomycin D by Streptomyces parvulus. Antimicrobial Agents and Chemotherapy, 11: 281-290.
WISTREICH, G. A & LECHTMAN, M. D. (1984) ..... . Microbiology 4th edition. MacMillan Publishing Company, New York, London.
WOLF, B, & HOTCHKISS, R. D. (1963). Genetically modified folic acid synthesizing enzymes of Pneumococcus. Biochemistry, £: 145-50.
WOLFF, S. P., GARNER, A & DEAN, R. T. (1986). Free radicals, Jipids and protein degradation. Trends in Biochemical Science, 11: 27-31.
. WOODS, D. C. (1962). The biochemical mode of action of the sulphanamides. Journal of General Microbiology, 29: 687-702.
WREDE, F. & STRACK, E. (1924). Pyocynin, the blue pigment of Bacillus pyoc;yaneus. Z. Physiol. Chem. 140: 1-15.
252

YOSHIMURA, F. & NIKAIDO, H. (1982). Permeability of Pseudomonas aeruginosa outer membrane to hydrophilic solutes. Journal of Bacteriology, 152: 636-642.
YOUNG, C. (1947). Pigment production and antibiotic activity in cultures of Pseudomonas aeruginosa. Journal of Bacteriology, 54: 109-117. .
YOUNG, T. B. (1979). Fermentation scale-up: industrial experience with a total environmental approach. In: Biochemical engineering, vol. 326, pp 165-180, eds. W. R. Vieth, K. V. Sulramanian & A. Constantinides. New York Academy of Sciences, New York.
YOUNG, M. D. & KEMPE, L L (1985). . Effects of phosphate, glucose and ammonium on cell growth and lincomycin production by
Streptomyces Iincolnensis in chemically defined media. Biotechnology and Bioengineering, 27: 327-333.
253
L-__________________________ ~ ____________________________________________ ___ I


![SuppressionofSensitivitytoDrugsand ......aceticacid[7]and antibiotics produced bynon-LAB strains (e.g.Streptomyces spp.)[7,18]. ... Actinomycin D Polypeptide antibiotic Inhibitor of](https://static.fdocuments.in/doc/165x107/5f3f9ce93048e06f7d5cb0ea/suppressionofsensitivitytodrugsand-aceticacid7and-antibiotics-produced.jpg)


