An Investigation into Scientist Involvement in Science ...
67
An Investigation into Scientist Involvement in Science Communication Activities July 2013 Center for Science Communication Japan Science and Technology Agency
Transcript of An Investigation into Scientist Involvement in Science ...

An Investigation into Scientist Involvement in
Science Communication Activities
July 2013
Center for Science Communication
Japan Science and Technology Agency

Table of Contents
I. Overview ............................................................................................................................................ 1
1.Overview of Survey ............................................................................................................................. 2
1-1 Objective ................................................................................................................................... 2
1-2 Method ...................................................................................................................................... 1
1-2-1 Subjects ......................................................................................................................... 1
1-2-2 Method, Period and Number Collected ......................................................................... 1
2.Overview of Results ............................................................................................................................ 3
2-1 Experience in Science Communication ................................................................................... 1
2-2 Activity Type ............................................................................................................................ 1
2-3 Impetus for Activities .............................................................................................................. 1
2-4 Objectives of Activities ............................................................................................................. 1
2-5 Achievements Made (With Experience), Achievements to be Made (With No Experience) ... 1
2-6 Barriers .................................................................................................................................... 1
2-7 Support .................................................................................................................................... 1
2-8 Support Systems (Departments/Staff) ..................................................................................... 1
2-9 Preferred Training ..................................................................................................................... 1
2-10 Impact of the 4th Science and Technology Basic Plan on Scientist Involvement in Science
Communication Activities ............................................................................................................ 5
3. Discussion .......................................................................................................................................... 6
3-1 Current State .............................................................................................................................. 1
3-2 Objectives .................................................................................................................................. 1
3-3 Achievements ............................................................................................................................ 1
3-4 Barriers ...................................................................................................................................... 1
3-5 Support ...................................................................................................................................... 1
3-5-1 Human Support System ................................................................................................. 1
3-5-2 Subsidies for Necessary Expenses ................................................................................. 1
3-5-3 Introducing and Providing Places and Opportunities for Practice ................................. 1
3-5-4 No Rewards ................................................................................................................... 1
3-6 Training ..................................................................................................................................... 1
3-7 Summary ................................................................................................................................... 1
4. Acknowledgements............................................................................................................................. 1
5. Survey Implementation System ........................................................................................................ 1

II. Survey Results ................................................................................................................................. 10
1. About the Respondents ......................................................................................................................... 1
2. Results ................................................................................................................................................. 15
2-1 State of Science Communication Activities .............................................................................. 1
2-2 Barriers in Carrying Out Science Communication Activities ................................................... 1
2-3 Support for Promoting Science Communication Activities ...................................................... 1
2-4 Impact of Government Policies on Scientist Involvement in Science Communication
Activities ........................................................................................................................................ 1
List of Figures and Tables ...................................................................................................................... 61

1
I. Overview

2
1. Overview of Survey
1-1 Objective
The Center for Science Communication (directed by Mamoru Mohri) of the Japan Science and Technology
Agency (hereafter, “JST”) carries out investigative research as part of its efforts to implement timely measures
and strategically promote projects from a long-term perspective, according to the 4th Science and Technology
Basic Plan (approved by the Cabinet on August 19, 2011).
The Basic Plan states that “researchers who have received a certain amount or more of national research
funds are required to actively engage in communication with the public on the content and results of their
research activities.” Also, the Great East Japan Earthquake and incident at the Fukushima Daiichi Nuclear
Power Plant have raised new questions about the current status of experts in science and technology.
Within this social context, the objective of this investigative research (hereafter, “survey”) is to highlight the
current state and issues of scientist involvement in science communication1 activities, and clarify the support
required for promoting science communication activities. The survey was carried out by the survey research
unit (JST Fellow and National Institute for Physiological Sciences Associate Professor Amane Koizumi) of the
Science Communication Center, focusing on the science communication activities of scientists at universities
and research institutes in Japan.
In fiscal 2010, an identical survey on science communication activities of scientists was carried out as part of
the JST Public Consultation Activities 2010 “Communication between Society and Science and Technology.”
The 2010 survey was referred to when designing the current survey.
1-2 Method
1-2-1 Subjects
This survey was sent to 122,164 email addresses recorded in the ReaD & Researchmap, the largest national
database of 220,000 Japanese academic scientists, operated by the JST.
1-2-2 Method, Period and Number Collected
The survey was conducted from March 8 to 16, and the number of responses collected was 8,964 (7.3%),
while the number of valid responses was 7,908 (6.5%).
1 This refers to activities with the goal of having scientists (experts) and non -scientists engage in the mutual
exchange of information and opinions on science and technology and related issues thereof, and to share these
issues as even larger social problems. Accordingly, as an academic field, these activities include not only
scientific, agricultural, medical and pharmaceutical areas but also the humanities and social sciences, and their
format covers a broad range from outreach to participation in policy making.

3
2. Overview of Results
2-1 Experience in Science Communication (see Fig. 8 on page 15)
Persons with experience in science communication activities (hereafter, “With Experience”) accounted for
64.4% (5,769 persons) of the total number collected, while persons with no experience in science
communication activities (hereafter, “With No Experience”) accounted for 35.6% (3,195 persons).
2-2 Activity Type (see Fig. 10 on page 17)
The typical content of science communication activities of the With Experience group is as follows: open
lectures, lecture presentations, symposiums and seminars for the general public (77.4%); opening research
facilities to the public, open campus (66.0%); special classes at elementary, junior and senior high schools
(52.0%); participating in town meetings, citizen councils and citizen juries, etc. (9.4%); collaborative surveys
and research with citizens (8.9%).
2-3 Impetus for Activities (see Table 2 on page 17 and Fig. 11 on page 18)
Regarding the impetus for carrying out science communication activities, the response rate for “by request
(other than from work)” (hereafter, “agree, “somewhat agree” ratio) was the highest (80.7%), followed by “as
ancillary work or duty to own research” (75.5%), and then “started activities voluntarily” (55.6%).
2-4 Objectives of Activities (see Table 3 on pages 19-20, and Fig. 12 on pages 21-24)
Regarding the objectives of carrying out science communication activities, the response rate for both the
With Experience and With No Experience groups was more than 80% for the following: “fulfill my original
duty as a scientist to publish in society the background and results of my research” (With Experience 89.0%,
With No Experience 90.1%); “stimulate interest in science, technology and academia” (With Experience 86.8%,
With No Experience 84.1%); “use my abilities to help solve social issues as a scientist” (With Experience
82.0%, With No Experience 82.0%). Meanwhile, the response rate was around 50% for the following: “prevent
children from losing interest in science” (With Experience 53.5%, With No Experience 53.3%).
Comparing the results by the presence or absence of experience in science communication activities, the
response rate was higher in the With Experience group than in the With No Experience group for the following
objectives: “raise the knowledge level of non-experts” (With Experience 62.9%, With No Experience 53.0%);
“enjoy communicating with non-experts” (With Experience 57.9%, With No Experience 45.6%).
Meanwhile, the response rate was higher in the With No Experience group than in the With Experience
group for the following objectives: “fulfill my accountability to the providers of the acquired research funding,
as a duty to my affiliated institution” (With Experience 70.2%, With No Experience 82.3%); “fulfill my
accountability to taxpayers” (With Experience 57.7%, With No Experience 64.9%).
2-5 Achievements Made (With Experience), Achievements to Be Made (With No Experience)
(see Table 4 on page 25 and Fig. 13 on pages 26-27)
Regarding the achievements made by the With Experience group in carrying out science communication

4
activities, the response rates in order of the highest were as follows: “communicating my message” (86.1%);
“understanding what the other persons wanted to say” (69.2%); “sharing ideas and thoughts” (67.5%);
“acquiring new knowledge and realizations” (67.5%).
As for the achievements to be made by the With No Experience group when carrying out science
communication activities, the response rates in order of the highest were as follows: “acquiring new knowledge
and realizations” (84.1%); “communicating my message” (82.1%).
Comparing the results by the presence or absence of experience in science communication activities, the
response rate was notably higher in the With No Experience group than the With Experience group for the
following: “contributing to solving social issues” (With Experience 35.6%, With No Experience 68.7%).
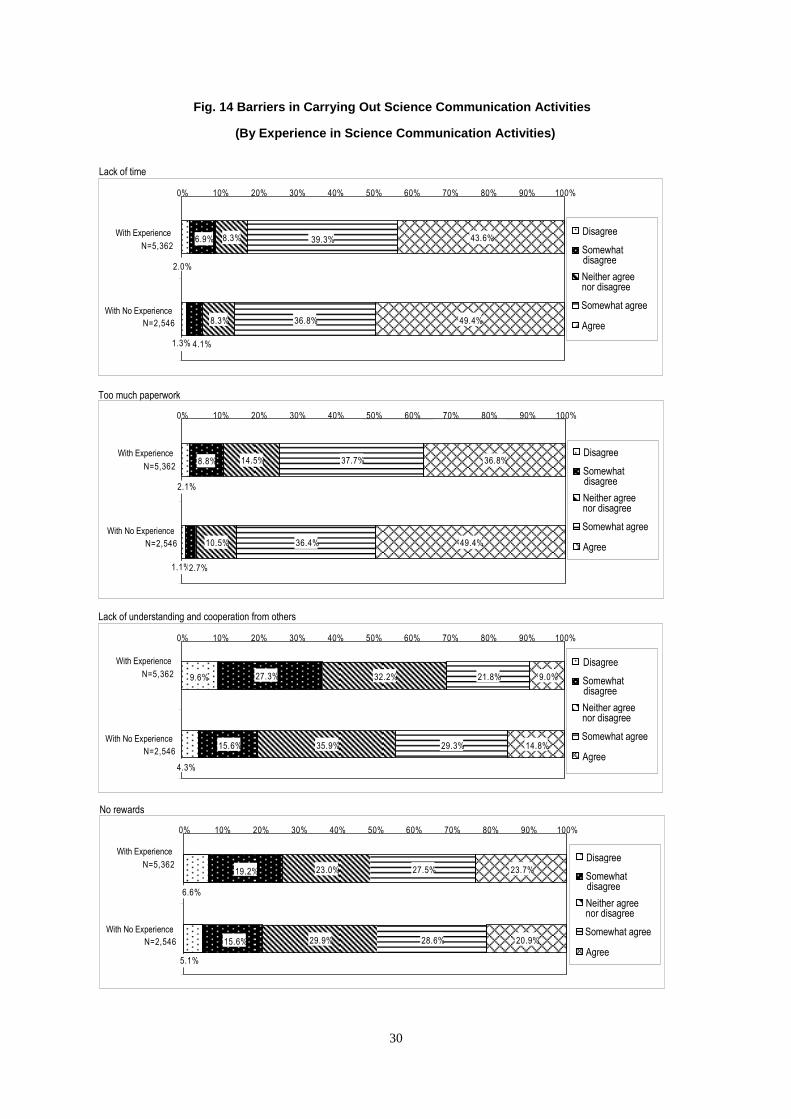
2-6 Barriers (see Table 5 on pages 28-29, Fig. 14 on pages 30-33, Fig. 15 on page 34, and
Fig. 16 on page 35)
Regarding the barriers to carrying out science communication activities, irrespective of the With Experience
group or With No Experience group, the response rates in order of the highest were as follows: “lack of time”
(With Experience 82.9%, With No Experience 86.2%); “too much paperwork” (With Experience 74.5%, With
No Experience 85.8%). Continuing on from this, in the With Experience group the response rates in order of
the highest were as follows: “no rewards” (51.2%); “funding restrictions” (49.9%). For the With No Experience
group, the response rates in order of the highest were as follows: “funding restrictions” (68.6%); “difficulty in
creating a platform that would allow science communication activities” (64.0%).
For most of the items, the response rates were higher for the With No Experience group than the With
Experience group. However, there was no significant difference noted in the presence or absence of experience
in science communication activities for the response of “no rewards” (With Experience 51.2%, With No
Experience 49.5%).
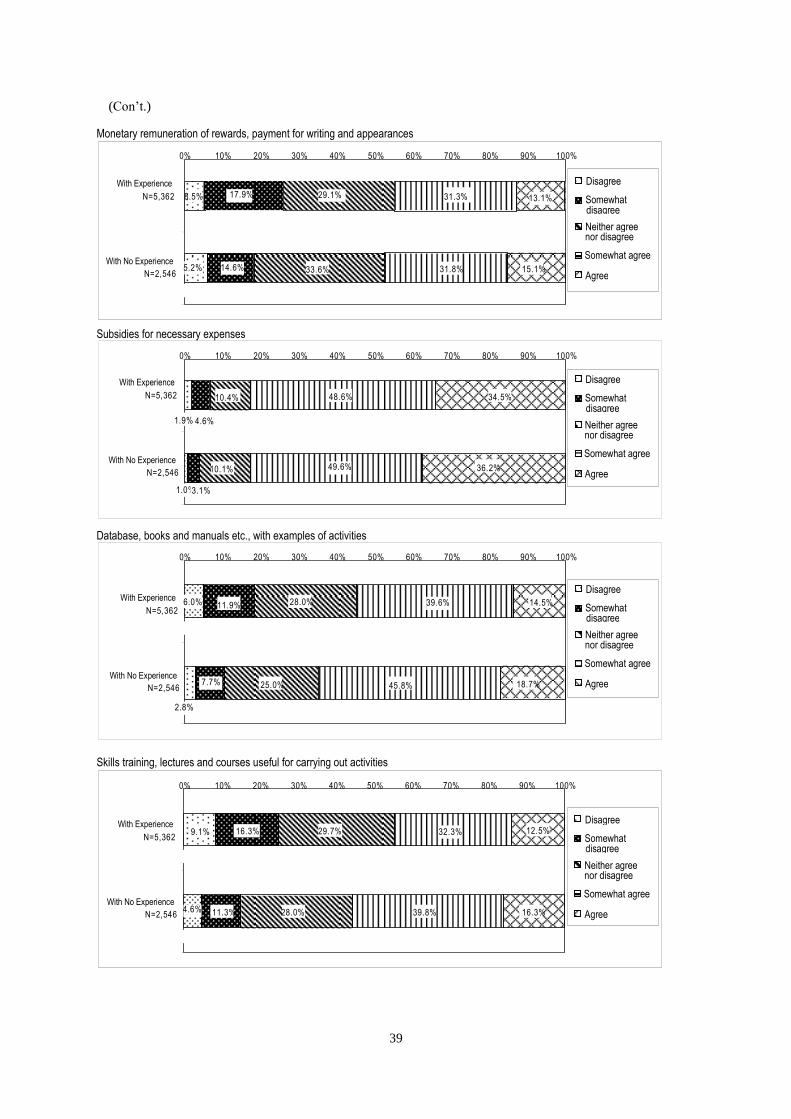
2-7 Support (see Table 6 on pages 36-37, Fig. 17 on pages 38-40, Fig. 18 on page 41, and
Fig. 19 on page 42)
Regarding the support for promoting science communication activities, irrespective of the presence or
absence of experience in these activities, the high response rates were as follows: “human support system”
(With Experience 84.2%, With No Experience 87.2%); “subsidies for necessary expenses” (With Experience
83.1%, With No Experience 85.8%); “providing places and opportunities for practice” (With Experience 67.7%,
With No Experience 77.7%).
Continuing on from this, in the With Experience group the high response rates were as follows: “direct
evaluation from the visitors” (61.3%); “evaluated on results as per for a thesis” (59.1%). For the With No
Experience group, the high response rates were as follows: “database, books and manuals, etc., with examples
of activities” (64.5%); “holding joint events and study workshops, etc., where results and know-how from
science communication activities are presented and shared” (64.4%); “evaluated on results as per for a thesis”
(63.9%).

5
2-8 Support System (Departments/Staff) (see Figs. 20-21 on page 43, Fig. 22 on page 44,
Fig. 23 on page 45 and Fig. 24 on page 46)
The ratio of persons who responded that there is a support system (departments/staff) for science
communication activities was 42.3%, while the ratio of those who responded that there is no such support
system was 57.7%. For those in the former group, the response rate for who the specific providers was highest
for “students” (84.5%), followed by “staff from a special department for science communication” (76.2%).
The typical contents of the support provided are as follows: “work related to carrying out the activities”
(72.9%); “setting up and running the activities on the day” (60.1%); “negotiating with external parties”
(60.0%); “planning the activities” (57.0%).
The highest response for the funding sources of science communication activities was “universities and
research institutes” (65.9%).
2-9 Preferred Training (see Table 7 on pages 47-49, Fig. 25 on page 50, Fig. 26 on page 51 and
Fig. 27 on pages 52-56)
For the With Experience group, the response rates did not exceed 50% for any of the items. In contrast, in
the With No Experience group, the response rates for all six items were above 50%, as follows: “open lectures,
lecture presentations, symposiums and seminars for general public” (65.7%); “interactive science cafes and
workshops” (56.5%); “special classes at elementary, junior and senior high schools” (53.2%); “work with
science museums (52.2%); “writing books and developing software for the general public” (51.7%); “opening
research facilities to the public, open campus” (51.4%).
2-10 Impact of the 4th Science and Technology Basic Plan on Scientist Involvement in Science
Communication Activities (see Table 8 and Fig. 28 on page 57, Tables 9-10 on page 58,
Figs. 29-30 on page 59, Table 11 and Fig. 31 on page 60)
The ratio of persons who responded that they “know of” or “somewhat know of” the 4th Science and
Technology Basic Plan that states, “researchers who have received a certain amount or more of national
research funds are required to actively communicate with the public on the content and results of their research
activities” was 45.6%, while the ratio of those who responded that they “don’t know of” or “don’t really know
of” the Basic Plan was 49.3%. Also, the greater the amount of annual research grants received by individuals,
the higher the response was for “know of” or “somewhat know of” regarding the Basic Plan.
The ratio of persons who responded that they “agree” or “somewhat agree” the Basic Plan was 70.9%, which
greatly exceeded the 10.8% of persons who responded “disagree” or “somewhat disagree” regarding the Basic
Plan.
Regarding the question of whether the Basic Plan had resulted in carrying out more science communication
activities than previously, the ratio of persons who responded “neither agree nor disagree” was 65.6%, which
was greater than half the respondents.
Meanwhile, the ratio of persons who responded that scientists voluntarily carrying out science
communication activities “had become the norm” or “had somewhat become the norm” was only 28.1%.

6
3. Discussion
3-1 Current State
The ratio of scientists with experience in science communication activities exceeded 60% (64.4%). Also, the
ratio of those who “agree” or “somewhat agree” the 4th Science and Technology Basic Plan that states,
“researchers who have received a certain amount or more of national research funds are required to actively
communicate with the public on the content and results of their research activities” was 70.9%. Thus, science
communication activities can be regarded as a general activity of scientists.
The survey results also revealed that a wide range of science communication activities are carried out, from
typical activities to promote understanding such as “open lectures, lecture presentations, symposiums and
seminars for the general public” (77.4%) to interactive activities including “collaborative surveys and research
with citizens” (8.9%).
Conversely, the ratio of persons who responded that scientists voluntarily carrying out science
communication activities “had become the norm” or “had somewhat become the norm” was only 28.1%. This
result indicated that science communication activities have not become the norm as a voluntary activity of
scientists.
3-2 Objectives
Regarding the objectives of carrying out science communication activities, irrespective of the presence or
absence of experience in these activities, the following response rates were all more than 80%: “fulfill my
original duty as a scientist to publish in society the background and results of my research” (With Experience
89.0%, With No Experience 90.1%); “stimulate interest in science, technology and academia” (With
Experience 86.8%, With No Experience 84.1%); “use my abilities to help solve social issues as a scientist”
(With Experience 82.0%, With No Experience 82.0%). These results suggest that science communication
activities are recognized as a social responsibility of scientists.
Meanwhile, the response rate for “enhance my own multifaceted understanding of my research field” was
over 60% (With Experience 67.3%, With No Experience 70.0%). This result indicates that scientists view
science communication activities as a way of gaining a different perspective on their own research activities, so
as to deepen their understanding thereof. Thus, science communication activities can be regarded as a way for
scientists to gain an overview of their own research field as well as acquire different perspectives from experts
in other fields and the general public, which subsequently leads to a multifaceted understanding.
3-3 Achievements
Regarding the achievements made by the With Experience group in carrying out science communication
activities, the response rates in order of the highest were as follows: “communicating my message” (86.1%);
“understanding what the other persons wanted to say” (69.2%); “sharing ideas and thoughts” (67.5%);
“acquiring new knowledge and realizations” (67.5%); “contributing to solving social issues” (35.6%). These
achievements can be regarded as also coinciding with the current state of science communication activities,
which cover a wide range from activities intended to promote understanding to highly interactive citizen
participation-based activities.

7
Also, the response rate was notably higher in the With No Experience group than in the With Experience
group for the following: “contributing to solving social issues” (With Experience 35.6%, With No Experience
68.7%).
3-4 Barriers
The survey results revealed that the major barriers to carrying out science communication activities are as
follows: “lack of time” (With Experience 82.9%, With No Experience 86.2%); “too much paperwork” (With
Experience 74.5%, With No Experience 85.8%); “no rewards” (With Experience 51.2%, With No Experience
49.5%); “funding restrictions” (With Experience 49.9%, With No Experience 68.6%); “difficulty in creating a
platform that would allow science communication activities” (With Experience 42.2%, With No Experience
64.0%).
Thus, the removal of these barriers is expected to promote scientist involvement in science communication
activities.
3-5 Support
Regarding the support for promoting science communication activities, the results revealed the following as
actions required in response to the items cited as barriers: “human support system” (With Experience 84.2%,
With No Experience 87.2%); “subsidies for necessary expenses” (With Experience 83.1%, With No Experience
85.8%); “providing places and opportunities for practice” (With Experience 67.7%, With No Experience
77.7%); “evaluated on results as per for a thesis” (With Experience 59.1%, With No Experience 63.9%).
Furthermore, in the With Experience group there was a high response rate for “direct evaluation from the
visitors” (With Experience 61.3%, With No Experience 55.3%), while in the With No Experience group the
high response rates were as follows: “database, books and manuals, etc., with examples of activities” (With
Experience 54.1%, With No Experience 64.5%); “holding joint events and study workshops, etc., where results
and know-how from science communication activities are presented and shared” (With Experience 51.3%,
With No Experience 64.4%). These results show the need for considering support policies in accordance with
experience in science communication activities.
3-5-1 Human Support System
The results revealed that about half the organizations (51.2%) with which the With Experience group is
affiliated have a support system (departments/staff) for science communication activities, while there are fewer
organizations (23.6%) of the With No Experience group in which such a system exists.
Thus, a diverse range of support is required, such as building an appropriate human support system with staff
from a special department for science communication, and providing assistance for the following: “work
related to carrying out the activities” (72.9%); “setting up and running the activities on the day” (60.1%);
“negotiating with external parties” (60.0%); “planning the activities” (57.0%).
3-5-2 Subsidies for Necessary Expenses
In the case of a support system, the highest response for the funding sources of science communication

8
activities was “universities and research institutes” (65.9%). Thus, in order to remove the barrier of “funding
restrictions,” a wider variety of funding for science communication activities needs to be secured, as follows:
“competitive funds (part of research expenses)” (23.7%); “corporate donations” (10.1%); “from participants”
(14.5%).
3-5-3 Providing places and opportunities for practice
The survey results indicate that in addition to planning activities carried out by staff from a special
department for science communication, mechanisms need to be built so as to provide and introduce information
on opportunities for practicing these activities, such as developing events and exhibitions with science
museums, holding science festivals in collaboration with local governments and planning and participating in
citizen classes, and special classes and providing research guidance, etc., at elementary, junior and senior high
schools.
3-5-4 No Rewards
The item “no rewards” (With Experience 51.2%, With No Experience 49.5%) was the only one within the
barriers in which there were no significant differences based on experience in activities, which suggests that
this is a general trend among scientists. Thus, in order to make it “the norm” to have scientists voluntarily
carrying out science communication activities, it is essential to establish mechanisms (other than a thesis index)
for evaluating these activities as results.
3-6 Training
The survey results showed that over 50% of the persons in the With No Experience group would prefer
training on the following items: “open lectures, lecture presentations, symposiums and seminars for the general
public” (65.7%); “interactive science cafes and workshops” (56.5%); “special classes at elementary, junior and
senior high schools” (53.2%); “work with science museums” (52.2%); “writing books and developing software
for the general public” (51.7%); “opening research facilities to the public, open campus” (51.4%).
Conversely, in the With Experience group there were no items with a response rate that exceeded 50%. A
notable difference between the two groups was the ranking of an item on the need for training to “acquire
knowledge on social issues, systems and laws, etc.” (46.2%), which placed eighth in the With No Experience
group compared to second in the With Experience group.
From these results, the development and implementation of needs-based training is required such as general
training on typical science communication activities for the With No Experience group, and a more diverse
range of training according to the content of and awareness of issues in science communication activities for
the With Experience group.
3-7 Summary
This survey revealed that although scientist involvement in science communication activities has become
common, voluntarily carrying out these activities is not yet the norm.
This can be attributed to the following barriers as background factors: “lack of time” (With Experience

9
82.9%, With No Experience 86.2%); “too much paperwork” (With Experience 74.5%, With No Experience
85.8%); “no rewards” (With Experience 51.2%, With No Experience 49.5%); “funding restrictions” (With
Experience 49.9%, With No Experience 68.6%); “difficulty in creating a platform that would allow science
communication activities” (With Experience 42.2%, With No Experience 64.0%).
Thus, devising appropriate measures such as alleviating the administrative burden on scientists and
evaluating science communication activities as results, etc., will enable the voluntary carrying out of these
activities by scientists to become the norm in society.
4. Acknowledgements
We express our sincere thanks to all of the scientists who cooperated with this survey.
5. Investigation Implementation System
This survey was conducted as part of the JST Center for Science Communication research on issues,
focusing on “Practical Research on the Science communication Activities of Scientists in Universities and
Research Institutes.”
Planned, Designed, and Implemented by:
KOIZUMI, Amane: JST Center for Science Communication Fellow
(Associate Professor, Inter-University Research Institute Corporation – National Institutes of Natural Sciences,
National Institute for Physiological Sciences)
*Listed alphabetically
FUJITA, Hisashi: Assistant, Planning & Research, JST Center for Science Communication
KAKUBAYASHI, Motoko: Researcher, Planning & Research, JST Center for Science Communication
KAWAMOTO, Shishin: Specially Appointed Lecturer, Center for Research and Development in Higher
Education, Hokkaido University, Communicators in Science and Technology Education Program
(CoSTEP)
KURIMOTO, Tatsuji: Survey Manager, Planning & Research, JST Center for Science Communication
MORITA, Yoshiko: Science Communication Senior Expert, National Museum of Emerging Science and
Innovation (Miraikan)
TAKESHITA, Yoko: Science Communicator, National Museum of Emerging Science and Innovation
(Miraikan)
SEKIYA, Sho: Associate Fellow, JST Center for Science Communication
SHIRANE, Sumito: Survey Manager, Planning & Research, JST Center for Science Communication
UENO, Nobuko: Researcher, Planning & Research, JST Center for Science Communication

10
II. Survey Results

11
1. About the Respondents
The following graph displays the attributes of the survey respondents (N = 7,908).
○ Gender
Fig. 1 Gender Ratio of Respondents
( ): Frequency
N = 7,908
○ Age
Fig. 2 Ratio by Age
( ): Frequency
N = 7,908
1.5% 20.9% 31.8% 28.6% 14.7% 2.5%
0% 20% 40% 60% 80% 100%
20-29 years
(118)
30-39 years (1653)
40-49 years (2515)
50-59 years (2260)
60-69 years (1161)
70 years and above (201)
85.0% 15.0%
0% 20% 40% 60% 80% 100%
Male (6724)
Female (1184)
12
○ Type of Affiliated Organizations (Multiple Responses)
Fig. 3 Affiliated Organizations (Multiple Responses)
( ): Frequency
N = 7,908
○ Employment Pattern (Multiple Responses)
Fig. 4 Employment Pattern (Multiple Responses)
( ): Frequency
N = 7,908
72.4%
18.7%
7.5%
1.5%
0.2%
0.1%
1.2%
2.1%
0% 10% 20% 30% 40% 50% 60% 70% 80% 90% 100%
Full-time (retirement system:
Part-time (590)
Graduate student (PhD) (120)
Graduate student (Master’s degree) (13)
Undergraduate student (9)
Non-affiliated organization (92)
Other (167)
non-tenure system) (5725)
Full-time (tenure system) (1481)
4.6%
1.3%
3.0%
17.2%
34.5%
6.4%
39.3%
0% 10% 20% 30% 40% 50% 60% 70% 80% 90% 100%
National University (3104)
Public University (505)
Private University (2729)
Public Research Institute (1364)
Private Company (240)
No Affiliated Organization (104)
Other (367)

13
○ Position
Fig. 5 Position
( ): Frequency
N = 7,908
○ Specialty Fields
Fig. 6 Specialty Fields
( ): Frequency
N = 7,908
4.4% 28.0% 9.8% 5.7%
6.9% 23.6% 9.7% 11.9%
0% 20% 40% 60% 80% 100% Mathematical Science
Life Science (2211)
Material Science (773)
Information Science
Cosmology/Geoscience/ Environmental Science
Human Science/ Social Science (1866)
Technology (770)
Other (941)
(349)
(449)
(549)
3.4% 36.9% 28.3% 17.7%
6.3%
1.0% .1%
2.8%
3.6%
0% 20% 40% 60% 80% 100%
Director/Department head or
head/Professor class (2917)
Head researcher/Associate Professor class (2239)
Assistant Professor/Lecturer class
Researcher/Post Doctorate class
Graduate student (PhD) (80)
Graduate student (Master’s) (5)
No position (223)
Other (288)
above (265)
Department/Laboratory or group
(1396)
(495)

14
○ Annual Research Grants to Individuals
Fig. 7 Annual Research Grants to Individuals
( ): Frequency
N = 7,908
1.4% 1.5%
7.3%
16.2% 42.0% 31.6%
0% 20% 40% 60% 80% 100%
¥50 million or more (110)
¥30 million to ¥50
million (122)
¥10 million to ¥30 million (576)
¥3 million to ¥10 million (1279)
Less than ¥3 million (3325)
Annual Research Grants
(2496) name
not in an individual’s

15
2. Results
This survey is composed of the following sections: State of Science Communication Activities (2-1); Barriers
in Carrying Out Science Communication Activities (2-2); Support for Promoting Science Communication
Activities (2-3); Impact of Government Policies on Scientist Involvement in Science Communication Activities
(2-4). The results are listed in this order.
2-1 State of Science Communication Activities
The results of the question “So far, have you ever carried out science communication activities targeting
non-scientists2?” are as follows (including respondents who withdrew from the survey midway): yes 64.4%
(5,769 persons); no 35.6% (3,195 persons).
Fig. 8 Experience in Science Communication Activities (Number of Responses: 8,964)
( ): Frequency
N = 8,964
2 Academic conference presentations and thesis submissions for experts are not included, even as an open access source.
64.4%
35.6%
With Experience
With No Experience
(3,195)
(5,769)

16
The results for respondents who completed the survey from start to finish are as follows: yes 67.8% (5,362
persons); no 32.2% (2,546 persons).
Fig. 9 Experience in Science Communication Activities (Number of Valid Responses: 7,908)
( ): Frequency
N = 7,908
The results also indicated a positive correlation between the amount of annual research grants received by
individuals and the tendency to carry out Science communication activities (i.e., the greater the amount, the
higher the tendency).
Table 1 Experience in Science Communication Activities by Annual Research Grants to
Individuals
N = 7,908
67.8%
32.2%
With Experience
With No Experience
(2,546)
(5,362)
With Experience With No Experience
¥50 million or more
¥30 million to ¥50 million
¥10 million to ¥30 million
¥3 million to ¥10 million
Less than ¥3 million
Annual Research Grants not in an
individual’s name
Frequency
Frequency
Frequency
Frequency
Frequency
Frequency
Percent (%)
Percent (%)
Percent (%)
Percent (%)
Percent (%)
Percent (%)
102 92.7%
108
88.5% 483
83.9%
942
73.7%
2224
66.9%
1503
60.2%
8 7.3%
14 11.5%
93
16.1%
337
26.3%
1101
33.1%
993
39.8%
Annual Research Grants in an individual’s name

17
The following graph displays the specific content of science communication activities of the With Experience
group. (Multiple Responses)
Fig. 10 Specific Content of Science Communication Activities (Multiple Responses)
( ): Frequency
N = 5,362
The following table displays the impetus for science communication activities of the With Experience
group.
Table 2 Impetus for Science Communication Activities
N = 5,362
Items Disagree
Somewhat agree Agree
Frequency 559 1080 1461 1522
Percent (%) 10.4% 20.1% 27.2% 28.4%
1351 1278 1149 316
25.2% 23.8% 21.4% 5.9%
351 590 2116 1929
6.5% 11.0% 39.5% 36.0%
749 750 932 1753 1178
14.0% 17.4% 32.7% 22.0%
359 449 1675 2655
6.7% 8.4% 31.2% 49.5%
By request
Started activities voluntarily
Influenced by other scientists already carrying out science
As ancillary work or duty to own research
As own research/part there of
communication activities
/Percent (%) disagree
Frequency
Frequency
Frequency
Frequency
Percent (%)
Percent (%)
Percent (%)
Percent (%)
(other than from work)
nor disagree
77.4% 66.0%
52.0% 47.0%
35.3% 35.2%
33.8% 30.7%
27.9% 22.4% 21.9%
18.7% 17.2%
9.4% 8.9%
3.5%
Open lectures, lecture presentations, symposiums and seminars for the general public (4150)
Opening research facilities to the public, open campus (3537)
Special classes at elementary, junior and senior high schools (2787)
Working with the press (2519)
Writing books and developing software for the general public (1892)
Working with governmental advisory committees (1815)
(1815)
Communicate through own media (website, blog, Twitter, SNS, etc.) (1644)
Media appearances on television and radio, etc. (1498)
Interactive science cafes and workshops (1199) Research guidance for elementary, junior and senior high school students (1176)
Press releases, press conferences (1004) Work with science museums (922)
Participating in town meetings, citizen councils and citizen juries (505)
Other (186)
Collaborations with companies or private organizations (1887)
Participating in public activities (science shops, community-based research, etc.) (477)
0% 10% 20% 30% 60% 70% 80% 90% 40% 50% 100%
Somewhat
Frequency
740
13.8%
1268
23.6%
7.0%
376
14.0%
224
4.2%
Neither agree

18
Fig. 11 Impetus for Science Communication Activities
N = 5,362
The following table displays the objectives of science communication activities of the With Experience group
and the With No Experience group. For the With No Experience group, we asked what the objective would be
if they were to carry out science communication activities.
14.0%
6.7%
10.4%
25.2%
6.5%
14.0%
4.2%
7.0%
13.8%
23.6%
8.4%
17.4%
11.0%
20.1%
23.8%
31.2%
32.7%
39.5%
27.2%
21.4%
49.5%
22.0%
36.0%
28.4%
5.9%
0% 20% 40% 60% 80% 100%
Influenced by other scientists already carrying
Started activities voluntarily
As ancillary work or duty to own research
As own research/part thereof
By request (other than from work)
Disagree
Somewhat disagree
Neither agree nor disagree
Somewhat
Agree
out science communication activities
agree

19
Table 3 Objectives of Science Communication Activities
(By Experience in Science Communication Activities)
communication activities
Experience in science communication activities
With Experience
N=5,362
With No Experience
N=2,546
Prevent children from losing interest in science
With Experience
N=5,362
With No Experience
N=2,546
Raise the knowledge level of non-experts
With Experience
N=5,362
With No Experience
N=2,546
Stimulate interest in science, technology and academia
With Experience
N=5,362
With No Experience
N=2,546
Fulfill my accountability to taxpayers
With Experience
N=5,362
With No Experience
N=2,546
Fulfill my original duty as a scientist to publish in society the background and results of my research
With Experience N=5,362
With No Experience
N=2,546
Fulfill my accountability to the providers of the acquired research funding, as a duty to my affiliated institution
With Experience
N=5,362
With No Experience
N=2,546
Use my abilities to help solve social issues as a scientist
With Experience
N=5,362
With No Experience
N=2,546
Frequency
Percent (%)
Percent (%)
Percent (%)
Percent (%)
Percent (%)
Percent (%)
Percent (%)
Percent (%)
Percent (%)
Percent (%)
Percent (%)
Percent (%)
Percent (%)
Percent (%)
Percent (%)
Percent (%)
Frequency
Frequency
Frequency
Frequency
Frequency
Frequency
Frequency
Frequency
Frequency
Frequency
Frequency
Frequency
Frequency
Frequency
Frequency
74 182 332 1930 2844
1.4% 3.4% 6.2% 36.0% 53.0%
37 64 150 917 1378
1.5% 2.5% 5.9% 36.0% 54.1%
119 274 571 1967 2431
2.2% 5.1% 10.6% 36.7% 45.3%
11.7% 41.9% 42.2%
1253 2064 1307
23.4% 38.5% 24.4%
755 922 429
29.7% 36.2% 16.8%
1419 1637 1232
26.5% 30.5% 23.0%
746 912 445
29.3% 35.8% 17.5%
999 2155 1454
18.6% 40.2% 27.1%
509 1115 668
20.0%
1155
45.4%
1813
33.8%
1041
40.9%
1251
23.3%
671
26.4%
2606
48.6%
1075
43.8% 26.2%
Disagree
disagree
nor disagree
agree
Agree
Experience in science Items
58 120 281 932
2.3% 4.7% 11.0% 36.6%
292 440 865 1952
5.4% 8.2% 16.1% 36.4%
42 130 280 1053
1.6% 5.1% 11.0% 41.4%
439 648 1182 1842
8.2% 12.1% 22.0% 34.4%
106 249 541 979
4.2% 9.8% 21.2% 38.5%
86 147 475 2048
1.6% 2.7% 8.9% 38.2%
22 84 297 1068
0.9% 3.3%
209 529
3.9% 9.9%
119 321
4.7% 12.6%
447 627
8.3% 11.7%
128 315
5.0% 12.4%
273 481
5.1% 9.0%
76 178
3.0% 7.0%
Somewhat
Neither
agreeagree
Somewhat
agree
agreeagree

20
(Con’t)
N = 7,908
communication activities
Raise one’s own name recognition
With Experience
N=5,362
With No Experience
N=2,546
Enjoy communicating with non-experts
With Experience
N=5,362
With No Experience
N=2,546
Know the trends and views in society
With Experience
N=5,362
With No Experience
N=2,546
Get students and young scientists interested in
With Experience
N=5,362
With No Experience
N=2,546
Build networks with a range of people
With Experience N=5,362
With No Experience
N=2,546
Facilitate the process of
acquiring research funds
With Experience
N=5,362
With No Experience
N=2,546
Practice and apply research findings in society
With Experience
N=5,362
With No Experience
N=2,546
Frequency
Percent (%)
Percent (%)
Percent (%)
Percent (%)
Percent (%)
Percent (%)
Percent (%)
Percent (%)
Percent (%)
Percent (%)
Percent (%)
Percent (%)
Percent (%)
Percent (%)
Frequency
Frequency
Frequency
Frequency
Frequency
Frequency
Frequency
Frequency
Frequency
Frequency
Frequency
Frequency
Frequency
my own research field
255 512 1130 2085 1380
4.8% 9.5% 21.1% 38.9% 25.7%
81 201 556 1099 609
3.2% 7.9% 21.8% 43.2% 23.9%
237 464 933 2034 1694
4.4% 8.7% 17.4% 37.9% 31.6%
64 142 396 1119 825
2.5% 5.6% 15.6% 44.0% 32.4%
1273 1236 1667 883 303
23.7% 23.1% 31.1% 16.5% 5.7%
273 461 948 642 222
10.7% 18.1% 37.2% 25.2% 8.7%
437 681 1285 1949 1010
8.1% 12.7% 24.0% 36.3% 18.8%
121 277 723 1011 414
4.8% 10.9% 28.4% 39.7% 16.3%
434 702 1319 1979 928
8.1% 13.1% 24.6% 36.9% 17.3%
101 252 655 1084 454
4.0% 9.9% 25.7% 42.6% 17.8%
337 567 1353 1908 1197
6.3% 10.6% 25.2% 35.6% 22.3%
174 348 863 820 341
6.8% 13.7% 33.9% 32.2% 13.4%
1775 1240 1496 685 166
33.1% 23.1% 27.9% 12.8% 3.1%
642 629 860 330 85
25.2% 24.7% 33.8% 13.0% 3.3%
Items Agree
nor disagree
Experience in science Disagree
disagree
agree
Somewhat
Neither
Neither
agree
Somewhat
agree

21
Fig. 12 Objectives of Science Communication Activities
(By Experience in Science Communication Activities)
Fulfill my original duty as a scientist to publish in society the background and results of my research
Use my abilities to help solve social issues as a scientist
Fulfill my accountability to the providers of the acquired research funding, as a duty to my affiliated institution
Fulfill my accountability to taxpayers
6.2%
5.9%
36.0%
36.0%
53.0%
54.1%
1.4%
1.5%
3.4%
2.5%
0% 10% 20% 30% 40% 50% 60% 70% 80% 90% 100%
With Experience
With No Experience
10.6%
11.0%
36.7%
36.6%
45.3%
45.4%
2.2%
2.3%
5.1%
4.7%
0% 10% 20% 30% 40% 50% 60% 70% 80% 90% 100%
16.1%
11.0%
36.4%
41.4%
33.8%
40.9%
5.4%
1.6%
8.2%
5.1%
0% 10% 20% 30% 40% 50% 60% 70% 80% 90% 100%
22.0%
21.2%
34.4%
38.5%
23.3%
26.4%
8.2%
4.2%
12.1%
9.8%
0% 10% 20% 30% 40% 50% 60% 70% 80% 90% 100%
N=5,362
N=2,546
With Experience
With No Experience
N=5,362
N=2,546
With Experience
With No Experience
N=5,362
N=2,546
With Experience
With No Experience
N=5,362
N=2,546
Neither agree
Somewhat disagree
Disagree
Somewhat agree
Agree
nor disagree
Neither agree
Somewhat disagree
Disagree
Somewhat agree
Agree
nor disagree
Neither agree
Some what disagree
Disagree
Somewhat agree
Agree
nor disagree
Neither agree
Somewhat disagree
Disagree
Somewhat agree
Agree
nor disagree
22
(Con’t.)
Stimulate interest in science, technology and academia
Raise the knowledge level of non-experts
Prevent children from losing interest in science
Enhance my own multifaceted understanding of my research field
8.9%
11.7%
38.2%
41.9%
48.6%
42.2%
1.6%
0.9%
2.7%
3.3%
0% 10% 20% 30% 40% 50% 60% 70% 80% 90% 100%
With Experience
With No Experience
23.4%
29.7%
38.5%
36.2%
24.4%
16.8%
3.9%
4.7%
0% 10% 20% 30% 40% 50% 60% 70% 80% 90% 100%
26.5%
29.3%
30.5%
35.8%
23.0%
17.5%
5.0%
11.7%
0% 10% 20% 30% 40% 50% 60% 70% 80% 90% 100%
18.6%
20.0%
40.2%
43.8%
27.1%
26.2%
5.1%
3.0%
9.0%
7.0%
0% 10% 20% 30% 40% 50% 60% 70% 80% 90% 100%
N=5,362
N=2,546
With Experience
With No Experience
N=5,362
N=2,546
With Experience
With No Experience
N=5,362
N=2,546
With Experience
With No Experience
N=5,362
N=2,546
9.9%
12.6%
8.3%
12.4%
Neither agree
Somewhat disagree
Disagree
Somewhat agree
Agree
nor disagree
Neither agree
Somewhat disagree
Disagree
Somewhat agree
Agree
nor disagree
Neither agree
Somewhat disagree
Disagree
Somewhat agree
Agree
nor disagree
Neither agree
Somewhat disagree
Disagree
Somewhat agree
Agree
nor disagree

23
(Con’t.)
Practice and apply research findings in society
Facilitate the process of acquiring research funds
Get students and young scientists interested in my own research field
21.1%
21.8%
38.9%
43.2%
25.7%
23.9%
4.8%
3.2%
9.5%
7.9%
0% 10% 20% 30% 40% 50% 60% 70% 80% 90%
17.4%
15.6%
37.9%
44.0%
31.6%
32.4%
4.4%
2.5%
8.7%
5.6%
0% 10% 20% 30% 40% 50% 60% 70% 80% 90% 100%
31.1%
37.2%
16.5%
25.2%
5.7%
8.7%
23.7%
10.7%
23.1%
18.1%
0% 10% 20% 30% 40% 50% 60% 70% 80% 90% 100%
24.0%
28.4%
36.3%
39.7%
18.8%
16.3%
8.1%
4.8%
12.7%
10.9%
0% 10% 20% 30% 40% 50% 60% 70% 80% 90% 100%
With Experience
With No Experience
N=5,362
N=2,546
With Experience
With No Experience
N=5,362
N=2,546
With Experience
With No Experience
N=5,362
N=2,546
With Experience
With No Experience
N=5,362
N=2,546
Neither agree
Somewhat disagree
Disagree
Somewhat agree
Agree
nor disagree
Neither agree
Somewhat disagree
Disagree
Somewhat agree
Agree
nor disagree
Neither agree
Somewhat disagree
Disagree
Somewhat agree
Agree
nor disagree
Neither agree
Somewhat disagree
Disagree
Somewhat agree
Agree
nor disagree
Build networks with a range of people

24
(Con’t.)
Enjoy communicating with non-experts
Raise one’s own name recognition
24.6%
25.7%
36.9%
42.6%
17.3%
17.8%
8.1%
4.0%
13.1%
9.9%
0% 10% 20% 30% 40% 50% 60% 70% 80% 90% 100%
25.2%
33.9%
35.6%
32.2%
22.3%
13.4%
6.3%
6.8%
10.6%
13.7%
0% 10% 20% 30% 40% 50% 60% 70% 80% 90% 100%
27.9%
33.8%
12.8%
13.0%
33.1%
25.2%
23.1%
24.7%
3.1%
3.3%
0% 10% 20% 30% 40% 50% 60% 70% 80% 90% 100%
With Experience
With No Experience
N=5,362
N=2,546
With Experience
With No Experience
N=5,362
N=2,546
With Experience
With No Experience
N=5,362
N=2,546
Neither agree
Somewhat disagree
Disagree
Somewhat agree
Agree
nor disagree
Neither agree
Somewhat disagree
Disagree
Somewhat agree
Agree
nor disagree
Neither agree
Somewhat disagree
Disagree
Somewhat agree
Agree
nor disagree
Know the trends and views in society

25
The following table displays the achievements made by carrying out science communication activities of the
With Experience group and the With No Experience group. For the With Experience group, we asked what
they actually achieved by carrying out science communication activities, while for the With No Experience
group, we asked what they would like to achieve by carrying out science communication activities.
Table 4 Achievements of Science Communication Activities
N = 7,908
Items
28 204 515 3661 954
.5% 3.8% 9.6% 68.3% 17.8%
25 76 354 1194 897
1.0% 3.0% 13.9% 46.9% 35.2%
64 306 1285 3093 614
1.2% 5.7% 24.0% 57.7% 11.5%
23 80 495
.9% 3.1% 19.4%
59 316 1366
1.1% 5.9% 25.5%
37 93 575
1.5% 3.7% 22.6%
168 492 1084
3.1% 9.2% 20.2%
26 62 315
1.0% 2.4% 12.4% 41.4%
471 991 1990
8.8% 18.5% 37.1%
59 151 587
2.3% 5.9% 23.1%
communication activities
Communicating my message
Understanding what the other persons wanted
Contributing to solving social
Sharing ideas
and thoughts
Acquiring new knowledge and
With Experience
N=5,362
With Experience
N=5,362
With Experience
N=5,362
With Experience
N=5,362
With No Experience
N=2,546
With No Experience
N=2,546
With No Experience
N=2,546
With No Experience
N=2,546
With No Experience
N=2,546
Frequency
Percent (%)
Frequency
Percent (%)
Frequency
Percent (%)
Frequency
Percent (%)
Frequency
Percent (%)
Frequency
Percent (%)
Frequency
Percent (%)
Frequency
Percent (%)
Frequency
Percent (%)
Frequency
Percent (%) 37.7%
960
28.3%
1520
1055
43.7%
2341
44.4%
1130
54.0%
2898
49.3%
1256 692
27.2%
723
711
13.5%
27.9%
1277
23.8%
1088
390
42.7%
7.3%
789
31.0%
to say
realizations
issues
With Experience
N=5,362
Agree
agree
nor disagree
disagree
Disagree
Experience in science Somewhat
Neither
agree
Somewhat agree

26
Fig. 13 Achievements of Science Communication
Activities
Communicating my message
Understanding what the other persons wanted to say
Sharing ideas and thoughts
Acquiring new knowledge and realizations
9.6%
13.9%
68.3%
46.9%
17.8%
35.2%
1.0%
.5%
3.0%
3.8%
0% 10% 20% 30% 40% 50% 60% 70% 80% 90% 100%
24.0%
19.4%
57.7%
49.3%
11.5%
27.2%
1.2%
.9%
5.7%
3.1%
0% 10% 20% 30% 40% 50% 60% 70% 80% 90% 100%
25.5%
22.6%
54.0%
44.4%
13.5%
27.9%
1.1%
1.5%
5.9%
3.7%
0% 10% 20% 30% 40% 50% 60% 70% 80% 90% 100%
20.2%
12.4%
43.7%
41.4%
23.8%
42.7%
3.1%
1.0%
9.2%
2.4%
0% 10% 20% 30% 40% 50% 60% 70% 80% 90% 100%
With Experience
With No Experience
N=5,362
N=2,546
With Experience
With No Experience
N=5,362
N=2,546
With Experience
With No Experience
N=5,362
N=2,546
With Experience
With No Experience
N=5,362
N=2,546
Neither agree
Somewhat disagree
Disagree
Somewhat agree
Agree
nor disagree
Neither agree
Somewhat disagree
Disagree
Somewhat agree
Agree
nor disagree
Neither agree
Somewhat disagree
Disagree
Somewhat agree
Agree
nor disagree
Neither agree
Somewhat disagree
Disagree
Somewhat agree
Agree
nor disagree

27
(Con’t.)
37.1%
23.1%
28.3%
37.7%
7.3%
31.0%
8.8%
2.3%
18.5%
5.9%
0% 10% 20% 30% 40% 50% 60% 70% 80% 90% 100%
With Experience
With No Experience
N=5,362
N=2,546
Neither agree
Somewhat disagree
Disagree
Somewhat agree
Agree
nor disagree
Contributing to solving social issues

28
2-2 Barriers in Carrying Out Science Communication Activities
The following table displays the items listed as barriers in carrying out science communication activities.
Table 5 Barriers in Carrying Out Science Communication Activities
communication activities
Difficulty in creating a platform that would allow
With Experience
N=5,362
With No Experience
N=2,546
Difficulty in easily explaining and communicating
With Experience
N=5,362
With No Experience
N=2,546
Funding restrictions
With Experience
N=5,362
With No Experience
N=2,546
No rewards
With Experience
N=5,362
With No Experience
N=2,546
Lack of time
With Experience N=5,362
With No Experience
N=2,546
Lack of understanding
and cooperation from others
With Experience
N=5,362
With No Experience
N=2,546
Too much paperwork
With Experience
N=5,362
With No Experience
N=2,546
Frequency
Percent (%)
Percent (%)
Percent (%)
Percent (%)
Percent (%)
Percent (%)
Percent (%)
Percent (%)
Percent (%)
Percent (%)
Percent (%)
Percent (%)
Percent (%)
Percent (%)
Frequency
Frequency
Frequency
Frequency
Frequency
Frequency
Frequency
Frequency
Frequency
Frequency
Frequency
Frequency
Frequency
Items
about one’s work
outreach activities
Public indifference
With Experience
N=5,362
With No Experience
N=2,546
Frequency
Frequency
Percent (%)
Percent (%)
34 105 211 938 1258
49.4% 36.8% 8.3% 4.1% 1.3%
114 474 778 2022 1974
36.8% 37.7% 14.5% 8.8% 2.1%
27 68 267 927 1257
49.4% 36.4% 10.5% 2.7% 1.1%
513 1466 1728 1170 485
9.6% 27.3% 32.2% 21.8% 9.0%
377 747 914 398 110
4.3% 15.6% 35.9% 29.3% 14.8%
1272 1472 1234 1031 353
6.6%
129
19.2%
397
23.0%
762
27.5%
727
23.7%
531
5.1% 15.6% 29.9% 28.6% 20.9%
1101 1575 1402 910 374
7.0% 17.0% 26.1% 29.4% 20.5%
758 989 554 188 57
2.2% 7.4% 21.8% 38.8% 29.8%
974 1592 940 1392 464
8.7%
275
10.8%
501
9.3% 32.9%
1112 517
20.3% 43.7%
1763
29.3%
746
26.0% 17.5%
612
24.0%
1480
27.6%
577
22.7%
255
10.0%
21.7%
1164
24.3%
619
29.7% 18.2%
294
11.5%
454
8.5%
85
3.3%
732 1494 1770 1085 281
5.2%
304 767
20.2% 33.0%
951
37.4%
27.9%
384
15.1% 5.5%
140
13.7%
30.1% 11.9%
Agree
8.3%
nor disagree
Experience in science
Frequency
105 370 444 2105 2338
2.0% 6.9% 39.3% 43.6%
Disagree
disagree
agree
Somewhat
Somewhat
Neither
agree
agree

29
(Con’t.)
N = 7,908
Items
965 1694 1710 784 209
18.0% 31.6% 31.9% 14.6% 3.9%
249 558 1008 548 183
9.8% 21.9% 39.6% 21.5% 7.2%
841 1540 1792 953 236
15.7% 28.7% 33.4% 17.8% 4.4%
209 525 985 634 193
8.2% 20.6% 38.7% 24.9% 7.6%
774 1461 1676 1154 297
14.4% 27.2% 31.3% 21.5% 5.5%
198 443 909 750 246
7.8% 17.4% 35.7% 29.5% 9.7%
2204 1820 1015 260 63
41.1% 33.9% 18.9% 4.8% 1.2%
641 795 819 219 72
25.2% 31.2% 32.2% 8.6% 2.8%
2619 1595 906 189 53
48.8% 29.7% 16.9% 3.5% 1.0%
573 731 902 257 83
22.5% 28.7% 35.4% 10.1% 3.3%
2085 1621 1135 380 141
38.9% 30.2% 21.2% 7.1% 2.6%
439 699 774 486 148
17.2% 27.5% 30.4% 19.1% 5.8%
Accountability adequately fulfilled by the thesis
No interest in science communication
Nothing to gain
Gap between oneself and the professional
Different views and
Lack of knowledge of the public
With Experience
N=5,362
communication activities
values with the
public
image required by the public
publication table
Frequency
Percent (%)
Frequency
Percent (%)
Frequency
Percent (%)
Frequency
Percent (%)
Frequency
Percent (%)
Frequency
Percent (%)
Frequency
Percent (%)
Frequency
Percent (%)
Frequency
Percent (%)
Frequency
Percent (%)
Frequency
Percent (%)
Frequency
Percent (%)
With Experience
N=5,362
With Experience
N=5,362
With Experience
N=5,362
With Experience
N=5,362
With Experience
N=5,362
With No
N=2,546
Experience
With No
N=2,546
Experience
With No
N=2,546
Experience
With No
N=2,546
Experience
With No
N=2,546
Experience
With No
N=2,546
Experience
Disagree
disagree
nor disagree
agree
Agree
Somewhat
Somewhat
Neither
agree
activities
Experience in science agree
30
Fig. 14 Barriers in Carrying Out Science Communication Activities
(By Experience in Science Communication Activities)
Lack of time
Too much paperwork
Lack of understanding and cooperation from others
No rewards
8.3%
8.3%
39.3%
36.8%
43.6%
49.4%
1.3%
2.0%
4.1%
6.9%
0% 10% 20% 30% 40% 50% 60% 70% 80% 90% 100%
14.5%
10.5%
37.7%
36.4%
36.8%
49.4%
2.1%
1.1%
8.8%
2.7%
0% 10% 20% 30% 40% 50% 60% 70% 80% 90% 100%
32.2%
35.9%
21.8%
29.3%
9.0%
14.8%
9.6%
4.3%
27.3%
15.6%
0% 10% 20% 30% 40% 50% 60% 70% 80% 90% 100%
23.0%
29.9%
27.5%
28.6%
23.7%
20.9%
6.6%
5.1%
19.2%
15.6%
0% 10% 20% 30% 40% 50% 60% 70% 80% 90% 100%
With Experience
With No Experience
N=5,362
N=2,546
With Experience
With No Experience
N=5,362
N=2,546
With Experience
With No Experience
N=5,362
N=2,546
With Experience
With No Experience
N=5,362
N=2,546
Neither agree
Somewhat disagree
Disagree
Somewhat agree
Agree
nor disagree
Neither agree
Somewhat disagree
Disagree
Somewhat agree
Agree
nor disagree
Neither agree
Somewhat disagree
Disagree
Somewhat agree
Agree
nor disagree
Neither agree
Somewhat disagree
Disagree
Somewhat agree
Agree
nor disagree

31
(Con’t.)
Difficulty in easily explaining and communicating about one’s work
Difficulty in creating a platform that would allow science communication activities
Public indifference
26.1%
21.8%
29.4%
38.8%
20.5%
29.8%
7.0%
2.2%
17.0%
7.4%
0% 10% 20% 30% 40% 50% 60% 70% 80% 90% 100%
17.5%
24.0%
26.0%
29.3%
8.7%
10.8%
18.2%
11.5%
29.7%
24.3%
0% 10% 20% 30% 40% 50% 60% 70% 80% 90% 100%
27.6%
22.7%
32.9%
43.7%
9.3%
20.3%
8.5%
3.3%
21.7%
10.0%
0% 10% 20% 30% 40% 50% 60% 70% 80% 90% 100%
33.0%
37.4%
20.2%
30.1%
5.2%
11.9%
13.7%
5.5%
27.9%
15.1%
0% 10% 20% 30% 40% 50% 60% 70% 80% 90% 100%
With Experience
With No Experience
N=5,362
N=2,546
With Experience
With No Experience
N=5,362
N=2,546
With Experience
With No Experience
N=5,362
N=2,546
With Experience
With No Experience
N=5,362
N=2,546
Neither agree
Somewhat disagree
Disagree
Somewhat agree
Agree
nor disagree
Neither agree
Somewhat disagree
Disagree
Somewhat agree
Agree
nor disagree
Neither agree
Somewhat disagree
Disagree
Somewhat agree
Agree
nor disagree
Neither agree
Somewhat disagree
Disagree
Somewhat agree
Agree
nor disagree
Funding restrictions

32
(Con’t.)
Different views and values with the public
Gap between oneself and the professional image required by the public
Nothing to gain
31.9%
39.6%
14.6%
21.5% 7.2%
18.0%
9.8%
31.6%
21.9%
3.9%
0% 10% 20% 30% 40% 50% 60% 70% 80% 90% 100%
33.4%
38.7%
17.8%
24.9% 7.6%
15.7%
8.2%
28.7%
20.6%
4.4%
0% 10% 20% 30% 40% 50% 60% 70% 80% 90% 100%
31.3%
35.7%
21.5%
29.5%
5.5%
9.7%
14.4%
7.8%
27.2%
17.4%
0% 10% 20% 30% 40% 50% 60% 70% 80% 90% 100%
18.9%
32.2% 8.6%
41.1%
25.2%
33.9%
31.2%
4.8%
2.8%
1.2%
0% 10% 20% 30% 40% 50% 60% 70% 80% 90% 100%
With Experience
With No Experience
N=5,362
N=2,546
With Experience
With No Experience
N=5,362
N=2,546
With Experience
With No Experience
N=5,362
N=2,546
With Experience
With No Experience
N=5,362
N=2,546
Neither agree
Somewhat disagree
Disagree
Somewhat agree
Agree
nor disagree
Neither agree
Somewhat disagree
Disagree
Somewhat agree
Agree
nor disagree
Neither agree
Somewhat disagree
Disagree
Somewhat agree
Agree
nor disagree
Neither agree
Somewhat disagree
Disagree
Somewhat agree
Agree
nor disagree
Lack of knowledge of the public

33
(Con’t.)
Accountability adequately fulfilled by the thesis publication table
16.9%
35.4% 10.1% 3.3%
48.8%
22.5%
29.7%
28.7%
3.5%
1.0%
0% 10% 20% 30% 40% 50% 60% 70% 80% 90% 100%
21.2%
30.4%
7.1%
19.1%
2.6%
5.8%
38.9%
17.2%
30.2%
27.5%
0% 10% 20% 30% 40% 50% 60% 70% 80% 90% 100%
With Experience
With No Experience
N=5,362
N=2,546
With Experience
With No Experience
N=5,362
N=2,546
Neither agree
Somewhat disagree
Disagree
Somewhat agree
Agree
nor disagree
Neither agree
Somewhat disagree
Disagree
Somewhat agree
Agree
nor disagree
No interest in science communication activities

34
Fig. 15 Barriers in Carrying Out Science Communication Activities of
the With Experience Group (Slightly agree, Agree)
N = 5,362
4.8%
3.5%
8.7%
9.0%
5.5%
5.2%
4.4%
3.9%
2.6%
1.2%
1.0%
9.3%
0% 10% 20% 30% 40% 50% 60% 70% 80% 90% 100%
Lack of time
Too much paperwork
No rewards
Funding restrictions
Difficulty in creating a platform that would allow science communication activities
Difficulty in easily explaining and communicating about one’s work
Lack of understanding and cooperation from others
Gap between oneself and the
Public indifference
Different views and values with the public
Lack of knowledge of the public
Accountability adequately fulfilled
No interest in science communication activities
Nothing to gain
43.6% 39.3%
36.8% 37.7%
23.7% 27.5%
20.5% 29.4%
32.9%
26.0%
21.8%
21.5%
20.2%
17.8%
14.6%
7.1%
professional image required by the public
by the thesis publication table
Slightly agree
Agree

35
Fig. 16 Barriers in Carrying Out Science Communication Activities of
the With Experience Group (Slightly agree, Agree)
N = 2,546
10.8%
9.7%
7.6%
7.2%
5.8%
3.3%
2.8%
0% 10% 20% 30% 40% 50% 60% 70% 80% 90% 100%
Lack of time
Too much paperwork
Funding restrictions
Difficulty in creating a platform that would allow outreach activities
No rewards
Lack of understanding and cooperation from others
Public indifference
Difficulty in easily explaining and communicating about one’s work
Gap between oneself and the
Different views and values with the public
Lack of knowledge of the public
Accountability adequately fulfilled by the
No interest in science communication activities
thesis publication table
professional image required by the public
Nothing to gain
14.8%
11.9%
36.8%
36.4%
38.8%
43.7%
28.6%
29.3%
30.1%
29.3%
29.5%
24.9%
21.5%
19.1%
8.6%
49.4%
49.4%
29.8%
20.3%
20.9%
10.1%
Slightly agree
Agree

36
2-3 Support for Promoting Science Communication Activities
The following table displays the items listed as support for promoting science communication
activities.
Table 6 Support for Promoting Science Communication Activities
(By Experience in Science Communication Activities)
Items
Frequency
61 253 537 2416 2095
Percent (%) 1.1% 4.7% 10.0% 45.1% 39.1%
Frequency
26 60 240 1102 1118
Percent (%)
1.0% 2.4% 9.4% 43.3% 43.9%
Frequency
506 962 1523 1609 762
Percent (%)
9.4% 17.9% 28.4% 30.0% 14.2%
Frequency
147 355 805 807 432
Percent (%)
5.8% 13.9% 31.6% 31.7% 17.0%
Frequency
368 716 1106 1933 1239
Percent (%)
6.9% 13.4% 20.6% 36.0% 23.1%
Frequency
108 251 561 990 636
Percent (%)
4.2% 9.9% 22.0% 38.9% 25.0%
Frequency
166 488 1420 2318 970
Percent (%)
3.1% 9.1% 26.5% 43.2% 18.1%
Frequency
82 218 838 1066 342
Percent (%)
3.2% 8.6% 32.9% 41.9% 13.4%
Frequency
455 961 1563 1679 704
Percent (%)
8.5% 17.9% 29.1% 31.3% 13.1%
Frequency
133 371 848 810 384
Percent (%)
5.2% 14.6% 33.3% 31.8% 15.1%
Frequency
103 247 555 2605 1852
Percent (%)
1.9% 4.6% 10.4% 48.6% 34.5%
Frequency
25 79 258 1262 922
Percent (%)
1.0% 3.1% 10.1% 49.6% 36.2%
Subsidies for
necessary
With
N=5,362
With No
Monetary remuneration of
rewards,
payment for
With
N=5,362
With No
N=2,546
Direct evaluation
from the visitors
With
N=5,362
With No
N=2,546
Human support
system With
N=5,362
With No
N=2,546
Evaluation of results as per
for a thesis
With
N=5,362
With No
N=2,546
Incentive rewards from
With
N=5,362
With No
N=2,546
academic
societies and
organizations, etc.
writing and
appearances
expenses
Experience
Experience
Experience
Experience
Experience
Experience
Experience
Experience
Experience
Experience
Experience
Experience
N=2,546
nor disagree
disagree
Disagree
communication activities agree
Agree
Somewhat
Neither
agree
Somewhat
agree
agree
Experience in science

37
(Con’t.)
N = 7,908
Items
Frequency
320 637 1502 2124 779
Percent (%)
6.0% 11.9% 28.0% 39.6% 14.5%
71 197 636 1166 476
2.8% 7.7% 25.0% 45.8% 18.7%
487 875 1594 1734 672
9.1% 16.3% 29.7% 32.3% 12.5%
117 287 713 1014 415
4.6% 11.3% 28.0% 39.8% 16.3%
202 395 1136 2433 1196
3.8% 7.4% 21.2% 45.4% 22.3%
33 93 441 1278 701
1.3% 3.7% 17.3% 50.2% 27.5%
340 707 1562 2029 724
6.3% 13.2% 29.1% 37.8% 13.5%
70 192 643 1159 482
2.7% 7.5% 25.3% 45.5% 18.9%
Present findings and know-how from activities and share the
information at
N=5,362
N=2,546
Providing places
and
N=5,362
N=2,546
Skills training,
lectures and
courses useful
for carrying out
With
N=5,362
N=2,546
Database,
books and
manuals etc.,
with examples
of activities
With
N=5,362
With No
N=2,546
activities
opportunities
for practice
events and study
Experience
Experience
Experience
Experience
Experience
Experience
Experience
Experience With No
With
With
With No
With No
Frequency
Frequency
Frequency
Frequency
Frequency
Percent (%)
Percent (%)
Percent (%)
Percent (%)
Percent (%)
Percent (%)
Percent (%)
Frequency
Frequency
nor disagree
disagree
Agree
Disagree
communication activities agree
Somewha
t
Neither
agree
Somewhat
agree
agree
Experience in science
communication

38
Fig. 17 Support for Promoting Science Communication Activities
(By Experience in Science Communication Activities)
Human support system
Incentive rewards from academic societies and organizations, etc.
Evaluation of results as per for a thesis
Direct evaluation from the visitors
10.0%
13.9%
45.1%
43.3% 43.9%
1.0%
1.1%
2.4%
0% 10% 20% 30% 40% 50% 60% 70% 80% 90% 100%
30.0%
31.7%
14.2%
27.2%
17.9%
0% 10% 20% 30% 40% 50% 60% 70% 80% 90% 100%
36.0%
25.0%
0% 10% 20% 30% 40% 50% 60% 70% 80% 90% 100%
43.2% 18.1%
3.1%
3.2%
9.1%
0% 10% 20% 30% 40% 50% 60% 70% 80% 90% 100%
With Experience
With No Experience
N=5,362
N=2,546
With Experience
With No Experience
N=5,362
N=2,546
With Experience
With No Experience
N=5,362
N=2,546
With Experience
With No Experience
N=5,362
N=2,546
4.7% 39.1%
9.4% 28.4%
.5.8% 13.9% 31.6%
6.9% 13.4% 20.6% 23.1%
4.2%
9.9% 22.0% 38.9%
26.5%
8.6% 32.9% 41.9% 13.4%
Neither agree
Somewhat disagree
Disagree
Somewhat agree
Agree
nor disagree
Neither agree
Somewhat disagree
Disagree
Somewhat agree
Agree
nor disagree
Neither agree
Somewhat disagree
Disagree
Somewhat agree
Agree
nor disagree
Neither agree
Somewhat disagree
Disagree
Somewhat agree
Agree
nor disagree
39
(Con’t.)
Monetary remuneration of rewards, payment for writing and appearances
Subsidies for necessary expenses
Database, books and manuals etc., with examples of activities
Skills training, lectures and courses useful for carrying out activities
15.1%
0% 10% 20% 30% 40% 50% 60% 70% 80% 90% 100%
10.1%
48.6%
49.6%
34.5%
36.2%
1.9%
1.0%
4.6%
3.1%
0% 10% 20% 30% 40% 50% 60% 70% 80% 90% 100%
39.6%
45.8%
14.5%
18.7%
2.8%
0% 10% 20% 30% 40% 50% 60% 70% 80% 90% 100%
16.3% 32.3%
39.8%
12.5%
16.3%
0% 10% 20% 30% 40% 50% 60% 70% 80% 90% 100%
With Experience
With No Experience
N=5,362
N=2,546
With Experience
With No Experience
N=5,362
N=2,546
With Experience
With No Experience
N=5,362
N=2,546
With Experience
With No Experience
N=5,362
N=2,546
8.5% 17.9% 29.1% 31.3% 13.1%
5.2% 14.6% 33.6% 31.8%
10.4%
6.0% 11.9% 28.0%
7.7% 25.0%
9.1% 29.7%
4.6% 11.3% 28.0%
Neither agree
Somewhat disagree
Disagree
Somewhat agree
Agree
nor disagree
Neither agree
Somewhat disagree
Disagree
Somewhat agree
Agree
nor disagree
Neither agree
Somewhat disagree
Disagree
Somewhat agree
Agree
nor disagree
Neither agree
Somewhat disagree
Disagree
Somewhat agree
Agree
nor disagree

40
(Con’t.)
29.1%
25.3%
37.8%
45.5%
13.5%
18.9%
6.3%
2.7%
13.2%
7.5%
0% 10% 20% 30% 40% 50% 60% 70% 80% 90% 100%
With Experience
With No Experience
N=5,362
N=2,546
Neither agree
Somewhat disagree
Disagree
Somewhat agree
Agree
nor disagree
21.2%
17.3%
45.4%
50.2% 27.5%
3.8%
1.3%
7.4%
3.7%
0% 10% 20% 30% 40% 50% 60% 70% 80% 90% 100%
With Experience
With No Experience
N=5,362
N=2,546
22.3%
Neither agree
Somewhat disagree
Disagree
Somewhat agree
Agree
nor disagree
Providing places and opportunities for practice
Present findings and know-how from activities and share the information at events and study workshops, etc.

41
The following graph displays the items listed by the With Experience group as required support for
promoting science communication activities, in order from the highest response rate to the lowest.
Fig. 18 Support for Promoting Science Communication Activities
Required by the With Experience Group
N = 5,362
14.2%
13.1%
12.5%
13.5%
0% 10% 20% 30% 40% 50% 60% 70% 80% 90% 100%
Human support system
Subsidies for necessary expenses
Direct evaluation from the visitors
Evaluation of results as per for a thesis
Database, books and manuals etc.,
Present findings and know-how from activities and share
the information at events and study workshops, etc.
Skills training, lectures and courses
Incentive rewards from academic societies
45.1%
48.6%
45.4%
43.2%
36.0%
39.6%
37.8%
32.3%
31.3%
30.0%
14.5%
23.1%
18.1%
22.3%
34.5%
39.1%
Providing places and opportunities for practice
with examples of activities
and organizations, etc.
Monetary remuneration of rewards,
Slightly agree
Agree
payment for writing and appearances

42
The following graph displays the items listed by the With No Experience group as required support for
promoting science communication activities, in order from the highest response rate to the lowest.
Fig. 19 Support for Promoting Science Communication Activities
Required by the With No Experience Group
N = 2,546
15.1%
17.0%
13.4%
16.3%
0% 10% 20% 30% 40% 50% 60% 70% 80% 90% 100%
Human support system
Subsidies for necessary expenses
Database, books and manuals etc.,
Evaluation of results as per for a thesis
Skills training, lectures and courses
Direct evaluation from the visitors
Incentive rewards from academic societies
Monetary remuneration of rewards, payment
41.9%
31.7%
31.8%
38.9%
39.8%
45.5%
45.8%
50.2%
49.6%
43.3% 43.9%
36.2%
27.5%
18.7%
18.9%
25.0%
and opportunities for practice
with examples of activities
useful for carrying out activities
and organizations, etc.
for writing and appearances
Present findings and know-how from activities and share
the information at events and study workshops, etc.
Slightly agree
Agree
Providing places
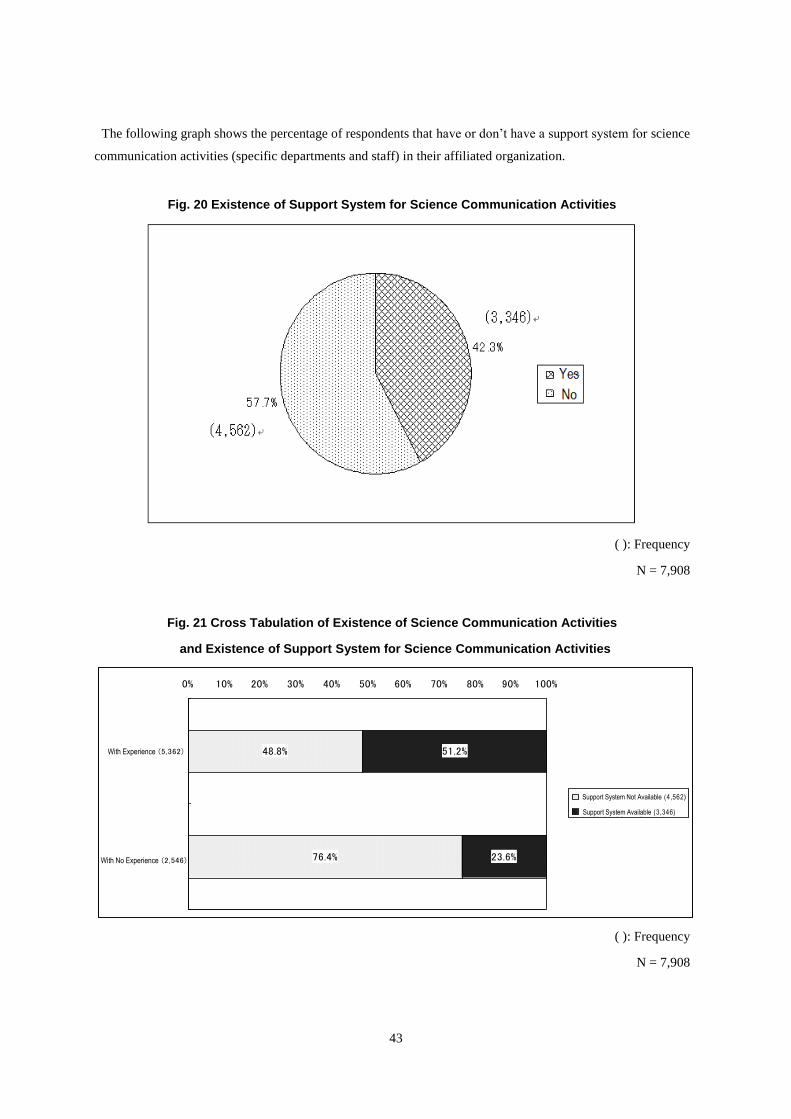
43
The following graph shows the percentage of respondents that have or don’t have a support system for science
communication activities (specific departments and staff) in their affiliated organization.
Fig. 20 Existence of Support System for Science Communication Activities
( ): Frequency
N = 7,908
Fig. 21 Cross Tabulation of Existence of Science Communication Activities
and Existence of Support System for Science Communication Activities
76.4%
48.8%
23.6%
51.2%
0% 10% 20% 30% 40% 50% 60% 70% 80% 90% 100%
経験なし(2,546)
経験あり(5,362)
支援体制がない(4,562)
支援体制がある(3,346)
( ): Frequency
N = 7,908
Support System Not Available (4,562)
Support System Available (3,346)
With Experience (5,362)
With No Experience (2,546)

44

45
The following graph shows the specific departments and staff for respondents that have a support
system for science communication activities in their affiliated organization. (Multiple Responses)
Fig. 22 Specific Departments and Staff
(Support System for Science Communication Activities is Available)
( ): Frequency
N = 3,346
76.2%
23.6%
55.8%
84.5%
5.7%
0% 10% 20% 30% 60% 70% 80% 90% 100%
science communication activi t ies (2,549)
Administrative Staff (789)
Teachers/Scientists (1,866)
Students (2,827)
Other (192)
S t a f f f r o m a s p e c i a l d e p a r t m e n t f o r
40% 50%

46
The following graph shows the items listed as specific work carried out as a support system for science
communication activities. (Multiple Responses)
Fig. 23 Specific Work of Support System for Science Communication Activities
(Support System for Science Communication Activities is Available)
( ): Frequency
N = 3,346
72.9%
60.1%
60.0%
57.0%
36.9%
35.7%
34.6%
29.2%
24.1%
23.2%
12.7%
9.9%
5.6%
0% 10% 20% 30% 40% 50% 60% 70% 80% 90% 100%
Work related to carrying out the activities (2,440)
Setting up and running the activities on the day (2,012)
Negotiating with external parties (2,006)
Planning the activities (1,907)
Recording/reporting on the carrying out of activities (1,235)
Securing participants (1,196)
Writing articles and press releases (1,159)
Raising funds (775)
Creating videos, illustrations, designs, etc. (425)
Education/training on skills
Other (189)
Evaluating the carrying out of activities (survey, etc.) (978)
(as master of ceremonies, introducing research, etc.) (806) Appearances
for carrying out of activities (330)

47
The following graph shows the funding sources for activities when there is a support system for science
communication activities available. (Multiple Responses)
Fig. 24 Funding Sources of Activities
(Support System for Science Communication Activities is Available)
( ): Frequency
N = 3,346
6.8%
19.1%
21.8%
14.5%
5.9%
10.1%
8.4%
23.7%
65.9%
0% 10% 20% 30% 40% 50% 60% 70% 80% 90% 100%
Universities and research institutes (2206)
Corporate donations (339)
Other donations (198)
From participants (486)
None (640)
Other (226)
(part of research expenses) (792) Competitive funds
(Science communication activities) (280) Competitive funds
Self-funded (731)

48
The following table shows the preferred training for science communication activities.
Table 7 Preferred Training (By Experience in Science Communication Activities)
Percent (%) 12.7% 19.6% 34.2% 23.8% 9.1% .5%
communication activities
Interactive, science cafes and workshops
Experience N=5,362
Press releases, press conferences
見
Experience N=5,362
No Experience
N=2,546
Working
with the press
Experience N=5,362
No Experience N=2,546
Media appearances on television
Experience
N=5,362
No Experience N=2,546
No Experience N=2,546
Special classes
Experience N=5,362
No Experience N=2,546
Open lectures, lecturer
presentations, symposiums and seminars
Experience N=5,362
No Experience
N=2,546
Research guidance for
Elementary,
Experience N=5,362
No Experience N=2,546
Items
Frequency 836 1029 1272 1473 705 47
Percent (%) 15.6% 19.2% 23.7% 27.5% 13.1% .9%
Frequency 228 403 552 907 448 8
Percent (%) 9.0% 15.8% 21.7% 35.6% 17.6% .3%
Frequency 870 1103 1379 1338 610 62
Percent (%) 16.2% 20.6% 25.7% 25.0% 11.4% 1.2%
Frequency 234 439 628 843 384 18
Percent (%) 9.2% 17.2% 24.7% 33.1% 15.1% .7%
Frequency 721 743 1177 1829 846 46
Percent (%) 13.4% 13.9% 22.0% 34.1% 15.8% .9%
Frequency 138 219 506 1152 523 8
Percent (%) 5.4% 8.6% 19.9% 45.2% 20.5% .3%
Frequency 729 827 1421 1644 682 59
Percent (%) 13.6% 15.4% 26.5% 30.7% 12.7% 1.1%
Frequency 160 263 674 1026 413 10
Percent (%) 6.3% 10.3% 26.5% 40.3% 16.2% .4%
Frequency 1082 1207 1681 939 392 61
Percent (%) 20.2% 22.5% 31.4% 17.5% 7.3% 1.1%
Frequency 399 600 842 493 206 6
Percent (%) 15.7% 23.6% 33.1% 19.4% 8.1% .2%
Frequency 978 1063 1540 1244 488 49
Percent (%) 18.2% 19.8% 28.7% 23.2% 9.1% .9%
Frequency 321 496 786 677 261 5
Percent (%) 12.6% 19.5% 30.9% 26.6% 10.3% .2%
Frequency 975 1068 1645 1141 459 74
Percent (%) 18.2% 19.9% 30.7% 21.3% 8.6% 1.4%
Frequency 324 500 871 606 231 14
at elementary, junior and senior high schools
With
With
With
With
With
With
With
With
With
With
With
With
With
With
No Response
for the
and radio, etc
Agree
disagree
nor disagree
Disagree
junior and senior high school students
general public
Experience in science
agree
Somewhat
Somewhat Neither agree
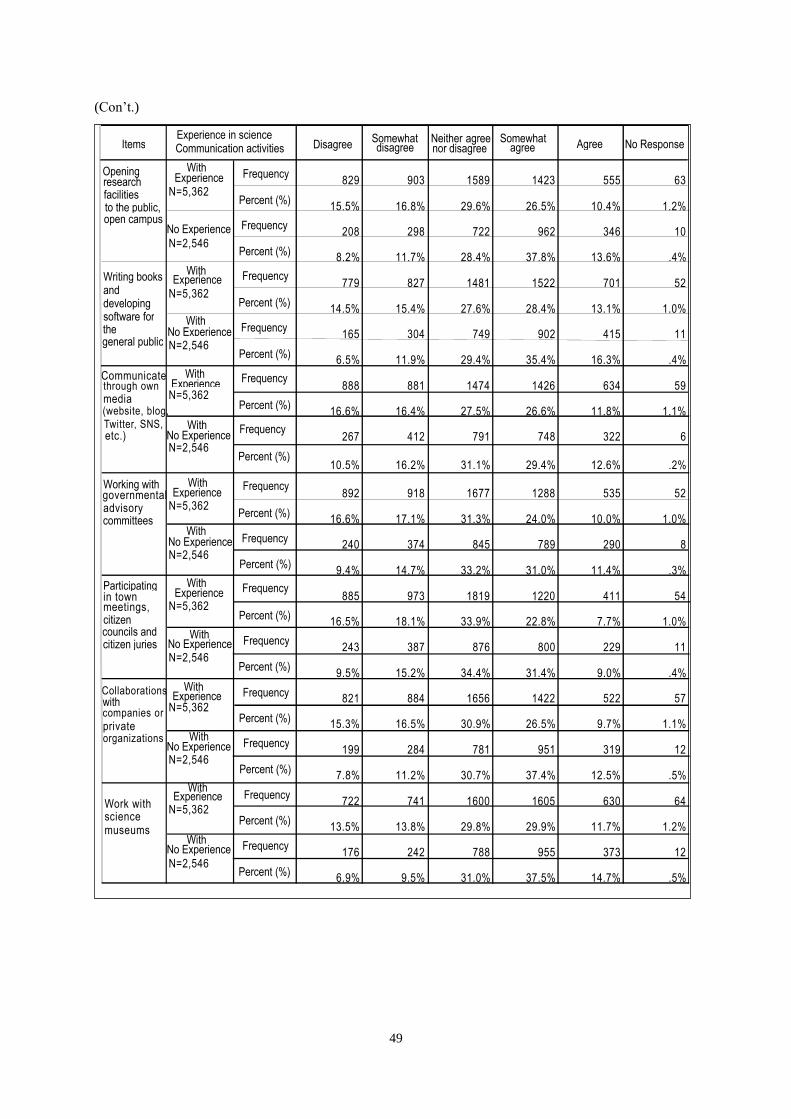
49
(Con’t.)
Items
Frequency 829 903 1589 1423 555 63
Percent (%)
15.5% 16.8% 29.6% 26.5% 10.4% 1.2%
Frequency 208 298 722 962 346 10
Percent (%)
8.2% 11.7% 28.4% 37.8% 13.6% .4%
Frequency 779 827 1481 1522 701 52
Percent (%) 14.5% 15.4% 27.6% 28.4% 13.1% 1.0%
Frequency 165 304 749 902 415 11
Percent (%)
6.5% 11.9% 29.4% 35.4% 16.3% .4%
Frequency 888 881 1474 1426 634 59
Percent (%) 16.6% 16.4% 27.5% 26.6% 11.8% 1.1%
Frequency 267 412 791 748 322 6
Percent (%)
10.5% 16.2% 31.1% 29.4% 12.6% .2%
Frequency 892 918 1677 1288 535 52
Percent (%) 16.6% 17.1% 31.3% 24.0% 10.0% 1.0%
Frequency 240 374 845 789 290 8
Percent (%) 9.4% 14.7% 33.2% 31.0% 11.4% .3%
Frequency 885 973 1819 1220 411 54
Percent (%) 16.5% 18.1% 33.9% 22.8% 7.7% 1.0%
Frequency 243 387 876 800 229 11
Percent (%) 9.5% 15.2% 34.4% 31.4% 9.0% .4%
Frequency 821 884 1656 1422 522 57
Percent (%) 15.3% 16.5% 30.9% 26.5% 9.7% 1.1%
Frequency 199 284 781 951 319 12
Percent (%) 7.8% 11.2% 30.7% 37.4% 12.5% .5%
Frequency 722 741 1600 1605 630 64
Percent (%) 13.5% 13.8% 29.8% 29.9% 11.7% 1.2%
Frequency 176 242 788 955 373 12
Percent (%) 6.9% 9.5% 31.0% 37.5% 14.7% .5%
Opening research facilities to the public,
N=5,362
No Experience
N=2,546
Communicate through own media
etc.)
open campus
Experience N=5,362
No Experience N=2,546
Writing books and developing software for
Experience N=5,362
No Experience
N=2,546
Participating in town
meetings, citizen
,
N=5,362
N=2,546
Working with governmental advisory
Experience N=5,362
No Experience N=2,546
Work with N=5,362
N=2,546
with companies or N=5,362
N=2,546
With No Experience
Experience With
No Experience With
Experience With
No Experience With
With
With
With Experience
With
With
With
With
With
Experience
No Response
the general public
committees
councils and
and
citizen juries
private organizations
Disagree
disagree
nor disagree
agree
Agree
Somewhat
Somewhat
(website, blog, Twitter, SNS,
Collaborations
Communication activities
science museums
Experience in science Neither
agree
agree

50
(Con’t.)
N = 7,908
Items No Response
Frequency 759 833 1693 1458 553 66
Percent (%) 14.2% 15.5% 31.6% 27.2% 10.3% 1.2%
197 322 828 882 303 14
Percent (%) 7.7% 12.6% 32.5% 34.6% 11.9% .5%
Frequency 798 793 1610 1513 594 54
Percent (%) 14.9% 14.8% 30.0% 28.2% 11.1% 1.0%
Frequency 193 314 843 875 310 11
Percent (%) 7.6% 12.3% 33.1% 34.4% 12.2% .4%
Frequency 839 886 1677 1365 518 77
Percent (%) 15.6% 16.5% 31.3% 25.5% 9.7% 1.4%
Frequency 217 357 897 798 264 13
Percent (%) 8.5% 14.0% 35.2% 31.3% 10.4% .5%
Frequency 640 694 1485 1700 780 63
Percent (%) 11.9% 12.9% 27.7% 31.7% 14.5% 1.2%
Frequency 165 304 824 902 333 18
Percent (%) 6.5% 11.9% 32.4% 35.4% 13.1% .7%
N=2,546
Participate in public activities
(science shops, community- based research, etc.)
With
N=5,362
No Experience
N=2,546
Outreach Activities
Knowledge on social issues,
systems and
laws
N=5,362
N=2,546
Knowledge on the history/ background of Science Outreach
N=5,362
N=2,546
Overview/ Introduction to Science Outreach
N=5,362
Experience in Science
Experience
With Frequency
With Experience
With Experience
With Experience
With
With
With
No Experience
No Experience
No Experience
Activities
Disagree
disagree
nor disagree
agree
Agree
Somewhat
Neither
agree
Somewhat
agree

51
Fig. 25 Preferred Training for Science Communication Activities of the With Experience Group
34.1%
31.7%
30.7%
29.9%
28.4%
27.5%
28.2%
26.6%
27.2%
26.5%
25.0%
26.5%
25.5%
24.0%
23.2%
22.8%
21.3%
17.5%
15.8%
14.5%
7.3%
8.6%
7.7%
9.1%
10.0%
9.7%
9.7%
11.4%
10.4%
10.3%
11.8%
11.1%
13.1%
11.7%
12.7%
13.1%
0% 10% 20% 30% 40% 50% 60% 70% 80% 90% 100%
一般むけ公開講座・講演会・シンポジウム・セミナー
社会的課題や制度、法律等に関する知識
サイエンスカフェ、ワークショップ等の参加型対話イベント
科学館・博物館等の活動への協力
一般向け書籍の執筆・ソフトウェアの作成
小中高等学校での出前授業、講演会
科学コミュニケーションの概論・入門
自身が管理する電子メディアでの発信(ホームページ、ブログ、ツイッター、SNS等)
市民との協働調査・研究(サイエンスショップ、コミュニティベースドリサーチ等)
研究室・施設の一般公開・オープンキャンパス
小中高校生むけの研究指導等
企業・民間団体向けの説明会・勉強会・情報交換会
科学コミュニケーションの歴史や背景などの知識
行政等のアドバイザリーや委員会等への提言・参加
テレビ・ラジオ・新聞等のマスメディアへの取材対応・協力
タウンミーティング・市民会議・市民陪審等への情報提供・参加
プレスリリース・記者会見
テレビ・ラジオ等のメディアへの出演
ややそう思う
そう思う
N = 5,362
science communication activities
citizen councils and citizen juries,
senior high school students
general public
Opening research facilities to the public, open campus
Research guidance for elementary, junior and
Collaborations with companies or private organizations
Knowledge on the history/background of
Working with governmental advisory committees
Working with the press
Participating in town meetings,
Press releases, press conferences
Media appearances on television and radio, etc.
(science shops, community-based research, etc.)
(website, blog, Twitter, SNS, etc.)
senior high schools etc., and giving lecture presentations
seminars for the general public Open lectures, lecture presentations, symposiums and
Knowledge on social issues, systems and laws
Interactive science cafes and workshops
Work with science museums
Writing books and developing software for the
Special classes at elementary, junior and
Overview/Introduction to Science communication Activities
Communicate through own media
Participate in public activities Slightly agree
Agree

52
Fig. 26 Preferred Training for Science Communication Activities of the With No Experience Group
45.2%
40.3%
35.6%
37.5%
35.4%
37.8%
37.4%
35.4%
33.1%
34.6%
34.4%
31.0%
31.4%
26.6%
23.8%
19.4%
20.5%
16.2%
17.6%
14.7%
31.3%
29.4%
16.3%
10.4%
12.6%
11.4%
12.2%
11.9%
15.1%
13.1%
12.5%
13.6%
9.0%
10.3%
9.1%
8.1%
0% 10% 20% 30% 40% 50% 60% 70% 80% 90% 100%
一般むけ公開講座・講演会・シンポジウム・セミナー
サイエンスカフェ、ワークショップ等の参加型対話イベント
小中高等学校での出前授業、講演会
科学館・博物館等の活動への協力
一般向け書籍の執筆・ソフトウェアの作成
研究室・施設の一般公開・オープンキャンパス
企業・民間団体向けの説明会・勉強会・情報交換会
社会的課題や制度、法律等に関する知識
小中高校生むけの研究指導等
市民との協働調査・研究(サイエンスショップ、コミュニティベースドリサーチ等)
科学コミュニケーションの概論・入門
行政等のアドバイザリーや委員会等への提言・参加
自身が管理する電子メディアでの発信(ホームページ、ブログ、ツイッター、SNS等)
科学コミュニケーションの歴史や背景などの知識
タウンミーティング・市民会議・市民陪審等への情報提供・参加
テレビ・ラジオ・新聞等のマスメディアへの取材対応・協力
プレスリリース・記者会見
テレビ・ラジオ等のメディアへの出演
ややそう思う
そう思う
N = 2,546
general public
Opening research facilities to the public, open campus
senior high school students Research guidance for elementary, junior and
Science communication Activities Knowledge on the history/background of
Press releases, press conferences
Media appearances on television and radio, etc.
senior high schools etc., and giving lecture presentations
seminars for the general public Open lectures, lecture presentations, symposiums and
Interactive science cafes and workshops
Work with science museums
Writing books and developing software for the
Special classes at elementary, junior and
Knowledge on social issues, systems and laws
Working with the press
Collaborations with companies or private organizations
Overview/Introduction to science communication
Activities
(science shops, community-based research, etc.) Participate in public activities
Slightly agree
Agree
citizen councils and citizen juries Participating in town meetings,
Working with governmental advisory committees
(website, blog, Twitter, SNS, etc.) Communicate through own media
activities

53
Fig. 27 Preferred Training
(By Experience in Science Communication Activities)
Special classes at elementary, junior and senior high schools
Research guidance for elementary, junior and senior high school students
Open lectures, lecture presentations, symposiums and seminars for the general public
Interactive science cafes and workshops.
23.7%
21.7%
27.5%
35.6%
13.1%
17.6% 9.0%
15.6%
15.8%
19.2%
.3%
.9%
0% 10% 20% 30% 40% 50% 60% 70% 80% 90% 100%
With Experience
N=5,362
With No Experience
N=2,546
25.7%
24.7%
25.0%
33.1%
11.4%
15.1%
16.2%
9.2%
20.6%
17.2%
1.2%
.7%
0% 10% 20% 30% 40% 50% 60% 70% 80% 90% 100%
22.0%
19.9%
34.1%
45.2%
15.8%
20.5%
13.4%
5.4%
13.9%
8.6%
0.9%
.3%
0% 10% 20% 30% 40% 50% 60% 70% 80% 90% 100%
26.5%
26.5%
30.7%
40.3%
12.7%
16.2%
13.6%
6.3%
15.4%
10.3%
1.1%
.4%
0% 10% 20% 30% 40% 50% 60% 70% 80% 90% 100%
With Experience
N=5,362
With No Experience
N=2,546
With Experience
N=5,362
With No Experience
N=2,546
With Experience
N=5,362
With No Experience
N=2,546
Neither agree
Somewhat disagree
Disagree
Somewhat agree
Agree
nor disagree
No Response
Neither agree
Somewhat disagree
Disagree
Somewhat agree
Agree
nor disagree
No Response
Neither agree
Somewhat disagree
Disagree
Somewhat agree
Agree
nor disagree
No Response
Neither agree
Somewhat disagree
Disagree
Somewhat agree
Agree
nor disagree
No Response

54
(Con’t.)
Working with the press.
Press releases, press conferences
Opening research facilities to the public, open campus
31.4%
33.1%
17.5%
19.4%
7.3%
8.1%
20.2%
15.7%
22.5%
23.6%
1.1%
.2%
0% 10% 20% 30% 40% 50% 60% 70% 80% 90% 100%
28.7%
30.9%
23.2%
26.6%
9.1%
10.3%
18.2%
12.6%
19.8%
19.5%
0.9%
.2%
0% 10% 20% 30% 40% 50% 60% 70% 80% 90% 100%
30.7%
34.2%
21.3%
23.8%
8.6%
9.1%
18.2%
12.7%
19.9%
19.6%
1.4%
.5%
0% 10% 20% 30% 40% 50% 60% 70% 80% 90% 100%
29.6%
28.4%
26.5%
37.8%
10.4%
13.6%
15.5%
8.2%
16.8%
11.7%
1.2%
.4%
0% 10% 20% 30% 40% 50% 60% 70% 80% 90% 100%
With Experience
N=5,362
With No Experience
N=2,546
With Experience
N=5,362
With No Experience
N=2,546
With Experience
N=5,362
With No Experience
N=2,546
With Experience
N=5,362
With No Experience
N=2,546
Neither agree
Somewhat disagree
Disagree
Somewhat agree
Agree
nor disagree
No Response
Neither agree
Somewhat disagree
Disagree
Somewhat agree
Agree
nor disagree
No Response
Neither agree
Somewhat disagree
Disagree
Somewhat agree
Agree
nor disagree
No Response
Neither agree
Somewhat disagree
Disagree
Somewhat agree
Agree
nor disagree
No Response
Media appearances on television and radio, etc.

55
(Con’t.)
Communicate through own media (website, blog, Twitter, SNS, etc.)
Working with governmental advisory committees.
Participating in town meetings, citizens councils and citizens juries
27.6%
29.4%
28.4%
35.4%
13.1%
16.3%
14.5%
6.5%
15.4%
11.9%
1.0%
.4%
0% 10% 20% 30% 40% 50% 60% 70% 80% 90% 100%
27.5%
31.1%
26.6%
29.4%
11.8%
12.6%
16.6%
10.5%
16.4%
16.2%
1.1%
.2%
0% 10% 20% 30% 40% 50% 60% 70% 80% 90% 100%
31.3%
33.2%
24.0%
31.0%
10.0%
11.4%
16.6%
9.4%
17.1%
14.7%
1.0%
.3%
0% 10% 20% 30% 40% 50% 60% 70% 80% 90% 100%
33.9%
34.4%
22.8%
31.4%
7.7%
9.0%
16.5%
9.5%
18.1%
15.2%
1.0%
.4%
0% 10% 20% 30% 40% 50% 60% 70% 80% 90% 100%
With Experience
N=5,362
With No Experience
N=2,546
With Experience
N=5,362
With No Experience
N=2,546
With Experience
N=5,362
With No Experience
N=2,546
With Experience
N=5,362
With No Experience
N=2,546
Neither agree
Somewhat disagree
Disagree
Somewhat agree
Agree
nor disagree
No Response
Neither agree
Somewhat disagree
Disagree
Somewhat agree
Agree
nor disagree
No Response
Neither agree
Somewhat disagree
Disagree
Somewhat agree
Agree
nor disagree
No Response
Neither agree
Somewhat disagree
Disagree
Somewhat agree
Agree
nor disagree
No Response
Writing books and developing software for the general public

56
(Con’t.)
Work with science museums
Participate in public activities (science shops, community-based research, etc.)
Overview/Introduction to science communication activities
30.9%
30.7%
26.5%
37.4%
9.7%
12.5%
15.3%
7.8%
16.5%
11.2%
1.1%
.5%
0% 10% 20% 30% 40% 50% 60% 70% 80% 90% 100%
29.8%
31.0%
29.9%
37.5%
11.7%
14.7%
13.5%
6.9%
13.8%
9.5%
1.2%
.5%
0% 10% 20% 30% 40% 50% 60% 70% 80% 90% 100%
31.6%
32.5%
27.2%
34.6%
10.3%
11.9%
14.2%
7.7%
15.5%
12.6%
1.2%
.5%
0% 10% 20% 30% 40% 50% 60% 70% 80% 90% 100%
30.0%
33.1%
28.2%
34.4%
11.1%
12.2%
14.9%
7.6%
14.8%
12.3%
1.0%
.4%
0% 10% 20% 30% 40% 50% 60% 70% 80% 90% 100%
With Experience
N=5,362
With No Experience
N=2,546
With Experience
N=5,362
With No Experience
N=2,546
With Experience
N=5,362
With No Experience
N=2,546
With Experience
N=5,362
With No Experience
N=2,546
Neither agree
Somewhat disagree
Disagree
Somewhat agree
Agree
nor disagree
No Response
Neither agree
Somewhat disagree
Disagree
Somewhat agree
Agree
nor disagree
No Response
Neither agree
Somewhat disagree
Disagree
Somewhat agree
Agree
nor disagree
No Response
Neither agree
Somewhat disagree
Disagree
Somewhat agree
Agree
nor disagree
No Response
Collaborations with companies or private organizations

57
(Con’t.)
Knowledge on social issues, systems and laws
31.3%
35.2%
25.5%
31.3%
9.7%
10.4%
15.6%
8.5%
16.5%
14.0%
1.4%
.5%
0% 10% 20% 30% 40% 50% 60% 70% 80% 90% 100%
27.7%
32.4%
31.7%
35.4%
14.5%
13.1%
11.9%
6.5%
12.9%
11.9%
1.2%
.7%
0% 10% 20% 30% 40% 50% 60% 70% 80% 90% 100%
With Experience
N=5,362
With No Experience
N=2,546
With Experience
N=5,362
With No Experience
N=2,546
Neither agree
Somewhat disagree
Disagree
Somewhat agree
Agree
nor disagree
No Response
Neither agree
Somewhat disagree
Disagree
Somewhat agree
Agree
nor disagree
No Response
Knowledge on the history/background of science communication activities

58
2-4 Impact of Government Policies on Scientist Involvement in Science Communication
Activities
This survey looked at government policies on science and technology, including science communication
activities, and the impact thereof.
First, we asked the respondents if they know of the government policy that states that “researchers who
have received a certain amount or more of national research funds are required to actively communicate
with the public on the content and results of their research activities” (4th Science and Technology Basic
Plan). The responses are as follows.
Table 8 Awareness of Government Policy
Fig. 28 Awareness of Government Policy
N = 7,908
26.2% 23.1% 5.1% 25.0% 20.6%
0% 20% 40% 60% 80% 100%
Didn’t know of
Didn’t really know of
Neither Yes or No
Somewhat know of
Know of
Didn’t know of 2069 26.2 Didn’t really know of 1830 23.1 Neither Yes or No 401 5.1 Somewhat know of 1979 25.0
Know of 1629 20.6
Total 7908 100.0
Frequency Percent (%)

59
The results of a cross tabulation of awareness of government policy and the total amount of annual
research grants to individuals showed a positive correlation between the total amount and awareness of
the government policy (i.e., the larger the amount, the greater the awareness).
Table 9 Cross Tabulation of Awareness of Government Policy and
Total Amount of Annual Research Grants to Individuals
The results of agreement with the abovementioned government policy are as follows.
Table 10 Agreement with Government Policy
Disagree 302 3.8
Somewhat disagree 556 7.0 Neither agree nor disagree 1442 18.2 Somewhat agree 3205 40.5 Agree 2403 30.4
Total 7908 100.0
Didn’t know of know of Yes or No know of Total
Frequency 9 11 1 32 57 110
Percent (%)
8.2% 10.0% 0.9% 29.1% 51.8% 100.0%
13 18 3 26 62 122
10.7% 14.8% 2.5% 21.3% 50.8% 100.0%
71 78 22 168 237 576
12.3% 13.5% 3.8% 29.2% 41.1% 100.0%
260 285 64 360 310 1279
20.3% 22.3% 5.0% 28.1% 24.2% 100.0%
855 834 173 854 609 3325
25.7% 25.1% 5.2% 25.7% 18.3% 100.0%
861 604 138 539 354 2496
34.5% 24.2% 5.5% 21.6% 14.2%
Less than
¥3 million
Annual Research Grants not in an individual’s
¥50 million or more
¥30 million
to ¥50 million
¥10 million to ¥30 million
¥3 million to ¥10 million
in an individual’s name Know of
Frequency
Percent (%)
Frequency
Percent (%)
Frequency
Percent (%)
Frequency
Percent (%)
Frequency
Percent (%)
100.0% name
Annual research grants Didn’t really Neither Somewhat
Frequency Percent (%)

60
Fig. 29 Agreement with Government Policy
N = 7,908
The results of carrying out science communication activities based on the abovementioned government
policy are as follows.
Fig. 30 Carrying Out Science Communication Activities Based on Government Policy
N = 7,908
11.5% 8.3% 65.6% 11.3%
3.3%
0% 20% 40% 60% 80% 100%
Not carrying out
Not really carrying out
Neither Yes or No
Somewhat carrying out
Carrying out
3.8%
7.0% 18.2% 40.5% 30.4%
0% 20% 40% 60% 80% 100%
Don’t agree
Somewhat don’t agree
Neither Yes or No
Somewhat agree
Agree

61
The results as to whether voluntary science communication activities by scientists has become the norm
are as follows.
Table 11 Voluntary Science Communication Activities by Scientists Has Become the Norm
Fig. 31 Voluntary Science Communication Activities by Scientists Has Become the Norm
N = 7,908
10.1% 29.4% 32.4% 25.1%
3.0%
0% 20% 40% 60% 80% 100%
Not become
Not really become the norm
Neither Yes or No
Somewhat
become the norm
Become the norm
the norm
Not become 802 10.1
Not really become the norm
2323 29.4
Neither Yes or No 2560 32.4
Somewhat become the norm 1984 25.1
Become the norm 239 3.0
Total 7908 100.0
the norm
Frequency Percent (%)

62
List of Figures and Tables
Fig. 1 Gender Ratio of Respondents .......................................................................................................... 1
Fig. 2 Ratio by Age.................................................................................................................................... 1
Fig. 3 Affiliated Organizations (Multiple Responses) ............................................................................... 1
Fig. 4 Employment Pattern (Multiple Responses) ..................................................................................... 1
Fig. 5 Position ............................................................................................................................................ 1
Fig. 6 Specialty Fields ............................................................................................................................... 1
Fig. 7 Annual Research Grants to Individuals ........................................................................................... 1
Fig. 8 Experience in Science Communication Activities (Number of Responses: 8,964) ........................ 1
Fig. 9 Experience in Science Communication Activities (Number of Valid Responses: 7,908) ............... 1
Fig. 10 Specific Content of Science Communication Activities (Multiple Responses) ............................ 1
Fig. 11 Impetus for Science Communication Activities ............................................................................ 1
Fig. 12 Objectives of Science Communication Activities (By Experience in Science Communication
Activities) ..................................................................................................................................................... 1
Fig. 13 Achievements of Science Communication Activities ................................................................... 1
Fig. 14 Barriers in Carrying Out Science Communication Activities (By Experience in Science
communication Activities) ....................................................................................................................... 1
Fig. 15 Barriers in Carrying Out Science Communication Activities of the With Experience Group
(Somewhat Think So, Think So) .......................................................................................................... 1
Fig. 16 Barriers in Carrying Out Science Communication Activities of the With No Experience Group
(Somewhat Think So, Think So) .......................................................................................................... 1
Fig. 17 Support for Promoting Science Communication Activities (By Experience in Science
communication Activities) ................................................................................................................... 1
Fig. 18 Support for Promoting Science Communication Activities Required by the With Experience
Group ................................................................................................................................................... 1
Fig. 19 Support for Promoting Science Communication Activities Required by the With No
Experience Group ................................................................................................................................ 1
Fig. 20 Existence of Support System for Science Communication Activities ........................................... 1
Fig. 21 Cross Tabulation of Existence of Science Communication Activities and Existence of Support
System for Science Communication Activities…………..43
Fig. 22 Specific Departments and Staff (Support System for Science Communication Activities is
Available) ..................................................................................................................................................... 1
Fig. 23 Specific Work of Support System for Science Communication Activities (Support System for
Science Communication Activities is Available) ................................................................................... 1

63
Fig. 24 Funding Sources of Activities (Support System for Science Communication Activities is
Available) ..................................................................................................................................................... 1
Fig. 25 Preferred Training for Science Communication Activities of the With Experience Group .......... 1
Fig. 26 Preferred Training for Science Communication Activities of the With No Experience Group .... 1
Fig. 27 Preferred Training (By Experience in Science communication Activities) .................................. 1
Fig. 28 Awareness of Government Policy ................................................................................................. 1
Fig. 29 Agreement with Government Policy ............................................................................................. 1
Fig. 30 Carrying Out Science Communication Activities Based on Government Policy ....................... 1
Fig. 31 Voluntary Science Communication Activities by Scientists Has Become the Norm .................... 1
Table 1 Experience in Science Communication Activities by Annual Research Grants to Individuals .... 1
Table 2 Impetus for Science Communication Activities ........................................................................... 1
Table 3 Objectives of Science Communication Activities (By Experience in Science communication
Activities) ..................................................................................................................................................... 1
Table 4 Achievements of Science Communication Activities .................................................................. 1
Table 5 Barriers in Carrying Out Science Communication Activities ..................................................... 1
Table 6 Support for Promoting Science communication Activities (By Experience in Science
Communication Activities) ..................................................................................................................... 1
Table 7 Preferred Training (By Experience in Science Communication Activities) ................................. 1
Table 8 Awareness of Government Policy ................................................................................................ 1
Table 9 Cross Tabulation of Awareness of Government Policy and Total Amount of Annual Research
Grants to Individuals ............................................................................................................................. 1
Table 10 Agreement with Government Policy .......................................................................................... 1
Table 11 Voluntary Science Communication Activities by Scientists Has Become the Norm ................. 1

Practical Research on the Science Communication Activities of Scientists in Universities and
Research Institutes
An Investigation into Scientist Involvement in Science
Communication Activities
July 2013
Center for Science Communication, Japan Science and Technology Agency
5-3, Yonbancho, Chiyoda-ku, Tokyo 102-8666, Japan
Telephone: 03-5214-7625
Fax: 03-5214-8088
http://csc.jst.go.jp/
No part of this publication may be reproduced, copied, transmitted or translated without written
permission. Applications for permission should be sent to [email protected]. Any quotations must be
appropriately acknowledged. ©2013 JST