AN INVESTIGATION INTO FACTORS THAT DETERMINE …
82
i AN INVESTIGATION INTO FACTORS THAT DETERMINE FINANCIAL PERFORMANCE OF INSURANCE COMPANIES IN KENYA BY MWANGI CALEB MUYA A RESEARCH PROJECT SUBMITTED IN PARTIAL FULFILMENT OF THE REQUIREMENTS OF THE AWARD OF THE DEGREE OF MASTER OF BUSINESS ADMINISTRATION UNIVERSITY OF NAIROBI 2013
Transcript of AN INVESTIGATION INTO FACTORS THAT DETERMINE …

i
AN INVESTIGATION INTO FACTORS THAT DETERMINE
FINANCIAL PERFORMANCE OF INSURANCE COMPANIES IN
KENYA
BY
MWANGI CALEB MUYA
A RESEARCH PROJECT SUBMITTED IN PARTIAL FULFILMENT
OF THE REQUIREMENTS OF THE AWARD OF THE DEGREE OF
MASTER OF BUSINESS ADMINISTRATION UNIVERSITY OF
NAIROBI
2013

ii
DECLARATION
This research project is my original work and has not been submitted for an award of a
degree in any other university.
............................................................................
Mwangi Caleb Muya
Reg No. D61/60444/2010
This research project has been presented for examination with our approval as the
University Supervisors.
............................................................................
Mr. James Nganga
Lecturer
Department of Finance and Accounting
University of Nairobi

iii
DEDICATION
I dedicate this work to my family for their love and support. To my parents Samuel (late)
and Fracha thank you for helping me to grow and realize my purpose in life; you have
been an inspiration to my life. To my sisters Rahab and Jane and my brothers John,
Simon and Jackson thank you for your moral support and encouragement. To my fiancée
Caroline thank you for unwavering support, encouragement and love. Your unconditional
sacrifice and prayers played a great role in the completion of my course and study. I will
always be grateful to you all
iv
ACKNOWLEDGEMENTS
First and foremost I wish to thank my supervisor Mr. James Nganga for his guidance
throughout this project. His immense contributions are immeasurable. I also wish to
thank my lecturers for their support throughout the course. I wish to thank the
management of the insurance companies and their employees for agreeing to participate
in this study. I also wish to thank my colleagues and friends for their continued support.
Lastly, I am highly indebted to my family for their moral and financial support since I
began the course.

v
TABLE OF CONTENTS
CONTENT PAGE
Title page...................................................................................................................i
Declaration...............................................................................................................ii
Dedication...............................................................................................................iii
Acknowledgements.................................................................................................iv
List of tables..........................................................................................................viii
List of figures..........................................................................................................ix
List of abbreviations.................................................................................................x
Abstract...................................................................................................................xi
CHAPTER ONE: INTRODUCTION
1.1Background ……................................................................................................1
1.1.1 The industry in Kenya………………………………………...................4
1.2 Statement of the problem...................................................................................7
1.3 Objectives of the study......................................................................................9
1.4 Research questions.............................................................................................9
1.5 Significance of the study...................................................................................9
CHAPTER TWO: LITERATURE REVIEW
2.1 Introduction......................................................................................................11
2.2 Global Insurance Industry................................................................................11
2.3 Theoretical framework…………………………………………………….....12
2.3 Determinants of financial performance of insurance companies......................13
2.3.1 Interest rate fluctuations and financial performance.....................................13
2.3.2 Profitability and its effects on insurer‘s financial performance….................16
2.3.3 Competition and its impact on insurance company performance..................19
2.3.4 Liquidity and its effects of insurer‘s financial performance……..................22
2.4 Conceptual framework.....................................................................................24
2.5 Empirical studies..............................................................................................24
2.6 Conclusion……………………………………..……………………………..27

vi
CHAPTER THREE: RESEARCH DESIGN AND METHODOLOGY
3.1 Introduction.....................................................................................................29
3.2 Research design...............................................................................................29
3.3 Target population.............................................................................................29
3.4 Sample size.......................................................................................................30
3.5 Data collection..................................................................................................30
3.6 Data analysis.....................................................................................................31
CHAPTER FOUR: DATA ANALYSIS, INTERPRETATION AND
PRESENTATION
4.1 Introduction......................................................................................................32
4.2 Questionnaire return rate..................................................................................32
4.3 Interest rate fluctuations and their effect on insurance company....................32
4.4 Profitability and its effect on insurance companies‘ financial performance....37
4.5 Competition and its effects on insurance company‘s financial performance...40
4.6 Liquidity and its effects on insurance companies‘ financial performance.......47
CHAPTER FIVE: SUMMARY, CONCLUSIONS AND RECOMMENDATIONS
5.1 Introduction......................................................................................................51
5.2 Summary of the study.......................................................................................51
5.3 Conclusions of the study...................................................................................56
5.4 Recommendations of the study.........................................................................58
5.5 Limitations of the study.....................................................................................58
5.6 Suggestions for further research.........................................................................59
REFERENCE...........................................................................................................60

vii
APPENDICES
Appendix I: Letter of introduction...........................................................................64
Appendix II:Questionnaire......................................................................................65
Appendix III: Insurance companies in Kenya..........................................................70

viii
LIST OF TABLES
Table 4.1 Effect of changes in interest rates on financial performance...................32
Table 4.2 Fluctuations in interest rates affect the financial performance ...............36
Table 4.3 Total valuation of assets owned by the insurance companies................37
Table 4.4 Extent to which company profitability affects financial performance....40
Table 4.5 Ways of ensuring that the company has market intelligence...................42
Table 4.6 Whether the company has an edge over competition..............................44
Table 4.7 Opinions regarding competition..............................................................45
Table 4.8 Liquidity of the company‘s investments.................................................47
Table 4.9 Company‘s financial strength to meet the ongoing clients‘ obligations.49
ix
LIST OF FIGURES
Figure 2.1 Conceptual framework...........................................................................24
Figure 4.1 What the company bases interest on......................................................34
Figure 4.2 Means of managing interest rate risks....................................................35
Figure 4.3 Total valuations of liabilities in the company........................................38
Figure 4.4 Measure of technology against that of competitors...............................41
Figure 4.5 Ways in which companies handle competition......................................43
Figure 4.6 Competition affects financial performance of the organization.............46
Figure 4.7 The company would sell investments to settle claims............................48
Figure 4.8 Company‘s source of funds during liquidity management....................48

x
ABBREVIATIONS AND ACRONYMS
IRIS: Insurance Regulatory Information System
IAS: International Accounting Standards
IASB: International Accounting Standards Board
GDP: Gross Domestic Product
GI: General Insurance
OECD: Organisation for Economic Co-operation and Development
OTC: Over the Counter
ROA: Return on Assets
ROE: Return on Equity
AKI Association of Kenya Insurers

xi
ABSTRACT
The purpose of this study was to investigate the factors that influence the financial
performance of insurance companies in Kenya. It looked in to some of the key factors
that determine financial performance and the extent to which they influence financial
performance of insurance companies. This study was conducted using a descriptive
survey design. The target population for this study comprised the 46 insurance companies
in Kenya. This study used systematic random sampling method to select the respondents.
The study used questionnaires as the tool for data collection. Data was analysed through
descriptive statistics and results presented in frequency tables, bar graphs and pie charts.
The findings of the study showed that fluctuations in interest rates affect the financial
performance of insurance companies both ways. This is because it affects the rate of
borrowing as well as the rate of return on investments. Profitability as an indicator of
financial performance enables insurance companies to invest in viable ventures while
avoiding the too risky ones. Competition was found to have an effect on insurance
company‘s financial performance especially through the prices and innovation in new
products. Liquidity affects financial performance of insurance companies and this is why
the insurance companies have liquid investments. These would help them to settle claims
especially if their underwriting income cannot cover claims. Majority of insurance
companies rely on cash flow from operations in liquidity management. Based on the
findings of this study, it is recommended that insurers should invest in financial analysts
so that they can gauge when interest rates can work in their favour in increasing their
income.

1
CHAPTER ONE
INTRODUCTION
1.1 Background
The past decade has seen a dramatic rise in the number of insolvent insurers. The
perceive causes of these insolvencies were myriad. Some of the insolvencies were
precipitated by rapidly rising or declining interest rates, mispricing of insurance policies,
natural catastrophes, changes in legal interpretations of liability and the filing of false
claims, poor credit policies among others. The ―churning‖ of polices by unscrupulous
sales agents, insolvencies among the re-insurers backing the policies issued, non
compliance with insurance regulation, and malfeasance on the part of officers and
directors of insurance companies affected as well (Baldoni, 2008). As a result of
globalization, deregulation and terrorist attacks, the insurance industry has gone through
a tremendous transformation over the past decade (Sanchez, 2006). There are many
factors to examine when looking at insurance companies. More than anything, both
consumers and investors should concern themselves with the insurer's financial strength
and ability to meet ongoing obligations to policyholders. Poor fundamentals not only
indicate a poor investment opportunity, but also hinder growth. Nothing is worse than
insurance customers discovering that their insurance company might not have the
financial stability to pay out if it is faced with a large proportion of claims
(Babbel&Klock, 1994).
2
Insurance companies sell protection to policyholders against many types of risks:
propertydamage or loss, health and casualty, financial losses, etc. In return for this risk
protection, insurancecompanies receive a premium from the policyholder that is used to
cover expenses and the expectedrisk. For longer-term risk protections, part of the
premiums is invested to get higher yields. Although the protection buyer mitigates the
individual risk to the large and better-diversifiedportfolio of the insurer, the risk is not
completely reduced because the insurer may default hisobligations. Insurers need to have
sufficient equity or buffer capital to meet their obligations inadverse conditions when
their losses on the diversified portfolio exceed the expected losses. Pottier (1998)
contends that this may affect the ability of the insurer to meet its obligations to
policyholders and debtholders.
The majority of research on life insurer performance has been in terms of identifying
those insurer-specific variables that aid in identifying insurers that are more likely to
become insolvent. Examining the life insurance industry, BarNiv and Hershbarger (1990)
found insolvent insurers tend to be smaller in size than solvent insurers and changed their
product mix more. Ambrose and Carroll (1994) found that financial variables combined
with IRIS ratios in a logistic regression model outperformed A.M. Best‘s
recommendations in distinguishing between insurers likely to remain solvent and those
insurers likely to become insolvent. Combining all three types of predictors into one
model provided the most accurate classification. Carson and Hoyt (1995) found that
surplus and leverage measures are strong indicators of insurer financial strength, and also
found a slightly higher risk of failure among stock insurers than mutual insurers.

3
Deakin(2005) examined the ―run on the bank‖ risk, and found that prior to 1992 rating
organizations generally did not appreciate the risks inherent in liabilities such as
guaranteed investment contracts. Cummins et al,(1999) showed that cash flow simulation
variables add explanatory power to solvency prediction models.
While insurance companies hold billions of shillings belonging to the general public,
including buyers of their products, retirement benefit schemes and funds managers,
information on these companies is scanty. For large consumers of insurance products, this
group usually relies on the expertise of qualified risk management consultants to offer
advice on where to place their insurance covers (Kumba, 2011). But it is the retail
consumer of insurance who is left to grope in the dark, constantly dazzled by overzealous
insurance agents, all trying to outdo each other in selling one product or the other. With a
shortage of qualified insurance sales people to sell products, the general public is left
without any basis on which to make an informed expenditure or investment decision on
which company to place their cover with (Kumba, 2011).
Owing to an apparent lack of uniform financial reporting formats, a number of insurance
companies have not published their profit and loss accounts, making it difficult for the
general public to gauge their profitability, overall written premiums or even their net
incomes. Companies using this format simply give a skeleton balance sheet, providing
little or no information to the public. The scanty financial statements, released to the
public by some companies, create a lot of grey areas and room for such unprofessional
activities as tax evasion and concealing of critical ratios and figures. Based on available

4
credit rating methods, profit combined with other ratios and computations can provide
useful indicators to anyone looking for a stable and financially sound insurance company
(Kumba, 2011). Other financial ratios, includes current ratio which simply shows how
fast an insurance company can settle a claim. These ratios are critical in determining the
financial strength and ability of any insurance company to settle claims and stay in
business. For those wishing to determine if their insurance company is failing, risk
management experts advice that one needs to calculate the Debt/Equity ratio, which is
total liabilities divided by shareholders equity. This ratio is also known as risk gearing
and shows the extent to which a company is financed by borrowed funds. Other ratios
include acid test ratios, which is liquid assets divided by current assets and the current
ratio. All the above ratios can determine whether it is safe to place a cover with the
insurance company,Kumba (2011), and whether the insurer is in a sound financial
position to settle claims; factors which are of great importance to the investors,
employees and policy holders.
1.1.1 The Insurance Industry in Kenya- An overview
The concept of insurance has been around Africa for a long time. Members of a
community pooled together resources to create a ―social insurance fund‖. The
―premiums‖ ranged material to material support or other payments in kind from the fund
―drawings were made out‖ to support a few unfortunate members exposed to perils.
However, the history of development of commercial insurance in Kenya is closely related
to the historical liberation of Kenya as a nation. With the conquest of Kenya as a British
colony, settlers initiated various economic activities, particularly farming, and extraction

5
of agricultural product. These, substantial investment needed some form of protection
against various risks exposures. British insurers saw an opportunity in this, and
established agency offices to service the colony‘s insurance needs. Prosperity in the
colony soon justified explanation of these agencies to branch networks with more
autonomy and expertise to service the growing insurance needs. By independence, most
of the branches had been transformed to fully fledged insurance companies. Since then,
insurance industry in has flourished (Maxon, 1993)
The statute regulating the industry is the Insurance Act; Laws of Kenya, Chapter 487
which was enacted in 1985. The office of the Commissioner of insurance was established
under these provisions to strengthen the government regulation on insurance. The
Commissioner of insurance was created as a department under the ministry of finance. In
order to enhance the supervisory capacity of the regulator, the government delinked the
department from the ministry to give it some autonomy. The insurance (amendment) Act
number 11 of 2006 established the Insurance Regulatory Authority (IRA) with the
commissioner of insurance as the managing director and the chief executive officer to
take the role of regulating, supervising and developing the insurance industry. This body
replaced the functions of the commissioner of insurance. The role of the authority is to
ensure effective administration, supervision, regulation and control of insurance ad re-
insurance business in Kenya(Insurance amendment Act, 2006). The authority is also
mandated o licence all persons involved in or connected with insurance business
including insurance and re-insurance companies, insurance and re-insurance
intermediaries, loss adjusters and assessors, risk surveyors and valuers. To protect the

6
interest of insurance policy holders and insurance beneficiaries in any contract of
insurance. To promote the development of the insurance sector and to advise the
government on the national policy to be followed in order to ensure adequate insurance
protection and security for national assets and national properties among other functions
(insurance act Cap 487). There is also a self regulation of the insurance by the
Association of Kenya Insurers (AKI). The professional body of the industry is the
Insurance Institute of Kenya (IIK), which deals mainly with training and professional
education. According to the (AKI) insurance industry report for the year 2010, there were
44 licensed insurance companies at the end of 2010. Twenty companies wrote non-life
insurance business only, nine wrote life insurance business only while fifteen were
composite (both life and non life). During the year 2010, there were 137 licensed
insurance brokers, 21 medical insurance providers (MIPs) and 3,076 insurance agents.
Other licensed players included 106 investigators, 57 motor assessors, 18 loss adjusters, 2
claims settling agents, 5 risk managers and 26 insurance surveyors during the year (AKI
Report, 2010).
The gross written premiums by the industry was Kshs. 64.47 billion compared to Kshs
55.19 billion in 2008, representing a growth of 16.8 %. The gross written premium in
non-life insurance was Kshs 43.11 billion (2008: Kshs 36.89 billion) while that from life
insurance business was Kshs 21.36 billion (2008: Kshs 18.30). Non-life insurance
premium grew by 16.8 % while life insurance premium and contributions from deposit
administration business grew by 16.7 %. The industry has consistently recorded growth
over the last seven years. Twenty non-life insurance companies made an underwriting

7
profit. The overall underwriting profit posted under non-life insurance was Kshs 413
million. Kenya is underinsured at penetration rate of 3% for a population of 40 millions
compares poorly with India at 4% penetration for a population of over a billion and
contrasts with South Africa with a penetration of 16% for a population of 50 millions.
This shows the importance of having a insurance sector which can add more to economic
development of the country, which signifies a huge potential for the insurance business in
country. From 2002, the insurance sector of Kenya shows a steady growth (Global Credit
Rating Agency, 2010).
1.2 Statement of the Problem
It has been noted that without the insurance sector, the economy and the wealth creation
associated with it can be adversely affected (International Accounting Standards Board,
2007). The insurance industry forms an integral part of the country‘s financial sector and
its benefits cannot be over-emphasized. If this crucial sector was missing, the
consequence on the economy would be devastating, knocking off billions of shillings
from the Gross Domestic Product (GDP) index. However, the insurance sector in Kenya
and other countries while providing critical interventions and creating wealth through
investments, has had a fair share of company collapses (Kumba, 2011; Greene, 2000 and
Hagel, Brown & Davison, 2010). Over the last one decade, a number of insurance
companies have closed shop and eventually liquidated. Most of these companies have
gone under with billions of shillings, in cash, belonging to policy holders, pension
schemes and life funds. This brings out the question of whether insurance companies are
financially sound and whether they are disclosing enough information to enable investors

8
make informed decisions. Obviously financial health is critical for any business
organization.
A number of studies have looked at the PSV insurance sector in Kenya. Omondi, (1988)
conducted a study on the operations of Kenya motor insurance pool (KMIP) 1985. The
studies sought to document operations of the KMIP and determine the attitudes of the
executives of the pool member companies towards it.Ramadhan (2009) investigated the
impact of the 2003 reforms on the PSV insurance sector in Kenya; case study of ―matatu‖
and concluded that the implementation of legal notice number 161 in 2003 by the
government influenced insurers practices with respect to underwriting and claims in the
PSV sector. More insurance company covering PSV face the risk of collapse unless
urgent measures are taken.Wekesa j. N., (2010). A task force appointed by IRA in 2008
observes that the current PSV underwriting system is unsustainable. Incidentally the task
force presented its report to IRA in March 13 2009, two days after the industry regulator
placed Standard Assurance Ltd under statutory management (Ondari, 2009)
Makembo(1992), investigated problems on the compensation system (fault system) for
personal injuries and deaths in motor insurance in Kenya. The study aimed at establishing
the problems and identifying the possible solutions to them. Jelala (1993) carried out a
study on motor theft implications on the underwriting practice in Kenya 1989 – 1992. A
survey of the credit policies on the insurance company in Kenya found out that
competing in the insurance industry is cut throat and firms have been forced to

9
differentiate themselves in order to survive in the long term. This explains the reason for
undercutting and introduction of credit facilities (Karanja, 2010)
No specific study that has however addressed the factors that determine financial
performance of the insurance companies in Kenya. This is a knowledge gap that the study
sought to fill. The study sought to answer the question what and how certain specific
factors determine performance of insurance companies in Kenya.
1.3 Objective of the study
The general objective of this study was to investigate the factors that influence the
financial performance of insurance companies in Kenya.
1.4 Research Questions
The study sought to answer the following research questions
a) What are some of the key factors that determine financial performance of
insurance companies?
b) To what extent do these factors influence the financial performance of insurance
companies?
c) What are the insurance companies doing to enhance or to mitigate the effect of
these factors determining their financial performance?
1.5 Significance of the study
1.5.1 Stakeholders

10
It is important for investors and stakeholders to know the financial position of their
insurance company and the factors which could be affecting it. These would enable them
to make the right decisions at the right time and cut their losses. It is therefore hoped that
this study would shed some light regarding them same.
1.5.2 Investors
The investors might benefit from the findings of this study by learning the factors which
could be affecting the financial performance of insurance companies. Resultantly, they
can be in a position to compare different companies and hence make the right decisions
before investing.
1.5.3 Policy holders
The findings of this study are hoped to give the policy holders a better understanding as
to why some insurance companies work hard against paying claims. Based on this, they
can understand that it is imperative to consider the financial position of an insurance
company before they buy policies, to establish the insurance companies which are viable
and the ones which are not.
1.5.4 Interested researchers
This study adds on to the literature on factors that determine the financial performance of
insurance companies and hence might shed some light to any interested researchers in
future.

11
CHAPTER TWO
LITERATURE REVIEW
2.1 Introduction
This chapter is structured based on the research objectives. It reviews relevant literature
available that focuses on factors that influence the financial performance of insurance
companies in Kenya. This chapter widely explores interest rates, profitability,
competition and liquidity and how these factors affect the financial performance of
insurance companies in Kenya.
2.2 Global insurance industry
The insurance industry forms an integral part of the global financial market, with
insurance companies being significant institutional investors. In recent decades, the
insurance sector, like other financial services, has grown in economic importance. This
growth can be attributed to a number of factors including, but not exclusively: Rising
income and demand for insurance, Rising insurance sector employment, and increasing
financial intermediary services for policyholders, particularly in the pension business
(Ward and Zurbruegg, 2002). Expanding on the link between GDP and insurance market
development, it must be remembered that the insurance industry‘s primary function is to
supply individuals and businesses with coverage against specified contingencies, by
redistributing losses among the pool of policyholders. Insurance companies, therefore,
engage in underwriting, managing, and financing risks.

12
2.3 Theoretical Framework
The concept of finance theories involves studying the various ways by which businesses
and individuals raise money, as well as how money is allocated to projects while
considering the risk factors associated with them. It also includes the study of money and
other assets, managing and profiling project risks, control and management of assets, and
the science of managing money (Eckardt, 2007). This study was guided by Rational
Choice Theory. This theory is used to understand the social and economic behaviours of
the individuals. The application of the term rationality varies with the subject. Many
other theories are concerned about the mechanism of the market that enables the
production and distribution of goods. But the Rational Choice Theory is extensively used
in applying the same principles that are used by other theories to understand interactions
that include resources like prestige, time and many more.
According to the Rational Choice Theory, human beings are prompted by their own goals
and preferences (Eckardt, 2007). Human actions are regulated primarily by the
information regarding the conditions under which a particular individual is going to work
and would try to achieve his or her goal. It is almost impossible for the human beings to
get whatever they desire for. Choice of goals along with the selection of a proper method
to reach the previously set target is very important in the domain of Rational Choice
Theory. According to the Rational Choice Theory, an individual should have a proper
understanding of his or her own selection of goals and the consequences of that selection.

13
Rational people always choose only those options that can offer good results. According
to the Rational Choice Theory, each and every kind of social contact or social interaction
is treated as a method of social exchange. It considers reward and punishment as benefit
and cost respectively and the theory holds that the human action is dominated by their
desires of getting good rewards (Organisation for Economic Co-operation and
Development, 2003).
This theory can be applied in the insurance industry. Individuals take policies in order to
be protected in case of risks. However, in order to get benefits from insurance, they must
have the right policies with the right companies. The rational choice for companies is
pegged on several factors like the financial performance of the insurance company. Most
individuals would not buy policies if they knew that their prospective company is going
bankrupt because in case of a risk, they would not get the benefits out of the policies.
They would therefore choose an insurance company which is performing well financially
because only then do they stand a chance of being compensated for their losses.
2.3.1 Interest Rate
An interest rate is the cost of borrowing money (Hoyt, 1994). Since insurance companies
make their promises or commitments to insurants at the time of the sale of policies to the
latter, they are not free to adjust the rates fixed or agreed in the sale subsequently
depending on circumstance. This feature of insurance exposes them directly to the risks
associated with changes in interest rates. Insurance companies invest much of the
collected premiums, so the income generated through investing activities is highly

14
dependent on interest rates. Declining interest rates usually equate to slower investment
income growth impacting on the insurance company‘s financial performance (Staking
&Babbel, 1995). Another downside to interest rate fluctuations (not exclusive to
insurance companies) is the cost of borrowing.
However, Schich (2008) contends that insurance companies may also benefit from rising
interest rates, because much of their profit is earned on the float, the period between
when premiums are collected and claims paid out. During this time, insurers invest the
premium. Rising interest rates imply a higher return on bonds, one kind of investment,
although higher rates lower the value of bonds currently in their portfolio. Large home
insurers benefit more than do smaller auto insurers.
It is argued that a continuing decline in market interest rates tends to make it more
difficult for insurance companies to provide high interest rates for their customers or
insurants and-as a result-to maintain hence high levels of profitability. This proposition
was tested in Taiwan over a period of declining market interest rates for insurance
companies. Flannery's (1981) model (quoted in Yang, 2007) was used to examine the
relations between changes in market interest rate and the profitability of 12 domestic
insurance companies. The results suggest that the effects of changes in interest rates on
insurance company profitability depend on how profits are measured, that it differs
depending on the profit indicator that is employed. This result is not apparent, with there
being no obvious influence of interest rates on profitability, if the entire insurance sector
is considered as a whole.
15
Yang (2007) argues that the extent of the fluctuations in interest rates does not have an
obvious impact on the income, cost, operating profit, or the assets return rate, net return
rate, operating profit margin, operating profit rate and net profit rate of the 12 sample
insurance companies, except in the case of the profitability indices for Cathay Life,
Central Insurance and First Insurance. This may have something to do with the length of
observation. When market interest rate fluctuations are taken into account, three of the
effects examined, those for insurance companies' profits on new assets, and two of the
effects, those for insurance companies' cost of liabilities, become significant, suggesting
that in these cases at least market interest rates may have an influence on the profits on
new assets of the insurance companies. Moreover, in the case of nine insurance
companies in the sample profits on new assets were higher than the cost of new liabilities,
suggesting that in these companies at least profits on new assets increase relatively
rapidly, bringing about a gradual increase on operating net profits to the insurance
companies concerned.
In a study of the relation between insurance market conditions and insolvencies, A. M.
Best(1992) found that the number of insolvencies is correlated with the accident and
health underwriting cycle (lagged one to three years). The increased number of
insolvencies also is correlated with increases in interest rates and the life-health insurance
industry‘s focus on investment-related products. The Best study did not examine the
various economic factors in a multivariate framework, thus precluding the ability to
identify the relative significance of the individual factors.

16
Changes in interest rates have a direct impact on the value of insurers. As interest rates
decline, the value of bonds in an insurer‘s portfolio rises, and vice versa. Staking and
Babbel (1995) note that one way insurers incur risk with their financial portfolio is by
holding assets with a longer duration than their liabilities. This mismatch creates an
interest rate risk since the magnitude of the change in the value of assets will be greater
than that of liabilities when interest rates move. When interest rates decrease, insurers
with this duration mismatch experience an increase in surplus. On the other hand, an
increase in interest rates leads to a larger decline in the value of assets than liabilities, and
thus a decrease in surplus. Young (1996) document a positive asset/liability maturity
mismatch for the majority of life insurers in their sample. The asset/liability mismatch
results in increased leverage and a greater risk of poor performance for the insurer
(Carson and Hoyt, 1995). Changes in interest rates are expected to be negatively related
to insurer performance.
2.3.2 Profitability
As with any company, profitability is a key determinant for deciding whether to invest.
For an insurance company, there are two components of profits that we must consider:
premium/underwriting income and investment income (Santomero&Babbel,
1997).Underwriting income is just that: any revenue derived from issuing insurance
policies. By averaging the premium's growth rates of several past years, you can
determine the growth trends. Growing premium income is a "catch 22" for insurance
companies. Ideally, you want the growth rate to exceed the industry average, but you
want to be sure that this higher growth does not come at the expense of accepting higher-

17
risk clients. Conversely, a company whose premium income is growing at a slower rate
might be too picky, looking for only the highest quality insurance opportunities. The one
thing to remember is that higher premium collections do not equate to higher profits.
Lower numbers of claims (via low risk clients) contribute more to the bottom line.
Santomero and Babbel (1997) contend that the second area of profitability that should be
included in the analysis is investment income. As mentioned earlier, a greater proportion
of an insurer's income comes from investments. To evaluate this area, take a look at the
company's asset allocation strategy (usually mentioned in the notes of the financial
statements). A majority of the assets should be invested in low-risk bonds, equities or
money market securities. Some insurers invest a substantial portion of their assets in real
estate. If this is so, take a look at what type of property it is and where it is located. A
building in Nairobi may be more liquid than one in Marsabit.
Return on Assets (ROA): Net Income + Interest Expense
Total Assets
ROA indicates the return a company is generating on the firm's investments/assets. In
general, a life insurer should have an ROA that falls in the 0.5-1% range.
Return on Equity (ROE): Net Income
Shareholder's Equity

18
ROE indicates the return a company is generating on the owners' investments. In the
policyholder owned case, you would use policy holders' surpluses as the denominator. As
a general rule for insurance companies, ROE should lie between 10-15%.
Lapse Ratio: Lapsed Life Insurance Specified Period
Contracts in Force (in effect) at Start of Specified Period
This ratio compares the number of policies that have lapsed (expired) within a specified
period of time to those in force at the start of that same period. It is a ratio used to
measure the effectiveness of an insurer's marketing strategy. A lower lapse ratio is better,
particularly because insurance companies pay high commissions to brokers and agents
that refer new clients.ROA, ROE, and the lapse ratios (discussed above) are also useful
for evaluating the profitability of the insurer. In order to determine whether management
has been increasing return for shareholders, the ROA and ROE numbers over the past
several yearsshould be calculated. The lapse ratio will help to tell whether the company
has managed to keep marketing expenses under control. The more policies that remain in
force (are not cancelled), the better
These views are supported by Hagel, Brown and Davison (2010) who proposed that most
economic analysts and investors tend to focus on return on equity as their primary
measure of company performance.ROE focuses on return to the shareholders of the
company. If you are a shareholder, this gives you a quick and easy to understand metric.
However, they argued that ROE can obscure a lot of potential problems. If investors are

19
not careful, it can divert attention from business fundamentals and lead to spiteful
surprises. Companies can resort to financial strategies to artificially maintain a healthy
ROE — for a while — and hide deteriorating performance in business fundamentals.
Growing debt leverage and stock buybacks funded through accumulated cash can help to
maintain a company's ROE even though operational profitability is eroding. Mounting
competitive pressure combined with artificially low interest rates, characteristic of the
last couple of decades, creates a potent incentive to engage in these strategies to keep
investors happy.Excessive debt leverage becomes a significant albatross for a company
when market demand for its products heads south, as many companies discovered during
the current economic downturn. It actually creates more risk for a company in hard times.
These efforts can become addictive. If underlying profitability continues to deteriorate,
more stock buybacks or debt leverage will be necessary to maintain return on equity,
further increasing company exposure to unanticipated downturns in consumer demand or
financial market crises. But letting ROE decline is often too painful to contemplate since
the impact on stock performance hence financial performance can be immediate. The
risks on the other side are less immediate and less quantifiable, so there is an
understandable temptation to avoid immediate pain (Hagel, Brown & Davison, 2010).
2.3.3Competition
One of the most significant trends in the insurance industry is the prevalence of mergers
and acquisitions among insurance carriers and agencies (Schich& Kikuchi, 2004). Due to
strong investment returns, record profits have allowed many carriers to amass substantial

20
"war chests" earmarked for acquisition. As a result, the large insurance companies are
getting larger and smaller agencies are being forced to band together in "clusters."In
addition, networks have become more competitive in an effort to improve their
bargaining position with carriers whose demands for profitable premium growth have
steadily increased. All of thesehave a major impact on consumers.
Over time economists have approached the measurement of competition in industries in
avariety of ways. The earliest studies attempted to infer the competitive conduct
andperformance of firms from the market structure of the industry. This approach is
mainlyassociated with Bain (1956) quoted in Hochhauser (2004). The number of firms
and any concentration of market shareare believed to determine the competitive conduct.
Fewer firms with more concentratedmarket shares are more likely to engage in anti-
competitive behaviour than when theindustry is populated by numerous small firms.
Alternatively, a small number of largecompanies may form a cartel and dictate prices and
conditions. Furthermore, one or twodominant firms may act as price setters while the
many smaller peripheral firms acceptthe formers‘ price leadership. This structure-
conduct-performance approach providesregulators with a convenient yardstick, when
they rule on thecompetitive impact of mergers.
Blundell-Wignall, Atkinsonand Lee (2008) proposed an alternative approach to
competitive behaviour and examined the revenue and coststructures of companies, using
the framework of perfect competition as the referenceposition. Firms in an industry
operating under conditions of perfect competition areunable to absorb any of the cost

21
increase. They are forced to pass on the entire rise ofinput costs in output prices and
revenue, leaving output unaffected. Of course, not allfirms survive. By contrast, under
monopolistic conditions in equilibrium, a rise in inputprices, such as wages or
administrative costs, results in a reduction in output and a rise inprices by a smaller
amount than the increase in costs, leading to a shrinking of totalrevenue. Marginally
profitable firms may have to leave the industry.
A group of firms offers a range of insuranceproducts. By differentiating their products
they are able to create downward slopingdemand curve segments for their insurance
products through advertising and other sellingcosts. The many competitors allow each
firm to believe that its actions will not promptretaliatory actions. Entry into the industry
is relatively easy and collusion such as pricefixing or market sharing virtually impossible
(Brigham & Philip, 2004). Under monopolistic competition in long-run equilibrium
output is determined where theaverage cost curve is tangential to the average revenue
curve. Companies do not makeeconomic profits since long-run average cost equals price.
Since firms produce at lessthan minimum cost, the theory of monopolistic competition
suggests that the industry isoperating under excess capacity. As a result more firms exist
than if production occurredat the average cost minimum. The market becomes
overcrowded. If productionoccurred at the long-run cost minimum, the return on assets
would, of course, be higher.
According to Donlon and Gutfreund (1998) firms in this industry generate revenue
through underwriting of insurance risks and frominvesting their assets. Market pressure
22
appears to force companies to employsimilar investment strategies enabling them to
match competitors' investment yields. Asthey record consistently underwriting losses,
that is, premium income falls short ofclaims payments and expenses, there is considerable
pressure on companies to generate satisfactory investment returns. Finance theory
suggests that a higher return from a givenamount of available funds may only be had by
investing in riskier assets. This impliesthat firms in the GI industry have to take greater
risk than would seem to be compatiblewith prudence, considering their underwriting
losses. Applied to the problem at hand thismeans that firms can only recoup rising costs
in investment markets by reshuffling theirportfolios towards more risky assets and thus
reap higher returns. The asset riskmaterializes in the form of market and credit risks
(O'Connor, 2000).
2.3.4 Liquidity
Black, Wright and Bachman (1998) define liquidity ratios as the amount of money that
companies and other private entities have on hand at any time available to pay their debt.
When looking at any company's financial statements and attempting to understand where
it stands as regards to its viability, liquidity ratios are quite important. The higher a
company's liquidity ratio, the healthier it is. Entities with high debt and low liquidity are
more likely to fail and riskier investments. Liquidity risk could include two different
types of risk: the risk that an insurance company will become unable to assure itself of
adequate funding due to a decline in new premium incomecaused by a deterioration, etc.
of its financial position, an increase in surrender value caused by large-lot cancellations,
or an outflow of funds caused by a big disaster, or it will incur lossesbecause it is forced

23
to sell assets at markedly lower prices than normal and therefore unable to maintain cash
flow (capital liquidity risk), and the risk that upheavals, etc. in the market willrender it
impossible to trade and therefore force the company to engage in transactions at prices
that are markedly more disadvantageous than normal (market liquidity risk) (Black,
Wright & Bachman, 1998).
According to Barney (1997) the first test of an insurer's ability to meet financial
obligations is the acid test. It tests whether a firm has enough short-term assets (without
selling inventory) to cover its immediate liabilities. Poor liquidity causes investment
losses and hence poor financial performance when the insurer must sell assets
prematurely to cover claims. An insurer should almost always have a positive cash flow.
Cash flow is crucial to an entity's survival. Having ample cash on hand will ensure that
creditors, employees and others can be paid on time. If a business or person does not have
enough cash to support its operations, it is said to be insolvent, and a likely candidate for
bankruptcy should the insolvency continue. Other things to keep an eye on are the
investment grades of the company's bond portfolio. Too many high and medium risk
bonds could lead to instability hence poor financial health.

24
2.4 Conceptual framework
The study is conceptualised as follows
Source: Researcher, 2012
2.5Empirical studies
Sigma (2001) contends that the largest insurance sectors are to be found in the United
States and Japan, which together generate more than 50 percent of global premium
income, followed by the United Kingdom, Germany, France, and Italy. Furthermore,
during the last four decades the global insurance sector has on average outpaced global
economic growth. Between 1984 and 2001, the global insurance industry grew with an
annual growth rate of 9.7 percent (roughly comprised of 11.8 percent from the life
insurance sector, and 7.5 percent from the property–casualty sector). Over the last few
years, growth in the global property–casualty market has significantly slowed down and
has only grown in line with general economic growth (Sigma, 2001). This development is
mainly due to the sustained downward trend in commercial business experienced until
Profitability in insurance companies
Interest rate fluctuations in insurance
companies
Liquidity in insurance companies
Financial performance of
insurance companies Competition in insurance industry
Dependent variable Independent variables
25
recently, the economic and financial crisis in Asia, particularly in Japan, and the
deregulation of the European market resulting in appreciable price decreases. This is in
contrast to the life insurance sector, which has continued to grow at around 5.4 percent
across the world since 2000. The increase in the life insurance business is mainly
attributable to the increased demand for private pension provisions in the United States
and Western Europe and the soaring demand for unit-linked products. Measured in total
premiums, OECD countries accounted for 95.52 percent and 93.99 percent of the life
insurance business, and 91.19 percent and 92.50 percent of property– casualty premium
volume in 1994 and 2001, respectively.
A more recent development has been the strengthening of global market share among
emerging economies, with premium growth rates inside such economies often reaching
double-digit figures. Furthermore, insurance markets within the OECD countries have
faced falling premium income, reduced capital market yields, and low interest rates, all of
which have put insurers under some pressure (Sigma, 2002). Also, the growing
importance of the insurance industry in emerging markets is reflected in growing
insurance density and insurance penetration of the non-OECD insurance markets (Sigma,
1996, 2001). Nevertheless, emerging markets still have some way to go before matching
the relative sizes and importance that the insurance industry has in industrialized
countries.
A comprehensive policy that is effectively implemented enables the financial institutions
to maintain sound credit underwriting standards; asses, monitor and control credit risks;

26
properly evaluate new business opportunities and identify administer and collect problem
credits (Baldoni, 2008).
The credit policy should specify credit risk philosophy governing the extent to which
institution is willing to accept credit risk; levels of authority should be subject to timely
review to ensure that it remains appropriate to current market conditions and expertise of
credit officers. A credit policy should be drawn up to give consistency to process and
procedures. The policy should be communicated to all those involved with customer
terms and payments including sales agents so that they can set the correct expectations
with customers. An effective credit control policy should deal with mechanisms for
approving credit for new customers, mechanisms for approving credit ratings and terms
for new customers and procedures for taking against customers and procedures where
premium due is not paid.
Credit policies should also incorporate criteria to allow business to determine the
conditions of sale to be issued to customer. Business may require to devise different
conditions of sale to be issued depending on the risk involved with offering the customer
credit payment terms and conditions, interest payable to be applied to accounts which
become overdue, details of any cash discounts, details of assessing which credit ratings
should apply to customers details of when accounts will be frozen and recovery action
taken thereafter details of the stage of which legal action should be raised against the
debtor, whether or not credit data from external sources should be investigated and
whether credit insurance should be taken out.
27
2.6 Conclusion
The study investigated the factors influencing the financial performance of insurance
companies. While there are many factors which influence the financial performance of
insurance companies, this study was delimited to four factors; interest rate fluctuations,
profitability, competition and liquidity.
Past studies show that interest rate changes affects insurance companies financial
performance both ways. Yang (2007); Staking and Babbel (1995); A. M. Best (1992);
Young (1996) and Carson and Hoyt (1995) claimed that changes in interest rates affect
the insurance companies negatively. However, Schich (2008) found out that fluctuations
in interest rates could have a positive effect on the financial performance of insurance
companies.
In relation to profitability, Santomero and Babbel (1997) and Hagel, Brown and Davison
(2010) found a positive relationship between insurance companies‘ profitability and their
financial performance. Competition was also found to affect the financial performance of
insurance by Schich and Kikuchi (2004); Hochhauser (2004); Blundell-Wignall,
Atkinson and Lee (2008); Brigham and Phillip (2004) and Danlon and Gutfreund (1998).
In relation to liquidity, Barney (1997) and Black, Wright and Bachman (1998) found a
positive relationship between liquidity and the financial performance of insurance
companies. The past studies are not consistent; consequently, this study will reconcile
them as well as establish the extent to which these factors influence the financial

28
performance of insurance companies in Kenya. The study will also expound on the local
studies done by people like Maina (2003) Karuiru (2005) to cover other factors which
could be affecting the financial performance of insurance companies.

29
CHAPTER THREE
RESEARCH DESIGN AND METHODOLOGY
3.1 Introduction
This chapter deals with the research methodology in the study. This includes the research
design, target population, sampling, data collection, and data analysis.
3.2 Research Design
This study was conducted using a descriptive survey design. The survey is a non-
experimental, descriptive research method. It is the collection of information from a
common group through interviews or the application of questionnaires to a representative
sample of that group. This design was preferred because very large samples are feasible,
making the results statistically significant even when analyzing multiple variables.
Surveys are useful in describing the characteristics of a large population. Additionally,
high reliability is easy to obtain by presenting all subjects with a standardized stimulus
which ensures that observer subjectivity is greatly eliminated (Mugenda&Mugenda,
1999).
3.3 Target population
The target population for this study comprised the 46 insurance companies in Kenya
(Appendix III). The respondents were the top level management of these companies.

30
3.4 Sample Size
Sampling is the process of selection of appropriate number of subjects from a defined
population (Kothari, 2008). This study used systematic random sampling method.
Mugenda and Mugenda (1999) contend that a 10% sample can be used to represent a
population. However, they argued that the bigger the sample, the more representative of
the population it is. In this case, 50% of the insurance companies were selected and it is
from these that the respondents were drawn. From each insurance company, two top
management and three lower level managers were randomly selected. This gave a total of
115 respondents.
3.5 Data Collection
The study used questionnaires as the tool for data collection. A questionnaire is a
research instrument consisting of a series of questions and other prompts for the purpose
of gathering information from respondents (Mugenda&Mugenda, 1999). The researcher
opted for the questionnaire because the responses are gathered in a standardised way, so
questionnaires are more objective compared to other tools of data collection. It is also
relatively quick to collect information using a questionnaire. Additionally, potential
information can be collected from a large portion of a group (Kothari, 2008). The
questionnaires were administered to the respondents through drop and pick method. The
filled questionnaires were picked four days after. The drop and pick approach was
considered an appropriate method for the study because it gave the respondents time to
fill the questionnaire and allowed the researcher an opportunity to review the
questionnaires before picking them to ensure completeness of responses. Secondary data

31
on the performance of insurance companies was collected over a period of five years
from the audited annual reports and accounts of the concerned insurance company in
order to provide a good period for analysis.
3.6 Data Analysis
The questionnaires were checked for completeness in preparation for analysis. The
simplest way to present information according to Ngechu (2006) is in descriptive
statistics. Data was appropriately coded for ease of use with Statistical Package for Social
Sciences (SPSS). Using the SPSS program can give such descriptive statistics and
therefore the program is much appropriate for the analysis. Descriptive statistics enabled
the researcher to meaningfully describe a distribution of scores or measurements using a
few indices or statistics (Kothari, 2008). The qualitative data was analysed through
content analysis. Each research question has quantitative and qualitative data. For the
quantitative data, the responses were coded, tallied and their frequencies and percentages
identified. For the qualitative data, similar responses werecoded and tallied after which
deductions were made. In determining the factors, the study will used factor analysis
method.
Model, Y = f(C+L+P+I)
Where;
Y=Financial performance C=Competition
L=Liquidity P=Profitability
I=Interest rate
32
CHAPTER FOUR
DATA ANALYSIS, INTERPRETATION AND PRESENTATION
4.1 Introduction
This chapter presents data analysis, interpretation and the presentation. These are based
on the objectives of the study.
4.2 Questionnaire Return Rate
Out of the 115 respondents who were given the questionnaires, 106 returned completely
filled questionnaires. This gave a 92.2% response rate.
4.3 Interest rate fluctuations and their effect on insurance company
In order to fulfil this objective, several items were used as discussed in the following
paragraphs
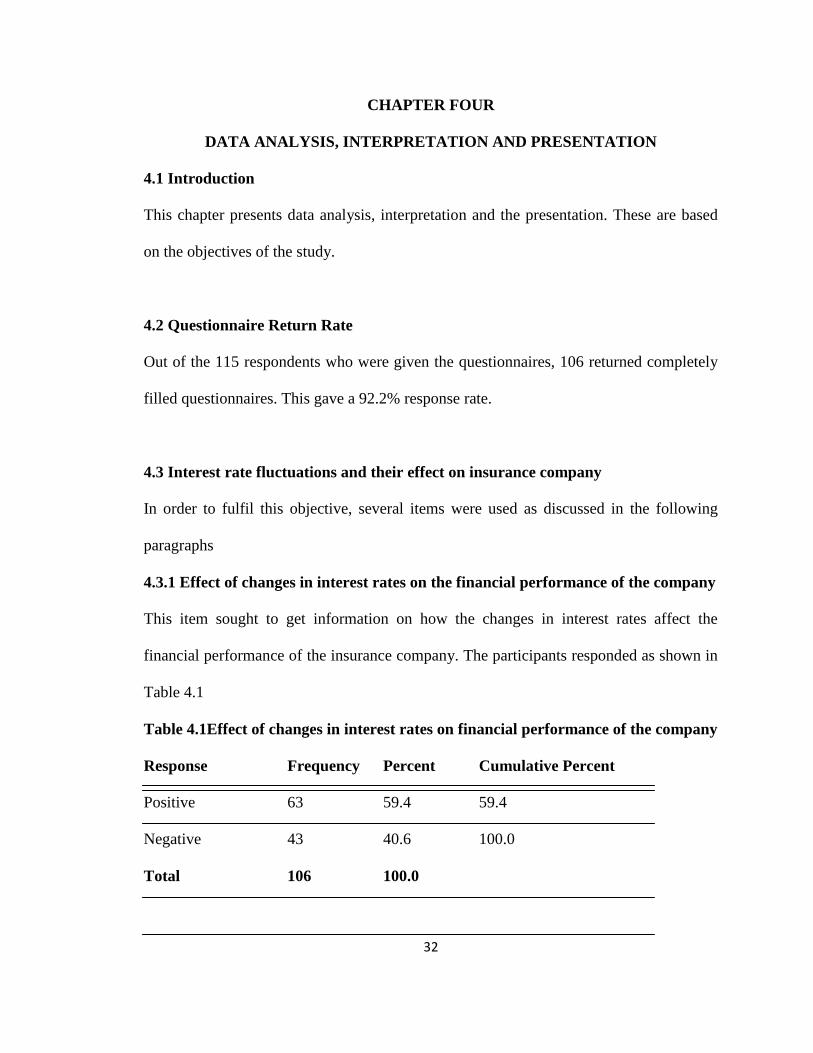
4.3.1 Effect of changes in interest rates on the financial performance of the company
This item sought to get information on how the changes in interest rates affect the
financial performance of the insurance company. The participants responded as shown in
Table 4.1
Table 4.1Effect of changes in interest rates on financial performance of the company
Response Frequency Percent Cumulative Percent
Positive 63 59.4 59.4
Negative 43 40.6 100.0
Total 106 100.0

33
As indicated in Table 4.1, majority of the participants reported that changes in interest
rates affect the financial performance of the insurance companies positively. This is
mainly because low interest rates on borrowing enable insurersto borrow and invest more
in higher risk areas thus improving their investments and financial performance. The
respondents who said that changes in interest rates have a negative effect on the financial
performance of the insurance companies said that high interest rates affect the insurance
companies‘ ability to borrow and invest. However, high interest rates increase the return
on investments for example; rising interest rates imply a higher return on bonds, one kind
of investment, although higher rates lower the value of bonds currently in their portfolio.
These findings therefore imply that fluctuations in interest affect the financial
performance of insurance companies both ways.
4.3.2 What the company bases interest on
The participants were asked what their insurance companies base their interest on. They
responded as indicated in Figure 4.1
34
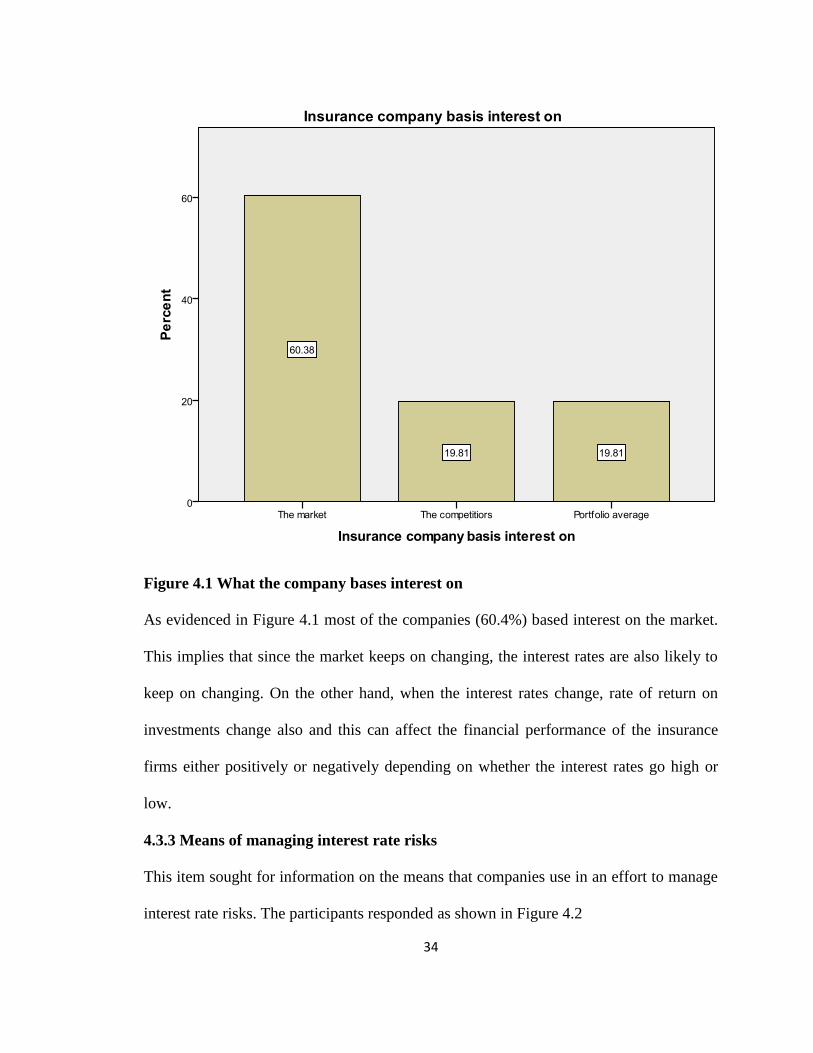
Figure 4.1 What the company bases interest on
As evidenced in Figure 4.1 most of the companies (60.4%) based interest on the market.
This implies that since the market keeps on changing, the interest rates are also likely to
keep on changing. On the other hand, when the interest rates change, rate of return on
investments change also and this can affect the financial performance of the insurance
firms either positively or negatively depending on whether the interest rates go high or
low.
4.3.3 Means of managing interest rate risks
This item sought for information on the means that companies use in an effort to manage
interest rate risks. The participants responded as shown in Figure 4.2

35
Figure 4.2Means of managing interest rate risks
As indicated in Figure 4.2, majority of the respondents (40.6%) reported that their
insurance companies usedfutures to manage interest rate risks. The other 39.6% used
exchange traded instruments while 19.8% used derivatives markets. This implies that all
insurance companies are aware of the risks which come as a result of fluctuations in
interest rates.That is why they have ways of managing such risks. This is all because
interest rates can affect the financial performance of a company.

36
4.3.4 Measures used by companies to profit from changes in interest rates
When asked the kind of measures that the insurance companies use in order to profit from
changes in interest rates, the participants reported that companies diversify their
investment portfolio through buying bonds, investing in property, equity, shares as well
as increasing their borrowed capital when rates fall. All these measures are done to
improve the financial performance of the insurance companies.
4.3.5 Extent to which fluctuations in interest rates affect the financial performance
of insurance companies
In response to the extent to which fluctuations in interest rates affect the financial
performance of insurance companies, the participants‘ responses were as indicated in
Table 4.2
Table 4.2Extent to which fluctuations in interest rates affect the financial
performance of insurance companies
Response Frequency Percent Cumulative Percent
Great extent 63 59.4 59.4
Moderate extent 43 40.6 100.0
Total 106 100.0
According to Table 4.2, majority of the respondents (59.4%) were of the opinion that
fluctuations in interest rates affect the financial performance of insurance companies. No
respondent indicated that changes in interest rates had no effect on the performance of
insurance companies. This means if the interest rates increase, insurance companies may
decline investments as they try to cut their costs. This would make their financial
performance decrease. On the other hand, decrease in interest rates may promote the rate
37
of borrowing as well as investments thus improving the financial performance of
insurance companies.
4.4 Profitability and its effect on insurance companies’ financial performance
In order to meet this objective, several items were used as discussed in the following
paragraphs.
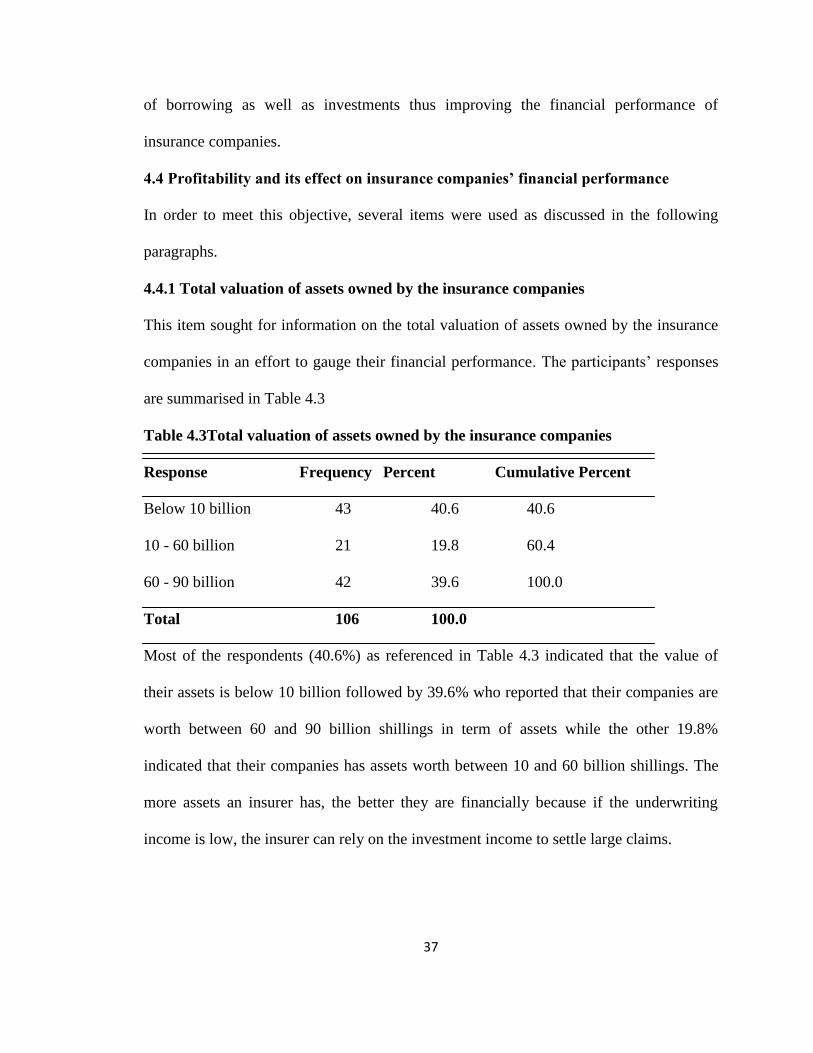
4.4.1 Total valuation of assets owned by the insurance companies
This item sought for information on the total valuation of assets owned by the insurance
companies in an effort to gauge their financial performance. The participants‘ responses
are summarised in Table 4.3
Table 4.3Total valuation of assets owned by the insurance companies
Response Frequency Percent Cumulative Percent
Below 10 billion 43 40.6 40.6
10 - 60 billion 21 19.8 60.4
60 - 90 billion 42 39.6 100.0
Total 106 100.0
Most of the respondents (40.6%) as referenced in Table 4.3 indicated that the value of
their assets is below 10 billion followed by 39.6% who reported that their companies are
worth between 60 and 90 billion shillings in term of assets while the other 19.8%
indicated that their companies has assets worth between 10 and 60 billion shillings. The
more assets an insurer has, the better they are financially because if the underwriting
income is low, the insurer can rely on the investment income to settle large claims.
38
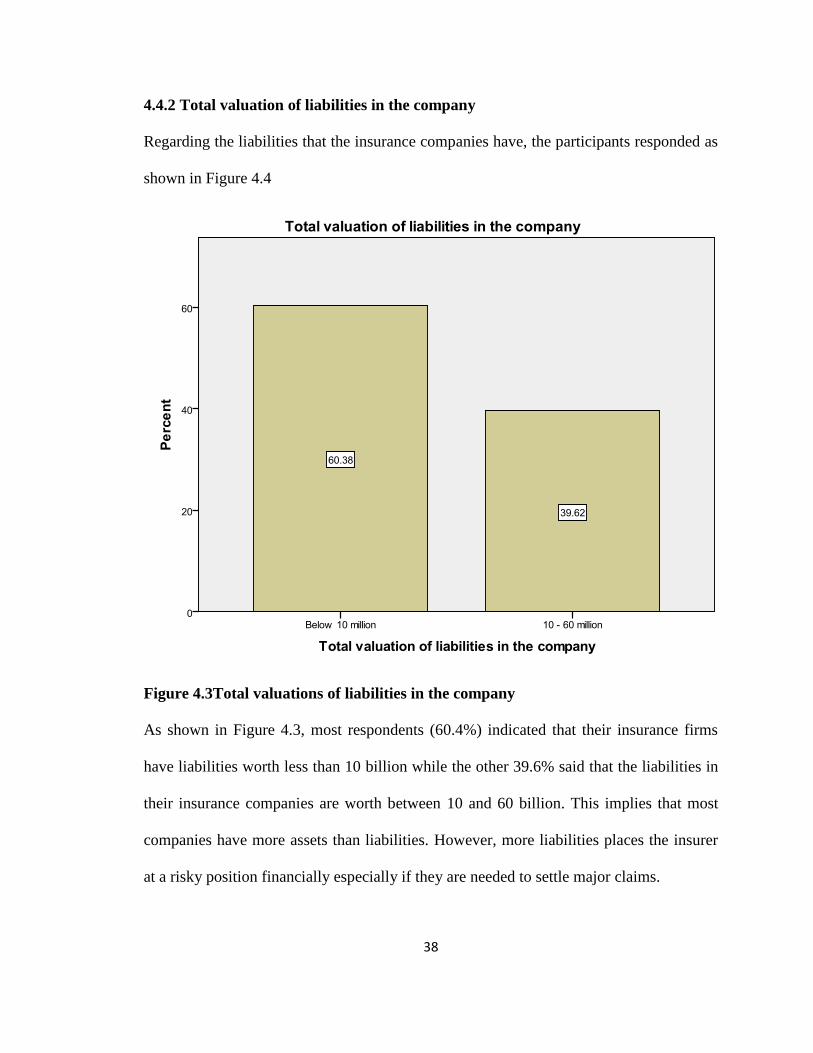
4.4.2 Total valuation of liabilities in the company
Regarding the liabilities that the insurance companies have, the participants responded as
shown in Figure 4.4
Figure 4.3Total valuations of liabilities in the company
As shown in Figure 4.3, most respondents (60.4%) indicated that their insurance firms
have liabilities worth less than 10 billion while the other 39.6% said that the liabilities in
their insurance companies are worth between 10 and 60 billion. This implies that most
companies have more assets than liabilities. However, more liabilities places the insurer
at a risky position financially especially if they are needed to settle major claims.

39
4.4.3 Whether the company has performance indicators to gauge business
On being asked whether their insurance companies have performance indicators for
gauging business, 60.4% said yes while the other 39.6% said no. For the companies
whose respondents reported that they have performance indicators, they said that they
mainly use KPI‘s, targets, benchmarking, claims, operational costs, new businesses,
return on investment and profits. This is an indication that most insurance companies are
aware of the way they are performing financially hence they can take appropriate
measures when their financial performance goes down. For the insurance companies with
no performance indicators, it is difficult to know when they are performing well or
poorly. The implication is that they may not know when it is necessary to make drastic
financial decisions depending on the market. This can have a negative effect on the
financial performance of the insurance companies.
4.4.4 Trend of profitability in the company in the last one financial year
On the trend of profitability in the company in the last one financial year, all the
respondents indicated that it has been on the increase. This could be because the economy
in the country is also growing. The participants were asked whether their insurance
companies have any specific investment preference. All of them said that they do. The
most preferred investment was real estate and mortgage industry. These companies try to
avoid investing in the stock market mainly because of the uncontrolled return trends. The
findings show that the insurance companies mind their profitability by investing in the
viable ventures while avoiding the too risky ones. This is evidence that profitability
affects the financial performance of the insurance companies.

40
4.4.5 Extent to which company profitability affects its financial performance
This item sought for information to gauge the extent to which company profitability
affects its financial performance. The responses are summarised in Table 4.4
Table 4.4Extent to which company profitability affects its financial performance
Response Frequency Percent Cumulative Percent
Great extent 84 79.2 79.2
Moderate extent 22 20.8 100.0
Total 106 100.0
According to Table 4.4, 79.2% of the respondents were of the opinion that company
profitability affects its financial performance to a great extent. The other 20.8% reported
that it affects company‘s financial performance to a moderate extent. This is an indication
that company‘s profitability has an effect on the financial performance of the said
company.
4.5 Competition and its effects on insurance company’s financial performance
In order to fulfil this objective, the study used several items as discussed in the following
paragraphs.
4.5.1 Knowledge on current activities about the competitors
All the respondents indicated that they have knowledge on the current activities about the
competitors. With knowledge of competitors‘ current activities, insurers can take
measures to match up or improve their products and services beyond their competitors in
order to gain a competitive edge.

41
4.5.2 Measure of technology against that of competitors
On being asked how the company‘s technology measures against that of the competitors,
the participants responded as shown in Figure 4.4
Figure 4.4Measure of technology against that of competitors
According to Figure 4.4, 40.6% of the respondents reported that the technology in their
insurance is neck to neck with that of their competitors while 19.8% said they are ahead
of competition in terms of technology. The other 39.6% admitted that the competition is
ahead of them technology-wise. Being ahead of competition gives an insurer a
competitive edge and this would be the aim of most insurers because they are in business
to make money. However, being behind in technology can make an insurer lose

42
customers especially the ones who prefer the convenience that comes with the use of
technology.
4.5.3 Ways of ensuring that the company has the necessary market intelligence
The respondents were asked to indicate what their organization does in order to have the
necessary market intelligence for gauging competition. They responded as shown in
Table 4.5
Table 4.5Ways of ensuring that the company has the necessary market intelligence
Response Frequency Percent Cumulative Percent
Market research 42 39.6 39.6
Competitor's advertisement 42 39.6 79.2
Others 22 20.8 100.0
Total 106 100.0
As shown in Table 4.5, 39.6% of the respondents reported that the insurance companies
use market research while another 39.5% said they use competitor‘s advertisement. The
other 20.8% use customers‘ feedback. This implies that insurers are aware that
competition can reduce their market share hence their financial performance and that is
why they get ways of gauging competition.
4.5.4 Whether the company encourages clients to give them feedback
On whether the company encourages clients to give them feedback regarding the quality,
price, packaging or placement of their products or services, all the respondents said yes.
The companies achieve this through maintaining complaints and compliment registers
while others have a customer experience unit that embark on gauging the satisfaction
their clients receive. Other insurance firms organize agents for forums on the same. This

43
is an indication that the insurance companies care about their customers and they try to
keep them coming back by ensuring that they are satisfied. This is a way of staying ahead
of competition hence improving financial performance.
4.5.5 Ways in which companies handle competition
On how the companies handle competition, the participants responded as shown in Figure
4.5
Figure 4.5Ways in which companies handle competition
As shown in Figure 4.5 most of the companies (52.8%) handle competition through
paying claims on time, 34.0% do research in order to stay ahead of competition while
13.2% use innovation to come up with products that are in tandem with the clients‘

44
needs. This is an indication that all the insurance firms are aware that there is competition
and each uses different ways to stay ahead. This means that competition can affect the
financial performance of an insurance firm and that is why the insurers take measures to
stay ahead of competition.
4.5.6 Whether the company has an edge on competition
This item sought for information on whether the company has an edge on completion.
The responses are summarised in Table 4.6
Table 4.6 Whether the company has an edge over competition
Response Frequency Percent Cumulative Percent
Yes 84 79.2 79.2
Somewhat 22 20.8 100.0
Total 106 100.0
When asked whether the insurance company has an edge on competition, 79.2% of the
respondents said yes while the other 20.8% said no. For the ones who said that they have
an edge on competition, they said that from the IRA and AKI reports, their market share
has continued to increase thus increasing their profits. Others said that their company has
a strong financial standing and a good claims paying experience. Others have efficient
and customer-friendly services. For the ones with no edge on competition, they explained
that they are yet to enhance their products. Having an edge on competition may improve
an insurer‘s financial performance because they become more preferred by clients.
4.5.7 Opinions regarding competition

45
This item sought for the respondents‘ opinions regarding issues on competition. They
responded as shown in Table 4.7
Table 4.7Opinions regarding competition
Statement Agreed Disagreed Total
Business environment supports company's survival 100% 0 100%
The demand for our products will be high 100% 0 100%
Profit margin increase is very high 40.6% 59.4% 100%
The competition is intense related to the prices 100% 0 100%
Competition is intense related to quality of products 19.8% 80.2% 100%
The competition is intense related to the innovation 59.4% 40.6% 100%
According to Table 4.7, all the respondents agreed that the business environment supports
their company's survival, the demand for their products will be high and the competition
is intense related to the prices. While 40.6% agreed that profit margin increase is very
high, 59.4% refuted. On whether the competition is intense related to quality of products,
19.8% agreed while 80.2% disagreed. On whether the competition is intense related to
the innovation embedded in new products, 59.4% agreed while 40.6% disagreed. These
findings show that the main areas in which the insurance companies are affected by the
competition are prices and innovation in new productions. The findings also imply that
the competition eats up into the market of the insurance companies reducing their profit
margin.
4.5.8 Extent to which competition affects financial performance the organization
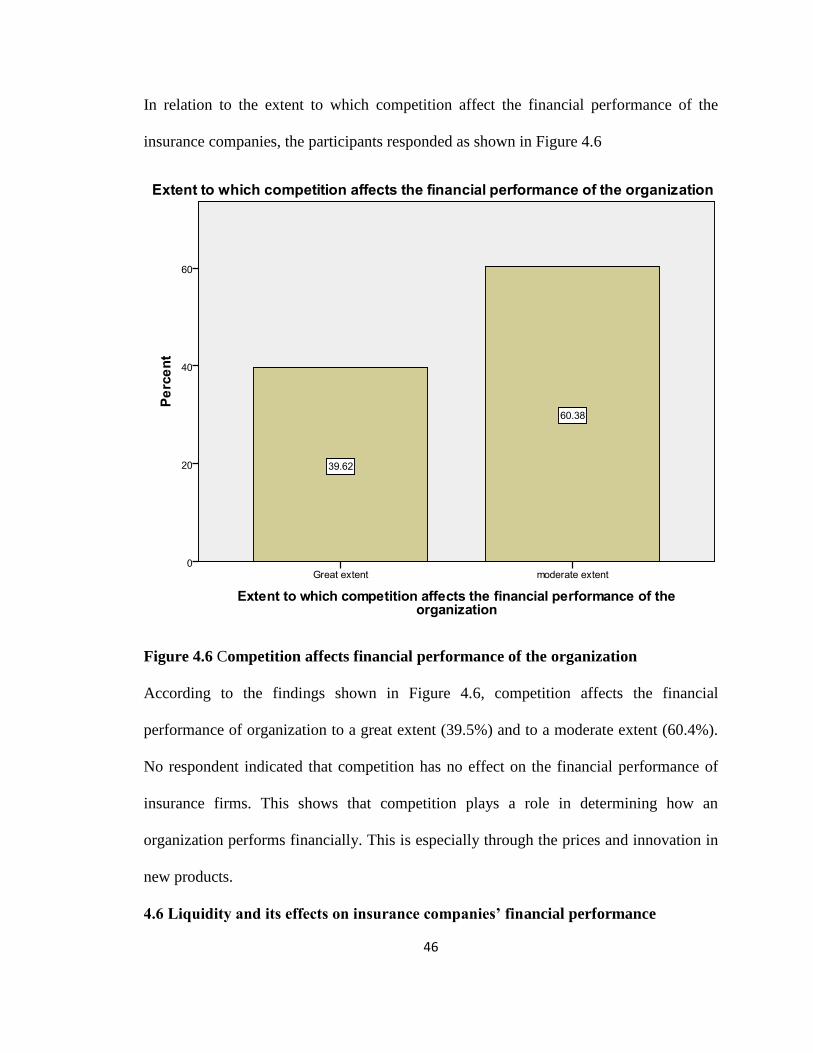
46
In relation to the extent to which competition affect the financial performance of the
insurance companies, the participants responded as shown in Figure 4.6
Figure 4.6 Competition affects financial performance of the organization
According to the findings shown in Figure 4.6, competition affects the financial
performance of organization to a great extent (39.5%) and to a moderate extent (60.4%).
No respondent indicated that competition has no effect on the financial performance of
insurance firms. This shows that competition plays a role in determining how an
organization performs financially. This is especially through the prices and innovation in
new products.
4.6 Liquidity and its effects on insurance companies’ financial performance
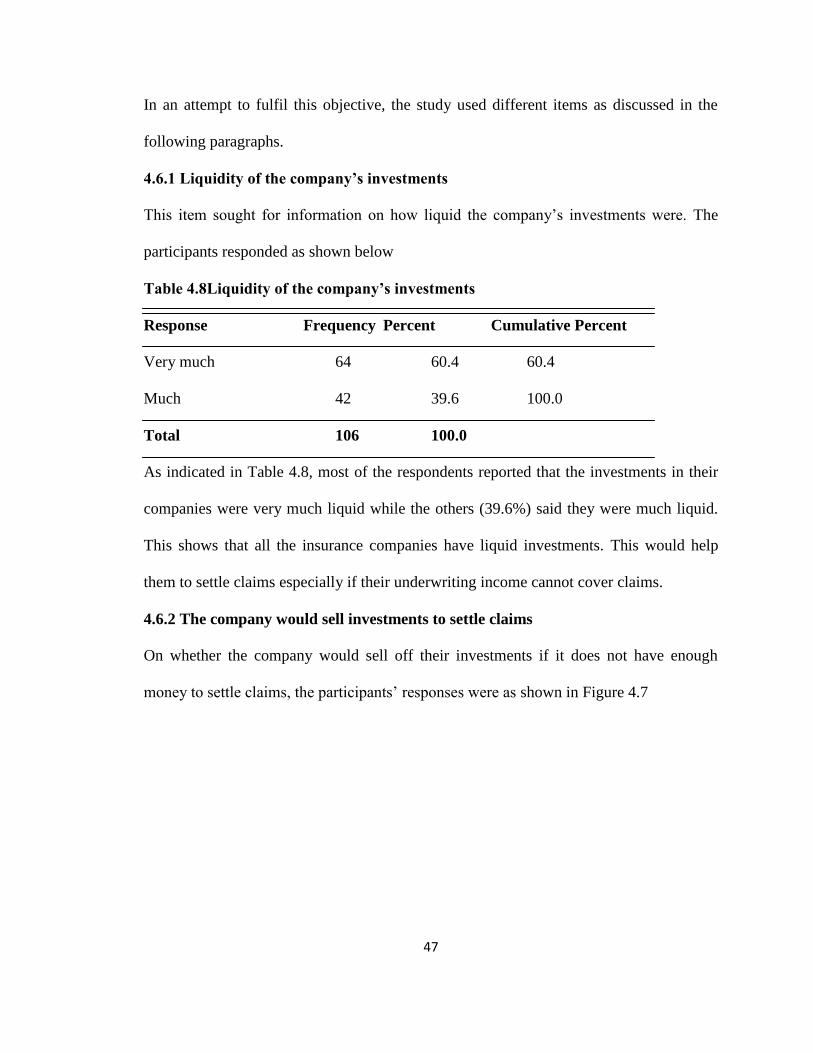
47
In an attempt to fulfil this objective, the study used different items as discussed in the
following paragraphs.
4.6.1 Liquidity of the company’s investments
This item sought for information on how liquid the company‘s investments were. The
participants responded as shown below
Table 4.8Liquidity of the company’s investments
Response Frequency Percent Cumulative Percent
Very much 64 60.4 60.4
Much 42 39.6 100.0
Total 106 100.0
As indicated in Table 4.8, most of the respondents reported that the investments in their
companies were very much liquid while the others (39.6%) said they were much liquid.
This shows that all the insurance companies have liquid investments. This would help
them to settle claims especially if their underwriting income cannot cover claims.
4.6.2 The company would sell investments to settle claims
On whether the company would sell off their investments if it does not have enough
money to settle claims, the participants‘ responses were as shown in Figure 4.7

48
Figure 4.7The company would sell investments to settle claims
Figure 4.7 shows that 39.6% of the respondents strongly agreed that the company would
sell off their investments if they lacked money to settle claims, 20.8% agreed while
39.6% somehow agreed. These findings show that most companies would be willing to
sell their investments so that they can settle clients‘ claims.
4.6.3 Company’s financial strength to meet the ongoing policyholders’ obligations
The respondents rated the company‘s financial strength to meet the ongoing
policyholders‘ obligations as shown in Table 4.9

49
Table 4.9Company’s financial strength to meet the ongoing clients’ obligations
Rating Frequency Percent Cumulative Percent
Excellent 84 79.2 79.2
Good 22 20.8 100.0
Total 106 100.0
The financial strength to meet the ongoing client‘s obligations was mainly excellent
(79.2%) in most companies. The others (20.8%) reported that it was good. This shows
that most insurance companies put effort to ensure that they are in a position to settle
claims. Probably because settling of claims and indemnifying is the main purpose of
insurance companies and this is the only way they can maintain clients.
4.6.4 Company’s source of funds during liquidity management
This item sought for information on whether the companies get their money from when it
comes to liquidity management. The responses are as shown in Figure 4.8

50
Figure 4.8Company’s source of funds during liquidity management
As shown in Figure 4.8, majority of insurance companies (59.4%) rely on cash flow from
operations in liquidity management. The other 20.8% consider portfolio‘s level of cash
and short term investments while 19.8% use portfolio‘s level of readily saleable
securities. This implies that all companies have a certain source of funds for liquidity
management.
4.6.5 Extent to which liquidity affects financial performance of insurance companies
In rating the extent to which liquidity affects the financial performance of insurance
companies, all the respondents agreed that it affects to a great extent.

51
CHAPTER FIVE
SUMMARY, CONCLUSIONS AND RECOMMENDATIONS
5.1 Introduction
This chapter presents summary, conclusions, recommendations of the study and
suggestions for further research.
5.2 Summary of the study
The purpose of this study was to investigate the factors that influence the financial
performance of insurance companies in Kenya. It was based on the following research
questions: What are some of the key factors that determine financial performance of
insurance companies? To what extent do these factors influence the financial
performance of insurance companies? And what are the insurance companies doing to
enhance or to mitigate the effect of these factors determining their financial performance?
This study was conducted using a descriptive survey design. The target population for
this study comprised the 46 insurance companies in Kenya. This study used systematic
random sampling method to select the respondents. The study used questionnaires as the
tool for data collection. Data was analysed through descriptive statistics and results
presented in frequency tables, bar graphs and pie charts.
The findings on the effect of interest rates on the financial performance of insurance
companies showed that changes in interest rates affect the financial performance of the
insurance companies positively and negatively. Low interest rates on borrowing enable
insurers to borrow and invest more in higher risk areas thus improving their investments
and financial performance. This is in line with Staking and Babbel (1995). High interest

52
rates increase the return on investments for example; rising interest rates imply a higher
return on bonds, one kind of investment. This is in line with Schich (2008). Most of the
companies (60.4%) based interest on the market. This implies that since the market keeps
on changing, the interest rates are also likely to keep on changing. On the other hand,
when the interest rates change, rate of return on investments change also and this can
affect the financial performance of the insurance firms either positively or negatively
depending on whether the interest rates go high or low. Majority of the respondents
(40.6%) reported that their insurance companies used futures to manage interest rate
risks. This implies that all insurance companies are aware of the risks which come as a
result of fluctuations in interest rates. That is why they have ways of managing such
risks. This is all because interest rates can affect the financial performance of a company.
In order to profit from changes in interest rates, most participants reported that companies
diversify their investment portfolio through buying bonds, investing in property, equity,
shares as well as increasing their borrowed capital when rates fall. All these measures are
done to improve the financial performance of the insurance companies. Majority of the
respondents (59.4%) were of the opinion that fluctuations in interest rates affect the
financial performance of insurance companies. This is in line with Best (1992) and
Carson and Hoyt (1995).
The findings on profitability and its effect on insurance companies‘ financial
performance showed that most insurers (40.6%) have assets worth below 10 billion
shillings. The more assets an insurer has, the better they are financially because if the
underwriting income is low, the insurer can rely on the investment income to settle large
53
claims. This is in line with Hagel, Brown and Davison (2010). Most respondents (60.4%)
indicated that their insurance firms have liabilities worth less than 10 billion. More
liabilities place the insurer at a risky position financially especially if they are needed to
settle major claims. Most respondents (60.4%) indicated that their insurance companies
have performance indicators like KPI‘s, targets, benchmarking, claims, operational costs,
new businesses, return on investment and profits for gauging business. This is an
indication that most insurance companies are aware of the way they are performing
financially hence they can take appropriate measures when their financial performance
goes down. For the insurance companies with no performance indicators, it is difficult to
know when they are performing well or poorly. On the trend of profitability in the
company in the last one financial year, all the respondents indicated that it has been on
the increase. The most preferred investment was real estate and mortgage industry. These
companies try to avoid investing in the stock market mainly because of the uncontrolled
return trends. This is in line with Santomero and Babbel (1997) findings. The findings
show that the insurance companies mind their profitability by investing in the viable
ventures while avoiding the too risky ones. This is evidence that profitability affects the
financial performance of the insurance companies as shown by 79.2% of the respondents
were of the opinion that company profitability affects its financial performance to a great
extent.
Findings on competition and its effects on insurance company‘s financial performance
showed that all the respondents have knowledge on the current activities about the
competitors. With knowledge of competitors‘ current activities, insurers can take
measures to match up or improve their products and services beyond their competitors in

54
order to gain a competitive edge. 40.6% of the respondents reported that the technology
in their insurance is neck to neck with that of their competitors while 19.8% said they are
ahead of competition in terms of technology. The other 39.6% admitted that the
competition is ahead of them technology-wise. Being ahead of competition gives an
insurer a competitive edge and this would be the aim of most insurers because they are in
business to make money. 39.6% of the respondents reported that the insurance companies
use market research while another 39.5% said they use competitor‘s advertisement. The
other 20.8% use customers‘ feedback. This implies that insurers are aware that
competition can reduce their market share hence their financial performance and that is
why they get ways of gauging competition. This is in line with Donlon and Gutfreund
(1998). On whether the company encourages clients to give them feedback regarding the
quality, price, packaging or placement of their products or services, all the respondents
said yes. The companies achieve this through maintaining complaints and compliment
registers while others have a customer experience unit that embark on gauging the
satisfaction their clients receive. Other insurance firms organize agents for forums on the
same. This is an indication that the insurance companies care about their customers and
they try to keep them coming back by ensuring that they are satisfied. This is a way of
staying ahead of competition hence improving financial performance. On how the
companies handle competition, most participants reported that insurers handle
competition through paying claims on time, 34.0% do research in order to stay ahead of
competition while 13.2% use innovation to come up with products that are in tandem
with the clients‘ needs. When asked whether the insurance company has an edge on
competition, 79.2% of the respondents said yes while the other 20.8% said no. For the

55
ones who said that they have an edge on competition, they said that from the IRA and
AKI reports, their market share has continued to increase thus increasing their profits.
Others said that their company has a strong financial standing and a good claims paying
experience. Others have efficient and customer-friendly services. All the respondents
agreed that the business environment supports their company's survival, the demand for
their products will be high and the competition is intense related to the prices. While
40.6% agreed that profit margin increase is very high, 59.4% refuted. On whether the
competition is intense related to quality of products, 19.8% agreed while 80.2%
disagreed. On whether the competition is intense related to the innovation embedded in
new products, 59.4% agreed while 40.6% disagreed. Competition affects the financial
performance of organization to a great extent (39.5%) and to a moderate extent (60.4%).
This shows that competition plays a role in determining how an organization performs
financially. This is especially through the prices and innovation in new products. This is
in line with (O'Connor, 2000).
Findings on liquidity and its effects on insurance companies‘ financial performance
showed thatmost insurers have very much liquid investments while the others (39.6%)
said they were much liquid. This shows that all the insurance companies have liquid
investments. This would help them to settle claims especially if their underwriting
income cannot cover claims. This is in line with (Black, Wright & Bachman, 1998).
39.6% of the respondents strongly agreed that the company would sell off their
investments if they lacked money to settle claims, 20.8% agreed while 39.6% somehow
agreed. These findings show that most companies would be willing to sell their

56
investments so that they can settle clients‘ claims. The financial strength to meet the
ongoing client‘s obligations was mainly excellent (79.2%) in most companies. The others
(20.8%) reported that it was good. This shows that most insurance companies put effort
to ensure that they are in a position to settle claims. Probably because settling of claims
and indemnifying is the main purpose of insurance companies and this is the only way
they can maintain clients. This is in line with Barney (1997). Majority of insurance
companies (59.4%) rely on cash flow from operations in liquidity management. The other
20.8% consider portfolio‘s level of cash and short term investments while 19.8% use
portfolio‘s level of readily saleable securities. This implies that all companies have a
certain source of funds for liquidity management. In rating the extent to which liquidity
affects the financial performance of insurance companies, all the respondents agreed that
it affects to a great extent.
5.3 Conclusions of the study
Based on the findings of the study, it can be concluded that fluctuations in interest rates
affect the financial performance of insurance companies both ways. This is because it
affects the rate of borrowing as well as the rate of return on investments. Most of the
companies based interest on the market. Most insurers use futures to manage interest rate
risks. In order to profit from changes in interest rates, most insurers diversify their
investment portfolio through buying bonds, investing in property, equity, shares as well
as increasing their borrowed capital when rates fall.
On profitability and its effects on financial performance of insurance companies, it can be
concluded that it has an effect. Most insurance companies have performance indicators
like KPI‘s, targets, benchmarking, claims, operational costs, new businesses, return on

57
investment and profits for gauging business. All the respondents indicated that the trend
of profitability in the company in the last one financial year has been on the increase. The
most preferred investments were real estate and mortgage industry. The findings show
that the insurance companies mind their profitability by investing in the viable ventures
while avoiding the too risky ones.
Competition was found to have an effect on insurance company‘s financial performance.
This is why all the respondents indicated to have knowledge on the current activities
about the competitors. With knowledge of competitors‘ current activities, insurers can
take measures to match up or improve their products and services beyond their
competitors in order to gain a competitive edge. A significant number of insurers‘
competition is ahead of them technology-wise. Most insurance companies use market
research while another while othersuse competitor‘s advertisement and customers‘
feedback. Insurers mainly handle competition through paying claims on time.
Competition plays a role in determining how an organization performs financially. This is
especially through the prices and innovation in new products.
Liquidity affects financial performance of insurance companies. This is why all the
insurance companies have liquid investments. Thesewould help them to settle claims
especially if their underwriting income cannot cover claims. All the respondents at least
somehow respondents strongly agreed that the company would sell off their investments
if they lacked money to settle claims. The financial strength to meet the ongoing client‘s
obligations was mainly excellent in most companies. Majority of insurance companies
58
rely on cash flow from operations in liquidity management. This implies that all
companies have a certain source of funds for liquidity management.
5.4 Recommendations of the study
Based on the findings of this study, it is recommended that
a) Insurers should invest in financial analysts so that they can gauge when interest
rates can work in their favour in increasing their income. This would enhance
their financial performance hence they would be able to settle all claims
irrespective of the amount of money involved.
b) The insurers without performance indicators should adopt some. This way, they
would know when to invest or not. This would place them in a better financial
position.
c) All insurers should find an area they excel and capitalize on it to get a competitive
edge while trying to upgrade on the areas in which they are weak. This would
place them ahead of competition.
d) The insurers should work towards increasing their cash flow to avoid sale of
investments in case of settling huge claims. This would make them financially
healthier.
5.5 Limitations of the study
A few challenges were encountered during this study. It was not possible to control the
attitude of the respondents regarding the topic of study. However, the researcher assured
the respondents of the anonymity of their identity as well as explained the need for this

59
study. These made it more likely for the respondents to give accurate information. It was
limiting to use profitability as a factor of financial performance. The study therefore used
profitability as a factor in determining investment behaviour of insurance companies. The
factors under study could not be measured accurately. This is due to the limited resources
of time and the sample size taken. The study also concentrated in Nairobi where majority
of the insurance companies are located.
5.6 Suggestions for further research
The researcher suggested that a similar study to investigate the factors affecting the
financial performance of companies in other sectors should be conducted. A similar
research can be undertaken on wider scale say in East Africa.

60
REFERENCE
Akello L. (2010)). Challenges of Implementing Competitive Strategies in the Insurance
Industry in Kenya; Unpublished MBA Thesis, University of Nairobi
A. M. Best Company Inc., (1992). Best‘s Insolvency Study: Life/Health Insurers 1976-
1991, Best’s Review--Life/Health Edition, June: 18-24, 130-134.
Ambrose, Jan M. and Anne M. Carroll, (1994).―Using Best Ratings in Life Insurer
Insolvency Prediction.‖Journal of Risk and Insurance, 61:317-327.
Babbel, D.F. &Klock, D.R., (1994). "Measuring the Interest Rate Risk of Insurer
Liabilities", Insurance Risk Management and Public Policy,pp 49-73
Baldoni R. J. (2008). A Best Practices Approach to Risk Management, TMA Journal,
Jan/Feb pp.30-34
Barney, L.D., (1997), "The Relation Between Capital Structure, Interest Rate Sensitivity,
and Market Value in the Property-Liability Industry: Comment", The Journal of
Risk and Insurance, 64(4), 733-738
BarNiv, R. &Hershbarger, R. (1990).―Classifying Financial Distress in the Life Insurance
Industry.‖Journal of Risk and Insurance, 57:110-136.
Black, A.P., P. Wright, & J. E. Bachman. (1998). In Search of Shareholder Value:
Managing the Drivers of Performance. London: Pitman Publishing.
Blundell-Wignall, A., P. Atkinson, & Lee, S. H. (2008).“The Current Financial Crisis:
Causes and Policy Issues”, OECD Financial Market Trends Volume 2008/2,
December, pp. 11-31.
Brigham, Eugene & Philip Daves.(2004). Intermediate Financial Management.8th Ed.
Thomson Southwestern, US.
Carey A. (2001) ―Effective Risk Management in Financial Institutions. The Turnbul
Approach‖ Balance Sheet, Vol 9 No. 3
Carson, J. M. & Hoyt, R. (1995). ―Life Insurer Financial Distress: Classification Models
and Empirical Evidence.‖ Journal of Risk and Insurance, 62:764-775.
Cummins, J. D., Grace, M. & Phillips, R. (1999). ―Regulatory solvency prediction in
property-liability insurance: Risk-based capital, audit ratios, and cash flow
simulation.‖ Journal of Risk and Insurance 66, 417-458.

61
Deakin, S. (2005)."The Coming Transformation of Shareholder Value."Corporate
Governance 13, no. 1 pp 11–18.
Donlon, J.P., and J. Gutfreund.(1998). "Good for the Company, Good for the
Shareholder?"Chief Executive 132 (March 1998): 50–59.
Eckardt, M. (2007).Insurance intermediation: an economic analysis of the information
services market. London: Springer
Greene, W. H., (2000). Econometric Analysis, 4th ed. Prentice Hall, Upper Saddle River,
N.J.
Groves, R. M., Fowler, F. J. Couper, M. P., Lepkowski, J. M. & Singer, E. (2009).Survey
methodology. Edition 2, New York: John Wiley and Sons
Hagel, J. Brown, J. S. & Davison, L. (2010).―The Best Way to Measure Company
Performance‖.Harvard Business Review. Harvard: Harvard Business Publishing
Hochhauser, M. (2004). "Smart Executives, Dumb Decisions." Risk Management 51, no.
9 pp 64.
Hodes, D. M., Sholom, F. &Neghaiwi, S. (1999). ―The Financial Modelling of
Property-Casualty Insurance Companies‖, North American Actuarial Journal,
3:41-69.
Hoyt, R. E., (1994). ―Modelling of Insurance Cash Flows for Universal Life
Policies.‖Journal of Actuarial Practice, 2:197-220.
International Accounting Standards Board (2007).International Financial Reporting
Standards 2007 (including International Accounting Standards (IAS(tm)) and
Interpretations as at 1 January 2007), LexisNexis
Jelala A. C. A., (1993). Motor Vehicle Thefts – Implications and the Underwriting
Practice in Kenya 1989 – 1992; Unpublished MBA Thesis, University of Nairobi
Karanja R. M. (2010). A survey of the credit policies n the insurance company in Kenya;
Unpublished MBA Thesis, University of Nairobi
Karuiru, F. (2005).Determinants of profitability of insurance companies in Kenya, MBA
Thesis. Kenya: University of Nairobi
62
Kothari, C.R., (2008). Research Methodology: Method and Techniques. 2nd Ed, New
Delhi: New Age International (P) Ltd Pottier, S. W. (1998). ―Life insurer financial
distress, Best‘s ratings and financial ratios.‖ Journal of Risk and Insurance 65, no.
2:275-288.
Kumba, S. (2011).How to determine whether your financier is financially sound.The
Financial Post, Vol 2 pp 16
Maina, P. (2003). Risk and return of investment held by insurance companies in Kenya,
MBA Thesis. Kenya: University of Nairobi
Makembo S. M. (1992). An Investigation of the Problems in the Compensation System
For Personal Injuries and Deaths in Motor Insurance In Kenya; Unpublished
MBA Thesis, University of Nairobi
Maxon R. M. (1993). Struggle for Kenya. The loss and Reassertion of Imperial Initiative,
1912 – 1923, Fairleigh Dickson University Press, Madison
Mugenda, O.M. & A.G. Mugenda. (1999). Research Methods: Quantitative and
Qualitative Approaches. Nairobi: Acts Press
Mutuku, K. (2004). The relationship between corporate social responsibility & financial
performance: a case of publicly quoted companies in Kenya. MBA Thesis,
University of Nairobi, Kenya
Mwaura, S. (2003).Relationship between cost of credit and financial performance of
manufacturing firms listed in the Nairobi Stock Exchange. MBA Thesis, Kenyatta
University, Kenya
Ngechu, M. (2006).Understanding the research process and methods: An introduction.
University of Nairobi: Starbright services Ltd.
O'Connor, T. (2000)."The Formula for Determining Cash Flow."Denver Business
Journal,Vol 3 pp 24-26
Omondi G. (1988). A study of the operations of the motor insurance pool;
Unpublished MBA, Thesis, University of Nairobi
Ondari J. (2009). PSV Insolvent, Dossier, Daily Nation, 25th
April 2009.
Organisation for Economic Co-operation and Development. (2003). Environmental risks
and insurance: a comparative analysis of the role of insurance in the management
63
of environment-related risks, Issue 6 of Policy issues in insurance. New York:
OECD Publishing
Outreville, J. François, (1990). ―Whole Life Lapse Rates and the Emergency Fund
Hypothesis, Insurance‖: Mathematics and Economics, 9:249-255.
Ramadhan Z. W. (2009). The Impact of the 2003 Reforms on the PSV Insurance Sector
in Kenya: case of matatu: Unpublished Thesis, University of Nairobi
Sanchez, J. A. (2006). ―Calculating insurance claim reserves with fuzzy
regression.‖Fuzzy Sets and Systems 157, no. 23:3091-3108.
Santomero, A. M. &Babbei, D. F. (1997). "Financial Risk by Insurers: An Analysis of the
Process": The Journal of Risk and Insurance, 64, 231-270.
Schich, S. (2008). ―Challenges related to Financial Guarantee Insurance‖,
OECDFinancial Market Trends, Volume 2008/1, June, pp. 81-113.
Schich, S. & Kikuchi, A. (2004). ―The Performance of Financial Groups in the Recent
Difficult Environment‖, by OECD Financial Market Trends No. 86, March, pp.
63-81.
Staking K. B. &Babbel D. F. (1995). "The Relation Between Capital Structure, Interest
Rate Sensitivity, and Market Value in The Property-Liability Insurance Industry,"
Journal of Risk and Insurance, 62(4), 690-718
Yang, Ho-Li, (2007).Effect of Interest Rate Changes on the Profitability of Insurance
Companies.International Business Journal,Vol 2 pp 46
Young, V. R. (1996). ―Insurance rate changing: A fuzzy logic approach.‖ Journal of Risk
and Insurance 63, no. 3:461-484.
Wekesa J. N. (2010). Underwriting Challenges Facing PSV Insurance in Kenya;
Unpublished MBA Thesis; University of Nairobi

64
APPENDICES
Appendix I: Introduction letter
University of Nairobi
Department of Accounting
P.O Box 30900 - 80100
NAIROBI
The Manager,
Dear Sir/Madam,
REF: REQUEST TO CONDUCT RESEARCH IN NAIROBI MUNICIPALITY
I am a final year Master of Business Administration student at the University of Nairobi.
My area of specialization is Finance. I am currently undertaking research study on the
factors that determine the financial performance of insurance companies in Kenya.
I would be grateful if you could spare some time and complete the enclosed
questionnaire. Your identity will be treated with utmost confidentiality. A copy of the
final report will be made available to you on request. Your timely response will be highly
appreciated.
Yours,
MWANGI CALEB MUYA

65
Appendix II:Questionnaire
This questionnaire aims to acquire information on the factors that determine the financial
performance of insurance companies. Please respond to all items. Unless otherwise
instructed respond to each item by putting a tick (√) next to the response that is
applicable.
SECTION A : DEMOGRAPHIC INFORMATION
SECTION B: MAIN ISSUES
I: Interest rate fluctuations and their effect on insurance companies
1. a) How do changes in interest rates affect the financial performance of your company
Positively ( )
Negatively ( )
No change ( )
b) Explain your answer
………………………………………………………………………………………
………………………………………………………………………………………
………………………………………………………………………………………
2. What does your company base your interests on?
The market ( )
The competitors ( )
New money ( )
Portfolio average ( )
Others (specify) …………………………………………………………………..
3. What means does your company use to manage interest rate risks?
Derivatives market ( )
Futures ( )
Exchange-traded instruments ( )
Over-the-counter (OTC) instruments ( )
Others (specify)……………………………………………………………………

66
4. What measures does the company have in order to profit from changes in the interest
rates?
………………………………………………………………………………………
………………………………………………………………………………………
………………………………………………………………………………………
5. To what extent do fluctuations in interest rates affect the financial performance of
insurance companies?
Great extent ( )
Moderate extent ( )
Small extent ( )
No extent ( )
II: Profitability and its effect on insurance companies’ financial performance
6. a) What is the total valuation of assets that your company owns?
Below Kshs. 10, 000, 000,000 ( )
10,000,000,000 – 60,000, 000, 000 ( )
60,000, 000, 001 – 90,000,000 000 ( )
Above 90,000,000,000 ( )
b) What is the total valuation of liabilities that you have?
Below Kshs. 10, 000, 000,000 ( )
10,000,000,000 – 60,000, 000, 000 ( )
60,000, 000, 001 – 90,000,000 000 ( )
Above 90,000,000,000 ( )
7. Does your company have performance indicators to gauge business?
Yes ( ) No ( )
If yes, name three performance indicators used in your company
………………………………………………………………………………………
………………………………………………………………………………………
………………………………………………………………………………………

67
8. What is the trend of profitability in your company for the last one financial year?
Increase ( )
Decrease ( )
No change ( )
9. a) Do you have any specific investment preference?
Yes ( )
Somewhat ( )
No ( )
b) If the answer to the above question is yes, explain the kind of investment preference
you have
………………………………………………………………………………………
………………………………………………………………………………………
c) What kind of investments do you want to avoid? (Explain)
………………………………………………………………………………………
………………………………………………………………………………………
10. To what extent does the company‘s profitability affect its financial performance?
Great extent ( )
Moderate extent ( )
Small extent ( )
No extent ( )
III: Competition and its effect on insurance companies’ financial performance
11. Do you have knowledge of current activities about your competitors? Yes ( ) No ( )
12. How does your use of technology measure against your main competitors?
We are way ahead of them ( )
We are neck to neck with them ( )
They are slightly ahead of us ( )
They are far more ahead of us ( )
13. What does your organization do to ensure that it has all the necessary market
intelligence necessary to gauge competition?
Market research ( )
68
Competitors‘ advertisements ( )
Others (specify)…………………………………
14. Do you encourage your clients to give your organization feedback regarding the
quality, price, packaging or placement of your products and services? Yes ( ) No ( )
Explain
………………………………………………………………………………………
………………………………………………………………………………………
15. How does the company handle the competition?
Ensuring quality of products ( )
Paying claims on time ( )
Stay ahead of competition through research ( )
Capitalizing on competitors‘ weaknesses ( )
Others (specify)…………………………………………………………………
16. Does the company have an edge over the competition? Yes ( ) No ( )
Explain……………………………………………………………………………………...
………………………………………………………………………………………
17. Please indicate your opinion regarding the following sentences
Disagree Agree
The business environment supports our company's survival ( ) ( )
The demand for our products will be high ( ) ( )
Profit margin increase is very high ( ) ( )
The competition is intense related to the prices ( ) ( )
The competition is intense related to the quality of products ( ) ( )
The competition is intense related to the innovation embedded in new products ( )
18. To what extent does competition affect the financial performance of your company?
Great extent ( )
Moderate extent ( )
Small extent ( )
No extent ( )

69
IV: Liquidity and its effect on insurance companies’ financial performance
19. How liquid are your company‘s investments?
Very much ( )
Much ( )
Little ( )
Not liquid ( )
20. To what degree do you agree with the statement ‗the company would sell off their
investments if it does not have enough money to settle claims?
Strongly agree ( )
Agree ( )
Somewhat agree ( )
Disagree ( )
21. How would you rate your company‘s financial strength to meet the ongoing
policyholders‘ obligations?
Excellent ( )
Good ( )
Poor ( )
22. During liquidity management, what is your company‘s source of funds?
Portfolio‘s level of cash and short-term investments ( )
Portfolio‘s level of readily saleable securities ( )
Cash flow from operations ( )
Others (specify)……………………………………………………….
23. To what extent does liquidity affect the financial performance of insurance
companies?
Great extent ( )
Moderate extent ( )
Small extent ( )
No extent ( )
Thank you for your cooperation

70
Appendix III: Insurance companies in Kenya
1 Africa Merchant Assurance Ltd
2 APA Insurance Company Ltd
3 Apollo Life Insurance Ltd
4 Blue Shield Insurance Company Ltd
5 British American Insurance Company Ltd
6 Cannon Assurance Company Ltd
7 Capex Life Assurance Company Ltd
8 CFC Life Assurance Ltd
9 Chars Kenya Insurance Company Ltd
10 Concord Insurance Company Ltd
11 Cooperative Insurance Company Ltd
12 Corporate Insurance Company Ltd
13 Directline Assurance Company Ltd
14 Fidelity Shield Insurance Company Ltd
15 First Assurance Company Ltd
16 GA Insurance Company Ltd
17 Gateway Insurance Company Ltd
18 Geminia Insurance Company Ltd
19 Heritage Insurance Company Ltd
20 Insurance Company of East Africa Ltd
21 Intra Africa Assurance Company Ltd
22 Invesco Assurance Company Ltd
23 Jubilee Insurance Company Ltd
24 Kenindia Assurance Company Ltd
25 Kenya Orient Insurance Company Ltd
26 Kenyan Alliance Insurance Company Ltd
27 Lion of Kenya Insurance Company Ltd
28 Madison Insurance Company Ltd
29 Mayfair Insurance Company Ltd
30 Mercantile Insurance Company Ltd
31 Metropolitan Life Assurance Company Ltd
32 Monarch Insurance Company Ltd
33 Occidental Insurance Company Ltd
34 Old Mutual Life Assurance Company Ltd
35 Pacis Insurance Company Ltd
36 Pan Africa Life Assurance Company Ltd
37 Phoenix of E. A. Assurance Company Ltd
38 Pioneer Life Assurance Company Ltd
39 REAL Insurance Company Ltd
40 Shield Assurance Company Ltd
41 Takaful Insurance of Africa Ltd
42 Tausi Assurance Company Ltd
43 Trident Insurance Company Ltd
44 UAP Insurance Company Ltd
45 UAP Life Assurance Company Ltd
46 Xplico Insurance Company Ltd

71