Estimating EV diffusion and charging infrastructure demand ...

International Journal of the Physical Sciences Vol. 5(6), pp. 724-737, June 2010 Available online at http://www.academicjournals.org/IJPS ISSN 1992 - 1950 © 2010 Academic Journals Full Length Research Paper
The effect of concept mapping on attitude and achievement in a physics course
Yunus Karakuyu
Department of Science and Mathmatics’ Education, Mustafa Kemal University, Hatay, Turkey.
E-mail: [email protected]: 90 326-2456000-5352. Fax: 90 326 2456006.
Accepted 29 April, 2010
The aim of this study was to investigate the effect of students’ concept mapping on their physics achievement and attitudes toward physics lesson. Participants were 58 ninth-grade students from the two classes enrolled to general physics course in a high school in Turkey. One of the classes was randomly chosen as experimental group (28), constructed electricity concept map and the other was control (30) group, did not receive any presentation on concept mapping. Data were collected via the pre- and post-administration of the Physics Achievement Electricity Test (PAET) and Concept Maps Attitude Scale towards Physics (CMASTP). The study conducted in six weeks in a class that met two times a week. The material covered was about electricity. Results showed that while there were no significant differences in the attitude and achievement between the experimental and control groups. However, the experimental group students were observed to have a tendency of more positive attitude than the control group students. Results also showed that drawing concept map instruction was more effective than traditional instruction in improving physics achievement of the participating students. Key words: Concept mapping, traditional instruction, physics, achievement.
INTRODUCTION Determining students’ success, need to be assessed. Recent years studies examining individual differences in learning are most popular. Applied assessment should have greater importance for students to able to show their personal potential. From this aspect, concept maps become an essential tool. Concept maps can be used as a dependable, current assessment method and as a research tool, which gives a great advantage on academic studies (Novak and Gowin, 1984). Concept maps can also be seen as a way map, which represents the relation between concepts with a graphical representation. In 1972, Novak started to apply this essential method. Concept maps enable us to simplify and present theoretical ideas on graphical content. This tool will prevent memorizing, which is very common method on our education system and will promote sensible learning. Sensible learning creates a logical meaning by an individual between the new information that has learned by previous education and establishes a complete meaning. Memorizing learning creates misunderstanding or inability to connection between the students’ previous and new learned knowledge. Rote memorization promotes fear of learning because it is ir-relevant to their own experiences. In addition, information
learned by rote in the absence of connections with previously acquired frameworks is largely forgotten (Novak, 1998). So that, the aim of education must be to develop educational experiences that make easy meaningful learning and reduce the need for rote learning. Ausubel (1968) describes meaningful learning as the establishment of non-willing relations towards concepts and if learners choose to relate new information to ideas meaningful learning is achieved (Novak, 1998). Students’ performances and interests about science courses are reducing (Markow and Lonning, 1998). Secondary school and college students’ knowledge of science is often characterized by lack of coherence and the majority of students engage in essentially rote learning (BouJaoude and Barakat, 2000). Conceptual nature of science seems to be particularly difficult for students and teaching methods and techniques do not seem to make the learning process sufficiently easy for students (Gabel, 1999). Cmap tools provides a variety of features that make it possible for teachers to use concept maps for a variety of the tasks that students perform (Cañas and Novak, 2005).
Physics education starts in the fourth grade as science and technology courses and it continues all through high

school in Turkey. The new Science and Technology class programme according to the new education curriculum aims to promote students to create a connection between in class-learned knowledge with the daily life events. Science as subject based on skeptic approach and research. At the roots of science lays the ability to explain or make nature events explainable with a constructive approach. Critical and constructive can be enabled if the student takes an active role in class (Balım et al., 2008). According to Matson (2006), teaching science based on questioning, that is, the period of questioning the universe’s nature and its creation. Concept maps have been used as assessment tools (Ingec, 2009) and curriculum planning tools (Ambe and Reid-Griffin, 2009; Kane and Trochim, 2007; Kinchin and Alias, 2005). Teaching programs that enable students to learn by seeing, living, creating and relating previous knowledge with the new learned knowledge, aims to breed individuals that can reach and research for information and eventually individuals that can produce new information. All these reasons forced our education system to move away from learning trough memorizing and replace the system with a new Science and Technology. Teaching programme, which aims to grow individuals that question the problems they face and bring solution, question their being in the natures they live in. The Ministry of National Education in Turkey emphasizes “teaching the means (methods, styles, or strategies) of learning” in the first, second and third years of high school (Turkish Ministry of National Education, 1992). This study is about the effects of concept mapping on students’ achievement and attitude in a physics course. Concept mapping Concept mapping is a teaching and learning strategy that establishes a bridge between how people learn knowledge and sensible learning. Students need to have sufficient foundation and a critical thinking about concept mapping and the relations between different concepts. Concept mapping promises to be useful in enhancing meaningful learning and students’ conceptual understanding in Science and Physics (Novak and Gowin, 1984). Many science educators have recognized the importance of arranging instruction in order of assessment and Shavelson and Baxter (Shavelson et al., 1993) advised that such an arrangement is developed if concept mapping is settled within the curriculum. Thus, in the recent studies students were taught how to make concept maps as part of regular classroom instruction in a progressive manner using techniques similar to those suggested by White and Gunstone (1992). It was also expected that students’ learning of mapping skills would be made easy by using concept maps as part of instruction (Anderson and Huang, 1989).
Concept maps are constructed by writing concepts and
Karakuyu 725 linking them by labeled lines. The labels are important because they require whoever is making the map to actively select convenient linking words. The links need to make sense and to be real links between the two concepts; they need to show the two concepts in some meaningful way (Novak and Gowin, 1984). Constructivist-based teaching involves students actively in constructing their own maps (Markow and Lonning, 1998). Horton et al. (1993) came to a decision that concept mapping generally had positive effects on both students’ achievement and attitude and concept mapping has been determined to help students’ meaningful learning by helping them to see the links between scientific concepts (Fisher et al., 2000). For this purpose Novak and Gowin (1983) developed Concept maps based on Ausubel’s ‘Learning Theory’. Concept mapping also has been reported to improve students’ collaborative learning (Sizmur and Osbourne, 1997). Ruiz-Primo and Shavelson (1996) described the concept-map assess-ments in a framework with three dimensions: a task that invites students to provide evidence for their knowledge structure in a wealthy area, an answer form that students use in order to do the task and a scoring system that the researchers can use in order to evaluate students’ answers. Ruiz-Primo and Shavelson pointed out that reliability and validity of information about different mapping techniques should be supplied before concept maps are used for assessment. Researchers examined scores for interrater reliability (Schacter et al., 1999); stability (Lay-Dopyera and Beyerbach, 1983); convergent validity the correlation between concept map score and other assessment score in the same wealthy area (Rice et al., 1998); predictive validity (Acton et al., 1994); equivalence of different scoring methods (McClure et al., 1999; Rice et al., 1998) and equivalence of different concept-map tasks. Concept maps are often used on planning and assessing the teaching-learning process while individual construction occurs (Erdo�an, 2000; Merrienboer, 2001) Concept mapping as a method to build explicit links and relations between concepts, as a study tool that I used as personal learning tool (Johnstone and Otis, 2006) and as an opportunity for students to construct maps using their own terms (Horton et al., 1993), is expected to stimulate the construction of integrated knowledge structures leading students to achieve higher in tests that measure high cognitive levels.
There is continued interest in improving learning activities in science education in primary and high schools. The new physics curricula have been in use for two years in high schools; but it is not known whether it is useful or not. One of the most significant innovations in the physics curricula is about constructivist learning methods and concept teaching. Concept maps are encouraged to be used as both a teaching tool and an assessment tool for high school physics education by MEB. In the present study, we performed in the high

726 Int. J. Phys. Sci. school concept maps method was not being used in physics courses curriculum in Turkey. Thus we did such a research about concept mapping which were used to provide an alternative for teaching physics courses in the classroom. In addition, the effect of concept mapping at physics courses was investigated.
The main purpose of this study was to examine the effects of concept mapping method on students’ physics achievement and attitudes towards physics. The research questions investigated in this study were as follows: 1. Is there any effect of concept mapping method on students’ physics achievement scores? 2. Is there any effect of concept mapping method on students’ attitudes toward physics? MATERIALS AND METHODS Subjects Participants in this study were 58 grade 9 physics students from co-educational state secondary school students from two classes of a general physics course taught by the same teacher in Turkey. For the purposes of the study, one of two instructional methods was randomly assigned to each class. This study is a comparative research that employed an experimental group and a second group that was taught in a more traditional teacher-centered manner (called the control group). The subjects were 58 students (33 boys, 25 girls, average age 16 years) from two 9th grade classes. One class (n = 28, 15 boys and 13 girls) was assigned as a concept mapping group and the other (n = 30, 18 boys and 12 girls) as the control group. The students were similar in socioeconomic status with the majority of them coming from middle- to upper-class families. The school is a large co-educational school based in a city with a roll of about 1200 students. There are about 52 teachers and 11 science teachers. Science is seen as an important subject for the school and is strongly supported by teachers, school administration and families. Normal instruction in the school is strongly teacher-dominated with a lecture type format typical and students passively learning, writing notes and reading textbook material. The teacher who implemented the concept mapping, the usual teacher for electricity physics for the 9th grade in the school, was a male with 7 years of teaching experience. Electricity physics is taught initially in the 8th year of Turkish elementary schools (age range 7 - 14). However, in the first year of secondary school (that is, 9th grade, age range 14 - 16), these concepts are re-visited and expanded upon. But in the new secondary high school physics curriculum, electricity is taught, in the second year of secondary school (that is, 10th grade, age range 15 - 17). The unit electricity and magnetism is the last unit in general physics curriculum for the second grade of secondary school is presented in the 10th grade. But at the old secondary high school physics curriculum for the first grade of secondary school is presented in the 9th grade. And also we put into practice this concept mapping study for the old secondary high school physics curriculum in 2007. The data analyzed for this research were taken from 28 students participating in the experimental group using the concept maps and 30 students participating in the control group receiving traditional instruction. Instruments Physics achievement electricity test (PAET)s The dependent variable in this study is the students’ physics
achievement. Two tests were used to measure achievement. One of the tests measured students’ pre-requisite knowledge in topics related to the ones covered during the study (Appendix A presents examples of the questions used in the pretest). The second test measured student achievement at the conclusion of the study (Appendix B presents examples of the questions used in the posttest). According to Willerman and MacHarg (1991), a test must be at the comprehension level and above in order to measure meaningful learning. Consequently, many items on the achievement tests used in this study were at the comprehension level or above. The pre-test assessed students’ achievement in electricity. The post-test also assessed students’ achievement electricity. An education faculty member, a physics teacher and a physics education mastery student were provided with the objectives based on which the lesson plans and tests were designed along with a detailed description. Differences in classification were discussed among the faculty members, teacher and mastery student and the researcher in order to reach consensus. The reliability KR-20 of the pretest was 0.82 while that of the posttest was 0.83. The two researchers and the physics teacher of the control group corrected the achievement tests based on a detailed, agreed upon, common key. Concept maps attitude scale towards physics (CMASTP) as a school subject Concept Maps Attitude scale is used to determine the attitude of the students towards the Physics course before the application and to see whether there is a significant difference in their attitude towards the physics course as a result of the implemented methods. This Concept Maps Attitude scale was developed by the researcher. It was used to measure student’s attitudes toward Physics as a school subject. The target of the questions was towards students’ interests related to the importance of subjects taught by the teacher in the classroom. This scale consisted of 17 items in 5 point likert type scale (absolutely agree, agree, do not sure, do not agree, absolutely do not agree). The Cronbach’s reliability coefficient was found 0.84 for CMASTP. The scale was not developed with subscales in mind because it included a small size of items and all items were related to students’ attitudes toward Physics subjects taught in school. Some items from the scale are; Concept Maps are helped to establish relations between concepts, Using Concept Maps at the lessons are increased my achievements, Concept Maps are made the complicated subjects more comprehensible, I want Concept Maps to use very frequently at the lessons science is my favorite area and I love using Concept Maps. Concept map scoring rubric Researchers have determined concern about concept map scoring systems and their connected validity and reliability. Generally, reliability data reported in studies using concept maps are in the form of interrater reliabilities (Ruiz-Primo and Shavelson, 1996). As previously mentioned, the two researchers scoring maps in the current study demonstrated an interrater agreement of 98%. This level of agreement using a scoring method focusing on the correctness of students’ declarative knowledge rather than on counting parts of the maps such as branches and levels of hierarchy is surprisingly high (Ruiz-Primo and Shavelson, 1996) and provides strong evidence of the consistency of the scoring method. They approval methods that use expert maps as referents and emphasize the use of correct concept relationships in forming scores, which have been found to relations with performance on standardized tests. Ruiz-Primo and Shavelson (1996) described the use of expert maps produced by the teacher, as standard for scoring concept maps. Jonassen (2006) contended, "Learners have

Karakuyu 727
Table 1. The distribution of participants according to gender and groups.
Control group Experimental group Total Gender n (%) n (%) Male 18 60 15 54 33 Female 12 40 13 46 25 Total 30 52 28 48 58
n: number of participants in groups; %: percentage of participants in groups. to think like teachers"; he cited research showing that the degree of similarity between the learners' and instructor's knowledge structures. The construction and use of scoring rubrics is easily within the reach of science teachers and their students. There are also three steps for effectively using scoring rubrics. The first step is teachers decide the final end products from an inquiry activity that will be submitted for a grade. The second step; students must perform expected tasks, behaviors and tasks. Points are assigned based on the level of students’ concerning. Teachers can use less-detailed rubrics called five point scale but performance expectations are open to less subjectivity or interpretation. The third step; Teachers assume full responsibility for grading. Some of the teachers are comfortable with this method, but some of them want to explore alternative methods (Eddie and Claudia, 2004). The teacher used an expert concept map (Appendix C) and a scoring rubric (Appendix D) to oversee students when constructing concept maps. The scoring rubric used to combine the qualitative analysis of framework structure and the quantitative analysis of links, in order to provide a valuable tool to highlight the key characteristics of concept maps. The approach to concept map scoring in the study represents a distinct departure from traditional methods that focus on characteristics such as hierarchy and branching. A large body of research has demonstrated the utility of such methods in the assessment of higher-level learning outcomes.
Kinchin et al. (2000) classification put forward the qualitative “spoke-chain-net“ to describe the radical changes in a concept map. In addition, the degree of valid crosslink age, the amount of branching and the hierarchical structure are included in the analysis because they reflect associative and super ordinate-subordinate categorical relationships among concepts. The concept maps have three dimensions of quantitative analysis: The links’ validity, convergence and salience. McClure, Sonak and Suen (1999) expressed that links in the map is the most reliable scoring way. The most difficult problem which students have got reveals a good deal of depth understanding. In the scoring rubric, each proposition is scored from zero to three; If any of the essential concepts were missing, the students’ knowledge of the concepts could not be determined. Students then received a score of zero and zero is assigned to invalid links, the links that were constructed based on false knowledge. The link that connects interrelated concept is assigned one but that misses the label. The link that is scientifically correct is two point and has a possible label indicated, but does not explicit the direction. If students had all of the pertinent links and correct answer concepts somewhere on their map, they received a score of 3 that is, nothing was missing. The correctly labeled links with the directions clearly by an arrow is three points. Convergence measures the extent to which the possible links are actualized in the students’ maps. The convergence score is computed as the number of the valid links in a map divided by the number of all possible links as derived from the expert map. Finally, salience measures the plenty of valid links. Salience is computed as the number of valid links divided by the number of all links in a student’s map (BouJaoude and Attieh, 2008). This result compares very favorably with those reported in the literature on scoring
concept maps (Ruiz-Primo and Shavelson, 1996; Shavelson et al., 1993). Treatment This study was conducted over a 12 lecture hours. The experimental (Concept mapping) and control (traditional) groups were pre-tested using a teacher-constructed physics achievement pretest (Appendix A). The study was extended over six weeks. The class met two times per week. The material covered was electricity which involves electric current, resistor, electrical energy, electrical power, voltage, electrical energy, voltage, electrical circuit, luminosity of lamps and electromotor force (e.m.f.). At the end of the treatment period, the students were post-tested (Appendix B). Study participants were randomly assigned to two classes. One teacher trained the experimental group to construct concept maps as homework and the same teacher taught the control group in which students covered the same physics content with rote learning as training lectures. Teaching with concept maps was being used at grade 4, 5 and 6 students in 2007 while grade 7, 8 and 9 students are not used in official curriculum. The teacher followed a teaching pacing chart which contained a detailed description of the content and teaching methods to construct concept map in experimental class. Students in the control group completed traditional learning method during the six weeks of the study. The treatment period was divided in to two parts. The first part consisted of one week during which the experimental group students were explained what concept maps were. The second part consisted of six weeks during which the experimental group students were required to submit concept map constructed by using the concepts taught in class. These assignments were scored and students were provided with detailed feedback. Teacher did not give the topics from the concept maps during the courses. Students in the control group completed traditional homework assignments during the six weeks of the study. The average achievement of the two classes was equivalent during the first semester of the academic year. At the end of the treatment period, both the experimental and control group students took the posttest and concept maps attitude Scale at the same time.�The participants according to gender and groups are shown in Table 1. RESULTS Pretest Based on the data obtained by the PAET, the students’ mean and standard deviation for pretest scores for experimental and control groups were shown in Table 2. The mean score of the pretest for the experimental group was found to be 26.01, while that of the control group
728 Int. J. Phys. Sci.
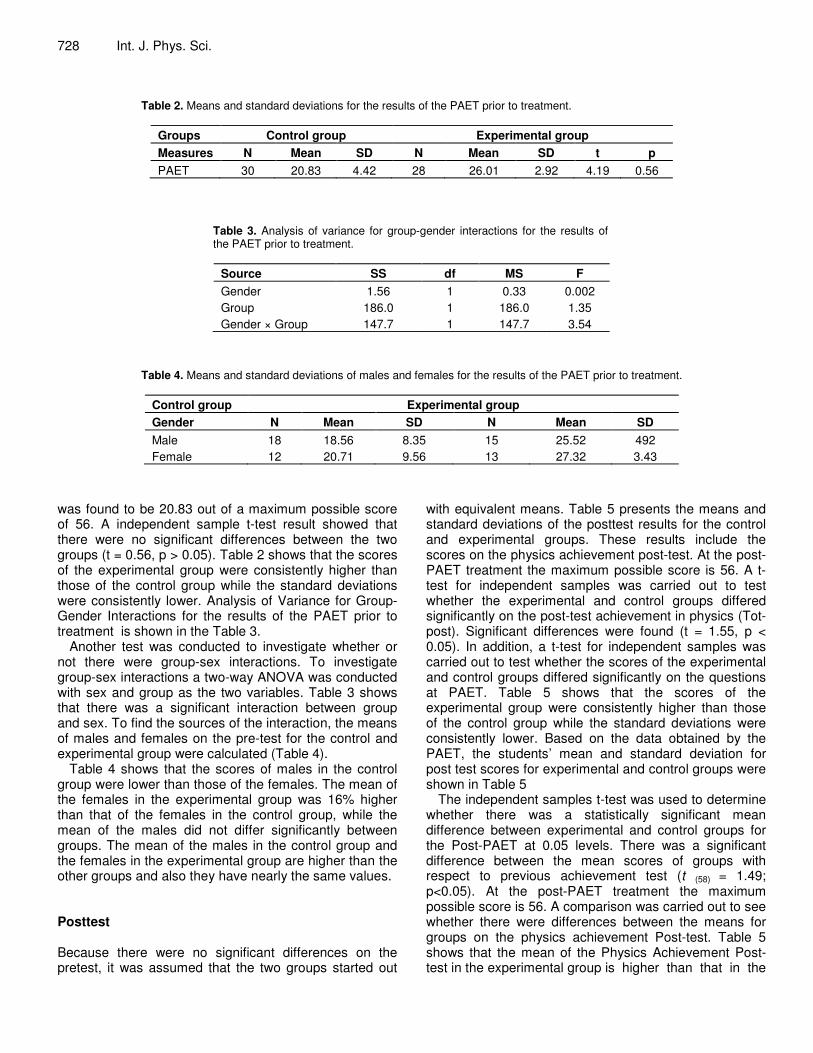
Table 2. Means and standard deviations for the results of the PAET prior to treatment.
Groups Control group Experimental group Measures N Mean SD N Mean SD t p PAET 30 20.83 4.42 28 26.01 2.92 4.19 0.56
Table 3. Analysis of variance for group-gender interactions for the results of the PAET prior to treatment.
Source SS df MS F Gender 1.56 1 0.33 0.002 Group 186.0 1 186.0 1.35 Gender × Group 147.7 1 147.7 3.54
Table 4. Means and standard deviations of males and females for the results of the PAET prior to treatment.
Control group Experimental group Gender N Mean SD N Mean SD Male 18 18.56 8.35 15 25.52 492 Female 12 20.71 9.56 13 27.32 3.43
was found to be 20.83 out of a maximum possible score of 56. A independent sample t-test result showed that there were no significant differences between the two groups (t = 0.56, p > 0.05). Table 2 shows that the scores of the experimental group were consistently higher than those of the control group while the standard deviations were consistently lower. Analysis of Variance for Group-Gender Interactions for the results of the PAET prior to treatment is shown in the Table 3.
Another test was conducted to investigate whether or not there were group-sex interactions. To investigate group-sex interactions a two-way ANOVA was conducted with sex and group as the two variables. Table 3 shows that there was a significant interaction between group and sex. To find the sources of the interaction, the means of males and females on the pre-test for the control and experimental group were calculated (Table 4).
Table 4 shows that the scores of males in the control group were lower than those of the females. The mean of the females in the experimental group was 16% higher than that of the females in the control group, while the mean of the males did not differ significantly between groups. The mean of the males in the control group and the females in the experimental group are higher than the other groups and also they have nearly the same values. Posttest Because there were no significant differences on the pretest, it was assumed that the two groups started out
with equivalent means. Table 5 presents the means and standard deviations of the posttest results for the control and experimental groups. These results include the scores on the physics achievement post-test. At the post-PAET treatment the maximum possible score is 56. A t-test for independent samples was carried out to test whether the experimental and control groups differed significantly on the post-test achievement in physics (Tot-post). Significant differences were found (t = 1.55, p < 0.05). In addition, a t-test for independent samples was carried out to test whether the scores of the experimental and control groups differed significantly on the questions at PAET. Table 5 shows that the scores of the experimental group were consistently higher than those of the control group while the standard deviations were consistently lower. Based on the data obtained by the PAET, the students’ mean and standard deviation for post test scores for experimental and control groups were shown in Table 5
The independent samples t-test was used to determine whether there was a statistically significant mean difference between experimental and control groups for the Post-PAET at 0.05 levels. There was a significant difference between the mean scores of groups with respect to previous achievement test (t (58) = 1.49; p<0.05). At the post-PAET treatment the maximum possible score is 56. A comparison was carried out to see whether there were differences between the means for groups on the physics achievement Post-test. Table 5 shows that the mean of the Physics Achievement Post-test in the experimental group is higher than that in the

Karakuyu 729
Table 5. Means and standard deviations for overall differences in PAET after the treatment. Groups Control group Experimental group Measures N Mean SD N Mean SD t p PAET 30 28.53 2.21 28 37.76 1.32 1.49 0.00
Table 6. Analysis of variance for group-gender interactions for the results of the PAET after the treatment.
Source SS df MS F Gender 0.33 1 0.33 0.002 Group 195.95 1 195.95 1.00 Gender X Group 167.67 1 167.67 2.12
Table 7. Means and standard deviations of males and females for overall differences in PAET after the treatment.
Control group Experimental group Gender N Mean SD N Mean SD
Male 18 30.07 5.04 15 40.56 4.86 Female 12 27.22 8.23 13 37.55 3.43
Table 8. Means and standard deviations of the variables used in the study for the control and experimental groups at the concept maps attitude scale towards physics (CMASTP).
Groups Control group Experimental group Measures N Mean SD N Mean SD t sig. CMASTP 30 22.83 14.34 28 25.01 14.67 7.05 0.00
control group. The results showed that there were significant differences between the dependent variables in the teaching methods used.
To investigate group-sex interactions a two-way ANOVA was conducted with sex and group as the two variables. Table 6 shows that there was a significant interaction between group and sex. To find the sources of the interaction, the means of males and females on the Post-test for the control and experimental group were calculated (Table 7). There was significant difference between the mean scores of groups with respect to previous achievement test.
The students in the experimental group who were subjected to concept maps instruction demonstrated better performances on post-PAET scores than the control group students who were subjected to traditional instruction. Table 7 shows that the scores of females in the control group were lower than those of the males. The mean of the males in the experimental group was the highest in the groups. There was significant difference between the Physics Achievement Post-Test and Physics Achievement Pre-Test.
Concept maps attitude scale The study of CMASTP was applied to 58; 9th grade students in an urban high school (Appendix E). The internal consistency reliability of the scale was found to be 0.86. This test was performed to students in both groups before the treatment. The independent sample t-test was used to determine whether there was a statistically significant mean difference between experimental and control groups for the concept maps attitude scale towards physics (CMASTP) test at 0.05 levels. There was a significant difference between the mean scores of groups (t (58) = 17.05; p < 0.05).
Table 8 shows that the students in the experimental group who were subjected to concept maps instruction demonstrated better performances on (CMASTP) scores than the control group students who were subjected to traditional instruction. At the CMASTP the maximum possible score is 105. The results showed that there were significant differences between the dependent variables in the teaching methods used. The correlation between the physics total post-test scores and the concept map

730 Int. J. Phys. Sci. attitude Scale test indicated that students’ concept mapping as a training method, performed better on high cognitive level questions. DISCUSSION According to new elementary education curricula concept maps were being used in grade 4, 5 and 6 students. Following years according to new curriculum concept maps will be used at the other elementary and secondary grade students. Concept mapping as training tools was expected to result in higher achievement in physics. This expectation was based on the assumption that concept mapping helps organize information. Results showed that the mean score of the physics achievement post-test for the experimental group was more than the control group. A study on the sixth year primary school students whom were training with concept maps through an electric unit, were found to be significantly higher than the students in the control group to whom using no method (Öner and Arslan, 2005). Further analyses investigated the interaction between sex and the effect of concept mapping as a training method. There were no significant interactions between sex and groups at the PAET pre-test. Concept mapping method favored boys over girls in the PAET pre and post-tests. The significant interactions between concept mapping and sex can be interpreted in light of the cognitive style theory that categorizes males and females into different learning styles. According to Wapner (1986), males are field-independent learners while females are field-dependent learners. Field independent individuals, such as males, use active reasoning patterns that include cognitive structuring skills, while field dependent individuals, such as females, accept reality and may become passive learners. The results of this study might seem to harmonious the conclusions derived from cognitive style theory. On the other hand, studies have shown that concept map construction is difficult (Lehman et al., 1985) and that students need excessive training to master the concept mapping technique (Beyerebach and Smith, 1990; Brandt et al., 2001). BouJaoude and Attieh (2008) found that there was an effect by concept mapping as study tools on achievement in chemistry lectures. In that study results showed that while there were no significant differences on the achievement total score, there were significant differences favoring the experimental group for scores on the knowledge level questions.
The means of PAET in the experimental group were higher than those in the control group. These results showed that concept mapping helped students who scored below the test scores to achieve better on high cognitive level questions. Stensvold and Wilson (1992) got similar results in their two studies with grade 9 and high school students. Among students with high abilities, those who constructed concept maps scored lower on the
comprehension test than those who did not construct maps. However, among students with lower abilities, those who constructed concept maps scored higher than those who did not. Stensvold and Wilson suggested that concept maps might have disadvantaged high ability students because they might have had their own successful strategies which were not applied when they used concept maps. The correlation between the physics post-test scores and the concept map attitude Scale test indicated that students who using concept-maps as a training method, performed better on high cognitive level questions. These results are in agreement with Novak’s (1994, 1998) description of meaningful learning as the establishment of non-arbitrary relations among concepts in the learners’ minds. Moreover, it highlights the importance of physics instruction that emphasizes identifying key concepts and stresses on teaching concepts and their relationships (Novak, 1994). Concept mapping is most useful if it is used as a study tool over the course of instruction. Students build concept maps in homework assignments recurrently, so they can correct their understandings about concept maps. It is expected that concept maps help students to overcome difficulties by integrating them into well-structured cognitive frameworks (BouJaoude and Attieh, 2008).
Thus, it can be concluded that concept mapping involved students who use concept maps as a training method relating new information to prior knowledge resulting in meaningful learning and consequently higher achievement. Concept maps help the students to answering the questions. However, concept mapping as a training method is not a solution for all problems in learning physics there are physics concepts that are abstract, non-intuitive and not directly interrelated and cannot be taught by concept mapping as a training method. Conclusion It is seen in this research, concept map is used as a way for teaching a lot of difficult physical complex concepts and knowledge in physics. Secondary ninth-grade students in electricity lecture in physics course, the learning and recalling levels of the students in experimental group to whom were taught by concept mapping as a training method were found to be significantly higher than the students in the control group to whom learning traditional method. The results of the study support concept mapping as a training method to engage students in learning and recalling their own knowledge structures, with the understanding that there is a need to help females in being more engaged in using the technique because of its possible benefits. In addition, concept mapping was a successful tool in helping low achiever students to improve their grades. And also concept mapping as a training method may

become effective for high achievers too because concept maps are one of our visual educational tools. The results of this and others studies on concept mapping as a training method are not conclusive. As a result, more research must be conducted to test further the effect of concept mapping as a training method with a larger number of students, in different types of schools and for different age groups. Other areas for further investigation include the amount of time needed to reap the benefits of concept mapping in a classroom setting and the possible benefits derived from using computers in the process.
Results about the effect of attitude on students’ concept mapping performance in this study must be viewed very conservatively because of the limited nature of the instrument used in characterizing students’ attitudes toward mapping. Although there was a significant difference between the mean scores of groups, this result provide some support for the argument that attitude, particularly a negative one, was not a factor in concept map scores. The establishment of concept mapping as a valid measure of student learning in the context of this study can be a factor in concept map scores. To become united whole of the process of teaching concept mapping into the existing curriculum, as described earlier, produced less distribution to normal class routines may account for the fact that concept mapping. This was generally perceived in a positive light by students in the study. The research project was also a primary consideration in choosing not to use a more extensive, formal attitude survey focusing on concept maps. REFERENCES Acton WH, Johnson PJ, Goldsmith TE (1994). Structural knowledge
assessment: Comparison of referent structures. J. Edu. Psychol. 86: 303-311.
Ambe E, Reid-Griffin A (2009). Using concept maps in ınstructional planning: An ınnovative approach to teaching pre-service educators. Southeastern Teacher Edu. J. 2(2): 167-179.
Anderson T, Huang SCC (1989). On using concept maps to assess the comprehension effects of reading expository text (Tech. Rep. No. 483). Cambridge, MA: Center for the Study of Reading. (ERIC Document Reproduction Service No. ED 310 368).
Ausubel D (1968). Educational psychology: A cognitive view. New York: Holt Rinehart and Winston.
Balim AG, �nel D, Evrekli E (2008). The Effects the Using of Concept Cartoons in Science Education on Students’ Academic Achievements and Enquiry Learning Skill Perceptions, Elementary Education Online, 7(1): 188-202.
Beyerebach B, Smith J (1990). Using a computerized concept mapping program to assess preservice teachers’ thinking about effective teaching. J. Res. Sci. Teaching, 27: 961-971.
BouJaoude S, Attieh M (2008). The Effect of Using Concept Maps as Study Tools on Achievement in Chemistry. Eurasia J. Math. Sci. Technol. Edu. 4(3): 233-246.
Brandt L., Elen J, Hellemans J, Heerman L, Couwenberg I, Volckaert L, Morisse H (2001). The impact of concept mapping and visualization on the learning of secondary school physics students. Int. J. Sci. Edu. 23: 1303-1313.
Eddie L, Claudia TM (2004). Using Scoring Rubrics to Evaluate Inquiry. Journal of College Science Teaching; Sep 2004; 34, 1; Academic Research Library. p. 34.
Erdo�an Y (2000). “Bilgisayar Destekli Kavram Haritalarının Matematik
Karakuyu 731 Ö�retiminde Kullanılması”, Marmara Üniversitesi Fen Bilimleri
Enstitüsü, Yayınlanmamı� doktora tezi, �stanbul. Fisher KM, Wandersee JH, Moody DE (2000). Mapping biology
knowledge. Kluwer, Dordrecht. Gabel D (1999). Improving teaching and learning through chemistry
education research: A look to the future. J. chem. Edu. 76: 548-554. Horton PB, McConney AA, Gallo M, Woods AL, Senn GJ, Hamelin D
(1993). An investigation of the effectiveness of concept mapping as an instructional tool. Sci Educ, 77: 95Y111.
Ingec S (2009). Analysing concept maps as an assessment tool in teaching physics and comparison with the achievement tests. International Int. Journal J. of Science. EducationEdu., 31(14): 1897-1915. doi:10.1080/09500690802275820.
Johnstone A, Otis K (2006). Concept mapping in problem based learning: A cautionary tale. Chemistry Education Research and Practice, 7: 84.95.
Jonasse NDH (2006). Toward A Design Theory Of Problem Solving. Educational Technology Research and Development, 48(4):, 63-85, doi: 10.1007/BF02300500.
Kane M, Trochim WMK (2007). Concept Mapping for Planning and Evaluation. Thousand Oaks, CA: Sage.
Kinchin I, Alias M (2005). Exploiting variations in concept map morphology as a lessonplanning tool for trainee teachers in higher education. Journal of In-service Education, 31(3): 569-591.
Kinchin I, Hay D, Adams A (2000). How a qualitative approach to concept map analysis can be used to aid learning by illustrating patterns of conceptual development. Educational Research, 42: 43-57.
Lay-Dopyera M, Beyerbach B (1983). Concept mapping for individual assessment. Syracuse, NY: Syracuse University, School of Education. (ERIC Document Reproduction Service No. ED 229 399).
Lehman J, Carter C, Kahle J (1985). Concept mapping, Vee mapping, and and achievement: Results of a field study with black high school students. Journal of Research in Science Teaching, 22: 663-673.
Markow P, Lonning R (1998). Usefulness of concept maps in college chemistry laboratories: Students’ perceptions and effects on achievement. Journal of Research in Science Teaching, 35: 1015-1029.
McClure J, Sonak B, Suen H (1999). Concept map assessment of classroom learning: Reliability, validity for science curriculum development: Towards improvement in process and product. Journal of Research in Science Teaching, 27: 987-1000.
Merrienboer JJG, Kirschner PA (2001). “Three Worlds of Instructional Design: State of Art and Future Directions, Instructional Science, 29(4-5): 429-441.
Novak J, Gowin B (1984). “Learning How to Learn” , Cambridge University Press, USA.
Novak J (1998). Learning, creating, and using knowledge: concept maps as facilitative tools in schools and corporations. New Jersey: Erlbaum.��
Novak J, Bradford DP, Richard LB (1994) Concept Maps as a Tool To Assess Learning in Chemistry J. Chem. Educ., 71 (1), p 9.
Cañas AJ, Novak JD (2005). The Theory Underlying Concept Maps and How to Construct and Use Them, Technical Report IHMC CmapTools Florida Institute for Human and Machine Cognition.
Öner F, Arslan M (2005). “�lkö�retim 6. Sınıf Fen Bilgisi Dersi Elektrik Ünitesinde Kavram Haritaları �le Ö�retimin Ö�renme Düzeyine Etkisi” TOJET ISSN: 1303-6521 Volume 4(4, Issue 4), Article 19. October 2005.
Rice D, Ryan J, Samson S (1998). Using Concept Maps to Assess Student Learning in the Science Classroom: Must Different Methods Compete? Journal of Research in Science Teaching, 35: 1103–1127.
Ruiz-Primo MA, Shavelson R (1996). Problems and issues in the use of concept maps in science assessment. Journal of Research in Science Teaching, 33: 569–600.
Schacter J, Herl HE, O'Neil Jr. HF, Chung GKWK (1999). Reliability And Validity of A Computer-Based Knowledge Mapping System To Measure Content Understanding , Computers in Human Behavior, 15: (1999) 403-418.
Shavelson R, Lang H, Lewin B (1993). On concept maps as potential “authentic” assessments in science. Los Angeles, CA: National Center for Research on Evaluation, Standards, and and Student

732 Int. J. Phys. Sci.
Testing. (ERIC Document Reproduction Service No. ED 367 691). Sizmur S, Osbourne J (1997). Learning processes and collaborative
concept mapping. Int J Sci Educ, 19(10):1117Y1135. Stensvold M, Wilson J (1992). Using concept maps as a tool to apply
chemistry concepts to laboratory activities. J. Chem. Educ., 69: 230-232.
Turkish Ministry of National Education (1992). Retrieved December 6, 2003, from http://www.ttkb.gov.tr.
Wapner S (1986). Introductory remarks. In M.Bertini, L. Pizzamiglio, &and S. Wapner (Eds). Field dependence in psychological theory, research, and and application. (p.1-4). Hillsale, NJ: Lawrence Erlbaun Associates.
White R, Gunstone R (1992). Probing understanding. New York: Falmer
Press. Willerman M, MacHarg R (1991). The concept map as an advance
organizer. J. Res. Sci. Teaching, 28: 705-712.

APPENDIX A Examples of items from the physics pre-test 1.
Given in the figure, What is the ratio of i1 / i2 =?
A) 1/4 B) 1/2 C) 1 D) 2 E) 2/3
2.
When the switches on, what is the relationships between the lights? (Cells and lamps are equivalent to each other) A) IL > IK > IM B) IM > IK > IL C) IK > IL > IM D) IK = IM > IL E) IL > IK = IM
3.
What is the resistance of resistor Rx=?
Karakuyu 733
A) 2 B) 4 C) 5 D) 6 E)8 4.
What is the relationships between V1, V2 and V3 ? A) V1 > V2 > V3 B) V2 > V1 > V3 C) V2
= V3 > V1 D) V1 > V2 = V3 E) V1=V2 > V3 5.
What is the equivalence resistance between K and L points?
A) B) R C) 3R/2 D) 2R E) 3R
6.

734 Int. J. Phys. Sci.
What will be the temperature of water after 5 min later? (cwater = 1 cal/g 0C , 1 cal � 4 J, Heat transfer is only between conductor and water) l
A) 81 0C B) 8.1 0C C) 810 0C D) 0. 81 0C E) 8110 0C
7.
The e.m.f of cells is 10 volt and the internal resistance of cells is 1 � a) What is the total e.m.f and total resistance? b) What is the value of current flows through resistor, 4 �?
8. What is the value of the given resistor R?
9. The e.m.f. of a cell is 1.5 V. What energy is dissipated by the cell if it drives 0.4 C of charge round the circuit? 10. What is the e.m.f. of a cell if it uses 4.2 J of energy as it pushes 6 coulombs of charge round a circuit? 11. 120 J of electrical energy are converted in a bulb as 10 coulombs of charge passes through the bulb. What is the voltage across the bulb? 12. What is the resistance of a 1.5 m long piece of wire if it has a cross-sectional area of 2 × 10⁻⁸ m² and a resistivity of 4 × 10⁻⁸ �m? 13. 2 kW kettle uses 3 TL of electricity in boiling some water in 5 min. What is the cost of a kWh of electricity? 14. What are the units that current is measured in? Unit: __________Symbol: __________
APPENDIX B Examples of items from the physics post-test. 1.
Electric circuits have equivalent resistance Ix, Iy and Iz currents pass through X, Y, Z resistor. What is the relationships between Ix, Iy and Iz ? A) 20 B) 40 C) 60 D) 80 E) 120
2.
What is the equivalence resistance between X and Y points? A) 1/2 B) 1 C) ) 3/2 D) 2 E) 4
3.
� Given at the figure, what is the relationship between the light. (Lamps give off the same colour of lights). A) X>Y>Z B) Y>X>Z C) Y>X>Z D) X>Z>Y E)Z>X>Y
4.

At the At the electrical circuits, current flows on the X resistor, is identical with Y resistor. According to the givens, what is the value of Y resistor? A) 7R/2 B) 7R C) 12R D) 14R E) 18R
5.
When X and Y switches on, which of the lamps light on? A) M and N B) L and K C) L and M D) M, N and K E) M, N and L.
6.
What will be the temperature of water after 5 minutes later? (cwater = = 1 cal/g 0C , 1 cal � 4 joule, Heat transfer is only between conductor and water) A) 81 0C B) 8. 1 0C C) 810 0C D) 0. 81 0C E) 8110 0C
Karakuyu 735 ���
Givens at the figure between X and Y points a) What is the value of total e.m.f ? b) What is the value of total internal resistor?
8. What is the current flowing through the circuit if the bulb has a resistance of 50 �?
9. The e.m.f. of a cell is 4 V. What energy is dissipated by the cell if it drives 8 C of charge round the circuit? 10. The e.m.f. of a cell is 4 V. What energy is dissipated by the cell in 20 seconds if a current of 2 amperes flows in the circuit? 11. When potential difference across a resistor R, is 4 V the current passing through it is 2 A. a) What is the resistance of the resistor, R? b) If the p.d. across R is doubled to 8 V, will the resistance of R change? c) What will be the current passing through the bulb? d) When the current is increased to a much higher value the resistor becomes hot. Would you still expect it to obey Ohm’s Law? Why? 12. What is the length of a piece of wire in a solenoid if the solenoid has a total resistance of 20 � and the wire has a cross-sectional area of 4 × 10⁻⁸ m² and a resistivity of 10 × 10-8 �m? 13. What is the cost of running a 2 kW air-conditioner from 9 p.m. to 7 a.m. if the cost of electricity is 15 TL per unit? 14. Not all fuses are the same, typical fuse ratings are 1, 3, 5 and 13 A. We always choose a fuse of the next highest power rating. a) If a bulb takes a current of 3.1 A, which fuse would you choose? b) If an appliance is stated to have a power rating of 300 W and is to be used with a 240 V supply, which fuse would you use?

736 Int. J. Phys. Sci.
Appendix C Expert concept map
Appendix D Scoring rubric of the concept map Student name 1.Map Structure: a. Spoke b. Chain c. Net
2. # of Correct Hierarchy levels: ______________ 3. # of Correct Cross-Link:__________________ 4. Quality of Propositions Invalid proposition:_______________x 0 = _____________ Possible relationship:_____________x 1 = _____________ Correct-label proposition:__________x 2 = _____________ Directional correct proposition:_____ x 3 = _____________ 5. Convergence Score =_____________ 6. Salience Score =_____________ Total =______________

Karakuyu 737 APPENDIX E Concept maps attitude scale towards physics (CMASTP)
Please mark the convenient suggestions given below: Absolutely agree Agree Not sure Disagree Absolutely disagree
Abs
olut
ely
agre
e
Agr
ee
Not
sur
e
Dis
agre
e
Abs
olut
ely
disa
gree
1. Concept maps are helped to establish relations between concepts. � � � � � 2. Concept maps are provided to see concepts as wholly. � � � � � 3. Using concept maps are developed relationships and social activities between our friends. � � � � � 4. Concept maps are made to repeating subjects easy. � � � � � 5. Drawing concept maps at the lessons are provided to see how subjects understanding. � � � � � 6. I love drawing concept maps. � � � � � 7. Using concept maps at the lessons are increased my achievements � � � � � 8. Concept maps are helped to establish relations between lessons subjects. � � � � � 9. Concept maps are helped to understand the subject better. � � � � � 10. Concept maps are the good method to learning science. � � � � � 11. Concept maps are made the complicated subjects more comprehensible. � � � � � 12. Concept maps are shown the subjects which are most important. � � � � � 13. Applying concept maps are easy. � � � � � 14. Drawing concept maps and filling the empty concept labels are guided us to researching. � � � � � 15. Concept maps are used very frequently at the lessons. � � � � � 16. I want concept maps to use very frequently at the lessons. � � � � � 17. I love using concept maps. � � � � �
�