An introduction to the use of Sun-photometry for the atmospheric … · An introduction to the use...
22
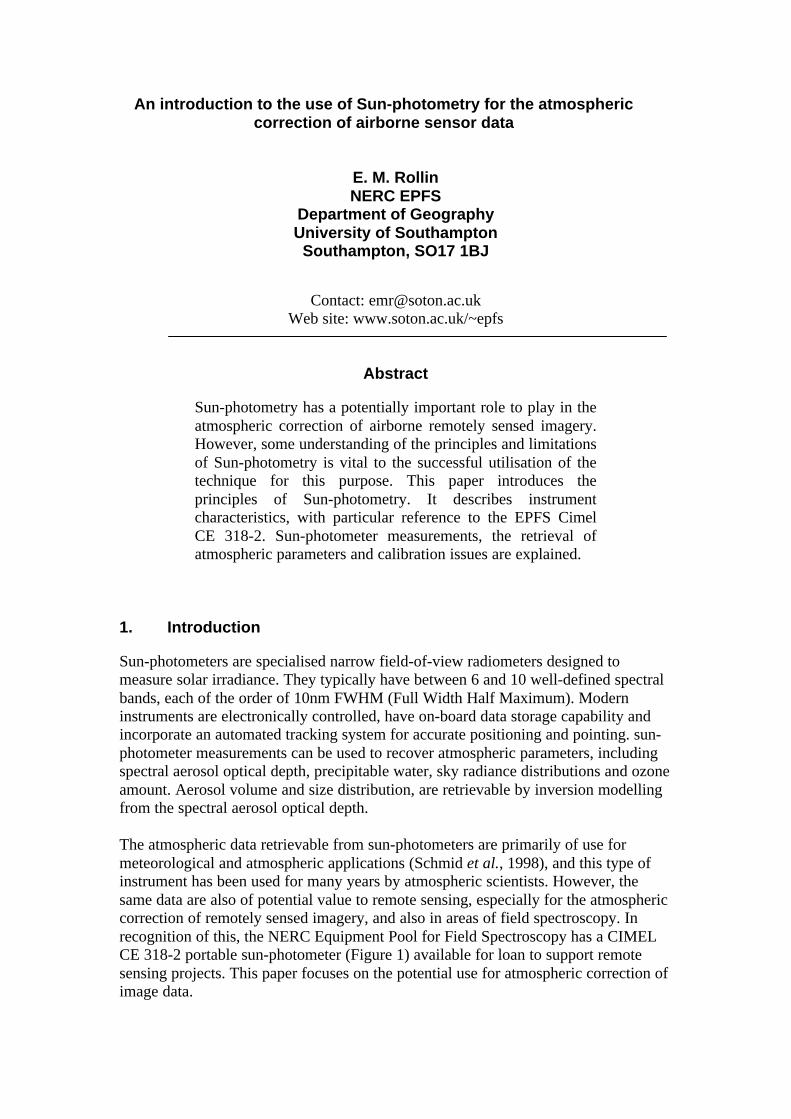
An introduction to the use of Sun-photometry for the atmospheric correction of airborne sensor data E. M. Rollin NERC EPFS Department of Geography University of Southampton Southampton, SO17 1BJ Contact: [email protected] Web site: www.soton.ac.uk/~epfs Abstract Sun-photometry has a potentially important role to play in the atmospheric correction of airborne remotely sensed imagery. However, some understanding of the principles and limitations of Sun-photometry is vital to the successful utilisation of the technique for this purpose. This paper introduces the principles of Sun-photometry. It describes instrument characteristics, with particular reference to the EPFS Cimel CE 318-2. Sun-photometer measurements, the retrieval of atmospheric parameters and calibration issues are explained. 1. Introduction Sun-photometers are specialised narrow field-of-view radiometers designed to measure solar irradiance. They typically have between 6 and 10 well-defined spectral bands, each of the order of 10nm FWHM (Full Width Half Maximum). Modern instruments are electronically controlled, have on-board data storage capability and incorporate an automated tracking system for accurate positioning and pointing. sun- photometer measurements can be used to recover atmospheric parameters, including spectral aerosol optical depth, precipitable water, sky radiance distributions and ozone amount. Aerosol volume and size distribution, are retrievable by inversion modelling from the spectral aerosol optical depth. The atmospheric data retrievable from sun-photometers are primarily of use for meteorological and atmospheric applications (Schmid et al., 1998), and this type of instrument has been used for many years by atmospheric scientists. However, the same data are also of potential value to remote sensing, especially for the atmospheric correction of remotely sensed imagery, and also in areas of field spectroscopy. In recognition of this, the NERC Equipment Pool for Field Spectroscopy has a CIMEL CE 318-2 portable sun-photometer (Figure 1) available for loan to support remote sensing projects. This paper focuses on the potential use for atmospheric correction of image data.
Transcript of An introduction to the use of Sun-photometry for the atmospheric … · An introduction to the use...
An introduction to the use of Sun-photometry for the atmosphericcorrection of airborne sensor data
E. M. RollinNERC EPFS
Department of GeographyUniversity of Southampton
Southampton, SO17 1BJ
Contact: [email protected] site: www.soton.ac.uk/~epfs
Abstract
Sun-photometry has a potentially important role to play in theatmospheric correction of airborne remotely sensed imagery.However, some understanding of the principles and limitationsof Sun-photometry is vital to the successful utilisation of thetechnique for this purpose. This paper introduces theprinciples of Sun-photometry. It describes instrumentcharacteristics, with particular reference to the EPFS CimelCE 318-2. Sun-photometer measurements, the retrieval ofatmospheric parameters and calibration issues are explained.
1. Introduction
Sun-photometers are specialised narrow field-of-view radiometers designed tomeasure solar irradiance. They typically have between 6 and 10 well-defined spectralbands, each of the order of 10nm FWHM (Full Width Half Maximum). Moderninstruments are electronically controlled, have on-board data storage capability andincorporate an automated tracking system for accurate positioning and pointing. sun-photometer measurements can be used to recover atmospheric parameters, includingspectral aerosol optical depth, precipitable water, sky radiance distributions and ozoneamount. Aerosol volume and size distribution, are retrievable by inversion modellingfrom the spectral aerosol optical depth.
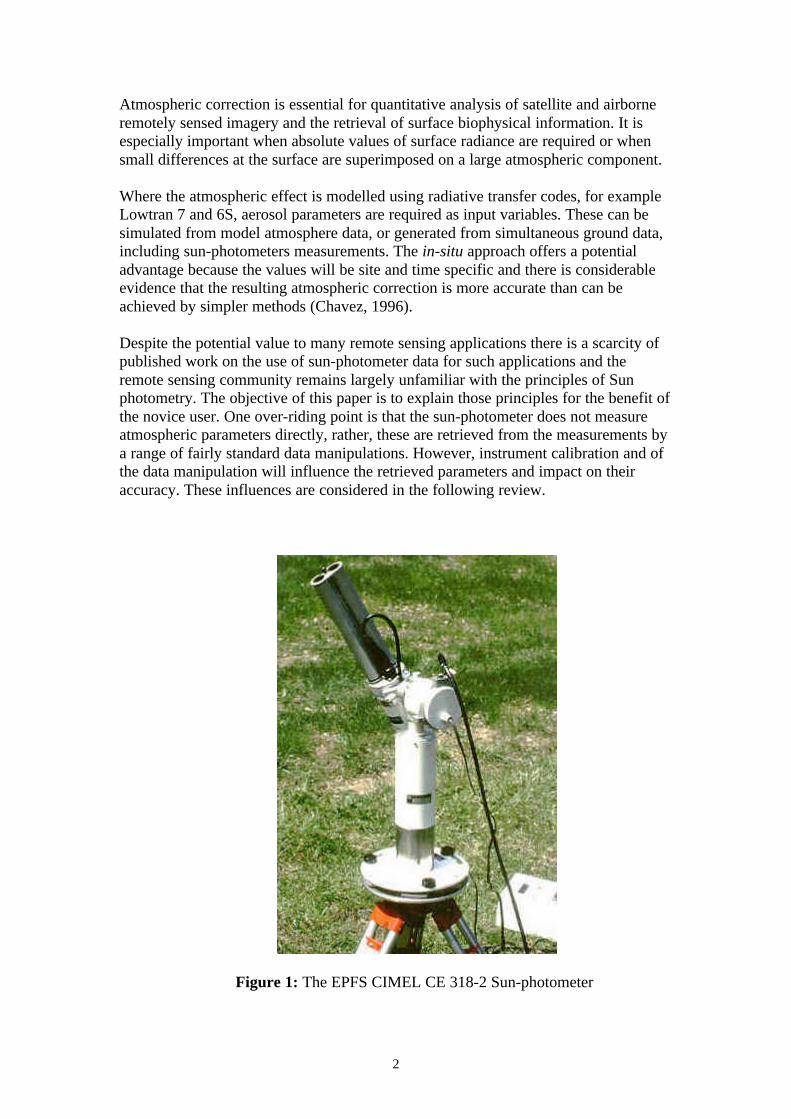
The atmospheric data retrievable from sun-photometers are primarily of use formeteorological and atmospheric applications (Schmid et al., 1998), and this type ofinstrument has been used for many years by atmospheric scientists. However, thesame data are also of potential value to remote sensing, especially for the atmosphericcorrection of remotely sensed imagery, and also in areas of field spectroscopy. Inrecognition of this, the NERC Equipment Pool for Field Spectroscopy has a CIMELCE 318-2 portable sun-photometer (Figure 1) available for loan to support remotesensing projects. This paper focuses on the potential use for atmospheric correction ofimage data.
2
Atmospheric correction is essential for quantitative analysis of satellite and airborneremotely sensed imagery and the retrieval of surface biophysical information. It isespecially important when absolute values of surface radiance are required or whensmall differences at the surface are superimposed on a large atmospheric component.
Where the atmospheric effect is modelled using radiative transfer codes, for exampleLowtran 7 and 6S, aerosol parameters are required as input variables. These can besimulated from model atmosphere data, or generated from simultaneous ground data,including sun-photometers measurements. The in-situ approach offers a potentialadvantage because the values will be site and time specific and there is considerableevidence that the resulting atmospheric correction is more accurate than can beachieved by simpler methods (Chavez, 1996).
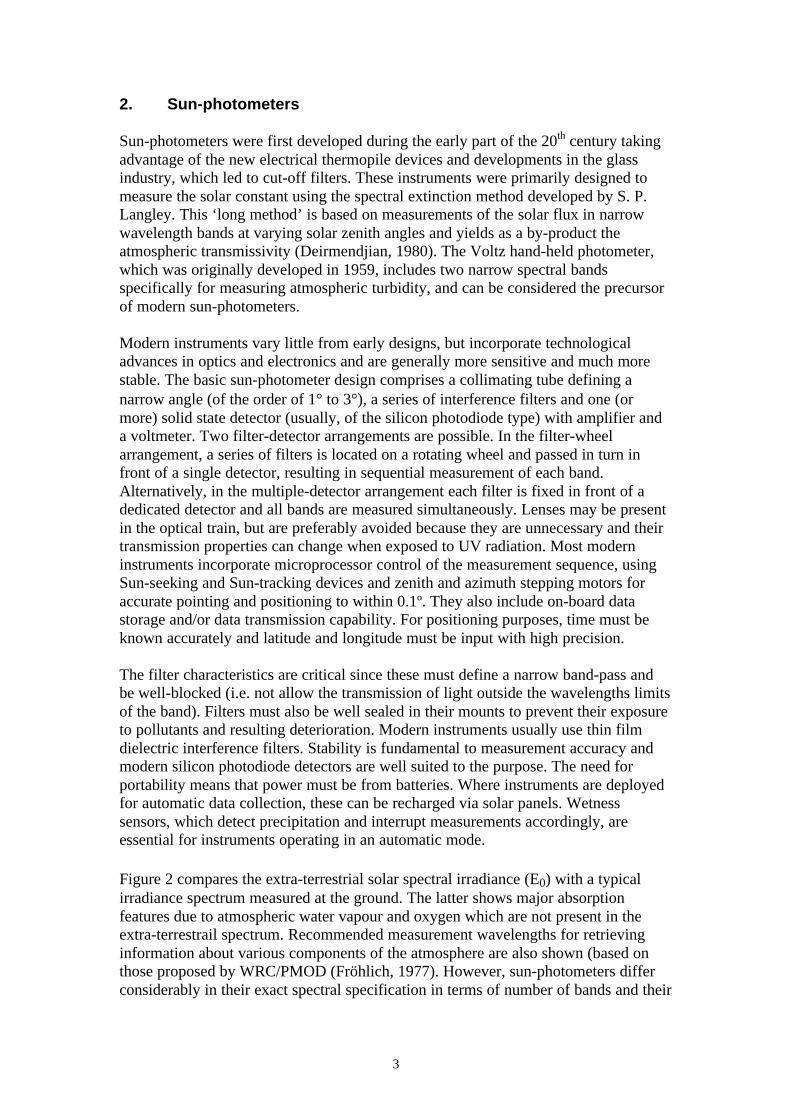
Despite the potential value to many remote sensing applications there is a scarcity ofpublished work on the use of sun-photometer data for such applications and theremote sensing community remains largely unfamiliar with the principles of Sunphotometry. The objective of this paper is to explain those principles for the benefit ofthe novice user. One over-riding point is that the sun-photometer does not measureatmospheric parameters directly, rather, these are retrieved from the measurements bya range of fairly standard data manipulations. However, instrument calibration and ofthe data manipulation will influence the retrieved parameters and impact on theiraccuracy. These influences are considered in the following review.
Figure 1: The EPFS CIMEL CE 318-2 Sun-photometer
3
2. Sun-photometers
Sun-photometers were first developed during the early part of the 20th century takingadvantage of the new electrical thermopile devices and developments in the glassindustry, which led to cut-off filters. These instruments were primarily designed tomeasure the solar constant using the spectral extinction method developed by S. P.Langley. This ‘long method’ is based on measurements of the solar flux in narrowwavelength bands at varying solar zenith angles and yields as a by-product theatmospheric transmissivity (Deirmendjian, 1980). The Voltz hand-held photometer,which was originally developed in 1959, includes two narrow spectral bandsspecifically for measuring atmospheric turbidity, and can be considered the precursorof modern sun-photometers.
Modern instruments vary little from early designs, but incorporate technologicaladvances in optics and electronics and are generally more sensitive and much morestable. The basic sun-photometer design comprises a collimating tube defining anarrow angle (of the order of 1° to 3°), a series of interference filters and one (ormore) solid state detector (usually, of the silicon photodiode type) with amplifier anda voltmeter. Two filter-detector arrangements are possible. In the filter-wheelarrangement, a series of filters is located on a rotating wheel and passed in turn infront of a single detector, resulting in sequential measurement of each band.Alternatively, in the multiple-detector arrangement each filter is fixed in front of adedicated detector and all bands are measured simultaneously. Lenses may be presentin the optical train, but are preferably avoided because they are unnecessary and theirtransmission properties can change when exposed to UV radiation. Most moderninstruments incorporate microprocessor control of the measurement sequence, usingSun-seeking and Sun-tracking devices and zenith and azimuth stepping motors foraccurate pointing and positioning to within 0.1º. They also include on-board datastorage and/or data transmission capability. For positioning purposes, time must beknown accurately and latitude and longitude must be input with high precision.
The filter characteristics are critical since these must define a narrow band-pass andbe well-blocked (i.e. not allow the transmission of light outside the wavelengths limitsof the band). Filters must also be well sealed in their mounts to prevent their exposureto pollutants and resulting deterioration. Modern instruments usually use thin filmdielectric interference filters. Stability is fundamental to measurement accuracy andmodern silicon photodiode detectors are well suited to the purpose. The need forportability means that power must be from batteries. Where instruments are deployedfor automatic data collection, these can be recharged via solar panels. Wetnesssensors, which detect precipitation and interrupt measurements accordingly, areessential for instruments operating in an automatic mode.
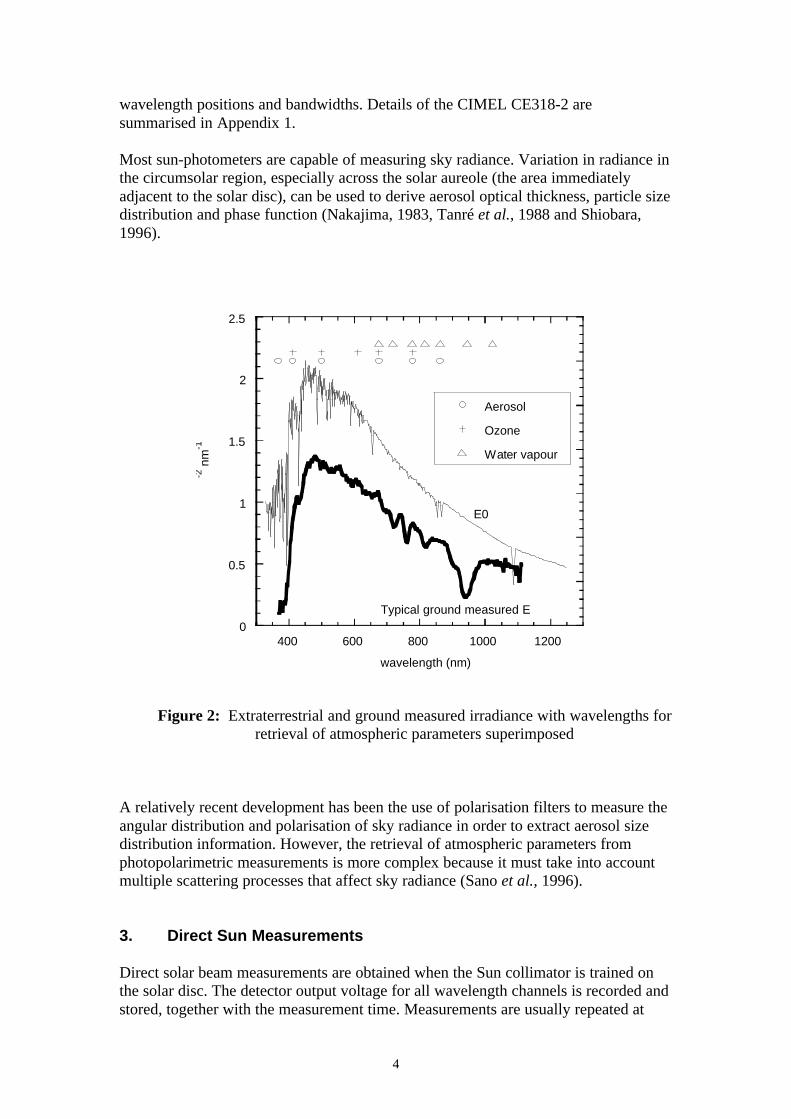
Figure 2 compares the extra-terrestrial solar spectral irradiance (E0) with a typicalirradiance spectrum measured at the ground. The latter shows major absorptionfeatures due to atmospheric water vapour and oxygen which are not present in theextra-terrestrail spectrum. Recommended measurement wavelengths for retrievinginformation about various components of the atmosphere are also shown (based onthose proposed by WRC/PMOD (Fröhlich, 1977). However, sun-photometers differconsiderably in their exact spectral specification in terms of number of bands and their
4
wavelength positions and bandwidths. Details of the CIMEL CE318-2 aresummarised in Appendix 1.
Most sun-photometers are capable of measuring sky radiance. Variation in radiance inthe circumsolar region, especially across the solar aureole (the area immediatelyadjacent to the solar disc), can be used to derive aerosol optical thickness, particle sizedistribution and phase function (Nakajima, 1983, Tanré et al., 1988 and Shiobara,1996).
0
0.5
1
1.5
2
2.5
400 600 800 1000 1200
Aerosol
Ozone
Water vapour
-2 n
m-1
wavelength (nm)
E0
Typical ground measured E
Figure 2: Extraterrestrial and ground measured irradiance with wavelengths forretrieval of atmospheric parameters superimposed
A relatively recent development has been the use of polarisation filters to measure theangular distribution and polarisation of sky radiance in order to extract aerosol sizedistribution information. However, the retrieval of atmospheric parameters fromphotopolarimetric measurements is more complex because it must take into accountmultiple scattering processes that affect sky radiance (Sano et al., 1996).
3. Direct Sun Measurements
Direct solar beam measurements are obtained when the Sun collimator is trained onthe solar disc. The detector output voltage for all wavelength channels is recorded andstored, together with the measurement time. Measurements are usually repeated at
5
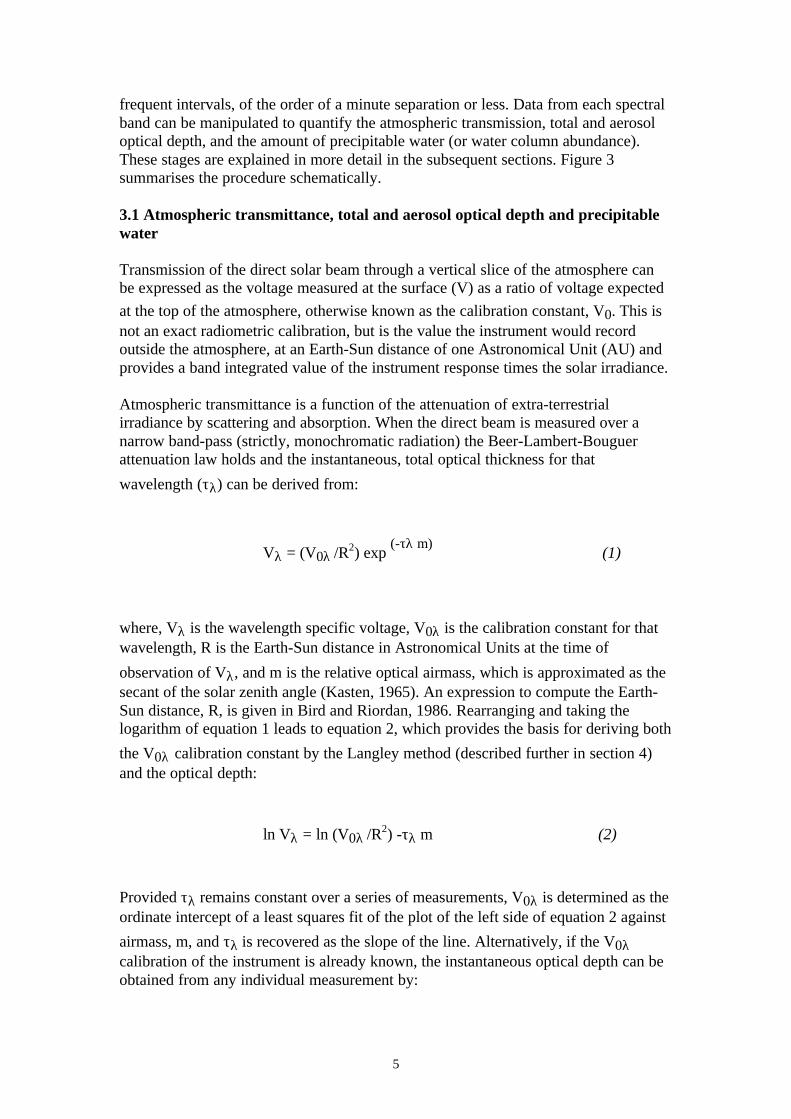
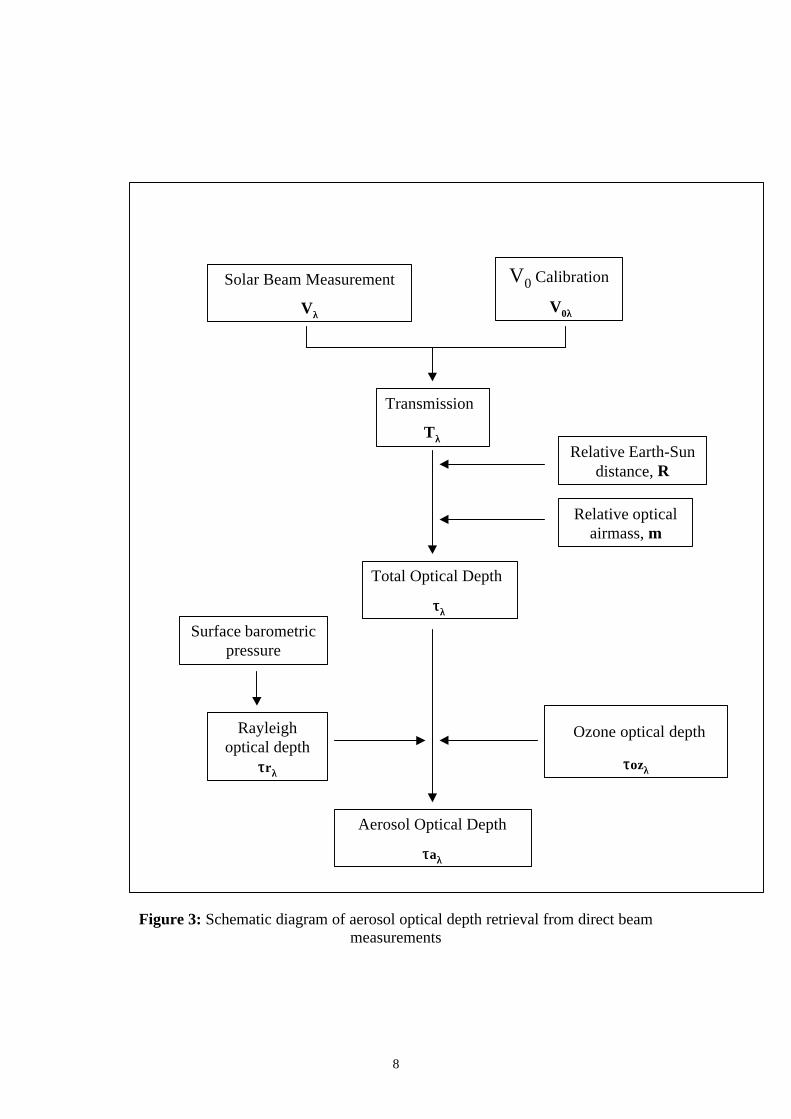
frequent intervals, of the order of a minute separation or less. Data from each spectralband can be manipulated to quantify the atmospheric transmission, total and aerosoloptical depth, and the amount of precipitable water (or water column abundance).These stages are explained in more detail in the subsequent sections. Figure 3summarises the procedure schematically.
3.1 Atmospheric transmittance, total and aerosol optical depth and precipitablewater
Transmission of the direct solar beam through a vertical slice of the atmosphere canbe expressed as the voltage measured at the surface (V) as a ratio of voltage expected
at the top of the atmosphere, otherwise known as the calibration constant, V0. This isnot an exact radiometric calibration, but is the value the instrument would recordoutside the atmosphere, at an Earth-Sun distance of one Astronomical Unit (AU) andprovides a band integrated value of the instrument response times the solar irradiance.
Atmospheric transmittance is a function of the attenuation of extra-terrestrialirradiance by scattering and absorption. When the direct beam is measured over anarrow band-pass (strictly, monochromatic radiation) the Beer-Lambert-Bouguerattenuation law holds and the instantaneous, total optical thickness for that
wavelength (τλ) can be derived from:
Vλ = (V0λ /R2) exp
(-τλ m) (1)
where, Vλ is the wavelength specific voltage, V0λ is the calibration constant for thatwavelength, R is the Earth-Sun distance in Astronomical Units at the time of
observation of Vλ, and m is the relative optical airmass, which is approximated as thesecant of the solar zenith angle (Kasten, 1965). An expression to compute the Earth-Sun distance, R, is given in Bird and Riordan, 1986. Rearranging and taking thelogarithm of equation 1 leads to equation 2, which provides the basis for deriving both
the V0λ calibration constant by the Langley method (described further in section 4)and the optical depth:
ln Vλ = ln (V0λ /R2) -τλ m (2)
Provided τλ remains constant over a series of measurements, V0λ is determined as theordinate intercept of a least squares fit of the plot of the left side of equation 2 against
airmass, m, and τλ is recovered as the slope of the line. Alternatively, if the V0λcalibration of the instrument is already known, the instantaneous optical depth can beobtained from any individual measurement by:
6
τλ = - ln Vλ /(V0λ /R2) / m (3)
The accuracy with which τλ can be retrieved depends on the uncertainty of the Vλ
measurement and the accuracy of the V0λ value. Modern silicon photodiode detectors
are very high precision, so the uncertainty in Vλ can be ignored. The accuracy of V0λis considered in section 4.
The total optical depth (τλ) is the result of attenuation by molecules (Rayleighscattering), aerosols (Mie scattering, resulting from interaction of the radiation withlarger particles), ozone, water vapour and other uniformly mixed gases. Each of these
components can be separated. The Rayleigh component (τrλ) is readily calculated,depending only on the wavelength and barometric pressure at the surface (Hansen andTravis, 1974). Ozone has a variable but small effect which can be calculated based ontabulated values of the ozone absorption coefficient and assumptions about the ozoneamount in Dobson units (e.g. Komhyr et al., 1989). The effect of other mixed gases isconstant but most sun-photometers use bands outside their influence, so theircontribution can usually be ignored. This leaves aerosol and water vapour as thelargest variable components and both of these may vary enormously in space andtime.
The aerosol optical depth (τaλ) can be obtained by subtraction of the Rayleigh (τrλ)
and ozone (τozλ) components from the total optical depth:
τaλ = τλ - τozλ - τrλ (4)
Absorption by water vapour, is restricted to narrow spectral bands. The extraction ofwater vapour amount from sun-photometer measurements generally relies on ameasurement in the region of water vapour absorption at 940nm. The aerosol effect isremoved by extrapolating the value based on an adjacent band outside the absorptionor, by interpolation between two adjacent bands. Equation 1 is not valid sinceexponential attenuation applies strictly to monochromatic radiation and is invalidacross the broad region of water vapour absorption. Transmission in the water vapour
band (Tw) can be modelled as:
Tw = exp( - ambW
b) (5)
where W is vertical column abundance and constants a and b depend on thewavelength position, width and shape of the sun-photometer filter function, and theatmospheric conditions (temperature-pressure lapse and the vertical profile of watervapour band). Halthore et al., (1997) showed that for a narrow (less than 10nm) band,sensitivity to the atmosphere can be removed and the following equation holds:
7
Vλ = (V0λ /R2) exp
(-mτ)exp
(-awb)(6)
where τ is the Rayleigh plus aerosol optical depth, which are estimated independently(as described above) and w is the water column abundance (equal to the airmass, m,multiplied by the precipitable water (PW). A modified Langley calibration is neededfor the water vapour band (see section 4.1).
3.2 Spectral aerosol optical depth and aerosol particle size distributions
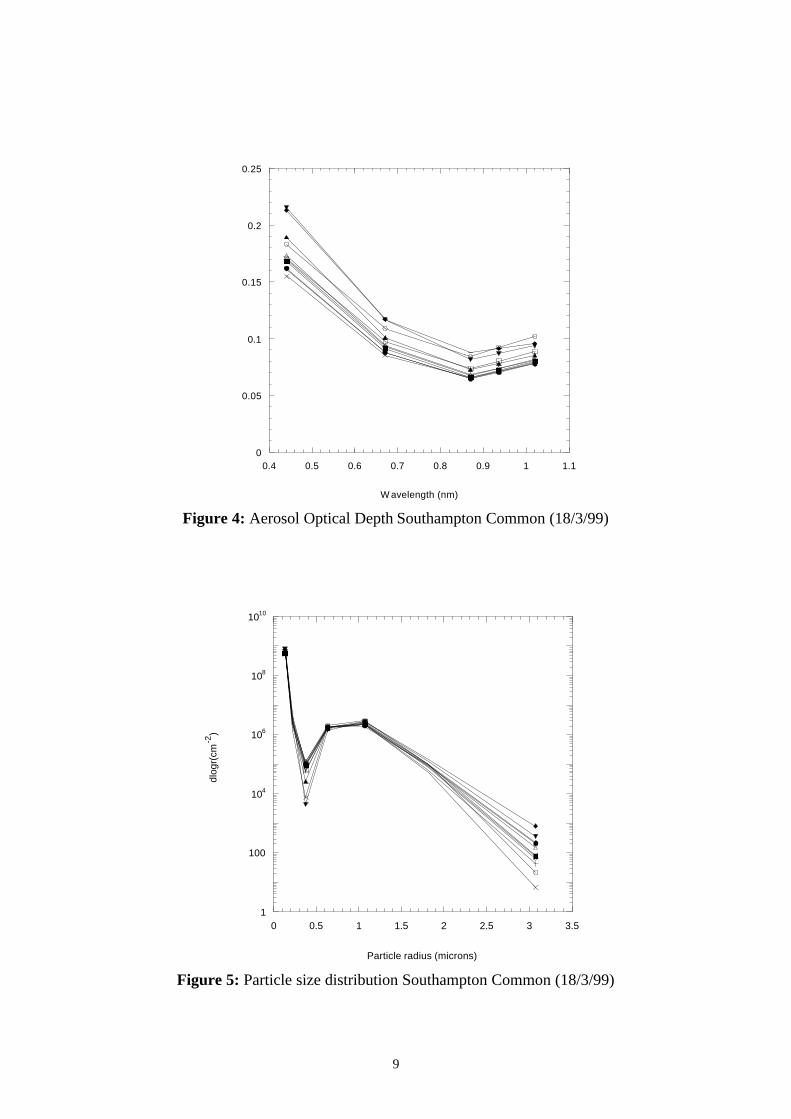
The variation in aerosol optical depth with wavelength, or the spectral aerosol optical
depth (τaλ), defines the attenuation of solar irradiance as a function of wavelength andprovides the basis for retrieving the columnar size distribution of the atmosphericaerosol. Figure 4 shows the spectral aerosol optical depth obtained from sun-photometer measurements at Southampton Common on 18/03/99. The relationshipbetween the wavelength dependence of the spectral aerosol optical depth and the sizeof atmospheric aerosol particles was first suggested by Ångström (1929). Since then,a variety of numerical inversion methods have been developed to derive aerosol sizedistribution from spectral optical depth measurements (e.g. Yamamoto and Tanaka,1969, King et al., 1978). Some inversion algorithms superimpose the particle sizesbased on a mathematical fit of the data (e.g. to Gaussian or Jungian distributions).Others derive the shape of the particle size distribution curve by an iterativeprocedure. Figure 5 shows the particle size calculated from the spectral aerosol opticaldepth data from Southampton Common shown in Figure 4.
These numerical inversions produce values of the columnar size distribution, dN/d(logR). These units are cm-2 for each particle sizes (defined in terms of particle radius,and assuming a spherical shape). To convert from the columnar size distribution to thenumber of particles per unit volume (i.e. per cm-3), dN/d(log R) should be divided bythe height of the column, H. This assumes the aerosol is uniformly distributedthroughout the column, when in fact under normal conditions in the real atmospheremost of the aerosol is confined to the boundary layer, or lowest 2km of theatmosphere. Values of dN/d(log R) can be converted to volume distributions(dV/d(logR)) which contains more information about the aerosol loading of theatmosphere, by multiplying by 4/3πR3, where R is the median radius of the size bin.
Limitations of the inversion procedure include the accuracy with which themeasurement wavelength is known and the number and range of wavelengths over
which τaλ is measured (Amato et al., 1995). King et al. (1978) point out thatmeasurements must be made over sufficient wavelengths that the inversions are notaffected by the sensitivity to the radii limits of maximum sensitivity and the refractiveindex values assumed in the inversions.
8
Figure 3: Schematic diagram of aerosol optical depth retrieval from direct beammeasurements
Solar Beam Measurement
Vλλ
V0 Calibration
V0λλ
Transmission
TλλRelative Earth-Sun
distance, R
Relative opticalairmass, m
Total Optical Depth
ττλλ
Surface barometricpressure
Rayleighoptical depth
ττrλλ
Ozone optical depth
ττozλλ
Aerosol Optical Depth
ττaλλ
9
0
0.05
0.1
0.15
0.2
0.25
0.4 0.5 0.6 0.7 0.8 0.9 1 1.1
W avelength (nm)
Figure 4: Aerosol Optical Depth Southampton Common (18/3/99)
1
100
104
106
108
1010
0 0.5 1 1.5 2 2.5 3 3.5
dlog
r(cm
-2)
Particle radius (microns)
Figure 5: Particle size distribution Southampton Common (18/3/99)
10
4. Solar Aureole Measurements and Sky Radiance ProfilesMeasurements
The brightness of the solar aureole and its radiance gradient out to about 6° aredependent on the overall number of aerosol particles, and the size distribution. Underconditions of moderate turbidity the contrast between sky background and aureolebrightness increases with wavelength (Deirmendjian, 1980). The aureole techniqueextracts aerosol optical thickness, particle size information and phase function using arelatively simple theoretical interpretation of predominantly single-scatteringprocesses (Nakajima, 1983). The method is sensitive at low turbidity and iscommonly used to complement direct beam measurements, which are more effectiveas turbidity increases. In order to retrieve aerosol parameters from the sky radiancemeasurements, the data must be calibrated to units of radiance (W m-2 sr-1 nm-1 ), (seesection 5.2).
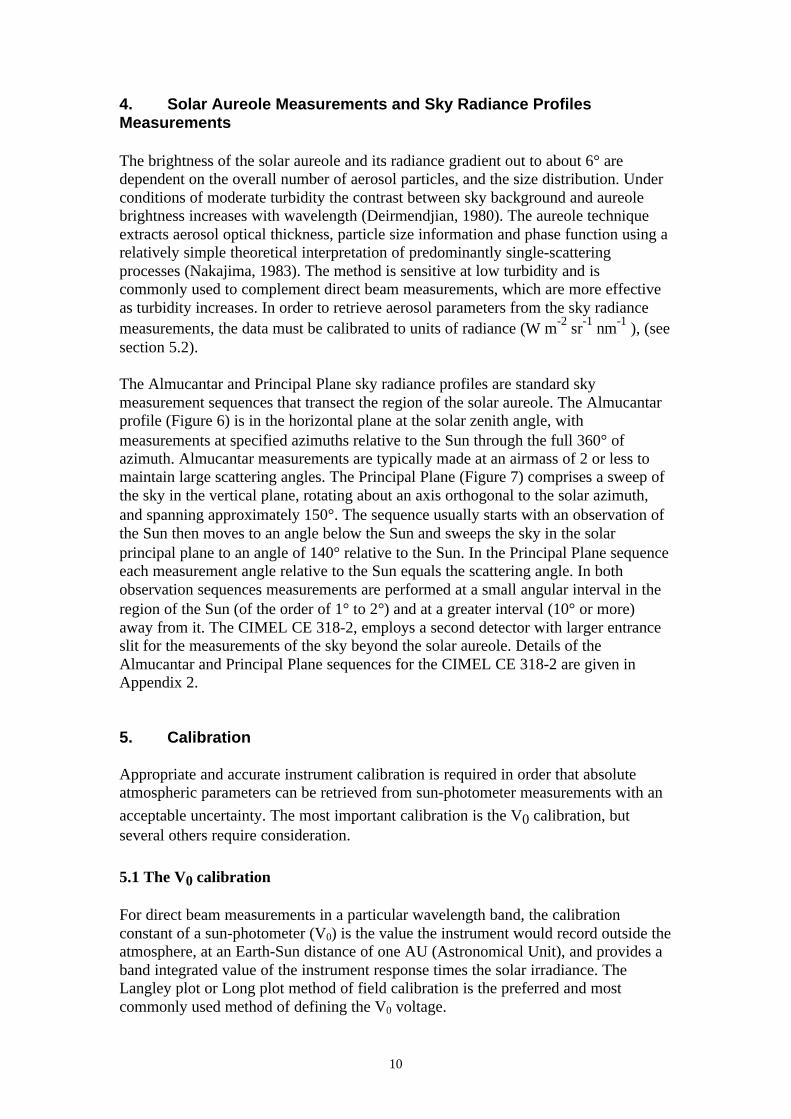
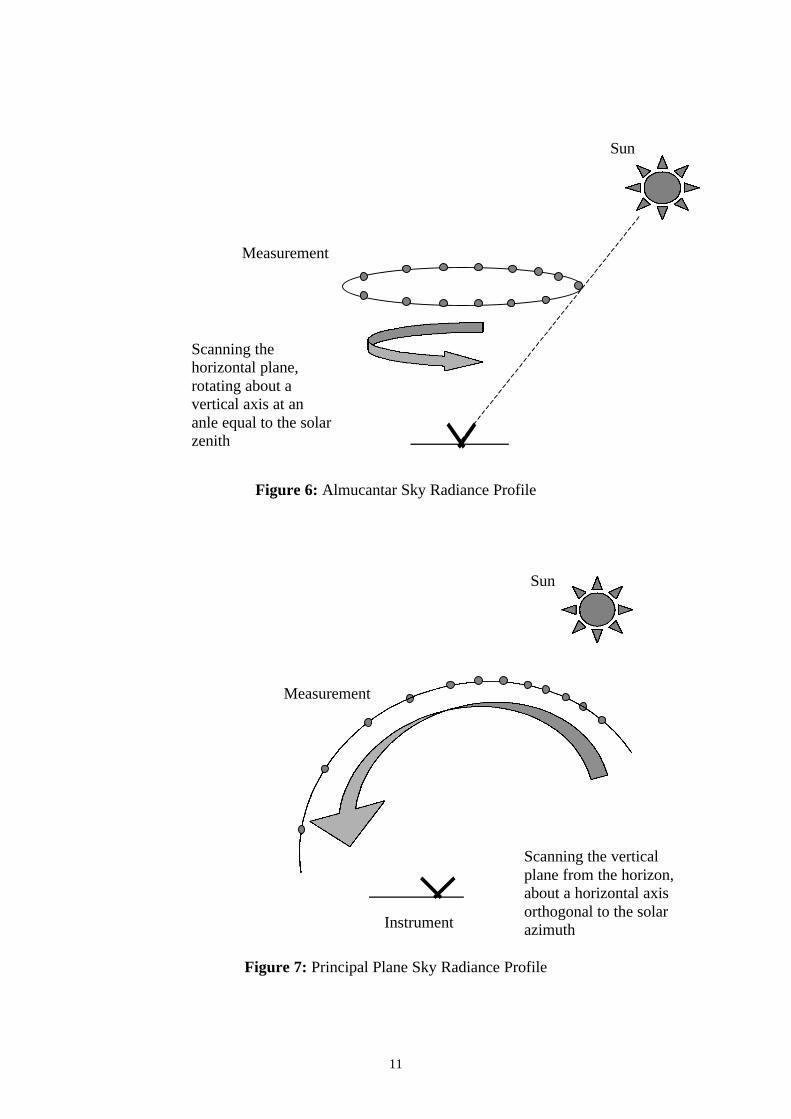
The Almucantar and Principal Plane sky radiance profiles are standard skymeasurement sequences that transect the region of the solar aureole. The Almucantarprofile (Figure 6) is in the horizontal plane at the solar zenith angle, withmeasurements at specified azimuths relative to the Sun through the full 360° ofazimuth. Almucantar measurements are typically made at an airmass of 2 or less tomaintain large scattering angles. The Principal Plane (Figure 7) comprises a sweep ofthe sky in the vertical plane, rotating about an axis orthogonal to the solar azimuth,and spanning approximately 150°. The sequence usually starts with an observation ofthe Sun then moves to an angle below the Sun and sweeps the sky in the solarprincipal plane to an angle of 140° relative to the Sun. In the Principal Plane sequenceeach measurement angle relative to the Sun equals the scattering angle. In bothobservation sequences measurements are performed at a small angular interval in theregion of the Sun (of the order of 1° to 2°) and at a greater interval (10° or more)away from it. The CIMEL CE 318-2, employs a second detector with larger entranceslit for the measurements of the sky beyond the solar aureole. Details of theAlmucantar and Principal Plane sequences for the CIMEL CE 318-2 are given inAppendix 2.
5. Calibration
Appropriate and accurate instrument calibration is required in order that absoluteatmospheric parameters can be retrieved from sun-photometer measurements with an
acceptable uncertainty. The most important calibration is the V0 calibration, butseveral others require consideration.
5.1 The V0 calibration
For direct beam measurements in a particular wavelength band, the calibrationconstant of a sun-photometer (V0) is the value the instrument would record outside theatmosphere, at an Earth-Sun distance of one AU (Astronomical Unit), and provides aband integrated value of the instrument response times the solar irradiance. TheLangley plot or Long plot method of field calibration is the preferred and mostcommonly used method of defining the V0 voltage.
11
Figure 6: Almucantar Sky Radiance Profile
Figure 7: Principal Plane Sky Radiance Profile
Instrument
Measurement
Sun
Scanning the verticalplane from the horizon,about a horizontal axisorthogonal to the solarazimuth
Measurement
Sun
Scanning thehorizontal plane,rotating about avertical axis at ananle equal to the solarzenith
12
i) The Langley methodThe Langley method is based on the principle of spectral extinction and relies on theBeer-Lambert-Bouguer Law. The extinction of the solar beam through differentdepths of atmosphere is measured and plotted and from this a value is extrapolated fora measurement at the top of the atmosphere. The procedure requires the instrumentvoltage for the direct solar beam to be measured at a number of different depths ofatmosphere. In principle, the measurements should be obtained simultaneously atdifferent elevations through the atmosphere. In practise, it is impossible to make themeasurements simultaneously at differentelevations with the same instrument, so the principle is applied by measuring thedirect solar beam at one location over a range of solar elevation angles, providingmeasurements at different relative depths of atmosphere, or airmass (m). Solarelevation angle is related to airmass by the approximation airmass (m) = sec θz, (orm=1/cos θz), where θz is the solar zenith angle. Then, for each wavelength, a plot of
the logarithm of the voltage against airmass yields V0λ as the ordinate intercept
(according to equation 2). When the Rayleigh (τrλ) and ozone (τozλ) contributions areknown, plotting the left side of the equation 7 against airmass (m) yields a straight-
line provided τaλ is constant throughout the measurement period.
lnV + mτrλ + mτozλ = ln (V0λ /R2) - mτaλ (7)
The intercept of a least-squares fit through the data provides the required calibration
coefficient, V0 and the slope gives τaλ for the measurement period. Measurementsobtained over large zenith angles (between 60º and 82º) covering the airmass range of2 to 7, are essential for correct determination of the slope. Accurate determination ofthe Rayleigh and ozone components is critical for the Langley calibration. For theRayleigh component, an accurate measurement of atmospheric pressure at the highaltitude location is required.
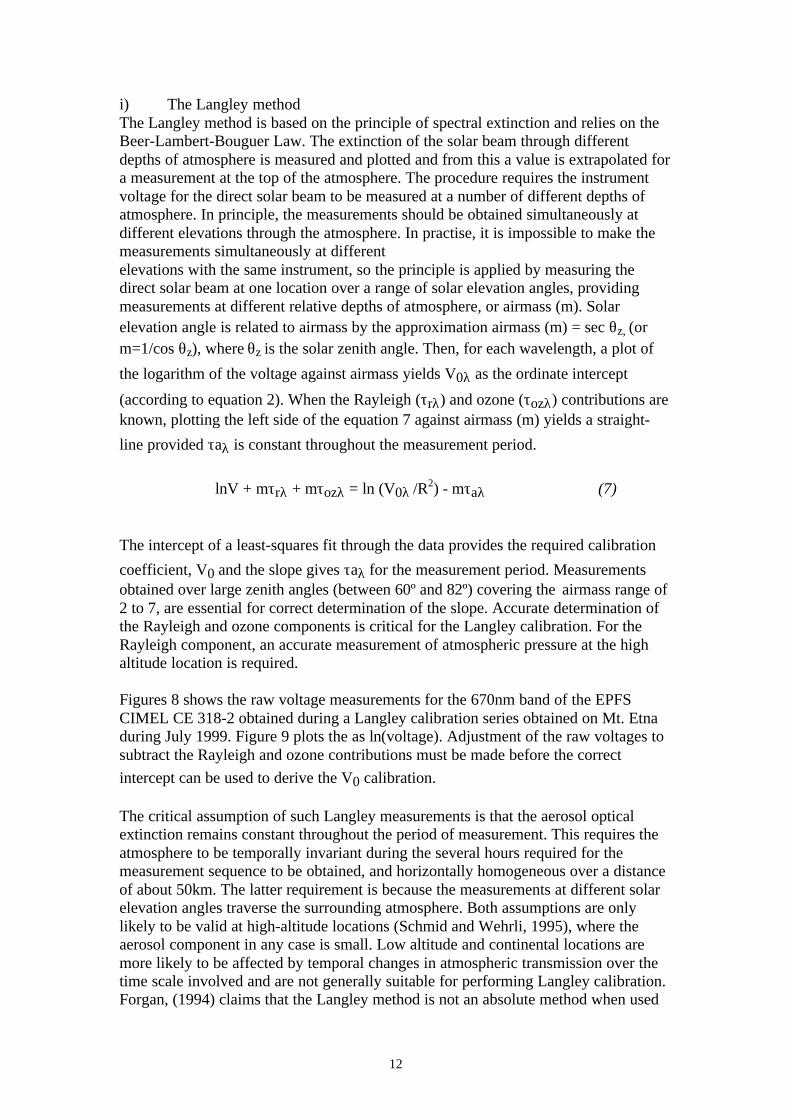
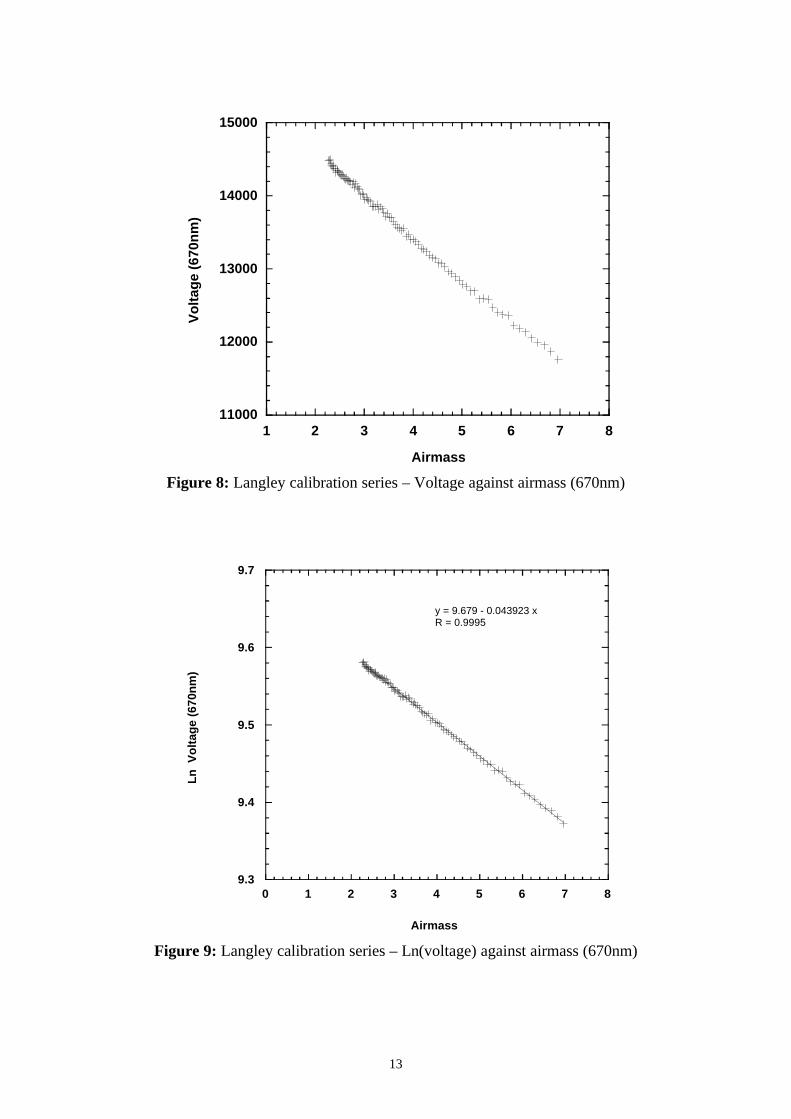
Figures 8 shows the raw voltage measurements for the 670nm band of the EPFSCIMEL CE 318-2 obtained during a Langley calibration series obtained on Mt. Etnaduring July 1999. Figure 9 plots the as ln(voltage). Adjustment of the raw voltages tosubtract the Rayleigh and ozone contributions must be made before the correct
intercept can be used to derive the V0 calibration.
The critical assumption of such Langley measurements is that the aerosol opticalextinction remains constant throughout the period of measurement. This requires theatmosphere to be temporally invariant during the several hours required for themeasurement sequence to be obtained, and horizontally homogeneous over a distanceof about 50km. The latter requirement is because the measurements at different solarelevation angles traverse the surrounding atmosphere. Both assumptions are onlylikely to be valid at high-altitude locations (Schmid and Wehrli, 1995), where theaerosol component in any case is small. Low altitude and continental locations aremore likely to be affected by temporal changes in atmospheric transmission over thetime scale involved and are not generally suitable for performing Langley calibration.Forgan, (1994) claims that the Langley method is not an absolute method when used
13
11000
12000
13000
14000
15000
1 2 3 4 5 6 7 8
Vo
ltag
e (6
70n
m)
Airmass
Figure 8: Langley calibration series – Voltage against airmass (670nm)
9.3
9.4
9.5
9.6
9.7
0 1 2 3 4 5 6 7 8
Ln
Vo
ltag
e (6
70n
m)
Airmass
y = 9.679 - 0.043923 xR = 0.9995
Figure 9: Langley calibration series – Ln(voltage) against airmass (670nm)
14
in the troposphere and has a large uncertainty. Instead, he proposed a general methodof calibration, which is essentially a modification of the Langley method but relaxesthe constraints on atmospheric conditions
Because modern sun-photometers can obtain direct sun measurements at a high
frequency (at the order of 1 or 2 seconds), V0 can be established with high precision.
However, the accuracy of the V0 values obtained by the method is the subject ofmuch attention, affected as it is by the measurement circumstances and in particular,
any change in the atmosphere. Reagan et al., (1984) cites the accuracy of V0 valuesfrom Langley plot as being typically between 4% and 10%. Shaw (1983) illustratesthe danger of introducing systematic errors to Langley calibrations as a result of time-dependent changes in atmospheric transmission. To avoid this, he recommends thateven calibrations performed at ideal, high altitude sites should be based on morningmeasurements only (before inversion layers breakdown due to solar heating andconvection), and should be accompanied by simultaneous measurement of the aerosoldirectly, to confirm no changes in atmospheric transmission occurred. It is generally
accepted that if the V0 values can be repeated on several days of independentmeasurement, they can be regarded as reliable (Shiobara et al., 1996).
There are numerous variations and refinements of the Langley method, includingthose developed to allow more accurate removal of the non-aerosol components or tocope with sub-optimal data series (e.g. Soufflet et al., 1992,). The method of Tanaka
et al., (1986) incorporates measurements of the solar aureole into the V0 calibration.Forgan (1994) formulated a general method of calibration based on the Langleymethod, but with more relaxed constraints on the atmospheric conditions.
A modified-Langley method is used for deriving calibration values for the waterabsorption band around 940nm (Bruegge et al., 1992). The method requires theproduct of the precipitable water (PW) and airmass (m), to be accounted for inaddition to Rayleigh and ozone optical depth. In this case, the aerosol optical depth
(τa) is estimated by interpolation between the two neighbouring channels. Themodified Langley calibration for this band then becomes:
lnV + mτ = ln (V0 /R2) - aPW
bm
b (8)
A plot of the left side of equation against mb
yields a straight-line with the ordinate
intercept equal to ln(V0) and the slope equal to aPWb.
ii) Alternative V0 calibration methods
In principle, V0 values can be derived from absolute radiometric calibration of theinstrument in the laboratory then extrapolation of the calibration to the extraterrestrialsolar irradiance spectrum (e.g. the tabulated values of Neckel and Labs, 1983).Laboratory calibration involves measuring against a calibrated irradiance source suchas a high intensity tungsten lamp, and requires that the relative spectral response ofthe sun-photometer be known. Schmid and Wehrli, (1995) performed a comparison of
15
a laboratory calibration procedure with the Langley plot method and found reasonable
accuracy for both and good agreement between the resulting V0 values, although theydid report their results were sensitive to the extraterrestrial solar irradiance spectrumused. They concluded that laboratory techniques could and should be used tosupplement regular field calibrations. Other workers consider that laboratorycalibration cannot replace the Langley method (e.g. Shaw, 1980). Problems associatedwith laboratory calibration include the accuracy of the calibration of the source and itsintensity, which may be several orders of magnitude lower than that of the Sun, andthe need to overfill the detector field-of-view. The accuracy of this calibration willalso depend on accurate spectral characterisation of the instrument bands (see 5.3).
Another method of effecting an absolute calibration is to cross-calibrate against asecond, accurately calibrated instrument either in the field or against a laboratorysource. Two considerations are important in this approach. Firstly, that differencesbetween the instruments being inter-calibrated must be properly accounted for,especially their spectral band characteristics (bandwidth and relative spectralresponse). Secondly, calibration errors will be increased via inter-calibration and canbe readily propagated across a network of instruments.
It is worth noting that all these methods require accurate information about therelative spectral response of the sun-photometer in all spectral bands, something notrequired for the Langley calibration method.
5.2 Radiance calibration of sky measurements
A laboratory procedure is normally used to determine the calibration coefficientsneeded to convert sky measurements from digital counts to units of radiance (W m-2
sr-1 nm-1). In this case, measurements are performed against a calibrated spectralradiance source (integrating sphere or irradiated reference panel). The calibrationcoefficient is then derived as:
Lλ / DNλ (9)
where Lλ is the radiance of the calibration source integrated over the spectral response
function of the wavelength band and DNλ is the measured response for thatwavelength band. The accuracy of this calibration depends partly on the accuratespectral characterisation of the instrument bands, as described in the followingsection.
5.3 Other calibration considerations
i) Spectral characteristicsAll the relationships between the sun-photometer measurements and the retrievedparameters are wavelength sensitive and it is critical that the spectral characteristics ofany particular instrument be accurately known. Ideally, the relative spectral responsefunction for each band is required, but at minimum the wavelength of peak sensitivityand bandwidth (normally the full width at half maximum - FWHM) should be known.These characteristics should be established initially and also checked intermittently so
16
that any changes can be identified. Checks should certainly be carried out whenchanges in the sensitivity of the instrument are indicated since this may indicate filterdeterioration, which is not uncommon.
ii) Temperature sensitivitySolid state optical detectors are often temperature dependent and ideally should bethermostatically controlled. One method instrument manufacturers use to achieve aconstant operating temperature is to provide heat to raise the operating temperatureabove ambient. Other manufacturers consider temperature control to be impracticalfor such a field instrument, preferring to record temperature and offer correctionfactors as necessary (these will normally be required for the longer wavelengthbands). In this case it is important that operators are aware of any temperaturedependent effects and make the necessary corrections.
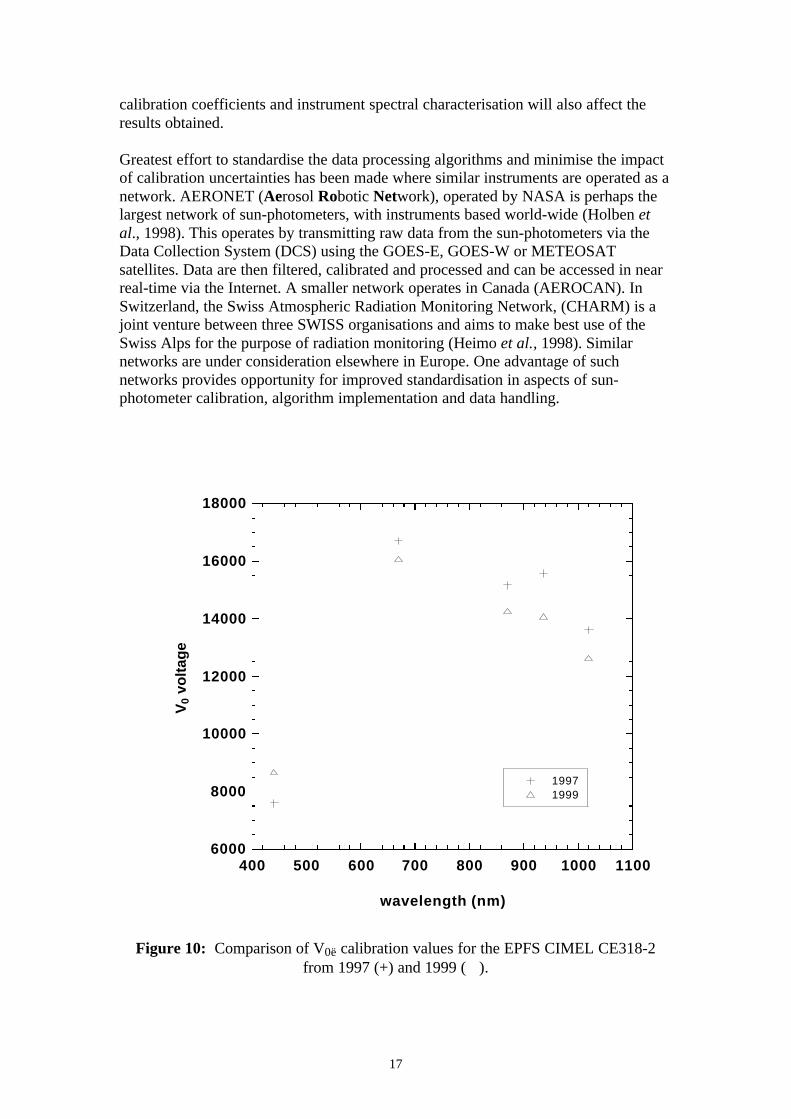
iii) Temporal stabilitySensitivity variations of up to 10% over a year or less have been reported for somesun-photometers (Forgan, 1994). This underlines the importance of monitoringsensitivity as frequently as possible, with a combination of field techniques andlaboratory calibration checks, something emphasised by several workers (e.g. Shaw,1983), Forgan (1994) and Schmid and Wehrli, 1995). Data from the EPFS CIMELshow a fairly typical variation with time (Figure 10), and illustrate the difficulty of
maintaining accurate V0 of the sun-photometer. In this case, the V0 for the bandscentred at 660nm, 880nm and 1020nm changed by between 3% and 7% between 1997and 1999. For the water vapour band at 940nm the change was greater (9.5%)although this may be due to a difference in boundary layer conditions between the twomeasurement dates. Data for the 440nm band indicate an apparent increase in
sensitivity with a higher V0 value for the 1999 calibration than for that obtained in1997. One possible cause of this would be a change in the efficiency of the filterbetween the two measurement dates, and this is currently under further investigation.
6. Data Processing Considerations
Modern sun-photometers operating in automatic mode can generate large volumes ofdata, which necessitates comprehensive methods for handling, processing andarchiving the data. Despite this need, even commercially available instruments areoften supplied without any dedicated support software. Software and data procedureshave developed in a rather ad hoc way, possibly because of variation betweeninstruments and the fact that many are unique, built for a particular location andobjective. One important consideration for data collected in an automatic mode is theneed to filter out cloud affected before processing.
From the users’ perspective, it is important to recognise the enormous scope forvariation in the implementation of the retrieval algorithms and inversion procedures,and the consequent effect of this on the results obtained. Algorithms can incorporateunique refinements and modifications and, in the numerical inversion modelling,assumptions about input parameters (such as the definition of aerosol particle shapeand refractive index) are a particular source of uncertainty, which can affect thereliability of the atmospheric data retrieved. Similarly, the accuracy of the instrument
17
calibration coefficients and instrument spectral characterisation will also affect theresults obtained.
Greatest effort to standardise the data processing algorithms and minimise the impactof calibration uncertainties has been made where similar instruments are operated as anetwork. AERONET (Aerosol Robotic Network), operated by NASA is perhaps thelargest network of sun-photometers, with instruments based world-wide (Holben etal., 1998). This operates by transmitting raw data from the sun-photometers via theData Collection System (DCS) using the GOES-E, GOES-W or METEOSATsatellites. Data are then filtered, calibrated and processed and can be accessed in nearreal-time via the Internet. A smaller network operates in Canada (AEROCAN). InSwitzerland, the Swiss Atmospheric Radiation Monitoring Network, (CHARM) is ajoint venture between three SWISS organisations and aims to make best use of theSwiss Alps for the purpose of radiation monitoring (Heimo et al., 1998). Similarnetworks are under consideration elsewhere in Europe. One advantage of suchnetworks provides opportunity for improved standardisation in aspects of sun-photometer calibration, algorithm implementation and data handling.
6000
8000
10000
12000
14000
16000
18000
400 500 600 700 800 900 1000 1100
19971999
V0
volt
age
wavelength (nm)
Figure 10: Comparison of V0ë calibration values for the EPFS CIMEL CE318-2from 1997 (+) and 1999 (ê).
18
7. Overview
The successful utilisation of sun-photometer derived atmospheric data to remotesensing applications requires an understanding of how those data are derived andsome perspective on their limitations and quality. The following considerations areparticularly important:
i) the instrument configuration, characterisation and calibration,ii) data processing, including the filtering of sub-optimal data (e.g. cloud
affected), the implementation of the algorithms and accuracy with which thenon-aerosol components of optical depth are determined, inversion modellingwith the associated assumptions.
The suitability of sun-photometer data for a specific task will also depend on otherfactors. For example, the advantage of sun-photometer derived data being time andlocation specific and therefore especially valuable for atmospheric correction ofsimultaneously acquired imagery may be compromised by the synoptic situation.Solar beam measurements with a sun-photometer traverse the slice of atmospherebetween the instrument and the Sun. In most cases, this will be an oblique, rather thana vertical, slice through the atmosphere. For example at latitude of 50° N, even thenoon solar zenith angle never falls below approximately 27º. The spatial extent overwhich the derived parameters will be representative will vary with conditions.
This review has focused on the principles of Sun-photometry with the aim ofenlightening users away from the ‘black-box’ concept of the sun-photometer a sourceof absolute and error free atmospheric parameters. Understanding the principles andpotential limitations of the technique are essential to the successful utilisation of Sun-photometry for atmospheric correction of remotely sensed imagery.
References
Amato, U., Esposito, F., Serio, C., Pavese, G. and Romano, F., 1995, Inverting highspectral resolution aerosol optical depth to determine the size distribution ofatmospheric aerosol. Aerosol Science and Technology, 23, 591-602.
Ångström, A., 1929, On the atmospheric transmission of sun radiation and on dust inthe air. Geografis Annal., 2,156-166.
Bird, R.E., and Riordan, C., 1986, Simple solar spectral model for direct and diffuseirradiance on horizontal and tilted planes of the Earth’s surface for cloudlessatmospheres. J. Clim. Appl. Meteorol. 25, 87-97.
Bruegge, C.T., Conel, J.E., Green, R.O., Margolis, J.S., Holm, R.G., and Toon, G.,1992, Water vapor column abundance retrievals during FIFE. JournalGeophysical Research 97:18759-18768.
Chavez, P.S. Jr., 1996, Image-based Atmospheric corrections – revisited andimproved. Photogrammetric Engineering and Remote Sensing, 62,1025-1036.
19
Deirmendjian, D., 1980, A survey of light-scattering techniques used in remotemonitoring of atmospheric aerosols. Reviews of Geophysics and SpacePhysics, 18, 341-360.
Forgan, B. W., 1994, General method for calibrating Sun photometers, AppliedOptics, 33, 4841-4850.
Fröhlich, C., 1977, WRC/PMOD Sunphotometer: instructions for manufacture, WorldMeteorological Organisation Report, Geneva, Switzerland.
Halthore, R. N., Eck, T. F., Holben, B. N. and Markham, B.L., 1997, Sun photometricmeasurements of atmospheric water vapor column abundance in the 940-nmband. Journal of Geophysical Research, 102, 4343-4352.
Hansen, J. E. and Travis, L. D., 1974, Light scattering in planetary atmospheres,Space Science Reviews 16, 527-610.
Heimo, A., Philipona, R., Fröhlich, C., Marty, Ch., and Ohmura, A., 1998, The SwissAtmospheric Radiation Monitoring Network CHARM. Proceedings of theWorld Meteorological Organisation Technical Conference on Meteorologicaland Environmental Instruments, Casablanca, Morocco, May13-15 1998,WMO/TD-877:291-294.
Holben, B. N., Eck, T. F., Slutsker, I., Tanre, D., Buis, J. P., Setzer, A., Vermote, E.,Reagan, J. A., Kaufman, Y. A., Nakajima, t., Lavenu, F., Jankowiak, I. AndSmirnov, A., 1998, AERONET – A federated instrument network and dataarchive for aerosol characterisation, Remote Sensing of Environment, 66:1-16.
Kasten, F, 1965, A new table and approximation formula for the relative opticalairmass. Arch. Meteor. Geophys. Bioklim., B14 206-223.
King, M. D., Byrne, D. M., Herman, B. M. and Reagan, J. A., 1978, Aerosol sizedistributions obtained by inversion of spectral optical depth measurements.Journal of the Atmospheric Sciences, 35, 2153-2167.
Komhyr et al., 1989, Dobson Spectrometer 83: A standard for total ozonemeasurements, 1962-1987, Journal of Geophysical Research, 94, 9847-9861
Nakajima, T., Tanaka, M. And Yamauchi, T., 1983, Retrieval of the optical propertiesof aerosols from aureole and extinction data. Applied Optics, 22, 2952-2959.
Neckel, H. And Labs, D., 1983, The solar radiation between 3300 and 12500 Å. SolarPhysics, 90, 205-258.
Reagan, J. A., Scott-Fleming, I. C., Herman, B. M. and Schotland, R. M., 1984,Recovery of spectral optical depth and zero-airmass solar spectral irradianceunder conditions of temporally varying optical depth, Proceedings ofIGARSS’84 Symposium, Strasbourg, ESA SP-215, 455-459.
20
Sano, I., Mukai, S., Takashima, T. And Yamaguchi, Y., 1996, Retrieval algorithmsfor photopolarimetric properties of aerosols. Advances in Space Research, 17,163-166.
Schmid, B. and Wehrli, C., 1995, Comparison of Sun photometer calibration by useof the Langley technique and the standard lamp. Applied Optics, 34, 4501-4512.
Shaw, G. E., 1983, Sun Photometry. Bulletin of American Meteorological Society, 64,4-10.
Shiobara, M., Spinhirne, J. D., Uchiyama, A., and Asano, S., 1991, Optical depthmeasurements of aerosol, cloud and water vapour using sun photometersduring the FIRE Cirrus IFO II. Journal of Applied Meteorology, 35, 36-46.
Soufflet,V., Devaux, C. and Tanré, D., 1992. A modified Langley plot method formeasuring the spectral aerosol optical thickness and its daily variations.Applied Optics, 31,2154-2162.
Tanaka, M., Nakajima, T., and Shiobara, M., 1986, Calibration of a sunphotometer bysimultaneous measurements of direct-solar and circumsolar radiation, AppliedOptics, 25, 1170-1176.
Tanré, D., Devaux, C., Herman, M. and Santer, R., 1988, Radiative properties ofdesert aerosols by optical ground-based measurements at solar wavelengths.Journal of Geophysical Research, 93, 14223-14231.
Yamamoto, G. and Tanaka, M., 1969, Determination of aerosol size distribution fromspectral attenuation measurements. Applied Optics, 8, 447-453.
21
Appendix 1 Summary of CIMEL CE 318-2
The CIMEL CE 318-2 spectral radiometer is manufactured by CIMEL Electroniqueof Paris, France. The instrument comprises:
i) a robotii) a sensor head with two 33 cm collimators, andii) a logic box.
This sensor head incorporates two silicon detectors for measurement of the Sun,aureole and sky radiance. Both collimators have approximately a 1.2º full angle fieldof view and are designed for 10-5 stray-light rejection for measurements of theaureole 3º from the Sun. The Sun collimator is protected by a quartz window allowingobservation with a UV enhanced silicon detector with sufficient signal-to-noise forspectral observations between 300 and 1020 nm. The sky collimator a larger aperture-lens system for better dynamic range of the sky radiance. Eight ion assisted depositioninterference filters are located in a filter wheel, which is rotated by a direct drivestepping motor.
The EPFS CIMEL CE318-2 is a polarised instrument, with 8 channels in total, threeof which are polarised at 870nm. The centre wavelengths and FWHM (in brackets)are as follows:
440nm (10nm)670nm (10nm)870nm (10nm) – 1 x unfiltered channel, plus 3 x polarised channels940nm (10nm)1020nm (10nm)
The sensor head is pointed by stepping azimuth and zenith motors with a precision of0.05 degrees. A microprocessor computes the position of the sun based on time,latitude and longitude which directs the sensor head to within approximately onedegree of the sun, after which a four quadrant detector tracks the sun precisely
The robot and sensor head are sealed from moisture and desiccated to prevent damageto the electrical components and interference filters. A thermistor measures thetemperature of the detector allowing compensation for any temperature dependence.
A solar panel provides power to the robot. When idle, the robot mounted sensor headis parked pointed vertically down. A "wet sensor" exposed to precipitation will cancelany measurement sequence in progress.
22
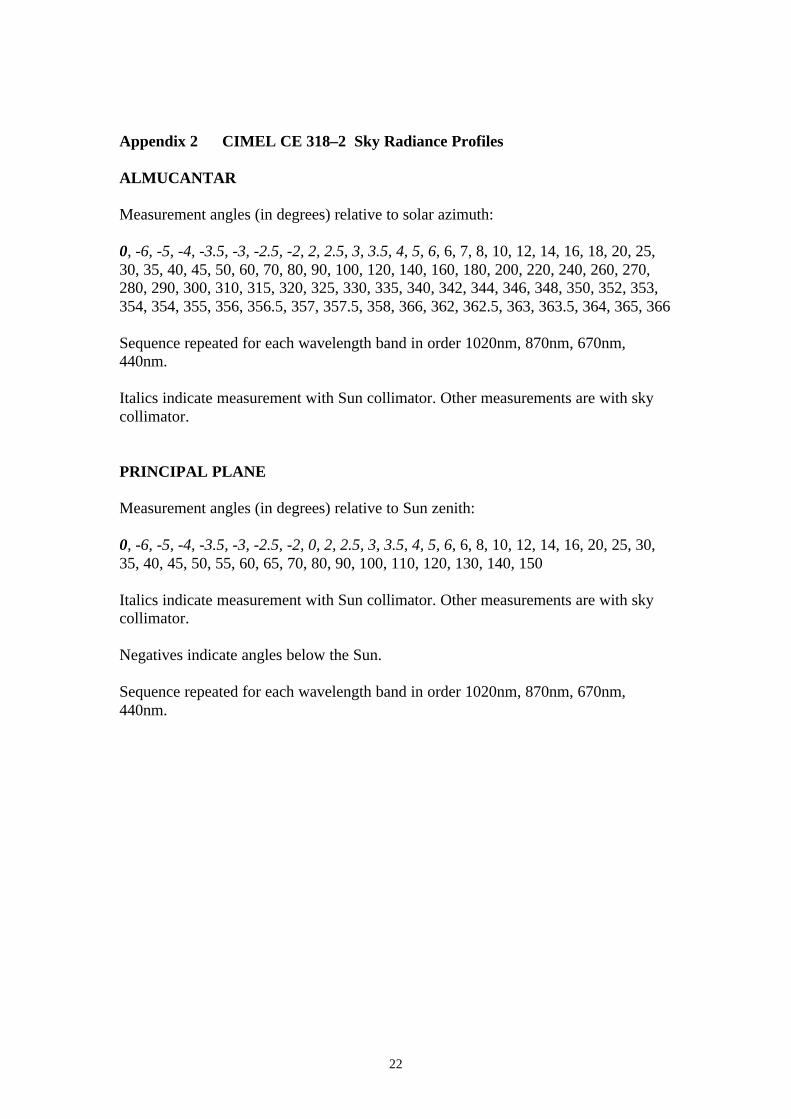
Appendix 2 CIMEL CE 318–2 Sky Radiance Profiles
ALMUCANTAR
Measurement angles (in degrees) relative to solar azimuth:
0, -6, -5, -4, -3.5, -3, -2.5, -2, 2, 2.5, 3, 3.5, 4, 5, 6, 6, 7, 8, 10, 12, 14, 16, 18, 20, 25,30, 35, 40, 45, 50, 60, 70, 80, 90, 100, 120, 140, 160, 180, 200, 220, 240, 260, 270,280, 290, 300, 310, 315, 320, 325, 330, 335, 340, 342, 344, 346, 348, 350, 352, 353,354, 354, 355, 356, 356.5, 357, 357.5, 358, 366, 362, 362.5, 363, 363.5, 364, 365, 366
Sequence repeated for each wavelength band in order 1020nm, 870nm, 670nm,440nm.
Italics indicate measurement with Sun collimator. Other measurements are with skycollimator.
PRINCIPAL PLANE
Measurement angles (in degrees) relative to Sun zenith:
0, -6, -5, -4, -3.5, -3, -2.5, -2, 0, 2, 2.5, 3, 3.5, 4, 5, 6, 6, 8, 10, 12, 14, 16, 20, 25, 30,35, 40, 45, 50, 55, 60, 65, 70, 80, 90, 100, 110, 120, 130, 140, 150
Italics indicate measurement with Sun collimator. Other measurements are with skycollimator.
Negatives indicate angles below the Sun.
Sequence repeated for each wavelength band in order 1020nm, 870nm, 670nm,440nm.