An introduction to the UBI Banca Group Banca Introduction 2018.10.16.pdf · The heritage of UBI...
15
An introduction to the UBI Banca Group October 2018
Transcript of An introduction to the UBI Banca Group Banca Introduction 2018.10.16.pdf · The heritage of UBI...
An introduction to the UBI Banca Group
October 2018

2
This document has been prepared by Unione di Banche Italiane Spa (“UBI”) for informational purposes only.
It is not permitted to publish, transmit or otherwise reproduce this document, in whole or in part, in any format, to any third party without the express written consent of UBI and it is not permitted to alter, manipulate, obscure or take out of context any information set out in the document.
The information, opinions, estimates and forecasts contained herein have not been independently verified and are subject to change without notice.
They have been obtained from, or are based upon, sources we believe to be reliable but UBI makes no representation (either expressed or implied) or warranty on their completeness, timeliness or accuracy.
Nothing contained in this document or expressed during the presentation constitutes financial, legal, tax or other advice, nor should any investment or any other decision be solely based on this document.
This document does not constitute a solicitation, offer, invitation or recommendation to purchase, subscribe or sell for any investment
instruments, to effect any transaction, or to conclude any legal act of any kind whatsoever.
This document may contain statements that are forward-looking: such statements are based upon the current beliefs and expectations of UBI and are subject to significant risks and uncertainties. These risks and uncertainties, many of which are outside the control of UBI, could cause the results of UBI to differ materially from those set forth in such forward looking statements.
Under no circumstances will UBI or its
affiliates, representatives, directors, officers and employees have any liability whatsoever (in negligence or otherwise) for any loss or damage howsoever arising from any use of this document or its contents or otherwise arising in connection with the document or the above mentioned presentation.
For further information about the UBI Group,
please refer to publicly available information, including Annual, Quarterly and Interim Reports.
By receiving this document you agree to be bound by the foregoing limitations.
Please be informed that some of the managers of UBI involved in the drawing up and in the presentation of data contained in this document possess stock of the bank. The disclosure relating to shareholdings of top management is available in the half year and the annual reports.
Methodology All data are as at 30th June 2018 unless
otherwise stated.
Disclaimer

3
• The UBI Banca Group
– UBI Banca history – UBI Banca at a glance – The Ubi Banca group
• UBI Banca’s International Network – Worldwide presence – UBI Banca – Global Transaction Banking – Contacts
• Annexes
Agenda

4
UBI Banca history The heritage of UBI Banca can be traced back to the local banks with deep roots in their communities, that have merged into the single legal entity under the brand UBI.
1812 branches in Italy
1869
2007
2018
Banca Etruria Banca Marche
Banca Popolare di Bergamo
CariChieti
Banca Carime
Banca Regionale Europea
Banca di Valle Camonica Banca Popolare
Commercio & Industria
Banco di Brescia
Banca Popolare di Ancona

5
Worldwide presence and product companies Representative Offices
UBI Banca – Foreign Branches
UBI Banca - Other Subsidiaries
1
2
3
4
5
6
7
8
USA New York
Brazil San Paolo
Morocco Casablanca
Russia Moscow
India Mumbai
China Shanghai
Hong Kong
UAE Dubai
Hong Kong
A
1 3
8
5
2
7
6
4
A C
D
B
France Antibes Mentone Nice
B
C
Luxembourg UBI Trustee SA UBI Management Co SA
Poland UBI Factor foreign branch
D China Zhong Ou Asset Management Company Co. Ltd*
* Joint-venture of which UBI Banca holds 35% of the share capital.
Other companies in UBI Group Perimeter

6
UBI Banca and its Peers
Source: Press releases and presentations
Total assets at 30th June 2018 (bln/€) No. of domestic branches as at 30th June 2018
Customer loans as at 30th June 2018 (bln/€) Total direct funding as at 30th June 2018 (bln/€)
824 794
70 136 161
4,531
1,597
2,555
1,812
# 4
# 5 127
1,219
2,319*
108**
459
400
107
46
552 431
50
97 95
# 4 # 5
87 91
* As from 1st July 2018, n. 310 branches were closed ** Excluding repos Source: press releases, presentations and half year report on 1H2018 results

7
The UBI Banca Group – Key Highlights
Strong competitive positioning
Sound asset quality
Solid capital and liquidity position
Total Assets: € 126.9 billion (5th Italian player) Total Loans to Customers: € 91.3 billion (4th Italian player) − 50% of net loans to customers granted in Lombardy where the Group has a 13.3% market share in
terms of branches Total Direct Funding: € 95 billion Total Indirect Funding (AUM, AUC and Bancassurance): € 98.5 billion
A total market share in Italy of 7%, with 1,812 branches (+5 branches abroad) Over 4.2 million customers and over 21,000 headcounts
1H2018 net profit of € 208.9 million CET 1 (Common Equity Tier 1): 11.78% Liquidity Coverage Ratio and Net Stable Funding Ratio > 100% The only Italian Bank which has always paid a cash dividend during the crisis
72% of tatal assets represented by Loans to customers - 79.5% of Performing Loans is low risk under the Internal rating model
Low incidence of Non Performing Exposures: • Net NPEs / Total net loans: 7.1% • Loan Loss Provisioning: 57 bps annualised
Over 75% of loans secured mainly by real estate collateral
As at 15 October 2018 STANDARD & POOR’S MOODY’S FITCH DBRS
SHORT TERM A-3 P-2 F3 R-2 (high) LONG TERM BBB- Baa3 BBB- BBB OUTLOOK stable negative negative stable
Issuer ratings

8
UBI Banca – Global Transaction Banking CHIEF COMMERCIAL OFFICER
(*) Representative Offices : Mumbai, Casablanca, Dubai, Hong Kong, Moscow, New York, Sao Paolo, Shanghai.
Transaction Banking
Guarantees P. Piccinelli
GLOBAL TRANSACTION BANKING
L.Monti
Coord. D.Roncaglio (commercial planning, due diligence, monitoring)
Trade & Cash Sales
G.Casotti
Trade & Cash Product
Management D. Nacci
Correspondent Banking L.Tassini
Transaction Banking
Units
CHIEF LENDING OFFICER
Transaction Screening
Unit F. Francolini
TOP PRIVATE
(Networth above Eur 1 Mln)
CORPORATE AND
INVESTMENT BANKING (Turnover above 250 Mln)
MAT
(7 REGIONAL HUBS)
Trade & Cash M. Menno di Bucchianico
Financial Institutions I.Moavero
Institutional Credit E. Santinelli
Representative Offices (*)
International Network
P.Vitali
Coord. R. Chielli (Foreign Branches)
9
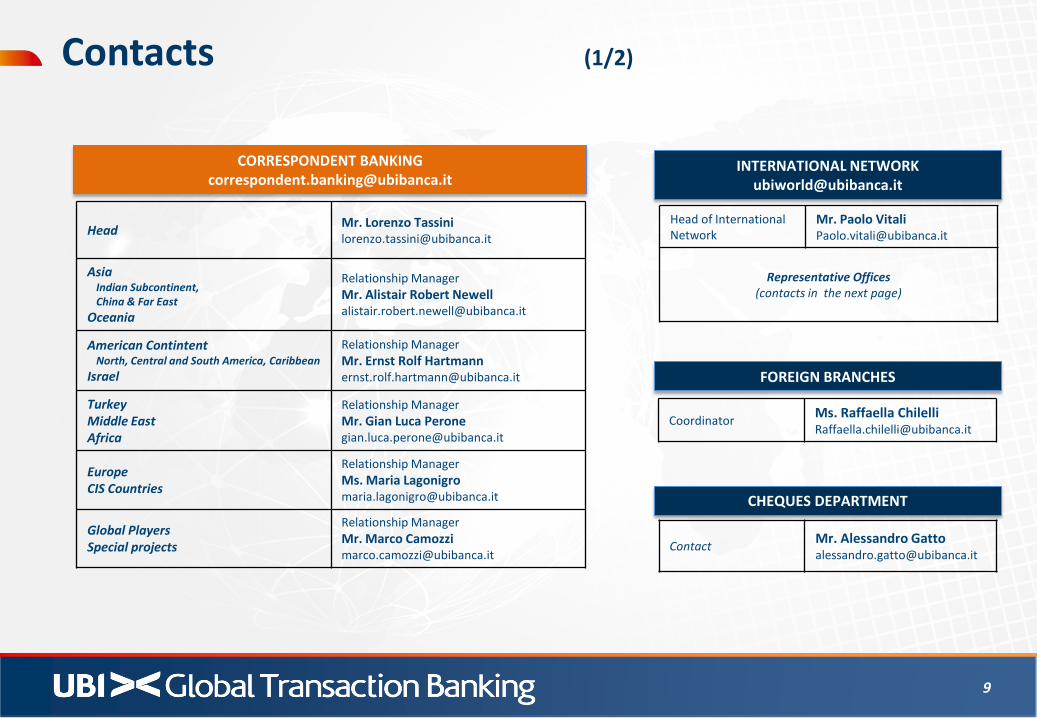
Contact Mr. Alessandro Gatto [email protected]
Coordinator Ms. Raffaella Chilelli [email protected]
Head of International Network
Mr. Paolo Vitali [email protected]
Representative Offices (contacts in the next page)
CORRESPONDENT BANKING [email protected]
FOREIGN BRANCHES
Head Mr. Lorenzo Tassini [email protected]
Asia Indian Subcontinent, China & Far East
Oceania
Relationship Manager Mr. Alistair Robert Newell [email protected]
American Contintent North, Central and South America, Caribbean
Israel
Relationship Manager Mr. Ernst Rolf Hartmann [email protected]
Turkey Middle East Africa
Relationship Manager Mr. Gian Luca Perone [email protected]
Europe CIS Countries
Relationship Manager Ms. Maria Lagonigro [email protected]
Global Players Special projects
Relationship Manager Mr. Marco Camozzi [email protected]
INTERNATIONAL NETWORK [email protected]
CHEQUES DEPARTMENT
Contacts (1/2)

10
Contacts – Representative Offices (2/2)
MUMBAI
Mr Andrea Croci [email protected] Tel. +852 2878 7393 Fax +852 2878 7932
HONG KONG
Ms Rajeshree Balsari [email protected] Tel. +91 22 22023601 Fax +91 22 22023603
SHANGAI
Ms Lu Bo [email protected] Tel +86 21 61675333 Fax +86 21 61675582
MOSCOW
Mr Isidoro Guerrerio [email protected] Tel. +55 11 3063 0454 Fax +55 11 3063 3785
SAO PAULO
Mr Ferdinando Pelazzo [email protected] Tel. +7 495 725 4466 Fax +7 495 725 4465
DUBAI
Mr Andrea De Benedittis [email protected] Tel +1 646 871 7600 Fax +1 646 205 4006
NEW YORK
Mr Luigi Landoni [email protected] Tel +971 4 3277289 Fax +971 4 3277290
CASABLANCA
Mr Abdelkrim Sbihi [email protected] Tel +212 520 48 12 70 Fax +212 520 48 12 72

11
Annexes

12
Net loans to customers at 91.3 bln/€: - Decreasing NPEs and - Increasing performing m/l term component

13
Flows from performing to non performing loans, recovery rate and default rate

14
Key Figures Figures in thousand of euros Figures in thousand of eurosASSETS 30/06/2018 LIABILITIES AND EQUITY 30/06/2018Cash and cash equivalents 616.368 Financial liabilities measured at amortised cost 111.617.355Financial assets measured at fair valure through profit or loss 1.488.455 a. Due to banks 16.607.300 1. loans and advances to banks 14.796 b. Due to customers 70.582.753 2. loans and advances to customers 313.580 c. Debt securities issued 24.427.302 3. securities and derivatives 1.160.069 Fianacial liabilities held for trading 386.959Financial assets measured at fair value through other comprehnsive income 11.527.974 Financial liabilities designed as at fair value 75.488 1. loans and advances to banks - Hedging derivatives 102.961 2. loans and advances to customers - Fair value change in hedged financial liabilities (+/-) 54.008 3. securities and derivatives 11.527.974 Tax liabilities 208.390Financial assets measured at amortised cost 103.886.299 Other liabilities 2.654.081 1. loans and advances to banks 9.513.708 Provision for post-employment benefits 328.484 2. loans and advances to customers 91.342.643 Provisions for risks and charges: 565.147 3. securities and derivatives 3.029.948 a. commitments and guarantees granted 73.964Hedging derivatives 59.804 b. pension and similar obligations 130.215
Fair value change in hedged financial assets (+/-) 33.826 c. other provisions for risks and charges 360.968Equity investments 240.509 Technical reserves 1.879.072
Technical reserves of reinsurers 373Share capital, share premiums, reserves, valuation reserves and tresury shares 8.756.026
Property, plant and equipment 1.799.295 Minority interests 6.336Intangible asets 1.711.908 Profit (loss) for the period/year (+/-) 208.867 of which: goodwill 1.465.260 Total liabilities and equity 126.904.174Tax assets 4.122.268
Non-current assets and disposal groups held for sale 1.384Other assets 1.415.721Total assets 126.904.174

15
Key Figures
Consolidated income statement (in mln €) 1H2018Net interest income 896,2Net commission income 808Net result from finance 52,2Profits of equity-accounted investees 9Dividends and similar income 8,4Net income from insurance operations 11Other income items 51,8Operating income 1836,5Staff costs -749,9Other administrative expenses -392,6Depreciation, amortisation and net impairment losses on property, plant and equipment and intangible assets 82Operating expenses 1224,4Net operating income 612,1Net impairment losses on loans and securities -266,3Net impairment losses on other financial assets and l iabil itiesNet provisions for risk and charges -2,6Profits from the disposal of equity investments 1Pre-tax profit from continuing operations 344,1Taxes on income for the period from continuing operations -116,9Profits/losses for the period attributable to non-controll ing interests -13,8Profit for the period before Business Plan impacts 213,4Redundancy expenses net of taxes and non controll ing interests -Business Plan Project expenses net of taxes and non-controll ing interests -4,6Negative consolidation interests
Profit for the period 208,9Profit for the period net of non-recurring 222,1
PROFIT AND LOSS