An introduction to the Rietveld method Angus P. Wilkinson School of Chemistry and Biochemistry...
31
An introduction to the Rietveld method Angus P. Wilkinson School of Chemistry and Biochemistry Georgia Institute of Technology
-
Upload
jamie-chick -
Category
Documents
-
view
218 -
download
0
Transcript of An introduction to the Rietveld method Angus P. Wilkinson School of Chemistry and Biochemistry...

An introduction to the Rietveld method
Angus P. Wilkinson
School of Chemistry and Biochemistry
Georgia Institute of Technology
Outline
History and fundamentals– The birth of the Rietveld method
» what is Rietveld refinement?
– Adolescence» new instrumentation expands scope
– Maturity» new software enhances scope
Achievements– the technique is invaluable to materials scientists– and is becoming a serious tool for examining organics
Historical background
Powder diffraction is viewed primarily as a tool for phase identification and quantitative analysis.
With few exceptions, most of the crystal structures refined using powder data prior to Rietveld refinement were simple.
The compression of a 3D diffraction pattern into 1D can lead to overlapping peaks and information loss

Solutions to the problem of overlap
Do not use overlapped reflectionUse grouped intensitiesCurve fit the overlapping peaksFit the whole powder pattern
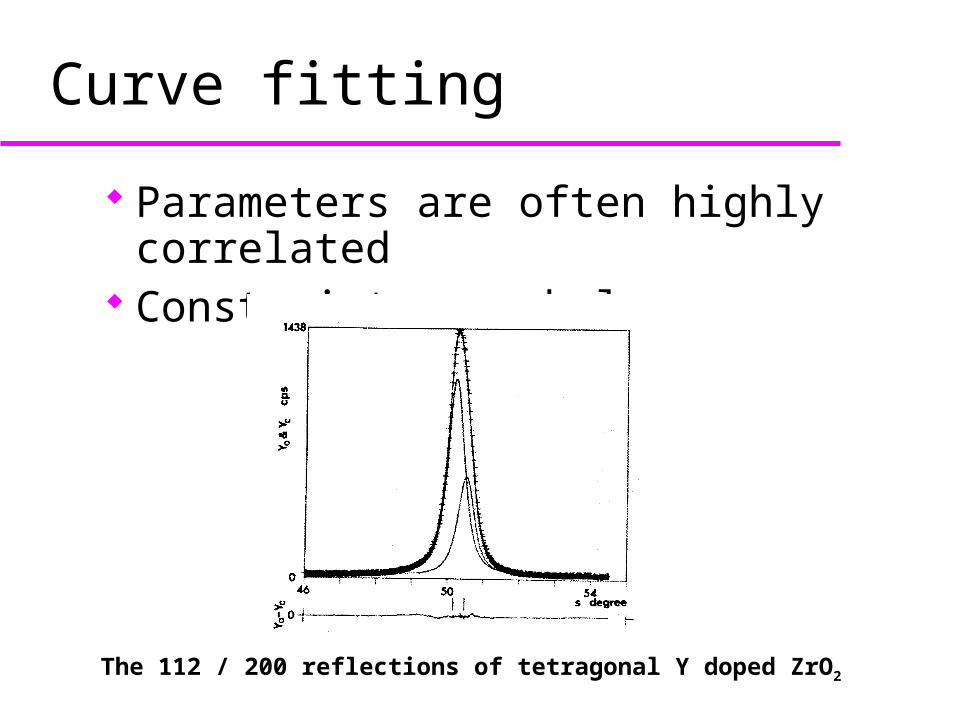
Curve fitting
The 112 / 200 reflections of tetragonal Y doped ZrO2
Parameters are often highly correlated Constraints can help
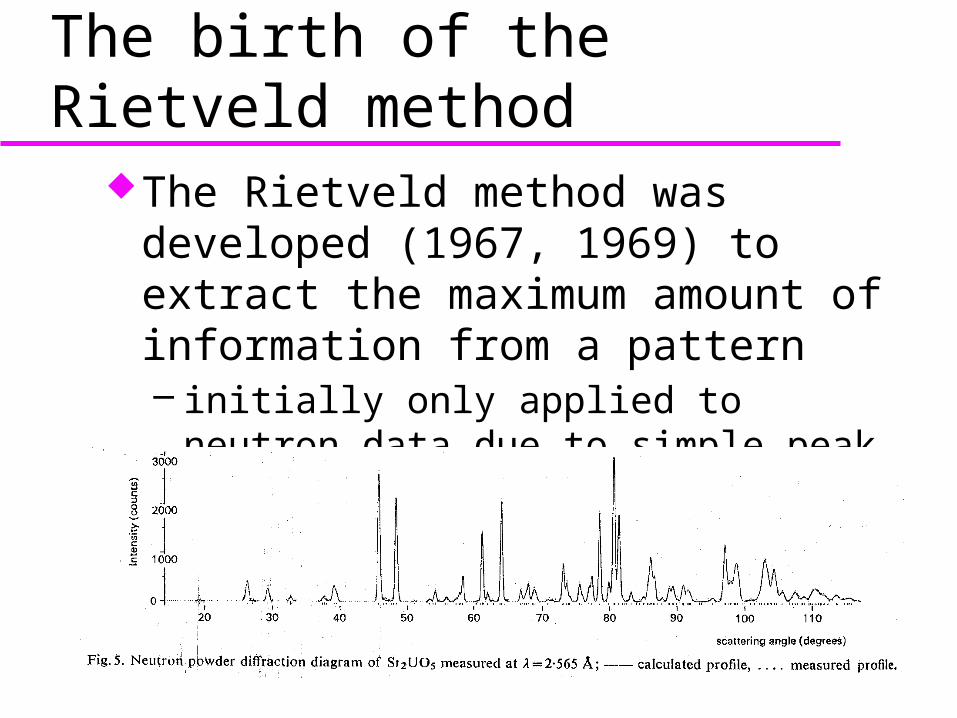
The birth of the Rietveld methodThe Rietveld method was developed (1967,
1969) to extract the maximum amount of information from a pattern– initially only applied to neutron data due to
simple peak shape
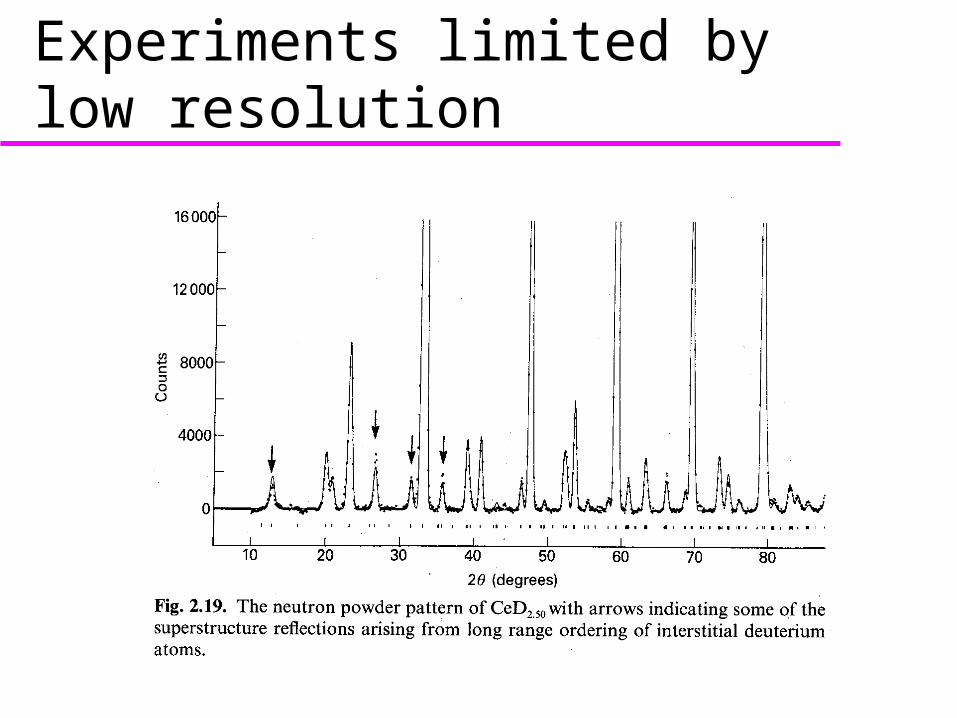
Experiments limited by low resolution

Parameters
Structural Variables– X, Y, Z, fractional occupancies, Uiso
Correction terms– Absorption, extinction
» These really do belong in the model!
Profile parameters– Unit cell constants, wavelength
– Peak shape, including width, asymmetry and anisotropy
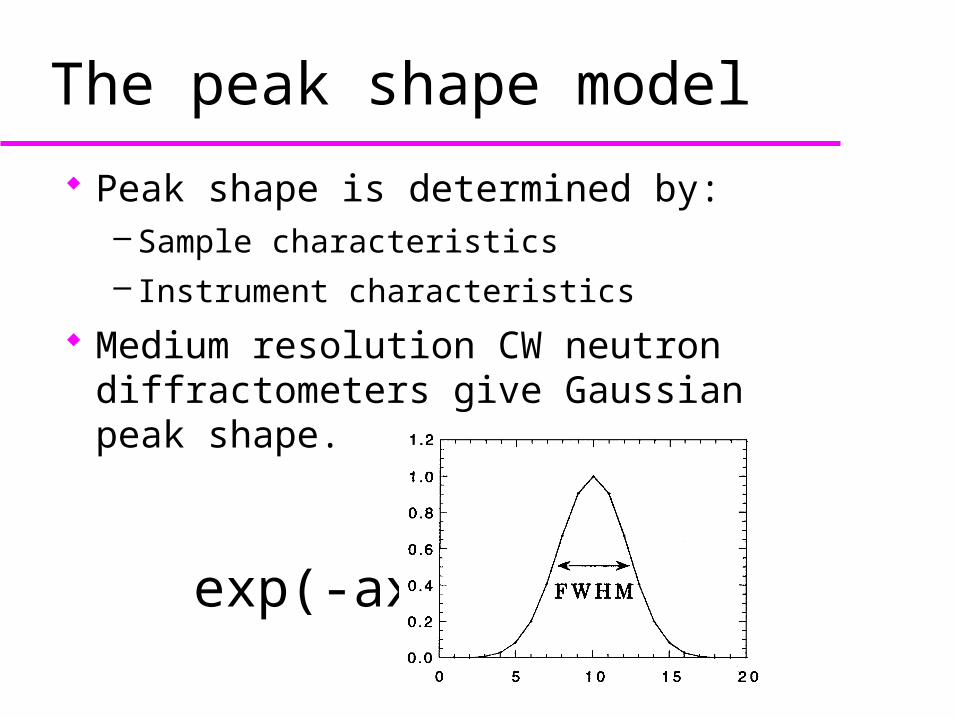
The peak shape model
Peak shape is determined by:– Sample characteristics
– Instrument characteristics
Medium resolution CW neutron diffractometers give Gaussian peak shape.
exp(-ax2)
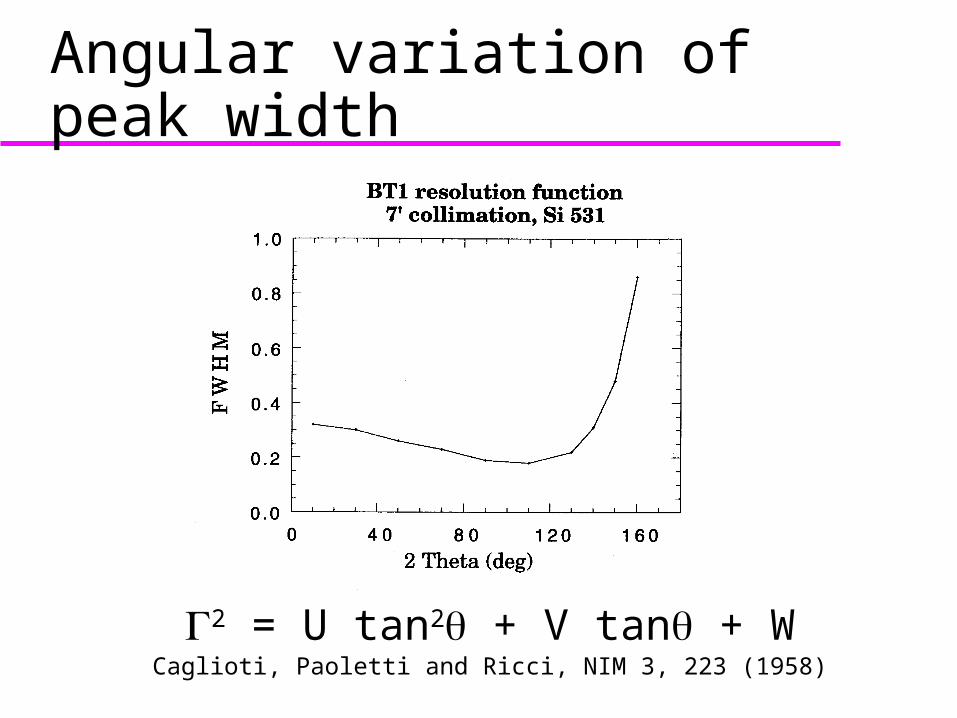
Angular variation of peak width
G2 = U tan2q + V tanq + WCaglioti, Paoletti and Ricci, NIM 3, 223 (1958)
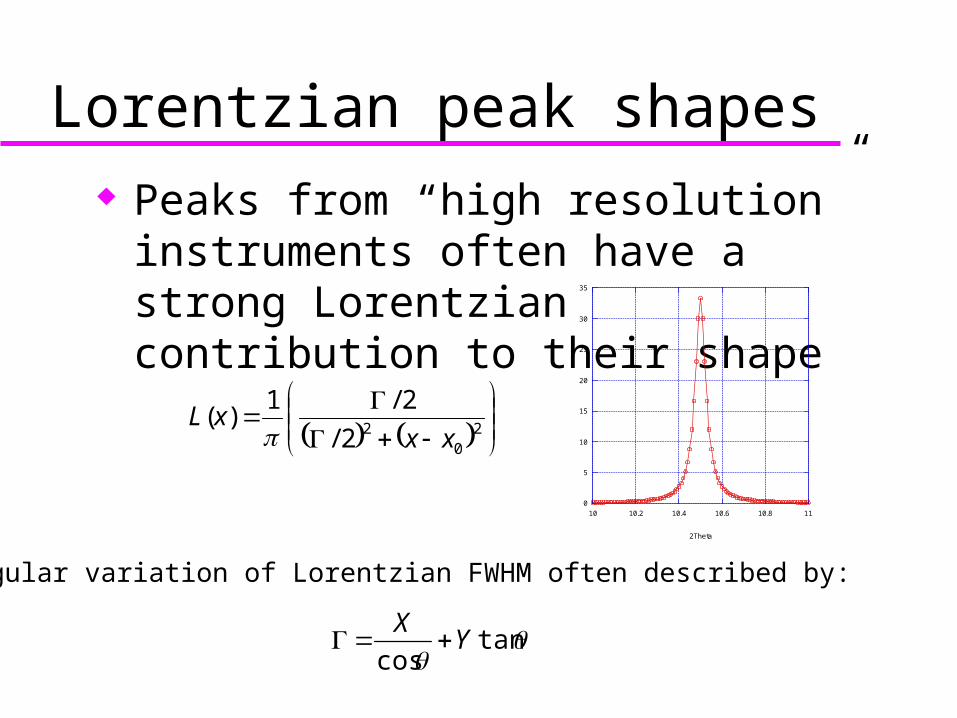
Lorentzian peak shapes Peaks from “high resolution” instruments
often have a strong Lorentzian contribution to their shape
20
22/
2/1)(
xxxL
0
5
10
15
20
25
30
35
10 10.2 10.4 10.6 10.8 11
2Theta
Angular variation of Lorentzian FWHM often described by:
tancos
YX

The limits of Rietveld refinement? We have to consider structural complexity, data quality
and what we already know Structural complexity is determined by:
– unit cell size– symmetry
Data quality includes factors such as:– How many resolved peaks do we have?– Is both neutron and X-ray data available
Existing information– Bond lengths– Chemical composition

ZrP2O7 Material is pseudo cubic (actually Pbca) with 136
unique atoms in the unit cell (402 coordinates!)– Synchrotron X-ray plus neutron data combined with
simulated annealing to get away from a pseudosymmetric starting point gave a good refinement. Restraints used.
Stinton, Hampson and Evans, Inorg. Chem. 45, 4352, (2006).
This is an extreme example!
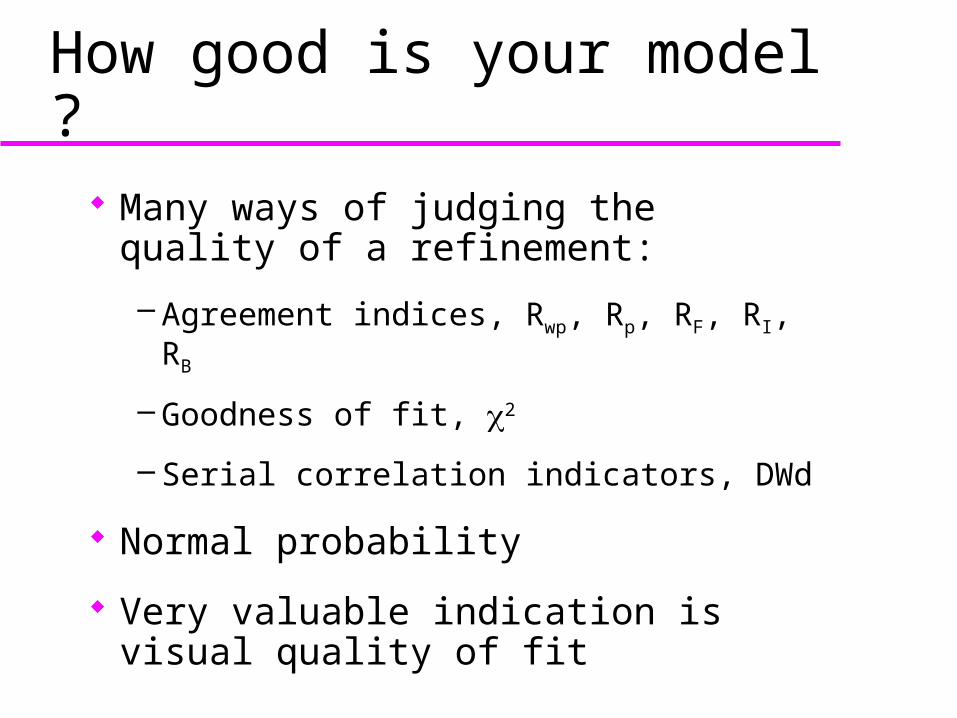
How good is your model ?
Many ways of judging the quality of a refinement:
– Agreement indices, Rwp, Rp, RF, RI, RB
– Goodness of fit, c2
– Serial correlation indicators, DWd
Normal probability
Very valuable indication is visual quality of fit

Profile R factors can be misleading
Rwp = 7.8%c2 = 16.5DWd = 0.19
Rwp = 2.1%c2 = 1.17DWd = 1.79

Profile plots can be very helpful
Zero point error / sample height problems

Profile plots can be very helpful
Peak shape model wrong

Better instruments
Instrument developments have enhanced the information content of powder patterns– high resolution time of flight and reactor based instruments
developed in the 80s– very high resolution x-ray diffractometers developed at
synchrotron sources in the 80s However, the extra information comes at a price
– The peak shape is often determined by the sample– TOF diffractometers have highly asymmetric peak shapes
Modeling high resolution data is more demanding

Synchrotron data for BaBiO3

Ultrahigh resolution
FWHM ~0.02o in some cases at ~ Cu Ka
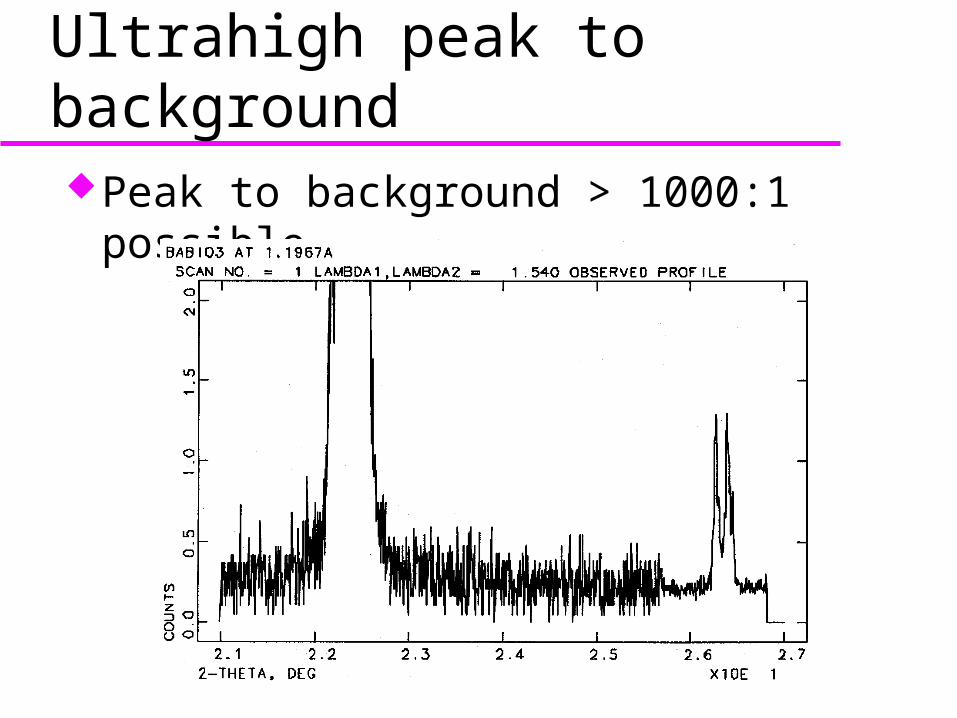
Ultrahigh peak to backgroundPeak to background > 1000:1 possible

TOF diffraction patterns
Asymmetric peak shapes
Advances in data analysis
Use multiple data sets to get extra information
Use constraints and restraints to handle very complex structures
Perform phase analysisLearn about crystallite size and strainDetermine texture in a material

Achievements Major contribution to almost every hot area of “hard”
materials in the last 15 years– High temperature superconductors– Buckyballs (C60)– Colossal Magnetoresistance– Thermoelectrics– Hydrogen storage– Batteries
Now making an inroad in biological science and organic materials– Drugs, polymers, proteins?

High Tc superconductors
Much of the solid state chemistry of these materials was worked using neutron diffraction and Rietveld refinement

C60 - Buckminsterfullerene
The structure of C60 and its metal doped variants have all been examined using the Rietveld method

Orientational ordering in C60
At high T, C60 is rotationally disordered, but at low temperatures the molecules order
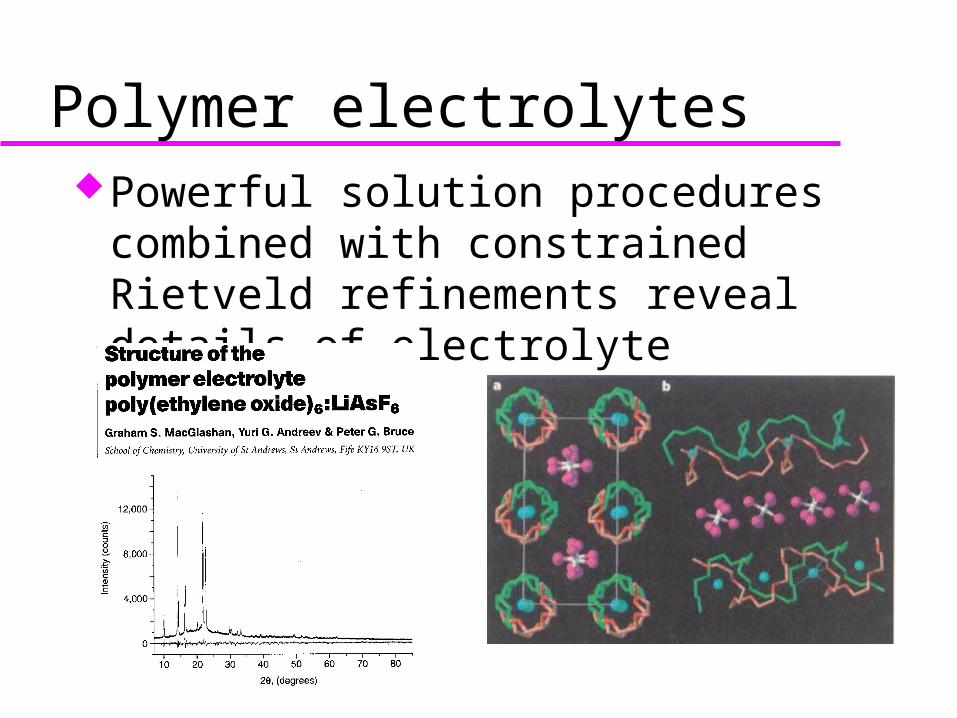
Polymer electrolytesPowerful solution procedures combined
with constrained Rietveld refinements reveal details of electrolyte structure

Drug structures can be determined Powerful structure solution methods (often simulated
annealing) combined with Rietveld refinement and constraints have been used to examine drugs

Battery electrodes Powder diffraction and Rietveld analysis are
widely used to characterize electrode materials and follow structural changes in-situ
Followed phase composition as a
function of discharge. Over 300 citations as of 2012
Conclusions Rietveld refinement has become a very powerful and
widely used tool. It makes the most of the available information– Quite large structures can be refined ~ 200 structural
parameters– The complexity of the problem is limited by instrument
resolution and sample quality Rietveld analysis is limited by the requirement that you
have a reasonable structural model before you start When performing a refinement consider all possible
indicators of model quality and make sure the visual fit is OK.