An Introduction to Stata for Economistsjorge-lara-alvarez.weebly.com/uploads/6/8/...stata... · 37....
45
An Introduction to Stata for Economists - Part II: Data Analysis Cosmina Dorobanțu, Sebastian Königs * _____________ * We are grateful to Kerry Papps for sharing his slides.
Transcript of An Introduction to Stata for Economistsjorge-lara-alvarez.weebly.com/uploads/6/8/...stata... · 37....
An Introduction to Stata for Economists -
Part II: Data Analysis
Cosmina Dorobanțu, Sebastian Königs*
_____________
* We are grateful to Kerry Papps for sharing his slides.

2. Overview • Do-files • Summary statistics • Correlation • Linear regression • Generating predicted values and hypothesis testing • Instrumental variables and other estimators • Panel data capabilities • Panel estimators • Writing loops • Graphs

3. Do-files
• Do-files allow commands to be saved and executed in “batch” form.
• We will use the Stata do-file editor to write do-files.
• To open do-file editor click Window Do-File Editor or click
• Can also use WordPad or Notepad: Save as “Text Document” with extension “.do” (instead of “.txt”). Allows larger files than do-file editor.

4. Do-files (cont.)
• Note: a blank line must be included at the end of a WordPad do-file (otherwise last line will not run).
• To run a do-file from within the do-file editor, either select Tools Do or click
• If you highlight certain lines of code, only those commands will run.
• To run do-file from the main Stata windows, either select File Do or type: do dofilename

5. Do-files (cont.)
• Can “comment out” lines by preceding with * or by enclosing text within /* and */.
• Can save the contents of the Review window as a do-file by right-clicking on window and selecting “Save All...”.

6. Univariate summary statistics
• tabstat produces a table of summary statistics: tabstat varlist [, statistics(statlist)]
• Example: tabstat age educ, stats(mean sd sdmean n)
• summarize displays a variety of univariate summary statistics (number of non-missing observations, mean, standard deviation, minimum, maximum): summarize [varlist]

7. Multivariate summary statistics
• table displays table of statistics: table rowvar [colvar] [, contents(clist
varname)] • clist can be freq, mean, sum etc. • rowvar and colvar may be numeric or string
variables. • Example:
table sex educ, c(mean age median inc)
8. Multivariate summary statistics (cont.)
• One “super-column” and up to 4 “super-rows” are also allowed.
• Missing values are excluded from tables by default. To include them as a group, use the missing option with table.

EXERCISE 1
9. Generating simple statistics • Open the do-file editor in Stata. Run all your
solutions to the exercises from here. • Open nlswork.dta from the internet as follows:
webuse nlswork • Type summarize to look at the summary
statistics for all variables in the dataset. • Generate a wage variable, which exponentiates ln_wage: gen wage=exp(ln_wage)
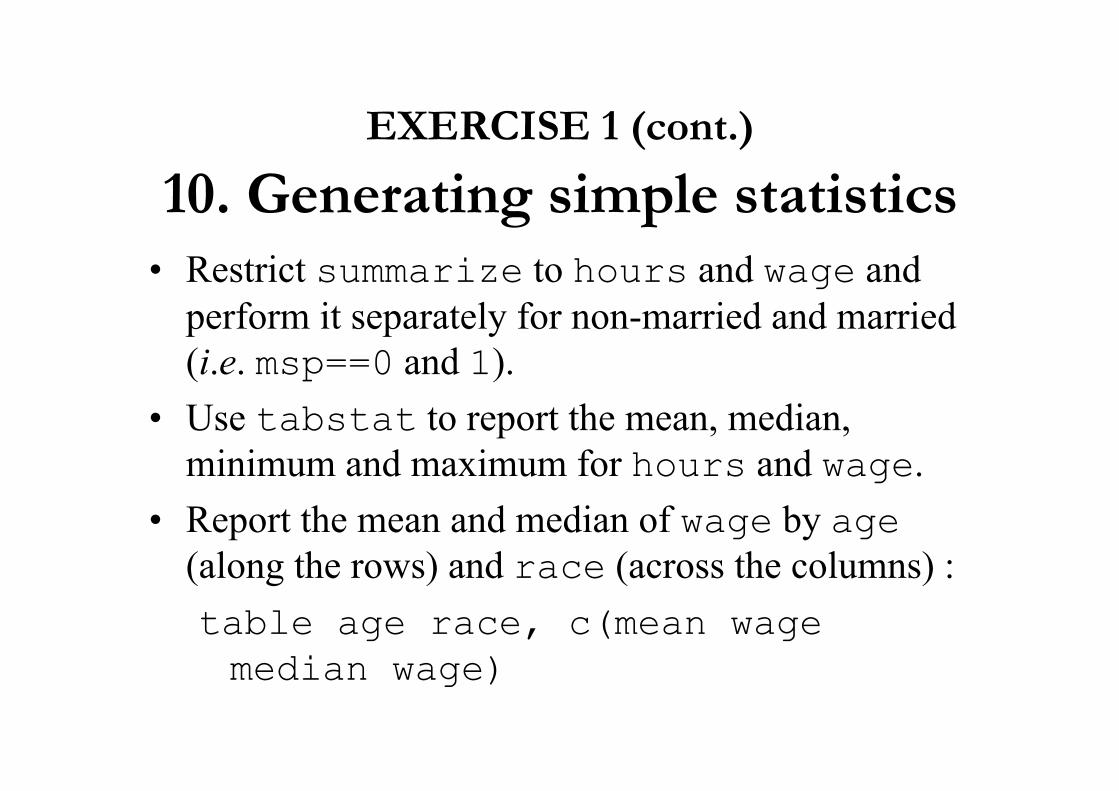
EXERCISE 1 (cont.) 10. Generating simple statistics
• Restrict summarize to hours and wage and perform it separately for non-married and married (i.e. msp==0 and 1).
• Use tabstat to report the mean, median, minimum and maximum for hours and wage.
• Report the mean and median of wage by age (along the rows) and race (across the columns) : table age race, c(mean wage median wage)

11. Sets of dummy variables
• Dummy variables take the values 0 and 1 only. • Large sets of dummy variables can be created
with: tab varname, gen(dummyname)
• When using large numbers of dummies in regressions, useful to name with pattern, e.g. id1, id2… Then id* can be used to refer to all variables beginning with *.

12. Correlation
• To obtain the correlation between a set of variables, type: correlate [varlist] [[weight]] [, covariance]
• covariance option displays the covariances rather than the correlation coefficients.
• pwcorr displays all the pairwise correlation coefficients between the variables in varlist: pwcorr [varlist] [[weight]] [, sig]

13. Correlation (cont.)
• sig option adds a line to each row of matrix reporting the significance level of each correlation coefficient.
• Difference between correlate and pwcorr is that the former performs listwise deletion of missing observations while the latter performs pairwise deletion.
• To display the estimated covariance matrix after a regression command use: estat vce

14. Linear regression
• To perform a linear regression of depvar on varlist, type: regress depvar varlist [[weight]] [if
exp] [, noconstant robust] • depvar is the dependent variable. • varlist is the set of independent variables
(regressors). • By default Stata includes a constant. The noconstant option excludes it.

15. Linear regression (cont.)
• robust specifies that Stata report the Huber-White standard errors (which account for heteroskedasticity).
• Weights are often used, e.g. when data are group averages, as in: regress inflation unemplrate year [aweight=pop]
• This is weighted least squares (i.e. GLS). • Note that here year allows for a linear time
trend.

16. Post-estimation commands
• After all estimation commands (i.e. regress, logit) several predicted values can be computed using predict.
• predict refers to the most recent model estimated.
• predict yhat, xb creates a new variable yhat equal to the predicted values of the dependent variable.
• predict res, residual creates a new variable res equal to the residuals.

17. Post-estimation commands (cont.)
• Linear hypotheses can be tested (e.g. t-test or F-test) after estimating a model by using test.
• test varlist tests that the coefficients corresponding to every element in varlist jointly equal zero.
• test eqlist tests the restrictions in eqlist, e.g.: test sex==3
• The option accumulate allows a hypothesis to be tested jointly with the previously tested hypotheses.

18. Post-estimation commands (cont.)
• Example: regress lnw sex race school age test sex race test school == age, accum

EXERCISE 2 19. Linear regression
• Compute the correlation between wage and grade. Is it significant at the 1% level?
• Generate a variable called age2 that is equal to the square of age (the square operator in Stata is ^).
• Create a set of race dummies with: tab race, gen(race)
• Regress ln_wage on: age, age2, race2, race3, msp, grade, tenure, c_city.

EXERCISE 2 (cont.) 20. Linear regression
• Display the covariance matrix from this regression.
• Use predict to generate a variable res containing the residuals from the equation.
• Use summarize to confirm that the mean of the residuals is zero.
• Rerun the regression and report Huber-White standard errors.

21. Additional estimators
• Instrumental variables: ivregress 2sls depvar exogvars (endogvars=ivvars)
• Both exogvars and ivvars are used as instruments for endogvars.
• For example: ivregress 2sls price inc pop (qty=cost)
• Logit: logit depvar indepvars

22. Additional estimators (cont.)
• Probit: probit depvar indepvars
• Ordered probit: oprobit depvar indepvars
• Tobit: tobit depvar indepvars, ll(cutoff)
• For example, tobit could be used to estimate labour supply: tobit hrs educ age child, ll(0)

EXERCISE 3 23. IV and probit
• Repeat the regression from Exercise 2 using ivregress 2sls and instrument for tenure using union and south. Compare the results with those from Exercise 2.
• Estimate a probit model for union with the following regressors: age, age2, race2, race3, msp, grade, c_city, south.

24. Panel data manipulation
• Panel data generally refer to the repeated observation of a set of fixed entities at fixed intervals of time (also known as longitudinal data).
• Stata is particularly good at arranging and analysing panel data.
• Stata refers to two panel display formats: – Wide form: useful for display purposes and
often the form data obtained in. – Long form: needed for regressions etc.
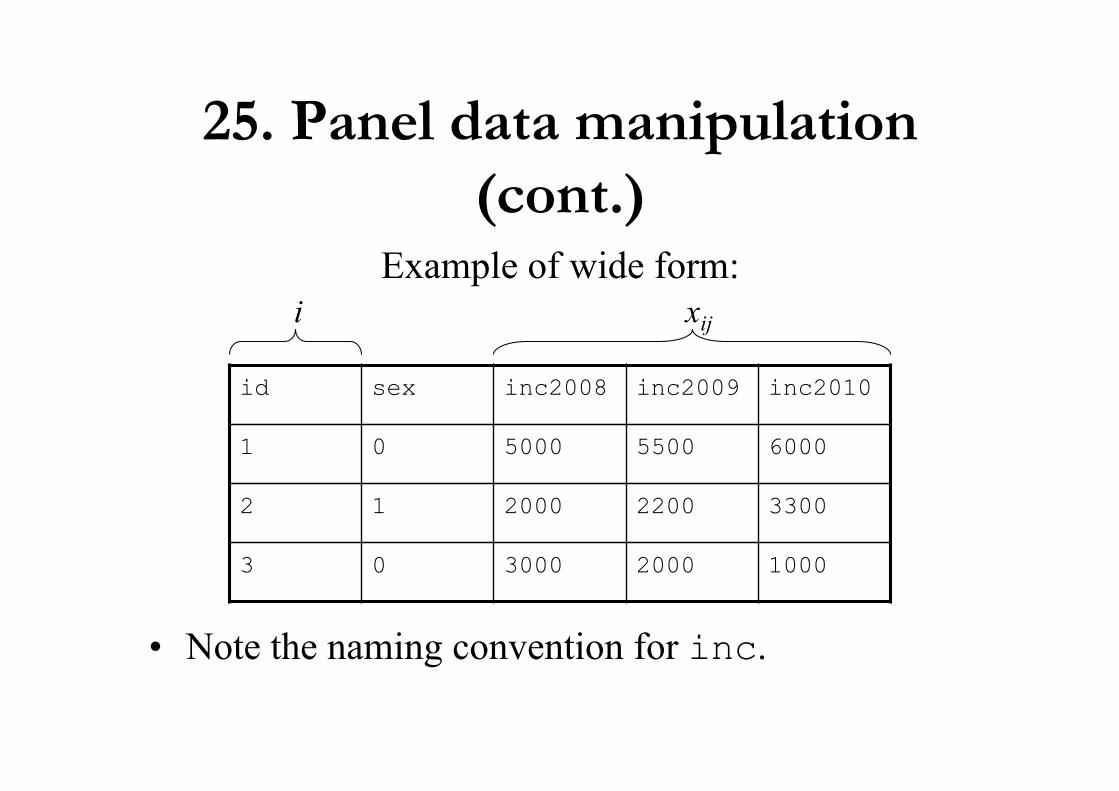
25. Panel data manipulation (cont.)
Example of wide form:
• Note the naming convention for inc.
id sex inc2008 inc2009 inc2010
1 0 5000 5500 6000
2 1 2000 2200 3300
3 0 3000 2000 1000
i xij

26. Panel data manipulation (cont.)
Example of long form:
id year sex inc
1 2008 0 5000
1 2009 0 5500
1 2010 0 6000
2 2008 1 2000
2 2009 1 2200
2 2010 1 3300
3 2008 0 3000
3 2009 0 2000
3 2010 0 1000
i j xij

27. Panel data manipulation (cont.)
• To change from long to wide form, type: reshape wide varlist, i(ivarname) j(jvarname)
• varlist is the list of variables to be converted from long to wide form.
• i(ivarname) specifies the variable(s) whose unique values denote the spatial unit.
• j(jvarname) specifies the variable whose unique values denote the time period.

28. Panel data manipulation (cont.)
• To change from wide to long form, type: reshape long stublist, i(ivarname) j(jvarname)
• stublist is the “word” part of the names of variables to be converted from wide to long form, e.g. “inc” above.
• It is important to name variables in this format, i.e. word description followed by year.

29. Panel data manipulation (cont.)
• To move between the above example datasets use: reshape long inc, i(id) j(year) reshape wide inc, i(id) j(year)
• These steps “undo” each other.

30. Lags
• You can “declare” the data to be in panel form, with the xtset command: xtset panelvar timevar
• For example: xtset country year
• After using xtset, a lag can be created with: gen lagname = L.varname
• Similarly, L2.varname gives the second lag.

31. Panel estimators
• Panel data estimation: xtreg depvar indepvars [, re fe i(panelvar)]
• i(panelvar) specifies the variable corresponding to an independent unit (e.g. country). This can be omitted if the data have been xtset.
• re and fe specify how we wish to treat the time-invariant error term (random effects vs fixed effects).

32. Panel estimators (cont.)
• An alternative to fe is to regress depvar on a set of dummy variables for each panel unit.
• You should either drop one dummy or use the noconstant option to avoid the dummy variable trap, although Stata automatically drops regressors when they are perfectly collinear.
• To perform a Hausman test of fixed vs random effects, first run each estimator and save the estimates, then use the hausman command:

33. Panel estimators (cont.)
xtreg depvar indepvars, fe estimates store fe_name xtreg depvar indepvars, re estimates store re_name hausman fe_name re_name
• You must list the fe_name before re_name in the hausman command.

EXERCISE 4 34. Manipulating a panel
• Declare the data to be a panel using xtset, noting that idcode is the panel variable and year is the time variable.
• Generate a new variable lwage equal to the lag of wage and confirm that this contains the correct values by listing some data (use the break button): list idcode year wage lwage
• Save the file as “NLS data” in a folder of your choice.

EXERCISE 4 (cont.) 35. Manipulating a panel
• Using the same regressors from the regress command in Exercise 2, run a fixed effects regression for ln_wage using xtreg.
• Note that all time invariant variables are dropped. • Store the estimates as fixed. • Run a random effects regression and store the
estimates as random. • Perform a Hausman test of random vs fixed
effects. Which is preferred?

EXERCISE 4 (cont.) 36. Manipulating a panel
• Drop all variables other than idcode, year and wage using the keep command (quicker than using drop).
• Use the reshape wide option to rearrange the data so that the first column represents each person (idcode) and the other columns contain wage for a particular year.
• Return the data to long form (change wide to long in the command).
• Do not save the new dataset.

37. Writing loops
• The foreach command allows one to repeat a sequence of commands over a set of variables: foreach name of varlist varlist { Stata commands referring to `name’ }
• Stata sequentially sets name equal to each element in varlist and executes the commands enclosed in braces.
• name should be enclosed within the characters ` and ’ when referred to within the braces.

38. Writing loops (cont.)
• name can be any word and is an example of a “local macro”.
• For example: foreach var of varlist age educ inc {
gen l`var’=log(`var’) drop `var’ }
• forvalues lets you loop over consecutive values

EXERCISE 5 39. Using loops in regression
• Open “NLS data” and rerun the fixed effects regression from Exercise 4.
• Use foreach with varlist to loop over all the regressors and report their t-statistics (using test).
• Use foreach with varlist to create a loop that renames each variable by adding “68” to the end of the existing name.

40. Graphs
• To obtain a basic histogram of varname, type: histogram varname, discrete freq
• To display a scatterplot of two (or more) variables, type: scatter varlist [[weight]]
• weight determines the diameter of the markers used in the scatterplot.

41. Graphs (cont.)
• There are options for (among other things): – Adding a title (title) – Altering the scale of the axes (xscale, yscale)
– Specifying what axis labels to use (xlabel, ylabel)
– Changing the markers used (msymbol) – Changing the connecting lines (connect)

42. Graphs (cont.)
• Particularly useful is mlabel(varname) which uses the values of varname as markers in the scatterplot.
• Example: scatter gdp unemplrate, mlabel(country)

43. Graphs (cont.)
• Graphs are not saved by log files (separate windows).
• Select File Save Graph. • To insert in a Word document etc., select Edit
Copy and then paste into Word document. This can be resized but is not interactive (unlike Excel charts etc.).

44. Installing new packages
• Sometimes, a command that you might want to use is not installed (it may be user-written)
• You can use findit word to look for in all available resources (online help, FAQs, etc.)
• Results will be displayed in the viewer window; look for correct package and click on ‘install’

45. Some useful references
• help [command_or_topic_name] • Check more extensive manual (link provided in the bottom
of the corresponding help-file: Also see Manual) • Statalist: http://www.stata.com/statalist/ • UCLA Stata learning moduldes
http://www.ats.ucla.edu/stat/stata/modules/default.htm • UCLA Stata graph examples
http://www.ats.ucla.edu/stat/stata/library/GraphExamples/default.htm