An introduction to parametric fingerprint maps
15
AN INTRODUCTION TO PARAMETRIC FINGERPRINT MAPS A NEW TOOL FOR MINERAL EXPLORATION Carl Knox-Robinson, PhD Spatial Analysis Services E: [email protected] W: www.prospectivitymapping.com
-
Upload
carl-knox-robinson -
Category
Technology
-
view
412 -
download
0
Transcript of An introduction to parametric fingerprint maps

AN INTRODUCTION TO PARAMETRIC FINGERPRINT MAPSA NEW TOOL FOR MINERAL EXPLORATION
Carl Knox-Robinson, PhDSpatial Analysis ServicesE: [email protected]: www.prospectivitymapping.com
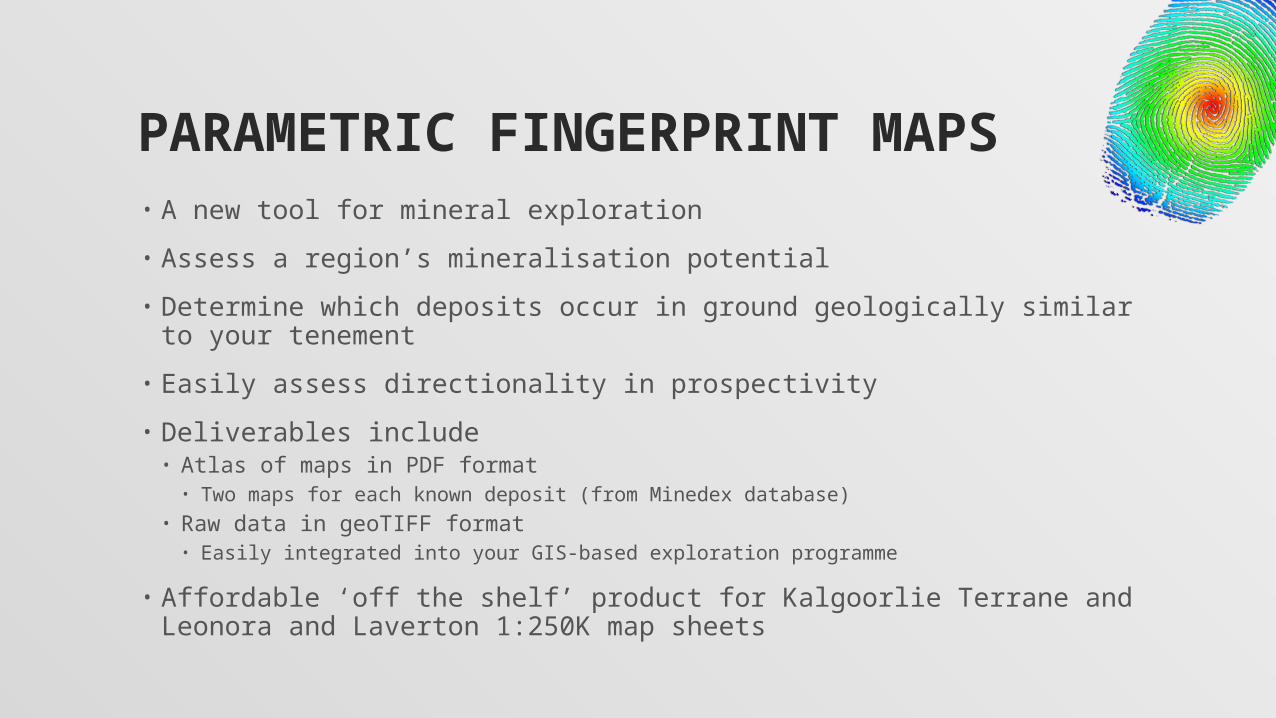
PARAMETRIC FINGERPRINT MAPS• A new tool for mineral exploration
• Assess a region’s mineralisation potential
• Determine which deposits occur in ground geologically similar to your tenement
• Easily assess directionality in prospectivity
• Deliverables include• Atlas of maps in PDF format• Two maps for each known deposit (from Minedex database)
• Raw data in geoTIFF format• Easily integrated into your GIS-based exploration programme
• Affordable ‘off the shelf’ product for Kalgoorlie Terrane and Leonora and Laverton 1:250K map sheets

CONVENTIONAL PROSPECTIVITY MAPPING• Two broad approaches:• Data-driven – based on empirical measurements• Knowledge-driven – based on genetic concepts of deposit formation
• Number of different techniques used to combine multiple map layers• Index overlay, weights of evidence, algebraic, fuzzy logic etc.
• Result is a single map denoting ‘prospectivity’ aka mineralisation potential
• For same input data most methods will agree on the least and most prospective areas• Calculated prospectivity in intermediate areas can vary greatly between
methods• Vectorial Fuzzy Logic (developed by prospectivitymapping.com) allows for better
visualisation of such areas

CONVENTIONAL PROSPECTIVITY MAPPING• For data-driven approaches, deposit size & clustering can
bias resultant map. Biased results can be reduced by:• Using a data subset that excludes smallest and largest deposits (e.g.
treat as outliers)• Transform data (log-transform) or use non-parametric methods• Spatially ‘winnow’ data to reduce clustering
• Ultimately all conventional prospectivity maps represent some kind of weighted average based on the input mineral deposits
• For Archean lode gold deposits the efficiency of resultant prospectivity map may be diminished due to the fact, for example, that all kinds of host rock can be mineralised.
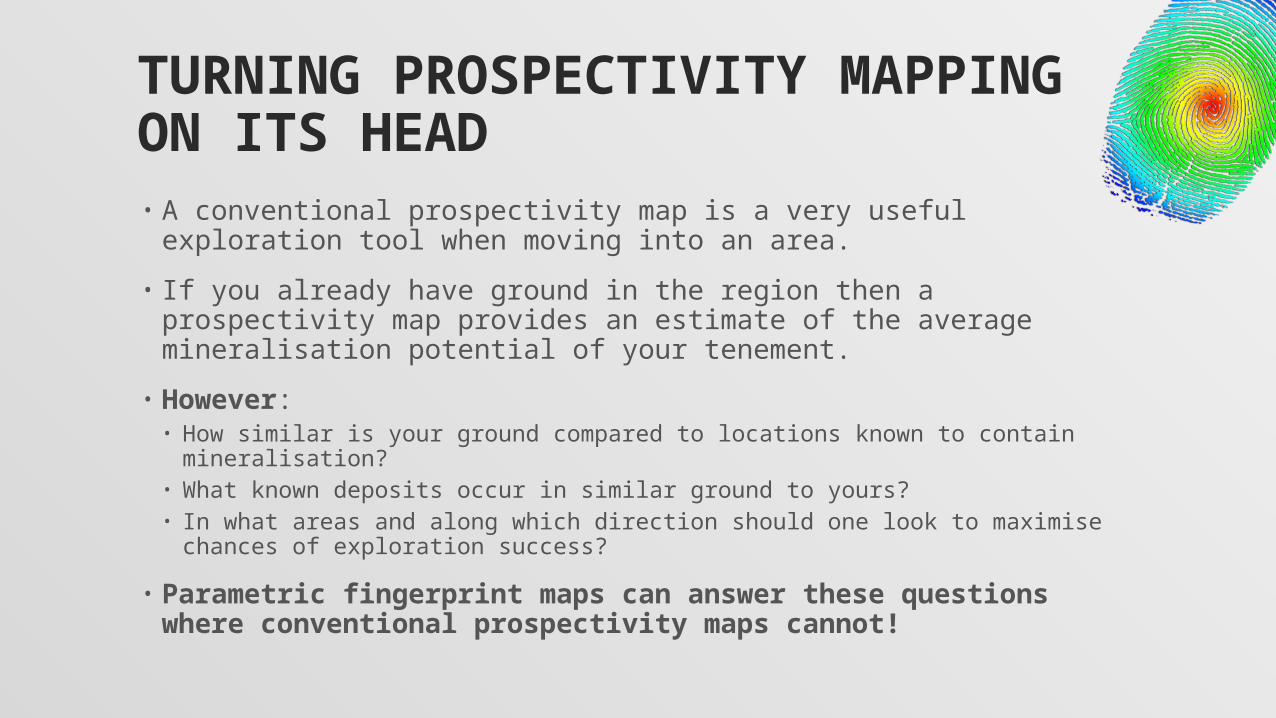
TURNING PROSPECTIVITY MAPPING ON ITS HEAD• A conventional prospectivity map is a very useful exploration tool
when moving into an area.
• If you already have ground in the region then a prospectivity map provides an estimate of the average mineralisation potential of your tenement.
• However:• How similar is your ground compared to locations known to contain
mineralisation?• What known deposits occur in similar ground to yours?• In what areas and along which direction should one look to maximise chances
of exploration success?
• Parametric fingerprint maps can answer these questions where conventional prospectivity maps cannot!

PARAMETRIC FINGERPRINT MAPS• Employs the same base layers as used in the construction of
conventional prospectivity maps
• For the location of each known deposit (or location of interest) a parametric ‘fingerprint’ is taken
• A map is then generated that expresses similarity to the fingerprint over the entire region• For visualisation purposes, this map is inverted so that peaks
represent the greatest similarity to the fingerprint• A 0.5% map is also created that shows the 0.5% of the ground that is
most similar to the ‘fingerprint’ based on the input layers

EXAMPLE PARAMETRIC FINGERPRINTFor the Kalgoorlie Terrane, 14 geological parameters have been identified that are spatially related to gold mineralisation.
These geological parameters have been represented in map from and normalised for the purposes of measuring a deposit’s fingerprint.
We are working in 14 dimensional space!
Parametric Fingerprint for the undevelopedBaden Powell Gold Deposit
Vector values are represented as the number ofstandard deviations from the mean of each input layer
V1 anticlinal fold hinge abundance (-.44)V2 fault abundance (0.36)V3 lithological contact abundance (1.55)V4 low rheological contrast contact abundance (2.16)V5 fault proximity (-0.77)V6 high rheological contrast contact abundance (-0.88)V7 lithological contact proximity (-0.73)V8 low rheological contrast contact proximity (-0.79)V9 strike of proximal anticlinal fold hinge (-0.39)V10 strike of proximal fault (-1.01)V11 strike of proximal lithological contact (-0.43)V12 lithological variety within 2km radius (2.29)V13 lithological variety within 5km radius (1.46)V14 change in lithological variety (0.01)

EXAMPLE PARAMETRIC FINGERPRINT MAPA portion of a parametric fingerprint map for the Kalgoorlie Terrane.
Parametric fingerprint map is for the deposit called Baden Powell and is based on 14 input Layers.
Warm colours indicate locations parametrically similar to the location of the reference gold deposit.
Fingerprint Location
Areas parametrically similar to the fingerprint location

EXAMPLE 0.5% SIMILARITY MAPThis map is based on the previous and shows the 0.5% of the ground that is parametrically most similar to the fingerprint location.
It allows for a quick analysis of a region’s importance based on a single known deposit.

ATLASES OF GOLD DEPOSIT FINGERPRINT MAPS AVAILABLE FROM PROSPECTIVITYMAPPING.COM
• Atlases constructed for two key regions of the Yilgarn Craton• Kalgoorlie Terrane (based on 1:250K maps)• Leonora – Laverton (based on 1:250K maps)
• Atlas data can be used stand-alone or integrated into your GIS-based mapping system• All data provided as geoTIFFs and PDFs• Due to the volume of information, all data provided on removable hard drive
• ProspectivityMapping.com can value-add to the fingerprint maps with your own company information• Assess your tenement, or neighbouring tenement for mineralisation
potential• How similar / dissimilar your ground is to that containing a specific known
deposit, etc.

KALGOORLIE TERRANE ATLAS (V2.1)• Maps created for each of the 963 relevant gold mines /
deposits / occurrences listed in the Minedex database• Geology digitised from two 1:250,000 Bedrock Geology Maps of the
Kalgoorlie Terrane complied by Swager and Griffin• 1,926 maps in total • 963 standard fingerprint maps• 963 0.5% similarity maps
• Data formats• Printable maps in PDF format (1:500k)• GeoTIFFs for importation into a GIS (30m nominal resolution)• For easy registration with Landsat imagery

KALGOORLIE TERRANE ATLAS (V2.1)• Based on 14 parameters statistically determined to have a bearing on gold
mineralisation in the region.• abundance of anticlinal fold hinges; • fault abundance; • lithological contact abundance;• low rheological contrast contact abundance; • fault proximity; • high rheological contrast contact proximity;• lithological contact proximity; • low rheological contrast contact proximity; • strike of proximal anticlinal fold hinge; • strike of proximal fault; • strike of proximal lithological contact; • lithological variety (number distinct rock types)within 2km radius; • lithological variety (number distinct rock types) within 5km radius; • change in lithological variety from between 5km and 3km.

LEONORA– LAVERTON ATLAS (V2.0)• Maps created for each of the 1,386 gold deposits /
occurrences listed in the Minedex database• 1:250,000 GSWA bedrock geology maps of the Leonora (SH51-1) and
Laverton (SH51-2) areas serve as a basis for this atlas.• 2,772 maps in total • 1,386 standard fingerprint maps• 1,386 0.5% similarity maps
• Data formats• Printable maps in PDF format• GeoTIFFs for importation into a GIS
• 30m nominal resolution• For easy registration with Landsat imagery

LEONORA– LAVERTON ATLAS (V2.0)• Based on 14 parameters statistically determined to have a bearing on
gold mineralisation in the region.• Fault intersection abundance; • fault abundance; • lithological contact abundance; • low rheological contrast contact abundance; • fault intersection proximity; • fault proximity; • high rheological contrast contact proximity; • low rheological contrast contact proximity; • strike of proximal anticlinal fold hinge; • strike of proximal fault; • strike of proximal lithological contact; • lithological variety (number distinct rock types) within 2km radius; • lithological variety (number distinct rock types) within 5km radius; • change in lithological variety from between 5km and 2km.

NEED MORE INFORMATION?
For more details on the tools and techniques used to construct these atlases please contact
Dr Carl Knox-Robinson via email or phone
E: [email protected]: 0422 935 457