AN INTRODUCTION TO MONITORING & ANALYTICS REQUIREMENTS
11
AN INTRODUCTION TO MONITORING & ANALYTICS REQUIREMENTS A white paper from the ONUG 2017 Monitoring & Analytics Initiative April, 2017
Transcript of AN INTRODUCTION TO MONITORING & ANALYTICS REQUIREMENTS

AN INTRODUCTION TO MONITORING & ANALYTICSREQUIREMENTS
A white paper from the ONUG 2017 Monitoring & AnalyticsInitiative
April, 2017

Table of ContentsIntroduction
Service Assurance Use Case Requirements Use Case Requirements
Application Service Delivery Management (SDM) Requirements
Cloud Migration and Hybrid Deployment Use Case Requirements
Overlay/Underlay Networks Use Case Requirements
Capacity Planning Use Case Requirements
Business Requirements Use Case Requirements
Supporting Data and Its Dimensions
Data Collection Mechanisms
Analytics of Data
ONUG Monitoring & Analytics Initiative Members
Definition of Open Networking
Open networking is a suite of interop-erable software and/or hardware that delivers choice and design options to IT business leaders, service, and cloud providers. At its core, open network-ing is the separation or decoupling of specialized network hardware and software – all in an effort to give IT ar-chitects options in the way they choose to design, provision, and manage their networks. These technologies must be based on industry standards. The standards can be de-facto as adopted by a large consortium of the vendor community, open in the sense that they are community-based, or defined as standards by the prevailing standards bodies. Open networking hopes to deliver on two promises:
1) Decoupling of network hardware and software, which serves to miti-gate vendor lock-in and shifts network architecture structure options to users
2) Significant reduction of total cost of network ownership
T3
4 Use Case Requirements Use Case Requirements
5 Requirements
5 Use Case Requirements
6 Use Case Requirements
7 Use Case Requirements
8 Use Case Requirements
9
10
10
11

IntroductionThis White paper was prepared by the ONUG Monitoring & Analytics Initia-tive. It sets forth a number of monitoring and analytics use cases and associated requirements. It then describes the different sources of data and related dimensions that can be used for monitoring and analysis.
Figure 1 below, our reference environment, depicts the nature of modern IT, including a Software-Defined Data Center (SDDC), multi-cloud deployments, Software as a Service (SaaS) application services, mobile workforces, and a wired and wireless enterprise user community connected by legacy network, Software- Defined Networks (SDN), and the public Internet. In a majority of cases, the old legacy management solutions, while still required, will not extend to overlay networks, public cloud, and SaaS applications.
This new picture of IT has introduced new challenges for both end-user operations teams as well as domain-specific management vendors, who are all playing a catch-up game. In the public cloud arena for example, network Switch Port Analyzer (SPAN) capability is no longer readily available, while servers and other infrastructure management to the extent accessible are provided by cloud provider tools. In the case of Amazon Web Services (AWS) and Microsoft Azure for example, these tools are respectively Cloudwatch and Operations Management Suite (OMS), which are different in look and feel, workflow, and capabilities. This added complexity and additional tools require more human interaction and different skillsets. Our use casesrefer to this environment for the rest of this document
Open Networking User Group(ONUG)
ONUG is one of the largest indus-try user groups in the IT infrastruc-ture market. Its board is comprised exclusively of IT business leaders, with representation from Fidelity Investments, FedEx, BNY Mellon, Bank of America, Intuit, UBS, Pfizer, GE, JPMorgan Chase, Morgan Stanley, Citigroup, Credit Suisse, Gap, Yahoo!, eBay and TD Ameritrade. The ONUG mission is to enable greater choice and options for IT business leaders by advocating open, interoperable hardware- and software-defined infrastructure solutions that span the entire IT stack, all in an effort to create business value.
The ONUG community is led by IT business leaders and aims to drive industry dialogue to set the technology direction and agenda with vendors, standards and open source organizations. To that end, ONUG hosts two major conferences per year where use cases are developed and members vote to establish a prioritized list of early adopter, open interop-erable hardware and software-de-fined infrastructure projects that communicate propensity to buy and budget development. The vendor community stages proof of concepts based upon ONUG Use Cases, while standards and open source organi-zations prioritize their initiatives and investments based upon them. ONUG organizes working groups to fully develop use cases and set industry initiatives. ONUG also hosts user sum-mits and smaller, regional user-focused Fireside Chat Meet-Ups through the year.
Figure 1 - The hybrid nature of modern IT
Feedback from our ONUG community is emphatic that Hybrid IT deployments are an essential use case; they are here now in many varieties and here to stay for a long time; a fact with which the analyst community also concurs. End-user monitoring architectures that do not address Hybrid IT reality are missing the mark!
For application management, performance metrics derived from Application Aware Network Data Analytics, Synthetic Transactions, and Application Performance Management (APM), agent technologies will be used along with infrastructure management metrics, pertaining to the application. Infrastructure and application management data sources will include time series Wire Data, Synthetic Transaction agents, Simple Network Management Protocol (SNMP), Web Management Interface (WMI), Application Programming Interface (API) calls, which are polled or streamed, and configuration information and log data, which are often collected or received asynchronously.

With our reference environment and data model outlined, the use cases are:
Service Assurance (SA), a broad topic, covering performance and fault management across network, compute, storage, and Unified Communication and Collaboration (UCC) infrastructure;
Application Service Delivery Management (SDM), which is closely related to the previous item but distinguished here because of it is typically delivered from within a line of business and requires some level of application development or DevOps skill sets;
Cloud Migration and Hybrid Deployment. We focused on Hybrid deployment due to the large adoption rate of both Public Cloud and Hosted Private Cloud (HPC) seen today and projected to be seen in the market, which has left no enterprise untouched. However, similar attributes apply to any traditional moves, adds, and changes to the applications, infrastructure, and end-user communities;
Overlay/Underlay Networks. While items one to three touch upon changes that have come about as a result of a Software- Defined Data Centre (SDDC) implicitly, this category focuses on:
Fault detection and reporting in both the overlay and underlay network;
Correlation of faults in an underlay network to faults in the overlaid networks and vice versa.
Capacity Planning while a function typically outside the operations teams depends heavily on the same data collected by tools owned by operations. Furthermore, problem management root-cause findings may trigger capacity planning work.
Lastly, we have introduced a discussion of Business Requirements. Although, not a use case per se, in the real world, on one hand we all have budget constraints, which vary drastically by industry and company size, and on the other hand, we are faced with proliferation of new technologies requiring their own management tools and data sources. This directly increases both the Capex and Opex costs of operations teams and adversely impacts their Mean-Time-To Repair (MTTR). To that end, we have introduced requirements around efficacy of data and minimization of tools, where possible.
Service Assurance
Use case:
Problems during the deployment and operation of services and applications are inevitable. They may manifest themselves as failures (e.g., component failure, server errors, loss of connectivity), or degraded performance (e.g., slow application response time), requiring both fault management and performance management disciplines equipped with tools, expertise, and personnel.
A prerequisite step to problem resolution is problem detection, of course. In a way, defining functional requirements for comprehensive monitoring architecture (for the purpose of problem detection) is the goal of this document. The key steps in resolving a problem are Triage, Isolation and Troubleshooting. The Triage step determines scope and priority of the application users affected; the Isolation step attempts to contain the problem based on initial problem analysis, and consequently assigns investigation and support responsibilities; the Troubleshooting step includes all information to get to the root cause of the problem so it can be fixed. Unavailable, malfunctioning or slow services and applications can directly affect the revenue of a business or line-of-business. Minimizing the MTTR from the time a problem is identified (either proactively or reactively) is therefore essential.
Requirements:
- Monitoring functions must provide information that enables rapid Triage, Isolation, and timely Troubleshooting of services and applications that have become unavailable, intermittent or slow.
- When services or applications are split across different environments then (i) the same metrics (e.g., server CPU, memory, NIC, and Storage utilization) must be available from all deployment environments (e.g., legacy physical servers, virtualized compute, private cloud, and different public cloud environments), where possible; (ii) it must be possible for any analytics functions to com-pare and correlate said metrics from multiple deployment environments across a single service’s delivery chain. That is to say, data from various tools silos should be accessible to the analytics functions through a push or pull method for collection in a central repository (e.g., a data lake).

- Furthermore, the analytics functions must be able to perform meaningful correlation across the entire data set available for all infrastructure and application components in the scope of a problem and indicate likely root-cause(s).
Use case:
Problems that are detected proactively can often be mitigated before their impact is too far reaching. By contrast, if a problem is only identified reactively, it may have grown considerably in the time taken for it to be reported – this is even more likely if a service is only degraded and has not completely failed.
Requirements:
- Metric generation functions must be able to generate data 24/7.
- It is advantageous for the Analytic functions to proactively detect outages, violations of SLAs, and deviations from baselines.
Application Service Delivery Management (SDM)
Use case:
Monitoring in the context of an Application Dependency Map - Modern applications are often comprised of several tiers or a large number of micro-services; they also have dependencies on enabling services such as Domain Name Service (DNS) and Active Directory, other services, and applications. New dependencies will often be introduced as new features are added to an application. Moreover, the load and scale of each application component will be rapidly changing as loads change and application components are scaled either manually or using elasticity features of the cloud. Gaining visibility into application composition and its dependencies is an essential part of successfully managing complex applications, yet many organizations fail to achieve the required visibility due to the lack of up-to-date and detailed architectural maps and proper tools coverage.
Requirements:
- Analytic functions must allow correlation of performance and outage data in the context of an application dependency map.
- Analytic functions must be able to detect and report changes in the dependencies between application components, enabling services, and external services.
- When services or applications are split across different environments then (i) the same metrics (e.g., server CPU, memory, NIC, and Storage utilization) must be available from all deployment environments (e.g., legacy physical servers, virtualized compute, private cloud, and different public cloud environments), where possible; (ii) it must be possible for any analytics functions to compare said metrics from multiple deployment environments. That is to say, data from various tools silos should be accessible to the analytics functions through a push or pull method for collection in a central repository (e.g., a data lake).
Cloud Migration and Hybrid Deployment
Use case:
i) Moving a service or application currently hosted on physical or virtualized servers to a private or public cloud; (ii) Moving an application from one cloud environment to another; (iii) Moving part of an application to a cloud environment. In order to complete the migration successfully, one must be able to:
A. As a prerequisite step to any migration, one must understand the dependencies of the applications to be migrated (e.g., internal dependencies between tiers or micro-services; dependencies on enabling services such as DNS, authentication, certificate management; dependencies on external services such as web services, queues, etc.).
This answers the question of what is there today, which, in part, serves as input for planning security policies in the zero trust target network environment.
B. Baseline the performance of the application in its current location usage over time, including application metrics (e.g., response time, and network metrics and bandwidth). Performance baselining should be performed on both the internal and external interfaces of the application and on external services on which the application depends.
C. Measure the performance of the service or application during its pilot deployment in the new environment and compare the performance with the baselines obtained from its original location.
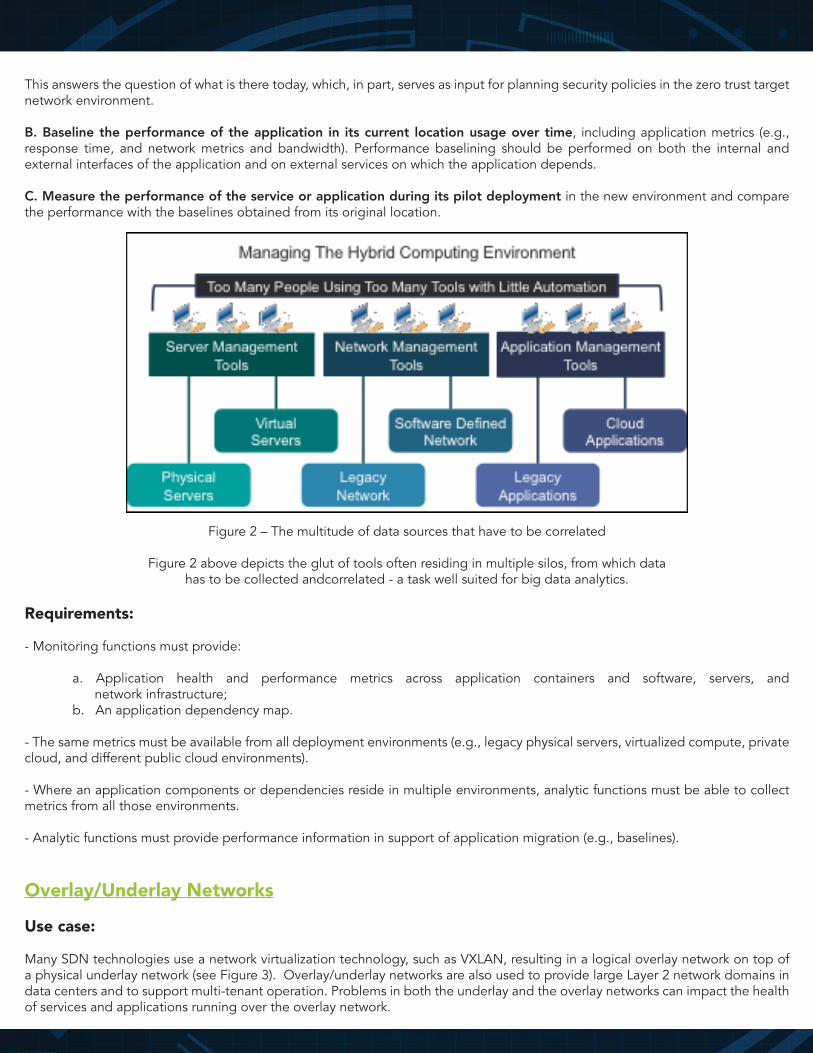
Figure 2 – The multitude of data sources that have to be correlated
Figure 2 above depicts the glut of tools often residing in multiple silos, from which datahas to be collected andcorrelated - a task well suited for big data analytics.
Requirements:
- Monitoring functions must provide:
a. Application health and performance metrics across application containers and software, servers, and network infrastructure; b. An application dependency map.
- The same metrics must be available from all deployment environments (e.g., legacy physical servers, virtualized compute, private cloud, and different public cloud environments).
- Where an application components or dependencies reside in multiple environments, analytic functions must be able to collect metrics from all those environments.
- Analytic functions must provide performance information in support of application migration (e.g., baselines).
Overlay/Underlay Networks
Use case:
Many SDN technologies use a network virtualization technology, such as VXLAN, resulting in a logical overlay network on top of a physical underlay network (see Figure 3). Overlay/underlay networks are also used to provide large Layer 2 network domains in data centers and to support multi-tenant operation. Problems in both the underlay and the overlay networks can impact the health of services and applications running over the overlay network.

Requirements:
- Monitoring functions must provide service and application performance information (e.g., response times), must be able to identify data with respect to both the overlay network (e.g., 5-tuple, VNI/VSID, virtual port, etc.) and the underlay network (e.g., 5-tuple, VLAN, port, node, etc.);
- Analytics functions must be able to analyze metrics in terms of both the overlay and underlay network.
Figure 3 - Overlay vs. Underlay Networks
Capacity Planning
Use case:
IT capacity planning and line of business (LOB) application teams have to regularly perform capacity planning. IT capacity planning functions typically have a yearly review but evaluations can be triggered by either moves, adds, and changes as a result of business activity or triggered by data from monitoring and analytics functions (e.g., problem management determining the root-cause of poor performance as the lack of capacity across some components of service delivery chain).
Application capacity planning, aside from the initial roles, tends to be driven by performance data (i.e., when performance become unacceptable). Today’s typical application deployed in a large enterprise has anywhere from two to a dozen releases per year. The pace of releases at web scale companies could be as frequent as weekly. While application teams focus on architecting the application in these subsequent releases, sometimes the thorough capacity planning across the entire service delivery chain for that application is neglected because the visibility into the entire service delivery chain and dependencies for an application is difficult with most legacy management platforms. This, in turn, could result in suboptimal performance.
Requirements:
- Monitoring functions must provide infrastructure and application performance metrics, both in real time for performance verification and across long enough historical time spans (i.e., at least 13 months for viable comparisons) for capacity planning activity.
- Analytic functions must provide a flexible reporting interface capable of reporting context applicable to silo, service, or application instances.

Also, repeated from “Migration and Hybrid Deployment” section:
- Monitoring functions must provide application performance and dependency information.
- The same metrics must be available from all deployment environments (e.g., legacy physical servers, virtualized compute, private cloud, and different public cloud environments).
- Analytic functions must be able to collect metrics from multiple deployment environments.
- Analytic functions must provide performance information in support of application migration (e.g., baselines).
Business Requirements
Use case:
Operations, LOB service delivery, and capacity teams have to contend with an increasing number of tools to address monitoring and management of virtualization and public cloud technologies on top of their legacy infrastructure. Budget constraints and industry-wide talent shortage for public cloud, SDN, and DevOps skill sets are business realities.
Nonetheless, IT operations will eventually be responsible for monitoring and supporting all these newer technologies even if brought in by the LOB at first. Hence, IT operations is often faced with a double burden of having to spend more on Capex (more tools) and Opex (more staff and more training for each staff member), while playing a catch-up game. Consequently, in the near term, Operations’ responsiveness may adversely be impacted. The proliferation tools will cause an increase in the MTTR because many more tools and data sources have to be learned, manually mapped across a single application or service context, and visually normalized and correlated. Adopting ONUG M&A requirements in planning an end-to-end monitoring strategy could minimize this impact.
Requirements:
- The same metrics must be available from all deployment environments (e.g., legacy physical servers, virtualized compute, private cloud, and different public cloud environments).
- Analytics functions must provide similar, if not identical, workflows when operating on data from legacy physical servers, virtual-ized compute, private cloud, and different public cloud environments.
- Analytics functions must be able to map a hybrid application spanning legacy physical servers, virtualized compute, private cloud, and different public cloud in a single application map.
- IT operations teams should design monitoring architectures with the goal of minimizing the number of tools, while keeping efficacy of data sources and effectiveness of each tool across legacy physical servers, virtualized compute, private cloud, and different public cloud.
- Analytics functions must be able to provide service- and application-centric health and reporting dashboards, with role-based security to enable transparency in state of health reporting for IT staff, LOB management, and CIO teams.
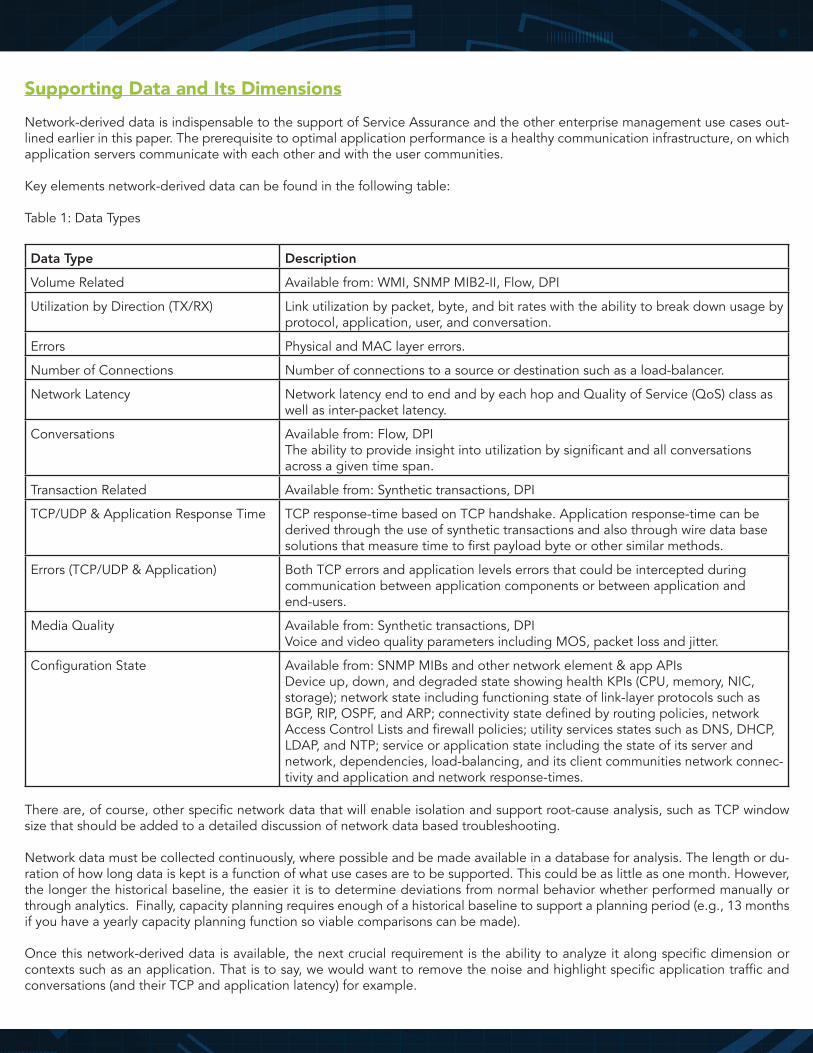
Supporting Data and Its DimensionsNetwork-derived data is indispensable to the support of Service Assurance and the other enterprise management use cases out-lined earlier in this paper. The prerequisite to optimal application performance is a healthy communication infrastructure, on which application servers communicate with each other and with the user communities.
Key elements network-derived data can be found in the following table:
Table 1: Data Types
Data Type Description
Volume Related Available from: WMI, SNMP MIB2-II, Flow, DPI
Utilization by Direction (TX/RX) Link utilization by packet, byte, and bit rates with the ability to break down usage by protocol, application, user, and conversation.
Errors Physical and MAC layer errors.
Number of Connections Number of connections to a source or destination such as a load-balancer.
Network Latency Network latency end to end and by each hop and Quality of Service (QoS) class as well as inter-packet latency.
Conversations Available from: Flow, DPIThe ability to provide insight into utilization by significant and all conversations across a given time span.
Transaction Related Available from: Synthetic transactions, DPI
TCP/UDP & Application Response Time TCP response-time based on TCP handshake. Application response-time can be derived through the use of synthetic transactions and also through wire data base solutions that measure time to first payload byte or other similar methods.
Errors (TCP/UDP & Application) Both TCP errors and application levels errors that could be intercepted during communication between application components or between application and end-users.
Media Quality Available from: Synthetic transactions, DPI Voice and video quality parameters including MOS, packet loss and jitter.
Configuration State Available from: SNMP MIBs and other network element & app APIs Device up, down, and degraded state showing health KPIs (CPU, memory, NIC, storage); network state including functioning state of link-layer protocols such as BGP, RIP, OSPF, and ARP; connectivity state defined by routing policies, network Access Control Lists and firewall policies; utility services states such as DNS, DHCP, LDAP, and NTP; service or application state including the state of its server and network, dependencies, load-balancing, and its client communities network connec-tivity and application and network response-times.
There are, of course, other specific network data that will enable isolation and support root-cause analysis, such as TCP window size that should be added to a detailed discussion of network data based troubleshooting.
Network data must be collected continuously, where possible and be made available in a database for analysis. The length or du-ration of how long data is kept is a function of what use cases are to be supported. This could be as little as one month. However, the longer the historical baseline, the easier it is to determine deviations from normal behavior whether performed manually or through analytics. Finally, capacity planning requires enough of a historical baseline to support a planning period (e.g., 13 months if you have a yearly capacity planning function so viable comparisons can be made).
Once this network-derived data is available, the next crucial requirement is the ability to analyze it along specific dimension or contexts such as an application. That is to say, we would want to remove the noise and highlight specific application traffic and conversations (and their TCP and application latency) for example.

The key network data dimensions and source are listed in Table 2 below:
Table 2: Data Dimensions
Data Dimension for Reporting and Investigation Description
Time Typically a timestamp
Service or Application Grouping of servers and associated protocols that belong to an application
Server/Container/Micro service IP or hostname or MAC address
Client/Groups or Communities of Client Client IP or IP ranges
Network Segment E.g., switch or router location or tapped link (physical location)
VRF Route Identifier, VXLAN VNI, VLAN Logical circuits/networks
DCSP QoS level
Data Collection MechanismsIn general, data sources fall into one of two categories: push and pull.
Push mechanisms deliver information in the form of a data stream. Publish/subscribe data busses, such as Kafka, are an increasingly common way of streaming data and have the benefit that multiple recipients can read the same data set. Moreover, if the data is divided into subsets, or topics, consumers can be selective about which data they receive.
Pull mechanisms include polling mechanisms and REST APIs. In this model, the recipient can often specify which data they wish to receive.
SNMP, WMI and REST APIs are examples of pull data mechanisms that are polled. By contrast, flow and syslog data are typically streamed. Metadata derived from deep packet inspection can be streamed via a publish/subscribe data bus or polled via a REST or other data mining API.
Most of these data sources are structured. However, some streaming data sources, notably syslog, may be unstructured and re-quire additional parsing and/or normalization, either at collection time or at analysis time.
Analytics of DataWe have already touched on the length, for which data should be kept. It is generally a function of the use cases supported. Again, capacity planning may require 13 months or longer as one extreme example. Resolution or granularity of data is another consideration. This is a function of the use cases supported. Real-time troubleshooting as a sub-function of Service Assurance or Application Service Delivery requires high resolution. This could be in microseconds, when it comes to inter-packet timing and microbursts that happen on the wire. As use cases take a broader scope of time, such as management reporting or capacity planning, so does the data. That is to say that the function can be performed with less granular data such as five-minute and hourly granularity, respectively, for the examples given.
Since storage and compute resources have a cost, the ability to roll up the very granular network data into efficient summary or metadata will reduce both the storage and compute needs for analysis of data.
Analytic functions employed to examine network data should, at a minimum, enable the following functions:
- Alerts and events based on deviation from baseline;
- Application discovery and dependency mapping;
- Network path discovery.

ONUG Monitoring & Analytics Initiative Members
Aryo Kresnadi, FedEx - Co-Chair Neal Secher, BNY Mellon - Co-Chair Ted Turner, Intuit - Co-Chair Paul Barrett, NetScout - Co-Chair Nabil Bitar, Nuage Networks - Co-Chair
Karlo Zatylny, SolarWinds Stephen Collins, ACG Research Tavarez Dudley, Advocate Insiders Venkatarao Mokkapati, American Express Yan Filyurin, Bloomberg Rosemary Wang, BNY Mellon Vesko Pehlivanov, Credit Suisse Yong Xue, DISA Jamie Jacobs, eBay Regis Rogers, General Electric Snehal Patel, Gap Michael Wynston, First Data Scott Bradner, Independent Jem Pagan, JNK Securities Arup Chakravarty, MetLife Niranjan Nandakumar, Susquehanna International Group, LLP Brian Anderson, Tegna Yufeng Xin, UNC at Chapel Hill Victor Liu, Vista Kaya Westling, Wells Fargo Manoj Kale, Cisco Manish Kumar, Cisco Aaron Linn, Cisco Nagendra Kumar Nainar, Cisco Tina Zhang, Cisco Dave Ward, Cisco Jesse Brower, cPacket Networks Vittal Krishnamurthy, cPacket Networks Josh Joiner, cPacket Networks Nikhil Handigol, Forward Networks Don Fedyk, Hewlett Packard Enterprise Peter Mellquist, Hewlett Packard Enterprise Ahmad Zamer, Hewlett Packard Enterprise Linda Dunbar, Huawei Yang Yang, Huawei George Zhao, Huawei Huiyang Yang, Huawei Babak Roushanaee, Netscout Paul Barrett, Netscout Kirk O’Connor, Netscout Senad Palislamovic, Nuage Jonathan Cornell, Pluribus Pierre-Louis Gingembre, Pluribus Sunay Tripathi, Pluribus Steven Shalita, Pluribus Lee Calcote, SolarWinds Gopi Gopalakrishnan, ThousandEyes Yefim Pipko, ThousandEyes Sanjay Mehta, ThousandEyes Dogu Narin, Versa Sandeep Najaj, Viptela