Functional Non-Coding DNA Part I Non-coding genes and non-coding elements of coding genes

An Introduction to Coding in R
Ed Hall and Jackie Huband 1
1University of Virginia Alliance for Computational Science and [email protected]
August 29, 2012
(UVACSE ) August 29, 2012 1 / 99

Outline
1 Getting Started with R
2 Vectors
3 Matrices and Arrays
4 Lists and Data Frames
5 Factors and Tables
6 R Programming Structures
7 Input/Output
8 Graphics
9 Debugging R Code
(UVACSE ) August 29, 2012 2 / 99

Getting Started with R
Why Use R
R is the public-domain implementation of the widely regarded Sstatistical language and is a defacto standard among professionalstatisticians.It is available for the Windows, Mac, and Linux operating systems.R is a general-purpose programming language that can be usedto automate analyses and create new functions that extend theexisting language features.It incorporates features found in object-oriented and functionalprogramming languages.The system saves data sets between sessions, so you don’t needto reload them each time. It saves your command history too.Because R is open source software, its easy to get help from theuser community, many whom are prominent statisticians.
(UVACSE ) August 29, 2012 3 / 99

Getting Started with R
Where to Access R
Since R is open source, it can be downloaded for free from one of themany mirror sites of the Comprehensive R Archive Network (CRAN)www.r-project.org/
R is also available in the ITS computerized classrooms (specificallyMEC 213) and in UVA Library computer labs, in the Statistical/R folderunder All Programs.
Finally, R is available on the UVa Hive, described atits.virginia.edu/hive/.
This last option involves downloading and installing a thin client onyour computer to connect to the Hive.
Once connected to the Hive, its available in the Statistical/R2.15 folderunder All Programs.
(UVACSE ) August 29, 2012 4 / 99

Getting Started with R
Rstudio
RStudio is a free and open source integrated developmentenvironment (IDE) for R.
Its available for Windows, Mac, or Linux, and can be downloaded fromthe following link:
rstudio.org
RStudio provides powerful productivity tools for developing programsin R.
Syntax highlighting, code completion, and smart indentationExecute R code directly from the source editorEasily manage multiple working directories using projectsQuickly navigate code using typeahead search and go to definition
(UVACSE ) August 29, 2012 5 / 99

Getting Started with R
Using R as a Calculator
From inside the R console window
(UVACSE ) August 29, 2012 6 / 99

Getting Started with R
Using R as a Calculator
From inside the R console window
(UVACSE ) August 29, 2012 7 / 99

Getting Started with R
Using R as a Calculator
(UVACSE ) August 29, 2012 8 / 99

Getting Started with R
Running R Commands from a Script File
A text file histogram1.R containing the following R commands
Running the file of R commands
(UVACSE ) August 29, 2012 9 / 99

Getting Started with R
Running R Commands from a Script File
The saved pdf file of the histogram
Histogram of rnorm(100)
rnorm(100)
Fre
quen
cy
−3 −2 −1 0 1 2 3
05
1015
20
(UVACSE ) August 29, 2012 10 / 99

Getting Started with R
Running R Commands from a Script File
A R script file can be run the following ways:
From the R console using the source() function.From the RStudio editor using the Run button.From the RStudio editor by selecting the commands and using theRun button.
The last method is especially useful for evaluating parts of the script.
A script file can be used as a scratchpad of R commands, selecting theones you want to run so they don’t have to be retyped in the consolewindow.
This allows for a more efficient workflow in developing and testingMatlab programs.
(UVACSE ) August 29, 2012 11 / 99

Getting Started with R
Things to Remember About R Syntax
R is case-sensitiveFunctions in R use the following syntaxfunction_name( argument1, argument2, ... )
A semicolon ; separates expressionsThe <- and = are both assignment operators.the # sign indicates a comment.Single quotes ’abc’ enclose a literal character stringThe + prompt means R is waiting for input
(UVACSE ) August 29, 2012 12 / 99

Getting Started with R
The R Workspace
The objects created in an R session remain in the workspace until youexplicitly delete them or the session ends.
To list all the currently defined object in the workspace, use the ls()function.
To remove an object x, use rm(x). To remove all the currently definedobjects (i.e. clear the workspace), use rm(list = ls()).
To determine if an object x exists in the workspace, use exists(x).
To save all your existing objects to a file called fname in the currentworking directory, use save.image(file = "fname").
To save specific objects (say x and y), use save(x, y, file ="fname")
To load a set of saved objects, use load(file = "fname").
(UVACSE ) August 29, 2012 13 / 99

Getting Started with R
Getting Help with R
To get help on a specific function or data set, simply precede its namewith a ?:> ?hist()
If you don’t know the exact name of the function, you can give part ofthe name (in quotes) and R will show all the functions that match:>apropos(’hist’)
You can also do a broader search using ?? or help.search(), whichwill find matches not only in the names of functions and data sets, butalso in their documentation:>??histogram>help.search(’histogram’)
(UVACSE ) August 29, 2012 14 / 99

Getting Started with R
Getting Help with R
Many functions and data sets in R include example codedemonstrating typical uses.
The examples appear at the end of the function/data setdocumentation and can be accessed with the example command:> example(’hist’)
Demos are bits of R code that an be executed using the demo()command with the name of the demo.
You can get a list of the available demos using> demo()> demo(package=’graphics’)
(UVACSE ) August 29, 2012 15 / 99

Getting Started with R
R Packages
One of the major strengths of R is that thousands of user-writtenpackages are available on the Comprehensive R Archive Network(CRAN).
A package is a library of R functions designed for a specificproblemSome packages are loaded automatically when you start R, butnot all installed packages are loaded to save memory and time.You can see which packages are loaded with the functionsessionInfo().The function to find out what packages are available for loading isinstall.packages().To see what function are available in a package, say mvtnorm,use library(help=mvtnorm).To load a package, say MASS, use library(MASS).
(UVACSE ) August 29, 2012 16 / 99
Vectors
Vector Variables
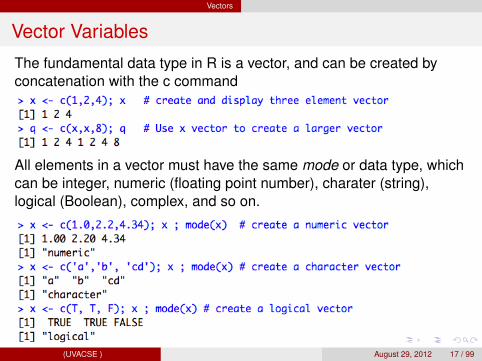
The fundamental data type in R is a vector, and can be created byconcatenation with the c command
All elements in a vector must have the same mode or data type, whichcan be integer, numeric (floating point number), charater (string),logical (Boolean), complex, and so on.
(UVACSE ) August 29, 2012 17 / 99

Vectors
Vector Indexing
Individual elements of a vector are accessed via [ ].
The number 2 is the index or subscript of the vector. You can use avector of subscripts to generate a subset of a vector.
(UVACSE ) August 29, 2012 18 / 99

Vectors
Vector Indexing
Adding and deleting vector elements
Generating a vector with the : operator, and obtaining the length of avector with the length function.
(UVACSE ) August 29, 2012 19 / 99

Vectors
Generating Vector Sequences
A generalization of the : operator is the seq() (or sequence) function,which generates a sequence in arithmetic progression.
The rep() (or repeat) function allows one to conveniently put thesame constant into long vectors. The call form is rep(x,times).
There is also a named argument each, which interleaves copies of x.
(UVACSE ) August 29, 2012 20 / 99

Vectors
Vector Operations
In R, arithmetic operators applied to vectors are performedelement-wise.
(UVACSE ) August 29, 2012 21 / 99

Vectors
Vector Operations
Comparison operators (<,>,<=, >=,==) applied to vectors generatevectors of Boolean values. Logical operators & (and), | (or), and ! (not)can then be applied to logical vectors.
(UVACSE ) August 29, 2012 22 / 99

Vectors
Vector Operations
If you want to determine the index positions of the TRUE elements of alogical vector x, then use which(x).
(UVACSE ) August 29, 2012 23 / 99

Vectors
Vector Operations
R also provides the subset() function for choosing a subvector of x.
The difference between using logical indexing to using the subset()function is how they handle NA values. The subset() function willignore missing values.
(UVACSE ) August 29, 2012 24 / 99

Vectors
Vectorized Functions
The numeric, comparison, and logical operations previously discussedare examples of vectorized functions in that they take vector inputs andproduce vector outputs.
Using vectorized functions is more efficient computationally and makesthe R code more readable. Other examples of vectorized functions are,
(UVACSE ) August 29, 2012 25 / 99

Vectors
NA and NULL Values
In statistiscal data sets, R represents missing data with the value NA.
NULL, on the other hand, represents that the value in question doesnot exist, rather than being existent but unknown.
(UVACSE ) August 29, 2012 26 / 99

Vectors
Vector Elements Names
The elements of a vector can optionally be given names. For example,given a 50-element vector of state populations, we could name eachelement with the appropriate state with the names() function.
(UVACSE ) August 29, 2012 27 / 99

Matrices and Arrays
Matrices and Arrays
A matrix is a vector with two additional attributes: the number of rowsand the number of columns, making it a two-dimensional object
Like vectors, matrices also have modes such as numeric, character,logical, etc.
Matrices are special cases of a more general R type of object calledarrays.
Arrays can be multidimensional. For example, a three-dimensionalarray consists of rows, columns, and layers.
Much of R’s power and utility comes from various operations you canperform on matrices.
(UVACSE ) August 29, 2012 28 / 99

Matrices and Arrays
Creating Matrices
Matrix row and column subscripts begin with 1, with the upper-leftcorner element of the matrix indexed as [1,1]. The internal storage ofthe matrix is as a vector in column-major order.
(UVACSE ) August 29, 2012 29 / 99

Matrices and Arrays
General Matrix Operations
You can perform various linear algebra operations on matrices, such asmatrix multiplication, matrix scalar multiplication, and matrix addition.
(UVACSE ) August 29, 2012 30 / 99

Matrices and Arrays
Matrix Indexing
The same indexing operations we discussed for vectors apply tomatrices as well.
(UVACSE ) August 29, 2012 31 / 99

Matrices and Arrays
Matrix Indexing
You can assign values to submatrices
(UVACSE ) August 29, 2012 32 / 99

Matrices and Arrays
Matrix Indexing
This is another example of assigning values to submatrices by firstallocating the memory for a matrix.
(UVACSE ) August 29, 2012 33 / 99

Matrices and Arrays
Matrix Indexing
You can logical expressions to index matrices
(UVACSE ) August 29, 2012 34 / 99

Matrices and Arrays
Using the apply() Function
The apply() function instructs R to call a user-specified function oneach of the rows or each of the columns of a matrix.
(UVACSE ) August 29, 2012 35 / 99

Matrices and Arrays
Adding or Deleting Rows/Columns of a Matrix
You can delete rows or columns of a matrix by reassignment.
(UVACSE ) August 29, 2012 36 / 99

Matrices and Arrays
Adding or Deleting Rows/Columns of a Matrix
You can change the size of a matrix by adding a row with rbind()(row bind) or by adding a column with cbind() (column bind).
(UVACSE ) August 29, 2012 37 / 99

Matrices and Arrays
Dimensions of a Matrix
Since a matrix is a vector with row and column attributes, there arefunctions in R to determine the values for these attributes. Thesefunctions are useful for writing R code that can programmaticallydetermine the size of the matrix.
(UVACSE ) August 29, 2012 38 / 99

Matrices and Arrays
Dimensions of a Matrix
If you have a vector that you want to be treated as a matrix, you canuse the as.matrix() as follows:
(UVACSE ) August 29, 2012 39 / 99

Matrices and Arrays
Naming Matrix Rows and Columns
The natural way to refer to rows and columns in a matrix is via the rowand column numbers. However, you can also give names to theseentities with the rownames() and colnames() functions.
(UVACSE ) August 29, 2012 40 / 99

Matrices and Arrays
Higher-Dimensional Arrays
Matrices can be combined in R to create a three-dimensional datastructure using the array() function. Each matrix then forms a layerof the new array.
(UVACSE ) August 29, 2012 41 / 99

Lists and Data Frames
Lists
In contrast to a vector, in which all elements must be of the samemode, R’s list structure can combine objects of different types.
For example, a list of employee information might contain threedifferent modes of data: character, numeric, and logical.
(UVACSE ) August 29, 2012 42 / 99

Lists and Data Frames
Lists
An alternative to using component names is to use numeric indexingas in vectors and matrices, though the use of tags is considered amore informative representation.
(UVACSE ) August 29, 2012 43 / 99

Lists and Data Frames
List Indexing
There are three ways to access a component of a list and return it asthe same data type as the original component.
An alternative to the second and third techniques is to use singlebrackets rather than double brackets. The returned value will again bea list, and can be used to create a subset of the original list.
(UVACSE ) August 29, 2012 44 / 99

Lists and Data Frames
Adding and Deleting List Elements
New components can be added to an existing list.
(UVACSE ) August 29, 2012 45 / 99

Lists and Data Frames
Adding and Deleting List Elements
You can delete a list component by setting it to NULL.
(UVACSE ) August 29, 2012 46 / 99

Lists and Data Frames
Applying Functions to Lists
The function lapply() (for list apply) works like the matrix apply()function, callin the specified function on each component of a list andreturning another list.
The function sapply() (simplified apply) returns a vector instead of alist.
(UVACSE ) August 29, 2012 47 / 99

Lists and Data Frames
Data Frames
A data frame is like a matrix, with a two-dimensionalrows-and-columns structure.
A data frame differs from a matrix in that each column may have adifferent mode.
Just as lists are heterogeneous analogs of vectors in one dimension,data frames are heterogeneous analogs of matrices fortwo-dimensional data.
On a technical level, a data frame is a list, with the components of thatlist being equal length vectors.
(UVACSE ) August 29, 2012 48 / 99

Lists and Data Frames
Creating Data Frames
A data frame can be created with the data.frame() function.
This creates a data frame of two vectors: kids and ages.
The last argument prevents R from converting the character vectorkids to a factor (to be discussed later).
(UVACSE ) August 29, 2012 49 / 99

Lists and Data Frames
Accessing Data Frames
Since the data frame d is a list, we can access it using componentindex values or component names.
Since the data frame is like a matrix, the last method of accessing thefirst column is clearest and most useful from a programmatic viewpoint.
Other methods previously discussed for accessing components ofmatrices (e.g.logical indexing) apply to data frames as well.
(UVACSE ) August 29, 2012 50 / 99

Lists and Data Frames
Accessing Data Frames
The str() function shows the internal structure of any R object,including lists and data frames.
This shows that the data frame d consists of three observations (thethree rows) that store data on two variables (the two columns).
(UVACSE ) August 29, 2012 51 / 99

Factors and Tables
Factors
R stores categorical variables (variables which take values from a finiteset) in a data type called a factor.
A factor is can be viewed as a vector, but with added informationconsisting of a record of the distinct values in the vector, called levels.
(UVACSE ) August 29, 2012 52 / 99

Factors and Tables
Factors
The number of levels can be specified as an additional argument in thefactor() command to account for levels not contained in the vector.
(UVACSE ) August 29, 2012 53 / 99

Factors and Tables
Tables
A contingency table displays the number of times each level of a factorappears.
The table() function creates a contingency table from a factor.
The table() function can be applied to other modes of vectors aswell as factors.
(UVACSE ) August 29, 2012 54 / 99

R Programming Structures
Branching with if-else
It is often useful to execute a block of code based on some conditionbeing met, as determined by a logical expression.
The if() function is used to perform conditional code evaluation.
The else portion of the if() function allows for an alternative code blockto be evaluated, and is optional.
The switch function allows for multiple branches.(UVACSE ) August 29, 2012 55 / 99

R Programming Structures
Vector-basedifelse()
The ifelse() function is a vectorized version of the if() function.
Using vector operations is more efficient computationally and moreconcise literally.
(UVACSE ) August 29, 2012 56 / 99

R Programming Structures
Loops
There are two main programming constructs for repeating a block ofcode statements some number of times. The for() loop and thewhile() loop.
The number of times a for() loop repeats the code block is definedexplicitly or based on the number of elements in a vector.
The number of times a while() loop repeats a code block is basedon whether a logical expression evaluates to TRUE when it is tested atthe beginning of each iteration of the loop.
The number of loop iterations being executed can be altered by theuse of the commands next (skip to the next iteration) or break (stopiterations and leave loop) as the result of an if() function evaluationin the body of the loop.
(UVACSE ) August 29, 2012 57 / 99

R Programming Structures
for() Loops
The following example explicitly defines the sequence over which thefor() loop is to iterate in the header part of the loop.
(UVACSE ) August 29, 2012 58 / 99

R Programming Structures
for() Loops
This example of a for() loop indexes acrose the elements of apredefined vector.
(UVACSE ) August 29, 2012 59 / 99

R Programming Structures
Loops: Array Preallocation
(UVACSE ) August 29, 2012 60 / 99

R Programming Structures
while() Loops
The while() loop is used when we want to repeat a block of code untilsome condition is met (defined by a logical expression), but we don’tknow how many iterations that will take.
(UVACSE ) August 29, 2012 61 / 99

R Programming Structures
Functions
Functions are the main building blocks of large programs.
A function is a group of instructions that takes inputs, uses them tocompute other values, and returns a results as outputs.
Consider the following function oddcount() witten to the file sourcecode file oddcount.R:
(UVACSE ) August 29, 2012 62 / 99

R Programming Structures
Functions
To call the function oddcount(), you have to first load it into thecurrent R session.
The function can now be executed from the R console command line:
(UVACSE ) August 29, 2012 63 / 99

R Programming Structures
Functions: Variable Scope
A variable that is visible only within a function is said to be local to thatfunction. In oddcount(), k and n are local variables.
The local variables disappear when the function returns its output.
(UVACSE ) August 29, 2012 64 / 99

R Programming Structures
Functions: Variable Scope
Variables created outside the function are global and are availablewithin the function even if not passed as an input argument.
But local variables do not affect global variables unless you use thesuperassignment operator, «- (not recommended).
(UVACSE ) August 29, 2012 65 / 99

R Programming Structures
Functions: Optional and Default Arguments
R function input arguments can be initialized to default values in thefunction definition.
When calling the function, the arguments with default values areoptional, and you can specify which arguments use the default values.
(UVACSE ) August 29, 2012 66 / 99

R Programming Structures
Functions: Multiple Outputs
If a function has multiple variables as output, they can be gatheredtogether as a list and the function can return the list.
(UVACSE ) August 29, 2012 67 / 99

Input/Output
Accessing the Keyboard and Monitor
R provides several functions for accessing the keyboard and monitor.We’ll look at the scan(), readline(), print(), and cat()functions.
(UVACSE ) August 29, 2012 68 / 99

Input/Output
Using the scan() Function
You can use scan() to read in a vector, whether numeric of character,from a file or the keyboard.
Suppose the two text files below contained the following lines:
z2.txt: z3.txt:
123 abc4.2 5 de f6 g
These files can be read into R as follows:
(UVACSE ) August 29, 2012 69 / 99

Input/Output
Using the scan() Function
By default, the scan() assumes the items in the vector are separatedby whitespace. You can use the optional sep argument for othersituations.
You can use scan() to read in from the keyboard by specifying anempty string for the filename.
(UVACSE ) August 29, 2012 70 / 99

Input/Output
Using the readline() Function
The readline() function will read a single line from the keyboard ascharacter data, with an optional prompt.
The output of readline() can be coerced to be numeric.
(UVACSE ) August 29, 2012 71 / 99

Input/Output
Printing to the Screen
At the top level of interactive mode, you can print the value of avariable or expression simply by typing the variable or expression.
But this won’t work in the body of a function. In this case, you can usethe print() function.
The print() function can only print one expression and its output isnumbered, but the cat() function can output multiple expressions onthe same line.
(UVACSE ) August 29, 2012 72 / 99

Input/Output
Reading from a File
In addition to scan(), R has the more general function read.table()for reading data from a file. Suppose the file z.txt looks like:name ageJohn 25Mary 28Jim 19
The file contains an optional header, specifying column names. Wecan use read.table to read this file as a data frame.
(UVACSE ) August 29, 2012 73 / 99

Input/Output
Using the read.table() Function
If the file x.txt contains a 2-by-3 matrix, the output of read.table can becoerced to be a matrix.
Two common variants of read.table() are read.csv() forcomma-separated data and read.delim() for tab-delimited data.The former is equivalent to
and the latter is equivalent to
(UVACSE ) August 29, 2012 74 / 99

Input/Output
Writing to a File
The function write.table() works much like read.table()except it writes a data frame rather than reading one.
The file kds will now have the contents:
"kids" "ages""1" "Jack" 12"2" "Jill" 10
In the case of writing a matrix xc to a file named xcnew, state that youdo not want row or column names as follows:
(UVACSE ) August 29, 2012 75 / 99

Input/Output
Writing to a File
The function cat() can also be used to write to a file, one line at a time.
The file v now contains the lines:
1 2 3x yz
(UVACSE ) August 29, 2012 76 / 99

Graphics
The Plot Function
The plot() function forms the basis of much of R’s base graphingoperations.
A simple use of the plot() function is to graph an x vector and a yvector as a set of (x , y) coordinate pairs.
(UVACSE ) August 29, 2012 77 / 99

Graphics
The Plot Function
(UVACSE ) August 29, 2012 78 / 99

Graphics
The Plot Function
You can add axes labels, a title, and how you want the points displayedwith additional arguments in the plot() function.
(UVACSE ) August 29, 2012 79 / 99

Graphics
The Plot Function
(UVACSE ) August 29, 2012 80 / 99

Graphics
The Plot Function
In particular, the type argument allows multiple plotting options.
(UVACSE ) August 29, 2012 81 / 99
Graphics
The Plot Function
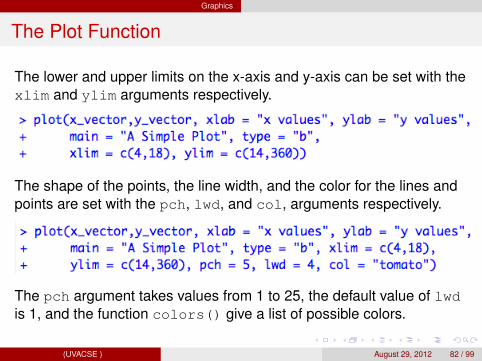
The lower and upper limits on the x-axis and y-axis can be set with thexlim and ylim arguments respectively.
The shape of the points, the line width, and the color for the lines andpoints are set with the pch, lwd, and col, arguments respectively.
The pch argument takes values from 1 to 25, the default value of lwdis 1, and the function colors() give a list of possible colors.
(UVACSE ) August 29, 2012 82 / 99

Graphics
The Plot Function
(UVACSE ) August 29, 2012 83 / 99

Graphics
Starting a New Graph While Keeping the Old Ones
Each time you call plot(), directly or indirectly through anotherfunction, the current graph window will be replaced by a new one.
If you want a new graph in addition to the old one, use the followingcommand specific to your operating system:
On Linux systems, call x11().On a Mac, call quartz().On Windows, call windows().
If you want to view two histograms of the vectors x and y side by side,then on a Mac you would type,
(UVACSE ) August 29, 2012 84 / 99

Graphics
Adding Points, Lines, a Legend, and Text
To add the points (x[1], y[1]), (x[2],y[2]), . . . to the currentplot, use the function points(x,y).
To add lines to the current plot (e.g. create a multi-curve graph), uselines(x,y).
Both points() and lines() take the additional arguments pch,lwd, and col. To explore other graphical options, see help(par).
The legend() function adds a legend to a multi-curve graph. Seeexample(legend).
To add a text string at the point (x,y) in the current graph, usetext(x,y,"text string").
(UVACSE ) August 29, 2012 85 / 99

Graphics
Graphing Explicit Functions
Say you want to plot the function g(t) = (t2 + 1)0.5 for t between 0 and5. You can use the function curve():
where n=201 is the number of points to plot.
If the curve is to be added to an existing graph, use:
(UVACSE ) August 29, 2012 86 / 99

Graphics
Multiple Plots in One Window
You can create a grid of plots in a single graphics window using thecommand par(mfrow = c(nr, nc), where nr is the number ofrows and nc is the number of columns in the grid.
(UVACSE ) August 29, 2012 87 / 99

Graphics
Multiple Plots in One Window
(UVACSE ) August 29, 2012 88 / 99

Graphics
Saving Plots to Files
To create a graphic as a pdf file, we do the following:
All plotting done between the pdf() function and the dev.off()function will appear in the pdf file graphic.pdf saved in the currentworking directory.
Multiple plots will appear by default as separate pages in the saved pdfdocument, as follows:
(UVACSE ) August 29, 2012 89 / 99

Debugging R Code
Good Programming Style
Debugging start with good programming practices to minimize theoccurrence of bugs.
Write code to solve the simplest possible version of the problem, thenadd complexity as it becomes necessary.
Good programming is clear rather than clever. Clear programs areeasier to debug.
Reinforce the structure and readability of the code with blank lines toseparate sections of the code into related parts, and indentation todistinguish the code block inside if statements and for/while loops.
Use descriptive variable names to indicate what the value of thevariable represents.
Document your code well, with a description at the beginning of whatthe program does and explaining the inputs and output. Provideextensive commenting throughout the code.
(UVACSE ) August 29, 2012 90 / 99

Debugging R Code
Code Confirmation
When you program code does not perform as you would expect, thenthere must be an error (bug) in the code.
To find an error or bug, you need to see how your variables change asyou move through the branches and loops of your code.
Fixing an error in your program code is a process of confirming, one byone, that the many things you believe to be true about the code runsactually are true.
When you find that one of your assumptions is not true, you havefound a clue to the location (if not the exact nature) of a error so thatyou can correct it.
Construct test cases with simple starting conditions for which youknow what the answer should be.
(UVACSE ) August 29, 2012 91 / 99

Debugging R Code
Debug in a Modular, Top-Down Manner
Code should be written in a modular structure.
The top-level code file should be short, much of it consisting of functioncalls. Those functions should not be too lengthy, and call otherfunctions if necessary.
This makes the code easier to organize during the writing stage andeasier for others (as well as yourself) to understand when the code isto be extended.
You should debug in a top-down manner as well. Make sure that eachfunction call returns the value you expect. If not, examine the code inthe function itself.
(UVACSE ) August 29, 2012 92 / 99

Debugging R Code
Anti-bugging
You can adopt anti-bugging strategies as well to detect if a bug ispresent.
Suppose you have a section of code in which the variable x should bepositive. You could include the line,
If there is a bug earlier in the code which makes x negative, the call tostopifnot() will stop execution at that point in the code with the errormessage:
(UVACSE ) August 29, 2012 93 / 99

Debugging R Code
Use a Debugging Tool
As part of the code confirmation process, print statements can beinserted in the code to see what the values of variables are at thatpoint.
But this involves removing previous print statements and inserting newones as you try to track down the error.
This manual process is tedious for a long debugging session, and thecontinuous editing is distracts from concentrating on finding the bug.
Using a debugging tool makes it easier to query the values ofvariables, check whether the if of the else gets executed, andanalyze execution errors the bug might create.
(UVACSE ) August 29, 2012 94 / 99

Debugging R Code
Single Stepping Using the browser() Function
The core of R’s debugging facility consists of the browser() function.
It allows you to single-step through your code, line by line, examiningthe workspace (e.g. within a function) as you go.
When you place a call to browser() at some line within your code, thebrowser will be invoked when execution reaches that line.
You can then single-step through the lines following in your codefollowing the browser() call, examining how variables change at eachstep.
(UVACSE ) August 29, 2012 95 / 99

Debugging R Code
Using Browser Commands
While you are in the browser, the prompt changes from > toBrowse[d]> , where d is the depth of the function call chain. You maysubmit the following commands at that prompt.
n (for next): Execute the next line. Hitting Enter causes thisaction too.c (for continue): Causes the remainder of the lines of code in aloop or function to be executed before pausing again.Any R command: While in the browser, you are in R’s interactivemode and can query the value of a variable x by typing x.where: Prints a stack trace that displays the sequence of functioncalls that led execution to the current location.Q: Quits the browser.
(UVACSE ) August 29, 2012 96 / 99

Debugging R Code
Calling the browser() Conditionally
You can make the invoking of the browser conditional on encounteringa specific situation.
Suppose a bug occurs only when the value of a variable s is greaterthan 1. Then the following two lines have the same effect.
This is especially useful if you want the browser to be invoked when aloop variable has reached a specific value.
(UVACSE ) August 29, 2012 97 / 99

Debugging R Code
Ensure Consistency in Running Simulation Code
If you are doing anything with random numbers, you’ll need to be ableto reproduce the same stream of numbers each time you run yourprogram during the debugging process.
The set.seed() function controls this by reinitializing the randomnumber sequence to a given value.
(UVACSE ) August 29, 2012 98 / 99

Debugging R Code
References
The Art of R Programming: A Tour of Statistical Software Designby Norman Matloff
Introduction to Scientific Programming and Simulation Using Rby Owen Jones, Robert Maillardet, and Andrew Robinson.
(UVACSE ) August 29, 2012 99 / 99