An Introduction to Air Pollution – Definitions ... · An Introduction to Air Pollution –...
14
Daly, A. and P. Zannetti. 2007. An Introduction to Air Pollution – Definitions, Classifications, and History. Chapter 1 of AMBIENT AIR POLLUTION (P. Zannetti, D. Al-Ajmi, and S. Al-Rashied, Editors). Published by The Arab School for Science and Technology (ASST) (http://www.arabschool.org.sy ) and The EnviroComp Institute (http://www.envirocomp.org/ ). Chapter 1 An Introduction to Air Pollution – Definitions, Classifications, and History Aaron Daly and Paolo Zannetti The EnviroComp Institute, Fremont, CA (USA) [email protected] and [email protected] Abstract: Definitions and classifications used in the study of air pollution are introduced. Also introduced are a brief history of air pollution, its regulation, and trends of its ambient concentrations and emissions. Keywords: Anthropogenic, biogenic, geogenic emissions; primary and secondary pollutants; criteria, hazardous, radioactive, indoor pollutants; sulfur smog, photochemical smog; UN-ECE, US-EPA, Clean Air Act. 1 The Natural Environment and Some Definitions of Air Pollution The present-day atmosphere is quite different from the natural atmosphere that existed before the Industrial Revolution (circa 1760 1 ), in terms of chemical composition. If the natural atmosphere is considered to be “clean”, then this means that clean air cannot be found anywhere in today’s atmosphere. The chemical composition of the pre-industrial (i.e., before the 18 th century), natural global atmosphere is compared to current compositions in Table 1: 1 T.S. Ashton, The Industrial Revolution, 1760-1830, London: Oxford University Press, 1948. © 2007 The Arab School for Science and Technology (ASST) and The EnviroComp Institute 1
Transcript of An Introduction to Air Pollution – Definitions ... · An Introduction to Air Pollution –...

Daly, A. and P. Zannetti. 2007. An Introduction to Air Pollution – Definitions, Classifications, and History. Chapter 1 of AMBIENT AIR POLLUTION (P. Zannetti, D. Al-Ajmi, and S. Al-Rashied, Editors). Published by The Arab School for Science and Technology (ASST) (http://www.arabschool.org.sy) and The EnviroComp Institute (http://www.envirocomp.org/).
Chapter 1
An Introduction to Air Pollution – Definitions, Classifications, and History Aaron Daly and Paolo Zannetti The EnviroComp Institute, Fremont, CA (USA) [email protected] and [email protected] Abstract: Definitions and classifications used in the study of air pollution are introduced. Also introduced are a brief history of air pollution, its regulation, and trends of its ambient concentrations and emissions. Keywords: Anthropogenic, biogenic, geogenic emissions; primary and secondary pollutants; criteria, hazardous, radioactive, indoor pollutants; sulfur smog, photochemical smog; UN-ECE, US-EPA, Clean Air Act. 1 The Natural Environment and Some Definitions of Air
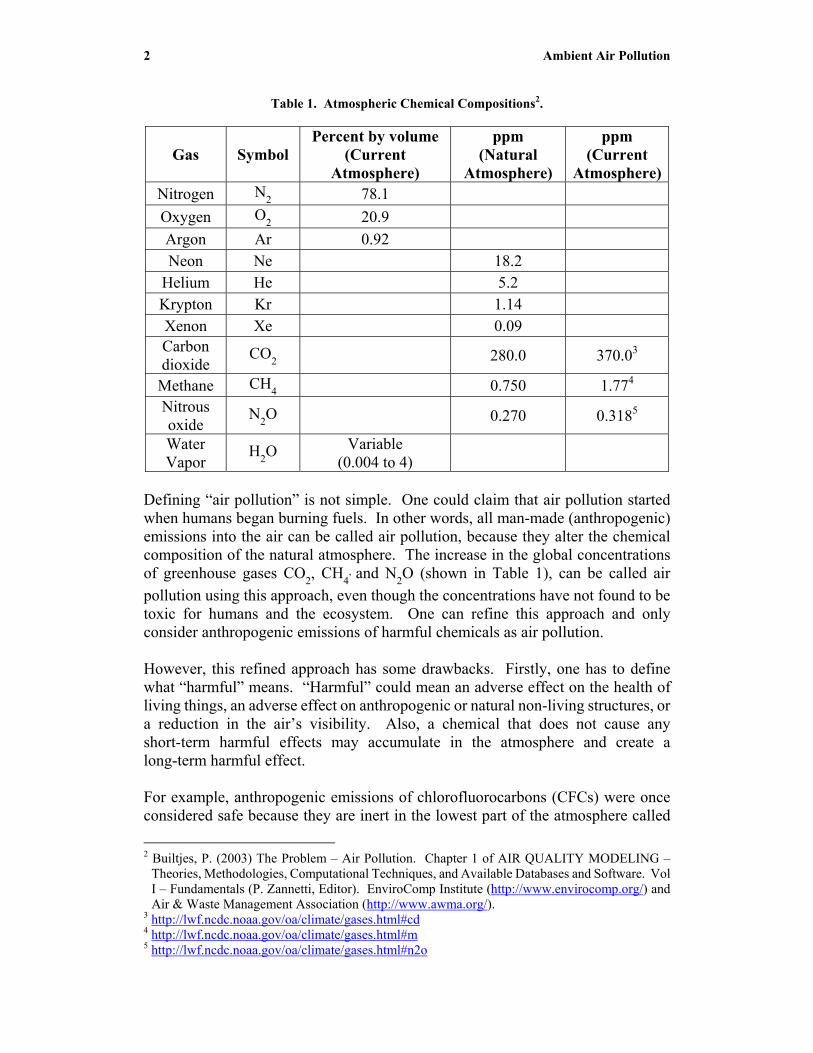
Pollution The present-day atmosphere is quite different from the natural atmosphere that existed before the Industrial Revolution (circa 1760 1 ), in terms of chemical composition. If the natural atmosphere is considered to be “clean”, then this means that clean air cannot be found anywhere in today’s atmosphere. The chemical composition of the pre-industrial (i.e., before the 18th century), natural global atmosphere is compared to current compositions in Table 1:
1 T.S. Ashton, The Industrial Revolution, 1760-1830, London: Oxford University Press, 1948.
© 2007 The Arab School for Science and Technology (ASST) and The EnviroComp Institute 1
2 Ambient Air Pollution
Table 1. Atmospheric Chemical Compositions2.
Gas Symbol Percent by volume
(Current Atmosphere)
ppm (Natural
Atmosphere)
ppm (Current
Atmosphere)Nitrogen N2 78.1 Oxygen O2 20.9 Argon Ar 0.92 Neon Ne 18.2
Helium He 5.2 Krypton Kr 1.14 Xenon Xe 0.09 Carbon dioxide
CO2 280.0 370.03
Methane CH4 0.750 1.774
Nitrous oxide
N2O 0.270 0.3185
Water Vapor
H2O Variable (0.004 to 4)
Defining “air pollution” is not simple. One could claim that air pollution started when humans began burning fuels. In other words, all man-made (anthropogenic) emissions into the air can be called air pollution, because they alter the chemical composition of the natural atmosphere. The increase in the global concentrations of greenhouse gases CO2, CH4
, and N2O (shown in Table 1), can be called air pollution using this approach, even though the concentrations have not found to be toxic for humans and the ecosystem. One can refine this approach and only consider anthropogenic emissions of harmful chemicals as air pollution. However, this refined approach has some drawbacks. Firstly, one has to define what “harmful” means. “Harmful” could mean an adverse effect on the health of living things, an adverse effect on anthropogenic or natural non-living structures, or a reduction in the air’s visibility. Also, a chemical that does not cause any short-term harmful effects may accumulate in the atmosphere and create a long-term harmful effect. For example, anthropogenic emissions of chlorofluorocarbons (CFCs) were once considered safe because they are inert in the lowest part of the atmosphere called 2 Builtjes, P. (2003) The Problem – Air Pollution. Chapter 1 of AIR QUALITY MODELING –
Theories, Methodologies, Computational Techniques, and Available Databases and Software. Vol I – Fundamentals (P. Zannetti, Editor). EnviroComp Institute (http://www.envirocomp.org/) and Air & Waste Management Association (http://www.awma.org/).
3 http://lwf.ncdc.noaa.gov/oa/climate/gases.html#cd4 http://lwf.ncdc.noaa.gov/oa/climate/gases.html#m5 http://lwf.ncdc.noaa.gov/oa/climate/gases.html#n2o

1 An Introduction to Air Pollution 3
the troposphere. However, once these chemicals enter the stratosphere, ultraviolet radiation can convert them into highly reactive species that can have a devastating effect on stratospheric ozone. Similarly, anthropogenic CO2 emissions from combustion processes were considered safe because they are not toxic, but the long-term accumulation of CO2 in the atmosphere may lead to a climate change, which could then be harmful to humans and the ecosystem. Another drawback of this approach is that it does not consider natural emissions as air pollution even though they can be very harmful, such as gases and particles from volcanic eruptions, and smoke from forest fires caused by natural processes (lightning strikes). So besides anthropogenic emissions, it is useful to also consider geogenic emissions and biogenic emissions as contributors to air pollution. Geogenic6 emissions are defined as emissions caused by the non-living world, such as volcanic emissions, sea-salt emissions, and natural fires. Biogenic emissions come from the living world; such as volatile organic compound (VOC) emissions from forests and CH4 emissions from swamps7. Human activity can also influence geogenic and biogenic emissions. For example, human applications of nitrogen fertilizers in agriculture can result in increased biogenic emissions of nitrogen compounds from the soil. Also, humans can affect the biogenic emissions of VOC by cutting down trees or planting trees. Lastly, geogenic emissions of dust from the earth’s surface can be altered if the surface is changed by human activity. So taking all of the above into account, we can define an “air pollutant” as any substance emitted into the air from an anthropogenic, biogenic, or geogenic source, that is either not part of the natural atmosphere or is present in higher concentrations than the natural atmosphere, and may cause a short-term or long-term adverse effect. 2 Primary and Secondary Pollutants Pollutants can be classified as primary or secondary. Primary pollutants are substances that are directly emitted into the atmosphere from sources. The main primary pollutants known to cause harm in high enough concentrations are the following:
• Carbon compounds, such as CO, CO2, CH4, and VOCs • Nitrogen compounds, such as NO, N2O, and NH3 • Sulfur compounds, such as H2S and SO2
6 http://www.eionet.europa.eu/gemet/concept?langcode=en&cp=3640 7 Builtjes, P. (2003) – see previous footnote.
4 Ambient Air Pollution
• Halogen compounds, such as chlorides, fluorides, and bromides • Particulate Matter (PM or “aerosols”), either in solid or liquid form, which
is usually categorized into these groups based on the aerodynamic diameter of the particles8,9: 1. Particles less than 100 microns, which are also called “inhalable”10
since they can easily enter the nose and mouth. 2. Particles less than 10 microns (PM10, often labeled “fine” in Europe).
These particles are also called “thoracic” since they can penetrate deep in the respiratory system.11
3. Particles less than 4 microns. These particles are often called “respirable” 12 because they are small enough to pass completely through the respiratory system and enter the bloodstream.
4. Particles less than 2.5 microns (PM2.5, labeled “fine” in the US). 5. Particles less than 0.1 microns (PM0.1, “ultrafine”).
Sulfur compounds were responsible for the traditional wintertime sulfur smog in London in the mid 20th century. These anthropogenic pollutants have sometimes reached lethal concentrations in the atmosphere, such as during the infamous London episode of December 195213. Secondary pollutants are not directly emitted from sources, but instead form in the atmosphere from primary pollutants (also called “precursors”). The main secondary pollutants known to cause harm in high enough concentrations are the following:
• NO2 and HNO3 formed from NO • Ozone (O3) formed from photochemical reactions of nitrogen oxides and
VOCs • Sulfuric acid droplets formed from SO2
, and nitric acid droplets formed
from NO2 • Sulfates and nitrates aerosols (e.g., ammonium (bi)sulfate and ammonium
nitrate) formed from reactions of sulfuric acid droplets and nitric acid droplets with NH3, respectively
• Organic aerosols formed from VOCs in gas-to-particle reactions In the 20th century, it was recognized that petroleum products are responsible for a new type of “smog”, a photochemical summertime smog composed of secondary
8 http://www.aiha.org/abs05/po105.htm9 http://www.greenfacts.org/glossary/pqrs/PM10-PM2.5-PM0.1.htm10 Inhalable particles are also defined, especially in the US, as particles of 15 micrometers or less in
diameter: http://iaspub.epa.gov/trs/trs_proc_qry.navigate_term?p_term_id=28097&p_term_cd=TERM .
11 PM10 particles are often defined as “respirable”, especially in the US: http://www.epa.gov/eogapti1/module3/category/category.htm . 12 http://www.aiha.org/abs05/po105.htm 13 http://www.metoffice.com/education/secondary/students/smog.html

1 An Introduction to Air Pollution 5
pollutants such as ozone, that is quite different from the winter sulfur smog described earlier. This smog has been labeled “Los Angeles” smog, to differentiate from the “London” smog described before. Photochemical smog14 was first recognized15 in the city of Los Angeles in the 1940s. After decades of research, the smog was identified as the product of photochemical reactions involving “precursors (nitrogen oxides and VOC) and sunlight, with the production of ozone and other secondary chemicals. While nitrogen oxides are emitted by a wide variety of sources, automobiles mostly emit VOCs, even though contributions can be found from vegetation and common human activities, such as bakeries16. Some secondary pollutants – sulfates, nitrates, and organic particles – can be transported over large distances, such as hundreds and even thousands of miles. Wet and dry deposition of these pollutants contributes to the “acid deposition” problem17 (often called “acid rain”), with possible damage to soils, vegetation, and susceptible lakes. 3 Air Pollution Regulation In the last few decades, especially after the milestone 1970 Clean Air Act in the US, air pollution has been regulated all over the world through a series of laws and regulations. The European commission has developed a series of framework directives for controlling ambient air pollution and monitoring concentrations. “Daughter” directives have followed that give thresholds, define the reporting requirements, and specify the monitoring methods and number of observations for SO2, NO2, particulate matter (PM), lead, and tropospheric (“low-level”) ozone (O3)18. More information can be found at: http://europe.eu.int/comm/environment/air/ambient.htm. The United Nations Economic Commission for Europe (UN-ECE) has created protocols to reduce long-range transboundary air pollution. More information can be found at: http://www.emep.int.
14 http://www.epa.qld.gov.au/environmental_management/air/air_quality_monitoring/air_pollutant
s/ozone/ 15 http://www.pbs.org/now/science/smog.html 16 The by-products of fermenting yeast are CO
2 and ethanol (a VOC). So baking bread in large
quantities can contribute to ozone formation due to emissions of VOCs. 17 http://en.wikipedia.org/wiki/Acid_rain 18Ambient ozone, a pollutant, is often defined as “tropospheric” to differentiate from “stratospheric”
ozone, which is a beneficial chemical.
6 Ambient Air Pollution
New developments in air pollution modeling, research, and regulations in Europe are listed at the EUROTRAC-project19. In the United States, the Environmental Protection Agency (US-EPA) has established air quality standards to protect public health, including the health of “sensitive” populations such as children, older adults, and people with asthma. US-EPA also sets limits to protect public welfare. This includes protecting ecosystems, such as plants and animals, from harm, as well as protecting against decreased visibility and damage to crops, vegetation, and buildings. US-EPA has set National Air Quality Standards (NAAQS) for six principal air pollutants: nitrogen oxides (expressed as NO2), ozone, sulfur dioxide, PM, carbon monoxide (CO), and lead (Pb). Four of these pollutants (CO, Pb, NO, and SO2) are emitted directly from a variety of sources. Ozone is not directly emitted, but is formed when nitrogen oxides (NOX) and VOCs react in the presence of sunlight. PM is mostly directly emitted, but PM2.5 particles can also be added as secondary pollutants (sulfates, nitrates, and organic particles). The US-EPA has a large network of monitoring stations measuring the levels of these pollutants in the air (ambient concentrations). A comprehensive annual report and air trends 20 publications are also distributed by the US-EPA. Furthermore, the US-EPA provides estimates and trends of emission rates for various source types21. The United States Clean Air Act22 provides the principal framework for national, state, tribal, and local efforts to protect air quality. Improvements in air quality are the result of effective implementation of clean air laws and regulations, as well as efficient industrial technologies. Under the Clean Air Act, the US-EPA has a number of responsibilities, including the following:
• Conducting periodic reviews of the NAAQS for the six principal pollutants that are considered harmful to public health and the environment.
• Ensuring that these air quality standards are met (in cooperation with the
state, tribal, and local governments) through national standards and strategies to control air pollutant emissions from vehicles, factories, and other sources.
• Reducing emissions of SO2 and NOX that cause “acid rain”.
• Reducing air pollutants such as PM, SOX, and NOX, which can reduce
visibility across large regional areas, including many of the nation’s parks and wilderness areas.
19 http://www.gsf.de/eurotrac 20 http://www.epa.gov/air/airtrends/reports.html 21 http://www.epa.gov/air/airtrends/aqtrnd03/ 22 http://www.epa.gov/oar/caa/contents.html

1 An Introduction to Air Pollution 7
• Ensuring that sources of toxic air pollutants that may cause cancer and other adverse human health and environmental effects are well controlled and that the risks to public health and the environment are substantially reduced.
• Limiting the use of chemicals that damage the stratospheric ozone layer in
order to prevent increased levels of harmful UV radiation. More information can be found at http://www.epa.gov/oar/caa/contents.html. 4 Classifications of Air Pollutants and Their Trends 4.1 Criteria Pollutants As listed above, there are 6 principal, or “criteria” pollutants regulated by the US-EPA and most countries in the world:
• Total suspended particulate matter (TSP), with additional subcategories of particles smaller then 10 µm in diameter (PM10), and particles smaller than 2.5 µm in diameter (PM2.5). PM can exist in solid or liquid form, and includes smoke, dust, aerosols, metallic oxides, and pollen. Sources of PM include combustion, factories, construction, demolition, agricultural activities, motor vehicles, and wood burning. Inhalation of enough PM over time increases the risk of chronic respiratory disease.
• Sulfur dioxide (SO2). This compound is colorless, but has a suffocating,
pungent odor. The primary source of SO2 is the combustion of sulfur-containing fuels (e.g., oil and coal). Exposure to SO2 can cause the irritation of lung tissues and can damage health and materials.
• Nitrogen oxides (NO and NO2). NO2 is a reddish-brown gas with a sharp
odor. The primary source of this gas is vehicle traffic, and it plays a role in the formation of tropospheric ozone. Large concentrations can reduce visibility and increase the risk of acute and chronic respiratory disease.
• Carbon monoxide (CO). This odorless, colorless gas is formed from the
incomplete combustion of fuels. Thus, the largest source of CO today is motor vehicles. Inhalation of CO reduces the amount of oxygen in the bloodstream, and high concentrations can lead to headaches, dizziness, unconsciousness, and death.
• Ozone (O3). Tropospheric (“low-level”) ozone is a secondary pollutant
formed when sunlight causes photochemical reactions involving NOX and VOCs. Automobiles are the largest source of VOCs necessary for these reactions. Ozone concentrations tend to peak in the afternoon, and can cause eye irritation, aggravation of respiratory diseases, and damage to plants and animals.

8 Ambient Air Pollution
• Lead (Pb). The largest source of Pb in the atmosphere has been from leaded gasoline combustion, but with the gradual elimination worldwide of lead in gasoline, air Pb levels have decreased considerably. Other airborne sources include combustion of solid waste, coal, and oils, emissions from iron and steel production and lead smelters, and tobacco smoke. Exposure to Pb can affect the blood, kidneys, and nervous, immune, cardiovascular, and reproductive systems.
Below is a graph showing the almost general decline in concentration of these criteria pollutants in the United States (courtesy of US-EPA data from their National Air Quality and Emissions Report, 1996 and 200323):
The following graphs (see electronic book for full color versions) depicting similar trends in UK air pollutants are from the National Environmental Technology Center24 (“Smoke” is soot emitted from burning coal, and is a type of Particulate Matter).
23 http://www.epa.gov/air/airtrends/reports.html24 http://www.airquality.co.uk/archive/reports/cat05/0408161000_Defra_AQ_Brochure_2004_s.pdf

1 An Introduction to Air Pollution 9
In order to obtain more comprehensive and representative data on ozone air pollution, the US-EPA air monitoring regulations now require US states to establish networks of Photochemical Assessment Monitoring Stations (PAMS) in areas where ozone air pollution is a serious problem. These stations provide enhanced monitoring of ozone and its precursors (NOX and VOCs), as well as some meteorological data. More information is listed at: http://www.epa.gov/oar/oaqps/pams/general.html.

10 Ambient Air Pollution
4.2 Toxic Pollutants Hazardous air pollutants (HAPS)25, also called toxic air pollutants or air toxics, are those pollutants that cause or may cause cancer or other serious health effects, such as reproductive effects or birth defects. The US-EPA is required to control 188 hazardous air pollutants26. Examples of toxic air pollutants include benzene, which is found in gasoline; perchlorethlyene, which is emitted from some dry cleaning facilities; and methylene chloride, which is used as a solvent and paint stripper by a number of industries. The following graph (which is figure 5.4 in the original reference) of benzene concentrations is courtesy of US-EPA data from their National Air Quality and Emissions Report, 200327:
4.3 Radioactive Pollutants Radioactivity 28 is an air pollutant that is both geogenic and anthropogenic. Geogenic radioactivity results from the presence of radionuclides, which originate either from radioactive minerals in the earth’s crust or from the interaction of cosmic radiation with atmospheric gases. Anthropogenic radioactive emissions originate from nuclear reactors, the atomic energy industry (mining and processing of reactor fuel), nuclear weapon explosions, and plants that reprocess spent reactor fuel. Since coal contains small quantities of uranium and thorium, these
25 http://www.epa.gov/ttn/atw/pollsour.html 26 http://www.epa.gov/ttn/atw/orig189.html 27 http://www.epa.gov/air/airtrends/aqtrnd03/28 http://epa.gov/radtown/air.htm
1 An Introduction to Air Pollution 11
radioactive elements can be emitted into the atmosphere from coal-fired power plants and other sources29. 4.4 Indoor Pollutants30
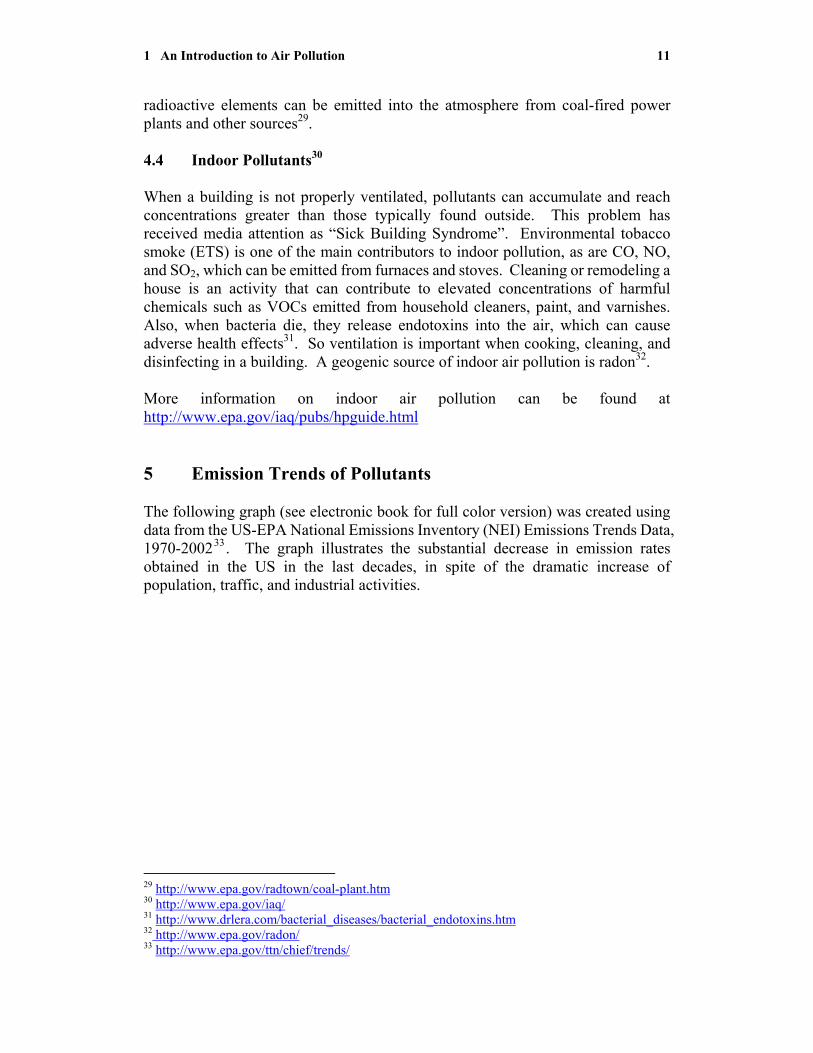
When a building is not properly ventilated, pollutants can accumulate and reach concentrations greater than those typically found outside. This problem has received media attention as “Sick Building Syndrome”. Environmental tobacco smoke (ETS) is one of the main contributors to indoor pollution, as are CO, NO, and SO2, which can be emitted from furnaces and stoves. Cleaning or remodeling a house is an activity that can contribute to elevated concentrations of harmful chemicals such as VOCs emitted from household cleaners, paint, and varnishes. Also, when bacteria die, they release endotoxins into the air, which can cause adverse health effects31. So ventilation is important when cooking, cleaning, and disinfecting in a building. A geogenic source of indoor air pollution is radon32. More information on indoor air pollution can be found at http://www.epa.gov/iaq/pubs/hpguide.html 5 Emission Trends of Pollutants The following graph (see electronic book for full color version) was created using data from the US-EPA National Emissions Inventory (NEI) Emissions Trends Data, 1970-200233. The graph illustrates the substantial decrease in emission rates obtained in the US in the last decades, in spite of the dramatic increase of population, traffic, and industrial activities.
29 http://www.epa.gov/radtown/coal-plant.htm30 http://www.epa.gov/iaq/ 31 http://www.drlera.com/bacterial_diseases/bacterial_endotoxins.htm32 http://www.epa.gov/radon/33 http://www.epa.gov/ttn/chief/trends/

12 Ambient Air Pollution
The following graph (Figure 5-3 in the original publication) is courtesy of US-EPA data from their National Air Quality and Emissions Report, 200334). The graph illustrates an encouraging trend of reduction of toxic ambient concentrations.
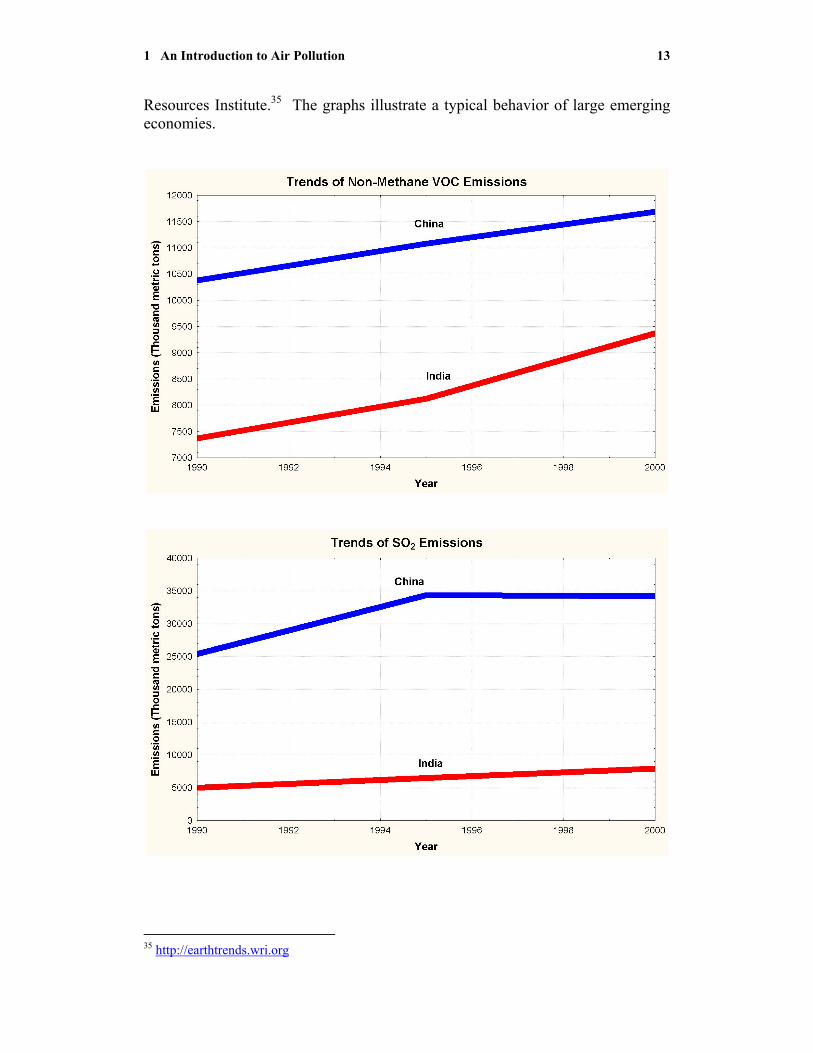
Finally, the following two graphs depict emission trends in large developing nations (China and India) and were created from data collected by the World
34 http://www.epa.gov/air/airtrends/aqtrnd03/
1 An Introduction to Air Pollution 13
Resources Institute.35 The graphs illustrate a typical behavior of large emerging economies.
35 http://earthtrends.wri.org

14 Ambient Air Pollution
6 Further Reading For additional information, the reader may consult these major references:
• US EPA web sites: http://www.epa.gov/air/basic.html http://yosemite.epa.gov/R10/AIRPAGE.NSF
• Other general references: http://en.wikipedia.org/wiki/Air_pollution
• Boubel et al. (1994) Fundamentals of Air Pollution, 3rd Edition. Academic Press.