An introduction: Revenue streams for battery storage
15
An introduction: Revenue streams for battery storage September 2017
Transcript of An introduction: Revenue streams for battery storage

An introduction:
Revenue streams for
battery storage
September 2017

Target audience
Introduction
2
• Overview of the business models and revenue sources for storage,
particularly for Lithium-ion batteries.
• Summary of the current status, potential market changes and attractiveness
of some of the main revenue streams to batteries.
• Estimate of the range of total revenues available to batteries from participation
in the system services markets, capacity market and embedded benefits.
• Storage is critical in low emissions and renewable electricity systems, providing additional flexibility and reliability.
• As part of a move towards a smarter and more flexible electricity system, Ofgem, National Grid and government are
seeking to reduce market barriers and enable storage.
• National Grid expects electricity storage capacity to grow rapidly in the next few years, nearing 6 GW by 2020 in all
scenarios. Under the 2017 Consumer Power scenario, storage capacity reaches 10.7 GW by 2050.
• Storage growth in the next five years will be driven by both technology progress and improving commercial
attractiveness, including decreasing cost, the increasing demand for flexibility and the growth of distributed resources.
• To optimise asset returns, investors need to understand how to monetise multiple potential sources of revenues.
About this document
Context
Investors Developers

Outline
3
1. Battery business models and revenues
2. Review of battery revenue sources
3. Illustrative quantitative analysis

Batteries can be developed as standalone assets (both behind and in front of the meter) or as part of an asset portfolio (for renewable
energy integration and services such as demand-side response). This document focuses on investor-owned batteries located in front of
the meter that may be developed by “stacking up” different sources of revenue.
Business models
4
Location* Owner**
Revenue streams and benefits Front of the meter Behind the meter Utility / investor Consumer
Frequency response (e.g. FFR, EFR)
Reserve power (e.g. STOR, DTU)
Voltage support
Capacity market
Embedded benefits
Wholesale arbitrage
Grid upgrade deferral and congestion relief
Resiliency
Black start
Peak reduction
Energy time shift
Renewable integration
Back up power
Off-grid / islanding
Self consumption
* Front of the meter
encompasses utility-
sided, central
applications; behind
the meter comprises
customer-sided,
distributed
applications.
** Network
businesses are not
included because
they are not currently
permitted to own
storage assets. An
Ofgem review is
underway to
facilitate proactive
network
management by
DNOs, e.g. through
ownership and
operation of storage
and DSR.
Directly accessible
Accessible primarily
through an aggregator
Energy storage is monetised through several business models and ownership structures:

The ability to “stack-up” these different sources of revenues will depend on both the operating parameters
of the asset and the rules and requirements for participation in each market or service contract.
Revenue streams
5
Capacity market: Batteries can secure a capacity market agreement lasting up
to 15 years for new build. Capacity market units are required to respond during
system stress events.
Wholesale market: Price arbitrage, including intraday trading, is feasible but
requires high spreads to justify the battery deterioration that follows from
constant cycling.
Embedded benefits: Distribution-connected batteries are not liable for a
number of generation network charges. Although significantly reduced, they can
also secure payments for reducing suppliers’ net demand and network charges.
System services: Batteries can provide a number of system support services,
such as frequency response, reserve and transmission constraint management.
Their technical properties make them best suited for services procured on a
short time scale. New system services definitions are expected in 2018.
In the GB market, batteries have access to four distinct revenues streams:
Wholesale Market
Frequency
ResponseSyste
m S
erv
ice
s
Embedded Benefits
Capacity Market
Wholesale Market
Reserve
ILLUSTRATIVE

Outline
6
1. Battery business models and revenues
2. Review of battery revenue sources
3. Illustrative quantitative analysis

Relevant system services
7
• National Grid consultation results are due to be published in September 2017
and are expected to lead to:
– Fewer products: inertia, frequency response (combining FFR and EFR),
reserve, reactive power, black start;
– Standardised key parameters (availability windows, contract terms); and
– Increased transparency regarding tender assessment.
• National Grid currently procures over 20 different balancing services products across the categories of frequency response,
reserve, system security and reactive power.
• Revenues from different system services can be cumulated as long as tendered availability windows do not overlap.
• The two key types of system services of relevance to batteries are frequency response (Firm and Enhanced Frequency
Response – FFR and EFR) and reserve services (Short Term Operating Reserve and Demand Turn Up – STOR and DTU).
• National Grid has initiated a consultation to improve transparency and reduce complexity in this market.
• Frequency response services currently provide higher revenues for batteries
than reserve services; however, STOR and DTU revenues may be combined
with some frequency response services.
• Competition for frequency response tenders is greater than reserve services.
Current service revenues
0
10,000
20,000
30,000
40,000
50,000
60,000
70,000
80,000
90,000
EFR FFR STOR DTU STOR +DTU
Upcoming changes
£/M
W o
f ca
pa
city/y
ear
ILLUSTRATIVE
Capacity market revenues
8
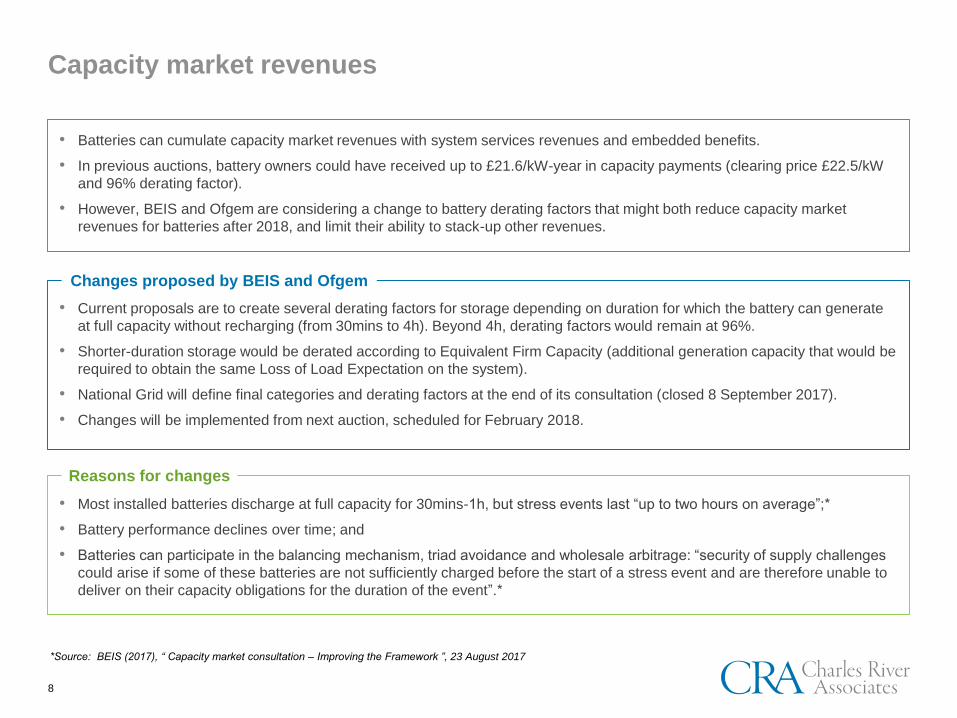
• Current proposals are to create several derating factors for storage depending on duration for which the battery can generate
at full capacity without recharging (from 30mins to 4h). Beyond 4h, derating factors would remain at 96%.
• Shorter-duration storage would be derated according to Equivalent Firm Capacity (additional generation capacity that would be
required to obtain the same Loss of Load Expectation on the system).
• National Grid will define final categories and derating factors at the end of its consultation (closed 8 September 2017).
• Changes will be implemented from next auction, scheduled for February 2018.
Changes proposed by BEIS and Ofgem
• Batteries can cumulate capacity market revenues with system services revenues and embedded benefits.
• In previous auctions, battery owners could have received up to £21.6/kW-year in capacity payments (clearing price £22.5/kW
and 96% derating factor).
• However, BEIS and Ofgem are considering a change to battery derating factors that might both reduce capacity market
revenues for batteries after 2018, and limit their ability to stack-up other revenues.
*Source: BEIS (2017), “ Capacity market consultation – Improving the Framework ”, 23 August 2017
• Most installed batteries discharge at full capacity for 30mins-1h, but stress events last “up to two hours on average”;*
• Battery performance declines over time; and
• Batteries can participate in the balancing mechanism, triad avoidance and wholesale arbitrage: “security of supply challenges
could arise if some of these batteries are not sufficiently charged before the start of a stress event and are therefore unable to
deliver on their capacity obligations for the duration of the event”.*
Reasons for changes

Embedded benefits (for distribution-connected assets)
9
Distribution-connected assets can:
• Receive payments for reducing net demand from suppliers at the GSP, thereby reducing liability for network charges;
• Face the inverse of TNUoS demand locational charges for generation during Triad;
• Avoid generation charges associated with being connected on the transmission system.
Payments to embedded generators
• CMP264 and 265 significantly reduced the value of the
TNUoS demand residual, from £45.33/kW to £1.62/kW.
• BEIS is minded to remove the capacity market supplier
charge payment to embedded generators.
• The CMA energy market inquiry recommended the
application of transmission losses to generation, which would
suppress this embedded payment.
• Other relevant changes:
– National Grid is looking into removing double charging of
TNUoS demand residual and BSUoS on electricity taken
from storage facilities (respectively CMP280 and 281).
– Ofgem has launched a Significant Code Review to reform
residual charging for transmission and distribution.
However, the review does not cover some embedded
benefits available to smaller embedded generation.
Evolution of embedded benefits and network charging
Embedded
benefits from
forgone
payments
May be
removed
(-) TNUoSlocational
charge
BSUoSdemand charge
DUoScredits
Capacity market supplier charge
Transmission
losses
TNUoSdemand residual

Outline
10
1. Battery business models and revenues
2. Review of battery revenue sources
3. Illustrative quantitative analysis

Revenue breakdown for Lithium-ion batteries, excluding wholesale
energy market
11
• Revenue scenarios for Lithium-ion batteries based on 2017 available services:
– Maximum: High capacity market derating factor, maximum revenue from embedded benefits, high remuneration for
frequency response;
– Conservative: Medium capacity market derating factor and embedded benefits, conservative remuneration for frequency
response; and
– Low: Low capacity market derating factor, no embedded benefits, participation in reserve services;
• Different combinations of capacity market, embedded benefits and system services revenues can provide between £20/kW-
year and £135/kW-year, in addition to potential revenues available from participation in energy markets.
• In comparison, make-whole revenue requirements can range from £60/kW-year to £85/kW-year for 30-minute batteries, with
substantial cost savings projected in coming years.
*Subject to assumptions on costs, battery sizing, required returns, WACC and other key parameters, not accounting for potential wholesale
market revenues. Revenues for reserve services have been adjusted to reflect the maximum participation possible with a 30-minute battery.
Source: CRA analysis
-
20,000
40,000
60,000
80,000
100,000
120,000
140,000
Maximum Conservative Limited
£/M
W p
er
ann
um
Capacity market Embedded benefits System services
Indicative
breakeven revenue
range for a large
scale 30min
Lithium-ion battery
built in 2017/18*
ILLUSTRATIVE

How CRA can help
12
• Assessing the optimal combination
of feasible revenues
• Market and revenue scenario
analysis
• Asset valuation
• Portfolio analysis
• Independent evaluation of your
internal analysis
• Third party challenge to investment
assumptions and forecasts
• Developing a bidding strategy for
auction markets (including the
capacity market or auctioned system
services)
• Developing a business case
• Assisting in negotiations with
investors and developers
How our team can help
• System services markets, capacity markets and embedded benefits are complex enough on their own. Understanding how
generation and storage assets can maximise the potential value from all of these markets is particularly challenging in an
environment with constantly changing rules and policies.
• CRA can help investors understand the interactions of these markets, the regulatory risks, the likely policy evolutions and
evaluate all potential sources of revenue for battery assets.
Proven market analysis and valuation experience
Our team has conducted revenue forecasts, financial analysis and asset valuations. Investors
and financial institutions often retain CRA to value investments and analyse the risk and value
drivers of power markets.
Why CRA?
Investment and operational expertise
Our team has experience investing in, and attracting investors to, a wide range of power
markets. We can help you shape or review your business plans, identify optimal investors and
negotiate.
Modelling expertise
CRA has extensive expertise modelling electricity markets and projecting financial models. We
can provide flexible, dynamic tools that will enable you to evaluate and value investments.
Deep electricity market knowledge
We have deep expertise in electricity markets, capacity markets and system services markets.
CRA experts have helped shape some of the most sophisticated electricity markets in the
world and understand policy and regulatory risks.

Battery storage system modelling:A comprehensive assessment of your project returns
13
• Battery capacity allocation for maximum
value capture
• Charge / recharge cycle duration
• Stochastic forecasts for battery
operations
• Battery usage and respective
degradation
• Capacity warranty contract and cycling
effects on performance
• Assessment of bundling energy storage
with a conventional asset
• Optimal battery sizing
• Optimal project capital structure
• Relevant project return parameters (e.g.
NPV and IRR)
• Financial risks and hedging strategies
• Portfolio financial performance and
optimisation
• Cash flow profiles
• Evaluation of revenue and operational
performance scenarios
• Business model and stakeholder
structure assessment
• Potential investor’s exit strategies
• How the regulation will evolve in the
near future
• How it will impact your project
• Key regulatory risks
• How much value each revenue stream
holds
• Which revenue streams can be combined
• What assets can be combined to capture
most revenue
• Bidding strategy
• Competitor analysis and benchmarkingMarket and regulatory risks
Op
era
tio
nal p
erf
orm
an
ce
Fin
an
cia
l retu
rns
Battery
Model
• £/kW and £/kWh price curves
• Battery efficiency
• System energy (kWh) to power (kW) ratio
• Depth of Discharge and State of Health
assumptions
• Battery lifetime assumptions
• Dynamic asset degradation
Project costs and asset
technical assumptionsRegulatory analysis and evolutionMarket analysis and value stacking
Design evaluation and
propositions
Financial returns and
capital structure

Disclaimer
This document shall not be construed as providing legal or financial opinions or guidance. Any opinion expressed herein shall not be interpreted as
any form of assurance or guarantee with respect to future events or circumstances, and the content of this report may not be relied on for
investment purposes. To the extent the information in this report is to be used to make legal or financial determinations, you should seek advice
from your own legal counsel and/or financial advisors.
Your use of this report, including any reliance on it, are your responsibility. CRA accepts no duty of care or liability of any kind whatsoever to you,
and you waive and release CRA for all claims, liabilities and damages, if any, suffered as a result of decisions made, or not made, or actions taken,
or not taken, based on this report.
Detailed information about Charles River Associates, a registered trade name of CRA International, Inc., is available at www.crai.com.
Copyright 2017 Charles River Associates

www.crai.com/energy
LondonTel +44 (0)20 7664 3700Fax +44 (0)20 7664 3998
8 Finsbury CircusLondon EC2M 7EAUnited Kingdom
Robin Cohen
+44 20 7959 1444 direct
+44 78 8151 8181 mobile
Ana Barillas
+44 20 7959 1547 direct
+44 77 8559 3471 mobile