An intercomparison study of analytical methods used for ... · K. E. Yttri et al.: An...
23
Atmos. Meas. Tech., 8, 125–147, 2015 www.atmos-meas-tech.net/8/125/2015/ doi:10.5194/amt-8-125-2015 © Author(s) 2015. CC Attribution 3.0 License. An intercomparison study of analytical methods used for quantification of levoglucosan in ambient aerosol filter samples K. E. Yttri 1 , J. Schnelle-Kreis 2 , W. Maenhaut 3,6 , G. Abbaszade 2 , C. Alves 4 , A. Bjerke 1 , N. Bonnier 14 , R. Bossi 5 , M. Claeys 6 , C. Dye 1 , M. Evtyugina 4 , D. García-Gacio 7 , R. Hillamo 8 , A. Hoffer 9 , M. Hyder 10,15 , Y. Iinuma 11 , J.-L. Jaffrezo 12 , A. Kasper-Giebl 13 , G. Kiss 9 , P. L. López-Mahia 7 , C. Pio 4 , C. Piot 12,16 , C. Ramirez-Santa-Cruz 13 , J. Sciare 14 , K. Teinilä 8 , R. Vermeylen 6 , A. Vicente 4 , and R. Zimmermann 2 1 NILU – Norwegian Institute for Air Research, P.O. Box 100, 2027 Kjeller, Norway 2 Helmholtz Zentrum München, Cooperation group Comprehensive Molecular Analytics, 85764 Neuherberg, Germany 3 Department of Analytical Chemistry, Ghent University, 9000 Gent, Belgium 4 Centre for Environmental and Marine Studies, Department of Environment, University of Aveiro, 3810-193 Aveiro, Portugal 5 Department of Environmental Science, Aarhus University, Frederiksborgvej 399, 4000 Roskilde, Denmark 6 Department of Pharmaceutical Sciences, University of Antwerp, Campus Drie Eiken, 2610 Antwerp, Belgium 7 Group of Analytical Chemistry (QANAP), Institute of Environment (IUMA), Department of Analytical Chemistry, Faculty of Sciences, University of A Coruña, Campus de A Coruña, 15071 A Coruña, Spain 8 Finnish Meteorological Institute, Atmospheric Composition Research, Aerosol Research, Erik Palménin Aukio 1, 00560, Helsinki, Finland 9 MTA-PE Air Chemistry Research Group, P.O. Box 158, 8201Veszprém, Hungary 10 Center for Analysis and Synthesis, Department of Chemistry, Lund University, Sweden 11 Leibniz-Institut für Troposphärenforschung, Permoserstr. 15, 04138 Leipzig, Germany 12 Univ. Grenoble Alpes, LGGE, 38000 Grenoble, France, CNRS, LGGE, 38000 Grenoble, France 13 Institute of Chemical Technologies and Analytics, Vienna University of Technology, Getreidemarkt 9/164, 1060 Vienna, Austria 14 Laboratoire des Sciences du Climat et de l’Environnement, CEA-CNRS-UVSQ, 91190 Gif-sur-Yvette, France 15 Pakistan Space and Upper Atmosphere research commission (SUPARCO), Lahore, Pakistan 16 Université de Savoie, LCME, 73376 Le Bourget du lac, France Correspondence to: K. E. Yttri ([email protected]) Received: 16 June 2014 – Published in Atmos. Meas. Tech. Discuss.: 23 July 2014 Revised: 4 December 2014 – Accepted: 4 December 2014 – Published: 9 January 2015 Abstract. The monosaccharide anhydrides (MAs) levoglu- cosan, galactosan and mannosan are products of incomplete combustion and pyrolysis of cellulose and hemicelluloses, and are found to be major constituents of biomass burn- ing (BB) aerosol particles. Hence, ambient aerosol particle concentrations of levoglucosan are commonly used to study the influence of residential wood burning, agricultural waste burning and wildfire emissions on ambient air quality. A European-wide intercomparison on the analysis of the three monosaccharide anhydrides was conducted based on ambi- ent aerosol quartz fiber filter samples collected at a Norwe- gian urban background site during winter. Thus, the sam- ples’ content of MAs is representative for BB particles orig- inating from residential wood burning. The purpose of the intercomparison was to examine the comparability of the great diversity of analytical methods used for analysis of levoglucosan, mannosan and galactosan in ambient aerosol filter samples. Thirteen laboratories participated, of which three applied high-performance anion-exchange chromatog- raphy (HPAEC), four used high-performance liquid chro- matography (HPLC) or ultra-performance liquid chromatog- raphy (UPLC) and six resorted to gas chromatography (GC). The analytical methods used were of such diversity that they should be considered as thirteen different analytical meth- Published by Copernicus Publications on behalf of the European Geosciences Union.
Transcript of An intercomparison study of analytical methods used for ... · K. E. Yttri et al.: An...

Atmos. Meas. Tech., 8, 125–147, 2015
www.atmos-meas-tech.net/8/125/2015/
doi:10.5194/amt-8-125-2015
© Author(s) 2015. CC Attribution 3.0 License.
An intercomparison study of analytical methods used for
quantification of levoglucosan in ambient aerosol filter samples
K. E. Yttri1, J. Schnelle-Kreis2, W. Maenhaut3,6, G. Abbaszade2, C. Alves4, A. Bjerke1, N. Bonnier14, R. Bossi5,
M. Claeys6, C. Dye1, M. Evtyugina4, D. García-Gacio7, R. Hillamo8, A. Hoffer9, M. Hyder10,15, Y. Iinuma11,
J.-L. Jaffrezo12, A. Kasper-Giebl13, G. Kiss9, P. L. López-Mahia7, C. Pio4, C. Piot12,16, C. Ramirez-Santa-Cruz13,
J. Sciare14, K. Teinilä8, R. Vermeylen6, A. Vicente4, and R. Zimmermann2
1NILU – Norwegian Institute for Air Research, P.O. Box 100, 2027 Kjeller, Norway2Helmholtz Zentrum München, Cooperation group Comprehensive Molecular Analytics, 85764 Neuherberg, Germany3Department of Analytical Chemistry, Ghent University, 9000 Gent, Belgium4Centre for Environmental and Marine Studies, Department of Environment, University of Aveiro, 3810-193 Aveiro, Portugal5Department of Environmental Science, Aarhus University, Frederiksborgvej 399, 4000 Roskilde, Denmark6Department of Pharmaceutical Sciences, University of Antwerp, Campus Drie Eiken, 2610 Antwerp, Belgium7Group of Analytical Chemistry (QANAP), Institute of Environment (IUMA), Department of Analytical Chemistry,
Faculty of Sciences, University of A Coruña, Campus de A Coruña, 15071 A Coruña, Spain8Finnish Meteorological Institute, Atmospheric Composition Research, Aerosol Research, Erik Palménin Aukio 1, 00560,
Helsinki, Finland9MTA-PE Air Chemistry Research Group, P.O. Box 158, 8201Veszprém, Hungary10Center for Analysis and Synthesis, Department of Chemistry, Lund University, Sweden11Leibniz-Institut für Troposphärenforschung, Permoserstr. 15, 04138 Leipzig, Germany12Univ. Grenoble Alpes, LGGE, 38000 Grenoble, France, CNRS, LGGE, 38000 Grenoble, France13Institute of Chemical Technologies and Analytics, Vienna University of Technology, Getreidemarkt 9/164,
1060 Vienna, Austria14Laboratoire des Sciences du Climat et de l’Environnement, CEA-CNRS-UVSQ, 91190 Gif-sur-Yvette, France15Pakistan Space and Upper Atmosphere research commission (SUPARCO), Lahore, Pakistan16Université de Savoie, LCME, 73376 Le Bourget du lac, France
Correspondence to: K. E. Yttri ([email protected])
Received: 16 June 2014 – Published in Atmos. Meas. Tech. Discuss.: 23 July 2014
Revised: 4 December 2014 – Accepted: 4 December 2014 – Published: 9 January 2015
Abstract. The monosaccharide anhydrides (MAs) levoglu-
cosan, galactosan and mannosan are products of incomplete
combustion and pyrolysis of cellulose and hemicelluloses,
and are found to be major constituents of biomass burn-
ing (BB) aerosol particles. Hence, ambient aerosol particle
concentrations of levoglucosan are commonly used to study
the influence of residential wood burning, agricultural waste
burning and wildfire emissions on ambient air quality. A
European-wide intercomparison on the analysis of the three
monosaccharide anhydrides was conducted based on ambi-
ent aerosol quartz fiber filter samples collected at a Norwe-
gian urban background site during winter. Thus, the sam-
ples’ content of MAs is representative for BB particles orig-
inating from residential wood burning. The purpose of the
intercomparison was to examine the comparability of the
great diversity of analytical methods used for analysis of
levoglucosan, mannosan and galactosan in ambient aerosol
filter samples. Thirteen laboratories participated, of which
three applied high-performance anion-exchange chromatog-
raphy (HPAEC), four used high-performance liquid chro-
matography (HPLC) or ultra-performance liquid chromatog-
raphy (UPLC) and six resorted to gas chromatography (GC).
The analytical methods used were of such diversity that they
should be considered as thirteen different analytical meth-
Published by Copernicus Publications on behalf of the European Geosciences Union.

126 K. E. Yttri et al.: An intercomparison study of analytical methods used for quantification
ods. All of the thirteen laboratories reported levels of lev-
oglucosan, whereas nine reported data for mannosan and/or
galactosan. Eight of the thirteen laboratories reported levels
for all three isomers.
The accuracy for levoglucosan, presented as the mean per-
centage error (PE) for each participating laboratory, varied
from −63 to 20 %; however, for 62 % of the laboratories the
mean PE was within ±10 %, and for 85 % the mean PE was
within ±20 %. For mannosan, the corresponding range was
−60 to 69 %, but as for levoglucosan, the range was sub-
stantially smaller for a subselection of the laboratories; i.e.
for 33 % of the laboratories the mean PE was within ±10 %.
For galactosan, the mean PE for the participating laboratories
ranged from −84 to 593 %, and as for mannosan 33 % of the
laboratories reported a mean PE within ±10 %.
The variability of the various analytical methods, as de-
fined by their minimum and maximum PE value, was typi-
cally better for levoglucosan than for mannosan and galac-
tosan, ranging from 3.2 to 41 % for levoglucosan, from 10 to
67 % for mannosan and from 6 to 364 % for galactosan. For
the levoglucosan to mannosan ratio, which may be used to
assess the relative importance of softwood versus hardwood
burning, the variability only ranged from 3.5 to 24 %.
To our knowledge, this is the first major intercomparison
on analytical methods used to quantify monosaccharide an-
hydrides in ambient aerosol filter samples conducted and re-
ported in the scientific literature. The results show that for
levoglucosan the accuracy is only slightly lower than that
reported for analysis of SO2−4 (sulfate) on filter samples, a
constituent that has been analysed by numerous laborato-
ries for several decades, typically by ion chromatography
and which is considered a fairly easy constituent to measure.
Hence, the results obtained for levoglucosan with respect to
accuracy are encouraging and suggest that levels of levoglu-
cosan, and to a lesser extent mannosan and galactosan, ob-
tained by most of the analytical methods currently used to
quantify monosaccharide anhydrides in ambient aerosol fil-
ter samples, are comparable.
Finally, the various analytical methods used in the current
study should be tested for other aerosol matrices and concen-
trations as well, the most obvious being summertime aerosol
samples affected by wildfires and/or agricultural fires.
1 Introduction
The monosaccharide anhydrides (MAs) levoglucosan, galac-
tosan and mannosan are products of the incomplete combus-
tion and pyrolysis of cellulose and hemicelluloses, and are
thus constituents of biomass burning (BB) aerosol (Hornig et
al., 1985; Simoneit, 1999). The presence of MAs has been
demonstrated in emissions from wood combustion (Oros and
Simoneit, 1999; Fine et al., 2001; Nolte et al., 2001; Schmidl
et al., 2008; Frey et al., 2009; Gonçalves et al., 2010, 2011;
Orasche et al., 2012) as well as from wildfires, prescribed and
agricultural fires (dos Santos et al., 2002; Gao et al., 2003;
Sillanpää et al., 2005; Mazzoleni et al., 2007; Sullivan et al.,
2008; Alves et al., 2010; Saarnio et al., 2010a; Vicente et al.,
2012; Wang et al., 2011). Recently, it has been shown that
combustion of peat (Iinuma et al., 2007; Kourtchev et al.,
2011) as well as of certain types of brown coal (Fabbri et al.,
2009) could be additional sources of ambient aerosol con-
centrations of MAs in regions where such fuels are utilised.
Levoglucosan exhibits the highest concentration of the
MAs in BB aerosol; consequently, it has been applied for
source apportionment of ambient particulate matter (PM).
Additional information can be drawn from the PM MAs pat-
tern, e.g. it has been used to estimate the impact from com-
bustion of different wood types; however, no clear picture of
the variability of MAs concentrations and ratios from wood
combustion has been found. Some studies have reported a
high variability depending on burning conditions or type of
wood with filtration-based sampling (Schmidl et al., 2008;
Orasche et al., 2012, 2013) or by application of aerosol mass
spectrometry (Weimer et al., 2008; Elsasser et al., 2013).
Other studies have shown relatively little variation in MAs
emissions during wood combustion under varying conditions
(Jordan and Seen, 2005; Frey et al., 2009) or with different
types of wood (Fine et al., 2001, 2002, 2004). Size distribu-
tion measurements of MAs in particulate emission samples
from wood combustion have shown that most MAs are as-
sociated with PM < 1.2 µm (Frey et al., 2009). These results
are in agreement with wintertime observations showing that
most levoglucosan is present in the PM1 fraction of the am-
bient aerosol (Yttri et al., 2005; Agarwal et al., 2010; Krumal
et al., 2010).
The atmospheric concentration of levoglucosan is highly
variable as it depends not only on the source strength, but
also on meteorological parameters. During wintertime in
Europe residential wood burning is the major source of
levoglucosan, and the observed concentration is typically
< 1 µg m−3 (Oliveira et al., 2007; Yttri et al., 2009; Kru-
mal et al., 2010; Schnelle-Kreis et al., 2010; Caseiro and
Oliveira, 2012; Herich et al., 2014). In the evening and dur-
ing night-time higher concentrations (> 1 µg m−3) can be ob-
served (Elsasser et al., 2012; Saffari et al., 2013). Agricul-
tural fires are reported to cause ambient levoglucosan con-
centrations well above 1 µg m−3 (Pietrogrande et al., 2013),
and concentrations > 7 µg m−3 have been reported for haze
episodes in tropical regions (Claeys et al., 2010; He et al.,
2010).
Early investigations suggested that levoglucosan is resis-
tant to atmospheric acid-catalysed degradation (Fraser and
Lakshmanan, 2000). The low vapour pressure of levoglu-
cosan (Oja and Suuberg, 1999; Booth et al., 2011) as well
as the minor impact of temperature on the observed volatil-
ity of levoglucosan in ambient PM (Ruehl et al., 2011) fur-
ther supports its stability and thus its suitability as a tracer
species. Recent investigations on the stability of levoglu-
cosan in aqueous solution suggest that “oxidation of levoglu-
Atmos. Meas. Tech., 8, 125–147, 2015 www.atmos-meas-tech.net/8/125/2015/

K. E. Yttri et al.: An intercomparison study of analytical methods used for quantification 127
cosan in atmospheric deliquescent particles is at least as fast
as that of other atmospherically relevant organic compounds
and levoglucosan may not be as stable as previously thought
in the atmosphere, especially under high relative humid-
ity conditions” (Hoffmann et al., 2010; Teraji and Arakaki,
2010). Further, oligomerisation of levoglucosan by Fenton
chemistry in aqueous solution has been observed (Holmes
and Petrucci, 2007). The decay of levoglucosan upon ageing
of wood combustion aerosol has been studied in smog cham-
ber experiments. When exposed to typical summertime OH
radical concentrations, the atmospheric lifetime of levoglu-
cosan in BB particles was found to be 0.7–2.2 days (Henni-
gan et al., 2010) under BB plume conditions and estimated
to range up to 2 weeks for atmospheric background condi-
tions (Slade and Knopf, 2013). The impact of the above-
mentioned effects on the levoglucosan content in the (true)
ambient aerosol still remains to be documented; however,
these are indications that levoglucosan may be depleted in
the atmosphere, and that possible degradation should thus be
taken into account when using levoglucosan as a tracer of
BB emissions in source apportionment studies. Nonetheless,
levoglucosan is a valuable tracer to investigate the impact of
residential wood burning in urban (Oliveira et al., 2007; Ti-
monen et al., 2008; Caseiro et al., 2009; Szidat et al., 2009;
Bari et al., 2010; Schnelle-Kreis et al., 2010; Saffari et al.,
2013), rural background (Gelencsér et al., 2007; Puxbaum et
al., 2007, van Drooge and Ballesta, 2009) and remote areas
(May et al., 2009; Yttri et al., 2014), especially during winter,
when wood combustion is used for domestic heating.
As levoglucosan is commonly used as a tracer of emis-
sions from biomass combustion, increasing efforts have been
put into levoglucosan quantification during the last decade.
Gas chromatographic methods have been established since
the end of the last century, whereas liquid chromatographic
methods were more recently developed and have been gain-
ing attention. A review of existing methods was published
in 2006 (Schkolnik and Rudich, 2006) and derivatisation
methods for analysis of MAs using gas chromatography
(GC) were covered by Hsu et al. (2007). Thus, only a brief
overview on actual existing methods and developments will
be given here.
Gas chromatography-mass spectrometry (GC–MS) meth-
ods for separation and quantification of MAs are widespread.
Most GC methods used for analysis of MAs in environ-
mental samples make use of solvent extraction followed by
trimethylsilylation (Simoneit, 1999; Pashynska et al., 2002;
Simpson et al., 2004; Medeiros and Simoneit, 2007). Reac-
tive pyrolysis, i.e. thermally assisted alkylation of MAs, es-
tablished in pyrolysis research (Fabbri et al., 2002), has also
been applied to environmental samples (Blazso et al., 2003),
and more recently, thermal extraction methods have been de-
veloped. Lin et al. (2007) investigated solid-phase microex-
traction for pre-concentration of levoglucosan from filter
samples prior to GC analysis, whereas Orasche et al. (2011)
developed a method for in situ derivatisation of MAs in filter
samples followed by GC–MS. The most recent advance was
made by Ma et al. (2010), who developed a two-dimensional
GC method, which uses heart-cutting and thermal extraction
of MAs from filter samples without the need of chemical
derivatisation.
High-performance liquid chromatography combined with
mass spectrometry (HPLC-MS) and high-performance
anion-exchange chromatography (HPAEC) are the most
commonly used methods for analysis of MAs in extracts
based on polar solvents. Methods such as capillary elec-
trophoresis with pulsed amperometric detection (CE-PAD)
(Garcia et al., 2005), chloride attachment in liquid chro-
matography combined with negative ion electrospray mass
spectrometry (Wan and Yu, 2007) and ion-exclusion high-
performance liquid chromatography followed by spectro-
scopic detection (Schkolnik et al., 2005) have been reported
in the scientific literature but do not seem to be widely ap-
plied to MA analysis. Gao et al. (2003) were the first to report
the use of electrospray ionisation mass spectrometry (ESI-
MS) for quantification of MAs, and, at present, HPLC com-
bined with mass spectrometric (Dye and Yttri, 2005; Larsen
et al., 2006; Wan and Yu, 2007; Piot et al., 2012) or aerosol
charge detection (HPLC-ACD) (Dixon and Baltzell, 2006)
are widespread. HPAEC coupled with pulsed amperometric
detection (PAD) (Engling et al., 2006; Caseiro et al., 2007;
Iinuma et al., 2009; Piazzalunga et al., 2010) or with mass
spectrometric detection (HPAEC-MS) (Saarnio et al., 2010b)
have been employed more recently.
The objective of the current intercomparison is to examine
the comparability of the great diversity of analytical methods
used for analysis of levoglucosan, mannosan and galactosan
in ambient aerosol filter samples.
2 Experimental
2.1 Site description and measurement period
Aerosol filter samples were collected at the urban back-
ground site Kjeller (59◦58′ N, 11◦3′ E), on the outskirts of the
small town of Lillestrøm (20 000 inhabitants), located 20 km
east of Oslo (Norway). The samples were collected during
the period 11–16 December 2008. The sampling inlets were
installed approximately 4 m a.g.l.
2.2 Aerosol filter samples collection, storage,
preparation and shipment
Six ambient aerosol filter samples were provided using two
high-volume samplers with total suspended particulate mat-
ter (TSPM) inlets collecting aerosols on quartz fibre fil-
ters (Munktel MK 360; 150 mm in diameter; batch number
403743). The instruments were operated at a flow rate of
21.5 m3 h−1. The sampling time ranged from 24 to 48 h.
After exposure, the filter samples were folded once, with
the exposed side facing inwards, wrapped in aluminium foil,
www.atmos-meas-tech.net/8/125/2015/ Atmos. Meas. Tech., 8, 125–147, 2015

128 K. E. Yttri et al.: An intercomparison study of analytical methods used for quantification
31
Figures
Figure 1: Schematic drawing illustrating the subdivision of one of the six filter samples
subjected to the intercomparison. The square in sector 16 illustrates the 1.0 cm2 punch taken
from each of the 16 sectors pr. filter sample to perform a homogeneity test of the filter samples.
Each of the sectors sent out to the participating laboratories had an exposed filter area of 8.6
cm2; i.e., when accounting for the removal of the 1.0 cm2 punch.
Figure 1. Schematic drawing illustrating the subdivision of one of
the six filter samples subjected to the intercomparison. The square
in sector 16 illustrates the 1.0 cm2 punch taken from each of the 16
sectors per filter sample to perform a homogeneity test of the filter
samples. Each of the sectors sent out to the participating laboratories
had an exposed filter area of 8.6 cm2, i.e. when accounting for the
removal of the 1.0 cm2 punch.
put in a zip-lock polyethylene bag and stored in a freezer
at −18 ◦C to prevent any form of degradation of the ana-
lytes. Two field blanks were collected, which were treated in
exactly the same manner regarding handling, transport and
storage as the filters being exposed.
Each of the sampled filter samples was divided into 16
equally large sectors, providing a total of 96 sectors, each
with an exposed area of 9.6 cm2. A 1.0 cm2 punch was taken
from each of the 16 sectors to perform a homogeneity test
of the filters subjected to the intercomparison (Sect. 2.4.1).
Hence, each of the sectors sent to the participating laborato-
ries had an exposed filter area of 8.6 cm2 (Fig. 1).
Each sector was given a number, which combined with the
filter sample identification gave the sector a unique identifi-
cation. The sectors were then assigned to the participating
laboratories following a randomising approach.
For shipment, each sector was wrapped in aluminium foil
and placed in a petri slide. The six petri slides, to be received
by each of the participating laboratories, were placed in a
zip-lock polyethylene bag and sent in an envelope to the par-
ticipants by mail. Those receiving the samples were directed
to store them in a freezer at −18 ◦C until analysis. The dead-
line for reporting the results was set to be within 70 days after
shipment.
2.3 The data set – background, scope and application
Fifteen laboratories located in twelve different European
countries reported their interest in the current intercompar-
ison exercise and received sectors from the filter samples for
analysis. Two of the fifteen laboratories did not submit re-
sults. Hence, the results presented in the current study are
based on the results of thirteen different laboratories. All thir-
teen laboratories reported levels for levoglucosan, whereas
nine reported levels for mannosan and galactosan. Eight of
thirteen laboratories reported levels for all three isomers,
whereas one reported for levoglucosan and mannosan, and
one for levoglucosan and galactosan.
A brief overview of the various analytical methods used
by the participating laboratories in the current intercompar-
ison is provided in Table 1, including information about the
method’s capability to separate the isomeric compounds lev-
oglucosan, mannosan and galactosan, the method’s limit of
detection (LOD), the instrument being used for separation
and detection of the analytes, the solvent(s) used for ex-
traction and whether derivatisation of the analytes was ap-
plied. Complementary information can be found in Table B1,
including extraction procedure, derivatisation agent and re-
covery standard. A full description of the various analytical
methods can be found in Appendix A: in Sect. A1 for those
using HPAEC, Sect. A2 for those using HPLC and ultra-
performance liquid chromatography (UPLC) and Sect. A3
for those applying GC.
All of the major methods used for analysis of levoglu-
cosan, mannosan and galactosan in ambient aerosol filter
samples, and which have been reported in the scientific lit-
erature so far, are represented in the present intercompari-
son. This adds additional strength to any conclusion to be
drawn from the study. In addition, the descriptions of the
various methods show that none of them can be considered
completely identical; i.e. they differ to a large extent with
respect to crucial parameters, such as extraction procedure
and derivatisation agent, to fulfil such a criterion. This, how-
ever, brings an important asset to the intercomparison, as the
goal is to evaluate the comparability of the great diversity of
analytical methods used for analysis of levoglucosan, man-
nosan and galactosan in ambient aerosol filter samples. On
the contrary, this great diversity prevents comparison of the
performance of different subclasses of analytical methods,
e.g. GC-based versus LC-based methods.
2.4 Quality assurance
2.4.1 Homogenity of filter samples
A uniformity test was performed to ensure that the two co-
located filter samplers generated samples with a homogenous
distribution of the analytes.
Each of the six filter samples analysed in the intercompar-
ison were divided into 16 equally large sectors. From each
Atmos. Meas. Tech., 8, 125–147, 2015 www.atmos-meas-tech.net/8/125/2015/
K. E. Yttri et al.: An intercomparison study of analytical methods used for quantification 129
Table 1. Overview and short description of the analytical methods used by the participating laboratories in the present intercomparison,
including the method’s capability for isomer separation, the method’s limit of detection (LOD), the instrument used for separation and
detection of the analytes, the solvent(s) used for extraction and whether derivatisation of the analytes was applied.
Lab no. Isomer LOD Instrument Solvent Derivatisation
separation (ng m−3)1
1 Yes 0.28 HPLC–HR-TOFMS (ESI-) tetrahydrofuran No
2 Yes 2.2 IC–QMS (ESI-) deionised H2O No
3 Yes 5.0 HPAEC–PAD deionised H2O No
4 Yes 0.05 GC–MS methanol Yes
5 No 0.05 GC–QMS dichloromethane/methanol Yes
6 Yes 1.8 LC–MS (ESI+) methanol No
7 Yes 0.004 HPAEC–PAD deionised H2O No
8 Yes 3.0 LC–MS-MS (ESI-) deionised H2O No
9 Yes 0.02 GC–MS dichloromethane/methanol Yes
10 Yes 0.19 UPLC–MS-MS deionised H2O/methanol No
11 Yes 0.02 GC–MS dichloromethane/methanol Yes
12 Yes 0.004 TD-GC-TOFMS none Yes
13 Yes 0.05 GC-QMS dichloromethane/methanol Yes
LOD calculated for an air volume of 2.3 m3 h−1 for 24 hours and an exposed filter area of 12 cm2. For explanation of abbreviations see Table C1.
sector one 1.0 cm2 punch was taken and subjected to levoglu-
cosan, mannosan and galactosan analysis using the analytical
method applied by lab. 1 (See Appendix A for a detailed de-
scription of the analytical methods used by the participating
laboratories), i.e. a total of 96 analyses were performed for
each of the three isomers. The results from this uniformity
test are shown in Table B2 and are briefly summarised as fol-
lows.
For levoglucosan, the mean relative standard deviation
(RSD) for all six filter samples was 11± 2.7 %. The highest
RSD was observed for filter sample 3 (16 %) and the lowest
for filter sample 2 (9.1 %). For mannosan, the mean RSD was
19± 9.9 %, with the lowest RSD for filter sample 1 (10 %)
and the highest for filter sample 4 (35 %). For galactosan,
the mean RSD was 24± 15 %, with the lowest RSD for filter
sample 2 (11 %) and the highest for filter sample 3 (45 %).
Note that the percentage provided for the RSD also includes
the uncertainty of the analytical method (which is < 5 %);
hence, the filter homogeneity is in fact up to 5 % lower than
that stated above. Two outliers were detected for galactosan
(one in filter sample 4 and one in filter sample 5) and one for
mannosan (filter sample 5), when running the Grubbs test for
outliers. These outliers did not affect the results of the inter-
comparison, as the sectors from which they were taken were
sent out to laboratories which either did not submit results at
all or which did not submit results for mannosan (lab. 13), or
the sector was not assigned to any of the participating labo-
ratories. Consequently, the results from the homogeneity test
demonstrate that the collected filter samples are sufficiently
homogenous to be used for an intercomparison.
Finally, it can be questioned to which extent a 1.0 cm2
punch from each sector is representative for addressing the
homogeneity of the filter samples as it accounts for no more
than 10 % of the total exposed filter area. However, the size of
the punch used for the homogeneity test should not compro-
mise the participation of laboratories using analytical meth-
ods with detection limits varying over a wide range.
2.4.2 Outliers – Grubbs test
The Grubbs test was used to detect outliers amongst the re-
sults submitted by the various laboratories. For levoglucosan,
one outlier was detected for filter samples 1 and 2 and both
were reported by the same laboratory (lab. 7). For galactosan,
one outlier was detected for each of the six filter samples and
all were reported by the same laboratory (lab. 9). No out-
liers were observed for mannosan. Values defined as outliers
were excluded from calculation of the theoretical median
value, but included in the measured arithmetic mean value
(see Sect. 2.5 for explanation of theoretical and measured
value).
2.4.3 Samples with levels below limit of detection
Two laboratories (labs. 3 and 8) reported values of galac-
tosan below the established detection limit of their analyti-
cal method for filter samples 3–6. These values were not in-
cluded in the calculated theoretical median value nor in the
measured mean value.
2.5 Calculation of the analytical methods performance
The outcomes of the intercomparison are presented in
Figs. 2–4 as aggregated results, whereas the aggregated data
reported by the laboratories, which are used as input for
Figs. 2–4, are listed in Table B3. The results are presented
in terms of the percentage error (PE); i.e. the PE was calcu-
www.atmos-meas-tech.net/8/125/2015/ Atmos. Meas. Tech., 8, 125–147, 2015
130 K. E. Yttri et al.: An intercomparison study of analytical methods used for quantification
32
Figure 2: Calculated mean percentage error (PE) for each of the thirteen laboratories reporting
levels of levoglucosan in the current intercomparison. The PE was calculated according to eq.
1 (Section 2.5) for each of the six sectors received by the participating laboratories. The mean
PE for each laboratory accounts for the PE calculated for all six sectors. The laboratory number,
ranging from 1-13, the analytical method and solvent used for extraction are mentioned at the
right of the figure.
Figure 2. Calculated mean percentage error (PE) for each of the
thirteen laboratories reporting levels of levoglucosan in the cur-
rent intercomparison. The PE was calculated according to Eq. (1)
(Sect. 2.5) for each of the six sectors received by the participating
laboratories. The mean PE for each laboratory accounts for the PE
calculated for all six sectors. The laboratory number, ranging from
1–13, the analytical method and solvent used for extraction are men-
tioned at the right of the figure.
33
Figure 3: Calculated mean percentage error (PE) for each of the nine laboratories reporting
levels of mannosan in the current intercomparison. The PE was calculated according to eq. 1
(Section 2.5) for each of the six sectors received by the participating laboratories. The mean PE
for each laboratory accounts for the PE calculated for all six sectors. The laboratory number,
ranging from 1-13, the analytical method and solvent used for extraction are mentioned at the
right of the figure.
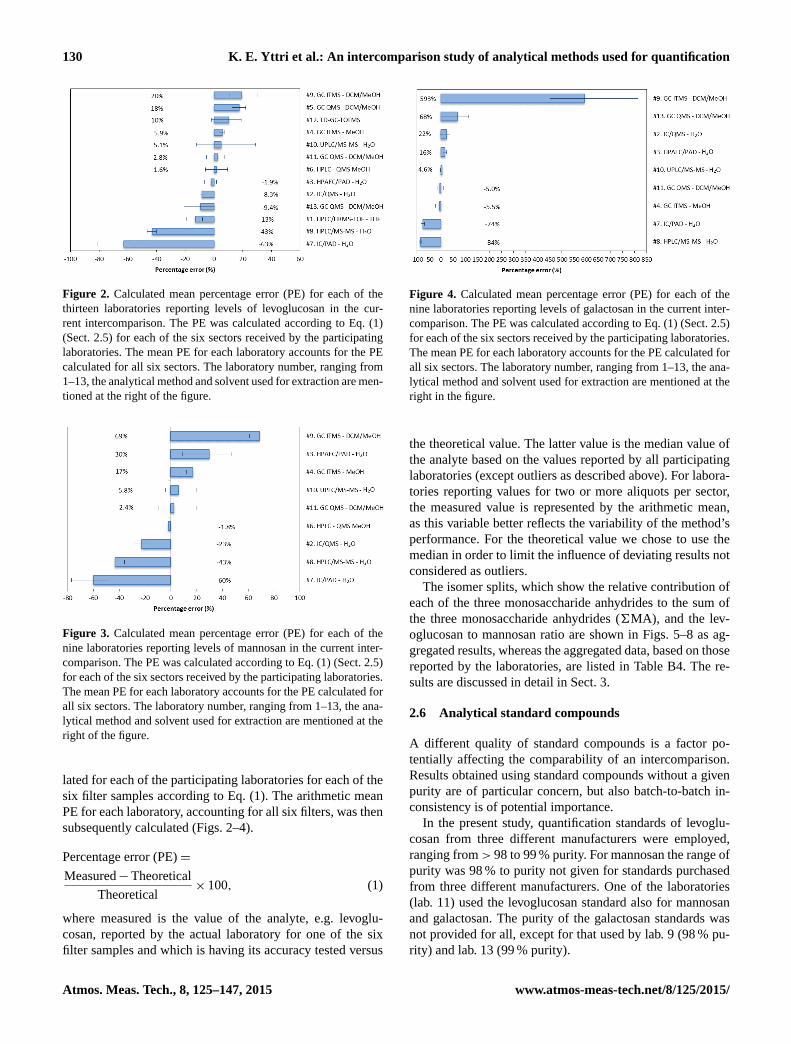
Figure 3. Calculated mean percentage error (PE) for each of the
nine laboratories reporting levels of mannosan in the current inter-
comparison. The PE was calculated according to Eq. (1) (Sect. 2.5)
for each of the six sectors received by the participating laboratories.
The mean PE for each laboratory accounts for the PE calculated for
all six sectors. The laboratory number, ranging from 1–13, the ana-
lytical method and solvent used for extraction are mentioned at the
right of the figure.
lated for each of the participating laboratories for each of the
six filter samples according to Eq. (1). The arithmetic mean
PE for each laboratory, accounting for all six filters, was then
subsequently calculated (Figs. 2–4).
Percentage error (PE)=
Measured−Theoretical
Theoretical× 100, (1)
where measured is the value of the analyte, e.g. levoglu-
cosan, reported by the actual laboratory for one of the six
filter samples and which is having its accuracy tested versus
34
Figure 4: Calculated mean percentage error (PE) for each of the nine laboratories reporting
levels of galactosan in the current intercomparison. The PE was calculated according to eq. 1
(Section 2.5) for each of the six sectors received by the participating laboratories. The mean PE
for each laboratory accounts for the PE calculated for all of the six sectors. The laboratory
number, ranging from 1-13, the analytical method and solvent used for extraction are mentioned
at the right in the figure.
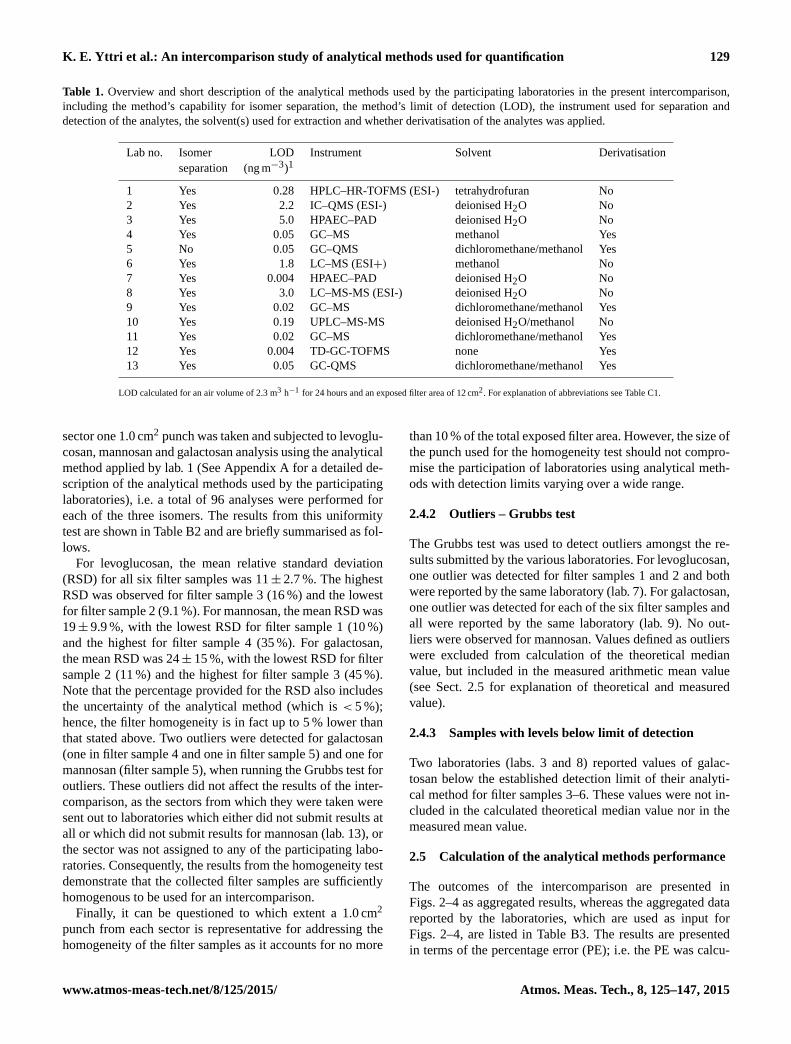
Figure 4. Calculated mean percentage error (PE) for each of the
nine laboratories reporting levels of galactosan in the current inter-
comparison. The PE was calculated according to Eq. (1) (Sect. 2.5)
for each of the six sectors received by the participating laboratories.
The mean PE for each laboratory accounts for the PE calculated for
all six sectors. The laboratory number, ranging from 1–13, the ana-
lytical method and solvent used for extraction are mentioned at the
right in the figure.
the theoretical value. The latter value is the median value of
the analyte based on the values reported by all participating
laboratories (except outliers as described above). For labora-
tories reporting values for two or more aliquots per sector,
the measured value is represented by the arithmetic mean,
as this variable better reflects the variability of the method’s
performance. For the theoretical value we chose to use the
median in order to limit the influence of deviating results not
considered as outliers.
The isomer splits, which show the relative contribution of
each of the three monosaccharide anhydrides to the sum of
the three monosaccharide anhydrides (6MA), and the lev-
oglucosan to mannosan ratio are shown in Figs. 5–8 as ag-
gregated results, whereas the aggregated data, based on those
reported by the laboratories, are listed in Table B4. The re-
sults are discussed in detail in Sect. 3.
2.6 Analytical standard compounds
A different quality of standard compounds is a factor po-
tentially affecting the comparability of an intercomparison.
Results obtained using standard compounds without a given
purity are of particular concern, but also batch-to-batch in-
consistency is of potential importance.
In the present study, quantification standards of levoglu-
cosan from three different manufacturers were employed,
ranging from> 98 to 99 % purity. For mannosan the range of
purity was 98 % to purity not given for standards purchased
from three different manufacturers. One of the laboratories
(lab. 11) used the levoglucosan standard also for mannosan
and galactosan. The purity of the galactosan standards was
not provided for all, except for that used by lab. 9 (98 % pu-
rity) and lab. 13 (99 % purity).
Atmos. Meas. Tech., 8, 125–147, 2015 www.atmos-meas-tech.net/8/125/2015/
K. E. Yttri et al.: An intercomparison study of analytical methods used for quantification 131
35
Figure 5: Calculated mean percentage error (PE) for each of the eight laboratories for which
the levoglucosan to MA ratio could be derived. The PE was calculated according to eq. 1
(Section 2.5) for each of the six sectors received by the participating laboratories. The mean PE
for each laboratory accounts for the PE calculated for all of the six sectors. The laboratory
number, ranging from 1-13, the analytical method and solvent used for extraction are mentioned
at the right of the figure.
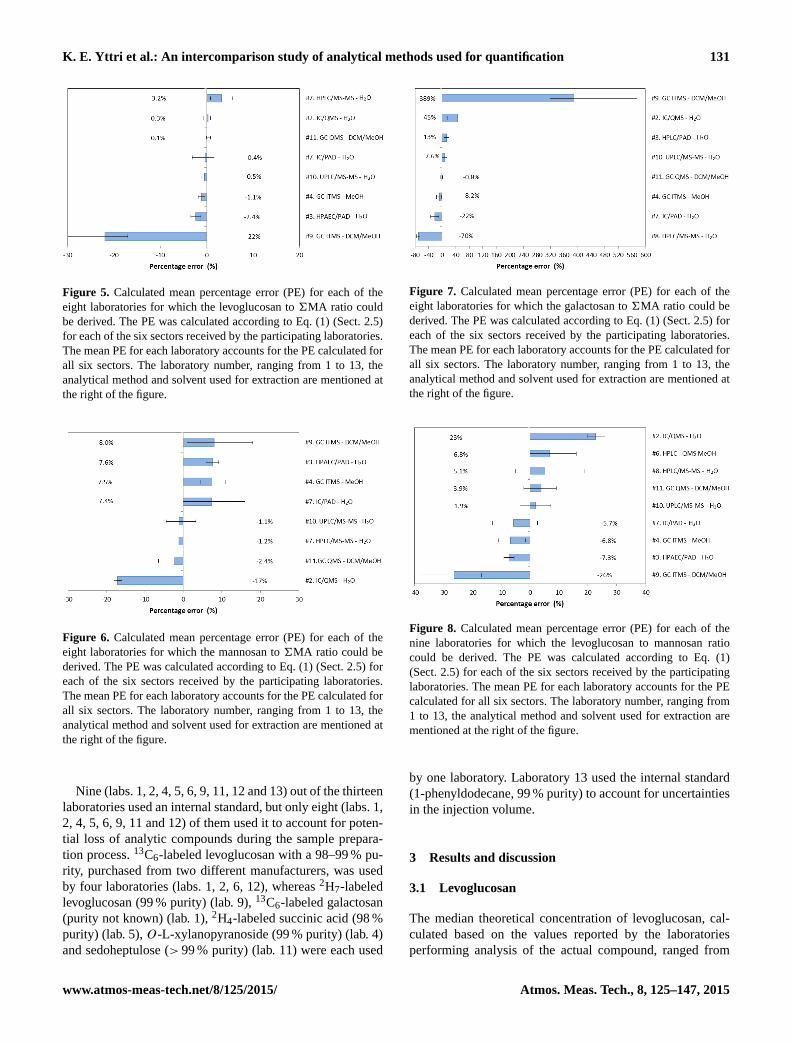
Figure 5. Calculated mean percentage error (PE) for each of the
eight laboratories for which the levoglucosan to 6MA ratio could
be derived. The PE was calculated according to Eq. (1) (Sect. 2.5)
for each of the six sectors received by the participating laboratories.
The mean PE for each laboratory accounts for the PE calculated for
all six sectors. The laboratory number, ranging from 1 to 13, the
analytical method and solvent used for extraction are mentioned at
the right of the figure.
36
Figure 6: Calculated mean percentage error (PE) for each of the eight laboratories for which
the mannosan to MA ratio could be derived. The PE was calculated according to eq. 1 (Section
2.5) for each of the six sectors received by the participating laboratories. The mean PE for each
laboratory accounts for the PE calculated for all of the six sectors. The laboratory number,
ranging from 1-13, the analytical method and solvent used for extraction are mentioned at the
right of the figure.
Figure 6. Calculated mean percentage error (PE) for each of the
eight laboratories for which the mannosan to 6MA ratio could be
derived. The PE was calculated according to Eq. (1) (Sect. 2.5) for
each of the six sectors received by the participating laboratories.
The mean PE for each laboratory accounts for the PE calculated for
all six sectors. The laboratory number, ranging from 1 to 13, the
analytical method and solvent used for extraction are mentioned at
the right of the figure.
Nine (labs. 1, 2, 4, 5, 6, 9, 11, 12 and 13) out of the thirteen
laboratories used an internal standard, but only eight (labs. 1,
2, 4, 5, 6, 9, 11 and 12) of them used it to account for poten-
tial loss of analytic compounds during the sample prepara-
tion process. 13C6-labeled levoglucosan with a 98–99 % pu-
rity, purchased from two different manufacturers, was used
by four laboratories (labs. 1, 2, 6, 12), whereas 2H7-labeled
levoglucosan (99 % purity) (lab. 9), 13C6-labeled galactosan
(purity not known) (lab. 1), 2H4-labeled succinic acid (98 %
purity) (lab. 5), O-L-xylanopyranoside (99 % purity) (lab. 4)
and sedoheptulose (> 99 % purity) (lab. 11) were each used
37
Figure 7: Calculated mean percentage error (PE) for each of the eight laboratories for which
the galactosan to MA ratio could be derived. The PE was calculated according to eq. 1 (Section
2.5) for each of the six sectors received by the participating laboratories. The mean PE for each
laboratory accounts for the PE calculated for all six sectors. The laboratory number, ranging
from 1-13, the analytical method and solvent used for extraction are mentioned at the right of
the figure.
Figure 7. Calculated mean percentage error (PE) for each of the
eight laboratories for which the galactosan to 6MA ratio could be
derived. The PE was calculated according to Eq. (1) (Sect. 2.5) for
each of the six sectors received by the participating laboratories.
The mean PE for each laboratory accounts for the PE calculated for
all six sectors. The laboratory number, ranging from 1 to 13, the
analytical method and solvent used for extraction are mentioned at
the right of the figure.
38
Figure 8: Calculated mean percentage error (PE) for each of the nine laboratories for which the
levoglucosan to mannosan ratio could be derived. The PE was calculated according to eq. 1
(Section 2.5) for each of the six sectors received by the participating laboratories. The mean PE
for each laboratory accounts for the PE calculated for all of the six sectors. The laboratory
number, ranging from 1-13, the analytical method and solvent used for extraction are mentioned
at the right of the figure.
Figure 8. Calculated mean percentage error (PE) for each of the
nine laboratories for which the levoglucosan to mannosan ratio
could be derived. The PE was calculated according to Eq. (1)
(Sect. 2.5) for each of the six sectors received by the participating
laboratories. The mean PE for each laboratory accounts for the PE
calculated for all six sectors. The laboratory number, ranging from
1 to 13, the analytical method and solvent used for extraction are
mentioned at the right of the figure.
by one laboratory. Laboratory 13 used the internal standard
(1-phenyldodecane, 99 % purity) to account for uncertainties
in the injection volume.
3 Results and discussion
3.1 Levoglucosan
The median theoretical concentration of levoglucosan, cal-
culated based on the values reported by the laboratories
performing analysis of the actual compound, ranged from
www.atmos-meas-tech.net/8/125/2015/ Atmos. Meas. Tech., 8, 125–147, 2015

132 K. E. Yttri et al.: An intercomparison study of analytical methods used for quantification
552 ng cm−2 (filter sample 6) to 1765 ng cm−2 (filter sample
1) (Table B3). This range corresponds to an ambient concen-
tration of levoglucosan ranging from 120 to 384 ng m−3, as-
suming a typical low-volume sampler operating at a flow rate
of 2.3 m3 min−1 for 24 h, assuming an exposed filter area of
12 cm2. This is within the range (60–900 ng m−3) observed
for European urban areas during wintertime sampling, as re-
ported by Szidat et al. (2009).
For the laboratories extracting, analyzing and reporting
values for two or more aliquots per sector, the repeatability
was on average 4.5± 2.9 %. The repeatability exceeded 10 %
for three of the 54 sectors, each of the three being analysed
by different laboratories (labs. 1, 3 and 13).
From Fig. 2 it can be seen that the mean PE for the
various analytical methods ranged from −63 to 20 %, i.e.
reflecting the accuracy of the various methods. The low-
est mean PE was seen for lab. 7, for which two outliers
were detected. When excluding these results from the cal-
culation, the mean PE for lab. 7 improved from −63 to
−54 %, and thus also the total range including all the meth-
ods. The mean PE was within ±10 % for eight (labs. 2,
3, 4, 6, 10, 11, 12 and 13) of the thirteen laboratories,
i.e. for 62 % of the laboratories, which should be consid-
ered a narrow range, and within ±20 % for eleven (labs. 1,
2, 3, 4, 5, 6, 9, 10, 11, 12, 13) of the thirteen laborato-
ries, corresponding to 85 %. Indeed, the accuracy reported
for levoglucosan analysis is only slightly lower than the re-
sults reported for analysis of SO2−4 on filter samples dur-
ing the latest intercomparison (intercomparison number 30)
organised by EMEP (Co-operative programme for moni-
toring and evaluation of the long-range transmissions of
air pollutants in Europe) (http://www.nilu.no/projects/ccc/
intercomparison/DQO-luft-30.pdf); i.e. an accuracy ranging
from −23 to 40 % for the entire data set of 64 laboratories,
and from −6 to 5 % for the subselection accounting for 62 %
of the laboratories. SO2−4 in aerosol filter samples has been
analysed by numerous laboratories for several decades, typi-
cally by ion chromatography, and should be considered as a
fairly easy constituent to analyse. Hence, the comparable re-
sults obtained for levoglucosan with respect to accuracy are
encouraging.
In Figs. 2–4 the error bars represent the minimum and the
maximum PE observed for the six samples analysed with the
respective analytical method. Hence, the range is a measure
of the variability of the analytical method; i.e. the smaller
the range, the better. For levoglucosan the variability ranged
from 3.2 to 41 %. Two of the laboratories had a mean PE
exceeding −40 %. For lab. 7 the low accuracy was accom-
panied by a large variability (30 %), whereas this was not
the case for lab. 8 (6.5 %). For lab. 7 the combination of a
low accuracy and a large variability could suggest an instru-
ment malfunction rather than a flaw in the analytical method
used. However, two of the samples reported by this labo-
ratory were outliers, and when excluded from the calcula-
tion, the variability improved substantially (i.e. a variability
of 5 %); thus, a systematic underestimation could not be ex-
cluded. It should be noted that lab. 7 later found that their in-
strument suffered from a technical problem that caused a ran-
dom loss of signals during the sample analysis. Subsequent
tests revealed that previous injections of high salt-containing
samples (i.e. seawater) had contaminated the instrument. The
problem was resolved by a rigorous cleaning of instrument
components, including working electrode, tubing and fit-
tings. Nevertheless, only two of the samples reported by this
laboratory were considered outliers when tested; hence, the
results reported from this laboratory should be included in
the current data set. There were also other laboratories ex-
periencing difficulties of various categories during the inter-
comparison; e.g. lab. 1 experienced possible ion suppression,
mainly of levoglucosan, which was not previously observed
using the actual method, causing negatively biased concen-
trations as well as deviating isomer splits. Furthermore, other
analytic methods used in the current intercomparison could
be affected by flaws as well, except that they have passed un-
seen. Thus, selectively removing data from the intercompari-
son when being aware of certain problems for one laboratory
but not for others cannot easily be done without introducing
additional flaws to the data set.
Despite the fact that the great diversity of the analytical
methods prevents us from comparing the performance of
different subclasses of analytical methods, it cannot be ne-
glected that a certain pattern emerges from Fig. 2. Five out
of the six GC-based methods participating in the intercom-
parison had a mean PE above the theoretical value, ranging
from 2.8 to 20 %. Furthermore, four of these five GC methods
were based on the approach initially developed in the USA,
which subsequently has been adopted by European research
laboratories, involving separation by GC, detection by mass
spectrometry, extraction by methanol or dichloromethane, or
a combination of the two, as well as derivatisation to im-
prove the (gas) chromatographic behaviour of the analyte.
Despite a certain variation between laboratories, the general
approach outlined above is by far the most commonly used
one for analyzing levoglucosan within the research commu-
nity and it also has the longest record of use. Hence, refine-
ment and experience in using this method is expected to be
more extensive than for the more recently developed LC and
ion chromatography (IC) methods, for which the mean PE
was below the theoretical value for five of seven methods
(−63 to −1.9 %) (Fig. 2). Consequently, we should not ex-
clude the possibility that the experience associated with a
more widespread analytical method could have a profound
influence on the observed pattern, and that this might be an
equally important factor as any differences attributed to the
choice of the analytical method itself. Given that the more
recently developed LC and IC methods have been taken into
service on a wider scale than at the time of the current inter-
comparison, a follow-up intercomparison should address any
potential change in the pattern seen in Fig. 2 of the current
study.
Atmos. Meas. Tech., 8, 125–147, 2015 www.atmos-meas-tech.net/8/125/2015/

K. E. Yttri et al.: An intercomparison study of analytical methods used for quantification 133
3.2 Mannosan
The median theoretical concentration of mannosan, cal-
culated based on the values reported by the laboratories
performing analysis of the actual compound, ranged from
80 ng cm−2 (filter sample 4) to 300 ng cm−2 (filter sample
1). This range corresponds to an ambient concentration of
mannosan ranging from 17 to 65 ng m−3, assuming a typical
low-volume sampler operating at a flow rate of 2.3 m3 h−1
for 24 h, assuming an exposed filter area of 12 cm2.
For the laboratories extracting, analyzing and reporting
values of mannosan for two or more aliquots per sample, the
repeatability was on average 5.2± 3.9 %. The repeatability
exceeded 10 % for three of the 36 samples, and was reported
by two different laboratories (labs. 8 and 9).
The mean PE, representing the accuracy, ranged from−60
to 69 % for the various analytical methods reporting values
for mannosan (Fig. 3). This range is noticeably wider than
that seen for levoglucosan (−63 to 20 %), and whereas 62 %
of the laboratories reported a mean PE within±10 % for lev-
oglucosan, the corresponding percentage for mannosan was
only 33 (i.e. for labs. 6, 10 and 11); 55 % of the laboratories
reported a mean PE within ±23 % for mannosan (labs. 2, 4,
6, 10 and 11).
As described in Sect. 4.1, the error bars in Figs. 2–4 rep-
resent the minimum and the maximum PE observed for the
actual analytical method, and thus the range is a measure
of the variability of the analytical method. For mannosan
the variability ranged from 9.3 to 38 %, which is a slightly
smaller range than that seen for levoglucosan. For five of the
nine laboratories (labs. 2, 3, 4, 8 and 11) reporting values for
both levoglucosan and mannosan the variability was substan-
tially higher, i.e. a factor of 2–6 for mannosan compared to
levoglucosan. For two of the laboratories the difference was
only minor (lab. 9) or non-existent (lab. 7), whereas labs. 6
and 10 had a slightly lower variability for mannosan com-
pared to levoglucosan.
The three GC-based methods used to determine levels of
mannosan had a mean PE above the theoretical value, rang-
ing from 2.4 to 69 %, thus reflecting the general pattern seen
for levoglucosan, whereas it ranged from below to above the
theoretical values for the LC-based and IC-based methods.
3.3 Galactosan
The median theoretical concentration of galactosan, cal-
culated based on the values reported by the laboratories
performing analysis of the actual compound, ranged from
31 ng cm−2 (filter sample 6) to 90 ng cm−2 (filter sample 1).
This range corresponds to an ambient concentration of galac-
tosan ranging from 7 to 20 ng m−3, assuming a typical low-
volume sampler operating at a flow rate of 2.3 m3 h−1 for
24 h, assuming an exposed filter area of 12 cm2.
For the laboratories extracting, analyzing and reporting
values for two or more aliquots per sample, the repeatabil-
ity was on average 8.5± 11 %. The repeatability exceeded
10 % for eleven of the 34 samples, and was reported by five
different laboratories (labs. 2, 3, 8, 9 and 11).
The mean PE, representing the accuracy, ranged from−84
to 593 % for the various analytical methods reporting values
for galactosan. This range is noticeably wider than that seen
for both levoglucosan (−63 to 20 %) and mannosan (−60 to
69 %). The very high mean PE (593 %) seen for lab. 9 is con-
sistent with the finding that all values of galactosan reported
by this laboratory were found to be outliers. When excluding
these data from the calculation, the mean PE range is sub-
stantially narrowed (−84–68 %), but it is still wider than for
the two other isomers. Excluding the two outliers reported
by lab. 7 did not have an influence on the mean PE range
including all laboratories, and it only marginally improved
the mean PE for lab. 7, going from −74 to −70 %; 33 % of
the laboratories (labs. 4, 10, and 11) reported a mean PE for
galactosan within ±10 %. This equals the percentage found
for mannosan, but it is substantially lower than that observed
for levoglucosan (62 %); 55 % of the laboratories (labs. 2, 3,
4, 10, and 11) reported a mean PE within ±22 % for galac-
tosan. It should be noted that for labs. 3 and 8, the mean PE
is based on the results from only two of the six filter samples,
as the value was found to be below the detection limit (BDL)
for the other four.
As previously described (Sects. 4.1 and 4.2), the error bars
in Figs. 2–4 represent the minimum and the maximum PE ob-
served for the actual analytical method, and thus are a mea-
sure of the variability. For galactosan the variability ranged
from 6 to 364 % when including all laboratories. For the sub-
selection of laboratories not influenced by outliers or levels
below the detection limit, the variability ranged from 16 to
112 %. For the latter subcategory of laboratories the variabil-
ity for galactosan was better than that seen for mannosan for
two of the laboratories (labs. 10 and 11) and poorer for the
two others (labs. 2 and 4). For lab. 10, the variability was no-
ticeably better for galactosan (16 %) also when compared to
levoglucosan (41 and 31 % for levoglucosan and mannosan,
respectively).
3.4 Relative contribution of levoglucosan, mannosan
and galactosan to the sum of the three isomeric
compounds (6MA)
3.4.1 Levoglucosan to 6MA ratio
The median theoretical relative contribution of levoglucosan
to 6MA ranged from 81 to 83 % for the eight laboratories
from which this ratio could be derived (Table B4); i.e. labo-
ratories not affected by outliers of any of the three isomers or
by levels below detection limit (Table B3). The levoglucosan
to 6MA ratio did not vary substantially between the labo-
ratories included in the above-mentioned subcategory. The
largest difference was observed for filter sample 1 for which
lab. 3 and lab. 10 reported a value of 81 % and lab. 8 a value
www.atmos-meas-tech.net/8/125/2015/ Atmos. Meas. Tech., 8, 125–147, 2015

134 K. E. Yttri et al.: An intercomparison study of analytical methods used for quantification
of 87 %. This rather small difference is to be expected given
that levoglucosan is by far the major MA of the three iso-
meric compounds reported in the literature. Lab. 7 reported
values of levoglucosan for filter samples 1 and 2, which were
found to be outliers; however, the levoglucosan to 6MA ra-
tio for these two filter samples (80 %) did not differ substan-
tially from that of filter samples 3–6 (82–84 %) nor from the
subcategory not affected by outliers. For lab. 9 the levoglu-
cosan to 6MA ratio ranged from 57 to 69 %, which is sub-
stantially lower than for the other laboratories. Indeed, lab. 9
reported levels of galactosan for filter samples 1–6, which
all were found to be outliers, and a markedly high mean PE
for galactosan of 593 % (Fig. 4). Laboratory 9 also reported
the highest mean concentration of mannosan, with a mean
PE of 69 % (Fig. 3). Despite the fact that lab. 9 also reported
the highest mean concentration of levoglucosan, the mean
PE (20 %) was lower for this isomer than for the two others;
hence, the lower levoglucosan to 6MA ratios seen for lab. 9
can likely be attributed to an overestimation of mannosan and
galactosan.
The mean PE, representing the accuracy, ranged from−22
to 3.2 % for the various laboratories for which the levoglu-
cosan to 6MA could be derived (Fig. 5). When excluding
lab. 9, which reported outliers for filter samples 1–6 with re-
spect to galactosan, this range is substantially reduced (−2.4
to 3.2 %). Excluding the two outliers detected for lab. 7 only
had a minor effect on the mean PE for the actual laboratory,
going from −0.4 to −0.6 %.
As described in Sects. 4.1–4.3, the error bars in Figs. 2–8
represent the minimum and the maximum PE observed for
the actual analytical method, and thus are a measure of the
method’s variability. For the levoglucosan to 6MA ratio the
variability ranged from 0.9 to 13 % when including all lab-
oratories. For the subselection of laboratories not influenced
by outliers, the variability ranged from 0.9 to 4.8 %.
3.4.2 Mannosan to 6MA ratio
The median theoretical relative contribution of mannosan
to 6MA ranged from 13 to 14 % for the laboratories from
which this ratio could be derived; i.e. laboratories not af-
fected by outliers of either of the three isomers or by lev-
els below the detection limit. The mannosan to 6MA ratio
did not vary substantially between the laboratories included
in the above-mentioned subcategory. The largest difference
was observed for filter sample 1 for which lab. 2 reported
a value of 11 % and labs. 1 and 3 a value of 15 %. Lab. 7
reported values of levoglucosan for filter samples 1 and 2,
which were considered outliers, hence, potentially affecting
the 6MA value and the mannosan to 6MA ratio. The man-
nosan to 6MA ratio for these two filter samples (16 %) did
not differ substantially from that of filter samples 3–6 (13–
16 %), while they were slightly higher compared to the sub-
category not affected by outliers. Lab. 9 reported levels of
galactosan for filter samples 1–6 which all were considered
to be outliers; however, the mannosan to 6MA ratio (14–
17 %) did not experience a similar decrease as the levoglu-
cosan to 6MA ratio due to the substantially elevated con-
centrations of galactosan; on the contrary, they were in the
upper range and above that seen for the subcategory not af-
fected by outliers; i.e. the mean PE of 69 % seen for lab. 9
with respect to mannosan seems to have counteracted this.
The mean PE, representing the accuracy, ranged from−17
to 8 % for the various laboratories for which the mannosan
to 6MA could be derived (Fig. 6). Excluding lab. 9, which
reported outliers for filter samples 1–6 with respect to galac-
tosan, and lab. 7, which reported outliers for filters 1 and 2
for levoglucosan, did not have an influence on the reported
range. Excluding the two outliers detected for lab. 7 im-
proved the mean PE for the actual laboratory from 7.4 to
3.4 %.
As previously described, the error bars in Figs. 2–8 rep-
resent the minimum and the maximum PE observed for the
actual analytical method, and thus are a measure of the
method’s variability. For the mannosan to 6MA ratio the
variability ranged from 2 to 20 % when including all lab-
oratories. The range did not change for the subselection of
laboratories not influenced by outliers.
3.4.3 Galactosan to 6MA ratio
The median theoretical relative contribution of galactosan to
6MA ranged from 3.9 to 5.0 % for the laboratories from
which this ratio could be derived; i.e. laboratories not af-
fected by outliers of either of the three isomers or by lev-
els below the detection limit. The galactosan to 6MA ra-
tio varied more between laboratories than seen for the two
other isomers considering the above-mentioned subcategory.
The largest difference was observed for filter sample 1 for
which lab. 2 reported a value of 6.3 % and lab. 8 a value of
1.0 %. Lab. 7 reported values of levoglucosan for filter sam-
ples 1 and 2, which were considered outliers, hence, poten-
tially affecting the 6MA value and the galactosan to 6MA
ratio. The mannosan to 6MA ratio for these two filter sam-
ples (3.5–3.6 %) was in the upper range of that seen for filter
samples 3–6 (2.6–3.5 %), whereas they were slightly lower
compared to the subcategory not affected by outliers. Lab.
9 reported levels of galactosan for filter samples 1–6 which
all were found to be outliers. The elevated levels reported by
lab. 9 with respect to galactosan also had an effect on the
galactosan to6MA ratio, which ranged from 17 to 27 %, be-
ing substantially higher than for the subcategory not affected
by outliers.
The mean PE, representing the accuracy, ranged from−70
to 389 % for the various laboratories for which the galac-
tosan to 6MA could be derived (Fig. 7). Excluding lab. 9,
which reported outliers for filter samples 1–6 with respect
to galactosan, substantially narrowed the range (−70–45 %),
whereas no change was observed when excluding lab. 7,
which reported outliers for filter samples 1 and 2 for levoglu-
Atmos. Meas. Tech., 8, 125–147, 2015 www.atmos-meas-tech.net/8/125/2015/

K. E. Yttri et al.: An intercomparison study of analytical methods used for quantification 135
cosan. Excluding the two outliers detected for lab. 7 changed
the mean PE for the actual laboratory from −22 to −26 %.
It should be noted that for lab. 8, the mean PE (−70 %) is
based on filter samples 1 and 2 only, as galactosan for filter
samples 3–6 was found to be below the detection limit.
The error bars in Figs. 2–8 represent the minimum and the
maximum PE observed for the actual analytical method, and
thus are a measure of the method’s variability. For the galac-
tosan to 6MA ratio the variability ranged from 6 to 257 %
when including all laboratories. The range was substantially
narrowed (6–56 %) when excluding lab. 9, which reported
outliers for filter samples 1–6 with respect to galactosan. Ex-
cluding lab. 7, which reported outliers for filter samples 1 and
2 for levoglucosan, did not have an effect on the total range.
3.5 The levoglucosan to mannosan ratio
The levoglucosan to mannosan ratio is occasionally used to
apportion the contribution of residential wood burning emis-
sions to burning of either softwood or hardwood (Caseiro
et al., 2009; Favez et al., 2010; Piazzalunga et al., 2011;
Maenhaut et al., 2012), with softwood combustion giving
rise to low ratios (< 4) and hardwood to high ratios (14–15)
(Schmidl et al., 2008). The latter authors proposed the fol-
lowing equation to derive the % spruce (or softwood) burnt
(relative to the total amount of softwood+ hardwood burnt):
%spruce= (14.8− levoglucosan / mannosan)/0.112, (2)
where levoglucosan / mannosan is the levoglucosan to man-
nosan ratio in the ambient aerosol.
This equation was derived from data that were obtained
for the combustion of common hardwood (beech and oak)
and softwood species (spruce and larch) in wood stoves in
Austria. Besides differences in the levoglucosan to mannosan
ratio between various softwood and hardwood species, the
uncertainty of the analytical methods used to quantify lev-
oglucosan and mannosan is an unknown variable potentially
contributing to the overall uncertainty when performing the
softwood and hardwood attribution.
The median levoglucosan to mannosan ratio did not vary
much between the six filter samples collected, ranging from
5.3 to 6.2 (Table B4), suggesting a rather stable composi-
tion of the wood burnt that impacted the sampling site. When
comparing the laboratories from which this ratio could be ex-
tracted, i.e. laboratories not affected by outliers for either of
the two isomers or by levels below the detection limit, the
largest difference observed was seen for filter sample 5 for
which lab. 2 reported a levoglucosan to mannosan ratio of
6.9 and lab. 9 a value of 3.6. Lab. 7 reported values of lev-
oglucosan for filter samples 1 and 2, which were considered
outliers, thus potentially affecting the levoglucosan to man-
nosan ratio. The levoglucosan to mannosan ratio for these
two filter samples (4.9–5.0) was in the lower range of that of
filter samples 3–6 (5.1–6.5) as well as being lower compared
to the subcategory not affected by outliers.
The mean PE, representing the accuracy, ranged from−26
to 23 % for the various analytical methods from which the
levoglucosan to mannosan ratio could be derived (Fig. 8). In
all, 78 % of the laboratories (labs. 3, 4, 6, 7, 8, 10, and 11)
reported a mean PE for the levoglucosan to mannosan ra-
tio within ±7 %, which should be considered quite a narrow
range. Excluding the two outliers detected for lab. 7 changed
the mean PE for the actual laboratory from −5.7 to −1.5 %,
thus having no effect on the range including all laboratories.
Assuming that the levoglucosan to mannosan ratio can
thus be measured to within±7 %, one can estimate the uncer-
tainty from the analysis on the %spruce result derived from
Eq. (2). This uncertainty is ±8 % spruce points for levoglu-
cosan to mannosan ratios close to 14.8 % (thus for %spruce
values close to 0 %) and gradually decreases to ±2 % spruce
points for ratios close to 0 (%spruce values close to 100 %).
However, the total uncertainty is likely much larger. It should
be noted that in addition to MAs, other organic aerosol
species, such as syringol and guaiacol, their derivatives, and
retene, could also be used to differentiate between hardwood
and softwood burning (e.g. Bari et al., 2009).
The error bars in Fig. 8 represent the minimum and the
maximum PE observed for the actual analytical method, and
thus the range can be considered a measure of the variability.
For the levoglucosan to mannosan ratio the variability ranged
from 3.5 to 24 %.
4 Conclusions
In the current study we have compared the results of thir-
teen different analytical methods used to quantify monosac-
charide anhydrides (MAs) (i.e. levoglucosan, mannosan and
galactosan) in ambient aerosol filter samples. To our knowl-
edge, this is the first major intercomparison that has been
conducted and reported in the scientific literature with re-
spect to these compounds. All major methods used for analy-
sis of MAs in ambient aerosol filter samples, and which have
been reported in the scientific literature so far, are represented
in the present intercomparison.
It is shown that the accuracy for levoglucosan, presented
as the mean percentage error (PE) for each participating lab-
oratory, varied from −63 to 20 %; however, for 62 % of the
laboratories the mean PE was within ±10 %, and for 85 %
the mean PE was within ±20 %. The variability of the var-
ious analytical methods, as defined by their minimum and
maximum PE value, ranged from 3.2 to 41 % for levoglu-
cosan. These results show that for levoglucosan the accuracy
is only slightly lower than that reported for an analysis of
SO2−4 on filter samples, a constituent that has been analysed
by numerous laboratories for several decades, typically by
ion chromatography, and which should be considered a fairly
easy constituent to analyse. Hence, the results obtained for
levoglucosan with respect to accuracy are encouraging and
suggest that levels of levoglucosan, and to a somewhat lesser
www.atmos-meas-tech.net/8/125/2015/ Atmos. Meas. Tech., 8, 125–147, 2015

136 K. E. Yttri et al.: An intercomparison study of analytical methods used for quantification
extent for mannosan and galactosan, obtained by most an-
alytical methods currently used to quantify monosaccharide
anhydrides in ambient aerosol filter samples provide compa-
rable results.
Finally, the various analytical methods used in the current
study should be tested for other aerosol matrices and concen-
trations as well, the most obvious being summertime aerosol
samples influenced by wildfires and/or agricultural fires.
Atmos. Meas. Tech., 8, 125–147, 2015 www.atmos-meas-tech.net/8/125/2015/

K. E. Yttri et al.: An intercomparison study of analytical methods used for quantification 137
Appendix A: Detailed description of analytical methods
used for quantification of levoglucosan, mannosan and
galactosan in the intercomparison
A1 HPAEC–Ion chromatography (IC)
A1.1 Lab. 2
For the analysis, punches of the filters (1 cm2) were spiked
with 13C6-levoglucosan and extracted with 5 mL deionised
water under 15 min gentle rotation. 50 µL of the filtered ex-
tracts (IC Acrodisc® syringe filter 0.45 µm Supor® (PES)
membrane) were used for analysis. The MAs were measured
using ion chromatography (Dionex IC-3000) coupled to a
quadrupole mass spectrometer (Dionex MSQ). Separations
were made using a Dionex CarboPac™ PA10 guard column
(2 mm i.d.× 50 mm length) and a Dionex CarboPac™ PA10
analytical column (2 mm i.d.× 250 mm length), a 2 mm
ASRS-300 suppressor, a CR-ATC anion trap column, and a
potassium hydroxide eluent generator. Monosaccharide an-
hydrides were ionized using the ESI technique. The molec-
ular ions of levoglucosan, mannosan and galactosan were
monitored at m/z 161, whereas that of 13C6-levoglucosan
was monitored atm/z 167, using the selected ion mode. Lev-
oglucosan was used for calibration.
A1.2 Lab. 3
For the analysis, five punches of the filters with an area
of 0.5 cm2 each were extracted together with 5 mL Milli-
Q grade water. Extraction was performed in polypropy-
lene test tubes, which were first agitated with a Vortex
and then put into an ultrasonic bath (20 min). After cen-
trifugation (10 min) the aqueous extract was transferred
into four microcentrifuge vials with 1 mL solution each.
The solutions (injection volume 20 µL) were analysed us-
ing ion chromatography with pulsed amperometric detection
(HPAEC–PAD, ICS-3000 from Dionex Corp.). The separat-
ing column was a CarboPac™ MA1, the eluent concentra-
tion ranged from 0.48 M NaOH up to 0.65 M NaOH with a
flow of 0.4 mL min−1. Levoglucosan, mannosan and galac-
tosan were identified by their retention time and quantified
using external standards.
A1.3 Lab. 7
For the analysis, punches of the filters (1.6 cm2) were ex-
tracted in 0.5 mL of Milli-Q grade water under ultrasoni-
cation for 30 min. The extract was filtered through a sy-
ringe filter (0.45 µm). The samples were analysed using a
Dionex ICS-3000 system. The separation was carried out on
a Dionex CarboPac™ MA1 column (4× 250 mm) with a cor-
responding guard column (4× 50 mm) at room temperature.
The sample injection loop was 25 µL. The eluent gradient
was programmed as follows: 0.52 M NaOH from 0 to 20 min,
0.52 to 0.65 M NaOH in 15 min and held constant for 15 min.
The eluent flow rate was 0.4 mL min−1. The waveform used
for pulsed amperometric detection was the standard quadru-
ple potential for carbohydrate analysis. Levoglucosan, man-
nosan and galactosan were identified by their retention time
and were quantified using external standards.
A2 HPLC
A2.1 Lab. 1
For the analysis, punches (1.5 cm2) of the filter were spiked
with 13C6-levoglucosan and 13C6-galactosan and extracted
twice with 2 mL tetrahydrofuran under ultrasonic agitation
(30 min). The filtered extracts (Teflon syringe filter, 0.45 µm)
were evaporated to a total volume of 1 mL in a nitro-
gen atmosphere. Before analysis the sample solvent elu-
tion strength was adapted to the mobile phase by adding
Milli-Q water (0.8 mL). The concentrations of the MAs were
determined using high-performance liquid chromatography
(HPLC) (Agilent model 1100) in combination with HR-
TOFMS (high-resolution time-of-flight mass spectrometry,
Micromass model LCT) operated in the negative ESI mode.
Levoglucosan, mannosan and galactosan were identified on
the basis of retention time and mass spectra of authentic stan-
dards. Quantification was performed using isotope-labeled
standards of levoglucosan and galactosan. The mass traces
at m/z 161.0455 and 167.0657 were used for quantification
(approximately 50 mDa peak width).
A2.2 Lab. 6
For the analysis, filters were spiked with 13C6-levoglucosan
and extracted three times with methanol in an ultrasonic bath
for 30 min. The three extracts were pooled and evaporated to
dryness. The sample was reconstituted with 1 mL methanol,
shaken, and filtered through a nylon filter. The analysis was
performed with liquid chromatography-mass spectrometry
with ESI in the positive ionisation mode. Sodium acetate
(2 mM) was added to the LC mobile phase to form sodium
adducts of levoglucosan and mannosan. The analytes were
separated by a gradient using 10 mM sodium acetate and
methanol as a mobile phase. The LC column was a Ben-
son Polymeric BP-100 Ca++ Carbohydrate Column. Anal-
ysis was performed using selected ion monitoring (SIM) of
the sodium adducts. The ion monitored for levoglucosan
and mannosan was m/z 185, for 13C6-levoglucosan it was
m/z 191.
A2.3 Lab. 8
For the analysis, filter punches (4.5 cm2) were extracted with
2 mL ultrapure water by 30 min vortex agitation; 449 µL of
the filtered extracts (Acrodisc® syringe filters, 0.2 µm) were
analysed by liquid chromatography (Dionex DX500) electro-
spray ionisation – tandem mass spectrometry (Thermo Fisher
Scientific LCQ Fleet). Levoglucosan, mannosan and galac-
www.atmos-meas-tech.net/8/125/2015/ Atmos. Meas. Tech., 8, 125–147, 2015
138 K. E. Yttri et al.: An intercomparison study of analytical methods used for quantification
tosan were identified and quantified on the basis of reten-
tion time and specific multiple reaction monitoring (MRM)
transition (m/z 161–113 for levoglucosan and galactosan,
m/z 161–101 for mannosan). External calibrations were per-
formed using standards of levoglucosan, mannosan, and
galactosan.
A2.4 Lab. 10
For the analysis, the entire filter punch was extracted twice
with 6 mL pure water in an ultrasonic bath for 45 min. Ex-
tracts were filtered (Teflon syringe filter, 0.2 µm) and 50 µL
of chloroform was added to prevent bacteria activity. Ex-
tracts were kept frozen (−18 ◦ C) until analysis. The anal-
yses were performed using an ultra-performance liquid chro-
matography (UPLC, Waters) instrument coupled with a triple
quadrupole mass spectrometer (Applied Biosystems, model
API3200). Separation of MAs was achieved using an Ac-
quity UPLC HSS T3 column, a sample loop of 10 µL, a
mixed water–methanol solvent, and post-column addition
of methanol. Levoglucosan, mannosan and galactosan were
identified and quantified on the basis of retention time and
specific MRM transition (m/z 161–113 for levoglucosan and
galactosan, m/z 161–113 for mannosan). External calibra-
tions were performed using standards.
A3 GC
A3.1 Lab. 4
For the GC–MS analyses, three filter punches (1 cm2
each) were spiked with recovery standard (methyl O-
L-xylanopyranoside). Each punch was extracted three
times with 10 mL methanol for 5 min under ultrasonic
agitation. The combined extract was reduced in vol-
ume with a rotary evaporator to about 1 mL. The fil-
tered concentrate (Teflon syringe filter, 0.45 µm) was
completely dried under a stream of nitrogen; 40 µL of
BSTFA (N ,O-Bis(trimethylsilyl)trifluoroacetamide) + 1 %
chlorotrimethylsilane (TMCS) / pyridine (2/1) was added to
the dried sample, and the mixture reacted at 70 ◦C for 1 h.
An aliquot of 1 µL was immediately analysed by GC–MS
(Thermo-Finnigan, TRACE GC2000 and Polaris Q). Quan-
tification of the MAs was performed in the scanning mode
(m/z 45–650) from the total ion chromatogram using relative
response factors determined by injection of authentic stan-
dards of levoglucosan, galactosan, and mannosan.
A3.2 Lab. 5
For the GC–MS analyses, three to four filter punches
(0.79 cm2 each) were spiked with internal stan-
dard. Each sample was extracted twice with an 8 mL
dichloromethane /methanol mixture (4/1) for 30 min in an
ultrasonic bath. The filtered extracts (Teflon syringe filter,
0.45 µm) were evaporated to dryness under a gentle flow of
nitrogen; 70 µL BSTFA and 70 µL pyridine were added to
derivatise the analytes. The mixtures were reacted at 70 ◦C
for 3 h; 1 µL of the sample was injected into the GC injector
(Agilent 6890N) in the splitless mode. The EI ionisation
mass spectrometer with quadrupole mass analyser (Agilent
5973) was operated in the SIM mode, the acquisition
frequency was 2.74 cycles s−1. The ion at m/z 333 was
used for the evaluation. Calibration was performed with a
standard solution of levoglucosan.
A3.3 Lab. 9
In the GC–MS method, punches (0.85 or 1.0 cm2) of the
samples were spiked with an internal standard levoglucosan
(2H7) and ultrasonically extracted twice with 5 mL of a mix-
ture of dichloromethane /methanol (2/1) for 15 min under
ultrasonic agitation. The filtered extracts (glass fiber filters,
0.60 mm) were concentrated in a rotary evaporator to a small
volume (ca. 200 µL), and then to dryness under a nitrogen
flow; 50 µL BSTFA+ 1 % TMCS was added and maintained
at 70 ◦C for 3 h. After derivatisation, the excess of derivati-
sation agent was evaporated by a nitrogen flow and hexane
was added to obtain a volume of 0.5 mL. The concentrations
were determined using PTV-GC (programmable temperature
vaporisation gas chromatography) (Thermo-Finnigan, Trace
GC) in combination with a MS detector (Thermo-Finnigan,
Polaris-Q). A 10 µL sample was injected and p-terphenyl was
used as a recovery standard. The chromatograms were ac-
quired in the full scan mode (m/z 50–500). Compounds were
quantified according to their characteristic ion: levoglucosan
(m/z 204), mannosan and galactosan (m/z 217). Quantifica-
tion was performed using isotope-labeled 2H7-levoglucosan
(m/z 220).
A3.4 Lab. 11
For the GC–MS analyses, samples were divided into two
parts (2.27 cm2 and rest of the filter). Sedoheptulose was
added as an internal standard and filters were extracted by
refluxing with 300 mL dichloromethane /methanol (2/1) for
24 h. The filtered extracts (glass filtration unit, 0.45 µm) were
concentrated in a rotary evaporator to a volume of about
2 mL, transferred to a vial and evaporated to dryness under
a nitrogen stream. The dried extracts were re-dissolved in
pyridine (100 µL) and derivatized with 200 µL BSTFA+ 1 %
TMCS at 70 ◦C for 3 h. For quantification 1 µL of the reaction
mixture was injected. The concentrations of MAs were de-
termined by gas chromatography (Agilent 6890) mass spec-
trometry (Agilent 7873). Levoglucosan was identified on the
basis of retention time and mass spectra of an authentic
standard. Quantification of the three anhydrosugars was per-
formed in the scanning mode using relative response factors
determined by injection of a levoglucosan standard.
Atmos. Meas. Tech., 8, 125–147, 2015 www.atmos-meas-tech.net/8/125/2015/
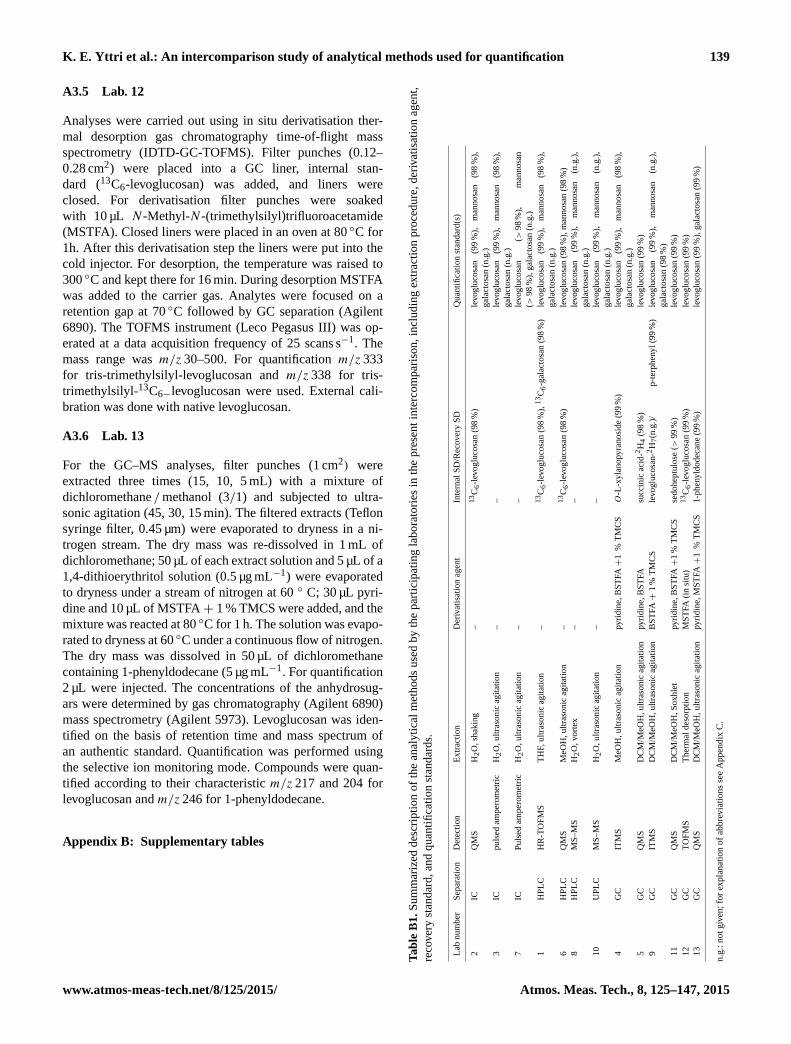
K. E. Yttri et al.: An intercomparison study of analytical methods used for quantification 139
A3.5 Lab. 12
Analyses were carried out using in situ derivatisation ther-
mal desorption gas chromatography time-of-flight mass
spectrometry (IDTD-GC-TOFMS). Filter punches (0.12–
0.28 cm2) were placed into a GC liner, internal stan-
dard (13C6-levoglucosan) was added, and liners were
closed. For derivatisation filter punches were soaked
with 10 µL N -Methyl-N -(trimethylsilyl)trifluoroacetamide
(MSTFA). Closed liners were placed in an oven at 80 ◦C for
1h. After this derivatisation step the liners were put into the
cold injector. For desorption, the temperature was raised to
300 ◦C and kept there for 16 min. During desorption MSTFA
was added to the carrier gas. Analytes were focused on a
retention gap at 70 ◦C followed by GC separation (Agilent
6890). The TOFMS instrument (Leco Pegasus III) was op-
erated at a data acquisition frequency of 25 scans s−1. The
mass range was m/z 30–500. For quantification m/z 333
for tris-trimethylsilyl-levoglucosan and m/z 338 for tris-
trimethylsilyl-13C6−levoglucosan were used. External cali-
bration was done with native levoglucosan.
A3.6 Lab. 13
For the GC–MS analyses, filter punches (1 cm2) were
extracted three times (15, 10, 5 mL) with a mixture of
dichloromethane /methanol (3/1) and subjected to ultra-
sonic agitation (45, 30, 15 min). The filtered extracts (Teflon
syringe filter, 0.45 µm) were evaporated to dryness in a ni-
trogen stream. The dry mass was re-dissolved in 1 mL of
dichloromethane; 50 µL of each extract solution and 5 µL of a
1,4-dithioerythritol solution (0.5 µg mL−1) were evaporated
to dryness under a stream of nitrogen at 60 ◦ C; 30 µL pyri-
dine and 10 µL of MSTFA+ 1 % TMCS were added, and the
mixture was reacted at 80 ◦C for 1 h. The solution was evapo-
rated to dryness at 60 ◦C under a continuous flow of nitrogen.
The dry mass was dissolved in 50 µL of dichloromethane
containing 1-phenyldodecane (5 µg mL−1. For quantification
2 µL were injected. The concentrations of the anhydrosug-
ars were determined by gas chromatography (Agilent 6890)
mass spectrometry (Agilent 5973). Levoglucosan was iden-
tified on the basis of retention time and mass spectrum of
an authentic standard. Quantification was performed using
the selective ion monitoring mode. Compounds were quan-
tified according to their characteristic m/z 217 and 204 for
levoglucosan and m/z 246 for 1-phenyldodecane.
Appendix B: Supplementary tables
Ta
ble
B1
.S
um
mar
ized
des
crip
tio
no
fth
ean
aly
tica
lm
eth
od
su
sed
by
the
par
tici
pat
ing
lab
ora
tori
esin
the
pre
sen
tin
terc
om
par
iso
n,
incl
ud
ing
extr
acti
on
pro
ced
ure
,d
eriv
atis
atio
nag
ent,
reco
ver
yst
and
ard
,an
dq
uan
tifi
cati
on
stan
dar
ds.
Lab
nu
mb
erS
epar
atio
nD
etec
tio
nE
xtr
acti
on
Der
ivat
isat
ion
agen
tIn
tern
alS
D/R
ecover
yS
DQ
uan
tifi
cati
on
stan
dar
d(s
)
2IC
QM
SH
2O
,sh
akin
g–
13C
6-l
evo
glu
cosa
n(9
8%
)le
vo
glu
cosa
n(9
9%
),m
ann
osa
n(9
8%
),
gal
acto
san
(n.g
.)
3IC
pu
lsed
amp
ero
met
ric
H2O
,u
ltra
son
icag
itat
ion
––
levo
glu
cosa
n(9
9%
),m
ann
osa
n(9
8%
),
gal
acto
san
(n.g
.)
7IC
Pu
lsed
amp
ero
met
ric
H2O
,u
ltra
son
icag
itat
ion
––
levo
glu
cosa
n(>
98
%),
man
no
san
(>9
8%
),gal
acto
san
(n.g
.)
1H
PL
CH
R-T
OF
MS
TH
F,
ult
raso
nic
agit
atio
n–
13C
6-l
evo
glu
cosa
n(9
8%
),1
3C
6-g
alac
tosa
n(9
8%
)le
vo
glu
cosa
n(9
9%
),m
ann
osa
n(9
8%
),
gal
acto
san
(n.g
.)
6H
PL
CQ
MS
MeO
H,
ult
raso
nic
agit
atio
n–
13C
6-l
evo
glu
cosa
n(9
8%
)le
vo
glu
cosa
n(9
8%
),m
ann
osa
n(9
8%
)
8H
PL
CM
S–
MS
H2O
,vo
rtex
––
levo
glu
cosa
n(9
9%
),m
ann
osa
n(n
.g.)
,
gal
acto
san
(n.g
.)
10
UP
LC
MS
–M
SH
2O
,u
ltra
son
icag
itat
ion
––
levo
glu
cosa
n(9
9%
),m
ann
osa
n(n
.g.)
,
gal
acto
san
(n.g
.)
4G
CIT
MS
MeO
H,
ult
raso
nic
agit
atio
npy
rid
ine,
BS
TFA+
1%
TM
CS
O-L
-xy
lan
opy
ran
osi
de
(99
%)
levo
glu
cosa
n(9
9%
),m
ann
osa
n(9
8%
),
gal
acto
san
(n.g
.)
5G
CQ
MS
DC
M/M
eOH
,u
ltra
son
icag
itat
ion
py
rid
ine,
BS
TFA
succ
inic
acid
-2H
4(9
8%
)le
vo
glu
cosa
n(9
9%
)
9G
CIT
MS
DC
M/M
eOH
,u
ltra
son
icag
itat
ion
BS
TFA+
1%
TM
CS
levo
glu
cosa
n-2
H7(n
.g.)
/p
-ter
ph
eny
l(9
9%
)le
vo
glu
cosa
n(9
9%
),m
ann
osa
n(n
.g.)
,
gal
acto
san
(98
%)
11
GC
QM
SD
CM
/MeO
H,
So
xh
let
py
rid
ine,
BS
TFA+
1%
TM
CS
sed
oh
eptu
lose
(>9
9%
)le
vo
glu
cosa
n(9
9%
)
12
GC
TO
FM
ST
her
mal
des
orp
tio
nM
ST
FA
(in
situ
)1
3C
6-l
evo
glu
cosa
n(9
9%
)le
vo
glu
cosa
n(9
9%
)
13
GC
QM
SD
CM
/MeO
H,
ult
raso
nic
agit
atio
npy
rid
ine,
MS
TFA+
1%
TM
CS
1-p
hen
yld
od
ecan
e(9
9%
)le
vo
glu
cosa
n(9
9%
),gal
acto
san
(99
%)
n.g
.:not
giv
en;
for
expla
nat
ion
of
abbre
via
tions
see
Appen
dix
C.
www.atmos-meas-tech.net/8/125/2015/ Atmos. Meas. Tech., 8, 125–147, 2015
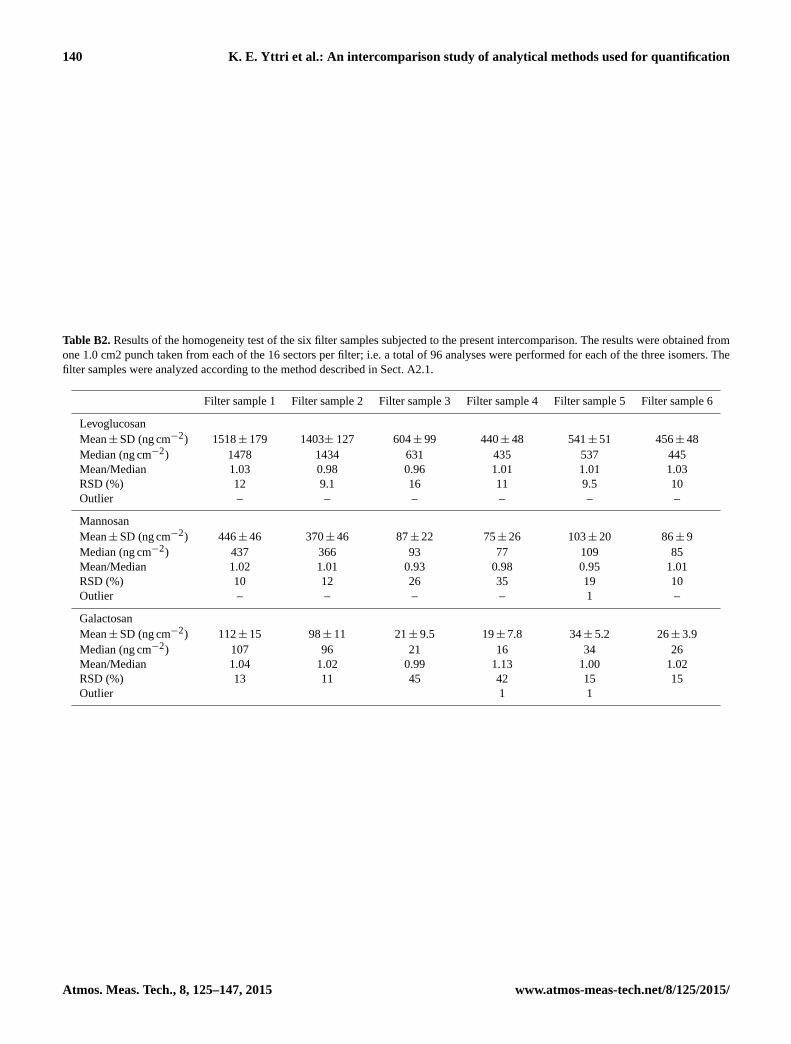
140 K. E. Yttri et al.: An intercomparison study of analytical methods used for quantification
Table B2. Results of the homogeneity test of the six filter samples subjected to the present intercomparison. The results were obtained from
one 1.0 cm2 punch taken from each of the 16 sectors per filter; i.e. a total of 96 analyses were performed for each of the three isomers. The
filter samples were analyzed according to the method described in Sect. A2.1.
Filter sample 1 Filter sample 2 Filter sample 3 Filter sample 4 Filter sample 5 Filter sample 6
Levoglucosan
Mean±SD (ng cm−2) 1518± 179 1403± 127 604± 99 440± 48 541± 51 456± 48
Median (ng cm−2) 1478 1434 631 435 537 445
Mean/Median 1.03 0.98 0.96 1.01 1.01 1.03
RSD (%) 12 9.1 16 11 9.5 10
Outlier – – – – – –
Mannosan
Mean±SD (ng cm−2) 446± 46 370± 46 87± 22 75± 26 103± 20 86± 9
Median (ng cm−2) 437 366 93 77 109 85
Mean/Median 1.02 1.01 0.93 0.98 0.95 1.01
RSD (%) 10 12 26 35 19 10
Outlier – – – – 1 –
Galactosan
Mean±SD (ng cm−2) 112± 15 98± 11 21± 9.5 19± 7.8 34± 5.2 26± 3.9
Median (ng cm−2) 107 96 21 16 34 26
Mean/Median 1.04 1.02 0.99 1.13 1.00 1.02
RSD (%) 13 11 45 42 15 15
Outlier 1 1
Atmos. Meas. Tech., 8, 125–147, 2015 www.atmos-meas-tech.net/8/125/2015/

K. E. Yttri et al.: An intercomparison study of analytical methods used for quantification 141
Table B3. Calculated mean (±SD) and median concentrations as well as maximum and minimum concentrations of levoglucosan, mannosan
and galactosan in the six filter samples subjected to the intercomparison, as obtained by the various methods applied. Number of values
included in the calculated concentrations, outliers and values below the detection limit (BDL) are listed. Outliers and values BDL are not
included in the calculated concentrations, nor in the listed maximum and minimum values.
Sample code Isomer Mean±SD (ng cm−2) Median Max Min n Outliers BDL
Filter 1
Levoglucosan 1730± 302 1765 2190 965 12 1 (lab. 7)
Mannosan 275± 122 300 489 68 9
Galactosan 76± 40 90 124 11 8 1 (lab. 9)
Filter 2
Levoglucosan 1592± 317 1631 2132 873 12 1 (lab. 7)
Mannosan 256± 105 263 441 65 9
Galactosan 68± 34 79 101 14 8 1 (lab. 9)
Filter 3
Levoglucosan 594± 141 627 765 280 13
Mannosan 101± 37 99 166 47 9
Galactosan 39± 18 40 68 12 6 1 (lab. 9) 2 (labs. 3 and 8)
Filter 4
Levoglucosan 544± 123 570 678 268 13
Mannosan 87± 33 80 146 42 9
Galactosan 37± 20 33 71 11 6 1 (lab. 9) 2 (labs. 3 and 8)
Filter 5
Levoglucosan 566± 134 586 758 258 13
Mannosan 110± 45 110 188 45 9
Galactosan 36± 20 35 70 11 6 1 (lab. 9) 2 (labs. 3 and 8)
Filter 6
Levoglucosan 521± 122 552 670 270 13
Mannosan 99± 36 100 162 51 9
Galactosan 35± 20 31 68 9 6 1 (lab. 9) 2 (labs. 3 and 8)
www.atmos-meas-tech.net/8/125/2015/ Atmos. Meas. Tech., 8, 125–147, 2015

142 K. E. Yttri et al.: An intercomparison study of analytical methods used for quantification
Table B4. Calculated mean (±SD) and median ratios, as well as maximum and minimum ratios of levoglucosan (levo), mannosan (manno)
and galactosan (galacto), to the sum of the three isomers (6MAs) including the mannosan to levoglucosan ratio in the six filter samples
subjected to the intercomparison, as obtained by the various methods applied. Number of values included in the calculated values are listed.
Outliers and values BDL are not included in the calculated concentrations, nor in the listed maximum and minimum values.
Sample code Isomer Mean±SD Median Max Min n
Filter 1
levo/6MA (%) 82± 2.1 82 87 81 6
manno/6MA (%) 14± 1.4 14 15 11 6
galacto/6MA (%) 4.0± 1.7 4.2 6.3 1.0 6
levo/manno 5.9± 0.9 5.8 7.2 4.5 8
Filter 2
levo/6MA (%) 82± 1.2 83 83 80 6
manno/6MA (%) 14± 1.4 14 15 12 6
galacto/6MA (%) 3.8± 1.4 3.9 5.5 1.4 6
levo/manno 5.8± 0.7 5.7 7.1 4.9 8
Filter 3
levo/6MA (%) 82± 0.7 82 83 81 5
manno/6MA (%) 13± 1.2 13 14 11 5
galacto/6MA (%) 4.7± 0.9 5.0 5.8 3.5 5
levo/manno 6.0± 1.0 6.0 7.5 4.5 9
Filter 4
levo/6MA (%) 82± 0.8 82 84 82 5
manno/6MA (%) 13± 1.2 13 14 11 5
galacto/6MA (%) 4.8± 0.9 4.7 6.3 3.4 5
levo/manno 6.2± 1.1 6.4 7.7 4.6 9
Filter 5
levo/6MA (%) 81± 0.8 82 82 80 5
manno/6MA (%) 14± 1.5 14 16 12 5
galacto/6MA (%) 4.3± 1.0 4.0 6.1 3.4 5
levo/manno 5.3± 1.0 5.7 6.9 3.6 9
Filter 6
levo/6MA (%) 81± 0.6 81 82 80 5
manno/6MA (%) 14± 1.5 14 16 12 5
galacto/6MA (%) 4.4± 1.5 4.0 6.8 2.6 5
levo/manno 5.3± 0.9 5.6 6.7 3.8 9
Atmos. Meas. Tech., 8, 125–147, 2015 www.atmos-meas-tech.net/8/125/2015/

K. E. Yttri et al.: An intercomparison study of analytical methods used for quantification 143
Appendix C: Abbreviations used
ACD Aerosol charge detection
BB Biomass burning
BSTFA N ,O-Bis(trimethylsilyl)trifluoroacetamide
CE Capillary electrophoresis
DCM Dichloromethane
ESI Electrospray ionisation
GC Gas chromatography
HPAEC High-performance anion-exchange chromatography
HPLC High-performance liquid chromatography
HR-TOFMS High-resolution time-of-flight mass spectrometry
ITMS Ion trap mass spectrometry
MAs Monosaccharide anhydrides
MS Mass spectrometry
MS–MS Tandem mass spectrometry
MSTFA N -Methyl-N -(trimethylsilyl)trifluoroacetamide
MeOH Methanol
PAD Pulsed amperometric detection
PM Particulate matter
QMS Quadrupole mass spectrometry
SO2−4
Sulfate
THF Tetrahydrofuran
TOFMS Time-of-flight mass spectrometry
TMCS Chlorotrimethylsilane
UPLC Ultra-performance liquid chromatography
www.atmos-meas-tech.net/8/125/2015/ Atmos. Meas. Tech., 8, 125–147, 2015

144 K. E. Yttri et al.: An intercomparison study of analytical methods used for quantification
Acknowledgements. The work was supported by the Co-operative
Programme for Monitoring and Evaluation of the Long-range
Transmission of Air pollutants in Europe (EMEP) under UN-
ECE and the European Union Seventh Framework Programme
(FP7/2007-2013) under the ACTRIS project (grant agreement no.
262254).
Edited by: P. Herckes
References
Agarwal, S., Aggarwal, S. G., Okuzawa, K., and Kawamura,
K.: Size distributions of dicarboxylic acids, ketoacids, α-
dicarbonyls, sugars, WSOC, OC, EC and inorganic ions in at-
mospheric particles over Northern Japan: implication for long-
range transport of Siberian BB and East Asian polluted aerosols,
Atmos. Chem. Phys., 10, 5839–5858, doi:10.5194/acp-10-5839-
2010, 2010.
Alves, C. A., Gonçalves, C., Evtyugina, M., Pio, C. A., Mirante, F.,
and Puxbaum, H.: Particulate organic compounds emitted from
experimental wildland fires in a Mediterranean ecosystem, At-
mos. Environ., 44, 2750–2759, 2010.
Bari, M. A., Baumbach, G., Kuch, B., and Scheffknecht, G.: Wood
smoke as a source of particle-phase organic compounds in resi-
dential areas, Atmos. Environ., 43, 4722–4732, 2009.
Bari, M. A., Baumbach, G., Kuch, B., and Scheffknecht, G.: Tem-
poral variation and impact of wood smoke pollution on a residen-
tial area in southern Germany, Atmos. Environ., 44, 3823–3832,
2010.
Blazso, M., Janitsek, S., Gelencsér, A., Artaxo, P., Graham, B., An-
dreae, M. O.: Study of tropical organic aerosol by thermally
assisted alkylation-gas chromatography mass spectrometry, J.
Anal. Appl. Pyrol., 68–69, 351–369, 2003.
Booth, A. M., Montague, W. J., Barley, M. H., Topping, D. O., Mc-
Figgans, G., Garforth, A., and Percival, C. J.: Solid state and sub-
cooled liquid vapour pressures of cyclic aliphatic dicarboxylic
acids, Atmos. Chem. Phys., 11, 655–665, doi:10.5194/acp-11-
655-2011, 2011.
Caseiro, A. and Oliveira, C.: Variations in wood burning organic
marker concentrations in the atmospheres of four European
cities, J. Environ. Monitor., 14, 2261–2269, 2012.
Caseiro, A., Marr, I. L., Claeys, M., Kasper-Giebl, A., Puxbaum,
H., and Pio, C. A.: Determination of saccharides in atmospheric
aerosol using anion-exchange high-performance liquid chro-
matography and pulsed-amperometric detection, J. Chromatogr.
A, 1171, 37–45, 2007.
Caseiro, A., Bauer, H., Schmidl, C., Pio, C. A., and Puxbaum, H.:
Wood burning impact on PM10 in three Austrian regions, Atmos.
Environ., 43, 2186–2195, 2009.
Claeys, M., Kourtchev, I., Pashynska, V., Vas, G., Vermeylen, R.,
Wang, W., Cafmeyer, J., Chi, X., Artaxo, P., Andreae, M. O., and
Maenhaut, W.: Polar organic marker compounds in atmospheric
aerosols during the LBA-SMOCC 2002 biomass burning experi-
ment in Rondônia, Brazil: sources and source processes, time se-
ries, diel variations and size distributions, Atmos. Chem. Phys.,
10, 9319–9331, doi:10.5194/acp-10-9319-2010, 2010.
Dixon, R. W. and Baltzell, G.: Determination of levoglucosan in at-
mospheric aerosols using high-performance liquid chromatogra-
phy with aerosol charge detection, J. Chromatogr. A, 1109, 214–
221, 2006.
dos Santos, C. Y. M., Azevedo, D. D., and Neto, F. R. D.: Selected
organic compounds from biomass burning found in the atmo-
spheric particulate matter over sugarcane plantation areas, At-
mos. Environ., 36, 3009–3019, 2002.
Dye, C. and Yttri, K. E.: Determination of monosaccharide anhy-
drides in atmospheric aerosols by use of high-performance liquid
chromatography combined with high-resolution mass spectrom-
etry, Anal. Chem., 77, 1853–1858, 2005.
Elsasser, M., Crippa, M., Orasche, J., DeCarlo, P. F., Oster, M., Pitz,
M., Cyrys, J., Gustafson, T. L., Pettersson, J. B. C., Schnelle-
Kreis, J., Prévôt, A. S. H., and Zimmermann, R.: Organic molec-
ular markers and signature from wood combustion particles in
winter ambient aerosols: aerosol mass spectrometer (AMS) and
high time-resolved GC-MS measurements in Augsburg, Ger-
many, Atmos. Chem. Phys., 12, 6113–6128, doi:10.5194/acp-12-
6113-2012, 2012.
Elsasser, M., Busch, C., Orasche, J., Schön, C., Hartmann, H.,
Schnelle-Kreis, J., and Zimmermann, R.: Dynamic changes of
the aerosol composition and concentration during different burn-
ing phases of wood combustion, Energ. Fuel., 27, 4959–4968,
2013.
Engling, G., Carrico, C. M., Kreidenweis, S. M., Collett, J. L.,
Day, D. E., Malm, W. C., Lincoln, E., Hao, W. M., Iinuma, Y.,
and Herrmann, H.: Determination of levoglucosan in biomass
combustion aerosol by high-performance anion-exchange chro-
matography with pulsed amperometric detection, Atmos. Envi-
ron., 40, S299–S311, 2006.
Fabbri, D., Chiavari, G., Prati, S., Vassura, I., and Vangelista, M.:
Gas chromatography/mass spectrometric characterisation of py-
rolysis/silylation products of glucose and cellulose, Rapid Com-
mun. Mass Sp., 16, 2349–2355, 2002.
Fabbri, D., Torri, C., Simoneit, B. R. T., Marynowski, L., Rushdi,
A. I., and Fabianska, M. J.: Levoglucosan and other cellulose and
lignin markers in emissions from burning of Miocene lignites,
Atmos. Environ., 43, 2286–2295, 2009.
Favez, O., El Haddad, I., Piot, C., Boréave, A., Abidi, E., Marchand,
N., Jaffrezo, J.-L., Besombes, J.-L., Personnaz, M.-B., Sciare, J.,
Wortham, H., George, C., and D’Anna, B.: Inter-comparison of
source apportionment models for the estimation of wood burning
aerosols during wintertime in an Alpine city (Grenoble, France),
Atmos. Chem. Phys., 10, 5295–5314, doi:10.5194/acp-10-5295-
2010, 2010.
Fine, P. M., Cass, G. R., and Simoneit, B. R. T.: Chemical char-
acterization of fine particle emissions from fireplace combustion
of woods grown in the northeastern United States, Environ. Sci.
Technol., 35, 2665–2675, 2001.
Fine, P. M., Cass, G. R., and Simoneit, B. R. T.: Chemical charac-
terization of fine particle emissions from the fireplace combus-
tion of woods grown in the southern United States, Environ. Sci.
Technol., 36, 1442–1451, 2002.
Fine, P. M., Cass, G. R., and Simoneit, B. R. T.: Chemical charac-
terization of fine particle emissions from the fireplace combus-
tion of wood types grown in the Midwestern and Western United
States, Environ. Eng. Sci., 21, 387–409, 2004.
Fraser, M. P. and Lakshmanan, K.: Using levoglucosan as a molec-
ular marker for the long-range transport of biomass combustion
aerosols, Environ. Sci. Technol., 34, 4560–4564, 2000.
Atmos. Meas. Tech., 8, 125–147, 2015 www.atmos-meas-tech.net/8/125/2015/

K. E. Yttri et al.: An intercomparison study of analytical methods used for quantification 145
Frey, A. K., Tissari, J., Saarnio, K. M., Timonen, H. J., Tolonen-
Kivimaki, O., Aurela, M. A., Saarikoski, S. K., Makkonen, U.,
Hytonen, K., Jokiniemi, J., Salonen, R. O., and Hillamo, R. E. J.:
Chemical composition and mass size distribution of fine partic-
ulate matter emitted by a small masonry heater, Boreal Environ.
Res., 14, 255–271, 2009.
Gao, S., Hegg, D. A., Hobbs, P. V., Kirchstetter, T. W., Magi, B., I.,
and Sadilek, M.: Water-soluble organic components in aerosols
associated with savanna fires in southern Africa: Identification,
evolution, and distribution, J. Geophys. Res.-Atmos., 108, 8491,
doi:10.1029/2002JD002324, 2003.
Garcia, C. D., Engling, G., Herckes, P., Collett, J. L., and Henry,
C. S.: Determination of levoglucosan from smoke samples us-
ing microchip capillary electrophoresis with pulsed amperomet-
ric detection, Environ. Sci. Technol., 39, 618–623, 2005.
Gelencsér, A., May, B., Simpson, D., Sanchez-Ochoa, A., Kasper-
Giebl, A., Puxbaum, H., Caseiro, A., Pio, C., and Legrand,
M.: Source apportionment of PM2.5 organic aerosol over
Europe: Primary/secondary, natural/anthropogenic, and fos-
sil/biogenic origin, J. Geophys. Res.-Atmos., 112, D23S04,
doi:10.1029/2006JD008094, 2007.
Gonçalves, C., Alves, C., Evtyugina, M., Mirante, F., Pio, C., Ca-
seiro, A., Schmidl, C., Bauer, H., Carvalho, F.: Characterisa-
tion of PM10 emissions from wood stove combustion of com-
mon woods grown in Portugal, Atmos. Environ., 44, 4474–4480,
2010.
Gonçalves, C., Alves, C., Fernandes, A. P., Monteiro, C., Tarelho,
L., Evtyugina, M., and Pio, C.: Organic compounds in PM2.5
emitted from fireplace and woodstove combustion of typical Por-
tuguese wood species, Atmos. Environ., 45, 4533–4545, 2011.
He, J., Zielinska, B., and Balasubramanian, R.: Composition of
semi-volatile organic compounds in the urban atmosphere of Sin-
gapore: influence of biomass burning, Atmos. Chem. Phys., 10,
11401–11413, doi:10.5194/acp-10-11401-2010, 2010.
Hennigan, C. J., Sullivan, A. P., Collett, J. L., and Robinson,
A. L.: Levoglucosan stability in biomass burning particles ex-
posed to hydroxyl radicals, Geophys. Res. Lett., 37, L09806,
doi:10.1029/2010GL043088, 2010.
Herich, H., Gianini, M. F. D., Piot, C., Mocnik, G., Jaffrezo, J.-L.,
Besombes, J.-L., Prévôt, A. S. H., and Hueglin, C.: Overview of
the impact of wood burning emissions on carbonaceous aerosols
and PM in large parts of the Alpine region. Atmos. Environ., 89,
64–75, 2014.
Hoffmann, D., Tilgner, A., Iinuma, Y., and Herrmann, H.: Atmo-
spheric stability of levoglucosan: A detailed laboratory and mod-
eling study, Environ. Sci. Technol., 44, 694–699, 2010.
Holmes, B. J. and Petrucci, G. A.: Oligomerization of levoglucosan
by Fenton chemistry in proxies of biomass burning aerosols, J.
Atmos. Chem., 58, 151–166, 2007.
Hornig, J. F., Soderberg, R. H., Barefoot, A. C., and Galasyn, J.
F.: Wood smoke analysis: vaporization losses of PAH from fil-
ters and levoglucosan as a distinctive marker for wood smoke,
in: Polynuclear Aromatic Hydrocarbons: Mechanisms, Methods,
and Metabolism, edited by: Cooke, M. and Dennis, A. J., Battelle
Press, Columbus, OH, 561–568, 1985.
Hsu, C. L., Cheng, C. Y., Lee, C. T., and Ding, W. H.: Deriva-
tization procedures and determination of levoglucosan and re-
lated monosaccharide anhydrides in atmospheric aerosols by gas
chromatography-mass spectrometry, Talanta, 72, 199–205, 2007.
Iinuma, Y., Bruggemann, E., Gnauk, T., Muller, K., Andreae, M. O.,
Helas, G., Parmar, R., and Herrmann, H.: Source characterization
of biomass burning particles: The combustion of selected Eu-
ropean conifers, African hardwood, savanna grass, and German
and Indonesian peat, J. Geophys. Res.-Atmos., 112, D08209,
doi:10.1029/2006JD007120, 2007.
Iinuma, Y., Engling, G., Puxbaum, H., and Herrmann, H.: A highly
resolved anion-exchange chromatographic method for determi-
nation of saccharidic tracers for biomass combustion and primary
bio-particles in atmospheric aerosol, Atmos. Environ., 43, 1367–
1371, 2009.
Jordan, T. B. and Seen, A. J.: Effect of airflow setting on the or-
ganic composition of woodheater emissions, Environ. Sci. Tech-
nol., 39, 3601–3610, 2005.
Kourtchev, I., Hellebust, S., Bell, J. M., O’Connor, I. P., Healy, R.
M., Allanic, A., Healy, D., Wenger, J. C., and Sodeau, J. R.: The
use of polar organic compounds to estimate the contribution of
domestic solid fuel combustion and biogenic sources to ambient
levels of organic carbon and PM2.5 in Cork Harbour, Ireland,
Sci. Total Environ., 409, 2143–2155, 2011.
Krumal, K., Mikuska, P., Vojtesek, M., and Vecera, Z.: Seasonal
variations of monosaccharide anhydrides in PM1 and PM2.5
aerosol in urban areas, Atmos. Environ., 44, 5148–5155, 2010.
Larsen, R. K., Schantz, M. M., and Wise, S. A.: Determination of
levoglucosan in particulate matter reference materials, Aerosol
Sci. Technol., 40, 781–787, 2006.
Lin, L., Lee, M. L., and Eatough, D. J.: Gas chromatographic analy-
sis of organic marker compounds in fine particulate matter using
solid-phase microextraction, J. Air Waste Manage., 57, 53–58,
2007.
Ma, Y., Hays, M. D., Geron, C. D., Walker, J. T., and Gatari
Gichuru, M. J.: Technical Note: Fast two-dimensional GC-MS
with thermal extraction for anhydro-sugars in fine aerosols, At-
mos. Chem. Phys., 10, 4331–4341, doi:10.5194/acp-10-4331-
2010, 2010.
Maenhaut, W., Vermeylen, R., Claeys, M., Vercauteren, J., Math-
eeussen, C., and Roekens, E.: Assessment of the contribution
from wood burning to the PM10 aerosol in Flanders, Belgium,
Sci. Total Environ., 437, 226–236, 2012.
May, B., Wagenbach, D., Hammer, S., Steier, P., Puxbaum, H., and
Pio, C.: The anthropogenic influence on carbonaceous aerosol in
the European background, Tellus B, 61, 464–472, 2009.
Mazzoleni, L. R., Zielinska, B., and Moosmüller, H.: Emissions
of levoglucosan, methoxy phenols, and organic acids from pre-
scribed burns, laboratory combustion of wildland fuels, and res-
idential wood combustion, Environ. Sci. Technol., 41, 2115–
2122, 2007.
Medeiros, P. M. and Simoneit, B. R. T.: Analysis of sugars in en-
vironmental samples by gas chromatography-mass spectrometry,
J. Chromatogr. A, 1141, 271–278, 2007.
Nolte, C. G., Schauer, J. J., Cass, G. R., and Simoneit, B. R. T.:
Highly polar organic compounds present in wood smoke and in
the ambient atmosphere, Environ. Sci. Technol., 35, 1912–1919,
2001.
Oja, V. and Suuberg, E. M.: Vapor pressures and enthalpies of subli-
mation of D-glucose, D-xylose, cellobiose, and levoglucosan, J.
Chem. Eng. Data, 44, 26–29, 1999.
Oliveira, C., Pio, C., Alves, C., Evtyugina, M., Santos, P.,
Goncalves, V., Nunes, T., Silvestre, A J. D., Palmgren, F.,
www.atmos-meas-tech.net/8/125/2015/ Atmos. Meas. Tech., 8, 125–147, 2015
146 K. E. Yttri et al.: An intercomparison study of analytical methods used for quantification
Wahlin, P., and Harrad, S.: Seasonal distribution of polar organic
compounds in the urban atmosphere of two large cities from the
North and South of Europe, Atmos. Environ., 41, 5555–5570,
2007.
Orasche, J., Schnelle-Kreis, J., Abbaszade, G., and Zimmermann,
R.: Technical Note: In-situ derivatization thermal desorption
GC-TOFMS for direct analysis of particle-bound non-polar and
polar organic species, Atmos. Chem. Phys., 11, 8977–8993,
doi:10.5194/acp-11-8977-2011, 2011.
Orasche, J., Seidel, T., Hartmann, H., Schnelle-Kreis, J., Chow, J.
C., Ruppert, H., and Zimmermann, R.: Comparison of emissions
from wood combustion. Part 1: Emission factors and characteris-
tics from different small-scale residential heating appliances con-
sidering particulate matter and polycyclic aromatic hydrocarbon
(PAH)-related toxicological potential of particle-bound organic
species, Energ. Fuel., 26, 6695–6704, 2012.
Orasche, J., Schnelle-Kreis, J., Schoen, C., Hartmann, H., Rup-
pert, H., Arteaga-Salas, J. M., and Zimmermann, R.: Compar-
ison of emissions from wood combustion. Part 2: Impact of
combustion conditions on emission factors and characteristics of
particle-bound organic species and polycyclic aromatic hydro-
carbon (PAH)-related toxicological potential, Energ. Fuel., 27,
1482–1491, 2013.
Oros, D. R. and Simoneit, B. R. T.: Identification of molecular trac-
ers in organic aerosols from temperate climate vegetation sub-
jected to biomass burning, Aerosol Sci. Technol., 31, 433–445,
1999.
Pashynska, V., Vermeylen, R., Vas, G., Maenhaut W., and Claeys,
M.: Development of a gas chromatographic/ion trap mass spec-
trometric method for the determination of levoglucosan and sac-
charidic compounds in atmospheric aerosols. Application to ur-
ban aerosols, J. Mass Spectrom., 37, 1249–1257, 2002.
Piazzalunga, A., Fermo, P., Bernardoni, V., Vecchi, R., Valli, G.,
and De Gregorio, M. A.: A simplified method for levoglucosan
quantification in wintertime atmospheric particulate matter by
high-performance anion-exchange chromatography coupled with
pulsed amperometric detection, Int. J. Environ. Anal. Chem., 90,
934–947, 2010.
Piazzalunga, A., Belis, C., Bernardoni, V., Cazzuli, O., Fermo, P.,
Valli, G., and Vecchi, R.: Estimates of wood burning contribu-
tion to PM by the macro-tracer method using tailored emission
factors, Atmos. Environ., 45, 6642–6649, 2011.
Pietrogrande, M. C., Bacco, D., and Rossi, M.: Chemical character-
ization of polar organic markers in aerosols in a local area around
Bologna, Italy, Atmos. Environ., 75, 279–286, 2013.
Piot, C., Jaffrezo, J.-L., Cozic, J., Pissot, N., El Haddad, I., Marc-
hand, N., and Besombes, J.-L.: Quantification of levoglucosan
and its isomers by High Performance Liquid Chromatography –
Electrospray Ionization tandem Mass Spectrometry and its appli-
cations to atmospheric and soil samples, Atmos. Meas. Tech., 5,
141–148, doi:10.5194/amt-5-141-2012, 2012.
Puxbaum, H., Caseiro, A., Sanchez-Ochoa, A., Kasper-Giebl, A.,
Claeys, M., Gelencsér, A., Legrand, M., Preunkert, S., and Pio,
C.: Levoglucosan levels at background sites in Europe for as-
sessing the impact of biomass combustion on the European
aerosol background, J. Geophys. Res.-Atmos., 112, D23S05,
doi:10.1029/2006JD008114, 2007.
Ruehl, C. R., Ham, W. A., and Kleeman, M. J.: Temperature-
induced volatility of molecular markers in ambient air-
borne particulate matter, Atmos. Chem. Phys., 11, 67–76,
doi:10.5194/acp-11-67-2011, 2011.
Saarnio, K., Aurela, M., Timonen, H., Saarikoski, S., Teinila, K.,
Makela, T., Sofiev, M., Koskinen, J., Aalto, P. P., Kulmala, M.,
Kukkonen, J., and Hillamo, R.: Chemical composition of fine
particles in fresh smoke plumes from boreal wild-land fires in
Europe, Sci. Total Environ., 408, 2527–2542, 2010a.
Saarnio, K., Teinila, K., Aurela, M., Timonen, H., and Hillamo, R.:
High-performance anion-exchange chromatography-mass spec-
trometry method for determination of levoglucosan, mannosan,
and galactosan in atmospheric fine particulate matter, Anal.
Bioanal. Chem., 398, 2253–2264, 2010b.
Saffari, A., Daher, N., Samara, C., Voutsa, D., Kouras, A., Manoli,
E., Karagkiozidou, O., Vlachokostas, C., Moussiopoulos, N.,
Shafer, M. M., Schauer, J. J., and Sioutas, C.: Increased biomass
burning due to the economic crisis in Greece and its adverse
impact on wintertime air quality in Thessaloniki, Environ. Sci.
Technol., 47, 13313–13320, 2013.
Schkolnik, G. and Rudich, Y.: Detection and quantification of lev-
oglucosan in atmospheric aerosols: A review, Anal. Bioanal.
Chem., 385, 26–33, 2006.
Schkolnik, G., Falkovich, A. H., Rudich, Y., Maenhaut, W., and Ar-
taxo, P.: New analytical method for the determination of levoglu-
cosan, polyhydroxy compounds, and 2-methylerythritol and its
application to smoke and rainwater samples, Environ. Sci. Tech-
nol., 39, 2744–2752, 2005.
Schmidl, C., Marr, L. L. Caseiro, A., Kotianova, P., Berner, A.,
Bauer, H., Kasper-Giebl, A., and Puxbaum, H.: Chemical charac-
terisation of fine particle emissions from wood stove combustion
of common woods growing in mid-European Alpine regions, At-
mos. Environ. 42, 126–141, 2008.
Schnelle-Kreis, J., Kunde, R., Schmoeckel, G., Abbaszade, G.,
Gaderer, M., Diemer, J., Ott, H., and Zimmermann, R.: An-
teil von Partikelemissionen aus Holzverbrennung an PM10-
Feinstaubimmissionen im städtischen Umfeld am Beispiel von
Augsburg – Teil 1: Emissions- und Immissionsmessungen,
Gefahrst. Reinhalt. L., 5, 203–209, 2010.
Sillanpää, M., Saarikoski, S., Hillamo, R., Pennanen, A., Makko-
nen, U., Spolnik, Z., Van Grieken, R., Koskentalo, T. A., and
Salonen, R. O.: Chemical composition, mass size distribution
and source analysis of long-range transported wildfire smokes
in Helsinki, Sci. Total Environ., 350, 119–135, 2005.
Simoneit, B. R. T.: A review of biomarker compounds as source
indicators and tracers for air pollution, Environ. Sci. Pollut., 6,
159–169, 1999.
Simoneit, B. R. T., Schauer, J. J., Nolte, C. G., Oros, D. R., Elias, V.
O., Fraser, M. P., Rogge, W. F., and Cass, G. R.: Levoglucosan, a
tracer for cellulose in biomass burning and atmospheric particles,
Atmos. Environ., 33, 173–182, 1999.
Simpson, C. D., Dills, R. L., Katz, B. S., and Kalman, D. A.: Deter-
mination of levoglucosan in atmospheric fine particulate matter,
J. Air Waste Manage., 54, 689–694, 2004.
Slade, J. H. and Knopf, D. A.: Heterogeneous OH oxidation of
biomass burning organic aerosol surrogate compounds: assess-
ment of volatilisation products and the role of OH concentration
on the reactive uptake kinetics, Phys. Chem. Chem. Phys., 15,
5898–5915, 2013.
Sullivan, A. P., Holden, A. S., Patterson, L. A., McMeeking, G.
R., Kreidenweis, S. M., Malm, W. C., Hao, W. M., Wold, C. E.,
Atmos. Meas. Tech., 8, 125–147, 2015 www.atmos-meas-tech.net/8/125/2015/

K. E. Yttri et al.: An intercomparison study of analytical methods used for quantification 147
and Collett Jr., J. L.: A method for smoke marker measurements
and its potential application for determining the contribution of
biomass burning from wildfires and prescribed fires to ambient
PM2.5 organic carbon, J. Geophys. Res.-Atmos., 113, D22302,
doi:10.1029/2008JD010216, 2008
Szidat, S., Ruff, M., Perron, N., Wacker, L., Synal, H.-A., Hallquist,
M., Shannigrahi, A. S., Yttri, K. E., Dye, C., and Simpson, D.:
Fossil and non-fossil sources of organic carbon (OC) and ele-
mental carbon (EC) in Göteborg, Sweden, Atmos. Chem. Phys.,
9, 1521–1535, doi:10.5194/acp-9-1521-2009, 2009.
Teraji, T. and Arakaki, T.: Bimolecular rate constants between lev-
oglucosan and hydroxyl radical: Effects of pH and temperature,
Chem. Lett., 39, 900–901, 2010.
Timonen, H., Saarikoski, S., Tolonen-Kivimäki, O., Aurela, M.,
Saarnio, K., Petäjä, T., Aalto, P. P., Kulmala, M., Pakkanen, T.,
and Hillamo, R.: Size distributions, sources and source areas
of water-soluble organic carbon in urban background air, At-
mos. Chem. Phys., 8, 5635–5647, doi:10.5194/acp-8-5635-2008,
2008.
van Drooge, B. L. and Ballesta, P. P.: Seasonal and daily source ap-
portionment of polycyclic aromatic hydrocarbon concentrations
in PM10 in a semirural European area, Environ. Sci. Technol.,
43, 7310–7316, 2009.
Vicente, A., Alves, C., Monteiro, C., Nunes, T., Mirante, F.,
Cerqueira, M., Calvo, A., Pio, C.: Organic speciation of aerosols
from wildfires in central Portugal during summer 2009, Atmos.
Environ., 57, 186–196, 2012.
Wan, E. C. H. and Yu, J. Z.: Analysis of sugars and sugar polyols
in atmospheric aerosols by chloride attachment in liquid chro-
matography/negative ion electrospray mass spectrometry, Envi-
ron. Sci. Technol., 41, 2459–2466, 2007.
Wang, G., Chen, C., Li, J., Zhou, B., Xie, M., Hu, S., Kawa-
mura, K., and Chen,Y.: Molecular composition and size dis-
tribution of sugars, sugar-alcohols and carboxylic acids in
airborne particles during a severe urban haze event caused
by wheat straw burning, Atmos. Environ., 45, 2473–2479,
doi:10.1016/j.atmosenv.2011.02.045, 2011.
Weimer, S., Alfarra, M. R., Schreiber, D., Mohr, M., Prévôt, A. S.
H., and Baltensperger, U.: Organic aerosol mass spectral signa-
tures from wood-burning emissions: Influence of burning con-
ditions and wood type, J. Geophys. Res.-Atmos., 113, D10304,
doi:10.1029/2007JD009309, 2008.
Yttri, K. E., Dye, C., Slørdal, L. H., and Braathen, O. A.: Quantifi-
cation of monosaccharide anhydrides by liquid chromatography
combined with mass spectrometry: Application to aerosol sam-
ples from an urban and a suburban site influenced by small-scale
wood burning, J. Air Waste Manage., 55, 1169–1177, 2005.
Yttri, K. E., Dye, C., Braathen, O.-A., Simpson, D., and Steinnes,
E.: Carbonaceous aerosols in Norwegian urban areas, At-
mos. Chem. Phys., 9, 2007–2020, doi:10.5194/acp-9-2007-2009,
2009.
Yttri, K. E., Lund Myhre, C., Eckhardt, S., Fiebig, M., Dye, C.,
Hirdman, D., Ström, J., Klimont, Z., and Stohl, A.: Quantify-
ing black carbon from biomass burning by means of levoglu-
cosan – a one-year time series at the Arctic observatory Zeppelin,
Atmos. Chem. Phys., 14, 6427–6442, doi:10.5194/acp-14-6427-
2014, 2014.
www.atmos-meas-tech.net/8/125/2015/ Atmos. Meas. Tech., 8, 125–147, 2015


![A [simple] land cover change intercomparison](https://static.fdocuments.in/doc/165x107/56814f92550346895dbd4da4/a-simple-land-cover-change-intercomparison.jpg)