
An Integrated Regulatory Framework for Digital Networks ... · Centre on Regulation in Europe...
54
Centre on Regulation in Europe (CERRE) asbl Rue de l’Industrie 42 Box 16 - B-1040 Brussels - Belgium Ph: +32 2 230 83 60 - Fax: +32 2 230 83 70 – [email protected] – www.cerre.eu An Integrated Regulatory Framework for Digital Networks and Services A CERRE Policy Report Appendix 2: Imagine 2025 Dr. Ir. Wolter Lemstra (CERRE, TU Delft and Aalborg University) 27 January 2016
Transcript of An Integrated Regulatory Framework for Digital Networks ... · Centre on Regulation in Europe...
Centre on Regulation in Europe (CERRE) asbl
Rue de l’Industrie 42 Box 16 - B-1040 Brussels - Belgium
Ph: +32 2 230 83 60 - Fax: +32 2 230 83 70 – [email protected] – www.cerre.eu
An Integrated Regulatory Framework for
Digital Networks and Services
A CERRE Policy Report
Appendix 2: Imagine 2025
Dr. Ir. Wolter Lemstra (CERRE, TU Delft and Aalborg University)
27 January 2016

160127_CERRE_IntegratedRegulatoryFramework_Appendix 2_Final 2/54
Table of contents
About the author ....................................................................................................................... 4
Acknowledgements .................................................................................................................... 5
1. Introduction ........................................................................................................................ 6
2. Economic development: showing regularities ...................................................................... 7
3. The deployment period of the ICT-driven techno-economic paradigm ................................ 12
4. Core input: All-things-digital, all-things-packet ................................................................... 15
4.1 From physical to virtual: information rules apply ............................................................... 15
4.2 Implications for telecommunications .................................................................................. 16
5. Moore’s Law and fixed networks ....................................................................................... 17
5.1 Developments in the PSTN .................................................................................................. 17
5.2 Developments in the CATV network ................................................................................... 20
6. Moore’s Law and mobile networks .................................................................................... 23
6.1 Next generation mobile: 5G - another application in the cloud .......................................... 23
6.2 Convergence of CT and IT .................................................................................................... 29
6.3 M2M and IoT ....................................................................................................................... 29
6.4 Network virtualisation ......................................................................................................... 31
7. Changes in the industrial organisation of the sector ........................................................... 35
7.1 Decoupling of services and applications from the underlying infrastructures ................... 36
7.2 Level playing field ................................................................................................................ 37
7.3 Digital convergence: the end of dedicated networks .......................................................... 37
7.4 Convergence between broadcasting and mobile ................................................................ 37
7.5 Convergence between fixed and mobile ............................................................................. 38
7.6 Convergence toward next generation points of presence .................................................. 39
7.7 Convergence of mobile and Wi-Fi ....................................................................................... 39
7.8 Convergence between mobile and public safety networks ................................................ 41
8. Robustness of the 2025 image ........................................................................................... 43
8.1 Diffusion of the ICT-driven techno-economic paradigm ..................................................... 43
8.1.1 Moore’s Law .................................................................................................................... 43
8.1.2 Growth trends .................................................................................................................. 44
8.1.3 Trust and privacy – cybercrime and big data ................................................................... 45
160127_CERRE_IntegratedRegulatoryFramework_Appendix 2_Final 3/54
8.2 The role of innovation: past, present and future ................................................................ 45
8.3 Shell scenarios ..................................................................................................................... 48
9. Concluding remarks........................................................................................................... 51
References ............................................................................................................................... 52
160127_CERRE_IntegratedRegulatoryFramework_Appendix 2_Final 4/54
About the author
Dr. Ir. Wolter Lemstra is a CERRE Research Fellow, Senior Research Fellow at the Faculty
Technology, Policy & Management of the TUDelft, Visiting Researcher at Aalborg University
and Senior Lecturer at the Strategy Academy, the Netherlands. His research interests are the
developments of the telecommunication sector in relation to firm strategy and government
policy, and the role of governance regimes and the institutional environment. He thereby
links his academic interests to 25 years of experience in the telecom sector. He occupied
senior management positions in the field of engineering and product management, sales
and marketing, strategy and business development. Most recently he was a Member of the
Senior Management Team and Vice-President at Lucent Technologies, responsible for
marketing and business development in the Europe, Middle East and Africa region.
He has been a Faculty Member of Delft TopTech, the School for post graduate and executive
education at TUDelft. He was the Corporate Liaison Director of LIRNE – Learning Initiatives
on Reforms in Network Economies, a cooperation of experts at TUDelft, the Technical
University of Denmark, the London School of Economics, and the LINK Centre at the
University of Witwatersrand, South Africa. He was a Faculty Member of the e-Governance
Masters program at the Ecole Polytechnique Fédérale de Lausanne (EPFL), in Switzerland.

160127_CERRE_IntegratedRegulatoryFramework_Appendix 2_Final 5/54
Acknowledgements
The author wishes to thank Prof. Dr. Ignas Niemegeers, TU Eindhoven, Ir. Peter Anker, Senior
Policy Advisor, Ministry of Economic Affairs, both in the Netherlands, and Prof. Dr. William
H. Melody, Aalborg University, Denmark, for their review of a previous version of this
document and for their very useful suggestions.

160127_CERRE_IntegratedRegulatoryFramework_Appendix 2_Final 6/54
1. Introduction
This paper explores the developments in the electronic communications industry towards
the 2025 horizon. The image of the future is constructed based on an exploration of the
trends that are underlying current developments. This image is complemented with a
reflection on innovation, by looking back ten years to anticipate what might happen in the
coming ten years.
The broader context applied derives from the reasoned history of technological
developments, from the First Industrial Revolution in the UK to the current day ICT-driven
revolution being global in nature. Each subsequent technological revolution reflects a degree
of regularity as well as unique features. We use this stylised model of economic
developments to capture the ‘installation’ and ‘diffusion’ of a new techno-economic
paradigm.
The core input of the current techno-economic paradigm are the ‘chips’, the silicon based
processing entities which double in capacity approximately every 18 months while costs
remain roughly the same. This regularity drives both the supply side and the demand side of
the electronic communications industry. We explore the implications of this so-called
Moore’s Law for both the fixed and mobile market.
For the fixed market it implies an extension of the ‘life of copper networks’ and for the
mobile market it implies development towards a ‘virtual utility’.
The anticipated technological developments form the bases for reflections on the likely
changes in industrial organisation, including the implications for regulation. Special attention
is given to various forms of convergence.
The report concludes with a reflection on the robustness of the 2025 image.

160127_CERRE_IntegratedRegulatoryFramework_Appendix 2_Final 7/54
2. Economic development: showing regularities
Economic developments are not smooth, but are characterised by ups and downs. Changes
in demand typically result in investment cycles, such as the popular ‘pig cycle’. In addition,
economists have identified an inventory cycle (the so-called Kitchin cycle of 4-5 years), a
capital goods cycle (Juglar cycle of 7-11 years) and a building cycle (Kuznets cycle of 15-25
years) (De Wit, 1994).
Next to these relatively short cycles, a long wave in economic development covering 40-60
years has been identified, the so-called Kondratieff cycle. This cycle has long been associated
with economic crisis on the one hand and expansion related to technology and trade on the
other (Freeman, 1998). Schumpeter made the link to innovation, and in particular the
clustering or discontinuities in technical innovation, as the driving force behind the long
wave in economic development (Kleinknecht, 1987). Kleinknecht also points to other,
complementary forces that are driving the long wave, identified by Van Gelderen and De
Wolff: “In each upswing of the long wave, the production of investment goods will expand
more rapidly than the production of consumer goods” (Kleinknecht, 1987 p3-4). There is also
the hypothesis by Van Gelderen on the availability of cheap loan capital together with a low
price level at the end of a long wave depression. From his research Kleinknecht concludes
that Schumpeter’s hypothesis about long waves in economic life and an uneven distribution
over time of radical innovations can be defended, not only in time but also in certain sectors.
The theoretical explanation is to be found in the: “…reallocation of R&D and other
investments towards new technological paradigms in response to the rien ne va plus during
the long wave depression” combined with “...an endogenously caused over-expansion and
depreciation of capital stock… [that] is caused by an expansionary self-ordering feedback
loop: to satisfy demand for investment goods from the consumer goods sector, the capital
goods producing sector itself has to expand its capacity, ordering capital goods for the
production of capital goods.” Furthermore, Kleinknecht argues, “…the hypothesis seems
plausible that prolonged depressions not only trigger a reallocation of innovative resources
but also create strong pressure towards social, political and institutional change”.
(Kleinknecht, 1987 p197-213) Freeman and Soete underline this broader perspective that:
“…clusters of radical technical innovations do also lead to major disruptions not just in the
production sphere but also in the broad social, institutional and organisational sphere”
(Freeman & Soete, 1997 p330).
Of particular interest in our project is the link between Schumpeterian innovation, the
emergence of new industries and the building of new related infrastructures, a link provided
by De Wolff. This linkage is made more explicit through the interpretation of regularities in
history by Freeman, Louçã and Perez. Freeman and Louçã have further explored the notion
of Long Waves and thereby argued a case for the application of ‘reasoned history’ as “…an
approach to economic history including technological innovations, structural changes, and
the co-evolution of economic and social movements within the framework of institutional
settings and modes of regulation” (Freeman & Louçã, 2001 p123).

160127_CERRE_IntegratedRegulatoryFramework_Appendix 2_Final 8/54
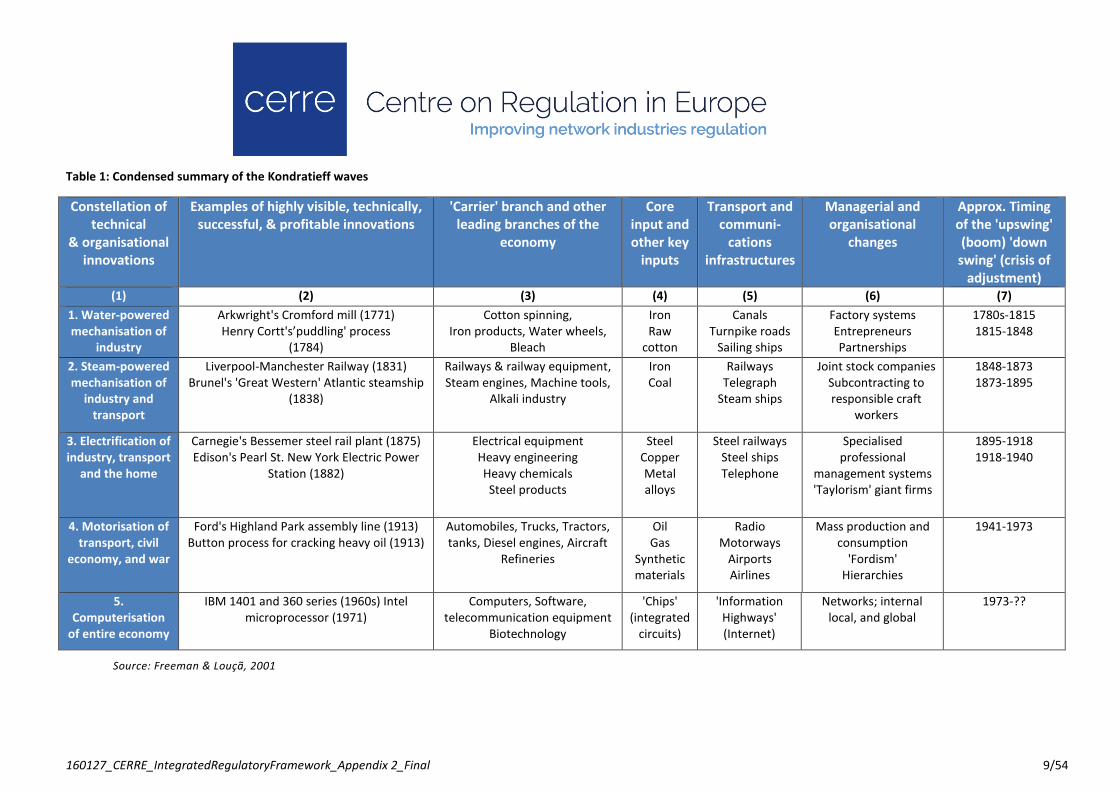
On the basis of the Theory of Reasoned History, Freeman and Louçã explore recurrent
phenomena in history, i.e. the successive Industrial Revolutions. See Table 1 for a condensed
summary of the Kondratieff waves as analysed and described by Freeman and Louçã
(Freeman & Louçã, 2001 p141).
160127_CERRE_IntegratedRegulatoryFramework_Appendix 2_Final 9/54
Table 1: Condensed summary of the Kondratieff waves
Source: Freeman & Louçã, 2001
Constellation of
technical
& organisational
innovations
Examples of highly visible, technically,
successful, & profitable innovations
'Carrier' branch and other
leading branches of the
economy
Core
input and
other key
inputs
Transport and
communi-
cations
infrastructures
Managerial and
organisational
changes
Approx. Timing
of the 'upswing'
(boom) 'down
swing' (crisis of
adjustment)
(1) (2) (3) (4) (5) (6) (7)
1. Water-powered
mechanisation of
industry
Arkwright's Cromford mill (1771)
Henry Cortt's’puddling' process
(1784)
Cotton spinning,
Iron products, Water wheels,
Bleach
Iron
Raw
cotton
Canals
Turnpike roads
Sailing ships
Factory systems
Entrepreneurs
Partnerships
1780s-1815
1815-1848
2. Steam-powered
mechanisation of
industry and
transport
Liverpool-Manchester Railway (1831)
Brunel's 'Great Western' Atlantic steamship
(1838)
Railways & railway equipment,
Steam engines, Machine tools,
Alkali industry
Iron
Coal
Railways
Telegraph
Steam ships
Joint stock companies
Subcontracting to
responsible craft
workers
1848-1873
1873-1895
3. Electrification of
industry, transport
and the home
Carnegie's Bessemer steel rail plant (1875)
Edison's Pearl St. New York Electric Power
Station (1882)
Electrical equipment
Heavy engineering
Heavy chemicals
Steel products
Steel
Copper
Metal
alloys
Steel railways
Steel ships
Telephone
Specialised
professional
management systems
'Taylorism' giant firms
1895-1918
1918-1940
4. Motorisation of
transport, civil
economy, and war
Ford's Highland Park assembly line (1913)
Button process for cracking heavy oil (1913)
Automobiles, Trucks, Tractors,
tanks, Diesel engines, Aircraft
Refineries
Oil
Gas
Synthetic
materials
Radio
Motorways
Airports
Airlines
Mass production and
consumption
'Fordism'
Hierarchies
1941-1973
5.
Computerisation
of entire economy
IBM 1401 and 360 series (1960s) Intel
microprocessor (1971)
Computers, Software,
telecommunication equipment
Biotechnology
'Chips'
(integrated
circuits)
'Information
Highways'
(Internet)
Networks; internal
local, and global
1973-??

160127_CERRE_IntegratedRegulatoryFramework_Appendix 2_Final 10/10
In pointing to recurrence, they caution the reader: “we should re-emphasise here our belief
that this recurrence is limited in scope and content. Each technological revolution and each
phase of economic growth has its own unique features. This does not mean, however, that
we cannot learn a great deal from even this limited recurrence as well as from unique
events…. …The work of Carlota Perez (1983, 1985, 1988) on long waves has shown that,
even if identical behaviour is ruled out, as it must be, there may still be striking similarities or
dissimilarities and some hidden ones too, which are helpful in understanding the
phenomena and even in making probabilistic forecasts and indications for policy” (Freeman
& Louçã, 2001 p130-1).
In her 2002 book ‘Technological revolutions and financial capital: The dynamics of bubbles
and golden ages’, Perez has expanded on her suggestions captured by Freeman. In observing
the ‘boundless rise of two forces: the information revolution and financial markets’ in the
last quarter of the twentieth century, she argues that: “productivity explosions and bursts of
financial excitement leading to economic euphoria and subsequent collapse of confidence
have occurred together before. They are interrelated and interdependent phenomena; they
share the same root cause and are in the nature of the system and its workings. They
originate in the way technologies evolve by revolutions, in the peculiar manner in which
these great upsurges of wealth creating potential are assimilated by the economic and social
system and in the functional separation of financial and production capital” (Perez, 2002
pxvii). Based on historical analysis she shows that the sequence of ‘technological revolution
– financial bubble – collapse – golden age – political unrest’, is recurring about every half
century. This recurrence is considered to be based on: “causal mechanisms that are the
nature of capitalism, which stem from the features of the system, which interact with and
influence one another:
1. The fact that technological change occurs by clusters of radical innovations forming
successive and distinct revolutions that modernise the whole productive structure;
2. The functional separation between financial and production capital, each pursuing
profits by different means; and
3. The much greater inertia and resistance to change of the socio-institutional
framework in comparison with the techno-economic sphere, which is spurred by
competitive pressures.” (p5-6)
In the early phases there is the battle of the new paradigm with the power of the old
paradigm, which is “ingrained in the established production structure and embedded in the
socio-cultural environment and in the institutional framework.” When this battle is won the
new paradigm diffuses across the whole of the economy and society. Hence, the diffusion of
the new paradigm can be seen as two distinct periods, the ‘installation period’ and the
‘deployment period’, both typically lasting 20-30 years. The ‘turning point’ from the
installation to the deployment is “usually a period of serious recession, involving a re-
composition of the whole system, in particular of the regulatory context that enables the
resumption of growth and the full fructification of the technological revolution.” (p36)

160127_CERRE_IntegratedRegulatoryFramework_Appendix 2_Final 11/54
The ensuing life cycle of a technological revolution is shown Figure 1.
Figure 1: Great Surge model
Source: Perez, 2002
Time
Degreeof diffusion
of thetechnological
revolution
Rec
essi
ve in
terv
al
Installation period Deployment period
Techno-economic splitIrruption of the technological revolutionDeclined of old industriesUnemployment
Irruption
Frenzy
Synergy
Maturity
Financial bubble timeIntensive investment in the revolutionDecoupling of the whole systemPolarization of rich and poorGilded Age
Socio-political splitLast products and industriesMarket saturation andtechnological maturity of main industriesDisappointment vs. complacencyGolden Age
Coherent growthwith increasing externalitiesProduction and employment
Turningpoint
PreviousGreatSurge
NextGreatSurge
Institutionalrecomposition Next
big-bangbig-bang Crash
160127_CERRE_IntegratedRegulatoryFramework_Appendix 2_Final 12/54
3. The deployment period of the ICT-driven techno-
economic paradigm
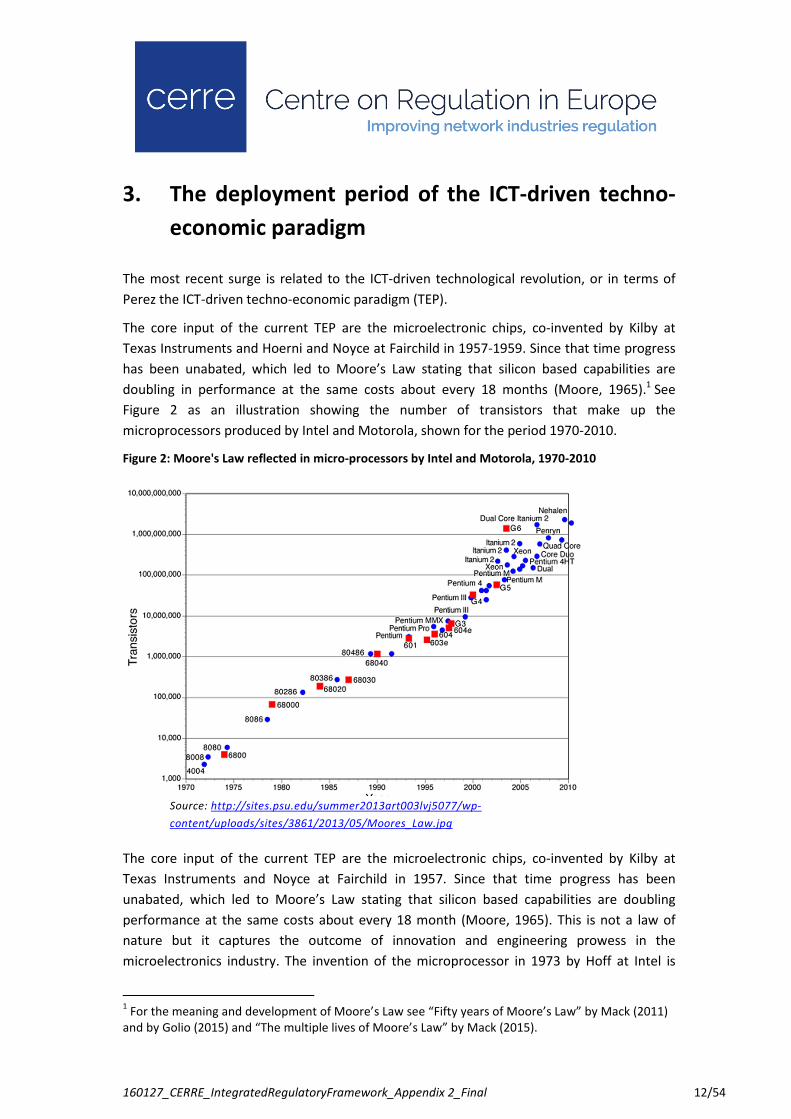
The most recent surge is related to the ICT-driven technological revolution, or in terms of
Perez the ICT-driven techno-economic paradigm (TEP).
The core input of the current TEP are the microelectronic chips, co-invented by Kilby at
Texas Instruments and Hoerni and Noyce at Fairchild in 1957-1959. Since that time progress
has been unabated, which led to Moore’s Law stating that silicon based capabilities are
doubling in performance at the same costs about every 18 months (Moore, 1965).1 See
Figure 2 as an illustration showing the number of transistors that make up the
microprocessors produced by Intel and Motorola, shown for the period 1970-2010.
Figure 2: Moore's Law reflected in micro-processors by Intel and Motorola, 1970-2010
Source: http://sites.psu.edu/summer2013art003lvj5077/wp-
content/uploads/sites/3861/2013/05/Moores_Law.jpg
The core input of the current TEP are the microelectronic chips, co-invented by Kilby at
Texas Instruments and Noyce at Fairchild in 1957. Since that time progress has been
unabated, which led to Moore’s Law stating that silicon based capabilities are doubling
performance at the same costs about every 18 month (Moore, 1965). This is not a law of
nature but it captures the outcome of innovation and engineering prowess in the
microelectronics industry. The invention of the microprocessor in 1973 by Hoff at Intel is
1 For the meaning and development of Moore’s Law see “Fifty years of Moore’s Law” by Mack (2011)
and by Golio (2015) and “The multiple lives of Moore’s Law” by Mack (2015).
160127_CERRE_IntegratedRegulatoryFramework_Appendix 2_Final 13/54
considered the milestone marking the beginning of the ICT-driven techno-economic
paradigm – the ‘big bang’ and the period of eruption as indicated in Figure 1. Moore’s Law is
both supply-side and demand-side driver.
The installation period was first characterised by an IT-based revolution in the 1980s, with
deep investment in computing power in anticipation of significant productivity
improvements. However, at the aggregate level no major improvements could be observed.
This led to the formulation by Solow of the productivity paradox. Firm level analysis by
Brynjolfson et al. has shown that next to investment in computer hardware, complementary
investments are required in software, in human resources and in the redesign of business
processes before the envisaged productivity improvements can be realized (Brynjolfson,
1992; Brynjolfson & Hitt, 1998).
The IT-based revolution was followed by a CT-based revolution in the 1990s. This period was
characterised by a boom in communications infrastructure spending, fueled by a rise in
bandwidth demand through the emergence of the Internet and through the popularity of
mobile communications. The euphoric period ended with a crash in the year 2000. We are
now in the middle of the deployment period, which lasts approximately 30 years. This is the
period in which the revolution spreads further, from the ICT-producing and ICT-intensive
industries affected during the installation period, to all other economic sectors and across
society at large.
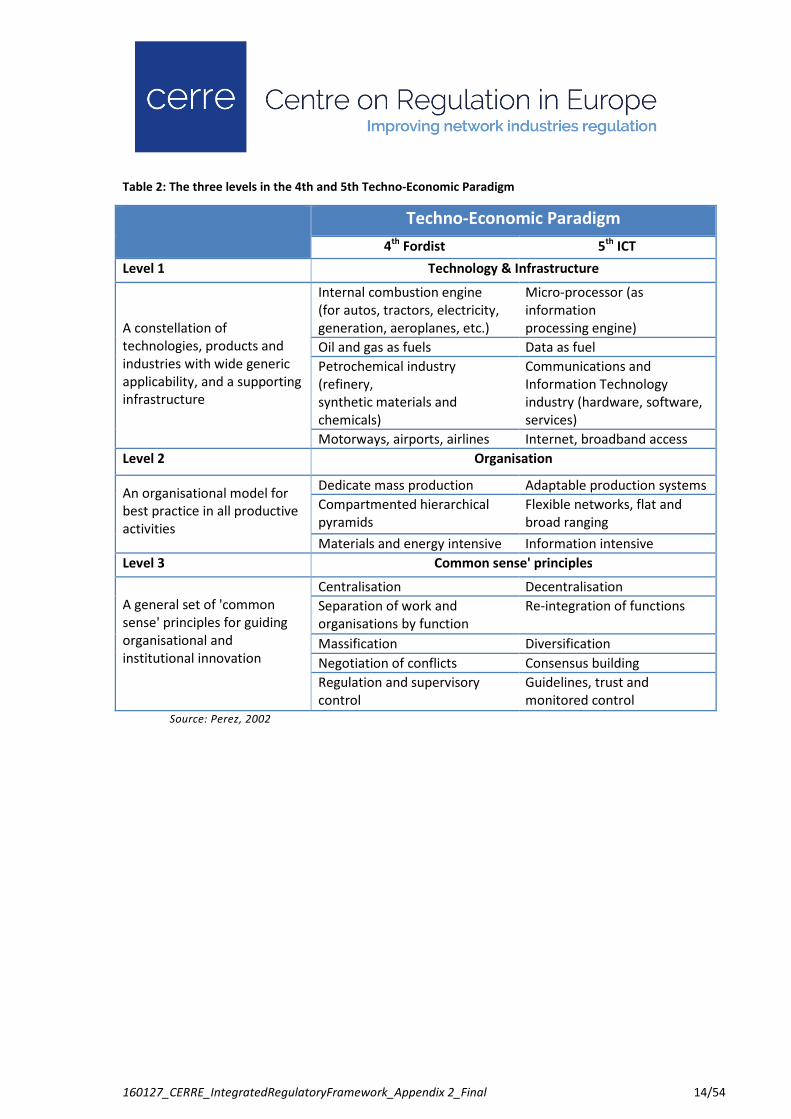
This deployment is characterised by constant reciprocal action between the three spheres of
change: technological, institutional and economic. The process of change reflects the
transformation from the previous Fordist-based techno-economic paradigm and its best
practices, to the current ICT-based techno-economic paradigm. Table 2 reflects the main
differences: at Level 1 in the core technology and infrastructure; at Level 2 the industrial
organisation; and at Level 3 the ‘common sense’ principles or best practices (derived from:
Perez, 2002). For a more detailed comparison see Lemstra (2006).
160127_CERRE_IntegratedRegulatoryFramework_Appendix 2_Final 14/54
Table 2: The three levels in the 4th and 5th Techno-Economic Paradigm
Techno-Economic Paradigm
4th
Fordist 5th
ICT
Level 1 Technology & Infrastructure
A constellation of
technologies, products and
industries with wide generic
applicability, and a supporting
infrastructure
Internal combustion engine
(for autos, tractors, electricity,
generation, aeroplanes, etc.)
Micro-processor (as
information
processing engine)
Oil and gas as fuels Data as fuel
Petrochemical industry
(refinery,
synthetic materials and
chemicals)
Communications and
Information Technology
industry (hardware, software,
services)
Motorways, airports, airlines Internet, broadband access
Level 2 Organisation
An organisational model for
best practice in all productive
activities
Dedicate mass production Adaptable production systems
Compartmented hierarchical
pyramids
Flexible networks, flat and
broad ranging
Materials and energy intensive Information intensive
Level 3 Common sense' principles
A general set of 'common
sense' principles for guiding
organisational and
institutional innovation
Centralisation Decentralisation
Separation of work and
organisations by function
Re-integration of functions
Massification Diversification
Negotiation of conflicts Consensus building
Regulation and supervisory
control
Guidelines, trust and
monitored control
Source: Perez, 2002
160127_CERRE_IntegratedRegulatoryFramework_Appendix 2_Final 15/54
4. Core input: All-things-digital, all-things-packet
The ‘core input’ (see Table 1) to the current techno-economic paradigm (TEP) – the use of
integrated circuits – has led to the ‘digitisation’ of all information inputs, which subsequently
allowed for digital transmission, storage and processing of information. During the
installation period of the current TEP, the transmission and switching in the communications
networks have changed from analogue to digital. With the introduction of the Internet in the
second half of the 1990s came a further change from circuit-mode to packet-mode
switching. And as the Internet is subsuming all types of previously dedicated networks for
information transport and communication, the Internet has become the ‘transport and
communications infrastructure’ of the current TEP. The use of the TCP/IP protocol stack,
being central to the Internet, has effectively decoupled the applications and services from
the characteristics of the underlying networks, whether they are fixed or mobile, and
whether they use copper, fibre or radio waves as the transport medium.
4.1 From physical to virtual: information rules apply
In contrast to the earlier techno-economic paradigms, where the ‘propellant’ was physical,
i.e. water, steam, electricity and oil, the current paradigm is propelled by information. With
the low transportation costs and extremely low reproduction costs of information the
economics of this revolution are different from previous technological revolutions: today
‘information rules for the networked economy’ apply. Examples of these ‘information rules’
are (Shapiro & Varian, 1999):
• Technology changes. Economic laws do not;
• Information is an experience good, consumers must experience it to value it;
• Information should be priced for its value not its costs;
• The Internet makes it easy to personalise information products, thereby adding
value;
• For digital content, production is reproduction;
• Network effects lead to demand side economies of scale and positive feedback;
• Supply-side and demand side economies of scale combine to make positive
feedback in the network economy especially strong;
• Positive feedback makes the strong grow stronger… …and the weak grow weaker.
The ‘information rules’, often in combination with the ubiquity of the Internet, have changed
in a fundamental way how business is conducted: it has caused the demise of industry
sectors, such as that for music recording and playback equipment; it has changed business
paradigms, e.g. from ‘print-distribute’ to ‘distribute-print’; it has led to disintermediation,
e.g. in the travel business. The full diffusion of the new techno-economic paradigm will
require reconceptualisation of all activities to be able to reap the full benefits.
160127_CERRE_IntegratedRegulatoryFramework_Appendix 2_Final 16/54
4.2 Implications for telecommunications
While electronic communications infrastructures are subject to network effects, it is the
services and application that are provided over these physical infrastructures that are
subject to the ‘information rules for the networked economy’. This applies in particular to
the so-called ‘over-the-top’ (OTT) services and applications.
By allowing users to connect for a fee to their access network, telecom operators, or rather
Internet service providers (ISPs), grant these users access to the globally interconnected
communication network, i.e., yesterday’s telephone network and today’s Internet. The ISPs
thereby allow the access users to benefit from the global network effects that have been
realised, which can be called the network-level network effect.
Thanks to the globally interconnected Internet, whereby all communications firms are
complying with the Internet protocol stack, this interconnection is irrespective of geography.
Using this connectivity, the OTT-services firms can deliver OTT-services to their subscribers
wherever they are connected to the Internet. In this way a secondary network effect can be
realised among users of the online service – a service-level network effect. The size of this
network effect depends on the number of users of the specific online service, e.g. the
number of WhatsApp users. In principle, it can replicate the size of the network-level
network effect.
At the network level, ‘all things digital’ and ‘all things packet’ are also leading to various
forms of convergence at the services level. For further discussion, see Section 7. The
virtualisation as it applies to mobile communications is the topic of Section 6.4. But first we
will explore the implications of Moore’s Law on fixed networks, reviewing the past and the
expectations for the future in Section 5. This is followed by a discussion of the impact of
Moore’s Law on mobile networks in Section 6.
160127_CERRE_IntegratedRegulatoryFramework_Appendix 2_Final 17/54
5. Moore’s Law and fixed networks
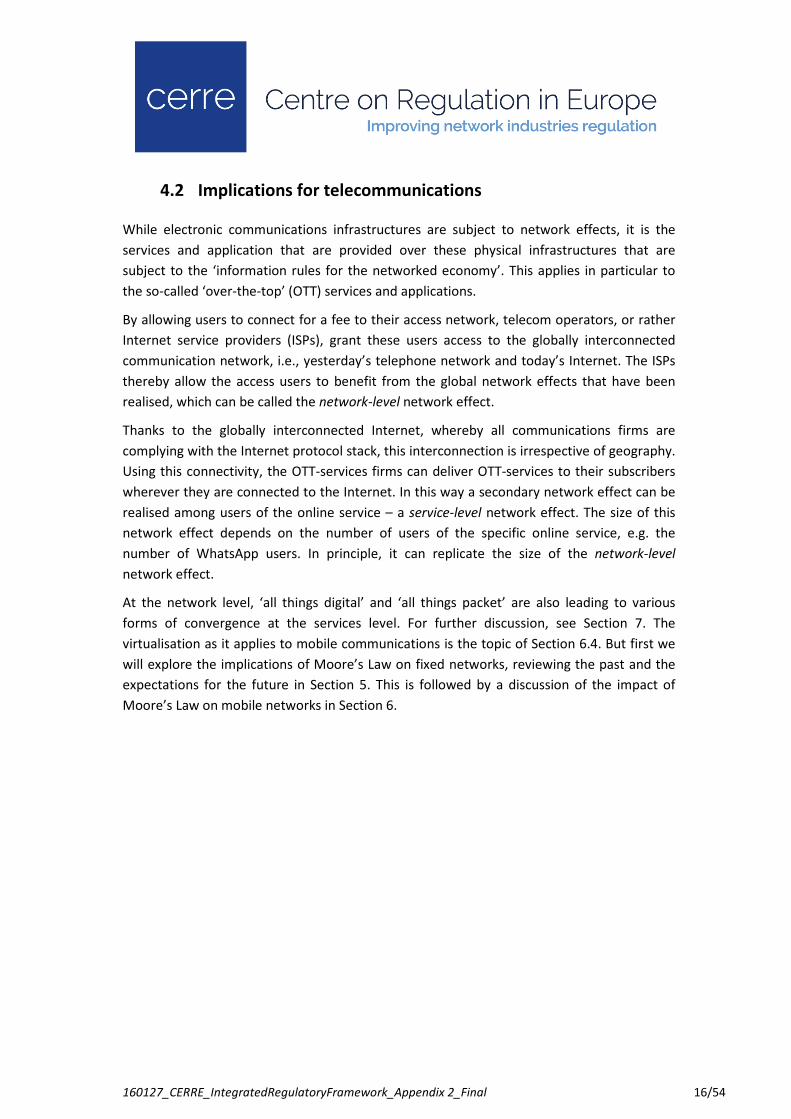
The progress in signal processing power is also visible in fixed broadband networks. See
Figure 3 for an overview of the theoretical rates of the various DSL access technologies.
Figure 3: Evolution of DSL data rates, 1995-2020
Source: FttH Council Europe, 2014
5.1 Developments in the PSTN
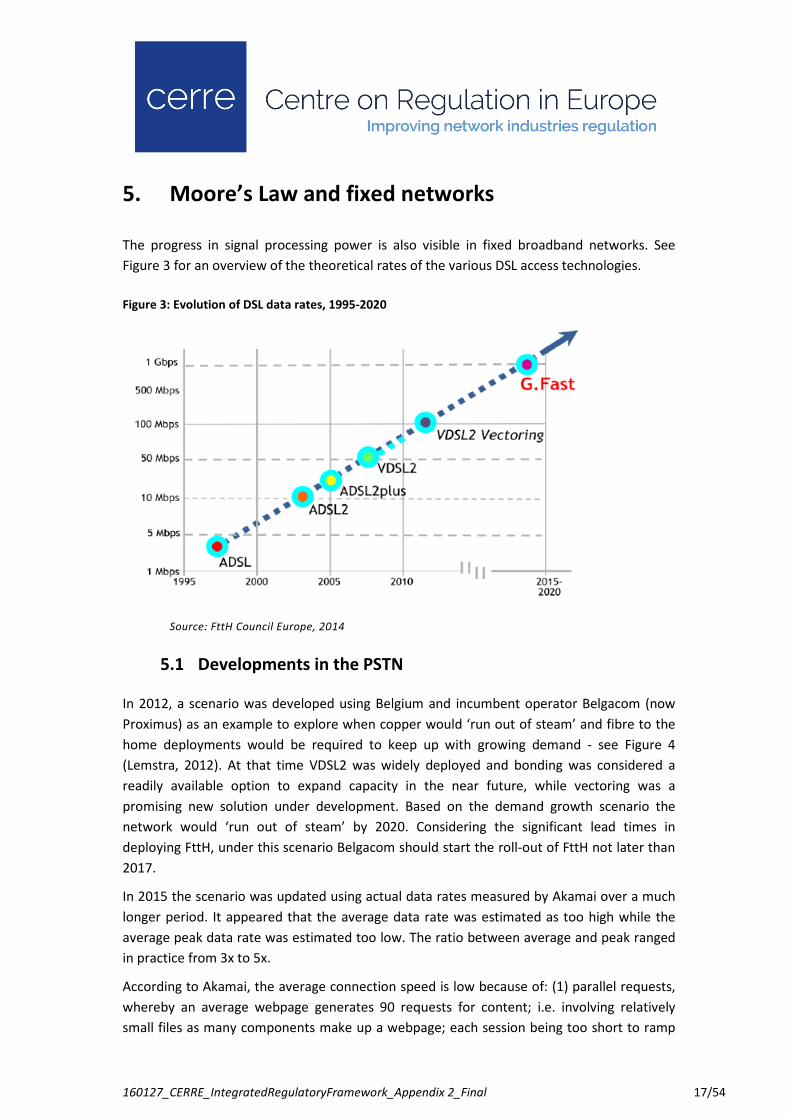
In 2012, a scenario was developed using Belgium and incumbent operator Belgacom (now
Proximus) as an example to explore when copper would ‘run out of steam’ and fibre to the
home deployments would be required to keep up with growing demand - see Figure 4
(Lemstra, 2012). At that time VDSL2 was widely deployed and bonding was considered a
readily available option to expand capacity in the near future, while vectoring was a
promising new solution under development. Based on the demand growth scenario the
network would ‘run out of steam’ by 2020. Considering the significant lead times in
deploying FttH, under this scenario Belgacom should start the roll-out of FttH not later than
2017.
In 2015 the scenario was updated using actual data rates measured by Akamai over a much
longer period. It appeared that the average data rate was estimated as too high while the
average peak data rate was estimated too low. The ratio between average and peak ranged
in practice from 3x to 5x.
According to Akamai, the average connection speed is low because of: (1) parallel requests,
whereby an average webpage generates 90 requests for content; i.e. involving relatively
small files as many components make up a webpage; each session being too short to ramp
160127_CERRE_IntegratedRegulatoryFramework_Appendix 2_Final 18/54
up to maximum speed; and (2) IP address sharing, whereby multiple devices use an internet
connection with an unique IP address, with simultaneous requests sharing the available
bandwidth. The average peak connection speed reflects the highest connection speeds from
each unique IP address. Thereby it is representative of internet connection capacity. It
reflects larger files, such as software updates occurring late at night (Akamai, 2015).
Figure 4: The useful life of copper, 2012 perspective
Source: Lemstra, 2012
In the updated scenario the data rates are extrapolated using the 16% annual growth rate
representative for the past 5 years. Moreover, the much earlier and wide deployment of
vectoring by Proximus is reflected. The new scenario suggests that the use of vectoring runs
out of steam by 2018. Looking into the future, bonding is still a readily available option but it
comes at doubling the cost. Moreover, progress on the G.fast standard suggests possible
large scale deployments within the 2020 timeframe to cater to growing demand –see Figure
5 (Lemstra, 2015). Note that G.fast implies bringing fibre closer to the home, from the
cabinet to the distribution point.
160127_CERRE_IntegratedRegulatoryFramework_Appendix 2_Final 19/54
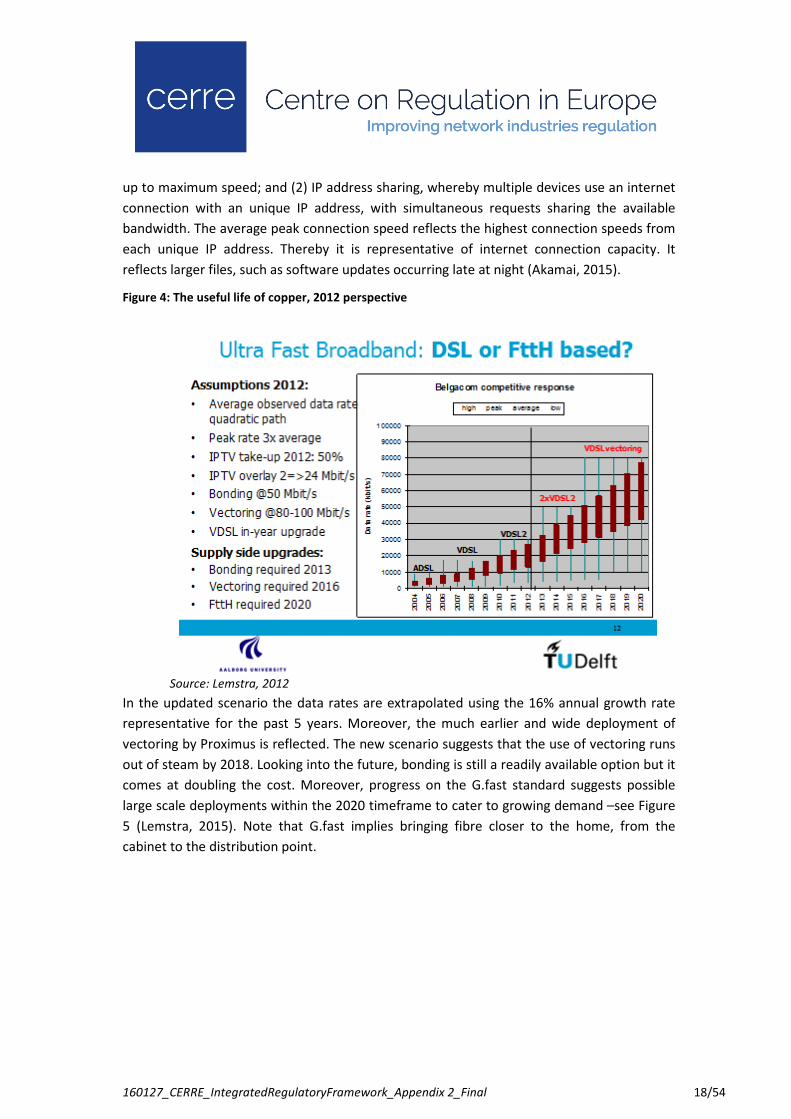
Figure 5: The useful life of copper, 2015 perspective
Source: Lemstra, 2015
Staying with the Belgium-Proximus scenario and applying the current growth rate of 16% for
average data rates2, the scenario projects an average data rate of 50 Mbit/s and an average
peak rate of approximately 220 Mbit/s for the year 2025 - see Figure 6. With many G.fast
trials underway and the first commercial deployments being announced, broad deployment
of G.fast could start in 2018, thereby solving the looming VDSL2+G.vector bottleneck in the
2015 scenario. The predicted capacity of FttDP+G.fast+G.vector on copper loops of 100
meters or less is given as at least 250 Mbit/s symmetrical. Under this scenario the useful life
of copper would be extended well beyond 2025. The deployment of fibre would have to be
extended to the distribution point, the basement of a multi-dwelling unit or the street access
of individual homes, thereby reducing the serving areas to micro-nodes of 1-16 subscribers.
2 This growth rate applies to the Internet in general. The derived CAGR of 16% is comparable to the
growth rate of 15% for video bandwidth over the period 2011-2020 as used by Alcatel-Lucent Bell
Labs in its outlook. (Alcatel-Lucent, 2013) It is consistent with the data reported by Cisco for Western
Europe over the period 2014-2019: broadband data rates growth at 18%; total IP traffic at 21% CAGR;
consumer web, email and data traffic at 13%; consumer file sharing traffic -3%; consumer internet
video traffic 31%; consumer managed IP traffic 12%; and business IP traffic 18%. (Cisco, 2015)

160127_CERRE_IntegratedRegulatoryFramework_Appendix 2_Final 20/54
Figure 6: The useful life of copper, 2025 perspective
Source: Lemstra, 2015
5.2 Developments in the CATV network
The CATV-cable network operators, such as Telenet in Belgium, have always been in a more
comfortable position as the coax cable has an inherently higher bandwidth. The use of
DOCSIS 3.0 modems allowed them to offer data rates well above 100 Mbit/s, though actual
rates may be lower due to the sharing of the final part of the access among multiple
subscribers. The capacity can be increased by reducing the group size and/or using more
capacity in the tertiary network.
Looking into the future, the availability of DOCSIS3.1, which implies a transition to OFDM-
based modulation techniques, is being advertised with a maximum download rate of 10
Gbit/s and upload of 1 Gbit/s (NLkabel, 2014; Rohde&Schwarz, 2015). Hence, CATV-cable
operators are able to stay well ahead of the rates that can be offered on twisted pair copper.
Note that the Belgium-Proximus scenario can be considered typical for West-European
countries, whereby Belgium is characterised by a strong push of IP-TV by the incumbent
operator, as well as an early and wide deployment of vectoring.
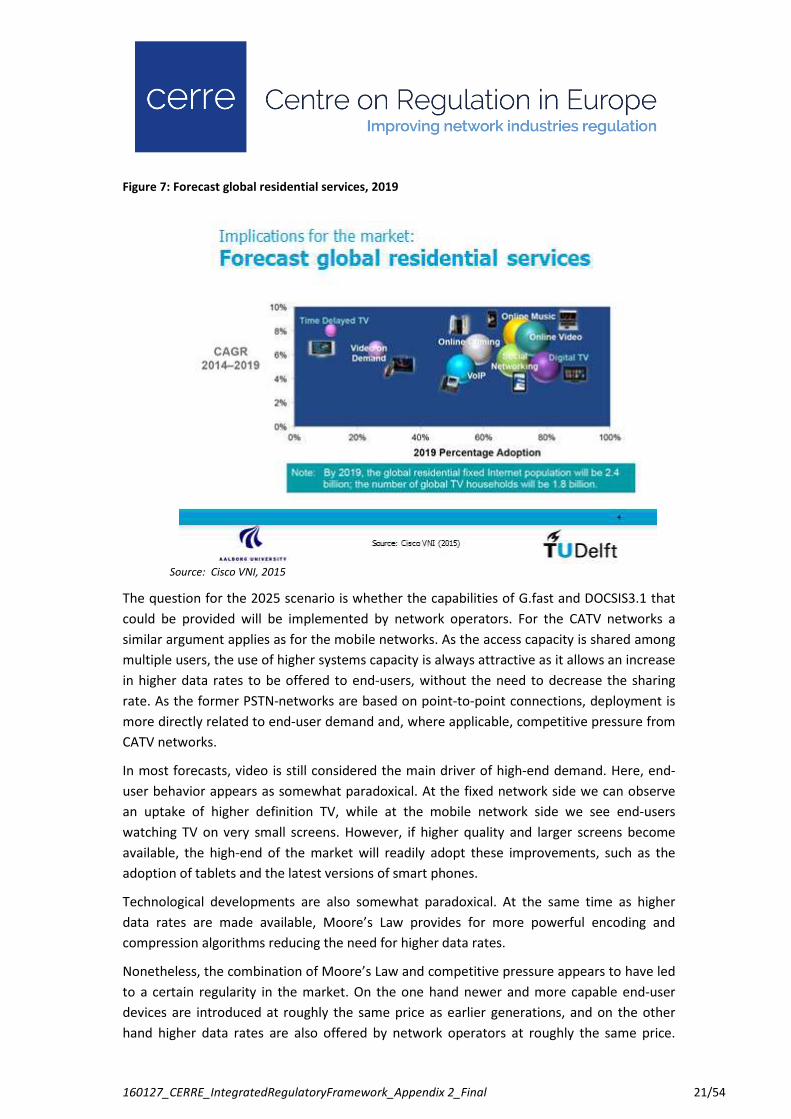
Figure 7 presents Cisco’s forecast for residential services in terms of growth rate and
penetration for the 2019 horizon. In 2019, 4k video is expected to account for 21% of all
video-on-demand traffic (Cisco, 2015).
160127_CERRE_IntegratedRegulatoryFramework_Appendix 2_Final 21/54
Figure 7: Forecast global residential services, 2019
Source: Cisco VNI, 2015
The question for the 2025 scenario is whether the capabilities of G.fast and DOCSIS3.1 that
could be provided will be implemented by network operators. For the CATV networks a
similar argument applies as for the mobile networks. As the access capacity is shared among
multiple users, the use of higher systems capacity is always attractive as it allows an increase
in higher data rates to be offered to end-users, without the need to decrease the sharing
rate. As the former PSTN-networks are based on point-to-point connections, deployment is
more directly related to end-user demand and, where applicable, competitive pressure from
CATV networks.
In most forecasts, video is still considered the main driver of high-end demand. Here, end-
user behavior appears as somewhat paradoxical. At the fixed network side we can observe
an uptake of higher definition TV, while at the mobile network side we see end-users
watching TV on very small screens. However, if higher quality and larger screens become
available, the high-end of the market will readily adopt these improvements, such as the
adoption of tablets and the latest versions of smart phones.
Technological developments are also somewhat paradoxical. At the same time as higher
data rates are made available, Moore’s Law provides for more powerful encoding and
compression algorithms reducing the need for higher data rates.
Nonetheless, the combination of Moore’s Law and competitive pressure appears to have led
to a certain regularity in the market. On the one hand newer and more capable end-user
devices are introduced at roughly the same price as earlier generations, and on the other
hand higher data rates are also offered by network operators at roughly the same price.
160127_CERRE_IntegratedRegulatoryFramework_Appendix 2_Final 22/54
Given the enduring nature of Moore’s Law we may expect this regularity to continue, most
likely into the 2025 time frame.
In terms of industry structure, this outlook suggests a continuation of the role of legacy
networks, the incumbent PSTN and CATV networks both turned into All-IP networks. With
the introduction of FttC+VDSL, the network economics already forced most alternative
operators to climb down the ‘ladder of investment’, from physical unbundling to virtual
unbundling. With G.fast this trend is being re-enforced, as the fiber-based aggregation
points are moving deeper into the access network, each capturing fewer subscribers.
With infrastructure-based competition being well established where legacy networks are
present, the rational for asymmetric access regulation has disappeared. Combined with the
notion that ‘two may not be enough’ to assure a well-functioning competitive market, the
question to be answered at the outset of the next regulatory period is whether symmetric
access regulation should be applied.
Where fiber to the home is deployed, alternative access is typically dependent on the
deployment of point-to-point architectures. With the prospect of wavelength multiplexing
on passive optical networks, PON may be able to provide for alternative access. This would
allow for competition at a more attractive cost level.
Where FttH is realised through state aid, open access is typically a condition for obtaining
the funds.
160127_CERRE_IntegratedRegulatoryFramework_Appendix 2_Final 23/54
6. Moore’s Law and mobile networks
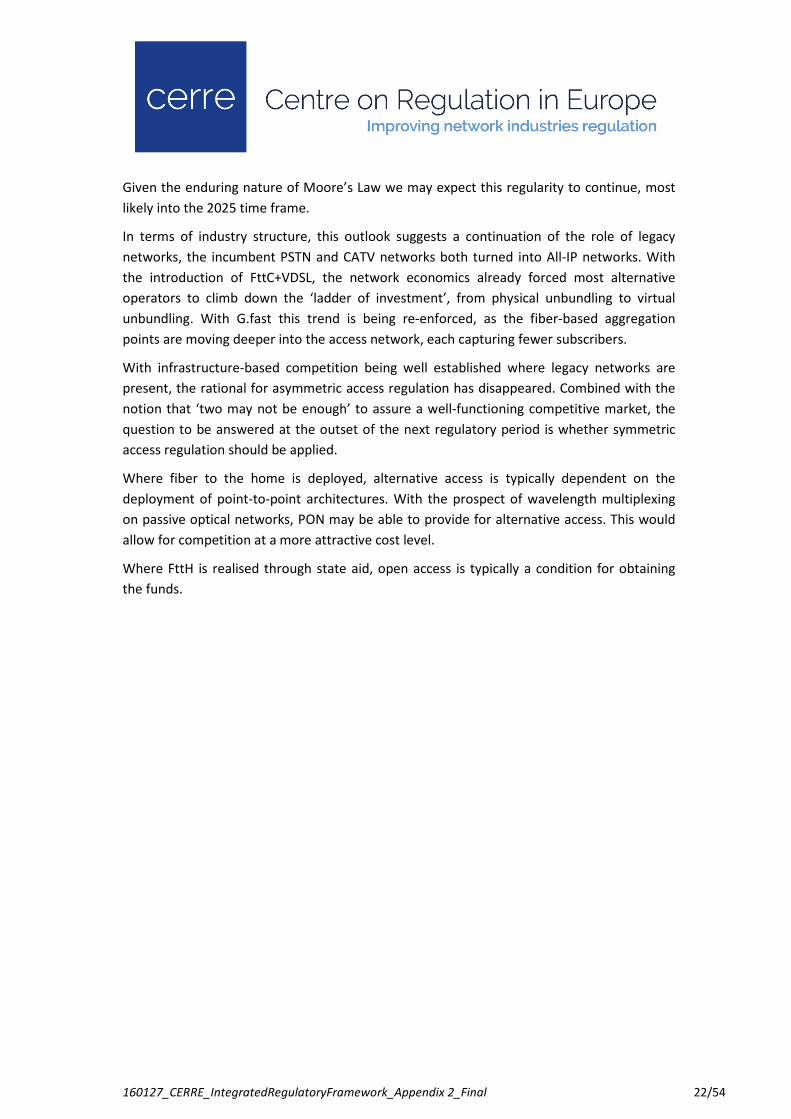
Moore’s Law is very clearly reflected in the growth in data rates, in particular those achieved
in mobile communications - see Figure 8 (Niemegeers & Heemstra de Groot, 2015). This is
essentially the result of more capable signal processing allowing for higher order modulation
techniques to be applied. We may expect this trend to continue.
Figure 8: Peak data rates in mobile, 1990-2020
Source: Niemegeers & Heemstra de Groot, 2015
6.1 Next generation mobile: 5G - another application in the cloud
The succession of generations of cellular mobile networks shows a high degree of regularity:
1G was introduced in the early 1980s, 2G in the early 1990s, 3G in the early 2000s and 4G
deployment started in 2010. Hence, it should not come as a surprise that the introduction of
5G is foreseen from 2020 onward (4G Americas, 2014a; 5G Infrastructure Association, 2015;
ITU-R, 2015).
5G represents a next step in the technological evolution: 1G was dedicated to telephony, 2G
started as capacity expansion for telephony to which a packet-switched overlay network
(GPRS) was later added to provide access to the Internet. 3G was designed for both voice
and data communication (implemented through resp. circuit switching and packet
switching). High demand for Internet access required regular upgrades, from HSPA (high
speed packet access), through HSPA+ and HSPA Advanced. This also accelerated the
transition to the next generation of mobile technology – 4G – also known as Long-Term
160127_CERRE_IntegratedRegulatoryFramework_Appendix 2_Final 24/54
Evolution (LTE), which is packet switched only.3 Again, intermediate enhancements were
made based on regular updates of the specifications. The upgrade to LTE Advanced with a
common air interface, introducing data rate enhancement through carrier aggregation, was
first introduced in 2013. It provides a peak cell capacity of 1.2 Gbit/s.
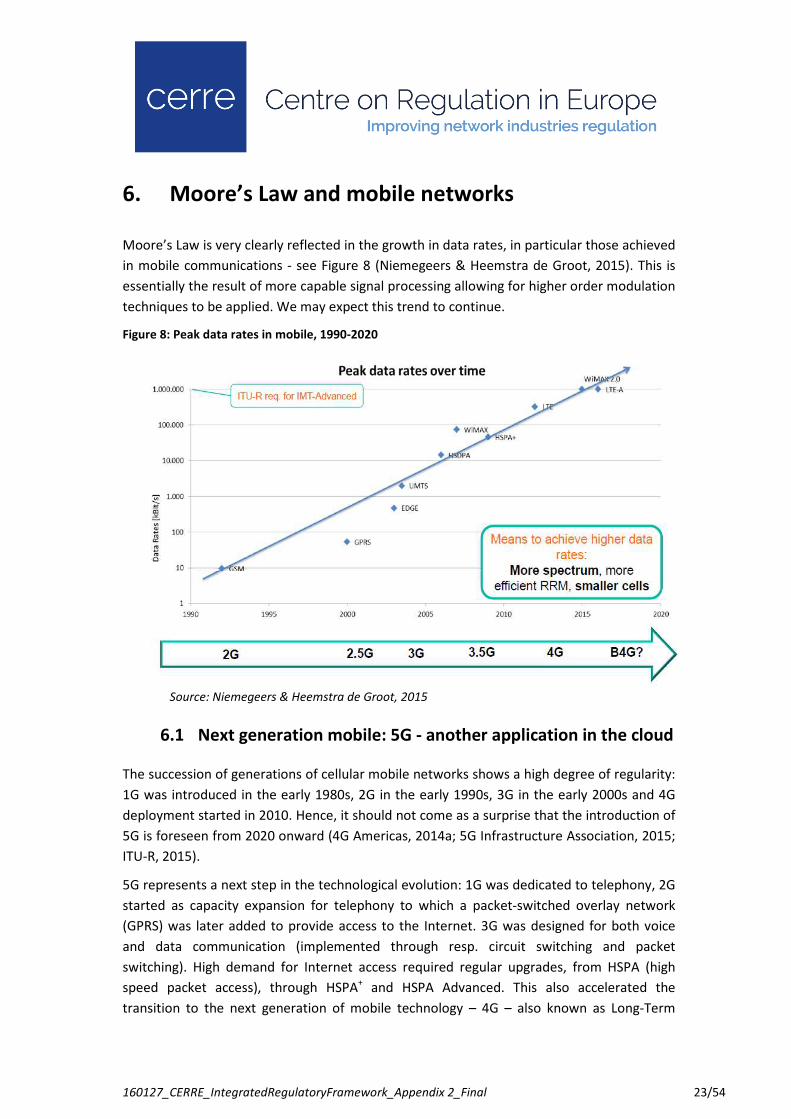
These network enhancements are intended to keep up with the growing end-user demand
across a range of services. Figure 9 provides Cisco’s forecast for growth and penetration of
global consumer mobile services towards 2019 (Cisco, 2015).
Figure 9: Forecast global mobile consumer services, 2019
Source: Cusci VNI Mobile, 2015
Note that all but one of the services shown are applications which use the mobile
infrastructure to obtain access to the Internet. Only MMS is an integrated service, which is
shown with a negative growth rate. Moreover, mobile telephony and SMS as distinct
services have disappeared from the radar screen, having become part of mobile social
networking.
Shortly after the introduction of a new generation of mobile technology, the stakeholders, in
particular the engineers, start thinking about the requirements for the next generation. In
2011 the Wireless World Research Forum published a whitepaper providing the
“Requirements and vision for NG-Wireless” (Wireless World Research Forum, 2011). The
3 In the context of LTE telephony services are provided through a fallback to 3G or 2G, so-called Circuit Switched
Fallback (CSFB) until VoLTE is made available. The functionality is technically available, but is subject to
investments by MNOs. (TNO, 2014a)
160127_CERRE_IntegratedRegulatoryFramework_Appendix 2_Final 25/54
Next Generation Mobile Networks alliance has also developed a 5G vision, with emphasis on
the business perspective of mobile operators (NGMN, 2015).
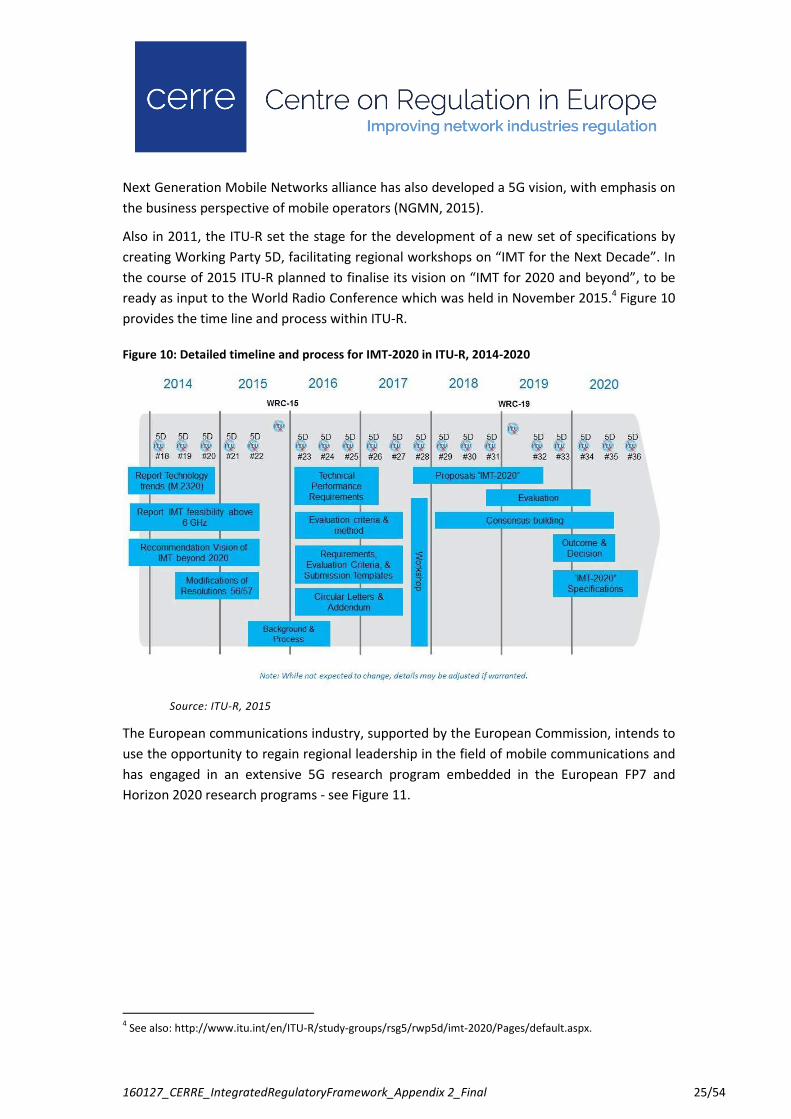
Also in 2011, the ITU-R set the stage for the development of a new set of specifications by
creating Working Party 5D, facilitating regional workshops on “IMT for the Next Decade”. In
the course of 2015 ITU-R planned to finalise its vision on “IMT for 2020 and beyond”, to be
ready as input to the World Radio Conference which was held in November 2015.4 Figure 10
provides the time line and process within ITU-R.
Figure 10: Detailed timeline and process for IMT-2020 in ITU-R, 2014-2020
Source: ITU-R, 2015
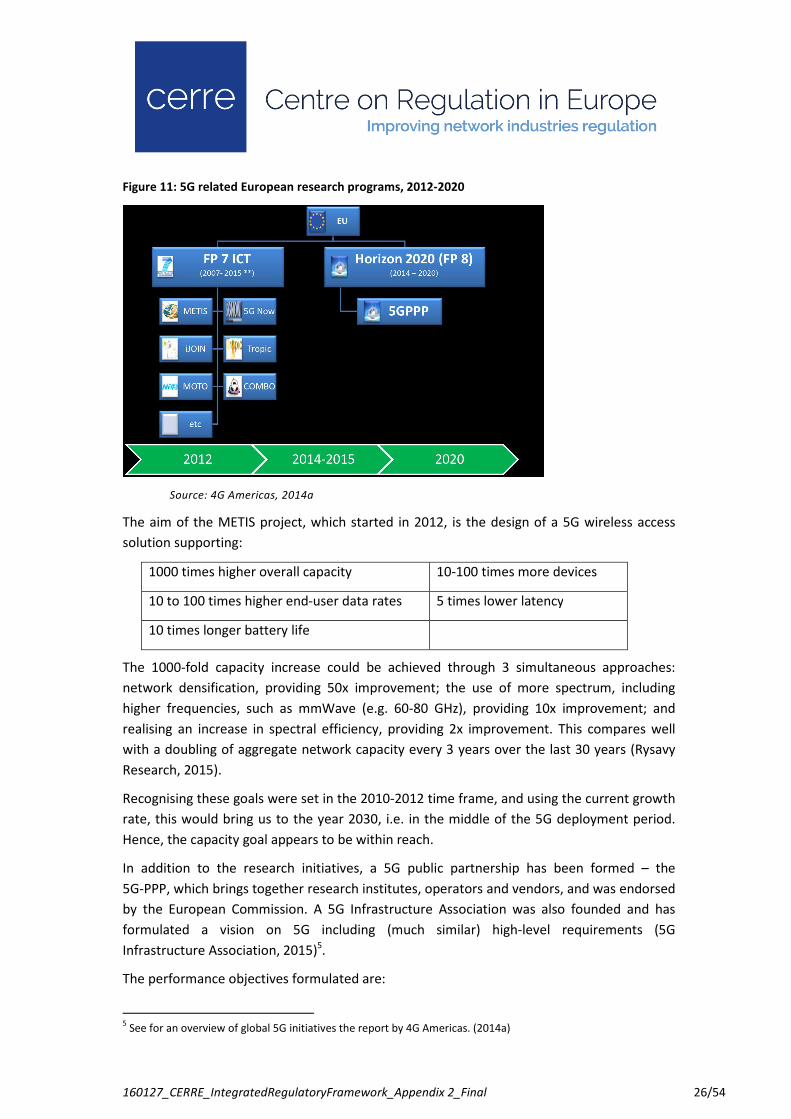
The European communications industry, supported by the European Commission, intends to
use the opportunity to regain regional leadership in the field of mobile communications and
has engaged in an extensive 5G research program embedded in the European FP7 and
Horizon 2020 research programs - see Figure 11.
4 See also: http://www.itu.int/en/ITU-R/study-groups/rsg5/rwp5d/imt-2020/Pages/default.aspx.
160127_CERRE_IntegratedRegulatoryFramework_Appendix 2_Final 26/54
Figure 11: 5G related European research programs, 2012-2020
Source: 4G Americas, 2014a
The aim of the METIS project, which started in 2012, is the design of a 5G wireless access
solution supporting:
1000 times higher overall capacity 10-100 times more devices
10 to 100 times higher end-user data rates 5 times lower latency
10 times longer battery life
The 1000-fold capacity increase could be achieved through 3 simultaneous approaches:
network densification, providing 50x improvement; the use of more spectrum, including
higher frequencies, such as mmWave (e.g. 60-80 GHz), providing 10x improvement; and
realising an increase in spectral efficiency, providing 2x improvement. This compares well
with a doubling of aggregate network capacity every 3 years over the last 30 years (Rysavy
Research, 2015).
Recognising these goals were set in the 2010-2012 time frame, and using the current growth
rate, this would bring us to the year 2030, i.e. in the middle of the 5G deployment period.
Hence, the capacity goal appears to be within reach.
In addition to the research initiatives, a 5G public partnership has been formed – the
5G-PPP, which brings together research institutes, operators and vendors, and was endorsed
by the European Commission. A 5G Infrastructure Association was also founded and has
formulated a vision on 5G including (much similar) high-level requirements (5G
Infrastructure Association, 2015)5.
The performance objectives formulated are:
5 See for an overview of global 5G initiatives the report by 4G Americas. (2014a)
160127_CERRE_IntegratedRegulatoryFramework_Appendix 2_Final 27/54
(1) radically higher wireless area capacity (1000x relative to 2010);
(2) much lower round-trip delays (latency <1 ms);
(3) very high dependability to enable (business/mission) critical applications; combined
with
(4) a far lower energy consumption, to enable support of very low energy devices, such
as sensors;
(5) reduced service creation time, from 90 hours to 90 minutes; and
(6) a reduction in the exposure to electromagnetic radiation.
It is foreseen that 5G implementation will be based on software-defined networking (SDN)
and network function virtualisation (NFV), mobile edge computing (MEC) and fog computing
(FC), in essence an architecture based on “cloud” computing, linking together a diverse set
of resources for transport, routing, storage and processing, including (user) resources at the
edge of the network. Moreover, it will support the development of new services through
application programming interfaces (APIs) (Patel et al., 2014; 5G Infrastructure Association,
2015). See Section 6.4 for a discussion of network virtualisation.
According to the ‘5G Vision’ statement, the 5G design is aimed at:
• bringing together the various radio access technologies (e.g. GSM, UMTS, LTE, Wi-Fi
and satellite) to provide the end-users with seamless handovers;
• to provide a multitenant environment for various users groups (mobile operators,
broadcasters, public safety and disaster relief, providers of cellular service for the
railways); thereby
• paving the way for virtual pan-European operators, relying on national
infrastructures.
The 5G infrastructure is expected to provide (virtual) network solutions for vertical markets,
such as automotive, energy, food and agriculture, city management, government,
healthcare, manufacturing, public transport, etc.
In terms of operational capabilities 5G is considered to provide (5G Infrastructure
Association, 2015):
connectivity for over 20 billion human
oriented terminals
connectivity for over 1 trillion IoT
terminals
guaranteed user rates of over 50
Mbit/s
with aggregate service reliability
better than 99.999%
communication for ground transport
at speeds of 500 km/hour
an accuracy of outdoor terminal
location less than 1 meter
160127_CERRE_IntegratedRegulatoryFramework_Appendix 2_Final 28/54
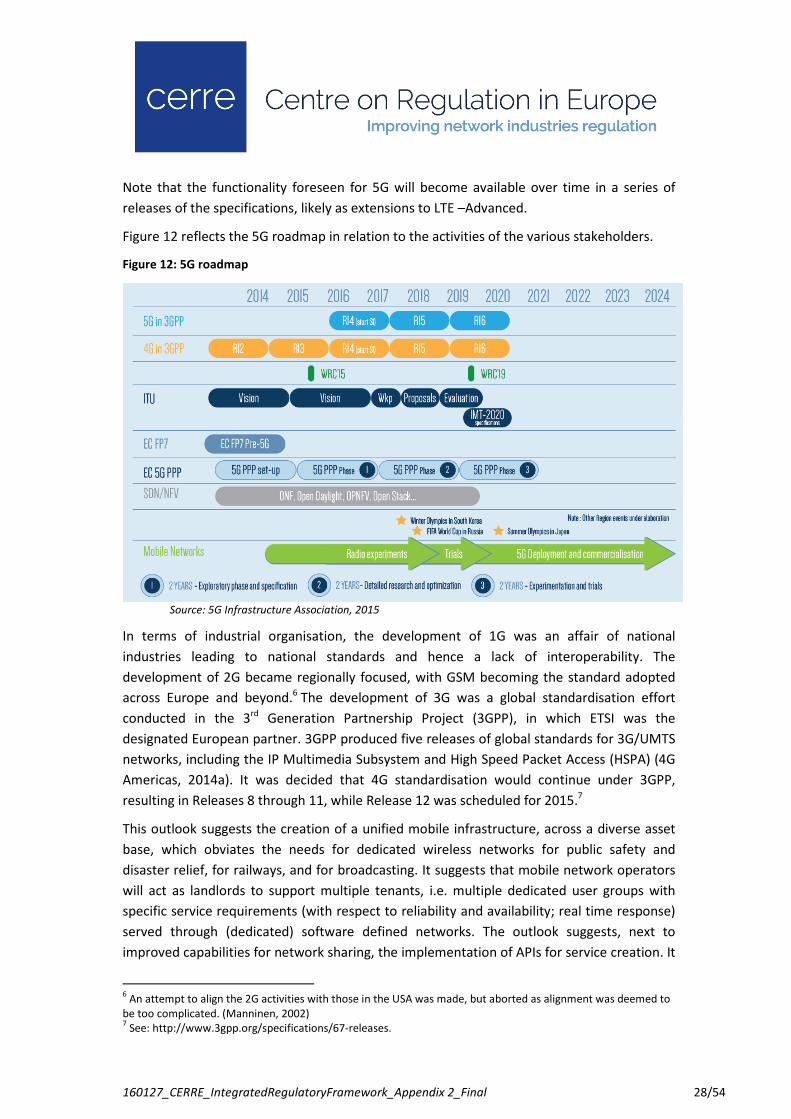
Note that the functionality foreseen for 5G will become available over time in a series of
releases of the specifications, likely as extensions to LTE –Advanced.
Figure 12 reflects the 5G roadmap in relation to the activities of the various stakeholders.
Figure 12: 5G roadmap
Source: 5G Infrastructure Association, 2015
In terms of industrial organisation, the development of 1G was an affair of national
industries leading to national standards and hence a lack of interoperability. The
development of 2G became regionally focused, with GSM becoming the standard adopted
across Europe and beyond.6 The development of 3G was a global standardisation effort
conducted in the 3rd Generation Partnership Project (3GPP), in which ETSI was the
designated European partner. 3GPP produced five releases of global standards for 3G/UMTS
networks, including the IP Multimedia Subsystem and High Speed Packet Access (HSPA) (4G
Americas, 2014a). It was decided that 4G standardisation would continue under 3GPP,
resulting in Releases 8 through 11, while Release 12 was scheduled for 2015.7
This outlook suggests the creation of a unified mobile infrastructure, across a diverse asset
base, which obviates the needs for dedicated wireless networks for public safety and
disaster relief, for railways, and for broadcasting. It suggests that mobile network operators
will act as landlords to support multiple tenants, i.e. multiple dedicated user groups with
specific service requirements (with respect to reliability and availability; real time response)
served through (dedicated) software defined networks. The outlook suggests, next to
improved capabilities for network sharing, the implementation of APIs for service creation. It
6 An attempt to align the 2G activities with those in the USA was made, but aborted as alignment was deemed to
be too complicated. (Manninen, 2002) 7 See: http://www.3gpp.org/specifications/67-releases.

160127_CERRE_IntegratedRegulatoryFramework_Appendix 2_Final 29/54
suggests a potential diversification in asset ownership, a redefinition of the role of MNOs as
Mobile Cloud Network (MCN) providers and more diversified roles for MVNOs, for instance
serving industry verticals. The outlook suggests an increase in the number and variety of
participating actors.
From the regulatory perspective, the outlook by the 5G-PPP assumes a continuation in the
use of exclusive licenses for access to the radio frequency spectrum dedicated for mobile
use, in order to ensure long-term investments into networks and access to the radio
spectrum. Nonetheless, full virtualisation would imply that the frequency assets will be
pooled among the owners.
It should further be noted that: “The thirst for new spectrum will likely prevail [over growing
the infrastructure with smaller cells] since spectrum has an appreciating value while
infrastructure is always depreciating.” (Wireless World Research Forum, 2011).
Moreover, coordination in band usage remains essential for device manufacturers to make
handsets available in a timely manner. Differences between infrastructure roll-out and
uptake can in part be explained by the lack of devices. A typical case was the iPhone initially
not supporting operation in the 800 MHz band for LTE (TNO, 2014a).
The question for the 2025 scenario is whether the raw capabilities provided by engineers will
be deployed by network operators. This is very likely the case because mobile data rates are
still trailing those provided on fixed networks. Moreover, in mobile networks the raw
capacity, as it translates to cell site capacity, is shared among multiple users. Even if demand
growth would flatten, the ability to share a higher capacity cell site would lead to a reduction
of costs and therefore be pursued by mobile operators.
6.2 Convergence of CT and IT
Considering the visions for 5G, one may conclude that the visions represent the final step in
the convergence of communication technologies with information technologies: mobile
communication becoming ‘just another’ cloud application.
It also represents the next and ultimate step in the sharing of resources: from passive
sharing, through active sharing to full virtualisation.
As such, the 5G vision conjures the image of a ‘virtual utility’.
6.3 M2M and IoT
The next step in the evolution of the Internet is the interconnection of uniquely identifiable
embedded computing-like devices using the Internet, denoted as the Internet of Things
(IoT). IoT requires transition to IPv6, which has a much larger address space of up to
3.4×1038, as well as low data rates with very low energy consumption.
IoT includes the earlier form of machine-to-machine (M2M) communication, which
originated in the field of industrial instrumentation. The ubiquitous use of the Internet
160127_CERRE_IntegratedRegulatoryFramework_Appendix 2_Final 30/54
facilitates M2M communication and expands its range of applications. Previously, this was
also denoted as telematics. Meanwhile, many mobile operators have created departments
dedicated to providing M2M services. A number of energy utility companies have
outsourced the collection of smart-meter data to communication providers. One of them
has acquired a radio spectrum license to set up a network to collect metering data over the
air.
The lowest-cost devices enabling M2M communications today are GPRS modems, which
may become obsolete as operators sunset their GSM systems. HSPA is also used for M2M
communications. LTE has been optimised to efficiently communicate small bursts of
information, making it well suited for M2M. Low-cost LTE modem options in 3GPP releases
10 through 13, when implemented, will reduce costs, improve the communications range,
and will extend battery life (Rysavy Research, 2015).
In other instances, developers will use local-area networking technologies, such as Wi-Fi,
Bluetooth Low Energy, and ZigBee. New wide-area wireless technologies emerging
specifically to support IoT include: LoRa, Sigfox, OnRamp Wireless, and Weightless. Cloud-
based support platforms and standardised interfaces will also facilitate the development and
deployment of IoT applications. For example, the GSM Association (GSMA) is developing the
OneM2M Service Layer that can be embedded in hardware and software to simplify
communications with application servers (Rysavy Research, 2015).
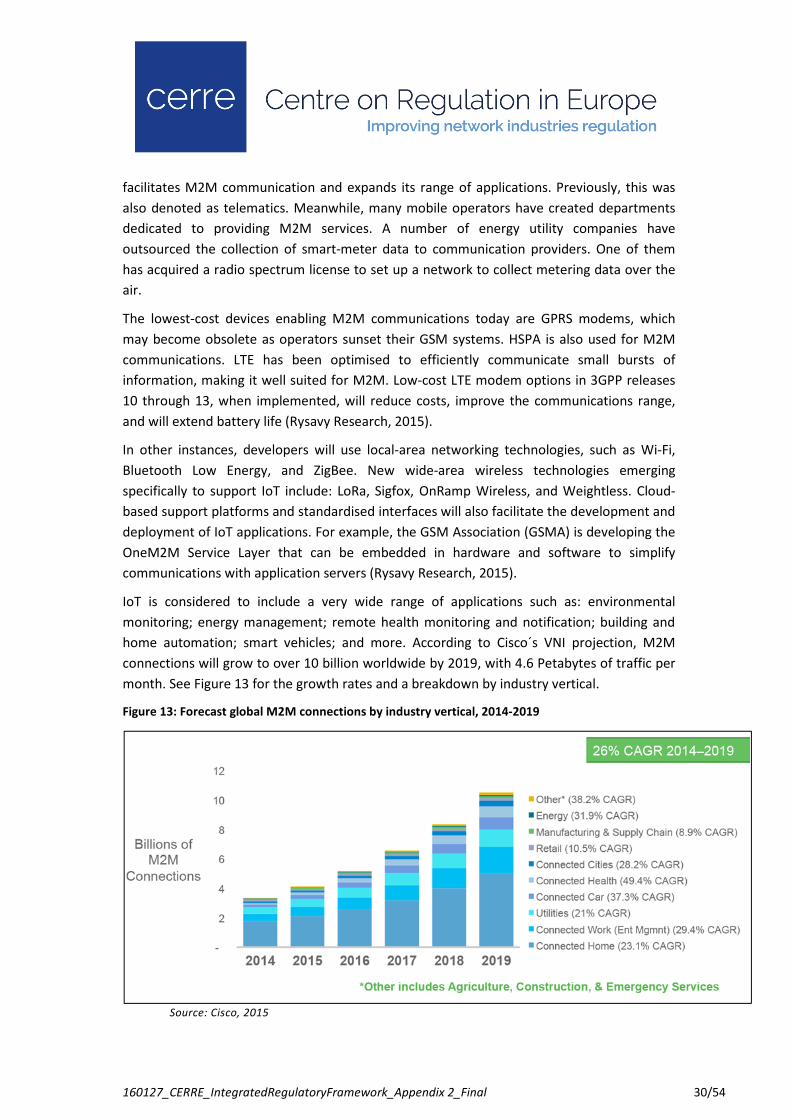
IoT is considered to include a very wide range of applications such as: environmental
monitoring; energy management; remote health monitoring and notification; building and
home automation; smart vehicles; and more. According to Cisco´s VNI projection, M2M
connections will grow to over 10 billion worldwide by 2019, with 4.6 Petabytes of traffic per
month. See Figure 13 for the growth rates and a breakdown by industry vertical.
Figure 13: Forecast global M2M connections by industry vertical, 2014-2019
Source: Cisco, 2015
160127_CERRE_IntegratedRegulatoryFramework_Appendix 2_Final 31/54
In terms of industrial organisation, the Internet-of-Things is expected to encode 50 to 100
trillion objects globally and to be able to follow these objects. Human beings in urban
environments are expected to be individually surrounded by 1000–5000 traceable objects.
This raises new issues around privacy and security, as well as of autonomy and control
(Höller et al., 2014).
6.4 Network virtualisation
Network virtualisation refers to implementing the functions of the communications
infrastructure in software running on commercial ‘off-the-shelf’ computing equipment.8
AT&T describes the motivation to move towards network function virtualisation (NFV) as
follows: “AT&T’s network is comprised of a large and increasing variety of proprietary
hardware appliances. To launch a new network service often requires adding yet another
variety, and finding the space and power to accommodate these boxes is becoming
increasingly difficult. This difficulty is compounded by increasing costs of energy, capital
investment, and rarity of skills necessary to design, integrate and operate increasingly
complex hardware-based appliances. Moreover, hardware-based appliances rapidly reach
end-of-life, requiring much of the procure-design-integrate-deploy cycle to be repeated with
little or no revenue benefit. Additionally, hardware lifecycles are becoming shorter as
technology and service innovation accelerates, and this can inhibit the expeditious roll out of
new revenue earning network services and constrain innovation in an increasingly network-
centric connected world. NFV aims to address these problems by evolving standard IT
virtualisation technology to consolidate many network equipment types onto industry
standard high volume servers, switches and storage that can be located in data centers,
network PoPs or on customer premises. This involves the implementation of network
functions in software, called Virtual Network Functions (VNFs), that can run on a range of
general purpose hardware, and that can be moved to, or instantiated in, various locations in
the network as required, without the need for installation of new equipment.” (AT&T, 2013).
The approach promises lower capital expenditures, benefiting from economies of scale in
the IT industry; lower operating costs; faster deployment of new services; energy savings;
and improved network efficiency. With NFV, multiple tenants will be able to share the same
infrastructure, facilitating, for example, mobile virtual network operator (MVNO)
arrangements.
Network virtualisation is directly linked with the development towards Software Defined
Networks (SDNs), as an architectural framework for creating intelligent networks that are
programmable, application aware, and more open. SDN allows the network to transform
into a more effective business enabler. SDN enables applications to request and manipulate
services provided by the network and allows the network to expose the network state back
8 See for small scale application and experimentation with virtual networks for instance the PhD by Strijkers.
(2014)
160127_CERRE_IntegratedRegulatoryFramework_Appendix 2_Final 32/54
to the applications. A key aspect of the architectural framework is the separation of the
forwarding plane from the control plane, and the establishment of standard protocols and
abstractions between the two. SDN can act as an enabler for NFV, since the separation of
the control and data planes enables the virtualisation of the separated control plane
software. NFV can also act as an enabler for SDN, since the separation between data plane
and control plane implementations is simplified when one or both of them are implemented
in software running on top of standard hardware (AT&T, 2013).
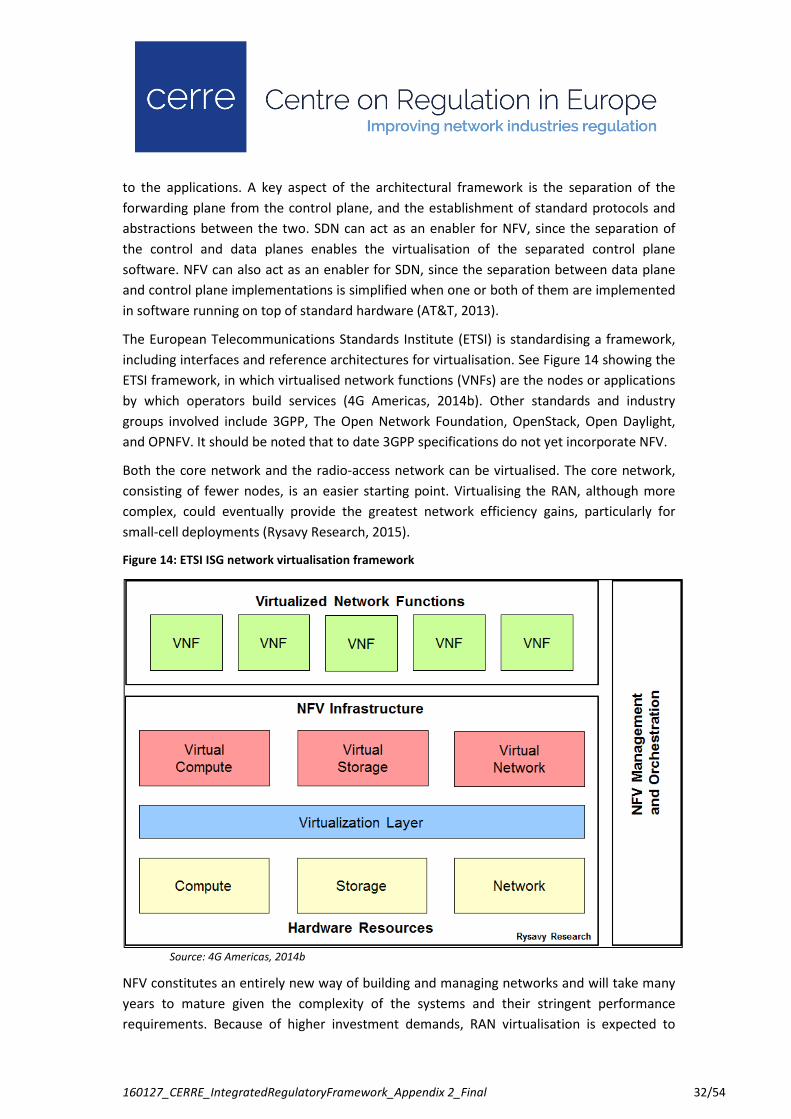
The European Telecommunications Standards Institute (ETSI) is standardising a framework,
including interfaces and reference architectures for virtualisation. See Figure 14 showing the
ETSI framework, in which virtualised network functions (VNFs) are the nodes or applications
by which operators build services (4G Americas, 2014b). Other standards and industry
groups involved include 3GPP, The Open Network Foundation, OpenStack, Open Daylight,
and OPNFV. It should be noted that to date 3GPP specifications do not yet incorporate NFV.
Both the core network and the radio-access network can be virtualised. The core network,
consisting of fewer nodes, is an easier starting point. Virtualising the RAN, although more
complex, could eventually provide the greatest network efficiency gains, particularly for
small-cell deployments (Rysavy Research, 2015).
Figure 14: ETSI ISG network virtualisation framework
Source: 4G Americas, 2014b
NFV constitutes an entirely new way of building and managing networks and will take many
years to mature given the complexity of the systems and their stringent performance
requirements. Because of higher investment demands, RAN virtualisation is expected to

160127_CERRE_IntegratedRegulatoryFramework_Appendix 2_Final 33/54
emerge over a longer timeframe than core network virtualisation, and will likely occur
selectively for small-cell deployments. See also Figure 15. (Rysavy Research, 2015).
Figure 15: The implementation of software-defined networking and cloud architectures
Source: Rysavy Research, 2015
It should be noted that the pooling of baseband processing in a cloud-RAN can, but does not
necessarily, use virtualisation techniques. Separating the radio function from baseband
processing typically requires transporting digitised radio signals across high data rate (multi-
Gbit/s) fibre connections. This is sometimes referred to as front-hauling.
The introduction of NFV also implies a different role for standardisation. As phrased by
AT&T: “Traditionally, carriers interested in a new architecture would gather with their
suppliers and start a new standardisation activity in one or several SDOs, often calling the
work Next Generation Network or NGN. The standards body would gather requirements
from interested parties, work out backwards compatibility, and negotiate an outcome that
was mutually acceptable and described the end-to-end system as an optimised and tightly
coupled whole. This process was [is] lengthy and expensive, diminished a carrier’s ability to
navigate their own technology transitions, and often created entities that fail to serve the
interests of the companies that fund them. This is not to say that standardisation is no
longer valuable, but rather that the goals of standards activities are better targeted toward
smaller, re-usable components that can be composed and recomposed into various systems
and architectures.” (AT&T, 2013).
The future mobile services industry is expected to include many more actors in a variety of
roles with a large and diversified asset ownership structure. This implies a high dependency
on private contracting, much more intricate than the current MNO-MVNO arrangements. An
open question is whether entrants will be able to fully exploit the degrees of freedom
offered by the software-driven API-enabled infrastructure.

160127_CERRE_IntegratedRegulatoryFramework_Appendix 2_Final 34/54
Regarding the quality assurance of the future electronic communication network, in
particular in the light of its use by public safety and disaster relief organisations, the question
of which industry model will prevail is of interest: the more open Google-model, the more
closed Apple-model or the stakeholder model of the Wi-Fi alliance.
The diversified asset base also raises the question of investment incentives. Given the
reliance on the current model of radio-spectrum auctions, a two tier model may emerge,
with mobile cloud network providers investing in the base infrastructure and mobile service
providers investing in applications servers. It will be of interest to assess to what degree this
model will be prone to free rider behaviour or hold-up.
160127_CERRE_IntegratedRegulatoryFramework_Appendix 2_Final 35/54
7. Changes in the industrial organisation of the
sector
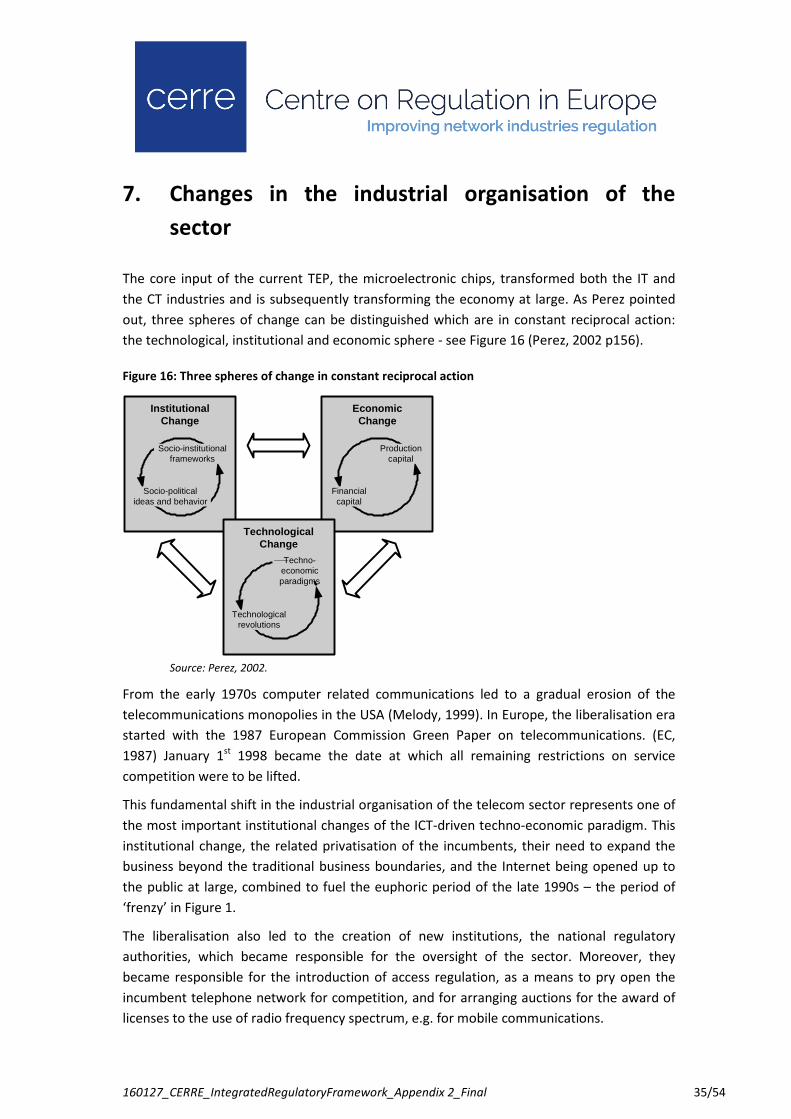
The core input of the current TEP, the microelectronic chips, transformed both the IT and
the CT industries and is subsequently transforming the economy at large. As Perez pointed
out, three spheres of change can be distinguished which are in constant reciprocal action:
the technological, institutional and economic sphere - see Figure 16 (Perez, 2002 p156).
Figure 16: Three spheres of change in constant reciprocal action
Source: Perez, 2002.
From the early 1970s computer related communications led to a gradual erosion of the
telecommunications monopolies in the USA (Melody, 1999). In Europe, the liberalisation era
started with the 1987 European Commission Green Paper on telecommunications. (EC,
1987) January 1st 1998 became the date at which all remaining restrictions on service
competition were to be lifted.
This fundamental shift in the industrial organisation of the telecom sector represents one of
the most important institutional changes of the ICT-driven techno-economic paradigm. This
institutional change, the related privatisation of the incumbents, their need to expand the
business beyond the traditional business boundaries, and the Internet being opened up to
the public at large, combined to fuel the euphoric period of the late 1990s – the period of
‘frenzy’ in Figure 1.
The liberalisation also led to the creation of new institutions, the national regulatory
authorities, which became responsible for the oversight of the sector. Moreover, they
became responsible for the introduction of access regulation, as a means to pry open the
incumbent telephone network for competition, and for arranging auctions for the award of
licenses to the use of radio frequency spectrum, e.g. for mobile communications.
EconomicChange
Financialcapital
Productioncapital
InstitutionalChange
Socio-politicalideas and behavior
Socio-institutionalframeworks
TechnologicalChange
Technologicalrevolutions
Techno-economicparadigms

160127_CERRE_IntegratedRegulatoryFramework_Appendix 2_Final 36/54
While in the previous era the realisation of public interests was realised largely along the
lines of managerial control of the fully integrated telecom firm, today the realisation
requires an alignment between public objectives and private firm objectives (Anker, 2013;
Anker & Lemstra, 2013).
The period of liberalisation and the introduction of competition has now come to an end,
the objectives largely being realised. With the start of the Junker Commission, the regulatory
regime has become the subject of a major evaluation at the European level. Examples are
the REFIT exercise, the study tendered by DG Competition into the role of competition on
market outcomes and the impact assessment accompanying the review of the regulatory
framework for e-communications by DG CONNECT. The aim is to align regulation towards
the new objectives of completing the Digital Single Market (DSM) and towards more
investment in communications infrastructures to enable the development of the DSM.
7.1 Decoupling of services and applications from the underlying
infrastructures
The transformation to ‘all things digital’ and the introduction of the TCP/IP protocol stack as
the core of the Internet has led to a decoupling of the services and applications from the
underlying infrastructures.9, 10 See Figure 17 for an illusatrion of this.
Figure 17: Decoupling of services and applications from the underlying infrastructures
Source: Author's own work
9 Note that increasingly User Datagram Protocol (UDP) is used for video transmission, to improve real-time
performance by foregoing the retransmission of packets received in error implied in the TCP protocol. 10
Note that the development towards managed services, whereby functionality of the network layer is used at
the application layer, is affecting this notion of effective decoupling.
Applications
Networks
TCP/IP
OTT and IoT APPLICATION
NETWORK
TRANSPORT
SESSION
PRESENTATION
Media Access Control (MAC)
Logical Link Controller (LLC)
PHYSICAL (PHY)
Data LinkLayer
PhysicalLayer
Examples of related protocolsused in the context of the internet
HTTP, HTTPS, SMTP, POP3, IMAP, FTP,UUCP, NNTP, SSL, SSH, IRC, SNMP, SIP,RTP, Telnet, DNS
TCP, UDP, SCTP, DCCP
IPv4, IPv6, ICMP, ARP, IGMP
Ethernet, Wi-Fi, Token Ring, FDDI, PPP, ATM
RS-232, EIA-422, RS-449, EIA-485, 10BaseT,100BaseT, IEEE 802.11a, IEEE 802.11b, IEEE802.11g, DSL, ADSL
Twisted pair copper, coax, fiber, radio, infra-redMEDIUM
OSI Protocol Stack

160127_CERRE_IntegratedRegulatoryFramework_Appendix 2_Final 37/54
This has enabled the emergence of so-called Over-the-Top (OTT) services, such as Voice-
over-IP (VoIP) and TV-over-IP (IPTV) in competition with the traditional telephony and
broadcasting services. Following the transition to All-IP infrastructures, these traditional
services are now also being delivered using TCP/IP protocols, but using dedicated channels
on the access networks.
In terms of industrial organisation, it implies that the circuit-switched paradigm is being
subsumed by the packet-switched paradigm, not only in terms of technologies but also in
terms of the related institutions. It implies the ITU losing its central role in the governance of
the sector, being replaced by the institutions that evolved with the emergence of the
Internet, such as the IETF, ICANN, etc. (Mueller, 2002, 2010; Mueller & Lemstra, 2011).
7.2 Level playing field
Whether there is a level playing field between ‘new’ and ‘old’ providers of (e.g. telephony)
services is the subject of current studies, for instance through the study on “Future trends
and business models in communication services” commissioned by DG CONNECT. The major
issue is that the firms are subject to different rules and regulations, impacting their business
models and the degrees of freedom to innovate differently.
7.3 Digital convergence: the end of dedicated networks
The transformation to ‘all things digital’ and the introduction of the TCP/IP protocol stack as
the core of the Internet implies the end of dedicated networks, i.e. networks that have been
optimised for the provision of a particular service, e.g. telephony (the public switched
telephone network – PSTN) and the network for the distribution of radio and TV signals (the
CATV-cable network). The PSTN network is now used by the incumbents to provide access to
the Internet and to distribute RTV-programs, while the CATV-network is now also used for
providing telephony and access to the Internet. This has enabled infrastructure-based
competition. PSTN-based and CATV-based firms are now competing in the market for multi-
play offerings, whereby access to exclusive content is used as a competitive weapon. The
ability to provide mobile access to the bundle adds another dimension to this competitive
game, whereby PSTN incumbents tend to have a better starting position as they typically
also run a mobile network.
7.4 Convergence between broadcasting and mobile
Moreover, with increasing use of streaming, e.g. by Netflix, and on-demand viewing, e.g. for
delay-TV, communications and broadcasting are converging further at the services level. To
provide a more viable way to deliver broadcasting services over mobile networks, 3GPP has
standardised multicast and broadcast techniques for application in LTE networks under the
acronym eMBMS (evolved Multimedia Broadcast Multicast Service). Single-frequency
network (SFN) technology is used to distribute broadcast streams into well-defined areas –
160127_CERRE_IntegratedRegulatoryFramework_Appendix 2_Final 38/54
where all contributing cells send the same data during exactly the same radio time slots.
Depending on content popularity, operators can also deliver content when network load is
low, using the local cache of a user’s device. This may include software upgrades over-the-air
of mobile devices or one-to-many file transfer in the context of M2M/IoT.
First demonstrations were given at the Mobile World Congress in 2013 and by KPN in
collaboration with Ericsson, Qualcomm, Samsung and IBM in the Amsterdam Arena football
stadium, the Netherlands, in 2014. KT launched the first public LTE broadcast service in
dedicated areas of Seoul in 2014 (Lohmar, Slssingar, Kenehan & Puustinen, 2013; TNO,
2014a, 2014b).
However, at this time, terrestrial digital broadcasting (DVB-T) demand is still high in
Southern Europe, with market shares above 75%. On the other hand, in some Northern
European countries it has dropped to less than 25%. (TNO, 2014a) A recent EBU study
concluded that delivery of free-to-air broadcast content over the current DTT networks using
DVB-T is at present considered more cost effective, albeit, no LTE cost calculations were
made due to the ‘lack of sufficient available evidence’ (EBU, 2014).
In terms of industrial organisation, this development will bring broadcasters and mobile
network operators into the same market. What we can observe is that a once highly efficient
form of broadcasting is becoming increasingly less efficient as the number of users declines.
At the same time, a highly efficient unicast system becomes less efficient as more and more
users are requesting the same content at approximately the same moment in time.
Moreover, when the broadcasting viewers are divided over many different programs and are
offered regional variants, the high-tower-high-power model of terrestrial broadcasting
becomes less efficient and the low-power-low-tower solution applied in LTE becomes more
attractive.
As the underlying trends of ‘all things digital’ and ‘all things packet’ progresses towards the
year 2025, and broadcast/multicast has become a common attribute of the (mobile)
Internet, one should ask the question whether and why a distinction needs to be made from
an infrastructure perspective. As a consequence, the radiofrequency spectrum could be
applied for ‘universal’ access provisioning, rather than being dedicated for a particular use,
thus making the overall usage of the radio spectrum potentially more efficient.
7.5 Convergence between fixed and mobile
While fixed networks are providing higher data rates than mobile networks, end-users tend
to prefer mobile connectivity for reasons of convenience, i.e. the freedom that mobility
provides and the additional functionality offered by the mobile devices. In the perception of
the end-users the differences at the services level will become blurred further as mobile
data rates increase, latency is reduced and device screens reach higher quality levels. This is
all part of the vision for the next generation of mobility, i.e. 5G, scheduled for introduction
into the market by 2020. See Section 6.1.
160127_CERRE_IntegratedRegulatoryFramework_Appendix 2_Final 39/54
Part of the LTE architecture is the IP multi-media subsystem (IMS). It is intended to offer
access to core services and applications across multiple-access networks. IMS allows for
creative blending of different types of communications and information, including voice,
video, instant messaging (IM), presence information, location, and documents. For example,
during a voice call, a user could add a simultaneous video connection, or start transferring
files.
IMS does not provide services by itself, but represents a framework of application servers,
subscriber databases and gateways to enable the provision of services. The core networking
protocol used for interworking with IMS is the Session Initiation Protocol (SIP). Although IMS
adoption by cellular operators was initially slow, deployment is accelerating as operators
make packet voice service available for LTE (Rysavy Research, 2015).
In terms of industrial organisation, it remains an open question whether the creation of
value in the network by MNOs will be preferred by end-users over value creation by third
parties at the edge of the network. See e.g. Patel et al. on mobile edge computing (2014). In
an earlier period of industry development a similar battle between AT&T and IBM over the
location of intelligence, either in the network or at the edge, was clearly won by the IBM
camp. The current developments of the Internet and OTT services and applications point in
the same direction.
Nonetheless, IMS will play a central role in providing public safety services. See section 0.
Moreover, open access to network functionality for third party development is foreseen in
the vision for 5G. See Section 6.1.
7.6 Convergence toward next generation points of presence
Ironically, increasing mobile network capacity requires increasing fixed network capacity. As
the capacity of cell sites increases to provide end-users with higher data rates, these cell
sites will need optical connections to the backbone network. To increase capacity for
simultaneous use by end-users requires cell coverage areas to be made smaller, hence more
cell sites need to be connected, requiring a finer optical network grid. This suggests further
synergies in the roll-out of fibre in the access networks. The EU FP7 research project COMBO
refers to Next Generation Points of Presence, aimed at a “better distribution of all essential
functions, equipment and infrastructures of convergent networks.”11
7.7 Convergence of mobile and Wi-Fi
License-exempt use of the radio spectrum is becoming ever more important to mobile
broadband networks. While the initial use was a rudimentary offload onto Wi-Fi networks,
Wi-Fi networks are gradually becoming more tightly integrated into cellular networks.
11
See : www.ict-combo.eu.
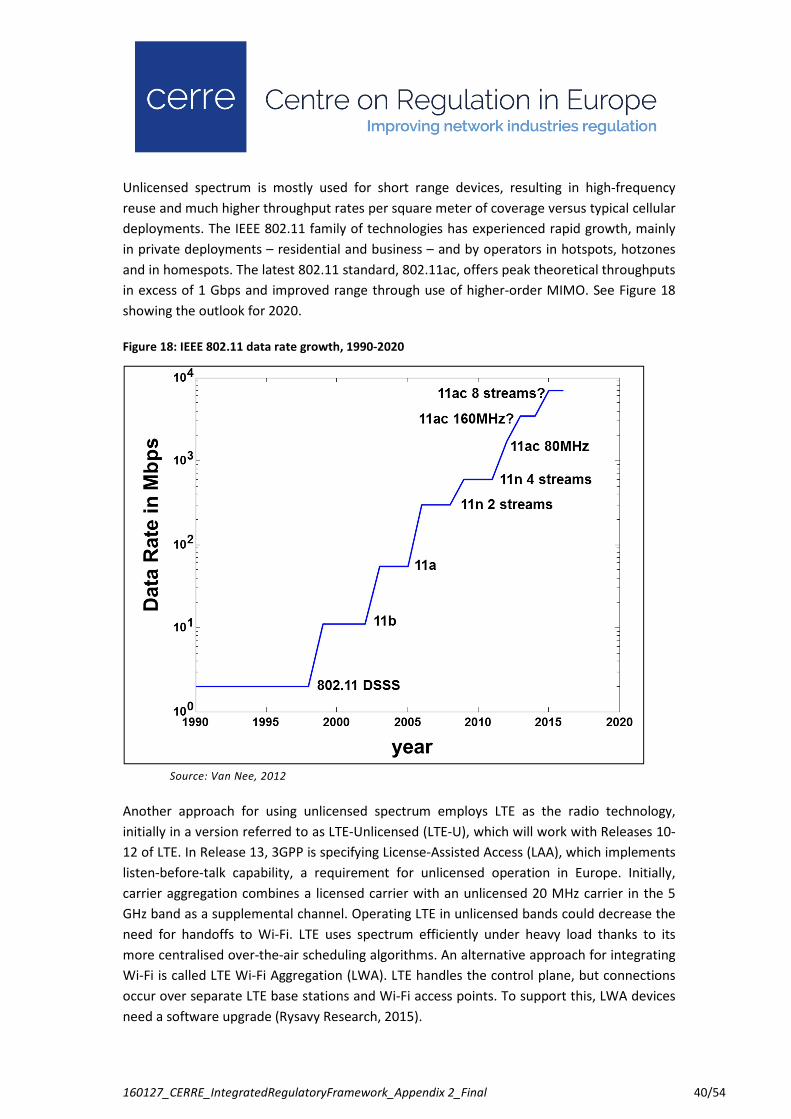
160127_CERRE_IntegratedRegulatoryFramework_Appendix 2_Final 40/54
Unlicensed spectrum is mostly used for short range devices, resulting in high-frequency
reuse and much higher throughput rates per square meter of coverage versus typical cellular
deployments. The IEEE 802.11 family of technologies has experienced rapid growth, mainly
in private deployments – residential and business – and by operators in hotspots, hotzones
and in homespots. The latest 802.11 standard, 802.11ac, offers peak theoretical throughputs
in excess of 1 Gbps and improved range through use of higher-order MIMO. See Figure 18
showing the outlook for 2020.
Figure 18: IEEE 802.11 data rate growth, 1990-2020
Source: Van Nee, 2012
Another approach for using unlicensed spectrum employs LTE as the radio technology,
initially in a version referred to as LTE-Unlicensed (LTE-U), which will work with Releases 10-
12 of LTE. In Release 13, 3GPP is specifying License-Assisted Access (LAA), which implements
listen-before-talk capability, a requirement for unlicensed operation in Europe. Initially,
carrier aggregation combines a licensed carrier with an unlicensed 20 MHz carrier in the 5
GHz band as a supplemental channel. Operating LTE in unlicensed bands could decrease the
need for handoffs to Wi-Fi. LTE uses spectrum efficiently under heavy load thanks to its
more centralised over-the-air scheduling algorithms. An alternative approach for integrating
Wi-Fi is called LTE Wi-Fi Aggregation (LWA). LTE handles the control plane, but connections
occur over separate LTE base stations and Wi-Fi access points. To support this, LWA devices
need a software upgrade (Rysavy Research, 2015).
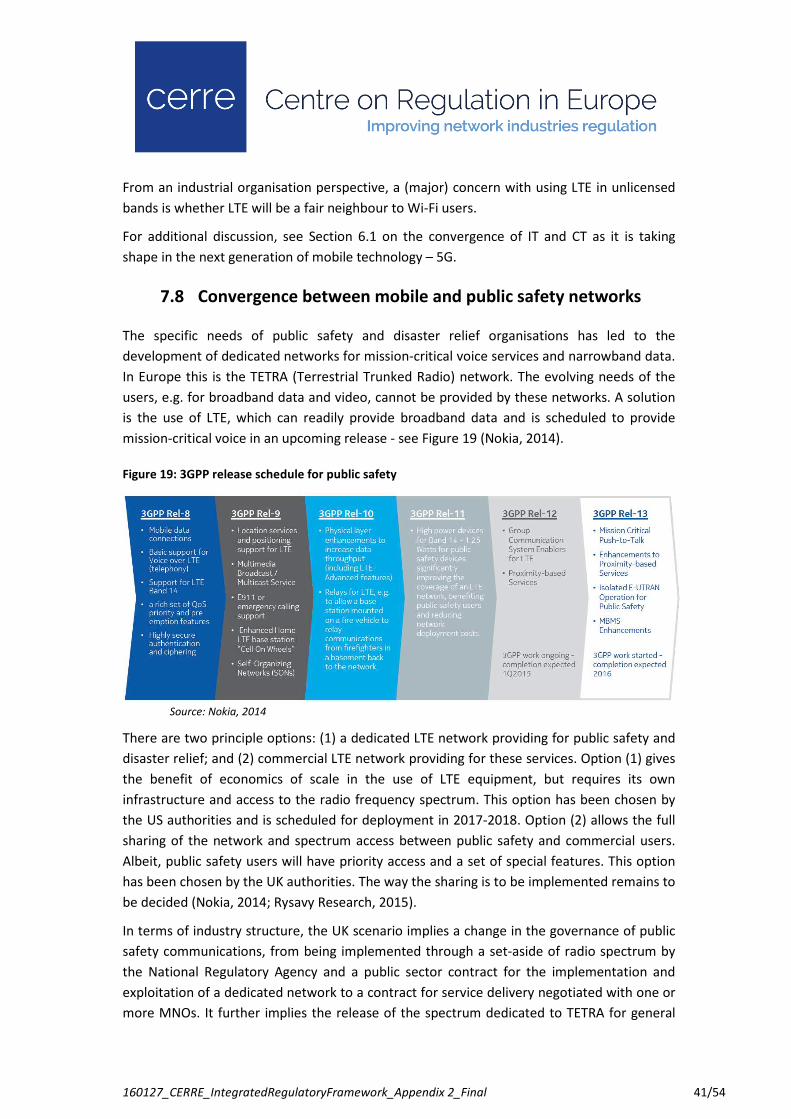
160127_CERRE_IntegratedRegulatoryFramework_Appendix 2_Final 41/54
From an industrial organisation perspective, a (major) concern with using LTE in unlicensed
bands is whether LTE will be a fair neighbour to Wi-Fi users.
For additional discussion, see Section 6.1 on the convergence of IT and CT as it is taking
shape in the next generation of mobile technology – 5G.
7.8 Convergence between mobile and public safety networks
The specific needs of public safety and disaster relief organisations has led to the
development of dedicated networks for mission-critical voice services and narrowband data.
In Europe this is the TETRA (Terrestrial Trunked Radio) network. The evolving needs of the
users, e.g. for broadband data and video, cannot be provided by these networks. A solution
is the use of LTE, which can readily provide broadband data and is scheduled to provide
mission-critical voice in an upcoming release - see Figure 19 (Nokia, 2014).
Figure 19: 3GPP release schedule for public safety
Source: Nokia, 2014
There are two principle options: (1) a dedicated LTE network providing for public safety and
disaster relief; and (2) commercial LTE network providing for these services. Option (1) gives
the benefit of economics of scale in the use of LTE equipment, but requires its own
infrastructure and access to the radio frequency spectrum. This option has been chosen by
the US authorities and is scheduled for deployment in 2017-2018. Option (2) allows the full
sharing of the network and spectrum access between public safety and commercial users.
Albeit, public safety users will have priority access and a set of special features. This option
has been chosen by the UK authorities. The way the sharing is to be implemented remains to
be decided (Nokia, 2014; Rysavy Research, 2015).
In terms of industry structure, the UK scenario implies a change in the governance of public
safety communications, from being implemented through a set-aside of radio spectrum by
the National Regulatory Agency and a public sector contract for the implementation and
exploitation of a dedicated network to a contract for service delivery negotiated with one or
more MNOs. It further implies the release of the spectrum dedicated to TETRA for general

160127_CERRE_IntegratedRegulatoryFramework_Appendix 2_Final 42/54
LTE use. The shared solution suggests an optimal use of resources, in particular of scarce
radio spectrum.
In terms of regulation, the end of dedicated networks implies that technology specific
solutions for the implementation of particular services of public interest, such as access to
emergency services, or the notion of universal service, will need to be redefined, to become
technology-neutral in their specification.

160127_CERRE_IntegratedRegulatoryFramework_Appendix 2_Final 43/54
8. Robustness of the 2025 image
The image of the electronic communications industry for 2025 as developed in this
contribution has largely been grounded on observed regularities and trends. Nonetheless,
discontinuities or set-backs may happen and they will affect the image. In the following
section we will review the end of the current TEP and the beginning of the next.
Subsequently, a reflection on innovations over the past ten years is provided as a way to
make us aware what might happen in terms of innovation in the next 10 years. In the final
section the use of scenarios by Shell as a means of testing the robustness of firm strategies is
discussed, suggesting the same approach may be applied for testing the robustness of policy
and regulation.
8.1 Diffusion of the ICT-driven techno-economic paradigm
The succession of technological revolutions, caused by a clustering of innovations, occurs
every 50-60 years. The image of the year 2025 is positioned in the second half of the
diffusion period of the current ICT-driven techno-economic paradigm. By that time the
paradigm will have been broadly established and the first signs of the next technological
revolution should be visible. Making a statement on the likely next revolution is speculative,
but it may well be centred around bio-informatics and bio-synthetics. The installation period
may begin around that time, but the period of frenzy, the major shift, will likely be a number
of years into the future.
While the core inputs in earlier technological revolutions were in essence substitutes in
terms of inputs, e.g. steam-power replacing water-power, followed by electricity replacing
steam, the input of the current technological revolution is additive, i.e., information
transport and processing is enabled by electricity. In the next revolution, the ICTs are also
expected to continue as a major input, the electronic communication infrastructure as a
major carrier.
8.1.1 Moore’s Law
2015 marks 50 years of Moore’s Law (Mack, 2011; Golio, 2015; Mack, 2015). There is a
physical limit in terms of device scaling of silicon, but as Moore’s Law also captures
engineering prowess in mastering the related physics and economics, it may extend well
beyond 2025, as alternative technologies and alternative computing techniques are
explored, such as quantum computing. Figure 20 provides an illustration of progress in
computing (number of calculations per second on the y-axis at $1,000) as compared to brain
capacity (based on: Kurzweil, 1999 p104; 2005).
What may be expected is a slowdown in the progression as predicted, affecting the high-end
computer and communications applications. On the other hand many applications that

160127_CERRE_IntegratedRegulatoryFramework_Appendix 2_Final 44/54
come under the header of IoT do not require higher data rates, but lower rates and more
energy efficient use of the communications protocol.
Figure 20: Exponential growth of computing, 1900-2100
Source: Kurzweil, 1999; 2005
8.1.2 Growth trends
The end of the euphoric period at the turn of the century was followed by a collapse of the
telecom industry. The turnover of firms on the equipment supply side dropped with 30-50%.
The introduction of 3G was delayed. While the Internet growth rate declined, it remained
positive, as measured at the Amsterdam Internet Exchange - see Figure 21 (Amsix, 2005). As
euphoric periods and subsequent setbacks are recurring economic phenomena, we may
expect other periods of slow-down as we move towards 2025.
19001900 1940194019201920 19601960 19801980 20002000
1010-10-10
1010-5-5
1010
101055
10101010
19001900 1940194019201920 19601960 19801980 20002000
1010-10-10
1010-5-5
1010
101055
10101010
20202020 20402040 20602060 20802080 21002100
10101515
10102020
10103030
10103535
10104040
10102525
One Insect Brain
One MouseBrain
One HumanBrain
Brains of allHumans
Limit of Moore’s Law?
- Optical- DNA - Quantum
- Etc.
- Optical- DNA - Quantum
- Etc.
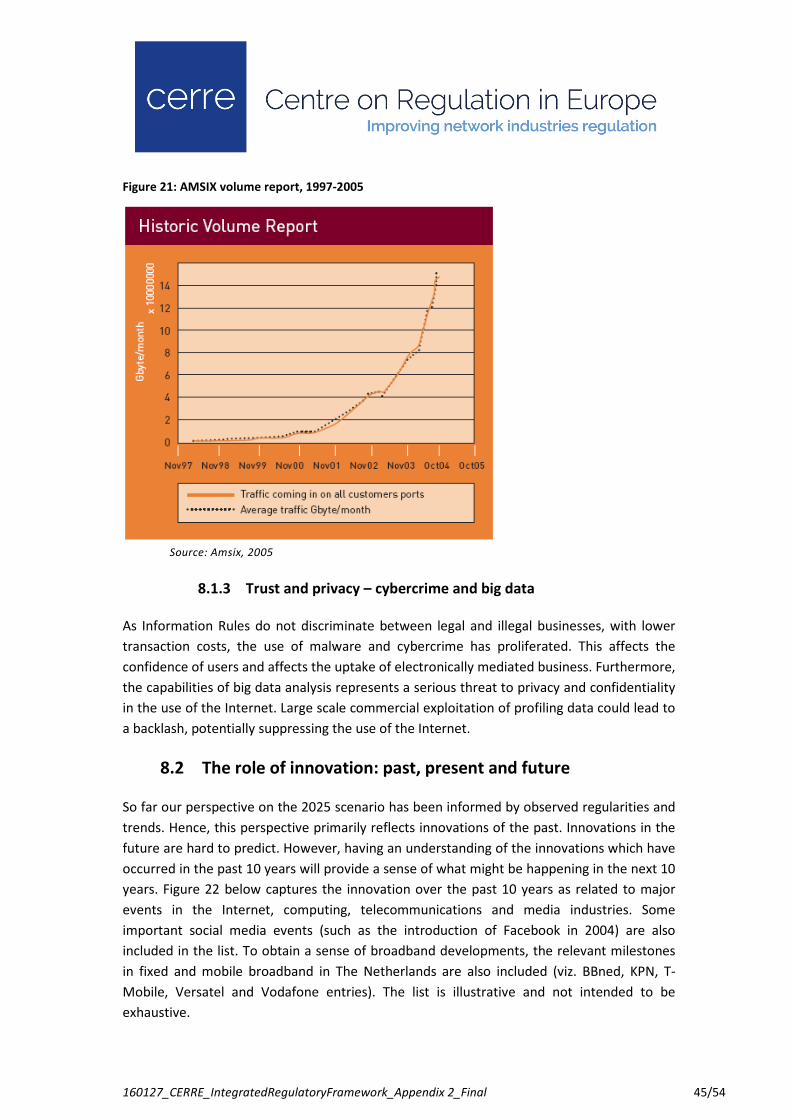
160127_CERRE_IntegratedRegulatoryFramework_Appendix 2_Final 45/54
Figure 21: AMSIX volume report, 1997-2005
Source: Amsix, 2005
8.1.3 Trust and privacy – cybercrime and big data
As Information Rules do not discriminate between legal and illegal businesses, with lower
transaction costs, the use of malware and cybercrime has proliferated. This affects the
confidence of users and affects the uptake of electronically mediated business. Furthermore,
the capabilities of big data analysis represents a serious threat to privacy and confidentiality
in the use of the Internet. Large scale commercial exploitation of profiling data could lead to
a backlash, potentially suppressing the use of the Internet.
8.2 The role of innovation: past, present and future
So far our perspective on the 2025 scenario has been informed by observed regularities and
trends. Hence, this perspective primarily reflects innovations of the past. Innovations in the
future are hard to predict. However, having an understanding of the innovations which have
occurred in the past 10 years will provide a sense of what might be happening in the next 10
years. Figure 22 below captures the innovation over the past 10 years as related to major
events in the Internet, computing, telecommunications and media industries. Some
important social media events (such as the introduction of Facebook in 2004) are also
included in the list. To obtain a sense of broadband developments, the relevant milestones
in fixed and mobile broadband in The Netherlands are also included (viz. BBned, KPN, T-
Mobile, Versatel and Vodafone entries). The list is illustrative and not intended to be
exhaustive.
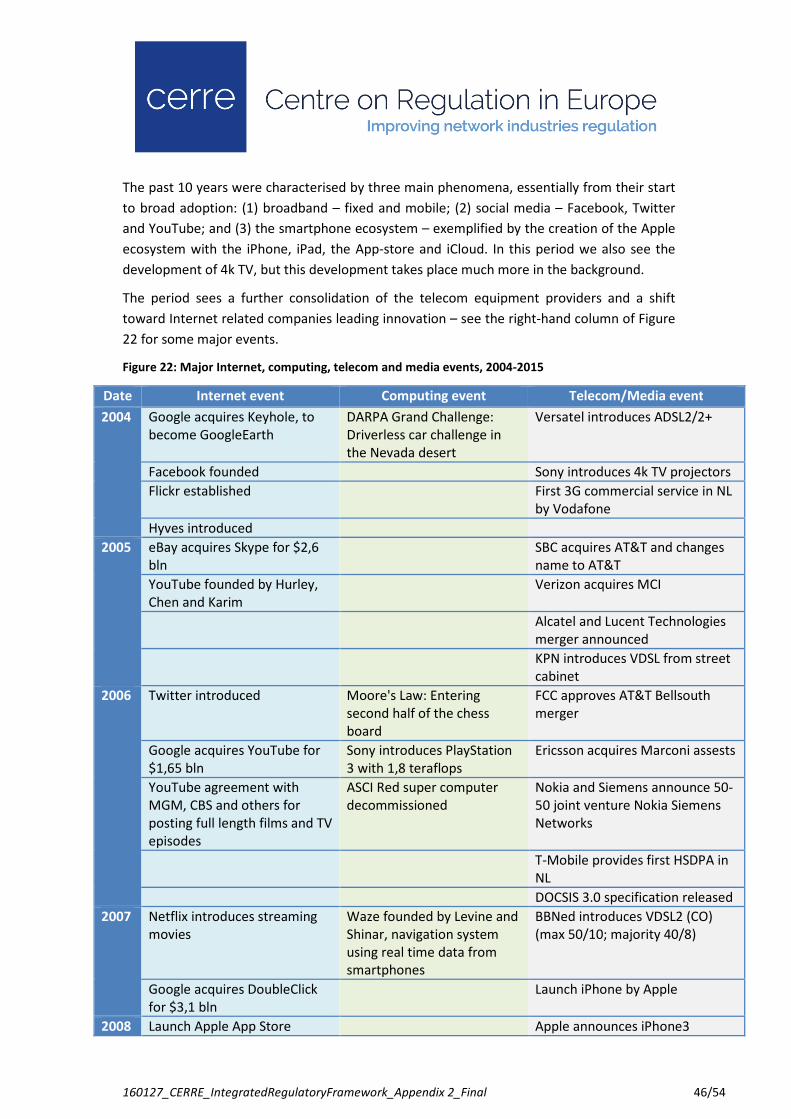
160127_CERRE_IntegratedRegulatoryFramework_Appendix 2_Final 46/54
The past 10 years were characterised by three main phenomena, essentially from their start
to broad adoption: (1) broadband – fixed and mobile; (2) social media – Facebook, Twitter
and YouTube; and (3) the smartphone ecosystem – exemplified by the creation of the Apple
ecosystem with the iPhone, iPad, the App-store and iCloud. In this period we also see the
development of 4k TV, but this development takes place much more in the background.
The period sees a further consolidation of the telecom equipment providers and a shift
toward Internet related companies leading innovation – see the right-hand column of Figure
22 for some major events.
Figure 22: Major Internet, computing, telecom and media events, 2004-2015
Date Internet event Computing event Telecom/Media event
2004 Google acquires Keyhole, to
become GoogleEarth
DARPA Grand Challenge:
Driverless car challenge in
the Nevada desert
Versatel introduces ADSL2/2+
Facebook founded Sony introduces 4k TV projectors
Flickr established First 3G commercial service in NL
by Vodafone
Hyves introduced
2005 eBay acquires Skype for $2,6
bln
SBC acquires AT&T and changes
name to AT&T
YouTube founded by Hurley,
Chen and Karim
Verizon acquires MCI
Alcatel and Lucent Technologies
merger announced
KPN introduces VDSL from street
cabinet
2006 Twitter introduced Moore's Law: Entering
second half of the chess
board
FCC approves AT&T Bellsouth
merger
Google acquires YouTube for
$1,65 bln
Sony introduces PlayStation
3 with 1,8 teraflops
Ericsson acquires Marconi assests
YouTube agreement with
MGM, CBS and others for
posting full length films and TV
episodes
ASCI Red super computer
decommissioned
Nokia and Siemens announce 50-
50 joint venture Nokia Siemens
Networks
T-Mobile provides first HSDPA in
NL
DOCSIS 3.0 specification released
2007 Netflix introduces streaming
movies
Waze founded by Levine and
Shinar, navigation system
using real time data from
smartphones
BBNed introduces VDSL2 (CO)
(max 50/10; majority 40/8)
Google acquires DoubleClick
for $3,1 bln
Launch iPhone by Apple
2008 Launch Apple App Store Apple announces iPhone3
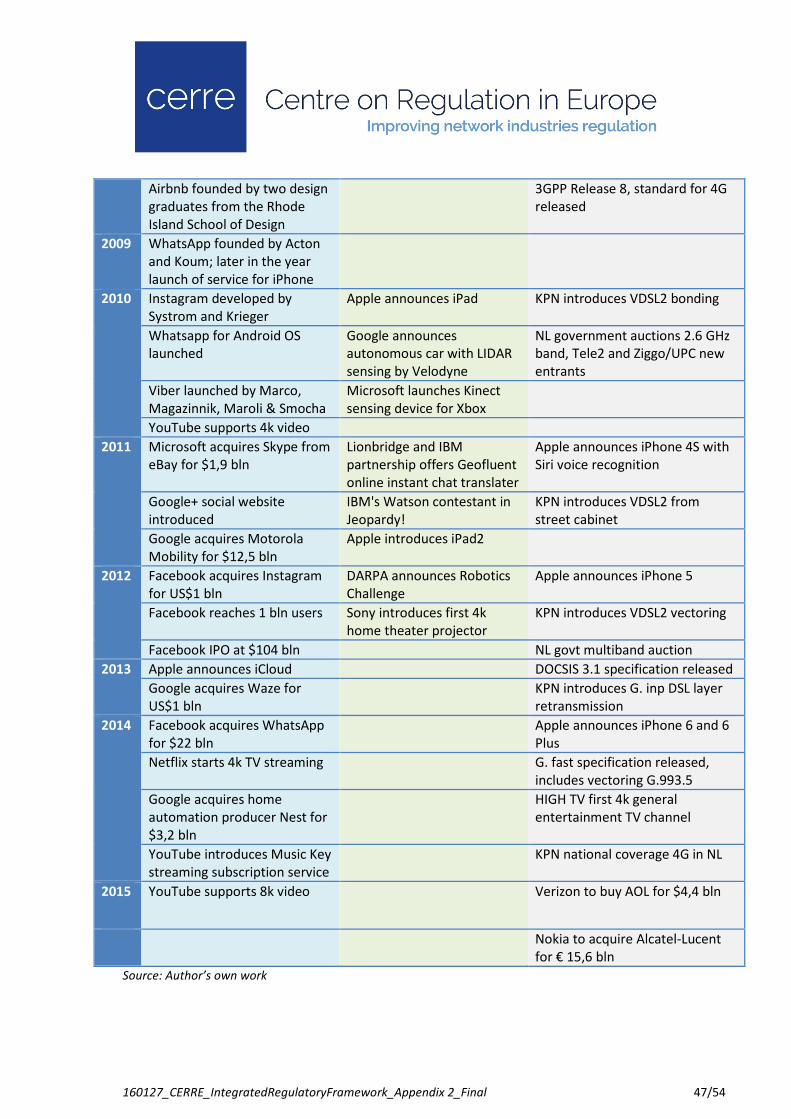
160127_CERRE_IntegratedRegulatoryFramework_Appendix 2_Final 47/54
Airbnb founded by two design
graduates from the Rhode
Island School of Design
3GPP Release 8, standard for 4G
released
2009 WhatsApp founded by Acton
and Koum; later in the year
launch of service for iPhone
2010 Instagram developed by
Systrom and Krieger
Apple announces iPad KPN introduces VDSL2 bonding
Whatsapp for Android OS
launched
Google announces
autonomous car with LIDAR
sensing by Velodyne
NL government auctions 2.6 GHz
band, Tele2 and Ziggo/UPC new
entrants
Viber launched by Marco,
Magazinnik, Maroli & Smocha
Microsoft launches Kinect
sensing device for Xbox
YouTube supports 4k video
2011 Microsoft acquires Skype from
eBay for $1,9 bln
Lionbridge and IBM
partnership offers Geofluent
online instant chat translater
Apple announces iPhone 4S with
Siri voice recognition
Google+ social website
introduced
IBM's Watson contestant in
Jeopardy!
KPN introduces VDSL2 from
street cabinet
Google acquires Motorola
Mobility for $12,5 bln
Apple introduces iPad2
2012 Facebook acquires Instagram
for US$1 bln
DARPA announces Robotics
Challenge
Apple announces iPhone 5
Facebook reaches 1 bln users Sony introduces first 4k
home theater projector
KPN introduces VDSL2 vectoring
Facebook IPO at $104 bln NL govt multiband auction
2013 Apple announces iCloud DOCSIS 3.1 specification released
Google acquires Waze for
US$1 bln
KPN introduces G. inp DSL layer
retransmission
2014 Facebook acquires WhatsApp
for $22 bln
Apple announces iPhone 6 and 6
Plus
Netflix starts 4k TV streaming G. fast specification released,
includes vectoring G.993.5
Google acquires home
automation producer Nest for
$3,2 bln
HIGH TV first 4k general
entertainment TV channel
YouTube introduces Music Key
streaming subscription service
KPN national coverage 4G in NL
2015
YouTube supports 8k video Verizon to buy AOL for $4,4 bln
Nokia to acquire Alcatel-Lucent
for € 15,6 bln
Source: Author’s own work
160127_CERRE_IntegratedRegulatoryFramework_Appendix 2_Final 48/54
8.3 Shell scenarios
The stated aim of the scenario approach in strategic planning as applied by Shell is “to
develop leaders who are better at seeing patterns of behaviour that may differ from a
conventional view of the world. They also help us recognise there may be a breadth of
possible outcomes to events that cannot be fully controlled, not ignored, but may be
influenced... … The more clearly we see the complex dynamics of tomorrow’s world, the
better we might navigate a path through the turbulence […], making wiser choices on the
journey and fostering deeper partnerships.” (Shell, 2013).
Shell has a long tradition of developing scenarios of possible futures, typically orthogonal or
at least of contrasting worlds (Van der Heijden, 1996; De Geus, 2002). The description of
those worlds could also be used to test the robustness of government policy and regulation.
The scenarios are designed to capture global developments.
The scenario for 2025 created in 2005 (and extended in 2007) presents the dual crisis of
security and trust, exemplified by the 9/11 attack on the Twin Towers and the collapse of
Enron. These have affected national security and trust in the market place. It brings into
focus the (lack of) power of the state to regulate and coerce. These elements were added to
the 2001 scenarios which already captured market incentives and the force of community. In
terms of possible futures these forces lead to the triad of ‘low trust globalisation’, ‘open
doors’ and ‘flags’ as tradeoffs achieved among market participants, civil society groups and
states, with particular attention to the role of investors and regulators - see Figure 23 (Shell,
2005, 2007).
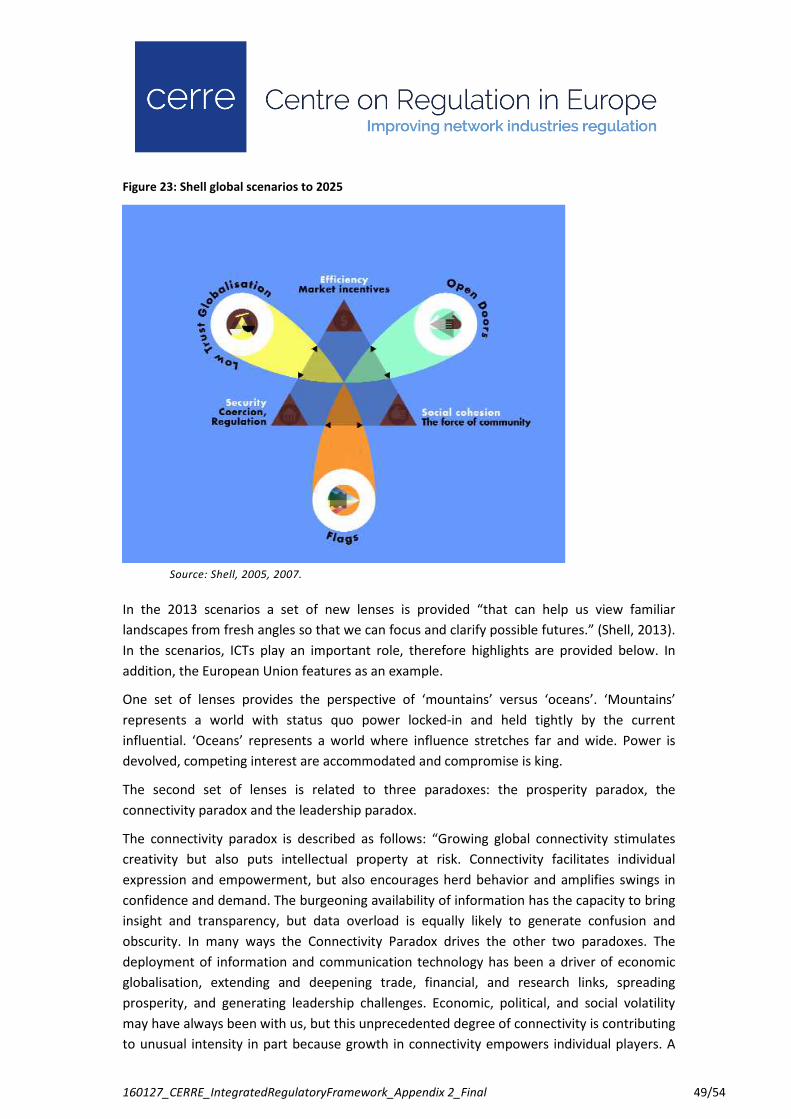
160127_CERRE_IntegratedRegulatoryFramework_Appendix 2_Final 49/54
Figure 23: Shell global scenarios to 2025
Source: Shell, 2005, 2007.
In the 2013 scenarios a set of new lenses is provided “that can help us view familiar
landscapes from fresh angles so that we can focus and clarify possible futures.” (Shell, 2013).
In the scenarios, ICTs play an important role, therefore highlights are provided below. In
addition, the European Union features as an example.
One set of lenses provides the perspective of ‘mountains’ versus ‘oceans’. ‘Mountains’
represents a world with status quo power locked-in and held tightly by the current
influential. ‘Oceans’ represents a world where influence stretches far and wide. Power is
devolved, competing interest are accommodated and compromise is king.
The second set of lenses is related to three paradoxes: the prosperity paradox, the
connectivity paradox and the leadership paradox.
The connectivity paradox is described as follows: “Growing global connectivity stimulates
creativity but also puts intellectual property at risk. Connectivity facilitates individual
expression and empowerment, but also encourages herd behavior and amplifies swings in
confidence and demand. The burgeoning availability of information has the capacity to bring
insight and transparency, but data overload is equally likely to generate confusion and
obscurity. In many ways the Connectivity Paradox drives the other two paradoxes. The
deployment of information and communication technology has been a driver of economic
globalisation, extending and deepening trade, financial, and research links, spreading
prosperity, and generating leadership challenges. Economic, political, and social volatility
may have always been with us, but this unprecedented degree of connectivity is contributing
to unusual intensity in part because growth in connectivity empowers individual players. A
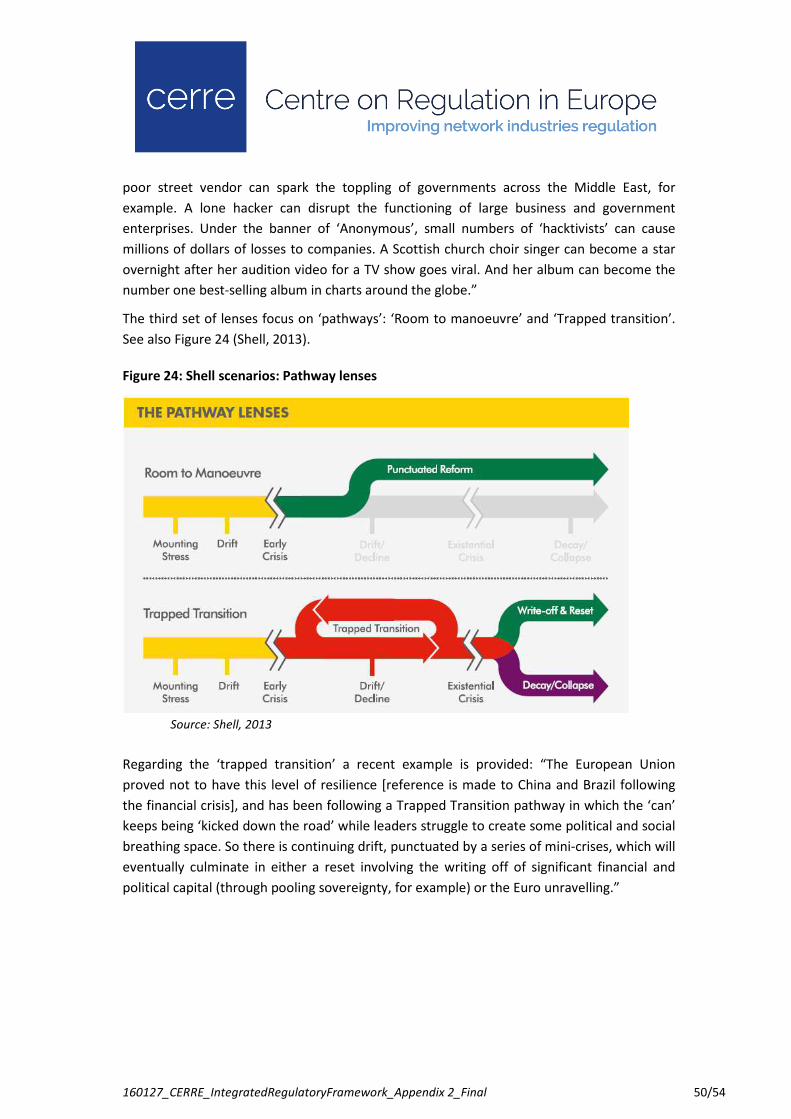
160127_CERRE_IntegratedRegulatoryFramework_Appendix 2_Final 50/54
poor street vendor can spark the toppling of governments across the Middle East, for
example. A lone hacker can disrupt the functioning of large business and government
enterprises. Under the banner of ‘Anonymous’, small numbers of ‘hacktivists’ can cause
millions of dollars of losses to companies. A Scottish church choir singer can become a star
overnight after her audition video for a TV show goes viral. And her album can become the
number one best-selling album in charts around the globe.”
The third set of lenses focus on ‘pathways’: ‘Room to manoeuvre’ and ‘Trapped transition’.
See also Figure 24 (Shell, 2013).
Figure 24: Shell scenarios: Pathway lenses
Source: Shell, 2013
Regarding the ‘trapped transition’ a recent example is provided: “The European Union
proved not to have this level of resilience [reference is made to China and Brazil following
the financial crisis], and has been following a Trapped Transition pathway in which the ‘can’
keeps being ‘kicked down the road’ while leaders struggle to create some political and social
breathing space. So there is continuing drift, punctuated by a series of mini-crises, which will
eventually culminate in either a reset involving the writing off of significant financial and
political capital (through pooling sovereignty, for example) or the Euro unravelling.”

160127_CERRE_IntegratedRegulatoryFramework_Appendix 2_Final 51/54
9. Concluding remarks
While the future cannot be predicted with a high degree of certainty, creating a vision of the
future opens the opportunity for a broad dialogue on which type of future is preferred. As
such it provides ‘food for thought’ in developing policies – policies that can be aimed at
facilitating the development in the direction of the more desirable future. Moreover, policies
can be tested for their robustness under different perspectives of the future.
To stimulate the thinking and discussion on the consequences of a particular future scenario,
it can be of great help if the differences with the past are articulated along various paradigm
dimensions, such as in Table 2 which compares the past Fordist paradigm with the current
ICT-driven techno-economic paradigm. The shifts in the operational practices when moving
from hardware centric world towards a software centric world, as identified by AT&T, may
serve as a good starting point. See the table below.
From To
Hardware Centric Software Centric
Separate IT/data center & Network/CO Common technology & technical plant
Quarterly software releases Continuous software process - “sandbox.”
Geographically fixed, single purpose equipment Highly dynamic & configurable topology & roles.
Tight coupling of NE, generic, EMS & NMS/OSS Separation of physical & logical components.
Separation of service elements & support systems Integrated orchestration, automation & virtualisation.
Faults as service failures Faults as capacity reduction events.
Hardware monitoring appliances Software based monitoring.
Service specific resource combinations Profiles, templates & reusable resource combinations.
Special design and provisioning processes Configurable catalog/rule-driven delivery frameworks.
Optimised provider network & ops process Optimised customer experience.
Highly constrained, independent & disaggregated
control planes
Highly integrated & automated control planes driven
by customer & operator policies.
Limited service dimensions Multifaceted service dimensioning.
Highly constrained data translation &
synchronisation solutions for shared management
knowledge between network & systems
Shared management “Data Bus” technology between
network & systems.
Slow tooling changes requiring coding Rapid tooling changes using policies/rules
Network management Customer experience management
Long lead provisioning times – often hardware and
process constrained
Real-time provisioning
Static billing and charging Granular and dynamic usage-based charging, billing,
financial management, subscription
Source: AT&T,2013.
160127_CERRE_IntegratedRegulatoryFramework_Appendix 2_Final 52/54
References
4G Americas (2014a). 4G Americas' summary of global 5G initiatives. Bellevue, WA.
4G Americas (2014b). Bringing network function virtualization to LTE. Bellevue, WA.
5G Infrastructure Association (2015). 5G Vision - The 5G infrastructure public private
partnership; the next generation of communication networks and services. Brussels.
Akamai (2015). State of the Internet, 4Q2014. Cambridge, MA.
Alcatel-Lucent (2013). Get to fast, faster. Paris.
Amsix (2005). Annual Report Amsterdam Internet Exchange. Amsterdam: Amsterdam
Internet Exchange.
Anker, P. (2013). Governance of the radio spectrum: An actor-centric framework for analysis.
First International Conference on Public Policy. Grenoble.
Anker, P. & W. Lemstra (2013). "Cognitive radio: How to proceed? An actor-centric
approach." Communications & Strategies. Digiworld Economic Journal 90(2): 77-96
AT&T (2013). AT&T Domain 2.0 vision white paper. Dallas.
Brynjolfson, E. (1992). "The productivity paradox of information technology: Review and
assessment." Retrieved 2004-02-09, from
http://ccs.mit.edu/papers/CCSWP130/ccswp130.html.
Brynjolfson, E. & L. M. Hitt (1998). "Beyond the productivity paradox - computers are the
catalyst for bigger changes." Communications of the ACM August
Cisco (2015). The Zettabyte era: trends and analysis. San Jose, CA.
De Geus, A. (2002). The living company - Habits for survival in a turbulant business
environment. Boston, MA: Harvard Business School Press.
De Wit, B. (1994). Strategie bouwen op golven - Een onderzoek naar strategieën in cyclical
industries, met als case-study de offshore drilling industry. Delft, The Netherlands: Eburon.
EBU (2014). Delivery of broadcast content over LTE networks - TR 027. Geneva.
EC (1987). COM(87)2 290: Green paper on the development of the common market for
telecommunications services and equipment. Brussels: European Commission.
Freeman, C. (1998). Lange Wellen und Arbeitslosigkeit (Long waves and unemployment). In:
H. Thomas & L. A. Nefiodow (Eds). Kondratieffs Zyklen der Wirtschaft - An der Schwelle neue
Vollbeschäftigung? Herford, Germany: BusseSeewald.
Freeman, C. & F. Louçã (2001). As time goes by - From the Industrial Revolutions to the
Information Revolution. Oxford: Oxford University Press.
Freeman, C. & L. Soete (1997). The economics of industrial innovation. Cambridge MA: The
MIT Press.
160127_CERRE_IntegratedRegulatoryFramework_Appendix 2_Final 53/54
FttH Council Europe (2014). G.fast. Brussels: FttH Council Europe.
Golio, M. (2015). "Fifty years of Moore's Law." Proceedings of the IEEE 103(10): 1932-1937
Höller, J., V. Tsiatsis, C. Mulligan, S. Karnouskos, S. Avesand & D. Boyle (2014). From
Machine-to-Machine to the Internet of Things: Introduction to a New Age of intelligence.
Oxford: Academic Press.
ITU-R (2015). Workplan, timeline, process and deliverables for the future development of
IMT. Geneva.
Kleinknecht, A. H. (1987). Innovation patterns in crisis and prosperity - Schumpeter's long
cycle reconsidered. New York: St. Martin's Press.
Kurzweil, R. (1999). The age of spiritual machines - When computers exceed human
intelligence. New York: Viking - Penguin Group.
Kurzweil, R. (2005). The singularity is near - When humans transcend biology. New York:
Penguin Books.
Lemstra, W. (2006). Dissertation: The Internet bubble and the impact on the development
path of the telecommunication sector. Department Technology, Policy and Management.
Delft, The Netherlands: TUDelft. p 460.
Lemstra, W. (2012). DSL and the Digital Agenda for Europe. TNO DSL Seminar. Leiden, The
Netherlands: TNO.
Lemstra, W. (2015). Ultra-Fast Broadband informed by research into the Dynamics of
Broadband Markets in Europe. TNO Ultrafast Broadband Seminar. The Hague: TNO.
Lohmar, T., M. Slssingar, V. Kenehan & S. Puustinen (2013). "Delivering content with LTE
broadcast." Ericsson Review February 11
Mack, C. A. (2011). "Fifty years of Moore's Law." IEEE Transactions on Semiconductor
Manufacturing 24(2): 202-207
Mack, C. A. (2015). "The multiple lives of Moore's Law." IEEE Spectrum April: 31-37
Manninen, A. T. (2002). Dissertation: Elaboration of NMT and GSM standards: From idea to
market. Dissertation: Department of Humanities. Jyväskylä, Finland: University of Jyväskylä.
Melody, W. H. (1999). "Telecom reform: Progress and prospects." Telecommunications
Policy 23
Moore, G. E. (1965). "Cramming more components onto integrated circuits." Electronics
38(8)
Mueller, M. L. (2002). Ruling the root: Internet governance and the taming of cyberspace.
Cambridge, MA: MIT Press.
Mueller, M. L. (2010). Networks and states: The global politics of internet governance.
Cambridge, MA: MIT Press.
160127_CERRE_IntegratedRegulatoryFramework_Appendix 2_Final 54/54
Mueller, M. L. & W. Lemstra (2011). Liberalization and the Internet. In: R. W. Künneke & M.
Finger (Eds). International handbook of network industries - The liberalization of
infrastructures. Cheltenham, UK: Edward Elgar: 144-161.
NGMN (2015). 5G White Paper. Frankfurt am Main, Germany.
Niemegeers, I. & S. Heemstra de Groot (2015). Cognitive Radio+ for 5G and beyond.
Eindhoven: Technical University Eindhoven.
NLkabel (2014). DOCSIS 3.1 Factsheet. The Hague.
Nokia (2014). LTE networks for public safety services. Espoo, Finland: Nokia Solutions and
Networks Oy.
Patel, M., J. Joubert, J. Roldan Ramos, N. Sprecher, S. Abeta & A. Neal (2014). Mobile-edge
computing - Introductory technical White Paper. Sophia-Antipolis, France: ETSI.
Perez, C. (2002). Technological revolutions and financial capital: The dynamics of bubbles
and golden ages. Cheltenham, UK: Edward Elgar.
Rohde&Schwarz (2015). DOCSIS 3.1 Application Note. München, Germany.
Rysavy Research (2015). LTE and 5G innovation: igniting mobile broadband. Bellevue, WA:
4G Americas.
Shapiro, C. & H. R. Varian (1999). Information Rules - A strategic guide to the network
economy. Boston: Harvard Business School Press.
Shell (2005). Shell global scenarios to 2025. The Hague: Shell Corp.
Shell (2007). Shell global scenarios to 2025. London: Shell Centre.
Shell (2013). New lens scenarios - A shift in perspective for a world in transition. London:
Shell Centre.
Strijkers, R. J. (2014). Dissertation: Internet factories. Department Physics, Mathematics and
Informatics. Amsterdam: University of Amsterdam.
TNO (2014a). Monitor draadloze technologie 2014. Delft, The Netherlands.
TNO (2014b). Versatile content distribution over LTE networks, a multi-provider approach.
Delft, The Netherlands.
Van der Heijden, K. (1996). Scenarios - The art of strategic conversation. Chichester, UK:
Wiley & Sons.
Van Nee, R. (2012). Enhancing throughput in 802.11. Use case workshop Cognitive Radio
Platform NL. Delft: TUDelft.
Wireless World Research Forum (2011). Requirements and vision for NG-wireless. Zürich,
Switzerland.