An integrated national mortality surveillance system … · An integrated national mortality...
12
Bull World Health Organ 2016;94:46–57 | doi: http://dx.doi.org/10.2471/BLT.15.153148 46 An integrated national mortality surveillance system for death registration and mortality surveillance, China Shiwei Liu, a Xiaoling Wu, b Alan D Lopez, c Lijun Wang, a Yue Cai, b Andrew Page, d Peng Yin, a Yunning Liu, a Yichong Li, a Jiangmei Liu, a Jinling You a & Maigeng Zhou a Introduction Reliable and timely information on cause-specific mortality is fundamental for informing the development, implementation and evaluation of health policy. 1,2 China has yet to establish a complete vital registration system for its 1.3 billion popu- lation. To date, the essential data on the causes of death in China used for decision-making and performance evaluation have come from sample-based mortality surveillance systems, including the nationally representative disease surveillance points system of the Chinese Center for Disease Control and Prevention (CDC) and the vital registration system of the Chinese Ministry of Health. 3 e disease surveillance points system was established in 1978 with a pilot study at two surveillance points in Beijing. 3 By 1990, the number of points had increased to 145 and the population covered was approximately 10 million. 3,4 In 2004, the system was expanded again to include 161 points and pop- ulation coverage increased to 73 million. e sampling strategy and the characteristics of this system have been described in detail elsewhere along with the quality control measures and the procedures for collecting data, coding the cause of death and determining the underlying cause of death. 3–5 For deaths in hospital, doctors certified the cause of death and trained coders determined the underlying cause of death by apply- ing the rules of the International Classification of Diseases. 6 For hospitals without the capacity to determine or code the underlying cause of death, these functions were carried out by the county or district CDC. For deaths occurring outside hospital, village health workers or township or community hospital staff did a verbal autopsy from which doctors in these hospitals determined the underlying cause of death. Since 2008 information on individual deaths in all population catchment areas has been reported in real time using an Internet-based reporting system. 7 In this system, information on each death is systematically validated by local – including county, pre- fecture and provincial level – Centers for Disease Control and Prevention, which also check the completeness, coding and internal logic of the items reported on death certificates. Causes-of-death are subsequently reported to the national CDC, where data are consolidated. e Chinese vital registration system was established in the 1950s to collect mortality data in 13 cities. By 2000, the population under surveillance was around 110 million and the system covered 15 large cities, 21 medium-sized or small cities and 90 counties drawn from 15 provinces and municipalities. 8 By 2012, the system had expanded to include 319 sites (138 counties and 181 districts) in 22 provinces covering about 230 million people, mostly in eastern and central areas of the country. Forty-two counties in the vital registration system overlapped with population catchments in the disease surveil- lance points system. e collection of cause-of-death data in the vital registration system was similar to the disease surveil- lance points system. Data on deaths were compiled according to predetermined aggregation principles and reported monthly by electronic file transfer to the Center for Health Statistics and Information of the National Health and Family Planning Commission (previously the Ministry of Health). Quality control meetings were held annually and regular training was carried out to ensure data quality. Together, the disease surveillance points and vital regis- tration systems provided a nationally representative picture of Abstract In China, sample-based mortality surveillance systems, such as the Chinese Center for Disease Control and Prevention’s disease surveillance points system and the Ministry of Health’s vital registration system, have been used for decades to provide nationally representative data on health status for health-care decision-making and performance evaluation. However, neither system provided representative mortality and cause-of-death data at the provincial level to inform regional health service needs and policy priorities. Moreover, the systems overlapped to a considerable extent, thereby entailing a duplication of effort. In 2013, the Chinese Government combined these two systems into an integrated national mortality surveillance system to provide a provincially representative picture of total and cause-specific mortality and to accelerate the development of a comprehensive vital registration and mortality surveillance system for the whole country. This new system increased the surveillance population from 6 to 24% of the Chinese population. The number of surveillance points, each of which covered a district or county, increased from 161 to 605. To ensure representativeness at the provincial level, the 605 surveillance points were selected to cover China’s 31 provinces using an iterative method involving multistage stratification that took into account the sociodemographic characteristics of the population. This paper describes the development and operation of the new national mortality surveillance system, which is expected to yield representative provincial estimates of mortality in China for the first time. a National Center for Chronic and Non-communicable Disease Control and Prevention, Chinese Center for Disease Control and Prevention, 27 Nanwei Road, Xicheng District, Beijing, 100050, China. b Center for Health Statistics and Information, National Health and Family Planning Commission, Beijing, China. c School of Population and Global Health, University of Melbourne, Melbourne, Australia. d School of Science and Health, University of Western Sydney, Sydney, Australia. Correspondence to Maigeng Zhou (email: [email protected]). (Submitted: 23 January 2015 – Revised version received: 9 August 2015 – Accepted: 10 August 2015 – Published online: 28 October 2015 ) Policy & practice
Transcript of An integrated national mortality surveillance system … · An integrated national mortality...

Bull World Health Organ 2016;94:46–57 | doi: http://dx.doi.org/10.2471/BLT.15.153148
Policy & practice
46
An integrated national mortality surveillance system for death registration and mortality surveillance, ChinaShiwei Liu,a Xiaoling Wu,b Alan D Lopez,c Lijun Wang,a Yue Cai,b Andrew Page,d Peng Yin,a Yunning Liu,a Yichong Li,a Jiangmei Liu,a Jinling Youa & Maigeng Zhoua
IntroductionReliable and timely information on cause-specific mortality is fundamental for informing the development, implementation and evaluation of health policy.1,2 China has yet to establish a complete vital registration system for its 1.3 billion popu-lation. To date, the essential data on the causes of death in China used for decision-making and performance evaluation have come from sample-based mortality surveillance systems, including the nationally representative disease surveillance points system of the Chinese Center for Disease Control and Prevention (CDC) and the vital registration system of the Chinese Ministry of Health.3
The disease surveillance points system was established in 1978 with a pilot study at two surveillance points in Beijing.3 By 1990, the number of points had increased to 145 and the population covered was approximately 10 million.3,4 In 2004, the system was expanded again to include 161 points and pop-ulation coverage increased to 73 million. The sampling strategy and the characteristics of this system have been described in detail elsewhere along with the quality control measures and the procedures for collecting data, coding the cause of death and determining the underlying cause of death.3–5 For deaths in hospital, doctors certified the cause of death and trained coders determined the underlying cause of death by apply-ing the rules of the International Classification of Diseases.6 For hospitals without the capacity to determine or code the underlying cause of death, these functions were carried out by the county or district CDC. For deaths occurring outside hospital, village health workers or township or community hospital staff did a verbal autopsy from which doctors in these
hospitals determined the underlying cause of death. Since 2008 information on individual deaths in all population catchment areas has been reported in real time using an Internet-based reporting system.7 In this system, information on each death is systematically validated by local – including county, pre-fecture and provincial level – Centers for Disease Control and Prevention, which also check the completeness, coding and internal logic of the items reported on death certificates. Causes-of-death are subsequently reported to the national CDC, where data are consolidated.
The Chinese vital registration system was established in the 1950s to collect mortality data in 13 cities. By 2000, the population under surveillance was around 110 million and the system covered 15 large cities, 21 medium-sized or small cities and 90 counties drawn from 15 provinces and municipalities.8 By 2012, the system had expanded to include 319 sites (138 counties and 181 districts) in 22 provinces covering about 230 million people, mostly in eastern and central areas of the country. Forty-two counties in the vital registration system overlapped with population catchments in the disease surveil-lance points system. The collection of cause-of-death data in the vital registration system was similar to the disease surveil-lance points system. Data on deaths were compiled according to predetermined aggregation principles and reported monthly by electronic file transfer to the Center for Health Statistics and Information of the National Health and Family Planning Commission (previously the Ministry of Health). Quality control meetings were held annually and regular training was carried out to ensure data quality.
Together, the disease surveillance points and vital regis-tration systems provided a nationally representative picture of
Abstract In China, sample-based mortality surveillance systems, such as the Chinese Center for Disease Control and Prevention’s disease surveillance points system and the Ministry of Health’s vital registration system, have been used for decades to provide nationally representative data on health status for health-care decision-making and performance evaluation. However, neither system provided representative mortality and cause-of-death data at the provincial level to inform regional health service needs and policy priorities. Moreover, the systems overlapped to a considerable extent, thereby entailing a duplication of effort. In 2013, the Chinese Government combined these two systems into an integrated national mortality surveillance system to provide a provincially representative picture of total and cause-specific mortality and to accelerate the development of a comprehensive vital registration and mortality surveillance system for the whole country. This new system increased the surveillance population from 6 to 24% of the Chinese population. The number of surveillance points, each of which covered a district or county, increased from 161 to 605. To ensure representativeness at the provincial level, the 605 surveillance points were selected to cover China’s 31 provinces using an iterative method involving multistage stratification that took into account the sociodemographic characteristics of the population. This paper describes the development and operation of the new national mortality surveillance system, which is expected to yield representative provincial estimates of mortality in China for the first time.
a National Center for Chronic and Non-communicable Disease Control and Prevention, Chinese Center for Disease Control and Prevention, 27 Nanwei Road, Xicheng District, Beijing, 100050, China.
b Center for Health Statistics and Information, National Health and Family Planning Commission, Beijing, China.c School of Population and Global Health, University of Melbourne, Melbourne, Australia.d School of Science and Health, University of Western Sydney, Sydney, Australia.Correspondence to Maigeng Zhou (email: [email protected]).(Submitted: 23 January 2015 – Revised version received: 9 August 2015 – Accepted: 10 August 2015 – Published online: 28 October 2015 )
Policy & practice

Bull World Health Organ 2016;94:46–57| doi: http://dx.doi.org/10.2471/BLT.15.153148 47
Policy & practiceMortality surveillance in ChinaShiwei Liu et al.
mortality in China.9 The vital registration system, while not representative, was able to give more accurate estimates of the proportion of deaths due to specific causes and larger sample of deaths than the disease surveillance points. The dis-ease surveillance points system reflected total mortality, the broad cause-of-death distribution and the geographic distribu-
tion of deaths more accurately, because the sampling strategy employed ensured a nationally representative sample.10 However, neither system was able to pro-vide representative data on mortality or the causes of death at the provincial level. Differences between the two systems and their development are described more fully in Table 1 and Table 2.
In 2013, the National Health and Family Planning Commission combined the vital registration system and disease surveillance points system to create an integrated national mortality surveil-lance system. The goals were to integrate and rationalize the health resources expended on these systems and to ac-celerate the development of a complete
Table 1. Vital registration and disease surveillance points mortality surveillance systems, China, 1950–2013
Mortality surveillance system
Establishment Development Sampling method
Sites covered
Population coverage
Representativeness Data reporting
Vital registration system
During the 1950s in 13 cities, including Beijing, Shanghai and Nanjing
By 1985, 28 large and medium-sized cities and 70 counties were covered; by 2000, 36 cities (i.e. municipalities and prefecture-level cities, which included many districts) and 90 counties in 15 provinces were covered.
Voluntary Cities (including counties and districts) and counties
By 1985, 60 million; by 2000, 110 million
Mostly cities and eastern rural areas of the country
Local CDCs made monthly reports by electronic file transfer to the CHSI of the NHFPC
By 2012, the system included 319 surveillance pointsa in 22 provinces
Voluntary Counties and districts
By 2012, 230 million
Mostly eastern and central areas of the country
Local CDCs made monthly reports by electronic file transfer to the CHSI of the NHFPC
Disease surveillance points system
In 1978, in Dongcheng district and Tong county, Beijing
By 1989, 71 surveillance pointsa across 29 provinces were covered
Voluntary ND ND Mostly large cities and more wealthy rural areas
Local CDCs made monthly reports by electronic file transfer to the national CDC
In 1990, 145 surveillance pointsa across 31 provinces were covered
Multistage, stratified, cluster sampling (sampling probability proportional to population size)
1 or 2 townships in each county or 1 or 2 subdistricts in each district for each surveillance point
10 million (approximately 1% of the total Chinese population)
Both nationally and regionally (i.e. eastern, central and western; urban and rural) representative
Local CDCs made monthly reports by electronic file transfer to the national CDC
In 2004, 161 surveillance pointsa across 31 provinces were covered
Multistage stratification, selection, evaluation and adjustment
The whole population covered by each surveillance point
73 million (approximately 6% of the total Chinese population)
Both nationally and regionally (i.e. eastern, central and western; urban and rural) representative
Since 2008, hospitals and local CDCs have reported to the national CDC using a real-time Internet-based system
CDC: Center for Disease Control and Prevention; CHSI: Center for Health Statistics and Information; ND: not determined; NHFPC: National Health and Family Planning Commission (previously the Ministry of Health).a Each surveillance point corresponded to one county or district.

Bull World Health Organ 2016;94:46–57| doi: http://dx.doi.org/10.2471/BLT.15.15314848
Policy & practiceMortality surveillance in China Shiwei Liu et al.
Tabl
e 2.
Re
port
ing
caus
e-of
-dea
th th
roug
h vi
tal r
egist
ratio
n an
d di
seas
e su
rvei
llanc
e po
ints
syst
ems,
Chin
a, 1
950–
2013
Perio
da , by
pla
ce o
f de
ath
Vita
l reg
istra
tion
syst
emDi
seas
e su
rvei
llanc
e po
ints
syst
em
Deat
h in
form
atio
n co
llect
ion
Deat
h
cert
ifica
teCo
ding
caus
e of
de
ath
Dete
rmin
ing
the
unde
rly-
ing
caus
e of
dea
thDe
ath
info
rmat
ion
co
llect
ion
Deat
h ce
rtifi
cate
Codi
ng ca
use
of
dea
thDe
term
inin
g th
e
unde
rlyin
g ca
use
of d
eath
In e
arlie
r ye
ars,
in
hosp
ital
Fam
ily m
embe
rs
repo
rted
to lo
cal v
ital
regi
stra
tion
office
s in
hosp
itals,
hos
pita
ls re
port
ed to
loca
l CD
Cs a
nd lo
cal C
DCs
pr
epar
ed su
mm
arie
s
Staff
in th
e ho
spita
l’s v
ital
regi
stra
tion
office
co
mpl
eted
the
cert
ifica
te u
sing
info
rmat
ion
from
fa
mily
mem
bers
an
d an
y av
aila
ble
med
ical
reco
rds
and
docu
men
ts
Codi
ng w
as d
one
by
staff
in lo
cal C
DCs
; IC
D-1
0 cl
assifi
catio
n us
ed si
nce
2002
Det
erm
ined
by
staff
in lo
cal
CDCs
Staff
in th
e ho
spita
l’s
dise
ase
prev
entio
n un
it co
llect
ed d
eath
ce
rtifi
cate
s and
re
port
ed to
the
loca
l CD
C, w
hich
pro
vide
d su
mm
arie
s
Clin
ical
doc
tors
in
the
hosp
ital
com
plet
ed th
e ce
rtifi
cate
s
Initi
ally
, cod
ing
was
don
e by
staff
in th
e na
tiona
l CD
C (p
revi
ously
the
Chin
ese
Acad
emy
of
Prev
entiv
e M
edic
ine)
; th
en th
ere
was
a
grad
ual t
rans
ition
to th
e pr
oced
ures
use
d in
rece
nt
year
s. IC
D-1
0 cl
assifi
catio
n us
ed si
nce
2004
Initi
ally
det
erm
ined
by
staff
in th
e na
tiona
l CD
C (p
revi
ously
the
Chin
ese
Acad
emy
of P
reve
ntiv
e M
edic
ine)
; the
n th
ere
was
a
grad
ual t
rans
ition
to th
e pr
oced
ures
use
d in
rece
nt
year
s
In re
cent
ye
ars,
in
hosp
ital
Staff
in th
e ho
spita
l’s
dise
ase
prev
entio
n un
it co
llect
ed d
eath
ce
rtifi
cate
s and
re
port
ed to
the
loca
l CD
C, w
hich
pro
vide
d su
mm
arie
s
Clin
ical
doc
tors
in
the
hosp
ital
com
plet
ed th
e ce
rtifi
cate
s
Codi
ng w
as d
one
eith
er b
y: d
octo
rs in
th
e ho
spita
l’s m
edic
al
reco
rds u
nit o
r by
staff
in th
e ho
spita
l’s
dise
ase
prev
entio
n un
it, a
nd lo
cal C
DC
staff
che
cked
the
codi
ng; o
r loc
al C
DC
staff
whe
n th
e lo
cal
hosp
ital d
id n
ot h
ave
the
capa
city
. ICD
-10
clas
sifica
tion
used
sin
ce 2
002
Det
erm
ined
eith
er b
y do
ctor
s in
the
hosp
ital’s
m
edic
al re
cord
s uni
t or
by st
aff in
the
hosp
ital’s
di
seas
e pr
even
tion
unit,
an
d ch
ecke
d by
loca
l CD
C st
aff; o
r by
loca
l CD
C st
aff
whe
n th
e lo
cal h
ospi
tal d
id
not h
ave
the
capa
city
Staff
in th
e ho
spita
l’s
dise
ase
prev
entio
n un
it co
llect
ed d
eath
ce
rtifi
cate
s and
ent
ered
th
e de
tails
ont
o a
real
-tim
e, In
tern
et-
base
d sy
stem
; loc
al
CDC
staff
che
cked
the
info
rmat
ion
Clin
ical
doc
tors
in
hos
pita
ls co
mpl
eted
the
cert
ifica
tes
Codi
ng w
as m
ostly
don
e by
loca
l CD
C st
aff, b
ut a
lso
by d
octo
rs in
hos
pita
ls’
med
ical
reco
rds u
nits
or
staff
in h
ospi
tals’
dise
ase
prev
entio
n un
its, a
nd
chec
ked
by lo
cal C
DC
staff
. ICD
-10
clas
sifica
tion
used
sinc
e 20
04
Mos
tly d
eter
min
ed b
y lo
cal
CDC
staff
, but
also
by
doct
ors
in h
ospi
tals’
med
ical
reco
rds
units
or s
taff
in h
ospi
tals’
di
seas
e pr
even
tion
units
, and
ch
ecke
d by
loca
l CD
C st
aff
In e
arlie
r ye
ars,
outs
ide
hosp
ital
Fam
ily m
embe
rs
repo
rted
to lo
cal v
ital
regi
stra
tion
office
s in
loca
l hos
pita
ls,
hosp
itals
repo
rted
to
loca
l CD
Cs a
nd
loca
l CD
Cs p
repa
red
sum
mar
ies
Staff
in lo
cal
hosp
itals’
vita
l re
gist
ratio
n offi
ces c
ompl
eted
th
e ce
rtifi
cate
s us
ing
info
rmat
ion
from
fam
ily
mem
bers
and
any
av
aila
ble
med
ical
re
cord
s and
do
cum
ents
Codi
ng w
as
perfo
rmed
by
staff
in
loca
l CD
Cs; I
CD-1
0 cl
assifi
catio
n us
ed
since
200
2
Det
erm
ined
by
staff
in lo
cal
CDCs
Villa
ge h
ealth
wor
kers
an
d di
seas
e pr
even
tion
unit
staff
in to
wns
hip
hosp
itals
in ru
ral a
reas
an
d di
seas
e pr
even
tion
unit
staff
in C
Hs i
n ur
ban
area
s col
lect
ed
info
rmat
ion
usin
g ho
useh
old
surv
eys;
the
info
rmat
ion
was
ch
ecke
d w
ith b
odie
s su
ch a
s the
loca
l po
lice,
the
civi
l affa
irs
depa
rtm
ent a
nd th
e m
ater
nal a
nd c
hild
de
part
men
t and
then
re
port
ed to
the
loca
l CD
C, w
hich
pre
pare
d su
mm
arie
s
Staff
in lo
cal
hosp
itals’
di
seas
e pr
even
tion
units
co
mpl
eted
th
e ce
rtifi
cate
s us
ing
info
rmat
ion
from
fam
ily
mem
bers
and
an
y av
aila
ble
med
ical
re
cord
s and
do
cum
ents
Codi
ng w
as p
erfo
rmed
by
staff
in th
e na
tiona
l CD
C (p
revi
ously
the
Chin
ese
Acad
emy
of P
reve
ntiv
e M
edic
ine)
; ICD
-10
clas
sifica
tion
used
sinc
e 20
04
Det
erm
ined
by
staff
in th
e na
tiona
l CD
C (p
revi
ously
th
e Ch
ines
e Ac
adem
y of
Pr
even
tive
Med
icin
e)
(contin
ues.
. .)

Shiwei Liu et al. Mortality surveillance in ChinaPolicy & practice
49Bull World Health Organ 2016;94:46–57| doi: http://dx.doi.org/10.2471/BLT.15.153148
vital registration and mortality surveil-lance system covering the entire popu-lation of China. Initially, the national mortality surveillance system covered a population of 323.8 million (24.3% of the total population of the country) and comprised 605 surveillance points, with each point covering an entire county or district. This paper describes the development and operation of this new mortality surveillance system.
Development of a new system
The national mortality surveillance system was established using the same general principles applied in developing the disease surveillance points system.3–5 First, the National Health and Family Planning Commission determined that the surveillance population should be not less than 5 million in any province that had a population greater than 10 million and was economically well developed; for other provinces, the population sample had to be at least 20% of the total population. These cri-teria were used to establish the number of surveillance points required in each province. Second, we divided all coun-ties and districts in each province into eight strata according to their degree of urbanization, population size and the crude mortality rate (total number of deaths per 1000 people per year). Third, we selected counties and districts in each stratum as candidate surveillance points for each province in accordance with the number of surveillance points required. We then determined how representa-tive the candidate surveillance points were of the whole province using data from the 2010 census.11 The final sur-veillance points for each province were selected using an iterative process that ensured the combination of points was representative of the population of the province (Fig. 1).
Surveillance population
The final size of the target surveillance population in each province was based not only on the two criteria used by the National Health and Family Planning Commission as described above but also on decisions made by the national CDC in consultation with provincial CDCs, which took into consideration differences between provinces in popu-lation and in the capability and training Pe
rioda ,
by p
lace
of
deat
h
Vita
l reg
istra
tion
syst
emDi
seas
e su
rvei
llanc
e po
ints
syst
em
Deat
h in
form
atio
n co
llect
ion
Deat
h
cert
ifica
teCo
ding
caus
e of
de
ath
Dete
rmin
ing
the
unde
rly-
ing
caus
e of
dea
thDe
ath
info
rmat
ion
co
llect
ion
Deat
h ce
rtifi
cate
Codi
ng ca
use
of
dea
thDe
term
inin
g th
e
unde
rlyin
g ca
use
of d
eath
In re
cent
ye
ars,
outs
ide
hosp
ital
Villa
ge h
ealth
wor
kers
in
rura
l are
as a
nd
dise
ase
prev
entio
n un
it st
aff in
CH
s in
urba
n ar
eas c
olle
cted
in
form
atio
n us
ing
hous
ehol
d su
rvey
s; th
e in
form
atio
n w
as
chec
ked
with
bod
ies
such
as t
he lo
cal
polic
e, th
e ci
vil a
ffairs
de
part
men
t and
the
mat
erna
l and
chi
ld
depa
rtm
ent a
nd th
en
repo
rted
to th
e lo
cal
CDC,
whi
ch p
repa
red
sum
mar
ies
Cert
ifica
tes w
ere
com
plet
ed b
y cl
inic
al d
octo
rs
in c
harg
e of
em
erge
ncy
treat
men
t or
by d
iseas
e pr
even
tion
unit
staff
in c
harg
e of
hou
seho
ld
surv
eys o
r of
chec
king
fiel
d re
port
s
Codi
ng w
as d
one
eith
er b
y th
e lo
cal
hosp
ital’s
dise
ase
prev
entio
n un
it st
aff,
and
chec
ked
by lo
cal
CDC
staff
; or l
ocal
CD
C st
aff w
hen
the
loca
l hos
pita
l did
not
ha
ve th
e ca
paci
ty.
ICD
-10
clas
sifica
tion
used
sinc
e 20
02
Det
erm
ined
by
eith
er: (
i) th
e lo
cal h
ospi
tal’s
dise
ase
prev
entio
n un
it st
aff, a
nd
chec
ked
by lo
cal C
DC
staff
; or
(ii)
loca
l CD
C st
aff w
hen
the
loca
l hos
pita
l did
not
ha
ve th
e ca
paci
ty
Villa
ge h
ealth
wor
kers
an
d di
seas
e pr
even
tion
unit
staff
in to
wns
hip
hosp
itals
in ru
ral a
reas
an
d di
seas
e pr
even
tion
unit
staff
in C
Hs i
n ur
ban
area
s col
lect
ed
info
rmat
ion
usin
g ho
useh
old
surv
eys;
the
info
rmat
ion
was
che
cked
with
ag
enci
es su
ch a
s the
lo
cal p
olic
e, th
e ci
vil
affai
rs d
epar
tmen
t an
d th
e m
ater
nal a
nd
child
dep
artm
ent a
nd
then
ent
ered
ont
o a
real
-tim
e, In
tern
et-
base
d sy
stem
; loc
al
CDC
staff
che
cked
the
info
rmat
ion
Cert
ifica
tes
wer
e co
mpl
eted
by
clin
ical
doc
tors
in
cha
rge
of
emer
genc
y tre
atm
ent o
r by
dise
ase
prev
entio
n un
it st
aff in
cha
rge
of h
ouse
hold
su
rvey
s or o
f ch
ecki
ng fi
eld
repo
rts
Codi
ng m
ostly
don
e by
lo
cal C
DC
staff
, but
also
by
staff
in h
ospi
tals’
dise
ase
prev
entio
n un
its, w
ith
loca
l CD
C st
aff c
heck
ing
the
info
rmat
ion;
ICD
-10
clas
sifica
tion
used
sinc
e 20
04
Mos
tly d
eter
min
ed b
y lo
cal
CDC
staff
, but
also
by
staff
in
hosp
itals’
dise
ase
prev
entio
n un
its, a
nd lo
cal C
DC
staff
ch
ecke
d th
e in
form
atio
n
CDC:
Cen
ter f
or D
iseas
e Co
ntro
l and
Pre
vent
ion;
CH:
com
mun
ity h
ospi
tal o
r com
mun
ity h
ealth
cen
tre o
r sta
tion;
ICD
-10:
Inte
rnat
iona
l sta
tistic
al cl
assifi
catio
n of
dise
ases
and
rela
ted
heal
th p
robl
ems,
10th
revi
sion.
a Exa
ct ti
me
cann
ot b
e gi
ven
since
this
was
a g
radu
al p
roce
ss a
nd d
iffer
ent s
ites h
ave
diffe
rent
star
ting
time
poin
ts.
Not
e: L
ocal
CD
C re
fers
to c
ount
y an
d di
stric
t lev
els.
(. . .continued)

Bull World Health Organ 2016;94:46–57| doi: http://dx.doi.org/10.2471/BLT.15.15314850
Policy & practiceMortality surveillance in China Shiwei Liu et al.
Fig.
1.
Sele
ctio
na of p
oint
s in
the
natio
nal m
orta
lity s
urve
illan
ce sy
stem
in e
ach
prov
ince
, Chi
na, 2
013
Mini
mum
surv
eillan
ce po
pulat
ion
in th
e pro
vince
dete
rmine
d
Coun
ties a
nd di
strict
s in t
he pr
ovinc
e div
ided i
nto e
ight s
trata
b
Cand
idate
surv
eillan
ce
point
s res
electe
d
Repr
esen
tativ
enes
s of s
electe
d su
rveil
lance
point
s re-
evalu
ated
Num
ber o
f sur
veilla
nce p
oints
requ
ired i
n the
prov
ince d
eter
mine
d
Not r
epre
sent
ative
of
the p
rovin
ce
Repr
esen
tativ
e of
the p
rovin
ce
Not r
epre
sent
ative
of
the p
rovin
ceRe
pres
enta
tive
of th
e pro
vince
Cand
idate
surv
eillan
ce po
ints i
n ea
ch st
ratu
m se
lecte
d
Repr
esen
tativ
enes
s of s
electe
d su
rveil
lance
point
s eva
luated
Surv
eillan
ce
point
s fina
lized
a An
iter
ativ
e pr
oces
s was
use
d to
det
erm
ine
whe
ther
the
popu
latio
n co
vere
d by
the
com
bina
tion
of
sele
cted
surv
eilla
nce
poin
ts in
a p
rovi
nce
was
repr
esen
tativ
e of
the
popu
latio
n of
the
who
le p
rovi
nce.
If
the
com
bina
tion
was
not
repr
esen
tativ
e of
the
who
le p
rovi
nce,
diff
eren
t poi
nts w
ere
sele
cted
with
in
each
stra
tum
unt
il it
was
repr
esen
tativ
e; h
owev
er, t
he n
umbe
r of p
oint
s in
each
stra
tum
was
not
ch
ange
d.b
Coun
ties a
nd d
istric
ts w
ere
divi
ded
into
eig
ht st
rata
acc
ordi
ng to
thei
r deg
ree
of u
rban
izat
ion,
po
pula
tion
size
and
crud
e m
orta
lity
rate
.
Tabl
e 3.
Su
rvei
llanc
e po
ints
in th
e na
tiona
l mor
talit
y sur
veill
ance
syst
em, C
hina
, 201
3
Prov
ince
No. o
f cou
ntie
s and
di
stric
tsa
No. o
f sur
veill
ance
poi
ntsb (%
of c
ount
ies
and
dist
ricts
)
Anhu
i10
524
(22.
9)Be
ijing
187
(38.
9)Ch
ongq
ing
4011
(27.
5)Fu
jian
8420
(23.
8)G
ansu
8720
(23.
0)Gu
angd
ong
123
28 (2
2.8)
Guan
gxi
110
21 (1
9.1)
Guiz
hou
8820
(22.
7)H
aina
n24
8 (3
3.3)
Heb
ei17
230
(17.
4)H
eilo
ngjia
ng13
227
(20.
5)H
enan
159
36 (2
2.6)
Hub
ei10
322
(21.
4)H
unan
122
28 (2
3.0)
Inne
r Mon
golia
101
20 (1
9.8)
Jiang
su10
627
(25.
5)Jia
ngxi
9920
(20.
2)Jil
in60
15 (2
5.0)
Liao
ning
100
22 (2
2.0)
Nin
gxia
2210
(45.
5)Q
ingh
ai46
10 (2
1.7)
Shaa
nxi
107
13 (1
2.1)
Shan
dong
140
31 (2
2.1)
Shan
ghai
187
(38.
9)Sh
anxi
119
20 (1
6.8)
Sich
uan
181
31 (1
7.1)
Tian
jin16
7 (4
3.8)
Tibe
t73
8 (1
1.0)
Xinj
iang
9815
(15.
3)Yu
nnan
129
25 (1
9.4)
Zhej
iang
9022
(24.
4)To
tal
2872
605
(21.
1)a T
he n
umbe
r of c
ount
ies a
nd d
istric
ts in
eac
h pr
ovin
ce w
as th
e sa
me
as th
e nu
mbe
r use
d in
the
2010
na
tiona
l cen
sus.11
b Eac
h su
rvei
llanc
e po
int c
over
ed a
n en
tire
coun
ty o
r dist
rict.
Bull World Health Organ 2016;94:46–57| doi: http://dx.doi.org/10.2471/BLT.15.153148 51
Policy & practiceMortality surveillance in ChinaShiwei Liu et al.
Fig. 2. Surveillance points, national mortality surveillance system, China, 2013
0 500 1000 1500 2000 km
N
Former 158 disease surveillance points447 national mortality surveillance pointsNot applicableNo data
Note: Dark green lines represent 447 counties with national mortality surveillance points; light green lines represent 158 counties which also have disease surveillance points. The map was produced using QGIS version 2.8.3 (QGIS Development Team).Source: Map data for China from the Natural Resources and Geospatial Base Information Database (National Development and Reform Commission, China). Map data for neighbouring countries from WHO.
Fig. 3. Urbanization, population size and mortality rate, China, 2013
–1.4 to –0.4–0.4 to –0.1–0.1 to 0.10.1 to 0.30.3 to 6.4Not applicableNo dataOther countries
U value
0 500 1000 1500 2000 km
N
Notes: The county or district representation was calculated as follows: first each U-value for the urbanization index, population size and mortality rate was obtained by using the equation U = (x−μ)/σ, where x is the observed value of the particular index in the country or district, μ is the mean value of the index in all counties and districts in the province and σ is the standard deviation. We then calculated the mean U-value for the three indices for each county or districts. The map was produced using QGIS version 2.8.3 (QGIS Development Team).Source: Map data for China from the Natural Resources and Geospatial Base Information Database (National Development and Reform Commission, China). Map data for neighbouring countries from WHO.

Bull World Health Organ 2016;94:46–57| doi: http://dx.doi.org/10.2471/BLT.15.15314852
Policy & practiceMortality surveillance in China Shiwei Liu et al.
of health-care staff and their ability to implement the new surveillance system. For example, the surveillance popula-tion chosen for Beijing was large because the city has a good infrastructure, a well-trained workforce and a large population. In contrast, the surveillance population in western provinces was smaller, partly because the local capacity and resources available for carrying out reliable mortality surveillance were lim-ited. Following detailed consideration of the average population of all counties and districts and after consultation with health authorities in each province, we determined that the national mortal-ity surveillance system required a total of 605 surveillance points – the 605 counties and districts covered by these points comprised 21.1% of all counties and districts in China (Table 3; Fig. 2).
Stratification
In the previous two adjustments to the disease surveillance points system in 1990 and 2004, urban areas (i.e. dis-tricts) and rural areas (i.e. counties and county-level cities) were used as the primary units for stratification and the urban-to-rural population ratio was also taken into account.3–5 However, with the rapid socioeconomic development of the last decades, this ratio is no longer ap-propriate for defining a county or coun-ty-level city as a rural area or a district as an urban area. In addition, per-capita gross domestic product (GDP) was used only in the further stratification of rural
areas because there was a lack of data on how urban per capita GDP varied by district.3–5 Given the incompleteness of these data and the potential positive correlation between urbanization and per capita GDP, we decided to use the urbanization index (i.e. the fraction of the population residing in an urban area) as a stratifying index instead of the urban-to-rural population distri-bution or per-capita GDP. Following consultations with experts, population size was retained as an important strati-fying index in the selection of surveil-lance points for the National Mortality Surveillance System, as was the crude mortality rate. These three stratifying indices were used as descriptors for each surveillance point and were calculated for each province. To obtain a graphi-cal illustration of the characteristics in each county or district based on the three stratification indices, we first cal-culated the representation (U) for each index as follows: U = (x−μ)/σ, where x is the observed value of the particular index in the country or district, μ is the mean value of the index in all counties and districts in the province and σ is the standard deviation. We then calculated the mean U-value for the three indices for each county or district (Fig. 3).
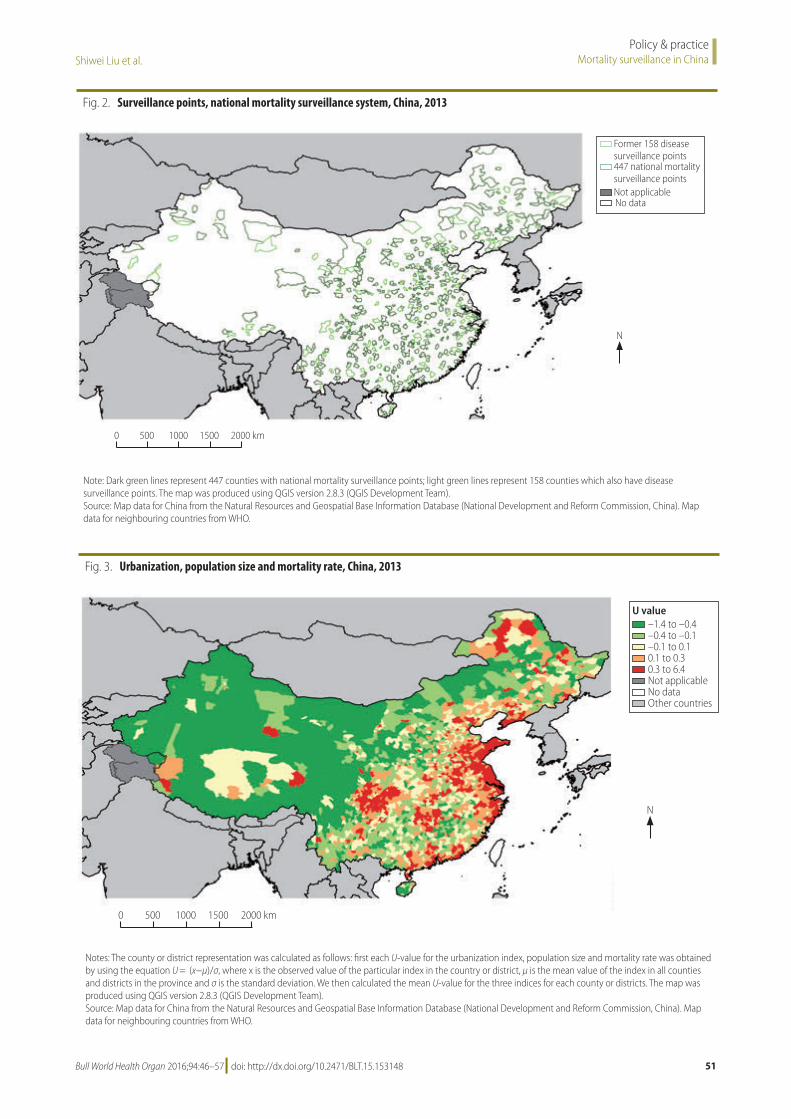
The multistage stratification pro-cess included three steps: (i) counties and districts in each province were divided into two strata based on the median urbanization index for each province (i.e. high or low urbanization);
(ii) counties and districts with a high or low urbanization index were further subdivided into two strata according to the median population size in each of the two urbanization strata in each province (i.e. high or low population size); and (iii) counties and districts in these four strata (i.e. two urbanization strata × two population-size strata) were subdivided into two further strata using the median total mortality rate in each of these four strata in each province. This process yielded eight strata in each province (Fig. 4) and a total of 248 strata (i.e. 8 × 31 provinces) across the whole country.
Ensuring representativeness
After stratification, counties and dis-tricts in each province were selected as surveillance points using inclusion criteria and principles developed in consultation with health administrators and disease surveillance experts. First, the number of selected counties and dis-tricts in each stratum of each province should be approximately n/8, where n is the number of counties and districts in each province included in the new surveillance points system (Table 3). Second, the existing 161 surveillance points in the current disease surveil-lance points system were considered as a priority for inclusion in the national mortality surveillance system. Then, other counties and districts with experi-ence in mortality surveillance were also considered for inclusion, as far as pos-sible. The vital registration system sites were given a lower priority during the selection process than disease surveil-lance points system sites because the vital registration system did not provide continuous, longitudinal, mortality data and the sites did not all have the same quality control measures in place. In addition, counties and districts in which local staff expressed a strong desire to participate and where there was demon-strable local government support were also considered. Finally, the counties and districts selected had to be evenly distributed across different geographi-cal areas with different characteristics and all prefecture-level cities had to be included.
At each stage of the selection pro-cess, candidate surveillance points were evaluated to determine how representa-tive they were of each province. Reselec-tion and re-evaluation were repeated until the final population sample was
Fig. 4. Stratificationa of counties and districts in each province for the development of the national mortality surveillance system, China
All counties and districts in a province
Urbanization(High)
Population(High)
Population(High)
Mortality(High)
Mortality(High)
Mortality(High)
Mortality(High)
Mortality(Low)
Mortality(Low)
Mortality(Low)
Mortality(Low)
Population(Low)
Population(Low)
Urbanization(Low)
a Counties and districts were divided sequentially into high and low categories according to their urbanization index, population size and mortality rate (see main text for details).

Bull World Health Organ 2016;94:46–57| doi: http://dx.doi.org/10.2471/BLT.15.153148 53
Policy & practiceMortality surveillance in ChinaShiwei Liu et al.
considered sufficiently representative of the province. We employed an iterative process to ensure the representativeness of the candidate surveillance points (Fig. 1). First, the parameters used to evaluate representativeness were similar to those used in the two previous adjust-ments to the Disease Surveillance Points system:8,9 (i) the urbanization index; (ii)the ratio of the size of the population aged 65 years or more to the size of the total population; (iii)the ratio of the size of the population younger than 15 years to the size of the total population; and (iv) the crude mortality rate. Second, there had to be no significant difference between the value of a given parameter in the sample population and the cor-responding value for the whole province, as indicated by a statistical test with the threshold of an α-level greater than 0.05. For variables that met the conditions for parametric tests, t tests were performed on log-transformed variables; other-wise, non-parametric tests were used. Although we aimed to select a similar number of counties or districts in each stratum of each province, this was not always possible. Because of the inclusion criteria and the variation in population size between counties and districts, inevitably the counties and districts in a province did not all have the same probability of being selected. Conse-quently, during the statistical evaluation of representativeness, we weighted each selected county and district according to its population.12–14
Final surveillance points
After several rounds of representative-ness evaluation and adjustment, we found that there was no significant difference in parameter values between the counties and districts chosen as surveillance points in each province and the entire province for all provinces in the national mortality surveillance system (Table 4). In total, 605 surveil-lance points were selected across China (Fig. 2): the number of counties and districts selected in each province varied from 7 to 36. Three of the 161 former sites in the disease surveillance points system were excluded because of poor data quality and limited local government support and capacity. Of the existing 319 vital registration system sites, 113 were retained in the national mortality surveillance system.
In 2013, the national mortality surveillance system covered 323.8 mil-
lion people. At the provincial level, the sample population ranged from 753 557 in Tibet to 25 919 659 in Guangdong. In five provinces (Hainan, Ningxia, Qinghai, Tibet and Xinjiang), the surveillance population was less than 5 million. The population covered by the surveillance points as a proportion of the total population in each province ranged from 14.5% in Shaanxi to 54.2% in Ningxia; it was over 20% in each of
the five provinces with a surveillance population less than 5 million (Table 5).
In 2014, the budget allocated by central government to run the national mortality surveillance system included two types of cost: (i) the cost of basic death registration procedures (i.e. col-lection, registration, reporting, quality control, supervision and training – 6444 United States dollars, US$, per surveil-lance point) and of periodic surveys of
Table 4. Representativenessa of points in the national mortality surveillance system, by province, China, 2013
Province Pb
Urbanization indexc
Ratio ≥ 65 yearsd
Ratio < 15 yearse
Mortality ratef
Anhui 0.69 0.17 0.35 0.36Beijing 0.64 0.50 0.45 0.30Chongqing 0.29 0.67 0.17 0.63Fujian 0.52 0.88 0.42 0.75Gansu 0.06 0.77 0.17 g 0.31Guangdong 0.83 0.94 0.21 0.41Guangxi 0.42 0.80 0.55 0.44Guizhou 0.23 0.69 0.39 0.43Hainan 0.88 0.58 0.08 g 0.74Hebei 0.32 0.21 0.32 0.62Heilongjiang 0.60 0.99 0.38 0.34Henan 0.06 0.21 0.40 0.80Hubei 0.72 0.66 0.19 0.43Hunan 0.79 0.78 0.43 0.69Inner Mongolia 0.29 0.17 0.13 0.70Jiangsu 0.32 0.23 0.24 0.06Jiangxi 0.67 g 0.27 0.07 g 0.55Jilin 0.59 0.80 0.67 0.52Liaoning 0.11 0.83 0.93 0.26 g
Ningxia 0.86 0.96 0.94 0.29Qinghai 0.35 0.35 0.14 0.64Shaanxi 0.32 0.78 0.46 0.62Shandong 0.38 0.56 0.07 0.70Shanghai 0.13 0.21 0.70 0.63Shanxi 0.46 0.49 0.86 0.17Sichuan 0.18 0.73 0.11 0.62Tianjin 0.29 0.16 0.99 0.18Tibet 0.10 0.15 g 0.15 g 0.11Xinjiang 0.26 0.84 0.50 0.84Yunnan 0.91 0.88 0.08 0.11Zhejiang 1.00 0.65 0.45 0.13
a Whether or not the population covered by the selected surveillance points in a province was representative of the population of the whole province was determined using the four parameters listed in the table.
b We used either t-test or the Wilcoxon signed-rank test to calculate if there was significant difference between the parameter value across the surveillance points in a province and the corresponding value for the whole province.
c Represents the fraction of the population residing in an urban area. d Ratio of the population aged 65 years or more to the total population. e Ratio of the population younger than 15 years to the total population. f Total number of deaths per 1000 people per year.g A non-parametric test was performed for this parameter.

Bull World Health Organ 2016;94:46–57| doi: http://dx.doi.org/10.2471/BLT.15.15314854
Policy & practiceMortality surveillance in China Shiwei Liu et al.
death underreporting (US$ 4833 per surveillance point); and (ii) the cost of work that varied with the estimated number of deaths, such as the printing, distribution and storage of registration cards (US$ 0.97 per death), the manage-ment and analysis of cause-of-death data (US$ 0.25 per death) and interdepart-mental comparison and verification of data (US$ 0.25 per death).
DiscussionIn China, the ultimate aim is to establish a comprehensive vital registration and mortality surveillance system. However, in the interim, a sample-based mortality surveillance system15 is the only viable option for generating valid and reliable information on total and cause-specific mortality in the country. The establish-ment of the national mortality surveil-lance system with 605 surveillance points covering almost one quarter of the Chinese population is a highly sig-nificant step towards the goal of achiev-ing the vital registration of all births and deaths across the country by 2020.
Perhaps the greatest advantage of the new system is that it will yield annual data on death rates and the causes of death for all provinces. The inclusion of most of the existing disease surveillance points system surveillance points in the new system ensures the continuity of mortality data from these points without affecting the national or regional rep-resentativeness of the data overall. The national mortality surveillance system is now the only mortality surveillance system in China covering all causes of death in people of all ages. Data from the 605 surveillance points will be reported at the time of death registration to the national CDC,7 which is responsible for the operation and maintenance of the in-formation system. The National Health and Family Planning Commission is responsible for overall project manage-ment, policy-making and information dissemination.
One of the main objectives of the national mortality surveillance system is to reliably monitor specific causes of death at both national and provincial levels. Over the long term, surveillance data will become increasingly impor-tant for describing changes in mortality, for identifying emerging health-care priorities and for informing health policy development. Although know-ing the extent to which the surveillance
system reflects mortality patterns is useful for interpreting data, represen-tativeness should not be the only factor considered when constructing a system and should not be overemphasized at the expense of practicality. Many lead-ing epidemiologists have argued that representativeness is not imperative, especially when investigating causal inference or examining associations between diseases and their component causes.16–18 Our view is that building capacity and quality control should be the main priorities in implementing the new surveillance system in addition to ensuring representativeness.
The completeness of death registra-tion and accurate coding of the cause of death and of identification of the under-lying cause of death are key issues for any
mortality surveillance system. Previous surveys of the disease surveillance points system found underreporting of 12 to 17% – the proportion was even higher among children younger than five years and in rural areas.3,19,20 More-over, in 2012, a report indicated that 2.73% of causes of death in China were coded inaccurately.21 One of the main challenges for the new system is the high proportion of deaths occurring outside hospital. Traditional burial customs, including the desire to return to one’s place of original residence before death, mean that approximately 70% of deaths in rural areas (as much as 90% in some places) occur at home and medical re-cords are limited or nonexistent. Second, staff at most new surveillance points lack relevant experience, especially
Table 5. National mortality surveillance system surveillance population, by province, China, 2010
Province Total populationa Surveillance populationa
Proportion of total population (%)
Anhui 59 500 468 14 580 012 24.5Beijing 19 612 368 6 605 681 33.7Chongqing 28 846 170 8 167 594 28.3Fujian 36 894 217 10 146 129 27.5Gansu 25 575 263 7 803 139 30.5Guangdong 104 320 459 25 919 659 24.8Guangxi 46 023 761 9 025 031 19.6Guizhou 34 748 556 8 997 602 25.9Hainan 8 671 485 3 097 131 35.7Hebei 71 854 210 13 896 574 19.3Heilongjiang 38 313 991 10 069 900 26.3Henan 94 029 939 21 785 954 23.2Hubei 57 237 727 12 513 533 21.9Hunan 65 700 762 17 661 802 26.9Inner Mongolia 24 706 291 5 840 040 23.6Jiangsu 78 660 941 22 084 484 28.1Jiangxi 44 567 797 8 141 229 18.3Jilin 27 452 815 7 044 428 25.7Liaoning 43 746 323 10 729 378 24.5Ningxia 6 301 350 3 417 327 54.2Qinghai 5 626 723 1 649 165 29.3Shaanxi 37 327 379 5 424 499 14.5Shandong 95 792 719 23 067 010 24.1Shanghai 23 019 196 8 055 902 35.0Shanxi 35 712 101 7 222 517 20.2Sichuan 80 417 528 18 066 478 22.5Tianjin 12 938 693 5 548 441 42.9Tibet 3 002 165 753 557 25.1Xinjiang 21 815 815 4 532 804 20.8Yunnan 45 966 766 9 269 827 20.2Zhejiang 54 426 891 12 656 460 23.3Total 1 332 810 869 323 773 287 24.3
a Population data are from the 2010 national census.11

Bull World Health Organ 2016;94:46–57| doi: http://dx.doi.org/10.2471/BLT.15.153148 55
Policy & practiceMortality surveillance in ChinaShiwei Liu et al.
with standardized workflow procedures and mechanisms for interdepartmental collaboration. Third, it may be difficult to recruit enough professional health workers, particularly at the local level. Fourth, there is an enormous difference in local capacity between the provinces due to large variations in economic development. To meet these challenges the integration and application of new automated methods for collecting infor-mation on the cause of death identified by verbal autopsy should be a prior-ity.22,23 Also, uniform training materials should be used by national and pro-vincial trainers to strengthen training; supervision and information-sharing should be enhanced and additional technical and financial support should be offered to underdeveloped provinces when necessary. In 2014, central govern-ment agencies, including the National
Health and Family Planning Commis-sion, the Ministry of Public Security and the Ministry of Civil Affairs, issued an updated official document aimed at strengthening death registration. How-ever, appropriate legislation to ensure all deaths are registered and properly certified is also essential.
Reliable information on mortal-ity and the cause of death is essential for the development of national and international health policy and of pro-grammes for preventing and controlling disease and preventing injury. Data from the disease surveillance points and vital registration systems have been extensively used to assess the burden of disease both regionally and nationally in China and globally9,10,24–26 as well as for other research purposes.27–29 For the future, there are plans to use the national mortality surveillance system
sample populations to carry out periodic national surveys of chronic disease, nu-trition and injury. Electronic linkage of data is becoming easier in China and it may soon be possible to convert these periodic surveys into prospective cohort studies. The national mortality surveil-lance system will not only play a unique and critical role in providing health metrics for China but will also serve as an essential resource for evaluating health-care policy at provincial, national and international levels, particularly for the prevention and control of chronic diseases. ■
AcknowledgementsThe authors thank staff at the 31 pro-vincial Centers for Disease Control and Prevention.
Competing interests: None declared.
ملخصنظام مراقبة الوفيات الوطني املتكامل لتسجيل ومراقبة الوفيات بالصني
العينات، إىل املستندة الوفيات مراقبة أنظمة استخدام تم لقد ملكافحة الصيني للمركز التابع األمراض مراقبة نقاط نظام مثل بوزارة اخلاصة املدنية السجالت ونظام منها، والوقاية األمراض الصحة هناك، لعدة قرون لتوفري بيانات متثيلية وطنية حول احلالة الصحية ألغراض اختاذ القرارات املتعلقة بالرعاية الصحية، وتقييم حول متثيلية بيانات يقدم مل األنظمة هذه من أيًا أن إال األداء. املقاطعات حتى يوضح أو أسباب حدوثها عىل مستوى الوفيات احتياجات اخلدمة الصحية اإلقليمية وأولويات السياسة. وعالوة عىل ذلك، حدث تداخل بني األنظمة إىل درجة ملموسة، مما يؤدي 2013 عام يف الصينية احلكومة وقامت اجلهود. ملضاعفة بدوره بدمج هذين النظامني يف نظام وطني واحد متكامل ملراقبة الوفيات، هبدف تقديم صورة متثيلية للوفيات بشكل عام وألسباب الوفيات عىل مستوى املقاطعات، وللتعجيل بتطوير سجالت مدنية شاملة
أدى هذا الدولة. وقد أنحاء للوفيات جلميع مراقبة شامل ونظام السكانية الرشحية من 6% من املراقبة اجلديد التساع مدى النظام إىل %24. وقد زاد عدد نقاط املراقبة، والتي تغطي كل منها منطقة أو مقاطعة، من 161 إىل 605 نقطة. وللتحقق من مصداقية متثيل نقطة 605 الـ اختيار تم فقد املقاطعات، مستوى عىل البيانات طريقة باستخدام الصني، يف مقاطعة 31 تغطي بحيث مراقبة احلسبان يف وتضع املراحل، متعدد تصنيف عىل تنطوي تكرارية الورقة هذه ترشح للسكان. الديموغرافية االجتامعية اخلصائص اجلديد، الوطني الوفيات مراقبة نظام وتشغيل تطوير كيفية والذي من املتوقع أن يقدم تقديرات متثيلية للوفيات عىل مستوى
املقاطعات ألول مرة يف الصني.
摘要适用于中国死亡登记和死亡率监测的全国死亡监测综合系统在中国 ,基于样本的死亡率监测系统 ,如中国疾病预防控制中心的疾病监测点系统和卫生部的生命登记系统,几十年一直用于提供有关健康状态的全国代表性数据,以进行准确的医疗保健决策和绩效评估。然而 , 这两个系统都无法在死亡率和死因方面提供省级代表性数据 , 以告知地区卫生服务需求和政策优先事项。此外 ,这两个系统在相当大的程度上互相重叠 , 因此导致重复劳动。2013 年 , 中国政府将这两个系统纳入全国死亡率监测综合系统 , 在总体死亡率和死因特定死亡率方面提供省级代表性现象 , 并加速全国生命登记和死
亡率监测综合系统的发展。这个新系统将监测人口从中国总人口的 6% 提升至 24%。涵盖区或县的各监控点数量从 161 个增至 605 个。为了确保省级的代表性 ,使用迭代法 , 其中包括基于人口社会人口学特征的多层分级法 , 选择 605 个监控点 , 覆盖中国 31 个省。本文介绍了全国新型死亡率监测系统的形成和运行 , 预计将首次得出中国死亡率的省级代表性估计值。

Bull World Health Organ 2016;94:46–57| doi: http://dx.doi.org/10.2471/BLT.15.15314856
Policy & practiceMortality surveillance in China Shiwei Liu et al.
Résumé
Chine: un nouveau système national intégré pour l’enregistrement des décès et la surveillance de la mortalitéEn Chine, des systèmes de surveillance de la mortalité fondés sur des échantillons (comme le système à points de surveillance des maladies du Centre chinois pour le contrôle et la prévention des maladies et le système d’enregistrement des données d’état civil du ministère de la Santé) sont utilisés depuis plusieurs dizaines d’années pour obtenir des données représentatives à l’échelle nationale de la situation sanitaire, en vue d’éclairer les processus décisionnels en matière de santé et d’évaluer les résultats. Or, aucun de ces systèmes traditionnellement utilisés ne proposait de données représentatives sur la mortalité et les causes de décès à l’échelle provinciale, pourtant nécessaires pour correctement définir les priorités et les besoins régionaux en matière de politiques de santé. Par ailleurs, ces systèmes étaient largement redondants entre eux, ce qui impliquait donc une duplication inutile des efforts. En 2013, le gouvernement chinois a fusionné ces deux systèmes dans un système national intégré de surveillance de la mortalité afin d’obtenir une image représentative à l’échelle provinciale de la mortalité totale
et de la mortalité par cause et d’accélérer la création d’un système exhaustif d’enregistrement des données d’état civil et de surveillance de la mortalité pour tout le pays. Ce nouveau système a permis d’augmenter la couverture de la surveillance (de 6% de la population chinoise couverte auparavant à 24%). Le nombre de points de surveillance (chacun couvrant un district ou un comté) est passé de 161 à 605. Pour garantir une bonne représentativité à l’échelle provinciale, les 605 points de surveillance ont été sélectionnés de manière à couvrir les 31 provinces chinoises à l’aide d’une méthode itérative impliquant une stratification à plusieurs degrés qui a tenu compte des caractéristiques sociodémographiques de la population. Cet article décrit l’élaboration et le fonctionnement de ce nouveau système national de surveillance de la mortalité, qui devrait permettre d’obtenir pour la première fois des estimations représentatives à l’échelle provinciale de la mortalité en Chine.
Резюме
Единая национальная система контроля за смертностью для регистрации случаев смерти и контроля за смертностью, КитайВ Китае системы выборочного контроля за смертностью, такие как система пунктов контроля заболеваний Китайского центра по профилактике болезней и борьбе с ними и система регистрации естественного движения населения Министерства здравоохранения, используются на протяжении десятилетий для получения национально-репрезентативных данных о состоянии здоровья, на основе которых принимаются решения и оцениваются результаты в сфере здравоохранения. Однако ни одна из этих систем не позволяла получить репрезентативные данные о смертности и причине смерти на уровне провинций, которые позволили бы определить потребности и приоритеты политики региональных служб здравоохранения. Кроме того, сферы деятельности двух систем во многом пересекались, вследствие чего происходило дублирование работы. В 2013 году Правительство Китая объединило эти две системы в единую национальную систему контроля за смертностью для получения репрезентативной картины общей смертности с
распределением по провинциям и смертности с разбивкой по причинам смерти. Это было сделано также для ускорения разработки всеобъемлющей системы регистрации естественного движения населения и контроля за смертностью для всей страны. Благодаря этой новой системе количество жителей, входящих в сферу контроля, увеличилось с 6 до 24% от всего населения Китая. Количество пунктов контроля, каждый из которых привязан к округу или району, было увеличено с 161 до 605. В целях обеспечения репрезентативности на уровне провинций 605 пунктов контроля были отобраны для курирования 31 провинции Китая с помощью метода итерации, включающего многоэтапную стратификацию, которая учитывала социально-демографические особенности населения. В данной статье описывается развитие и работа новой национальной системы контроля за смертностью, которая, как ожидается, впервые позволит осуществить репрезентативную оценку смертности в Китае на уровне провинций.
Resumen
Un sistema nacional integrado de vigilancia de la mortalidad para el registro de defunciones y la vigilancia de la mortalidad en ChinaEn China, los sistemas de vigilancia de la mortalidad basados en muestras, tales como el sistema de puntos de vigilancia de las enfermedades del Centro de Prevención y Control de Enfermedades de China y el sistema de registro civil del Ministerio de Salud, se han utilizado durante décadas para proporcionar datos nacionalmente representativos del estado de salud para tomar decisiones médicas y evaluaciones de rendimiento. Sin embargo, ningún sistema ofrecía datos representativos en cuanto a defunciones y las causas de las defunciones a un nivel provincial con el objetivo de informar de las necesidades de servicios sanitarios regionales y las prioridades de la política. Asimismo, los sistemas se solapaban hasta un punto considerable, lo que suponía una duplicación de los esfuerzos. En 2013, el gobierno chino combinó estos dos sistemas en un sistema nacional integrado de vigilancia de la mortalidad para proporcionar una imagen provincialmente representativa de la mortalidad total y de la mortalidad por causas específicas y para acelerar el desarrollo de un registro civil completo y un sistema de vigilancia de la mortalidad para
todo el país. Este nuevo sistema aumentó la población de vigilancia de un 6 a un 24% de la población china. El número de puntos de vigilancia, donde cada uno cubría un distrito o condado, subió de 161 a 605. Con el objetivo de garantizar una representación a nivel provincial, los 605 puntos de vigilancia se seleccionaron para cubrir las 31 provincias de China mediante la utilización de un método iterativo que consistía en una estratificación de etapas múltiples que tenía en cuenta las características sociodemográficas de la población. Este artículo describe el desarrollo y funcionamiento del nuevo sistema nacional de vigilancia de la mortalidad, el cual se espera que aumente las estimaciones provinciales representativas de mortalidad en China por primera vez.

Bull World Health Organ 2016;94:46–57| doi: http://dx.doi.org/10.2471/BLT.15.153148 57
Policy & practiceMortality surveillance in ChinaShiwei Liu et al.
References1. Ruzicka LT, Lopez AD. The use of cause-of-death statistics for health
situation assessment: national and international experiences. World Health Stat Q. 1990;43(4):249–58. PMID: 2293493
2. Strengthening civil registration and vital statistics for births, deaths and causes of death: resource kit. Geneva: World Health Organization; 2012.
3. Yang G, Hu J, Rao KQ, Ma J, Rao C, Lopez AD. Mortality registration and surveillance in China: history, current situation and challenges. Popul Health Metr. 2005 Mar 16;3(1):3. doi: http://dx.doi.org/10.1186/1478-7954-3-3 PMID: 15769298
4. Yang G. [Selection of DSP points in second stage and their presentation]. Zhonghua Liu Xing Bing Xue Za Zhi. 1992 Aug;13(4):197–201. Chinese. PMID: 1301261
5. Zhou M, Jiang Y, Huang Z, Wu F. [Adjustment and representativeness evaluation of national disease surveillance points system.] Disease Surveillance. 2010;25(3):239–44. Chinese.
6. International statistical classification of diseases and related health problems, 10th revision. Geneva: World Health Organization; 1992.
7. Wang L, Wang Y, Jin S, Wu Z, Chin DP, Koplan JP, et al. Emergence and control of infectious diseases in China. Lancet. 2008 Nov 1;372(9649):1598–605. doi: http://dx.doi.org/10.1016/S0140-6736(08)61365-3 PMID: 18930534
8. Rao C, Lopez AD, Yang G, Begg S, Ma J. Evaluating national cause-of-death statistics: principles and application to the case of China. Bull World Health Organ. 2005 Aug;83(8):618–25. PMID: 16184281
9. Murray CJL, Lopez AD. The global burden of disease: a comprehensive assessment of mortality and disability from diseases, injuries, and risk factors in 1990 and projected to 2020. Geneva: World Health Organization; 1996.
10. Lopez AD, Mathers CD, Ezzati M, Murray CJL, Jamison DT, editors. Global burden of disease and risk factors. New York: Oxford University Press; 2006. doi: http://dx.doi.org/10.1596/978-0-8213-6262-4
11. National data. Beijing: National Bureau of Statistics of China; 2015. Available from: http://data.stats.gov.cn/english/easyquery.htm?cn=C01 [cited 2015 Sep 28].
12. Hu N, Jiang Y, Li Y, Chen Y. [Weighting method for Chinese chronic disease surveillance in 2010.] Zhongguo wei sheng tong ji. 2012;29(3):424–6. Chinese.
13. Hou XY, Wei YY, Chen F. [Weighted estimation methods for multistage sampling survey data]. Zhonghua Liu Xing Bing Xue Za Zhi. 2009 Jun;30(6):633–6. Chinese. PMID: 19957636
14. Pfeffermann D, Skinner CJ, Holmes DJ, Goldstein H, Rasbash J. Weighting for unequal selection probabilities in multilevel models. J R Stat Soc Ser A Stat Soc. 1998;60(1):23–40. doi: http://dx.doi.org/10.1111/1467-9868.00106
15. Begg S, Rao C, Lopez AD. Design options for sample-based mortality surveillance. Int J Epidemiol. 2005 Oct;34(5):1080–7. doi: http://dx.doi.org/10.1093/ije/dyi101 PMID: 15911547
16. Rothman KJ, Gallacher JE, Hatch EE. Why representativeness should be avoided. Int J Epidemiol. 2013 Aug;42(4):1012–4. doi: http://dx.doi.org/10.1093/ije/dys223 PMID: 24062287
17. Nohr EA, Olsen J. Commentary: Epidemiologists have debated representativeness for more than 40 years–has the time come to move on? Int J Epidemiol. 2013 Aug;42(4):1016–7. doi: http://dx.doi.org/10.1093/ije/dyt102 PMID: 24062289
18. Richiardi L, Pizzi C, Pearce N. Commentary: Representativeness is usually not necessary and often should be avoided. Int J Epidemiol. 2013 Aug;42(4):1018–22. doi: http://dx.doi.org/10.1093/ije/dyt103 PMID: 24062290
19. Wang L, Wang LJ, Cai Y, Ma LM, Zhou MG. [Analysis of under-reporting of mortality surveillance from 2006 to 2008 in China]. Zhonghua Yu Fang Yi Xue Za Zhi. 2011 Dec;45(12):1061–4. Chinese. PMID: 22336336
20. Guo K, Yin P, Wang L, Ji Y, Li Q, Bishai D, et al. Propensity score weighting for addressing under-reporting in mortality surveillance: a proof-of-concept study using the nationally representative mortality data in China. Popul Health Metr. 2015;13(1):16. doi: http://dx.doi.org/10.1186/s12963-015-0051-3 PMID: 26161042
21. Report of cause-of-death surveillance in China 2012. Beijing: Chinese Center for Disease Control and Prevention; 2013.
22. Rao C, Lopez AD, Yang G, Begg S, Ma J. Evaluating national cause-of-death statistics: principles and application to the case of China. Bull World Health Organ. 2005 Aug;83(8):618–25. PMID: 16184281
23. Murray CJL, Lozano R, Flaxman AD, Serina P, Phillips D, Stewart A, et al. Using verbal autopsy to measure causes of death: the comparative performance of existing methods. BMC Med. 2014;12(1):5. doi: http://dx.doi.org/10.1186/1741-7015-12-5 PMID: 24405531
24. Yang G, Wang Y, Zeng Y, Gao GF, Liang X, Zhou M, et al. Rapid health transition in China, 1990–2010: findings from the Global Burden of Disease Study 2010. Lancet. 2013 Jun 8;381(9882):1987–2015. doi: http://dx.doi.org/10.1016/S0140-6736(13)61097-1 PMID: 23746901
25. Wang H, Dwyer-Lindgren L, Lofgren KT, Rajaratnam JK, Marcus JR, Levin-Rector A, et al. Age-specific and sex-specific mortality in 187 countries, 1970–2010: a systematic analysis for the Global Burden of Disease Study 2010. Lancet. 2012 Dec 15;380(9859):2071–94. doi: http://dx.doi.org/10.1016/S0140-6736(12)61719-X PMID: 23245603
26. Lozano R, Naghavi M, Foreman K, Lim S, Shibuya K, Aboyans V, et al. Global and regional mortality from 235 causes of death for 20 age groups in 1990 and 2010: a systematic analysis for the Global Burden of Disease Study 2010. Lancet. 2012 Dec 15;380(9859):2095–128. doi: http://dx.doi.org/10.1016/S0140-6736(12)61728-0 PMID: 23245604
27. Chen Y, Ebenstein A, Greenstone M, Li H. Evidence on the impact of sustained exposure to air pollution on life expectancy from China’s Huai River policy. Proc Natl Acad Sci USA. 2013 Aug 6;110(32):12936–41. doi: http://dx.doi.org/10.1073/pnas.1300018110 PMID: 23836630
28. Zhou M, Liu Y, Wang L, Kuang X, Xu X, Kan H. Particulate air pollution and mortality in a cohort of Chinese men. Environ Pollut. 2014 Mar;186:1–6. doi: http://dx.doi.org/10.1016/j.envpol.2013.11.010 PMID: 24333659
29. Xu G, Sui X, Liu S, Liu J, Liu J, Li Y, et al. Effects of insufficient physical activity on mortality and life expectancy in Jiangxi province of China, 2007–2010. PLoS ONE. 2014;9(10):e109826. doi: http://dx.doi.org/10.1371/journal.pone.0109826 PMID: 25314595