An Integrated Modeling Approach for Characterizing ... SPE... · fractured Topopah Spring welded...
10
Copyright 2007, Society of Petroleum Engineers This paper was prepared for presentation at the SPE Europec/EAGE Annual Conference and Exhibition held in London, United Kingdom, 11–14 June 2007. This paper was selected for presentation by an SPE Program Committee following review of information contained in an abstract submitted by the author(s). Contents of the paper, as presented, have not been reviewed by the Society of Petroleum Engineers and are subject to correction by the author(s). The material, as presented, does not necessarily reflect any position of the Society of Petroleum Engineers, its officers, or members. Papers presented at SPE meetings are subject to publication review by Editorial Committees of the Society of Petroleum Engineers. Electronic reproduction, distribution, or storage of any part of this paper for commercial purposes without the written consent of the Society of Petroleum Engineers is prohibited. Permission to reproduce in print is restricted to an abstract of not more than 300 words; illustrations may not be copied. The abstract must contain conspicuous acknowledgment of where and by whom the paper was presented. Write Librarian, SPE, P.O. Box 833836, Richardson, Texas 75083-3836 U.S.A., fax 01-972-952-9435. Abstract Even with the significant progress made in modeling flow and transport in fractured rock in the last few decades, characterizing fractured reservoirs remains a great challenge. This is because of the inherent complexity within actual fractured reservoirs, from multiphase flow and transport to the spatial variability of the fracture network. To investigate coupled processes of fluid and heat flow and chemical isotopic transport in the highly heterogeneous, unsaturated fractured tuff of Yucca Mountain (a proposed underground repository site for storing U.S. high-level radioactive waste), we present an integrated modeling methodology. The proposed modeling approach integrates a wide variety of moisture, pneumatic, thermal, and geochemical isotopic field data into a comprehensive three-dimensional numerical model for modeling analyses. In particular, the results of this evaluation indicate that moisture data, such as water potential and liquid saturation in the rock matrix, are not sufficient to determine in situ percolation flux, whereas temperature and geochemical isotopic data provide better constraints to net infiltration rates and flow patterns. In addition, pneumatic data are found to be extremely valuable in estimating large-scale fracture permeability. The integration of hydrologic, pneumatic, temperature, and geochemical data into modeling analyses is thereby demonstrated to provide a practical modeling approach for characterizing flow and transport processes in complex fractured reservoirs. Introduction The unsaturated zone (UZ) of the highly heterogeneous, fractured tuff at Yucca Mountain, Nevada, U.S.A, has been investigated as a possible repository site for storing high-level radioactive waste since the 1980s. Characterization of flow and transport processes in the fractured rock of the Yucca Mountain UZ has received significant attention and has made significant progress over the last two decades. During the same period of extensive studies, many types of data have been collected from the Yucca Mountain UZ, and these data have helped in developing a conceptual understanding of various physical processes within the UZ system. Even with the progress made so far in data analysis and flow and transport modeling in fractured rock, characterizing fractured reservoirs remains a great challenge, because of the inherent complexity within heterogeneous fractured reservoirs, from multiphase flow and transport to the spatial variability of the fracture network. In this work, we present an integrated modeling methodology of calibrating a UZ flow model for characterizing percolation flux in unsaturated fractured rock. Such integration of multiple processes provides a better understanding of percolation patterns and flow behavior within the Yucca Mountain UZ under different climates and hydrogeological conceptualizations of UZ flow. First, we discuss how to integrate different field-observed data, such as water potential, liquid saturation, perched water, gas pressure, chloride, and temperature logs, into a single 3-D UZ flow and transport model. The combined model calibration will provide a consistent cross-check or verification of modeled percolation fluxes, as well as better insight into UZ flow patterns. Second, we show that this integrated modeling effort provides consistent model predictions for different but interrelated hydrological, pneumatic, geochemical, and geothermal processes in the UZ. As a result, such an integrated approach will generally improve the capability and credibility of numerical models in characterizing flow and transport processes in unsaturated fractured formations. This paper represents our continuing effort in developing and applying the UZ flow and transport models to characterizing the UZ system of Yucca Mountain. Specifically, this modeling study consists of (1) a brief UZ model description and (2) model calibration. Hydrogeology and Conceptual Model The domain of the UZ model encompasses approximately 40 km 2 of the Yucca Mountain area, as shown in Figure 1. The UZ is between 500 and 700 m thick and overlies a relatively flat water table. The repository would be located in the highly fractured Topopah Spring welded tuff unit, more than 200 m above the water table. Geologically, Yucca Mountain is a structurally complex system of Tertiary volcanic rock. SPE 106996 An Integrated Modeling Approach for Characterizing Multiphase Flow, Chemical Transport, and Heat Transfer in Fractured Reservoirs Yu-Shu Wu, SPE, Guoping Lu, Keni Zhang, and G.S. Bodvarsson, Lawrence Berkeley Natl. Laboratory
Transcript of An Integrated Modeling Approach for Characterizing ... SPE... · fractured Topopah Spring welded...

Copyright 2007, Society of Petroleum Engineers This paper was prepared for presentation at the SPE Europec/EAGE Annual Conference and Exhibition held in London, United Kingdom, 11–14 June 2007. This paper was selected for presentation by an SPE Program Committee following review of information contained in an abstract submitted by the author(s). Contents of the paper, as presented, have not been reviewed by the Society of Petroleum Engineers and are subject to correction by the author(s). The material, as presented, does not necessarily reflect any position of the Society of Petroleum Engineers, its officers, or members. Papers presented at SPE meetings are subject to publication review by Editorial Committees of the Society of Petroleum Engineers. Electronic reproduction, distribution, or storage of any part of this paper for commercial purposes without the written consent of the Society of Petroleum Engineers is prohibited. Permission to reproduce in print is restricted to an abstract of not more than 300 words; illustrations may not be copied. The abstract must contain conspicuous acknowledgment of where and by whom the paper was presented. Write Librarian, SPE, P.O. Box 833836, Richardson, Texas 75083-3836 U.S.A., fax 01-972-952-9435.
Abstract Even with the significant progress made in modeling flow and transport in fractured rock in the last few decades, characterizing fractured reservoirs remains a great challenge. This is because of the inherent complexity within actual fractured reservoirs, from multiphase flow and transport to the spatial variability of the fracture network. To investigate coupled processes of fluid and heat flow and chemical isotopic transport in the highly heterogeneous, unsaturated fractured tuff of Yucca Mountain (a proposed underground repository site for storing U.S. high-level radioactive waste), we present an integrated modeling methodology. The proposed modeling approach integrates a wide variety of moisture, pneumatic, thermal, and geochemical isotopic field data into a comprehensive three-dimensional numerical model for modeling analyses. In particular, the results of this evaluation indicate that moisture data, such as water potential and liquid saturation in the rock matrix, are not sufficient to determine in situ percolation flux, whereas temperature and geochemical isotopic data provide better constraints to net infiltration rates and flow patterns. In addition, pneumatic data are found to be extremely valuable in estimating large-scale fracture permeability. The integration of hydrologic, pneumatic, temperature, and geochemical data into modeling analyses is thereby demonstrated to provide a practical modeling approach for characterizing flow and transport processes in complex fractured reservoirs. Introduction The unsaturated zone (UZ) of the highly heterogeneous, fractured tuff at Yucca Mountain, Nevada, U.S.A, has been investigated as a possible repository site for storing high-level radioactive waste since the 1980s. Characterization of flow and transport processes in the fractured rock of the Yucca
Mountain UZ has received significant attention and has made significant progress over the last two decades. During the same period of extensive studies, many types of data have been collected from the Yucca Mountain UZ, and these data have helped in developing a conceptual understanding of various physical processes within the UZ system.
Even with the progress made so far in data analysis and flow and transport modeling in fractured rock, characterizing fractured reservoirs remains a great challenge, because of the inherent complexity within heterogeneous fractured reservoirs, from multiphase flow and transport to the spatial variability of the fracture network. In this work, we present an integrated modeling methodology of calibrating a UZ flow model for characterizing percolation flux in unsaturated fractured rock. Such integration of multiple processes provides a better understanding of percolation patterns and flow behavior within the Yucca Mountain UZ under different climates and hydrogeological conceptualizations of UZ flow. First, we discuss how to integrate different field-observed data, such as water potential, liquid saturation, perched water, gas pressure, chloride, and temperature logs, into a single 3-D UZ flow and transport model. The combined model calibration will provide a consistent cross-check or verification of modeled percolation fluxes, as well as better insight into UZ flow patterns. Second, we show that this integrated modeling effort provides consistent model predictions for different but interrelated hydrological, pneumatic, geochemical, and geothermal processes in the UZ. As a result, such an integrated approach will generally improve the capability and credibility of numerical models in characterizing flow and transport processes in unsaturated fractured formations.
This paper represents our continuing effort in developing and applying the UZ flow and transport models to characterizing the UZ system of Yucca Mountain. Specifically, this modeling study consists of (1) a brief UZ model description and (2) model calibration.
Hydrogeology and Conceptual Model The domain of the UZ model encompasses approximately 40 km2 of the Yucca Mountain area, as shown in Figure 1. The UZ is between 500 and 700 m thick and overlies a relatively flat water table. The repository would be located in the highly fractured Topopah Spring welded tuff unit, more than 200 m above the water table. Geologically, Yucca Mountain is a structurally complex system of Tertiary volcanic rock.
SPE 106996
An Integrated Modeling Approach for Characterizing Multiphase Flow, Chemical Transport, and Heat Transfer in Fractured Reservoirs Yu-Shu Wu, SPE, Guoping Lu, Keni Zhang, and G.S. Bodvarsson, Lawrence Berkeley Natl. Laboratory

2 SPE 106996
Subsurface hydrological processes in the UZ occur in a heterogeneous environment of layered, anisotropic, and fractured volcanic1,2 tuff.
For hydrological investigations, the UZ geologic formations have been categorized into hydrogeologic units based primarily on their degree of welding3. These units are classified as the Tiva Canyon welded (TCw) hydrogeologic unit; the Paintbrush Tuff nonwelded unit (PTn), consisting primarily of the Yucca Mountain and Pah Canyon bedded tuffs; the Topopah Spring welded (TSw) unit; the Calico Hills nonwelded (CHn) unit; and the Crater Flat undifferentiated (CFu) unit. The hydrogeological units vary significantly in thickness and sloping over the model domain (Figure 2).
UZ-Flow Conceptual Model: Figure 2 presents a typical geological profile along a vertical east-west transect (Figure 1), illustrating a conceptual model currently used to analyze UZ flow patterns, as well as explaining the possible effects of faults and perched water on the UZ system4,5. As illustrated in Figure 2, the ground surface of the UZ is subject to spatially and temporally varying infiltration pulses from precipitation, which provide the water source for deep percolation into the UZ. Surface infiltration pulses are expected to move rapidly through the top, highly fractured TCw unit. Once it enters the PTn, percolating water may be subject to very different processes, because the PTn unit has very different hydrogeologic properties from the TCw and TSw units above and below it, which display the low porosity and intensive fracturing typical of densely welded tuffs. With its high porosity and low fracture intensity, the PTn matrix has a large capacity or pore space for storing groundwater. As a result, moisture imbibing into the relatively dry PTn matrix from rapid fracture flow of the TCw may result in a more uniform distribution of flux at the base of the PTn.
Perched Water: Perched water has been encountered in a number of boreholes at Yucca Mountain6. These perched water locations are found to be associated with low-permeability zeolites in the CHn or the densely welded basal vitrophyre of the TSw unit, below the repository horizon. Perched water is another important mechanism impacting flow paths in the UZ units below the repository horizon. In the permeability-barrier conceptual model used in UZ flow modeling studies since 19964,7, both vertical and lateral water movement in the vicinity of the perched zones is considered to be controlled mainly by localized fracture and matrix permeability distributions.
Faults: In addition to possible capillary and permeability barriers, major vertical faults in the UZ are also expected to play an important role in controlling percolation flux. Permeability within faults is much higher than that in the surrounding tuff3. High permeability fault zones with large pore space may act as vertical capillary barriers to lateral flow. Once water is diverted into a fault zone, however, its high permeability could facilitate rapid downward flow along faults through the unsaturated system. In this modeling study, major faults are treated as intensively fractured zones.
Heterogeneity: A considerable amount of field data, obtained from tens of boreholes, two underground tunnels, and hundreds of outcrop samples at the site, constrains the distribution of rock properties within different units. In general, field data indicate that the Yucca Mountain formation
is more heterogeneous vertically than horizontally, such that layer-wise representations are found to provide reasonable approximations of the complex geological system.
As shown in Figure 2, the key conceptualizations and assumptions made in this study for constructing the hydrogeological model to analyze UZ flow patterns are as follows: • Ambient water flow in the UZ system is at a quasi-steady
state condition. • Hydrogeological units/layers are internally homogeneous,
unless interrupted by faults or altered. • There may exist capillary barriers in the PTn or other
units, causing lateral flow. • Perched water results from permeability barrier effects. • Major faults serve as fast downward flow pathways for
laterally diverted flow. Numerical Model The technique used in this work for modeling multiphase flow, tracer transport, and heat transfer through fractured rock is based primarily on the dual-permeability concept. It considers global flow and transport occurring not only between fractures but also between matrix gridblocks. In this approach, one rock-volume domain is represented by two overlapping (yet interacting) fracture and matrix continua. The fracture-matrix fluid flow is evaluated using the same quasi-steady-state approximation as in the double-porosity model8, which has also been extended in this work to estimate local mass and energy exchange terms between fracture and matrix systems9.
Model calibration and simulation of this study were carried out using the TOUGH2 and T2R3D codes10–12. In these two TOUGH2-family codes, the integral finite-difference scheme is used for spatial discretization, and the time discretization is carried out with a backward, first-order, finite-difference scheme. The resulting discrete nonlinear algebraic equations for describing mass (or component) and/or energy conservation are written in a residual form and solved using the Newton/Raphson iteration fully implicitly with an iterative linear solver. At each time step, iteration continues until convergence is reached for a given time, when the residual at every gridblock is decreased to a preset convergence tolerance.
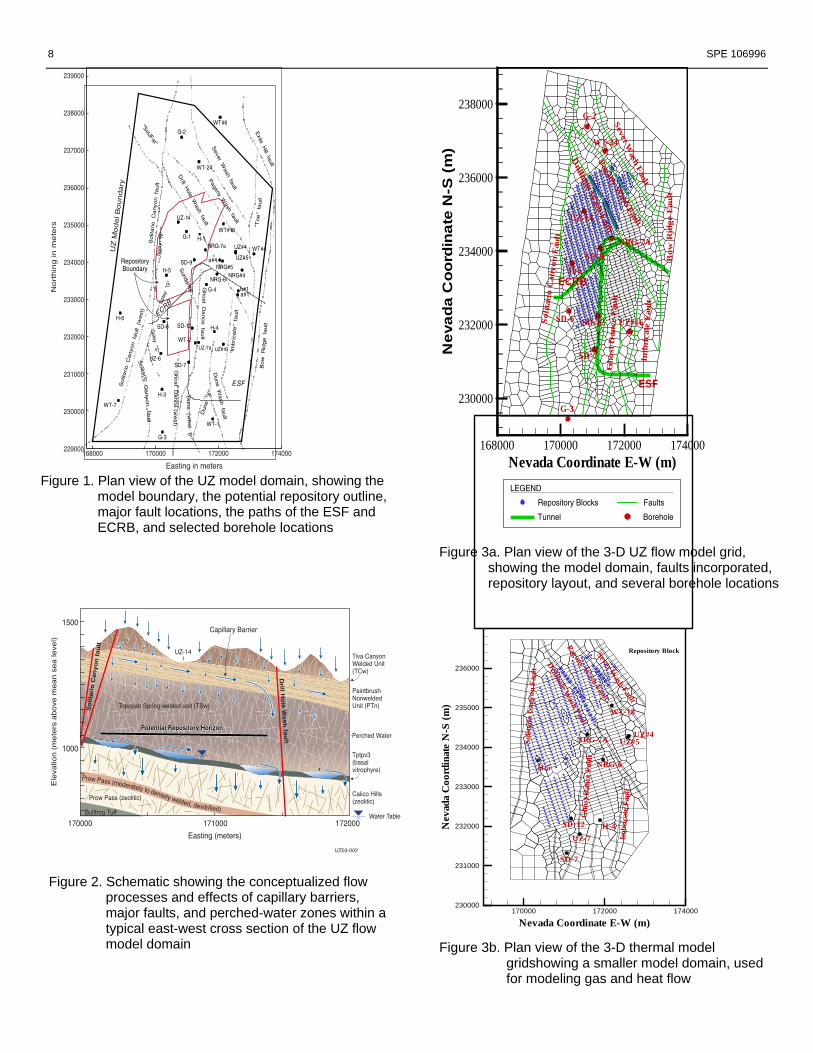
Model Grids: There are two 3-D numerical model grids used in this study, as shown in plan view in Figures 3a and 3b. The two 3-D UZ model grids were generated with a grid maker13, using an irregular, unstructured, 3-D control-volume spatial discretization. The first numerical grid (Figure 3a) is called the UZ flow model grid, because it is primarily designed for model calibrations and investigations of UZ flow and transport. Shown in its plan view in Figure 3b is the second 3-D model grid, covering a smaller model domain, called the thermal model grid, used for gas flow and ambient heat-flow modeling. Also shown in Figures 3a and 3b are the locations of a number of boreholes incorporated into model calibrations and analyses. In both model grids, faults are represented in the model by vertical or steeply inclined 30 m wide zones.

SPE 106996 3
In Figures 3a and 3b, each gridblock in the x-y plane represents a vertical column defined in the 3-D grid. The 3-D flow model grid has 2,042 mesh columns of both fracture and matrix continua along a horizontal grid layer (Figure 3a), and 50 computational grid layers in the vertical direction, resulting in 250,000 gridblocks and 1,000,000 connections in a dual-permeability grid. As shown in the plan view of Figure 3b, the thermal model grid domain covers approximately 20 km2 of the area. The thermal model grid of Figure 3b consists of 980 mesh columns of fracture and matrix continua, 86,440 gridblocks, and 350,000 connections in a dual-permeability grid. Vertically, the thermal grid has an average of 45 computational grid layers.
Input Model Parameters: Note that both Richards’ and two-active-phase flow equations are used in modeling unsaturated flow of water and air through fracture and matrix, relative permeability and capillary pressure curves are needed to model two-phase flow in the fracture-matrix two media. In addition, other intrinsic fracture and matrix properties are also needed, such as porosity, permeability, fracture density and geometric parameters, as well as rock thermal properties. In our modeling study, the van Genuchten models of relative permeability and capillary pressure functions14 are selected to describe variably saturated flow in both fracture and matrix media. The basic input rock and fluid-flow parameters used for each model layer or hydrogeological subunit15, including fracture and matrix properties.
Model Boundary Conditions: The ground surface of the mountain is taken as the top model boundary, while the water table is treated as the bottom model boundary. For flow simulations, net infiltration is applied to fractures along the top boundary using a source term. The bottom boundary at the water table is treated as a Dirichlet-type boundary. All the lateral boundaries, as shown in Figures 1, 3a, and 3b, are treated as no-flow (laterally closed) boundaries.
Net infiltration of water, resulting from precipitation that penetrates the top rock or soil layer of the mountain, is the most important factor affecting the overall hydrological, geochemical, and thermal-hydrological behavior of the UZ. This is because net infiltration is the ultimate source of groundwater recharge and deep-zone percolation through the UZ, and provides a vehicle for transporting radionuclides from the repository to the water table. To cover the various possible scenarios and uncertainties of current and future climates at Yucca Mountain, we have incorporated a total of nine net infiltration maps, provided by U. S. Geological Survey (USGS) scientists16, into the model, These infiltration maps include present-day (modern), monsoon, and glacial transition—three climatic scenarios, each of which consists of lower-bound, mean, and upper-bound rates, as summarized in Table 1, for average rate values over the flow model domain.
As shown in Table 1, the average rate for present-day, mean infiltration with the flow model grid (Figure 3a) is 4.4 mm/yr distributed over the flow model domain, which is considered as a base-case infiltration scenario. By comparison, the thermal model grid has an average net infiltration rate of 3.6 mm/yr distributed over the smaller domain (Figure 3b) for the present-day, mean infiltration case. Note that only the present-day, mean infiltration scenario is used with the thermal grid for gas flow and ambient thermal studies. The
two future Yucca Mountain climatic scenarios, the monsoon and glacial transition periods, are used to account for possible higher precipitation and infiltration conditions in the future. A plan view of the spatial distribution of the present-day mean infiltration map, as interpolated onto the flow model grid, is shown in Figure 4.
Model Calibration The complexities of the heterogeneous geological formation and coupled UZ flow and transport processes at the Yucca Mountain UZ have posed serious challenges to modeling investigations. For example, past modeling experience has shown that one cannot simply input field- and laboratory-measured parameters or 1-D model inverted properties directly into 3-D models and expect reasonable simulation results. This is because of the many uncertainties and significant differences in those input parameters—with respect to their spatial and temporal scales—between measurements and model spatial representations. Without further calibration, those parameters observed or determined on one spatial scale are in general inappropriate for use at another spatial scale. In general, a proper model approximation of the actual physical system requires model calibration on the same model scale, from conceptual models to model parameters, as well as an accurate description of the physical processes involved.
The model calibrations for this work rely on field-measured matrix-liquid saturation, water-potential, perched water, and pneumatic data. Liu et al.17 provide basic input parameters for fracture and matrix rock for starting modeling efforts in this paper. However, these properties were estimated through a series of 1-D model inversions in which lateral diversion, perched water, and capillary-barrier effects cannot be modeled. Use of a 3-D model allows further parameter adjustment to better match field observation data and avoid unphysical solutions. Among the various types of available data used in UZ model development, the moisture data related to matrix-liquid saturation and water potentials, measured from core samples or from in situ instruments, have historically been perhaps the most important data sources. In this study, a series of 3-D model calibrations have been carried out to estimate model-scale related parameters. The adjusted parameters include fracture-matrix properties of the top TSw layer, the entire PTn unit, and perched water zones, as well as fracture permeabilities in the upper TSw layers. The 3-D model calibration efforts were performed in a series of forward 3-D simulations, starting with the three sets of 1-D model calibrated parameters corresponding to three rates of lower bounds, means, and upper bounds of infiltration18. Then, model results are compared with field-observed data for matrix liquid, water potential, perched water elevations, and gas-pressure measurements, as well as temperature and chloride data.
As listed in Table 2, a total of 18 3-D steady-state flow simulation scenarios are studied and used for model calibrations and analyses. The 18 3-D flow simulations are generated using nine infiltration maps (See Table 1), two sets of fracture-matrix parameters, one base case and one alternative. The classification of base-case and alternative parameters is based on model calibration results from the two different property sets for the PTn unit, because the base-case

4 SPE 106996
(or first-set) parameter models provide a better overall match to field data than the alternative properties5,15.
Comparisons to Saturation and Water Potential Data: Comparisons of simulated and observed matrix liquid saturation and water potential along the vertical column representing borehole SD-12 are shown, as examples, in Figures 5 and 6 with different infiltration scenarios. In general, the modeled results from the nine simulations with the UZ flow conceptual model are in reasonable agreement with the measured saturation and water-potential profiles. It should be mentioned that the modeling results from the three lower infiltration scenarios diverge more widely from what was observed than the rest of the model predictions. The differences between simulated and observed saturation data, as shown in Figures 5 and 6, are primarily caused by heterogeneity and grid coarseness. Figures 5 and 6 also show the observed and simulated perched water elevations at this location, indicating a good agreement between observed and simulated data.
Comparison with Pneumatic Data: Calibration of the 3-D UZ model to pneumatic data or gas flow provides a practical method of estimating large-scale fracture permeability within the 3-D UZ system19,20. Note that because of the low percolation flux at the site, moisture data are found to be insensitive to fracture properties under ambient infiltration conditions and therefore are insufficient for estimating fracture permeability. In this study, gas flow calibration is carried out under a steady-state water flow condition with the present-day-mean infiltration scenario. To match field-measured pneumatic data from boreholes, fracture permeability needs to be modified from values estimated by the 1-D inverse model for a number of 3-D model layers. In these gas–flow calibrations, additional pneumatic boundary conditions are needed on the land-surface boundary for the gas phase, specifically as the time-dependent gas-pressure conditions, based on measured atmospheric barometric pressure data at the site. Since gas flow is a much more rapid process than liquid or heat flow in the UZ, water flow during pneumatic calibration is assumed to be at steady-state conditions, determined by steady-state flow simulation results under the present-day mean infiltration scenario.
In the 3-D model simulation, to capture the details of periodic gas-pressure variations for ridge and valley values, we set the maximum time step to be 13,000 seconds. The results of these gas-flow simulations are then compared with field-measured pneumatic data from several boreholes simultaneously, to examine the results from the 1-D models18. The model calibration results indicated that modification of fractured rock properties, as estimated by 1-D inversion in the TSw layers, is necessary for matching field-observed gas pressures. In particular, it was found necessary to reduce the fracture permeability of the subunits within the TSw by a factor of 15, as well as for the PTn units by a factor from 1.8 to 21.
Comparison of calibrated model simulation results and field-measured pneumatic data for borehole UZ-7a is shown in Figure 7 as an example, showing the need to reduce fracture permeability to match the measured pneumatic data. The lower fracture permeability needed for the 3-D model may be attributed to the original fracture permeability being estimated
from inverting 1-D models, allowing for 1-D vertical flow paths only. In a 3-D model, some high-gas-flux channels may exist, such as through faults or highly fractured zones, and 3-D gas flow is able to find and follow these high-permeability pathways with the least flow resistance. This also shows why 3-D model calibration is necessary for UZ model development.
Comparison to Temperature Data: Heat flow simulations use a 3-D thermal model grid (Figure 3b), base-case UZ model parameters, and present-day mean infiltration rate to simulate advective and conductive steady-state heat-transfer processes within the UZ. The main objective here is to analyze the average present-day infiltration rate. To account for variation in average atmospheric temperature along the mountain surface, we use measured mean surface temperatures and a linear equation to correlate surface temperature with elevation, thus describing initial surface temperature conditions21. Temperature distributions at the bottom boundary of the thermal model are taken from deep-borehole-measured temperature profiles22 for an initial guess of the water-table-boundary temperature contours. Then, initially estimated ground surface and water table temperatures are further calibrated by comparing model results with field temperature measurements.
Under steady-state conditions, temperature profiles or geothermal gradients within the UZ are controlled by regional geothermal and weather conditions. In addition, these profiles and gradients are also related to formation thermal conductivity, net infiltration rates, and deep percolation fluxes. In thermal calculations, the surface net infiltration rate is fixed, based on the U. S. Geological Survey estimates (Table 1), and the temperatures from the initially specified values along the top boundary are slightly adjusted. These adjustments result in a better match with observed borehole data. The rationale behind the adjustment is, first, that insufficient temperature data were collected along the UZ model boundaries for accurate description of temperature distributions along the boundaries. Second, under steady-state moisture and heat-flow conditions, both top and bottom boundary temperatures vary spatially, but are constant with time, which leaves room for adjustments to fit steady-state temperature profiles measured from boreholes.
Figure 8 shows a model calibration result using measured temperature profiles in six boreholes22. The figure shows a good match between measured and simulated temperatures for all six boreholes. Note that near the ground surface in the boreholes, observed temperatures show significant seasonal variations, which cannot be captured by the steady-state heat flow model. However, these seasonal changes in surface temperature have little impact on steady-state heat flow and field-measured temperature profiles in the deeper (more than 20 m) UZ. Field data, as well as comparisons with steady-state simulation results in Figure 13, indicate that the ambient geothermal conditions can be approximated as steady state on the large-scale model.
Matching measured temperature profiles using simulation results along these boreholes at different locations, as shown in Figure 8, implies that percolation fluxes (as well as their spatial distributions estimated by the 3-D UZ model) are within a reasonable range of the actual percolation in the UZ.

SPE 106996 5
Otherwise, the study by Bodvarsson et al.23 indicates that if the surface infiltration rate is increased or decreased by a factor of 3 or more, temperature profiles can generally no longer be fitted by a 3-D model. This is because on average, a percolation flux of 5 mm/yr removes about 10 mW/m2 of downward heat convection, which is about 25% of upward heat conduction, ~40 mW/m2, through the UZ by ambient geothermal gradients22. Any large increase or decrease (e.g., by a factor of 2 or more) of infiltration or percolation flux values in the model will lead to significant changes in downward heat convection or in geothermal gradients, such that model results will significantly deviate from observed temperature profiles.
Comparison with Geochemical Isotopic Data: The methodology for analyzing percolation flux using geochemical pore-water chloride (Cl) data is based on modeling studies of chloride transport processes in the UZ under different infiltration scenarios. Here, we discuss the detailed rationale for using Cl to constrain the percolation fluxes. The results of Cl transport modeling is briefly described; more detailed discussion and results using chloride and other isotopic data are provided in BSC and Wu et al. 5,15.
As discussed above, whereas field-measured moisture data are found to be relatively insensitive to percolation values, geochemical isotopic data provide valuable information by which to analyze the UZ system and help constrain the UZ percolation flux range24. Measurements of chloride concentration data were made from pore waters extracted from field samples25,26 collected from a number of surface-based boreholes and two underground tunnels—the Exploratory Studies Facilities (ESF) and the Enhanced Characterization of Repository Block (ECRB) (Figures 1 and 3a). The source recharge of chloride on the ground surface to the transport model is estimated using precipitation, runon, and runoff24, and is imposed on the top boundary under different infiltration scenarios. All Cl transport simulations were run using the T2R3D code for 100,000 years to approximate the current, steady-state condition under the infiltration scenarios considered. Chloride is treated as a conservative component transported through the UZ, subject to advection, diffusion, and first-order decay. The mechanical dispersion effect through the fracture-matrix system was ignored. A constant molecular diffusion coefficient of 2.032 × 10⁻⁹ m2/s is used for Cl matrix diffusion.
The three present-day infiltration rates for lower, mean, and upper bounds are used in chloride modeling. Each of the three infiltration maps corresponds to two 3-D flow fields (Table 2), i.e., the base-case (A) and alternative models (B) use the same surface infiltration maps. For example, the same present-day mean infiltration scenario leads to two flow fields: preq_mA of the base case and preq_mB of the alternative. This result in a total of six 3-D flow fields with three base cases and three alternatives, based on different parameter sets of different PTn conceptual models. Therefore, the difference predicted by the two flow-field results under the same infiltration scenario (e.g., preq_mA and preq_mB) is a function of input parameters or conceptual models. On the other hand, the difference in model predictions with the same conceptual models of base cases (i.e., preq_lA, preq_mA, preq_uA) or alternatives (preq_lB, preq_mB, preq_uB) with
different infiltration scenarios results from the effects of infiltration rates. By comparing model results with field-observed chloride data using different parameter sets (or conceptual models) and infiltration rates, it may be possible to identify more suitable conceptual models as well as to estimate the range of net infiltration rates.
The modeled chloride concentrations and their field measurements are presented in Figure 9, as an example, along the underground tunnel of ECRB. Several comparisons with borehole data are presented in BSC and Wu et al.5,15. As shown in Figure 9, modeled chloride distributions in the UZ are very sensitive to both conceptual models of the PTn and net surface infiltration rates. Comparisons of simulated and measured chloride concentrations in Figure 9 indicate that the simulations for mean infiltration of the base-case model (preq_mA) have overall better matches than the alternative model results (preq_mB). It is also shown that base-case model results (preq_uA) with upper-bound infiltration give reasonable matches compared to the mean infiltration results (preq_mA), while model results using lower-bound rates give the poorest fit. In general, high net infiltration results in lower chloride concentrations, whereas lower net infiltration gives high chloride concentrations within the UZ system. Summary and Concluding Remarks This paper presents an integrated modeling approach as well as its application to a large-scale study characterizing percolation patterns in the unsaturated zone of Yucca Mountain, Nevada. In particular, a comprehensive modeling effort is made to quantify moisture movement or unsaturated flow patterns at the Yucca Mountain UZ using an integrated approach for capturing the multiple processes, including moisture flow, natural geochemical reaction and transport, and gas and heat flow, within the UZ system. Our modeling results, based on the integrated modeling approach, provide a better understanding of percolation patterns and flow behavior within the Yucca Mountain UZ. More importantly, integration of different types of field-observed data—such as water potential, liquid saturation, perched water, gas pressure, chloride concentration, and temperature logs—into one single modeling analysis provides a rare opportunity to cross-examine and verify different process model results and various conceptualizations. Such an opportunity may be impossible when using only one or two types of data. This study also demonstrates that integrated model calibrations and analyses make it possible to have consistent model predictions for different but interrelated hydrological, pneumatic, geochemical, and geothermal processes in the UZ.
This study summarizes our current research effort to characterize UZ flow patterns at Yucca Mountain. As demonstrated in this work, the integrated methodology—integrating numerical models with various types of data and physical processes—provides a practical and promising approach for conducting large-scale site-characterization investigations in unsaturated fractured rock.
Acknowledgments The authors would like to thank Guoxiang Zhang and Dan Hawkes for his review of this paper. This work was supported

6 SPE 106996
by the Director, Office of Civilian Radioactive Waste Management, U.S. Department of Energy, through Memorandum Purchase Order EA9013MC5X between Bechtel SAIC Company, LLC, and the Ernest Orlando Lawrence Berkeley National Laboratory (Berkeley Lab). The support is provided to Berkeley Lab through the U.S. Department of Energy Contract No. DE-AC03-76SF00098 References
1. Scott, R. B., and J. Bonk, Preliminary geologic map of Yucca Mountain, Nye County, Nevada, with geologic sections, Report USGS OFR-84-494, US Geological Survey, 1984.
2. Buesch, D.C., R.W. Spengler, T. C. Moyer, and J.K. Geslin, Nomenclature and macroscopic identification of lithostratigraphic units of the Paintbrush group exposed at Yucca Mountain, Nevada, Report USGS OFR 94-469, U. S. Geological Survey, 1995.
3. Montazer, P. and W. E. Wilson, Conceptual Hydrologic Model of Flow in the Unsaturated Zone, Yucca Mountain, Nevada. Water-Resources Investigations Report 84-4345, Lakewood, Colorado: U.S. Geological Survey, 1984.
4. Wu, Y. S., L. Pan, W. Zhang, and G. S. Bodvarsson, Characterization of flow and transport processes within the unsaturated zone of Yucca Mountain, Nevada, Journal of Contaminant Hydrology, 54, 215–247, 2002.
5. Wu, Y. S., G. Lu, K. Zhang, and G. S. Bodvarsson, A mountain-scale model for characterizing unsaturated flow and transport in fractured tuffs of Yucca Mountain, Vadose Zone Journal, 3:796-805, 2004.
6. Rousseau J. P., E. M. Kwicklis, and C. Gillies (eds), Hydrogeology of the unsaturated zone, North Ramp area of the exploratory studies facility, Yucca Mountain, Nevada, U.S. Geological Survey, Water-Resources Investigations 98-4050, 1998.
7. Wu, Y. S., A. C. Ritcey, and G. A. S. Bodvarsson, A modeling study of perched water phenomena in the unsaturated zone at Yucca Mountain, Journal of Contaminant Hydrology, 38 (1-3), 157–184, 1999b.
8. Warren, J. E. and P. J. Root, The behavior of naturally fractured reservoirs, Soc. Pet. Eng. J., Trans., AIME, 228, 245-255, 1963.
9. Pruess, K. and T. N. Narasimhan, A practical method for modeling fluid and heat flow in fractured porous media, Soc. Pet. Eng. J., 25, 14-26, 1985.
10. Wu, Y.S., C.F. Ahlers, P. Fraser, A. Simmons and K. Pruess, Software Qualification Of Selected TOUGH2
Modules, Report LBL-39490; UC-800, Lawrence Berkeley National Laboratory, Berkeley, CA, 1996.
11. Pruess, K., Oldenburg, C., and Moridis, G., 1999. TOUGH2 User’s Guide, Version 2.0, LBNL-43134, Lawrence Berkeley National Laboratory, Berkeley, California
12. Wu, Y. S. and K. Pruess, Numerical simulation of non-isothermal multiphase tracer transport in heterogeneous fractured porous media, Advances in Water Resources, 23, 699–723, 2000.
13. Pan, L., J. Hinds, C. Haukwa, C., Y. S. Wu, and G. S. Bodvarsson, WinGrider: An Interactive Grid Generator for TOUGH2, Version 1.0 (Users’ Manual), Earth Sciences Division, Lawrence Berkeley National Laboratory, Berkeley California, 2000.
14. van Genuchten, M. Th., A closed-form equation for predicting the hydraulic conductivity of unsaturated soils, Soil Sci. Soc. Amer. J., 44(5), 892–898, 1980.
15. BSC (Bechtel SAIC Company), UZ flow models and submodels, Report MDL-NBS-HS-000006 REV002, Berkeley, CA, Lawrence Berkeley National Laboratory, Las Vegas, Nevada, CRWMS M&O, 2004.
16. BSC (Bechtel SAIC Company), Simulation of Net Infiltration for Present-Day and Potential Future Climates. MDL-NBS-HS-000023, Rev. 00. Las Vegas, Nevada: Bechtel SAIC Company, 2004.
17. Liu, J., E. L. Sonnenthal, and G. S. Bodvarsson, Calibration of Yucca Mountain unsaturated zone using porewater chloride data, Journal of Contaminant Hydrology, 62-63, 231–236, 2003.
18. BSC (Bechtel SAIC Company), Calibrated Properties Model, Report: MDL-NBS-HS-000003 REV 01, Lawrence Berkeley National laboratory, Las Vegas, Nevada, Bechtel SAIC Company, 2003.
19. Ahlers, C. F., S. Finsterle, and G. S. Bodvarsson, Characterization and prediction of subsurface pneumatic response of at Yucca Mountain, Nevada, Journal of Contaminant Hydrology, 38 (1–3), 47–68, 1999.
20. Wu, Yu-Shu, Keni Zhang, and Hui-Hai Liu, “Estimating Large-Scale Fracture Permeability of Unsaturated Rock Using Barometric Pressure Data,” LBNL-57614, Vadose Zone Journal, Vol. 5, pp.1129-1142, 2006.
21. Wu, Y. S., C. Haukwa, and G. S. Bodvarsson, A site-scale model for fluid and heat flow in the unsaturated zone of Yucca Mountain, Nevada, Journal of Contaminant Hydrology,. 38 (1-3), 185–217, 1999a.

SPE 106996 7
22. Sass J. H., A. H. Lachenbruch, W. W. Dudley Jr., S. S. Priest, and R .J. Munroe, Temperature, thermal conductivity, and heat flow near Yucca Mountain, Nevada: some tectonic and hydrologic implications, USGS OFR-87-649, 1988.
23. Bodvarsson, G. S., E. Kwicklis, C Shan, and Y. S. Wu, Estimation of percolation flux from borehole temperature data at Yucca Mountain, Nevada, Journal of Contaminant Hydrology, 62-63, 3–22, 2003.
24. Sonnenthal, E. L. and G. S. Bodvarsson, Constraints on the hydrology of the unsaturated zone of Yucca Mountain, NV from three-dimensional models of chloride and strontium geochmestry, Journal of Contaminant Hydrology, 38 (1-3), 107–106, 1999.
25. Fabryka-Martin, J., A. Meijer, B. Marshal, L. Neymark, J. Paces, J. Whelan, and A. Yang, Analysis of geochemical data for the unsaturated zone, Report ANL-NBS-HS-000017, Los Alamos, NM, Los Alamos National Laboratory, Las Vegas, Nevada, CRWMS M&O, 2002.
26. Yang, I. C., G. W. Rattray, and P. Yu, Interpretation of chemical and isotopic data from boreholes in the unsaturated-zone at Yucca Mountain, Nevada. Water Resources Investigation Report 96-4058. U.S. Geological Survey, Denver, Co., 1996.
Table 1. Climate scenarios and infiltration rates (mm/year) averaged over the flow model domain
Climate Scenario Lower-Bound Infiltration
Mean Infiltration
Upper-Bound Infiltration
Present-Day/Modern 1.3 4.4 10.7 Monsoon 4.4 11.8 19.2
Glacial Transition 2.4 17.0 31.7
Table 2. Nine base-case and nine alternative simulation scenarios associated with parameter sets and infiltration maps
Designation/Simulation*
Base-Case+ Alternative+
Infiltration Rate/Climate Scenario
preq_lA preq_lB Present-day, lower-bound
preq_mA preq_mB Present-day, mean
preq_uA preq_uB Present-day, upper-bound
monq_lA monq_lB Monsoon, lower-bound
monq_mA monq_mB Monsoon, mean
monq_uA monq_uB Monsoon, upper- bound
glaq_lA glaq_lB Glacial transition, lower-bound
glaq_mA glaq_mB Glacial transition, mean
glaq_uA glaq_uB Glacial transition, upper-bound * A denotes base-case and B alternative flow scenarios; l, m, and u stand for lower, mean, and upper bounds of infiltration rates for each climate scenarios, respectively. + The base-case simulations are based on the base-case parameter sets; while the alternative simulations are done using the alternative parameter sets.
8 SPE 106996
������
������
������
������
�������
�
������
�
�������
�
�������
�
������
�
�������
�
����������� ����� ����� ����
�
������ �� ������
����������
������
��������������
!�"������ �������
Figure 1. Plan view of the UZ model domain, showing the
model boundary, the potential repository outline, major fault locations, the paths of the ESF and ECRB, and selected borehole locations
����
����
������ ������ ������
����� �������
������� �����������������������
������ ���������������
����� ���� �������
����� �����
��! ��� ��"������� �� "����� !��"�"# "����$�"�
��! ��� �������
�����
������� ��
��� �������"�" %� ��!�
����&��'�!��"�"%� ��
(&��$��� �&$$
%)*�+
������� ,��� !��"�" &� �,!�
�������������� ��
�����" ������������� ��������� ��������������� ��������� �������
%)��*���
�������� (�����
Figure 2. Schematic showing the conceptualized flow
processes and effects of capillary barriers, major faults, and perched-water zones within a typical east-west cross section of the UZ flow model domain
ESF
Nevada Coordinate E-W (m)N
evad
aC
oord
inat
eN
-S(m
)168000 170000 172000 174000
230000
232000
234000
236000
238000
Sol
itari
oC
anyo
nF
ault
Drillhole
Wash
FaultPagany
Wash
Fault
SeverWash
Fault
Gho
stD
ance
Fau
lt
Bow
Rid
geF
ault
Imbr
icat
eF
ault
NRG-7A
SD-6
SD-7
SD-9
SD-12
UZ-14
WT-24
G-2
G-3
H-5
UZ#16
ECRB
LEGEND
Repository Blocks
Tunnel
Faults
Borehole Figure 3a. Plan view of the 3-D UZ flow model grid,
showing the model domain, faults incorporated, repository layout, and several borehole locations
Nevada Coordinate E-W (m)
Nev
ada
Coo
rdin
ate
N-S
(m)
170000 172000 174000230000
231000
232000
233000
234000
235000
236000
NRG-7A
WT-18
NRG-6
SD-7
SD-12
UZ-7
Solit
ario
Can
yon
Faul
t
Gho
stD
ance
Faul
t
Imbr
icat
eFa
ult
Drillhole W
ashFault
Pagany Wash Fault
SeverWash Fault
UZ#5
H-5
UZ#4
H-4
Repository Block
Figure 3b. Plan view of the 3-D thermal model
gridshowing a smaller model domain, used for modeling gas and heat flow

SPE 106996 9
1514.2513.512.751211.2510.59.7598.257.56.7565.254.53.7532.251.50.750
NevadaCoordinate E-W(m)
Nev
ada
Coo
rdin
ate
N-S
(m)
168000 170000 172000 174000
230000
232000
234000
236000
238000So
litar
ioC
anyo
nFa
ult
DrillholeW
ashFault
PaganyWashFault
SeverWash
Fault
Gho
stD
ance
Faul
t
Bow
Rid
geFa
ult
Imbr
icat
eFa
ult
(mm/year)
PresentDayInfiltration(Mean)
Figure 4. Plan view of net infiltration distributed over the 3-D UZ flow model grid for the present-day (base-case) mean infiltration scenario
Figure 5. Comparison to the simulated and observed matrix liquid saturations and perched water elevations for Borehole SD-12
Logarithm of Water Potential (Pa)
Ele
va
tio
n(m
)
0.0 2.0 4.0 6.0 8.0 10.0700
800
900
1000
1100
1200
1300
preq_uApreq_mApreq_lAmonq_uAmonq_mAmonq_lAglaq_uAglaq_mAglaq_lAField DataHydro. UnitPerched Water
SD-12
TSw
CHn
PTnTCw
Figure 6. Comparison to the simulated and averaged observed water potentials and perched water elevations for Borehole SD-12
85
86
87
88
89
90
91
92
0 10 20 30 40 50 60
ObservationModel prediction
Time (days from 12/01/95)
Pres
sure
(KPa
)
UZ-7a
TSw
PTn
PTn
TCw
TCw
Figure 7. Comparison of simulated and observed gas pressure at borehole UZ-7a over a 60-day period

10 SPE 106996
NRG-6
700
800
900
1000
1100
1200
1300
5 15 25 35
Simulated
1/1/1995
3/31/1995
NRG-7a
700
800
900
1000
1100
1200
1300
15 20 25 30 35
Simulated
1/1/1997
6/30/1997
SD-12
700
800
900
1000
1100
1200
1300
1400
5 15 25 35
Simulated
1/1/1997
6/30/1997
UZ#5
700
800
900
1000
1100
1200
10 20 30 40
Simulated
1/1/1997
6/30/1997
UZ-7a
700
800
900
1000
1100
1200
1300
5 15 25 35
Simulated
1/1/1997
6/30/1997
Elev
atio
n (m
)
Elev
atio
n (m
)
Elev
atio
n (m
)
Elev
atio
n (m
)
Elev
atio
n (m
)
Temperature (oC) Temperature (oC)
Temperature (oC) Temperature (oC) Temperature (oC)
Temperature (oC)
Elev
atio
n (m
)
H-4
700
800
900
1000
1100
1200
15.0 20.0 25.0 30.0 35.0
simulated
Measured 0n03/09/83
Figure 8. Comparisons between measured and simulated ambient temperature profiles for six boreholes under the present-day mean infiltration rate
DistancefromtheECRBEntrance(m)
Cl-
Con
cent
ratio
n(m
g/l)
05001000150020002500
101
102
103
preq_uApreq_uBpreq_mApreq_mBpreq_lApreq_lBfielddata
ECRB
Figure 9. Comparison between measured and simulated chloride concentration (mg/L) profiles along the ECRB for present infiltration with mean, upper, and lower bounds