AN INTEGRATED FRAMEWORK APPROACH FOR PPP PROJECTS …
116
The American University in Cairo School of Sciences and Engineering AN INTEGRATED FRAMEWORK APPROACH FOR PPP PROJECTS IN EGYPT A Thesis Submitted to The Department of Construction Engineering in partial fulfillment of the requirements for the degree of Master of Science in Construction Engineering By Nada Sherin Mohy El Din B.Sc. in Construction Engineering Under the supervision of Dr. Amr Hassanein Professor, Department of Construction Engineering The American University in Cairo And co-supervision of Eng. Atter Hannoura Director of the PPP Central Unit in Egypt May 2017
Transcript of AN INTEGRATED FRAMEWORK APPROACH FOR PPP PROJECTS …
The American University in Cairo
School of Sciences and Engineering
AN INTEGRATED FRAMEWORK APPROACH FOR PPP
PROJECTS IN EGYPT
A Thesis Submitted to
The Department of Construction Engineering
in partial fulfillment of the requirements for the degree of
Master of Science in Construction Engineering
By
Nada Sherin Mohy El Din
B.Sc. in Construction Engineering
Under the supervision of
Dr. Amr Hassanein
Professor, Department of Construction Engineering
The American University in Cairo
And co-supervision of
Eng. Atter Hannoura
Director of the PPP Central Unit in Egypt
May 2017

ii
DEDICATION
I would love to dedicate this thesis to the loving memory of my mother, for her love, endless
support and encouragement. She had always stood by me and pushed me forward in my life. I
would also like to dedicate this thesis to my father whose endless support is one of the main
reasons I have completed my thesis. I can never thank them enough for standing by me every
step of the way and owe them any accomplishment I achieve in life.

iii
ACKNOWLEDGEMENTS
I am grateful to Prof. Dr. Amr Hassanein for his patience and guidance. He has been very
generous with his knowledge, and his trust in my abilities has made my journey more rewarding.
I would like to thank him for giving me the chance to do this research and for his continuous
support and valuable feedback. It has been a pleasure working under his supervision.
I would like to thank Eng. Atter Hannoura - Director of the PPP Central Unit in Egypt for his
willingness to give me his valuable time to discuss various aspects in my research and for all the
information he provided me with to be able to complete my thesis.
I would also like to thank the experts who were involved in the validation survey for this
research project: Malak Draz from the International Finance Corporation and Eng. Khaled El
Degwy from Orascom Construction. Without their passionate participation and input, the
validation survey could not have been successfully conducted.
Finally, I must express my gratitude to my parents, my sister, and my friends for providing me
with unfailing support and continuous encouragement throughout my academic career. This
accomplishment would not have been possible without them. Thank you

iv
ABSTRACT
Public-Private Partnership (PPP) projects have been growing over the last decade in
Egypt, with an increasing popularity and interest in the participation of different entities in
similar projects. Since the government is not considered the only provider for public
infrastructure systems, the private sector is now contributing to providing such services.
However, not all PPP projects have been equally successful or have been utilized in the best way
through planning and decision. PPP projects require full consideration of all the factors, adequate
structuring and the correct adoption of such factors. Failure in the consideration of all factors
that complete the life cycle of PPPs may lead to the failure of the project. An integrated approach
within a framework is required in order for the PPP projects to succeed. Limited research has
presented an integrated framework approach for the adoption of PPPs. The framework for PPP
projects should be conducted both simultaneously and iteratively for the project to succeed.
The objective of this study is to assist the government in the front end process of a PPP
project, while contributing to the general understanding and filling some gaps in the research and
study of such projects. This can be achieved by depicting an integrated framework approach for
government adoption of PPP projects through three steps; the technical structure of the project,
developing a financial model and finally, designing the procurement strategy of the PPP project.
These three steps are the pillars that indicate the success or failure of a PPP project.
These three pillars are then subdivided into a series of steps that form the integrated
framework approach. Each pillar has a methodology that is followed by an application on a case
study, and a validation exercise. The first pillar is the first step in the initial assessment of a PPP
project. The technical structuring of the project includes structuring of the contractual terms and
managing of risks. It is concluded that the termination term is one of the most important clauses
in a PPP contract. In addition, financing risk is a risk that affects the affordability and the
bankability of a PPP project, and it is allocated to the government. The second step in the initial
assessment of a PPP project is the development of the public sector comparator.
The second pillar is the financial modeling of a PPP project. A financial model template
is developed, applied, and validated on a case study. The results reveal that the template is
running properly and all financial formulas and equations are correct. Following the financial
model development, a value for money assessment process is conducted on a case study both
quantitatively and qualitatively. The risk-adjusted net present costs are calculated at different
discount rates (10%, 11%, 12%, 13%, and 14%) for the public sector comparator and PPP
option.
The final pillar is a qualitative assessment of the procurement activities of PPP projects.
According to law 67 that regulates PPP activities, the results show that single bid may be
accepted if other qualified bidders have failed technically and it appears that the bid was made in
the bidder’s belief under competition. Due to the complexity and long concession periods of PPP
projects, technical offers shall have higher weight than financial offers. According to common
practice, technical offers usually weigh 70% while financial offers weigh 30%. The concept of
structuring a procurement process is further examined and validated by a case study.
KEYWORDS: (PPP projects, Egypt, integrated framework, financial model, public sector
comparator, value for money, technical structure, procurement process)
v
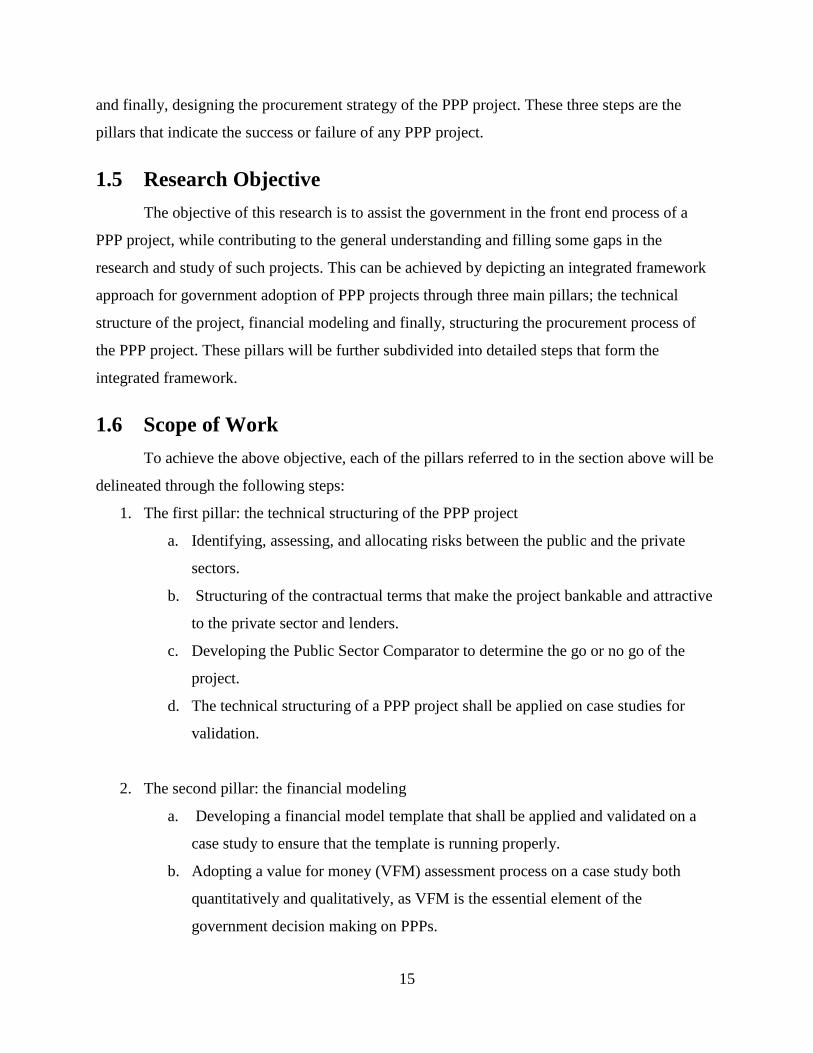
TABLE OF CONTENTS
LIST OF FIGURES ....................................................................................................................... ix
LIST OF TABLES .......................................................................................................................... x
Chapter 1 : INTRODUCTION...................................................................................................... 11
1.1 Background ................................................................................................................... 11
1.2 History of PPPs ............................................................................................................. 13
1.3 The Idea behind PPP in Egypt ......................................................................................... 13
1.4 Problem Statement ........................................................................................................ 14
1.5 Research Objective ....................................................................................................... 15
1.6 Scope of Work ................................................................................................................. 15
Chapter 2 : LITERATURE REVIEW........................................................................................... 17
2.1 What is PPP ........................................................................................................................ 17
2.1.1 PPP Definition ............................................................................................................. 18
2.1.2 Different Models of PPP .............................................................................................. 19
2.1.3 Advantages and Disadvantages of PPP ........................................................................... 21
2.1.4 Why Should Governments Consider PPP? .................................................................. 22
2.1.4.1 Successful Sectors of PPP ..................................................................................... 23
2.1.5 PPP Success Factors .................................................................................................... 24
2.2 PPP in Egypt ....................................................................................................................... 25
2.2.1 PPP Central Unit .......................................................................................................... 25
2.2.2 The Start of a PPP Project Starting from the Line Ministry until the Tendering Process
............................................................................................................................................... 26
2.2.3 PPP Project Life Cycle ................................................................................................. 28
2.2.3.1 Phase 1: Project Initiation & Screening ................................................................ 28
2.2.3.2 Phase 2: Business Case ......................................................................................... 28
2.2.3.3 Phase 3: Risk Assessment, VFM Analysis and PSC ............................................ 28
2.2.3.4 Phase 4: Tendering and Procurement ................................................................... 29
2.2.3.5 Phase 5: Bidders Selection .................................................................................... 29
2.2.3.6 Phase 6: Contract Signature and Financial Closure .............................................. 29
2.2.3.7 Phase 7: Post Award PPP Performance Monitoring & Contract Compliance ...... 29
2.3 The Criteria of a Project to undergo a PPP Participation ................................................... 29

vi
2.3.1 Project Affordability .................................................................................................... 29
2.3.2 Risk Analysis ............................................................................................................... 30
2.3.3 Bankability of the Project ............................................................................................ 36
2.3.4 Value for Money (VFM) .............................................................................................. 37
2.3.4.1 VFM Tests ............................................................................................................ 38
2.3.4.2 VFM Evaluation Criteria ...................................................................................... 39
2.4 PPP Project Viability “Private Sector Point of View” ........................................................ 40
2.5 Financial Models of PPP projects ....................................................................................... 41
2.5.1 Financial Model Usages ............................................................................................... 41
2.5.2 Data Collection ............................................................................................................ 42
2.5.4 Design of the Model ..................................................................................................... 43
2.5.4.1 Design Approaches ............................................................................................... 44
2.5.4.2 Model Inputs and Outputs ..................................................................................... 44
2.5.4.3 Sensitivities ........................................................................................................... 45
2.5.5 Stakeholders’ Preference on Financial Indicators ........................................................ 45
2.6 Public Sector Comparator (PSC) ........................................................................................ 46
2.6.1 Purpose of PSC ............................................................................................................ 47
2.6.2 Components of PSC ..................................................................................................... 47
2.6.3 PSC and the Procurement Process ............................................................................... 48
2.6.4 PSC and Bid Evaluation ............................................................................................... 49
2.7 Hypotheses .......................................................................................................................... 49
Chapter 3 : RESEARCH METHODOLOGY ............................................................................... 51
3.1 Introduction ......................................................................................................................... 51
3.2 Technical Structuring of a PPP Project ............................................................................... 55
3.2.1 Quantification of Risk .................................................................................................. 55
3.3 Public Sector Comparator (PSC) Model ............................................................................. 57
3.3.1 Raw PSC ...................................................................................................................... 57
3.3.2 Retained and Transferable Risks ................................................................................. 59
3.3.2.1 Calculating Transferable Risk............................................................................... 59
3.3.2.2 Calculating Retained Risk..................................................................................... 60
3.3.3 Discount Rate ............................................................................................................... 60

vii
3.4 Financial Model .................................................................................................................. 61
3.4.1 Model Design ............................................................................................................... 61
3.4.2 Model Calculations ...................................................................................................... 65
3.4.3 Model Sensitivities ....................................................................................................... 69
3.4.4 Shadow Bid Model ...................................................................................................... 69
3.5 Value for Money (VFM) Assessment ................................................................................. 69
3.6 Structuring of the Procurement Process .............................................................................. 71
3.6.1 Bidding Steps ............................................................................................................... 71
3.6.2 Weighing Criteria ......................................................................................................... 72
Chapter 4 : APPLICATION.......................................................................................................... 73
4.1 Technical Structuring of the Project ................................................................................... 73
4.1.1 Managing Risks ........................................................................................................... 74
4.1.2 Structuring of the Contractual Terms........................................................................... 74
4.1.3 Case Study (1) – PPP Schools Project ......................................................................... 75
4.1.4 Case Study (2) – Nile River Bus Ferry in Cairo .......................................................... 76
4.2 Financial Model Validation ................................................................................................ 77
4.2.1 Model Application on the Salam to 10th of Ramadan LRT Project ............................ 77
4.2.1.1 Model Calculations ............................................................................................... 81
4.2.1.2 Model Outputs ...................................................................................................... 86
4.2.1.3 Sensitivity Analysis .............................................................................................. 89
4.2.2 Case Studies Comparison............................................................................................. 91
4.3 Value for Money Analysis .................................................................................................. 93
4.3.1 Public Sector Comparator (PSC) for WWTP Project .................................................. 93
4.3.1.1 Raw PSC ............................................................................................................... 93
4.3.1.2 Financing Costs ..................................................................................................... 94
4.3.1.3 Risk Analysis ........................................................................................................ 94
4.3.1.4 Discounted PSC .................................................................................................. 100
4.3.2 Shadow Bid Model for WWTP Project ..................................................................... 101
4.3.2.1 Assumptions ........................................................................................................ 102
4.3.2.2 Costs .................................................................................................................... 102
4.3.2.3 Adjustments ........................................................................................................ 104

viii
4.3.2.4 Risk Analysis ...................................................................................................... 104
4.3.2.5 Discounted Shadow Bid Model (PPP Price) ....................................................... 104
4.3.3 Value for Money (VFM) Assessment ........................................................................ 105
4.3.3.1 Quantitative Assessment ..................................................................................... 105
4.3.3.2 Qualitative Assessment ....................................................................................... 107
4.4 Structuring of the Procurement Process ............................................................................ 108
4.4.1 Case Study – New Cairo Wastewater Treatment Plant ............................................. 108
Chapter 5 : CONCLUSIONS ...................................................................................................... 110
5.1 Conclusions ....................................................................................................................... 110
References ................................................................................................................................... 113

ix
LIST OF FIGURES
Figure 2.1: Existing Services and Facilities (Laing, et al. 2011) .................................................. 17
Figure 2.2: Project Procurement Options (Kong, 2007) ............................................................... 20
Figure 2.3: The Scale of PPPs (United Nations Economic Commission, 2008) .......................... 21
Figure 2.4: PPPCU Role (PPP Central Unit, 2009) ..................................................................... 26
Figure 2.5: The start of a PPP project – Step 1 (PPP Central Unit, 2009) .................................... 27
Figure 2.6: Approval of PPP project - Step 2 (PPP Central Unit, 2009) ...................................... 27
Figure 2.7: The Overall PPP Project Lifecycle (PPP Central Unit, 2009) ................................... 28
Figure 2.8: Illustration of Risk Management Process (Chinyio and Fergusson, 2008) ................ 31
Figure 2.9: Risk Allocation vs project efficieny and total cost (Zou, et al. 2008) ........................ 33
Figure 2.10: Risk Analysis Process (Zou, et al. 2008).................................................................. 35
Figure 2.11: Architecture of a financial model (Khan and Parra, 2003) ...................................... 43
Figure 2.12: Bid Evaluation (Melbourne Partnerships Victoria, 2001) ........................................ 49
Figure 3.1: Research Methodology Flowchart .............................................................................. 52
Figure 3.2: The integrated framework approach flowchart .......................................................... 53
Figure 3.3: Application and Validation Exercises ........................................................................ 54
Figure 3.4: PSC Methodology ...................................................................................................... 57
Figure 3.5: Raw PSC Components ............................................................................................... 58
Figure 3.6: Model Design ............................................................................................................. 65
Figure 3.7: Net Profit Calculation ................................................................................................. 67
Figure 3.8: Balance Sheet Calculations ........................................................................................ 67
Figure 3.9: Cash Flow Activities .................................................................................................. 68
Figure 3.10: VFM Quantitative Assessment ................................................................................. 70
Figure 3.11: Procurement Options (Burger and Hawkesworth, 2011) ......................................... 70
Figure 4.1: OPEX Calculations..................................................................................................... 85
Figure 4.2: Sensitivity Chart ......................................................................................................... 90
Figure 4.3: FX Rate Sensitivity Chart........................................................................................... 91
Figure 4.5: PSC Components ...................................................................................................... 101
Figure 4.6: Value for Money Analysis ....................................................................................... 106

x
LIST OF TABLES
Table 2-1 Comparison of the top rank preferred input assumptions (Kurniawan et al. 2015). .... 46
Table 3-1: Macroeconomic Assumptions ..................................................................................... 62
Table 3-2: Funding Assumptions .................................................................................................. 62
Table 3-3: Working Capital Assumptions .................................................................................... 63
Table 3-4: Law 89 Procurement vs. Law 67/2010 PPP Procurement........................................... 72
Table 4-1: Macroeconomic Assumptions ..................................................................................... 78
Table 4-2: Direct Operating Costs Assumptions .......................................................................... 79
Table 4-3: Revenue Assumptions ................................................................................................. 80
Table 4-4: Funding Assumptions .................................................................................................. 80
Table 4-5: Working Capital Assumptions .................................................................................... 81
Table 4-6: Revenue Calculations .................................................................................................. 82
Table 4-7: Model Outputs ............................................................................................................. 88
Table 4-8: Change in Variables .................................................................................................... 89
Table 4-9: Sensitivity Results ....................................................................................................... 89
Table 4-10: FX Rate Sensitivity ................................................................................................... 90
Table 4-11: Financial Models Comparison................................................................................... 91
Table 4-12: Major Maintenance Percentages ............................................................................... 93
Table 4-13: Inflation Rates ........................................................................................................... 94
Table 4-14: Risk Analysis ............................................................................................................. 96
Table 4-15: Risk Adjusted PSC .................................................................................................. 100
Table 4-16: CAPEX Assumptions .............................................................................................. 102
Table 4-17: PPP Price (Risk Adjusted) ....................................................................................... 104
Table 4-18: Cost to Government under Public Procurement - PSC ........................................... 105
Table 4-19: Cost to Government under PPP Procurement - Shadow Bid Model (PPP Price) ... 106
Table 4-20: Value for Money to Government - VFM (EGP mln) .............................................. 106

11
CHAPTER 1 : INTRODUCTION
1.1 Background
Recently the concept of the private financing of infrastructure projects has evolved
worldwide. The government nowadays is not considered the only provider for the public works
or services in the society. The concept of the Public-Private Partnership (PPP) has been recently
recognized as an important contribution for governments in providing infrastructure systems.
These schemes are sometimes referred to as PPP, P3 or P3.
This type of participation offers better quality for the infrastructure projects due to the
efficient management and skills of the private sector, distributing cost over time to the
government, in addition to fair profit of the private sector during the concession period. The
private sector’s expertise, innovation and skills optimize the cost of the project thus provide
value for money to the government. Throughout the concession period, the government retains
control over the delivery of the specified level of service. Thus, the role of the government in this
case becomes only coordination along with the private sector. As a result, managerial and
financial efficiencies are brought into the process (Chan and Cheung, 2014). Various
terminologies are used to describe such private participation, such as Private Finance Initiative
(PFI) and Concession models (i.e. Build-Operate-Transfer (BOT); however PPP is a more
generic term for such long term public private cooperation.
In the Build–Operate–Transfer (BOT) participation, the private sponsor finances, designs,
and builds the project and then operates it for a specified concession period. During this
concession period, the sponsor collects revenues from operating the project to recover its
investment and earn a profit. At the end of the concession period, the ownership of the project is
transferred to the granting authority. However, Private-Finance-Initiative (PFI) is slightly
different from BOT in the sense that the private sponsor collects revenues through periodic
payments by the government over the life of the project. The private sponsor of these kinds of
projects usually consists of a consortium or a joint venture of engineering, construction, and
venture capital firms, where the investment capital may come from commercial banks, insurance
companies or the sale of bonds (Yun, et al. 2009).
The most important reason for adopting PPP participations is the government need. In
many countries, PPP scheme was originally initiated due to financial shortages to deliver public

12
infrastructure and services. In addition to the government need, private sector’s efficiency and
expertise is considered another reason for adopting PPP projects (Chan and Cheung, 2014).
Many researchers and practitioners described the advantages of PPP projects as opposed to
normal procurement methods that lead to the importance of such participations. Some of these
advantages are the transfer of risk, better value for money, more appropriate financial analysis,
and enhanced partnership between the public sector and the private sector (Tang, et al. 2010).
On the other hand, PPP projects are considered somehow complicated due to the long
concession period, inaccurate forecasting of investments and market demands, uncertain
operation ability of the facility and the different stakeholders involved in the process. All these
factors create a lot of risks that should be considered while dealing with these projects (Yun, et
al. 2009). In addition, there are also political risks involved in the PPP participation that results
from the communication with the government. Therefore, proper risk allocation in PPP projects
is considered very essential so that each party can develop a strategy to manage these kinds of
risks to ensure project success.
In addition to risks, financial evaluation of PPP projects is considered another key factor
for the success of such projects. Therefore, for the success of privately funded infrastructure, a
high level of financing skill is required in order to produce a convincing plan that satisfies the
stakeholders involved. Many researchers have attempted to reach an optimal capital structure for
PPP projects in order to decrease the financial risks as much as possible. However, the financial
evaluation of such projects is considered complex and challenging due to the variety of risks and
uncertainties involved; which makes the forecasting of cash flows quite difficult. In PPP
projects, the concessionaire (private sector) undertakes many more risks than any contractor in
any other type of project. PPP projects are generally financed through varying proportions of
debt and equity. Generally operators (private sector) will try to reduce the amount of equity and
increase the amount of debt finance in order to minimize the level of risk exposure. On the other
hand, creditors or lenders will try to raise the amount of equity finance to a secure and decent
level of financial responsibility from the operators. Equity financing typically covers only 10–
30% of total project costs, while debt financing is obtained for the remaining 70–90%. The
debt/equity (D/E) ratios of different projects vary depending on the nature of the project. The
common strategy is to utilize as much debt but only as much as the project cash flows can justify

13
to provide an attractive rate of return to the equity investors. Thus, an appropriate balance
between equity and debt is needed (Schaufelberger and Wipadapisut, 2003).
In addition to the risk allocation and financial evaluation of PPP projects, there are other
factors that contribute to the success of such participations. These factors were not tackled by
many researchers, yet they are considered crucial to the whole PPP process. This study will focus
on these missing parts in literature in order to ensure PPP project success.
1.2 History of PPPs
The concept of PPP started in the 18th century as the private sector began to invest in the
public infrastructure in the European countries such as supplying drinking water to Paris. Later
in the 19th century, there were similar cases such as the Suez Canal in Egypt and the Trans-
Siberian Railway, in addition to canals, turnpikes, and railroads in Europe. However, the
approach of the PPP was widely implemented in the late 90’s (Tang, et al. 2010). In 1997, the
concept of PPP was heavily utilized in England; the private companies have been involved in the
development of facilities including designing, financing, construction, ownership, and/or
operation of a public sector utility or service. However in China, international financial
institutions and foreign firms rather than domestic firms have been involved in the PPP projects.
The most successful PPP project in China was the Laibin B power station in Guangxi in 1997
(Tang, et al. 2010). At the early 2000s, there has been a significant increase in the use of PPPs by
countries such as Australia, France, Germany, Korea and the United Kingdom. In the last
decade, PPPs in the UK constituted approximately 12% of total annual capital expenditure
(Burger and Hawkesworth, 2011). Although governments increasingly use PPPs, these
arrangements still have relatively small component of total public sector investment.
1.3 The Idea behind PPP in Egypt
Governments in both developed and developing countries are turning to private
investments as an alternative source of funding to cover the funding shortages. In Egypt, the
private sector involvement in infrastructure projects provides a new source of investment capital
in addition to the high quality of service to Egyptian citizens. PPPs create a new private sector
facility management market, expand the economy, drive the creation of local long term funding
markets, and stimulate job creation (PPP Central Unit, 2009).

14
The idea behind the PPP participation schemes in Egypt has been introduced since 2004
in order to sustain Egypt’s growth in the field of infrastructure projects. The private sector’s
investment is required, as discussed earlier, to cover the government needs. International
experience shows that 10-30% of infrastructure capital needs could come from the private sector
through PPPs if an appropriate and regulatory framework is established. It is estimated that
Egypt can target 10-15% of its infrastructure needs through PPPs (PPP Central Unit, 2009).
Accordingly later in 2006, the government of Egypt has established the PPP Central Unit within
the Ministry of Finance. The role of the PPP Central Unit is to offer support and expertise,
identify pilot projects together with the line ministry involved, set national guidelines for
implementation, standardize PPP contracts, provide technical/advisory support to the responsible
line ministry and monitor the implementation of PPP projects (PPP Central Unit, 2009).
1.4 Problem Statement
PPP projects have been envisaged as an attraction for investments from both local and
international firms. However, not all PPP projects have been equally successful or have been
utilized in the best way through planning and decision. While PPP projects have been widely
researched on many aspects, not all viewpoints have been tackled. While the interest in the PPP
projects has been growing, the projects require full consideration of all the factors, adequate
structuring and the correct adoption of such factors. The failure to consider all factors that
complete the life cycle of PPPs may lead to the failure of the project.
Many researchers have been directing their focus in the study of PPP projects to the
scope of the financial model and risk allocation, leaving behind vital factors that contribute to the
success of such projects. While the financial model is essential in the PPP projects for both the
private and public sectors, it is just a tool used among other factors to contribute to the successful
implementation of the project. Therefore to ensure the success of a PPP project, all factors have
to be considered, analyzed, and integrated within a framework that demonstrates all theories and
concepts relating to PPP projects. Limited research has presented an integrated framework
approach for the adoption of PPPs. The framework for PPP projects should be conducted both
simultaneously and iteratively for the project to succeed. This integrated framework approach is
depicted through three steps: the technical structure of the project, developing a financial model
15
and finally, designing the procurement strategy of the PPP project. These three steps are the
pillars that indicate the success or failure of any PPP project.
1.5 Research Objective
The objective of this research is to assist the government in the front end process of a
PPP project, while contributing to the general understanding and filling some gaps in the
research and study of such projects. This can be achieved by depicting an integrated framework
approach for government adoption of PPP projects through three main pillars; the technical
structure of the project, financial modeling and finally, structuring the procurement process of
the PPP project. These pillars will be further subdivided into detailed steps that form the
integrated framework.
1.6 Scope of Work
To achieve the above objective, each of the pillars referred to in the section above will be
delineated through the following steps:
1. The first pillar: the technical structuring of the PPP project
a. Identifying, assessing, and allocating risks between the public and the private
sectors.
b. Structuring of the contractual terms that make the project bankable and attractive
to the private sector and lenders.
c. Developing the Public Sector Comparator to determine the go or no go of the
project.
d. The technical structuring of a PPP project shall be applied on case studies for
validation.
2. The second pillar: the financial modeling
a. Developing a financial model template that shall be applied and validated on a
case study to ensure that the template is running properly.
b. Adopting a value for money (VFM) assessment process on a case study both
quantitatively and qualitatively, as VFM is the essential element of the
government decision making on PPPs.
16
3. The third pillar: structuring the procurement process
a. Designing the procurement process based on each project specifications and risk
allocation that will serve the purpose of evaluating and selecting bidders.
b. Describing the weighing criteria for technical and financial offers of PPP project
proposals according to the PPP Central Unit in Egypt and the procurement law 89.
c. The concept of structuring a customized procurement process shall be validated
by a case study.

17
CHAPTER 2 : LITERATURE REVIEW
This section of the study seeks to explore and summarize some of the most common
themes and research findings in relation to PPP projects. Given the topic's increasing popularity
and interest of different entities and governments in the participation of such projects, this review
is not limited to scholarly and academic literature. The review has instead been primarily
directed at input from some of the world's leading institutional authorities, think tanks and
policy-makers. The literature review reveals a number of key findings, which serve as the basis
of this work.
2.1 What is PPP
It is the Public Private Partnerships that aim to finance, design, construct and operate
public sector facilities and services. There are many forms of a partnership between public and
private sectors depending on the political environment, the nature of the assets and the level of
the private sector participation (Laing, et al. 2011). Figure 2.1 shows the existing services and
facilities for both the public and the private sectors.
Figure 2.1: Existing Services and Facilities (Laing, et al. 2011)
Pubic Responsibility Private Responsibility
Build-
Own-
Operate-
Maintain
Design-
Build-
Operate-
Maintain
Build-
Own-
Operate
Design-
Build-
Operate
Design-
Build-
Maintain
Design
-Build
Divestiture Concession Lease Service
Contracts Management
Contracts

18
2.1.1 PPP Definition
PPP is not a defined procurement model with a common understanding across the world;
therefore there are several definitions for such participation. PPP Resource and Research Center
in Kuala Lumpur (Kong, 2007) has provided some definitions for such scheme; some of these
definitions are:
“PPPs are aimed at increasing the efficiency of infrastructure projects by long term
collaboration between the public and the private sector”
“The term PPP refers to forms of cooperation between public authorities and private
sector to ensure the funding, construction, renovation, management and maintenance of
an infrastructure”
“ The long term relationship between the public and private sectors, involving the sharing
of risks and rewards of multi sectors skills, expertise, and finance to deliver desired
policy outcomes”
“PPP is a generic term for the relationships formed between the private sector and public
bodies with the aim of introducing private sector resources and/or expertise in order to
help provide and deliver public sector assets and services. The term PPP is used to
describe a wide variety of arrangements from loose, informal and strategic partnerships to
design build finance and operate (DBFO) type service contracts and formal joint venture
companies”
“A PPP is a partnership between the public and the private sector to deliver a project or
service traditionally provided by the public sector. It recognizes that both sides have
advantages and by allowing each to do what it does best, public services and
infrastructure can be provided in the most efficient manner”.
However, the PPP Central Unit in Egypt located in the ministry of finance and
responsible for regulating all PPP projects (PPP Central Unit, 2009) has defined the PPP projects
as “the long term contractual relationship between the public sector and the private sector for the
purpose of having the private sector deliver a project or service traditionally provided by the
public sector. PPP projects do not minimize the public sector’s responsibility to improve public
services, only the methodology for its provision and procurement is different.” The fundamental
policy of PPPs in Egypt is further explained by the PPP Central Unit to be the use of

19
performance based contracts in which the private sector provides services over a contract
duration and is paid by the public sector, end user or a hybrid of both. Output requirements are
specified by line ministries, while inputs are generally the responsibility of the private sector
partner through providing innovative methods, technology, expertise, and funds to achieve the
output requirements. During the PPP contract, the government retains strategic control on the
service, and allocates project and performance risks to the party best able to handle these risks.
Some of the key risks that are usually transferred to the private sector are design, finance,
construction, and operation risks (PPP Central Unit, 2009).
2.1.2 Different Models of PPP
There are many types of PPP participations that are described in the literature; however
there are some common key features between all the different models of PPP. Some of these
features are:
All participations are long term
The allocation of risk to the party best able to manage this risk
Different forms of long term contracts drawn up between multiple entities and
public authorities
The United Nations classified PPP participations into two broad categories: the
Concession Model and the Private Finance Initiative Model (PFI). Concession models have the
longest history of public private financing and are most associated with PPPs. They are
contractual arrangements whereby a facility is given by the public sector to the private sector
which then operates the PPP for a certain period of time. Concession models are financed by user
fees (user pays) such as in drinking water, gas and electricity, and public transport projects. The
Private Finance Initiative model (PFI) was developed in the UK in 1992, and has now been
adopted by parts of Canada, France, Netherlands, Japan, Australia, the United States, and
Singapore. In contrast to the concession model, PFIs are privately financed contracts for public
facilities and works but are paid by a public authority and not by private users (public sector
pays) such as in public lighting, hospitals, schools, and roads with shallow toll projects (United
Nations Economic Commission, 2008).
The PPP Resource and Research Center in Kuala Lumpur (Kong, 2007) explained four
main types of procurement alternatives depending on the involvement of both public and private

20
parties. Figure 2.2 shows the four project procurement options for both public and private
sectors.
As the public responsibility increases, the Traditional Public Sector Procurement takes
place where the government is the owner, operator, and financier in that case. On the other hand,
as the private sector involvement and responsibility increases, PPP procurement methods start to
take place until it reaches the Build Own Operate procurement (BOO) where the private sector
has full responsibility over the project whereby the private sector is the owner, contractor, and
operator.
The United Nations Economic Commission (United Nations Economic Commission,
2008) described different PPP models that allocate responsibilities and risks between the public
and private partners in different ways. The following terms are commonly used to describe
different types of contract and risk transfer:
Buy-Build-Operate (BBO)
Build-Own-Operate (BOO)
Build-Own-Operate-Transfer (BOOT)
Build-Operate-Transfer (BOT)
Build-Lease-Operate-Transfer (BLOT)
Design-Build-Finance-Operate (DBFO)
Public
Responsibility
Private
Responsibility
Traditional
Public Sector
Procurement
Build-Operate-
Transfer (BOT)
Design-Build-
Finance-Operate
(DBFO)
concession
Build-Own-
Operate (BOO)
Private
Figure 2.2: Project Procurement Options (Kong, 2007)
21
Finance-Only
Operation-and-Maintenance-Contract (O&M)
Design-Build (DB) (not considered as PPP model)
Operation-License
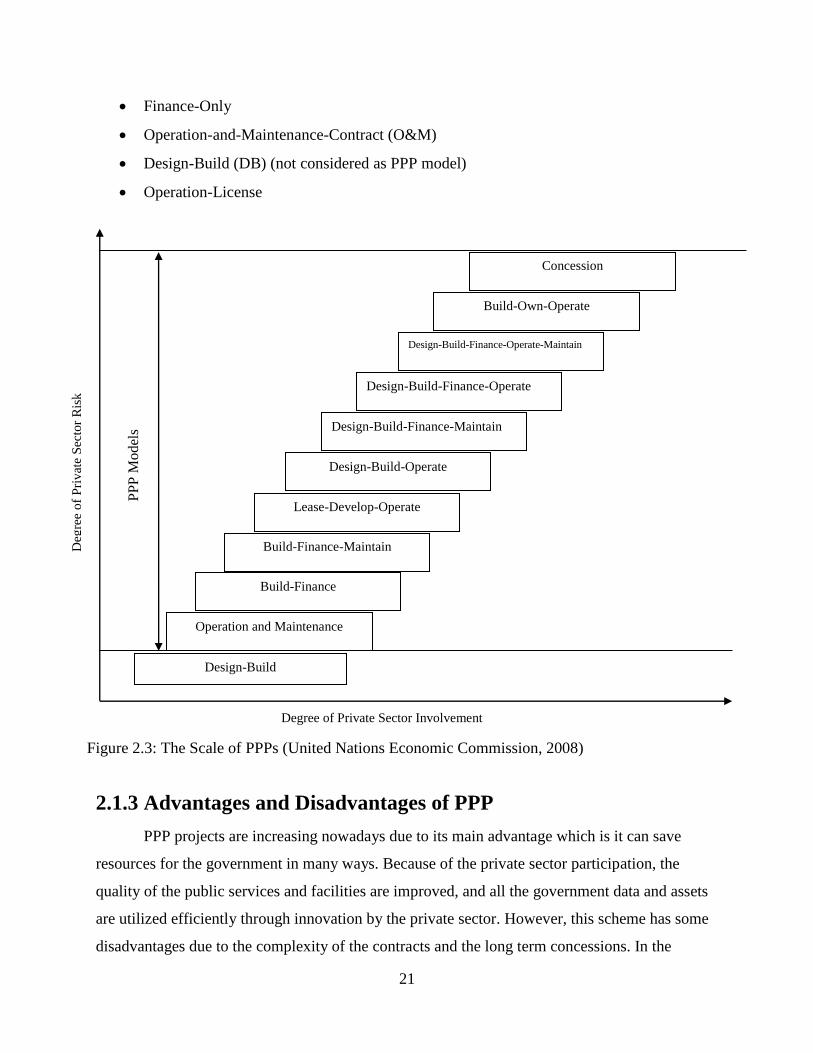
2.1.3 Advantages and Disadvantages of PPP
PPP projects are increasing nowadays due to its main advantage which is it can save
resources for the government in many ways. Because of the private sector participation, the
quality of the public services and facilities are improved, and all the government data and assets
are utilized efficiently through innovation by the private sector. However, this scheme has some
disadvantages due to the complexity of the contracts and the long term concessions. In the
Deg
ree
of
Pri
vat
e S
ecto
r R
isk
Degree of Private Sector Involvement
Concession
Design-Build-Finance-Operate-Maintain
Build-Own-Operate
Design-Build-Finance-Operate
PP
P M
odel
s
Operation and Maintenance
Build-Finance
Build-Finance-Maintain
Lease-Develop-Operate
Design-Build-Operate
Design-Build-Finance-Maintain
Design-Build
Figure 2.3: The Scale of PPPs (United Nations Economic Commission, 2008)

22
literature, the benefits of PPP projects were described according to (Tang et al. 2010), (Li and
Akintoye, 2008), and (Laing et al. 2011) to be as follows:
Increasing the quality of public facilities and services, due to the proper use or
maximization of the private sector’s skills, experience, technology, and innovation.
Public and private sectors can share risks at different stages.
PPP leads to the reduction of lifecycle costs, since these projects spread government
capital investment over the life of a project.
Reduce the time to implement the project.
Facilitate creative and innovative approaches.
Attract larger and more sophisticated bidders to the project.
Bring in private capital and make projects affordable.
Public sector only pays when services are delivered.
Ensures that assets are probably maintained.
However, the disadvantages of such scheme are described in (Tang et al. 2010), (Roehrich et al.
2014), and (Laing et al. 2011) to be as follows:
Cost overruns, unrealistic price and income projections, and legal disputes between
private operators and the government.
Higher capital costs as compared to the traditional government procurement.
Relationship management problems.
Limited competition due to limited number of contractors.
Long term relatively inflexible structures.
Procurement delays and high procurement costs.
Private sector has higher cost of finance.
Does not achieve absolute risk transfer.
2.1.4 Why Should Governments Consider PPP?
As discussed in earlier sections, there are many benefits and advantages to such
participation that make governments consider this type of procurement in many infrastructure
projects. PPP has developed in the first place due to financial shortages in the public sector. It
has demonstrated the ability of the private sector to add financial resources and operating
23
efficiencies into projects. These benefits to the government can be summarized according to (Li
and Akintoye, 2008), (European Commission, 2003), (Kong, 2007), and (Laing, et al. 2011) to
be as follow:
Enhance government’s capacity to develop integrated solutions
Delivering of quality services that provides VFM (whole life costing)
Faster Implementation - the allocation of design and construction responsibility to the
private sector, combined with payments linked to the availability of a service, provides
significant incentives for the private sector to deliver capital projects within shorter
construction timeframes
New options for public sector finances
Generation of additional revenues – the private sector can generate additional revenues
from a third party
Innovation
Good principles of PPP
Substantial risk transfer to the private sector (who does what best)
Whole life costing (balance between construction and maintenance costs)
Maintain value of public asset
VFM (quantitatively and qualitatively)
Performance standards and competition (payments upon delivery – output focus
stating the desired output quality and quantity)
2.1.4.1 Successful Sectors of PPP
PPP projects are most successful in the primary and social infrastructure projects,
although in emerging markets generally limited to primary infrastructures (power, water, and
transportation). However, they are not suitable where technology is likely to change rapidly over
the life of the contract (i.e. IT sector).
Successful PPP sectors in some countries as stated by the United Nations Economic
Commission are as follows (United Nations Economic Commission, 2008):
United Kingdom: schools, hospitals, prisons, defense facilities, and roads
Canada: energy, transport, environment, water, waste, recreation, information
technology, health and education

24
Spain: toll roads and urban regeneration
United States: Projects which combine environmental protection, commercial success,
and rural regeneration.
Greece: transport projects – airports and roads
2.1.5 PPP Success Factors
There are necessary elements in order to achieve successful partnerships in PPP projects.
Professor Cliff Hardcastle a member of the Chartered Institute of Building and the Association of
Cost Engineers and he is currently the Dean of the school of the Built and Natural Environment
at Glasgow Caledonian University has explained some critical success factors for PPP/PFI
projects based on a survey with 16 Public Sector and 45 Private Sector of Directors and
Managers of 21 years of experience (Hardcastle, 2005). This survey concluded that the critical
success factors for a PPP project are:
Strong private consortium
Appropriate risk allocation and risk sharing
Competitive procurement process
Commitment/responsibility of public/private sectors
Realistic cost/benefit assessment
Project technical feasibility
Transparency in the procurement process
Good governance
Favorable legal framework
Available financial market
Political support
Multi-benefit objectives
Government involvement by providing guarantees
Sound economic policy
Stable macro-economic environment
Shared authority between public and private sectors
Social support

25
However, the study concluded that the three top factors that have the most influence on the
success of the project are; the strong private consortium, appropriate risk allocation, and easy
access to financial market (Hardcastle, 2005).
The PPP Central Unit in Egypt (PPP Central Unit, 2009) described four success drivers for
any PPP project based on the experience of the past PPP projects in Egypt. These Drivers are:
1. Standardization: PPP models and documentation that can be easily replicated (feasibility
analysis, risk allocation, RFPs, PPP contracts, etc...)
2. Deal Flow:
a. Quantity – Sufficient scale to validate a PPP strategy
b. Quality – Determine which candidate is appropriate as PPPs, projects must be
clear and bankable
3. Leverage: Create more opportunities to attract new finance using credit enhancements to
reduce sovereign risk.
4. Capacity Building: PPP will not work unless the public sector understands its governance
and oversight responsibilities from the beginning to end.
2.2 PPP in Egypt
PPPs in Egypt provide a new source of investment capital for infrastructure projects, in
addition to the efficiency of the private sector’s management and skill that will lead to a high
quality of the service with the least cost. Throughout a PPP project, the government retains
control over the delivery of the specified level and standard of service (PPP Central Unit, 2009).
2.2.1 PPP Central Unit
The PPP Central Unit (PPPCU) was established in 2006 within the Ministry of Finance.
It acts as the PPP center for support and expertise. The PPPCU is responsible for the
development of the PPP program in Egypt serving the needs of the public sector. Therefore, the
role of the PPPCU can be summarized to be as follows (PPP Central Unit, 2009):
Establish a national PPP policy framework for implementation
Set PPP guidelines and methodologies appropriate to Egypt
Assist the line ministries to identify potential PPP projects as part of line ministries’ five
year strategic plans

26
Draft and issue standard project documents, contracts and PPP laws
Provide technical advisory support to line ministries on project development and
transaction implementation
Monitor project implementation post contract closure
Coordinate PPP program activities among line ministries, private sector partners and
service providers, and the capital funding market
Identify and resolve issues that may delay successful development of Egypt’s PPP
program
Serve as a capacity building center for PPP knowledge and expertise in Egypt
The role of the PPPCU starts from project screening, tendering and procurement, and bid
selection to post award monitoring. Therefore, it works with line ministries closely to implement
PPP projects.
2.2.2 The Start of a PPP Project Starting from the Line Ministry until the
Tendering Process
As shown in figure 2.5, during the screening and approval project phase, PPPCU
provides technical assistance to select bankable projects that meet the needs of the public sector
and are attractive to the private sector (PPP Central Unit, 2009).
Figure 2.4: PPPCU Role (PPP Central Unit, 2009)
External Financial
Advisor
External Legal
Advisor
External Technical
Advisor
PPP Central
Unit
Line Ministries
Lenders
PPP Central
Unit
Lenders
PPP Central
Unit
Service
Providers
Line Ministries
Lenders
PPP Central
Unit
External Legal
Advisor
External Technical
Advisor

27
Figure 2.6 shows the steps once a PPP project is approved by the Ministerial Committee;
it goes to the tendering and monitoring project cycle. The PPPCU at this stage assists awarding
authorities in the selection of service providers and ensures public sector contributions to a PPP
project are optimized and monitored throughout the project life (PPP Central Unit, 2009).
Project included in list of proposed projects
Submission of PPP application to PPP ministerial committee
If approved, included in Line Ministry’s 5 year strategic plan
Line Ministry submits project proposal to PPP Central Unit
Screening by PPP Central Unit
Does Project meet PPP
screening criteria?
Modifications/
updated details
Reject project/
Conventional
procurement
Figure 2.5: The start of a PPP project – Step 1 (PPP Central Unit, 2009)
Project Approved by PPP
Ministerial Committee
Appoint External Financial, Legal, and Technical Advisor
Prepare Contract Award Requirements
Ongoing Monitoring of Project
Tendering Cycle
Tender Submission Evaluation of Sign PPP Implement
PPP Project of Proposals bid proposals Contract Project
Figure 2.6: Approval of PPP project - Step 2 (PPP Central Unit, 2009)

28
2.2.3 PPP Project Life Cycle
This section describes the different PPP project phases in Egypt according to the PPP
Central Unit in Egypt (PPP Central Unit, 2009). Figure 2.7 shows the PPP project lifecycle
starting from phase 1 which is project initiation and screening until the post award and project
monitoring in phase 7. However, the scope of this research will only focus on the first five
phases (from phase 1 up to phase 5: bid selection).
2.2.3.1 Phase 1: Project Initiation & Screening
In this phase, the Line Ministry takes the lead of screening and selecting all of the
projects within their sector. The PPP Central Unit at this stage reviews the PPP project
documentation; however, the final decision whether the project should proceed to Phase 2 or not
is taken by the PPP Ministerial Committee.
2.2.3.2 Phase 2: Business Case
This phase provides an analysis of PPP project feasibility; as well as proposing an
approach to risk allocation by Line Ministries.
2.2.3.3 Phase 3: Risk Assessment, VFM Analysis and PSC
This phase is addressing the Public Sector Comparator (PSC) valuation in addition to the
Value for Money (VFM) assessment for a PPP project; in order to compare PPP option to normal
public procurement. The PSC is an essential component during the bidding process as it enables
the public sector to compare and validate financial alternatives to confirm that PPP project will
have better value for money that the normal public procurement method.
Figure 2.7: The Overall PPP Project Lifecycle (PPP Central Unit, 2009)

29
2.2.3.4 Phase 4: Tendering and Procurement
The Line Ministry together with the PPPCU will perform project tendering and
procurement. PPPCU will review procedures and documents, and in many cases it provides
qualification and tendering documents to the Line Ministry.
2.2.3.5 Phase 5: Bidders Selection
This phase includes opening technical and financial bids, and evaluating those bids in
addition to completing the financial model’s comparative. The PPPCU then reviews the Line
Ministry’s financial model and compares it to the financial models of the bidders which lead to
the selection of the winning bidder.
2.2.3.6 Phase 6: Contract Signature and Financial Closure
The Line Ministry at this stage will sign the final contract with the successful bidder
enabling it to finalize all financial closure agreements with lenders and co-financiers.
2.2.3.7 Phase 7: Post Award PPP Performance Monitoring & Contract Compliance
The Line Ministry at this stage monitors the performance of the private sector during the
project construction and operation.
2.3 The Criteria of a Project to undergo a PPP Participation
Before going through the PPP option, the government and its advisors has to assess the
project against certain criteria to determine whether this procurement method will succeed or not.
These criteria are summarized by the European Investment Bank (EIB) to be the affordability of
the project, the risk allocation and risk sources, the bankability of the project, and the value for
money (European Investment Bank EIB, 2015). However, the assessment of the PPP option will
be dependent on the specific situation of each country, in terms of its legal and institutional
framework.
2.3.1 Project Affordability
Affordability relates to the capacity to pay for constructing, operating, and maintaining
the project; in other words, the capacity of the end users or the government to pay for the
proposed project in order to cover its costs and make profit. An affordability assessment first
estimates the expected operating and maintenance costs of the project, together with the cash

30
flow required to repay the loans and provide a return on investment. The financial and technical
advisers will develop a financial model to estimate capital, operating and maintenance costs,
appropriate cost escalation indices, assumed financing structure and preliminary PPP contract
terms. At this stage, the financial model is developed at a very basic level (European Investment
Bank EIB, 2015).
The assessment of costs includes an estimate of the required revenues to cover those
costs:
“User-Pays PPPs”: In PPPs where users pay directly for the service, the government and
its advisers need to examine the capacity and willingness of users to pay, especially if
tariffs need to be increased from current levels. In many PPPs, the public sector will need
to subsidize the service in order to make it affordable. Thus, the use of public subsidies
can impact the value for money of a PPP arrangement; this will require that the savings
from the PPP option be large enough to compensate for the use of public funds.
“Government Pays PPPs”: In PPPs where the government makes the payments, the
assessment of affordability is a key aspect in deciding on the PPP option. The
government will enter into payment obligations over the life of the PPP contract that is
called “service fee”, which represent long-term commitments (European Investment
Bank EIB, 2015).
Thus, a PPP project is considered to be affordable if the present value of the expected future
revenues of government equals or exceeds the present value of expected future capital and
current expenditure of government, in other words, the net present value of the project yields a
positive value (Burger, 2008).
2.3.2 Risk Analysis
Risks are crucial issue in PPP projects; in fact many PPP projects fail because the parties
cannot agree on the allocation of risk. Considering the PPP option depends on the ability to
identify, analyze and allocate project risks adequately. The failure to do so will have financial
implications for the public sector. Therefore, in addition to assessing the sources of revenue
linked with the affordability of the project, the government needs to assess and identify all risks
associated with the project in order to manage them in a risk matrix form. Fig 2.8 shows the
process of risk management, and it usually continues with the lifetime of the PPP process.

31
The risk management process takes place in five stages:
i. Risk Identification: It is the process of identifying all the risks relevant to the project,
during its construction and operational phase (European Investment Bank, 2015). Risk
identification can be done by using a checklist or risk prompts. However, some new risks
cannot be found in checklists, therefore, checklists should be used with caution.
Sometimes organizations or consortia apply the 80-20 principle, in which 20% of the key
risks must be identified and addressed. The effect of these key risks account for 80% of
the cost and time implications of the entire risks. Risks can also be identified through real
time practice, together with the use of personal and corporate experience; safety reviews;
intuitive insights; brainstorming; site visits; the use of organizational charts; the use of
flow charts; research, interviews and surveys; analysis of assumptions; and consultation
of experts (Chinyio and Fergusson, 2008). The authors Shen and Chan conducted a study
about identifying and allocating the most critical risk factors in PPP projects through a
comprehensive literature review (Shen et al. 2006) and (Chan et al. 2011). Furthermore,
Xu, Yeung, et al in the Southeast University in China developed a study on the critical
risk factors in Highway PPP projects in China. They identified risks through a
questionnaire survey in addition to literature (Xu et al. 2010).
ii. Risk Assessment: It is the process of determining the likelihood (probability) of identified
risks materializing and the magnitude of their consequences (their impact on the project)
(European Investment Bank EIB, 2015). An accurate risk assessment will enable the
private consortium to decide on a course of action. It also helps the private consortium to
price its bid more competitively. Therefore, the private sector is heavily involved in the
risk identification and assessment processes (Chinyio and Fergusson, 2008). An
Risk
identification/
comprehension
Seek for
risk-
mitigating
solutions
Appraise
new or
residual
risks
Evaluate
or price
risks
Risk
monitoring
and control
Figure 2.8: Illustration of Risk Management Process (Chinyio and Fergusson, 2008)
32
assessment could be qualitative, quantitative or somewhere in between. The risk
assessment classification is as follows:
a. Qualitative: It is employed in the absence of information (uncertainty), in which
both probability and impact of risk are assessed subjectively (Chinyio and
Fergusson, 2008).
b. Semi-quantitative: It is employed when the impact of risk can be established
accurately, in which probability assessed subjectively but impact assessed
objectively (Chinyio and Fergusson, 2008).
c. Full quantitative: It is employed when information is available, in which both
probability and impact assessed objectively (Chinyio and Fergusson, 2008).
Moreover, different organizations use different strategies for assessing risks, some of
these strategies are: assess every risk as it is; assess every risk but model the price via
probabilities; assess only the main risks; benchmarking; negotiation in risk evaluation;
reactive risk assessment; pro-active risk assessment; and sensitivity analysis (Chinyio and
Fergusson, 2008).
iii. Risk Allocation: The concept of risk allocation in PPPs is relatively straightforward; risks
should be allocated to the party best able to handle them. In other words, the party that is
best able to understand a risk, control the likelihood of that risk and/or minimize the
impact of that risk should also be responsible for managing it. When the party that
manages the risk also bears its financial cost, it will face incentives to mitigate the risk.
Therefore, risk allocation based on these principles is assumed to generate the most
efficient risk allocation, the lowest costs to the project and the greatest value for money
(Hovy, 2015). Ke, Wang, and et in the Tsinghua University, Beijing in China conducted a
survey with experienced practitioners to identify the preference of risk allocation in
China's PPP projects. The results showed that the public sector would take all risks
related to government or government officials and their actions. As for the private sector,
they would take the responsibility for all risks at the project level. Risks identified that
neither the government nor the private sector could handle alone; it was recommended to
be shared equally between both (Ke, et al. 2010). The study of Shen concluded some risk
allocation that could be used for all researchers and practitioners in all countries. It stated
that the allocation of site acquisition risk, legal and policy risks to the public sector is

33
more effective, while allocate the design, construction, and operation risks to the private.
It was concluded that development risks, market risks, financial risks and force majeure
could be shared effectively between the two sectors (Shen, et al. 2006).
iv. Risk Mitigation: It is the process of attempting to reduce the likelihood of the risk
occurring and the degree of its consequences for the risk-taker (European Investment
Bank EIB, 2015). Risk mitigation involves finding solutions to counter risks. It should
continue throughout the life of the project, as new solutions can emerge that will change
previous actions (Chinyio and Fergusson, 2008). Darinka Asenova and Matthias Beck
provide an investigation of the risk management practices in PPP projects in the book of
“Public Private Partnerships: Managing Risks and Opportunities” and they explained that
the risk mitigation strategy for all parties are very similar. Parties tend to manage the
risks by seeking to mitigate them contractually. Therefore, the most important risks are
mitigated upfront (Asenova and Beck, 2008). There are four general risk mitigation
strategies according to (Chinyio and Fergusson, 2008):
a. Risk Elimination: actions to avoid the risk can lead to the complete elimination of
the risk.
b. Risk Reduction: actions that could be taken to minimize some risks such as
redesigning of facilities to minimize health and safety risks. Risks can be reduced
by acquiring more information.
c. Risk Transference: some risks can be transferred to other parties whenever
possible. Some risks can be transferred through the use of insurance and
performance bonds. Private sector consortium usually transfers the construction
Figure 2.9: Risk Allocation vs project efficieny and total cost (Zou, et al. 2008)

34
tasks and risks to a distinct construction company. Similarly, the facilities
management risks will be transferred to specialist service provider. Lenders do
not want the SPV to bear significant risks. If inflation were to rise, the lenders
would want to be satisfied that the project would not be aborted. Therefore, the
private consortium transfers many risks and tasks to different experts who can
handle them better depending on the requirements of each project.
d. Risk Retention: it is also known as risk absorption and risk pooling. After
reducing the potential impact of risks, those that cannot be eliminated or
transferred away are absorbed by the organization. Retention risks are usually
those with minimal consequences. Another criterion that influences organizations
to accept risks is their ability to control those risks.
There are also some risk mitigation tools that can be applied in addition to the
aforementioned strategies. These tools are more well-known in the financial sector.
Some of these tools are guarantees, ‘letter of credit’ (LOC), bid bonds, performance
bonds, surety bonds, insurance, risk premium, and risk adjusted discount rate (Chinyio
and Fergusson, 2008).
v. Risk monitoring and review: It is the process of monitoring and reviewing identified
risks, and managing new risks as the PPP project develops and its environment changes.
This process continues during the life of the PPP contract (European Investment Bank,
2015). Decisions reached regarding each risk are documented, and the records are used in
monitoring the risks throughout the life of a project (Chinyio and Fergusson, 2008).
The following figure 2.10 illustrates the whole risk analysis process during the different project
stages (feasibility study stage, bidding and negotiation stage, and during the construction and
operation stages).

35
Figure 2.10: Risk Analysis Process (Zou, et al. 2008)

36
2.3.3 Bankability of the Project
Another important aspect for the government to decide whether the project at hand
should be carried out by the PPP participation scheme or not is the bankability of the project; in
other words, the appetite of the lenders to finance the project. A PPP project is considered to be
bankable if lenders are willing to finance it. The majority of PPP projects are funded on a project
finance basis where a special purpose vehicle (SPV) is established to be responsible for the
project revenues and debt liabilities. The funding of PPPs is usually a long term debt which
varies from 70% to 90% of the total funding requirement depending on the risks of the project.
Lenders look to the cash flow of the project as the principal source of security (European
Investment Bank EIB, 2015).
Banks or lenders have to examine some issues first before deciding on the finance of the
PPP project in order to recover the debt owed to them by the private sector consortia. Issues they
often examine include (Chinyio and Fergusson, 2008):
The type and capability of employees who will run the project
Assessing that the proceeds from the business will be channeled to an account that
is tightly regulated
Ensuring that sponsors are forced to contribute equity into the project
Assessing the risk factors that affect the project
Checking that the independent expert opinions have been required on different
aspects of the project
However, the fundamental issue used by banks was explained by Hassan Ibrahim El
Fathali in a study at the Concordia University in Canada about the private partner selection and
the bankability assessment of PPP projects (El Fathali, 2015). He discussed the measures by
which lenders assess PPP projects to decide upon their bankability. This fundamental issue was
explained to be the cash flow available for debt service (CFADS), which was also termed the
free cash flow to the firm. First, the potential feasibility of the project must be proven and
presented to the lenders with the approval of external advisors and consultants. Second, an
analysis of all the risks is prepared, along with a description of the methods for mitigating the
effects of those risks. The project should also detail the allocation of risk to all the contractual
partners involved in the project (El Fathali, 2015).

37
According to the European Investment Bank (EIB), in order to finance a PPP project, it
has to follow the same EU and EIB rules as public-procurement projects. In some cases the
private sector also had to follow EU procurement rules for sub-contracts (Thomson and
Goodwill, 2005).
2.3.4 Value for Money (VFM)
Value for Money (VFM) is the core concept of PPP projects. The VFM aspect of a
project and the comparison between PPP projects and the conventional procurement method in
public assets are the essential elements of the government decision making process on PPPs. A
PPP project yields value for money if it results in a net positive gain to society which is greater
than which could be achieved through any alternative procurement method. It is defined as the
effective use of public funds on a capital project that can come from the private sector’s
innovation and skills in the design, construction and operational practices; and also from
transferring major risks in design, construction delays, cost overruns and finance to the private
sector (Zou et al. 2008). VFM is obtained by the comparison between the PPP financial model
and the Public Sector Comparator (PSC). PSC is a model of costs incurred by the government
through conventional procurement method, including risks during the lifecycle of the project as
costs. The achievement of the VFM depends on appropriate risk allocation process, together with
the ability of the private party to manage risks transferred to it and how the public sector
manages the long duration contract (Zou et al. 2008).
The European Investment Bank (European Investment Bank EIB, 2015) describes that a
PPP project will provide value for money when all or most of the following conditions are met:
The private sector has the expertise to design and implement complex projects;
The public sector has the ability to define output specifications that can be written into
the PPP contract ensuring effectiveness of the service;
Proper risk allocation between the public and private sectors;
It is possible to estimate the long-term costs of providing the assets and services
involved;
The project value is sufficiently larger than the procurement costs; and
The technological aspects of the project are stable (i.e. PPPs are not suitable for IT
projects) (European Investment Bank, 2015).
38
2.3.4.1 VFM Tests
The VFM test is a new terminology for the traditional cost-benefit analysis that has been
used by governments for decades to determine whether the public sector should or should not
undertake a project. While there are many possible value-for-money tests, they can be grouped
into four broad categories. The four general models for VFM tests are described by Paul A.
Grout in the EIB report 2005 about “Value-for-money measurement in public-private
partnerships”, which are:
Test 1: performing a full cost-benefit analysis
This approach seeks to identify the net benefits of each possible option. The option with
the highest net benefit is undertaken. PPP approach will be chosen if the net present value of the
project is greater than the present value of the public sector conventional procurement. A full
cost-benefit approach requires identifying all prices for project inputs and outputs. This approach
can be used later in the selection process between different private consortia (Grout, 2005).
Test 2: assessing the cost of service delivery to the government
This approach is the total opposite of a full cost-benefit study. Whereas, a full cost-
benefit study aims at assessing the benefits and costs of all possible impacts on the economy, this
approach aims at minimizing the cost of delivery for government. In other words, this test
compares the cost to the government of traditional public sector procurement with the cost to the
government of conducting the project as PPP (Grout, 2005).
Test 3: comparing private alternatives
This test is conducted in the selection process of the private bidders. This VFM test
focuses on the quality of the bidding process and the ability to correctly identify and value
deviations in service quality between bidders. The value for money is present if the differences in
the service quality of all potential bidders are corrected and identified, thus the bidder with the
lowest cost is chosen (Grout, 2005).
Test 4: confirming the viability of the chosen project
This test focuses only on the viability of the specific project that has been chosen. In this
case value for money exists if the project delivers a positive net present value (Grout, 2005).

39
The VFM tests show that there are two kinds of tests; the full cost-benefit tests and the
simpler more focused tests such as simple comparisons of private alternatives. The cost-benefit
test has quite large level of uncertainty; however, the simple comparisons of private alternatives
test is very focused and accurate but assumes that part of the decision making process has
already been made. This implies that it may be inappropriate to try to identify a unique VFM test
that should be used in all situations. The tests identify and categorize many types of specific
project risks. This categorization is very useful in the analysis and pricing of these risks and is
also used to ensure that all risks are considered (Grout, 2005).
2.3.4.2 VFM Evaluation Criteria
There are two ultimate goals in conducting VFM assessment of PPP projects. The first
goal is to determine whether a project delivers VFM to stakeholders. The second goal is to assess
potential bidders that can significantly contribute VFM to the projects. A study was conducted in
Malaysia in the postgraduate studies center in the Faculty of Architecture Planning and
Surveying, in the Universiti Teknologi MARA (Ismail et al. 2011) in order to determine the
perception of both public and private sectors of PPP stakeholders in evaluating the VFM criteria
involved in PPP bids. The data was collected from 216 target respondents which were comprised
of top management levels of contractors, consultants and governments’ officers. They were
chosen as they were the key stakeholders in PPP projects. The study yielded 6 criteria, the
government and the consultants identified all of them as “very critical”; however the contractors
identified only 4 as “very critical”. These six criteria are: optimum whole life cost, innovation, fit
for purpose, comprehensive specification, compliance on time, and appropriate risk allocation.
The optimum whole life cost is believed to be the most critical criterion in VFM evaluation of
PPP bids, as it is the core concept of PPP procurement. All respondents (government, consultants
and contractors) agreed that this criterion is the most important. Since PPP is a form of
procurement that involves an integration of finance, design, construction and operation; thus, the
understanding of the concept of whole life cost is very important in order to achieve VFM.
Therefore, PPP projects should be assessed over the entire whole life cost of a project throughout
the concession period.
The second critical criterion is innovation. The study showed that contractors rated
innovation as very important in the evaluation of VFM of PPP bids. This indicates that
contractors believed that in order to win the PPP bids, it is important for them to offer innovative
40
solutions in their proposals to achieve the outputs specified by the government. The third critical
criterion is fit for purpose, both government and consultants believe that that the achievement of
VFM should be assessed from the perspective of quality and should comply with building
functionality (fit for purpose). The fourth critical criterion is comprehensive specification; the
study showed that government and consultants are more aware on the comprehensive
specification of the proposed projects compared to contractors. The reason for that is they are
more concerned with the project outputs. The compliance on time and appropriate risk allocation
criteria are ranked in the fifth and sixth places. This was explained in the study by the fact that
the respondents are more cost- quality oriented rather than the configuration of these factors
(Ismail et al 2011).
2.4 PPP Project Viability “Private Sector Point of View”
The authors Salman in the Zagazig University in Egypt and Li and Akintoye in the
Glasgow Caledonian University in the UK (Salman et al. 2007) (Li et al. 2005) discussed the
attractiveness and viability of PPP projects from the private sector’s perspective. The studies
yielded three broad categories for decision factors for the viability of a PPP project. These
categories are; legal and environmental, financial and commercial, and technical aspects.
However, Expert respondents to questionnaires used in the researches indicate the financial and
commercial category of project viability factors as the most important, the legal and
environmental category somewhat less important, while technical aspects being the least
important.
The financial and commercial category has ten sub-factors; some of these factors are
acceptable tariff level, forecast of future demand, reasonable high debt/equity ratio, and
reasonable return on investment (project is fundable if IRR is sufficiently high). The legal and
environmental factors include four sub-factors; while, the technical category has six sub-factors.
In order for the PPP project to be attractive to private sector, the design guidelines for the project
should be flexible and adaptable to change to accommodate any design errors or future growth.
In addition, the technical design of the project should be simple and functional to satisfy the
government and conform to user’s expectations. This will save a considerable amount of time
and construction cost and will make the technical proposal highly attractive to the government.
The private sector should assess the availability of construction materials, operating equipment,

41
skilled labor, etc, and the other resources need to be imported before starting to bid for the
project. Innovation is another aspect to be considered by the private sector for PPP project
viability as it offers both the public client and the private contractor more freedom to select
innovative methods in the provision of assets and services. This leads to time saving by
accelerating project development and by avoiding delays in project delivery (Salman et al. 2007)
and (Li et al. 2005).
2.5 Financial Models of PPP projects
The financial model is a tool for evaluating a new project and facilitating negotiations
among lenders, sponsors and the government. In PPP projects, the private sector (or sponsor)
composes a special purpose vehicle (SPV) or a concessionaire company to deal with the lenders,
investors, insurance providers, contractors, and the government. A successful PPP project has
mutual agreement and balance risk sharing between the government and the private sector prior
to financial close (Kurniawan et al. 2015). The financial model is needed by the investors and
lenders to assess the cash flows under different scenarios throughout the life of the project. It is
also needed to evaluate Value for Money (VFM) as opposed to the normal public procurement
method (Macgillivray, 2010). The project developers are more concerned with the project’s
resulting internal rate of return (IRR). However, the lenders are concerned more on: (a) Projected
revenues, operating expenses, Cash Available for Debt Service (CADS); and (b) Realistic
estimates of future project revenues are sufficient to cover operating expenses and repay project
debt with an acceptable margin of safety. Financial models are developed by a financial advisor
that is assigned by both or either the government and/or the SPV company (Kurniawan et al.
2015).
2.5.1 Financial Model Usages
According to Chang and Chen the financial model assist the government in the
negotiation process with the sponsors (Chang and Chen, 2001). Therefore, the financial model is
used in five stages in the PPP project with different purposes. These stages are the pre-proposal
stage, contract negotiation stage, finance-raising stage, construction stage, and operation stage
(Kurniawan et al. 2015). Altin Turhani and Fredy Kurniawan described in their studies the
different uses of a financial model by the different stakeholders involved.

42
Firstly, the government uses the model in the initial feasibility stage (pre-proposal stage).
A shadow financial model will attempt to predict the bidder’s costs, finance structure, and other
assumptions and the outcome is the service fees. The government also uses the model in
structuring the bidders’ financing and reviewing the benefits of different financial terms and
arrangements (calculating the service fees to cover capital expenditures CAPEX, operating
expenditures OPEX, debt service, and the investors return). This stage is the main focus of this
research, thus a shadow financial model will be developed later to complete the integrated
framework approach. The financial model is also used by the government later in the bidding and
contract negotiation stage to evaluate the competitive bidders’ proposal. Finally during the
operation phase, the government could use the financial model to evaluate new tariff pricing
(Kurniawan et al. 2015) (Turhani, 2012).
Secondly, the project sponsor uses the model as a budgeting tool in the pre-proposal stage
in order to facilitate the submission of proposal. During the bidding and contract negotiation
stage it is used to negotiate the risk sharing mechanism and capital structure of the project with
other potential bidders, lenders, and the government. It is used in the construction stage to
monitor and track the performance of the project. During the operation phase, it is used to
calculate and refinance gain to be shared between the government and the project company
(Kurniawan et al. 2015) (Turhani, 2012).
Thirdly, financial models are used by lenders in the finance raising stage in order to test
the project’s financial viability and review their continuing risk exposure. During the
construction stage, lenders maintain the financial model and monitor the costs of the project.
Finally in the operation phase, lenders review the impact of the annual operations budget
submitted by the project sponsor to lenders (Kurniawan et al. 2015) (Turhani, 2012).
2.5.2 Data Collection
The financial advisor depends on other parties to collect data for the model. The
government provides policy initiatives data such as fiscal incentives scheme, retained
responsibilities for the delivery of core services, governmental loan guarantee, royalty, tariff cap,
etc. The SPV Company provides initial cost of the project and its management cost. The
Engineering, Procurement and Construction (EPC) Contractor provides construction cost and
also Life Cycle Cost (LCC) on a monthly basis. Operation and maintenance costs data are

43
provided by the operator company or facilities management contractor. The lenders will provide
financial information related to the project financing. These inputs are adjusted in coordination
and negotiation with the parties who provide the data. The financial advisor assembles all project
costs estimation, and feeds them into model together with adjustments to the forecasted traffic
volume and variable rates (Kurniawan et al. 2015).
2.5.4 Design of the Model
The design of the financial model should be as flexible as possible, so that it can allow
for changes in the start date, the construction schedule, the design, the capital and operating
costs. The model should have separate sheets for input and output with color coding to help the
user to understand which figures are inputs and which are calculated. Technical conversions are
very crucial issue to the model (McGillivray, 2010). The structure of a financial model will
depend on its purpose and use (Swan, 2008). Typically, a financial model is arranged in a
spreadsheet with different worksheets. The architecture of a typical financial model is illustrated
as shown in fig 2.11 by Khan and Parra in their book about “Financing Large Projects” showing
the standard parts or worksheets of a financial model (Khan and Parra, 2003). This design is
adopted later in this research in the design of the financial model template. The standard
worksheet consists of three categories which are: (1) Input Worksheet, (2) Calculation
Worksheet, and (3) Output Worksheet.
Figure 2.11: Architecture of a financial model (Khan and Parra, 2003)

44
Input Worksheets: These worksheets contain most of the user various assumptions that feed into
the rest of the model which are derived from the project documents or from other relevant
sources. Usually nothing is calculated in the input sheet; and they are designed to allow the users
to change the numbers used in the model, but not the formulas (Khan and Parra, 2003).
Calculation Worksheets: These worksheets are the most important part of a financial model; they
contain calculations regarding projections such as inflation and exchange rate indices, calculation
of interest during construction, computation of tariff, calculation of operation and maintenance
expenses, etc (Khan and Parra, 2003).
Output Worksheets: Readers get an overall summary from this worksheet. The Output worksheet
includes pro forma financial statements (e.g. income statement, balance sheet and cash flow
statement), and key ratios such as debt service coverage ratio (DSCR), net present value (NPV),
interest rate of return (IRR) and return on equity (ROE) (Khan and Parra, 2003).
2.5.4.1 Design Approaches
Fredy Kurniawan in his study (Kurniawan et al. 2015) about financial models discussed
two methods of developing a financial model. The two methods are the bottom-up and the top-
down approaches. He explained that the majority of the financial modelers adopt the bottom-up
approach; whereby the input identification of the raw data along with basic calculations is a
priority. However, he discussed that a good financial model is done by starting with designing
the output first and then identifying the output rather than the input. This approach is the top-
down approach (Kurniawan et al. 2015). Depending on the PPP project’s nature that outputs are
defined prior to inputs, the top-down design approach will be adopted in this research.
2.5.4.2 Model Inputs and Outputs
The financial model inputs and outputs are described by John McGillivray and Altin
Turhani. The model inputs are divided into four main categories: macroeconomic assumptions
(such as interest rates and interest), capital expenditure (CAPEX), operating and maintenance
costs (OPEX), and revenues. The CAPEX of the project takes into account costs incurred during
the bidding, development, and construction phases of the project, it includes: bidding and
development cost, project company costs, construction subcontract price, working capital
(current assets and liabilities; the initial costs that the project company has to incur until it
receives its first revenues), reserve accounts, interests during construction (IDC) and funding

45
drawdown (get the right balance of debt and equity), and contingency. OPEX is deducted from
projected revenues to calculate the cash flow available for debt service (CADS), it includes: the
project company’s own direct costs, subcontract payments, insurance, and taxation. However,
maintenance costs are the largest part of the operating costs, it includes: lifecycle costs, routine
maintenance, and major maintenance. Finally the revenues should cover OPEX, fit within the
envelope of the public authority requirement, meet lender debt services and other requirements,
and give the investors their required rate of return.
The outputs of the model typically include the following: CAPEX, drawdown of equity,
drawdown of debt, service fees, other operating revenues, OPEX, interest calculations, tax, debt
repayments, income statement, balance sheet, cash flow (source and use of funds), lenders cover
ratios, investors returns, and NPV (Net Presented Value) of these payments to enable the public
authority to compare bids (McGillivray, 2010) (Turhani, 2012).
2.5.4.3 Sensitivities
The financial model flexibility allows both investors and lenders to calculate a series of
sensitivities (also known as cases) which show the effects of variations in the key input
assumptions (Turhani, 2012). This calculation of several different events is also called “scenario
analysis”. Sensitivities include calculating the effect on cover ratios and equity IRR due to:
construction cost overrun, delay in completion, deduction or penalties for failure to meet
availability or service requirements, reduced usage of the project, higher OPEX and maintenance
costs, higher interest rates, and changes in inflation (Turhani, 2012).
2.5.5 Stakeholders’ Preference on Financial Indicators
According to the study of Fredy Kurniawan (Kurniawan et al. 2015), he concluded the most
important variables of the financial model according to the different stakeholders involved. He
presented the stakeholders’preference on input assumptions and output indicators as illustrated in
the following table (2-1).

46
Table 2-1 Comparison of the top rank preferred input assumptions (Kurniawan et al. 2015).
Stakeholder Input Assumptions
Top 5
Financial Model Outputs
Top Rank
Rank
Sponsors
Project costs IRR 1
Volume/Demand Net cash flow 2
Revenue forecast EBITDA 3
Operating cost CADS 3
Loan repayment schedule Loan Life Coverage Ratio LLCR 3
Financing cost Interest covering ratio 3
Authority
Volume/demand IRR 1
Operating cost NPV 2
Maintenance cost Revenue 2
Project timelines Operating cost 2
Revenue forecast DSCR 3
Lender
Volume/demand IRR 1
Project costs DSCR 2
Revenue forecast CADS 2
Operating cost Net cash flow 2
Interest and fees LLCR 2
Revenue 2
ROE 2
Consultant
Project costs DSCR 1
Volume/demand CADS 2
Revenue forecast LLCR 2
Capital structure Net cash flow 3
Operating cost IRR 4
Loan repayment schedule 4
2.6 Public Sector Comparator (PSC)
The Public Sector Comparator (PSC) is the assessment of whether a PPP procurement
option offers VFM or not. The VFM is obtained by comparing the cost of the proposed PPP with
the cost of public sector undertaking the project with the required output specifications and risk
allocation stated in the contract. The PSC is an estimate of the Net Present Cost (NPC) to
government if the project were delivered under a traditional procurement method. It is based on
life-cycle costing, the most recent public sector delivery of similar projects, and it is risk adjusted
(Melbourne Partnerships Victoria, 2001) (Government of Western Australia, 2011).
Cruz and Marques in their book about “Infrastructure Public-Private Partnerships” (Cruz
and Marques, 2013) defined the PSC to be “a theoretical calculation of the total costs for the
public sector of developing and operating an infrastructure and/or service. It is basically the sum
47
of cash-flows (including CAPEX and OPEX) for a pre-determined duration, incorporating the
efficiency gains arising from the manager learning curve and the retained risk, assuming a public
management model”. The PSC takes also into account the revenues whether direct or indirect.
The direct revenues are those coming from user charges (such as tariffs, tolls, etc.), while
indirect revenues are related to third party revenues (such as parking tickets, rentals, advertising,
etc) (Cruz and Marques, 2013).
2.6.1 Purpose of PSC
The Australian Government (Australian Government, 2013) stated that the main purpose
of the PSC is to provide governments with a quantitative measure of the value for money it can
expect from a private sector proposal to deliver the output specification compared to public
sector delivery. According to Cruz and Marques the purpose of the PSC is to provide a tool for
the decision making process of the procurement model (Australian Government, 2013) (Cruz and
Marques, 2013).
Partnerships Victoria discussed the several roles of the PSC to be as follows: promotes
full cost pricing at an early stage in the procurement process; acts as a management tool during
the procurement and assists the government to manage the process by focusing on the output
specification, risk allocation, and development of a comprehensive costing of the project;
demonstrates value for money; and provides a consistent benchmark and an evaluation tool
(Melbourne Partnerships Victoria, 2001) (Partnerships Victoria, 2003).
2.6.2 Components of PSC
The PSC is a valuation of the life-cycle costs of the project, in addition to risks associated
with that project. Therefore, the PSC core elements were identified in literature to be Raw PSC
(base costing), Competitive Neutrality, Transferable Risk, and Retained Risk (Kerali, 2006)
(Cruz and Marques, 2013). The PSC and its components are adopted in this research at the first
pillar of the integrated framework approach.
The raw PSC which is the base costing accounts for all life-cycle costs of the
infrastructure and/or service. The cash-flow is then discounted, and the sum of all cash-flow for
the entire duration represents the raw PSC. In other words, it is the expected capital and
operating costs both direct and indirect associated with building, owing, maintaining, and
delivering the service over the same period and output specifications specified to private sector

48
before any risks are taken into account (Cruz and Marques, 2013) (Melbourne Partnerships
Victoria, 2001) (Australian Government, 2013).
Competitive Neutrality corrects the PSC from biases due to public ownership and
management such as taxes, stamp duty, construction permits or environmental permits. This
allows a fair assessment between PSC and bidders (Cruz and Marques, 2013) (Melbourne
Partnerships Victoria, 2001) (Australian Government, 2013).
Transferable risks are those risks that fall under the private sector responsibility in the
PPP model such as construction, availability or demand risks. The estimated value of the
transferred risk should be added to the raw PSC to reflect the full risk adjusted expected cost to
government of delivering the project (Cruz and Marques, 2013) (Melbourne Partnerships
Victoria, 2001).
Finally, retained risks are those risks that even in the PPP model are managed by the
public sector. Any risk not to be transferred to a bidder is considered retained by the government.
The cost of the retained risk should be included in the PSC to provide the full cost to
government. Its value is needed to be added to the private sector’s bids to allow for a meaningful
comparison (Cruz and Marques, 2013) (Melbourne Partnerships Victoria, 2001).
2.6.3 PSC and the Procurement Process
Partnerships Victoria described the procurement process as eight stages which are: (1)
establish need, (2) option appraisal, (3) business case, (4) project development, (5) bidding
process, (6) project finalization review, (7) final negotiations/contract awarded, and (8) contract
management. The PSC is used in stage 2 as initial costing of the partnerships option, while at
stage 4 the detailed costs of the PSC is developed and finalized. At stage 5 and 7 the PSC is used
as a test of the VFM in the bid evaluation process (Melbourne Partnerships Victoria, 2001)
(Partnerships Victoria, 2003).

49
2.6.4 PSC and Bid Evaluation
Figure 2.12: Bid Evaluation (Melbourne Partnerships Victoria, 2001)
The above figure describes the bid evaluation process against the public sector
comparator in order to obtain the value for money for the project. As shown in the figure, bid 1
would be selected against the PSC as it has less cost thus provides value for money to the
government. On the other hand bid 2 would not be selected over PSC assuming that there is no
private bid lower than bid 2 (bid 1 does not exist in this case) then the public sector delivery
method would be preferred (Melbourne Partnerships Victoria, 2001).
2.7 Hypotheses
The literature review conducted in this study has suggested a number of hypotheses all of
which have served as the basis for the development of the integrated framework approach:
PPP is not a defined procurement model with a common understanding across the world
PPP has many forms depending on the political environment, the nature of the assets and
the level of the private sector participation
PPP projects in Egypt provide a new source of investment capital for infrastructure
projects in addition to the high quality of the service to the Egyptian citizen
Retained Risk Retained Risk Retained Risk
Raw PSC
NPC of service payments
NPC of service payments
Competitive Neutrality
Transferrable Risk
PSC Bid 1 Bid 2
Expected Cost
Procurement Option
50
Considering the PPP option depends on the legal and institutional framework of each
country
Risks are a crucial issue in PPP projects; many PPP projects fail because the parties
cannot agree on the allocation of risk
Value for Money (VFM) is the core concept of PPP projects
Financial and commercial aspects are the most important aspects in the attractiveness of a
PPP project from the private sector’s perspective
The financial model is a tool for evaluating a PPP project and for facilitating negotiations
among lenders, sponsors and the government
The Public Sector Comparator (PSC) is a tool for the decision making process of the
procurement model by the government
The financial model together with the PSC are needed by the government to evaluate the
VFM of a PPP project as opposed to the normal public procurement.

51
CHAPTER 3 : RESEARCH METHODOLOGY
3.1 Introduction
The aim of this study is to depict from the existing practice an integrated framework
approach for the front-end process of PPP projects in Egypt. The framework is derived from two
methods; firstly findings from the literature survey that lead to the development of various steps
that consists the integrated framework approach. However, due to the fact that there are some
gaps in research and in the study of such projects, and there is limited research about integrated
framework approach presented or explained in literature, the framework steps were further
developed by information obtained from the PPP Central Unit in Egypt, their advisors (such as
International Finance Corporation “IFC”), and contractors (such as Orascom Construction) in
order to develop the detailed process.
The framework’s methodology is divided into three main parts. These parts are the pillars
of the integrated framework approach of PPP projects. The first pillar is the initial assessment of
the proposed project. The initial assessment includes the technical structuring of the project and
calculating the Public Sector Comparator (PSC) model. Information regarding the technical
structuring of the project was obtained from the PPP Central Unit in Egypt. However, The PSC
model is driven by the findings derived in section 2.6. The second pillar is about developing a
financial model template with its main components that can be applied to any PPP project. This
model is derived according to the findings in section 2.5. These two pillars together are required
to evaluate whether the given project yields value for money or not. Finally, the last pillar is a
qualitative assessment about structuring the procurement process of the PPP project. The data
required for this part was obtained from the PPP Central Unit and their advisors.
The research methodology flowchart is outlined in the following figure 3.1. Each pillar is
applied on a case study with its validation and risk mitigation strategies in the following chapter.

52
Initial Assessment
• Technical Structuring of the Project
• PSC
Financial Model
Structuring of the Procurement
Process
(Qualitative Assessment)
Figure 3.1: Research Methodology Flowchart
These three pillars are then subdivided into a series of steps that form the detailed process
of the integrated framework approach of a PPP project. All the detailed steps are illustrated in the
below figure 3.2 with the inputs on the left side and outputs on the right side of each aspect.
Literature Survey
Interviews (informal) with the PPP Central Unit in Egypt,
their advisors (IFC), and contractors (Orascom Construction)
Validation and Risk Mitigation
Strategies
Application on different case studies
Integrated Framework

53
Figure 3.2: The integrated framework approach flowchart
Quantification of
Risks
Public Sector Comparator
Model (PSC)
Financial Model
Template
Structuring the
Procurement Process
Technical Structuring
of the Project
- Type and nature of
the project
- Socioeconomic
conditions
- Structuring of the
contractual terms
- Managing risks
- Country Risks
- Sector Risks
- Project Risks
(depends on Project
Structure)
Risk identification
and valuation
Risk Allocation All identified and
valued risks
Allocation of risks
between public and
private sectors
- Costs (capital and
operating)
- Risks (transferable
and retained)
Risk-adjusted net
present cost to
government
Assumptions:
- Macroeconomic
- Funding
- Working Capital
- Revenue
- Capex and Opex
- An Overall
summary
- Financial
Statements
- Key Ratios
- Shadow bid model
Value for Money
Assessment
-NPC to government
under PSC
-NPC to government
under PPP
VFM (quantitative
and qualitative
assessment)
-Project
specifications
-Risk allocation
Selection of the
successful bidder
First
Pillar
Second
Pillar
Third
Pillar

54
The below figure 3.3 shows the application and validation exercises for each aspect in the
integrated framework approach
Figure 3.3: Application and Validation Exercises
• Application:
Examples of managing risks & structuring of the contractual terms
• Validation:
PPP Schools project & Nile Bus Ferry PPP Project
Technical Structuring of a
PPP Project
• Application and Validation on the Wastewater Treatment Plant Project in New Cairo
Public Sector Comparator
Model
• Application and Validation on the Salam to 10th of Ramadan Railway Project
Financial Model Template
• Application and Validation on the Wastewater Treatment Plant Project in New Cairo
Value for Money Assessment
• Application and Validation on the Wastewater Treatment Plant Project in New Cairo
Structuring of the Procurement
Process
First
Pillar
Second
Pillar
Third
Pillar

55
3.2 Technical Structuring of a PPP Project
The first step in the development of a PPP project is the structuring of the project. By
structuring we mean that each PPP project differs depending on the nature of the project and the
socioeconomic conditions of each country. Therefore, the concept where we “cut and paste”
cannot be applied on PPP projects. The technical structuring of the project includes the
identification, assessment, and allocation of risks between the public and the private sectors. It
also includes structuring the contractual terms that make the project bankable and attractive to
the private sector and lenders. The data acquired for this work was collected from different
sources. Some data was gathered through interviews with the director of the PPP Central Unit in
Egypt. Data concerning quantification of risks were obtained from Partnerships Victoria guide
(Melbourne Partnerships Victoria, 2001).
In some cases during the structuring phase, the PPP Central Unit conducts a market
soundness survey or questionnaire to test the appetite of the private sector towards a certain
project. In other cases, the private sector submits a letter of intent showing his willingness to bid
for a certain project. In this case, both the government and the private sector will be engaged in
an informal debate discussing the different aspects of the project.
3.2.1 Quantification of Risk
Risks reflect the potential for additional cost in the project, and as mentioned earlier in
the literature, the lack of identifying all risks can lead to project failure. Therefore, a realistic
pricing of all quantifiable and material risks is crucial to PPP projects. Once all material risks are
identified and valued, they can be allocated between the public and the private sector. This is
done through four steps:
Step 1: Identifying Risks
This step includes identifying all the material risks. There are three types of risks; country
risk, sector risk, and project risk. Country risks include foreign exchange rate risk, interest rate
risk, inflation risk, and change in law risk. Sector risks include design and construction risks.
Finally, project risks depend on the structure and the location of the project. It includes demand
(usage) risk, environmental risk, financial risk, cost overrun and time overrun risk, operating
risk, performance risk, and technology obsolescence risk.

56
Step 2: Quantify the Consequences of Each Risk
In order to identify the consequence of risk, four factors are taken into account. These
factors are:
Effect: risk may increase cost or reduce revenue
Time: the expected timing of the consequence will have an impact on the NPC cash flow
Severity of risk consequence: the cost of minor repairs to a building will be less than if
the building collapses due to major structural flaw
Type of risk
Risk consequences include cost and time overruns. Each consequence has different
probability of occurring, thus by multiplying each consequence by the relevant probability to
give the total value of that risk.
Step 3: Estimate Probability of Each Risk
According to literature, there are different methods to estimate the probability of risk
depending on the risk level of the project. High project risk level requires more advanced
probability techniques such as Monte Carlo simulation, while low project risk level requires
more simple probability techniques such as point estimate approach. In this research, the
probability and the consequence of each risk identified in the application chapter were obtained
from the International Finance Corporation (IFC) (the financial advisor of the PPP Central Unit).
However, future researchers are encouraged to use more complex techniques to calculate the
probability of risk occurrence in order to obtain more accurate results.
Step 4: Calculate Value of Risk
After obtaining the consequence (%) and the probability (%) of each risk, the impact of
risk is calculated using this equation:
The value of each risk is then calculated by multiplying the percentage impact of risk by
the capex amount for construction risks and/or opex amount for operating risks.
Impact of risk (%) = consequence (%) x probability of occurrence (%)

57
3.3 Public Sector Comparator (PSC) Model
The second aspect in the initial assessment of a PPP project is the development of the
PSC model. It is developed at this stage (pre-feasibility study stage) in order to determine the go
or no go of the project. The methodology of the PSC is based on the literature review section 2.6
(Melbourne Partnerships Victoria, 2001). The PSC is fine tuned in the feasibility study and it is
revisited later in the procurement stage. It is preferred to finalize the PSC as early as possible to
promote certainty in the bid process. The PSC should only be refined after release of the project
brief if the scope of the project changes or a component has been mispriced or omitted.
According to literature, non-cash items such as depreciation should not be included in the
calculation of the PSC. The PSC only includes costs in addition to risks. The methodology of the
PSC can be summarized as shown in figure 3.3.
Figure 3.4: PSC Methodology
3.3.1 Raw PSC
The raw PSC is the base cost as defined earlier in section 2.6.2 in the literature review. It
is the capital and operating costs to the government before any risks are taken into account.
Figure 3.4 shows the different components of the raw PSC.
Identify all raw PSC
components
Assign all capital costs
Assign all operating costs
Calculate Raw PSC
Identify all material risks
Quantify consequences
of risk
Estimate probability of
risk
Calculate risk impact
Calculate value of all
risks
Identify desired risk allocation
Calculate transferrable
risk
Calculate retained risk
Calculate risk-adjusted PSC
(NPC)
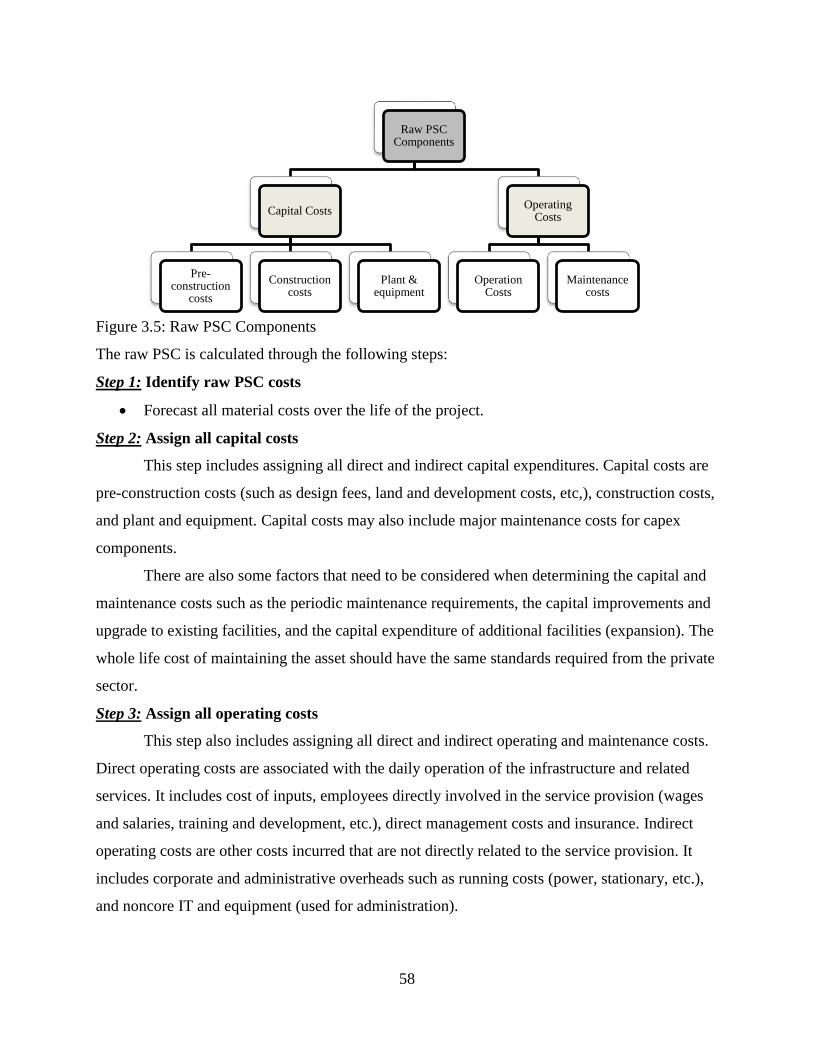
58
Figure 3.5: Raw PSC Components
The raw PSC is calculated through the following steps:
Step 1: Identify raw PSC costs
Forecast all material costs over the life of the project.
Step 2: Assign all capital costs
This step includes assigning all direct and indirect capital expenditures. Capital costs are
pre-construction costs (such as design fees, land and development costs, etc,), construction costs,
and plant and equipment. Capital costs may also include major maintenance costs for capex
components.
There are also some factors that need to be considered when determining the capital and
maintenance costs such as the periodic maintenance requirements, the capital improvements and
upgrade to existing facilities, and the capital expenditure of additional facilities (expansion). The
whole life cost of maintaining the asset should have the same standards required from the private
sector.
Step 3: Assign all operating costs
This step also includes assigning all direct and indirect operating and maintenance costs.
Direct operating costs are associated with the daily operation of the infrastructure and related
services. It includes cost of inputs, employees directly involved in the service provision (wages
and salaries, training and development, etc.), direct management costs and insurance. Indirect
operating costs are other costs incurred that are not directly related to the service provision. It
includes corporate and administrative overheads such as running costs (power, stationary, etc.),
and noncore IT and equipment (used for administration).
Raw PSC Components
Capital Costs
Pre-construction
costs
Construction costs
Plant & equipment
Operating Costs
Operation Costs
Maintenance costs

59
Maintenance costs are associated with maintaining the capability and quality of the
existing asset rather than improving it. It includes raw materials, tools and equipment, and labor
required for maintenance (wages and salaries).
Step 4: Calculate Raw PSC
The non risk-adjusted raw PSC is calculated by adding the net present values of all costs
3.3.2 Retained and Transferable Risks
Risks are the additional costs above the base case assumed in the raw PSC. The PSC
must include a comprehensive and realistic pricing of all quantifiable and material risk in order
to provide a VFM test against PPP option. The failure to include a financial assessment of
material risk may lead to a significant mispricing or underestimation of the PSC. A survey
report of projects in the United Kingdom found that risk transfer accounted for approximately
60% of the total cost savings across a sample of projects (Melbourne Partnerships Victoria,
2001). The methodology of identifying and valuing risk was described in the previous section,
once all risks are valued they can be classified between retained and transferable risk.
3.3.2.1 Calculating Transferable Risk
Transferable risks are those that are likely to be transferred to the private sector under
PPP arrangements. The decision to allocate a risk to the private sponsors depends on their ability
to manage and mitigate the risk at least cost. The value of transferrable risk in a PSC measures
the cost government would expect to pay for the risk over the term of the project in a public
procurement scenario. The estimated value of the transferred risk should be added to the raw
PSC to reflect the full risk-adjusted expected cost to government of delivering the project.
Transferable risk is calculated through the following steps:
Step 1: Analyze all material and quantifiable risks
Before the risk allocation process, the government has to ensure that all risks have been
identified and comprehensively valued. One of the problems in Egypt is that the government
does not identify and value all risks, thus underestimating the value of the PSC against PPP. This
problem appears especially in the brown field PPP projects due to its complexity. The brown
field PPP projects are existing projects that need renovation or extension.
Raw PSC = NPV of operation and maintenance costs + NPV of capital costs
60
Step 2: Identify optimal risk allocation
• Risk allocation is done by assessing which party is best able to manage and control each
risk. In other words, assessing the ability of each party to reduce the probability of risk
occurring and minimize the consequences of it.
• Risks are allocated between transferable, retained, and shared risks.
In Egypt, the government always bears the inflation risk, financing risk, and regulatory (or
change in law) risk. However, in other countries the private sector is the party that takes the
inflation risk. This depends on the economic stability environment of the country. Cost overruns
and time overruns are always allocated to the private sector. An efficient risk allocation allows
government to obtain greatest VFM.
Step 3: Calculate Transferable Risk
Each of the risks should be included as a separate cash flow item and then added to form
the transferrable risk component
Calculate present value of transferrable risk using appropriate discount rate
3.3.2.2 Calculating Retained Risk
Any risk not to be transferred to a bidder is considered retained by the government.
Retained risks are also calculated through the same steps as the transferable risks described
earlier. Retained risks are calculated through two steps:
Each of the risks should be included as a separate cash flow item and then added to form
the retained risk component
Calculate present value of retained risk using appropriate discount rate
3.3.3 Discount Rate
The cash flows of the raw PSC and the adjustment for project specific risks (retained and
transferred) are converted into net present cost (NPC) by applying the appropriate discount rate.
This allows the comparison between PSC and the PPP option (quantitative assessment) on a
single cost basis. The discounting process takes into consideration two aspects; the time value of
money and the systematic risk transferred to the private party.
(Systematic risks are market risks that impact all assets and are not specific to a certain project
e.g. general inflation is higher than expected)

61
The discount rate is calculated based on the CAPM formula:
Since, the cost of the PSC is based on the assumption that all systematic risks are retained by the
government and there is no any transferred risk. Thus, PSC discount rate is the risk free rate.
3.4 Financial Model
The financial model is the second pillar in the integrated framework approach. It is one of
the fundamental tools that contribute to evaluating the potential success of the PPP projects. It is
a tool needed by the government in order to estimate the price expected from the contractor
during the bidding process and to negotiate with the bidders. It is also required in the value for
money assessment against the public sector comparator. In this section of the study, a financial
model template with its main components is developed. The design of the template model adopts
a top-down approach.
3.4.1 Model Design
The design of the template is based on section 2.5.4 in the literature review and actual
PPP models. The model is divided into three main categories; the assumptions (input) worksheet,
calculation worksheets (for the calculation of the revenues, expenses, capex, and funding need),
and output worksheet (to display the income statement, balance sheet, cash flow statement, and
KPIs of the project).
Ra = Rf + βa (Rm – Rf)
Ra: cost of capital or required return on the asset whose risk class is determined by the asset
beta or systematic risk
Rf: risk free rate
βa: the asset beta that reflects the degree of systematic risk affecting the asset i.e. the extent to
which returns on the asset are expected to vary with returns on the market.
(Rm – Rf): the return over the risk free rate that investors need or expect to invest in an asset.
This is known as the market risk premium

62
Assumptions Worksheet
It is divided into; macroeconomic assumptions, funding assumptions, working capital
assumptions, revenue assumptions, CAPEX and OPEX assumptions. The macroeconomic
assumptions are constant for all projects; as listed in table 3-1:
Table 3-1: Macroeconomic Assumptions
Macroeconomic Assumptions Unit
Foreign exchange rate (if applicable) FX rate EGP/USD or Euro/USD
Annual devaluation % per annum
Foreign inflation rate (if applicable) % per annum
Egypt inflation rate % per annum
Tax rate % percentage
Number of days in a year 365 days
Number of working days 300 days
Model start year Date
Financial statements start Date
Table 3-2: Funding Assumptions
Funding Assumptions Unit
Equity % CAPEX Ranges from (10 -30%)
Total debt % CAPEX Ranges from (70 – 90%)
Local currency debt % Total debt Assuming no foreign
currency (100%)
Interest rate paid on the debt % Percentage On available balance
Drawdown period Years During construction period
typically ranges from 2-3
years
Repayment period Years During operation period
Tenor Years Drawdown period +
repayment period

63
Table 3-3: Working Capital Assumptions
Working Capital Assumptions Unit
Initial cash Value (EGP)
Minimum cash maintained As a % Sales
Initial inventory level Value (EGP)
Inventory days Days of COGS
Initial receivables balance Value (EGP)
Days of receivables Days of sales
Initial payables balance Value (EGP)
Days of payables Days of COGS
Revenues are calculated by multiplying the price of an item multiplied by its quantity
sold respectively (revenue = Price X Quantity). Hence, the revenue assumptions include the price
(USD or EGP/quantity), the increase in price (% per annum), the quantity, and the forecasted
increase in quantity. It also includes any third party revenues.
CAPEX and OPEX assumptions are specific to the project. CAPEX assumptions include
cost of construction of the infrastructure or building and the cost of installing the plant,
machinery and/or equipment. While, the OPEX assumptions include the following: maintenance
expense, increase in maintenance (% per annum), insurance premium, salaries, power
consumption (if any), and the selling and administrative expenses (SG&A) (% revenues).
Calculation Worksheets
The calculation worksheets are composed of: (i) calculation of revenues, (ii) calculation
of CAPEX, (iii) calculation of OPEX, and (iv) funding calculations for both debt financing and
equity financing.
Output Worksheet
The output worksheet includes the three financial statements which are income statement,
balance sheet, and cash flow statement, in addition to key ratios which are debt service coverage
ratio (DSCR), leverage, internal rate of return (equity IRR and/or project IRR), and net present
value (NPV). It also includes a summary of the following:
CAPEX
Drawdown of equity

64
Drawdown of debt
Total revenues
Total costs of goods sold (OPEX excluding SG&A)
Total operating expenses (OPEX including SG&A)
EBITDA (earnings before interest, tax, depreciation, and amortization)
Interest expense
Net income
Cash
Total assets
Long term debt
Total shareholder’s equity

65
Figure 3.6: Model Design
Once the framework for the model had been conceptualized, it is further developed based on
each project specifications and data.
3.4.2 Model Calculations
Revenue
There are two sources of revenues. There are revenues related to the project's core
operations and there are revenues that the company derives from any source other than its
operations. Revenues are a function of price and quantity.
Financial Model Design
Assumptions Worksheet
Macroeconomic assumptions
Funding assumptions
Working Capital assumptions
Revenue assumptions
CAPEX assumptions
Opex assumptions
Calculations Worksheets
Revenue
CAPEX
OPEX
Debt and Equity
Model Outputs
Financial Statments
Income Statement
Balance Sheet
Cashflow Statement
Key ratios
DSCR
IRR (equity and/or project)
NPV
An Overall Summary

66
CAPEX
The calculation of CAPEX includes the CAPEX deployed during the construction period of
the project which is typically 2-3 years. During the operation period the cost of machinery,
equipment, vehicles, computers, generators, etc are calculated and the cost of the total CAPEX
deployed is obtained. In this model a straight line depreciation method is adopted in order to
calculate the depreciation expense (depreciation expense = asset/useful life). The accumulated
depreciation is then deducted from the total assets to give the net book value of fixed assets.
OPEX
The OPEX expenses are divided into fixed expenses and variable expenses. It includes
maintenance expense (infrastructure, equipment, machinery, etc.), insurance expense, salaries,
electricity or power consumption, and selling and administrative expenses (SG&A). The
maintenance expense is a percentage assumed from the CAPEX value.
Debt and Equity
The debt and equity are calculated from the total CAPEX deployed based on their
corresponding weights. The equity drawdown is usually during the construction period of the
project and it includes the capitalized interest expense on debt during the construction period. It
is assumed that the drawdown of debt takes place during the construction period. The project
starts repaying the debt after operation. The interest expense is calculated based on the debt
outstanding balance (interest expense = interest rate% X outstanding balance).
Model Outputs
The outputs to the financial model, each relate to a financial statement as previously
mentioned. The model shows 5 levels of profit. The gross profit level is calculated by deducting
the cost of goods sold (COGS) from the net revenues. The EBITDA (earnings before interest,
tax, depreciation, and amortization) is the gross profit net any selling and administrative
expenses. The EBIT is the EBITDA (explained above) net depreciation. The EBT is the earnings
before tax after deducting interest expense. Finally, there is the net income, which is the EBT
after deducting the tax expense for the year as shown in figure 3.6 below.

67
Figure 3.7: Net Profit Calculation
The balance sheet is the second financial statement showing the project’s assets,
liabilities, and owner’s equity balances at a point in time. Assets are composed of current assets
and long term assets. The current assets include cash, accounts receivable, and inventory. The
long term assets include machinery, plant and equipment (net accumulated depreciation).
Liabilities are composed of current liabilities and long-term liabilities. Current liabilities include
accounts payable and long term liabilities include the long term debt. The final component of the
balance sheet is the shareholder’s equity which includes paid in capital (equity funding) and
retained earnings. Retained earnings are calculated by adding the net income to the retained
earnings of the previous year and deducting dividends paid (RE = retained earnings of last year +
net income – dividends). A balance sheet checker is included to make sure that the amount of
total assets is equal to the amount of total liabilities and shareholder’s equity.
Figure 3.8: Balance Sheet Calculations
The cash flow statement has three main cash components; cash flow from operations,
cash flow from investing activities and cash flow from financing activities, displayed in fig 3.8.
The change in the three cash components is added to calculate the change in cash for each
financial year, which is then added to the beginning cash balance to obtain an ending balance for
the whole year (ending cash = beginning cash + change in cash).
Gross Profit
• Total Revenue -COGS
EBITDA
• Gross Profit - SG&A expenses
EBIT
• EBITDA -Depreciation expense
EBT
• EBIT -Interest expense
Net Income
• EBT - Tax expense
Total Shareholder's
Equity:
Paid in Capital & Retained
Earnings
Total Libailities:
Accounts Payable & Long Term
Debt
Total Assets:
Cash, AR, Inventory and
PP&E, Accumulated Depreciation

68
Figure 3.9: Cash Flow Activities
Another component of the financial model is key financial ratios calculated based on the
findings of the financial statements. These ratios include but are not limited to debt service
coverage ratio (DSCR), IRR, and the net present value (NPV). According to literature, these
outputs are the most important factors for the public authority. The DSCR is a measure of the
cash flow available to pay for debt obligations. This factor is also important to lenders to
evaluate the ability of the private sector to repay the debt. It is calculated by this formula:
EBITDA/ (interest + principle repayment). The higher the DSCR is the better project sponsor’s
debt paying ability. Generally, a DSCR that at least equals to or larger than 1.0 is acceptable.
The Internal Rate of Return (IRR) is a factor that measures the profitability of potential
investments. It is a discount rate that makes the net present value (NPV) equal to zero. IRR is an
important financial indicator for all parties (sponsors, lenders, and the government). To evaluate
a project with IRR, just compare it to the estimated cost of capital. If the IRR is greater than the
weighted average interest rate, the project is acceptable. Otherwise, it is a better idea to reject the
project. Both project and equity IRRs could be calculated depending on the interested party
(public or private). Project IRR that takes into consideration the CAPEX component (equity +
debt) while calculating the cash outflows. Equity IRR takes into consideration only the equity
component.
The Net Present Value (NPV) compares the amount invested today to future cash flows.
It is also a measure of the profitability of a projected investment or a project. A zero value of
NPV represents the break-even point of a project. If the value of the NPV is zero or positive, the
project is worth investing. Conversely, if the value of NPV is negative, it is better to decline the
project. The NPV is required in the bidding process to compare between different bid proposals.
Cash Flow from Operations
•Net income + depreciation expense - change in A/R + change in A/P - change in inventory
Cash Flow from Investing
•CAPEX (-ve) (subtracted from cash)
Cash Flow from Financing
•Long term debt (issuance is added and reypayment is subtracted)
•New equity investments (added)
•Dividends (subtracted)

69
A higher NPV indicates higher profitability. The NPV is calculated based on the estimated cash
outflow, cash inflow, and discount rate.
3.4.3 Model Sensitivities
As described earlier in literature, sensitivities are conducted on the financial model to test
the effect of variations in key input assumptions on IRR (project or equity). These key input
assumptions include; change in construction costs, operating costs, maintenance costs, revenues,
inflation, interest rates, and higher foreign exchange rates.
3.4.4 Shadow Bid Model
The shadow bid model is an output derived from the financial model of the project. It
includes only cost estimates on privately procured PPP projects. In order to compare the net
present cost (NPC) to government under conventional procurement (PSC) with PPP, all
government’s costs are obtained from the financial model to calculate the net present cost to
government under PPP procurement. All retained risks by the government are added to the net
present cost.
3.5 Value for Money (VFM) Assessment
The Value for Money (VFM) is obtained by the comparison between the PPP financial
model and the Public Sector Comparator (PSC). The VFM aspect of the project is the essential
element of the government decision making on PPPs. A PPP project yields VFM if the net
present cost of the project is less than that obtained by public sector comparator. VFM
assessment is developed through:
i. Quantitative assessment - is the comparison between the net present cost to government
(NPC) under PSC and the net present cost (NPC) to government under PPP as shown in
the below figure.
ii. Qualitative assessment - qualitative factors are not included in the PSC as they are not
accurately quantifiable. The qualitative assessment includes any benefits or costs that a
partnership approach may bring that are not capable of being quantified.
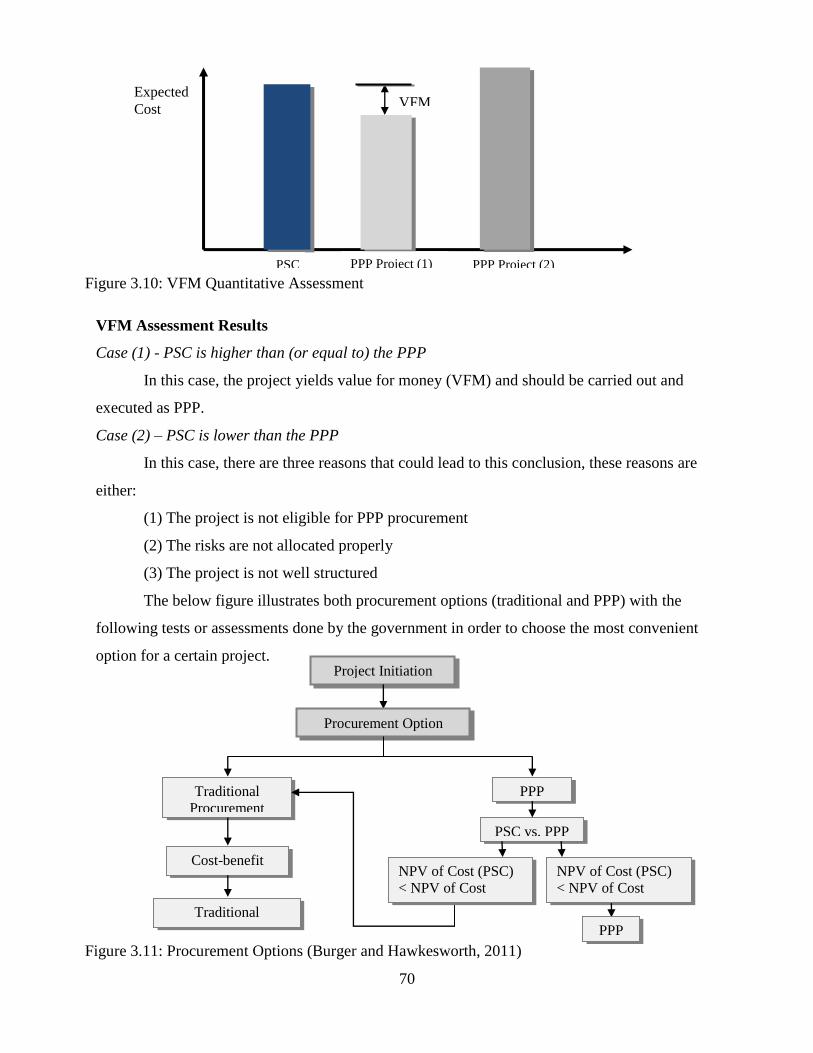
70
Project Initiation
Procurement Option
Traditional
Procurement
Option
Cost-benefit
Analysis
Traditional
Procurement
PPP
Option PSC vs. PPP
NPV of Cost (PSC)
< NPV of Cost
(PPP)
NPV of Cost (PSC)
< NPV of Cost
(PPP)
PPP
VFM Assessment Results
Case (1) - PSC is higher than (or equal to) the PPP
In this case, the project yields value for money (VFM) and should be carried out and
executed as PPP.
Case (2) – PSC is lower than the PPP
In this case, there are three reasons that could lead to this conclusion, these reasons are
either:
(1) The project is not eligible for PPP procurement
(2) The risks are not allocated properly
(3) The project is not well structured
The below figure illustrates both procurement options (traditional and PPP) with the
following tests or assessments done by the government in order to choose the most convenient
option for a certain project.
PSC PPP Project (1) PPP Project (2)
VFM Expected
Cost
Figure 3.11: Procurement Options (Burger and Hawkesworth, 2011)
Figure 3.10: VFM Quantitative Assessment

71
3.6 Structuring of the Procurement Process
The final pillar in the integrated framework approach for developing PPP projects is the
procurement process. This section of study is a qualitative assessment for structuring a
procurement model for PPP projects. In Egypt according to the previous PPP projects performed,
the PPP Central Unit concluded that if the procurement process was not structured correctly it
can lead to the failure of the whole PPP process. Thus, the proper handling of procurement
activities is crucial to the success of the PPP project in achieving value for money. Accordingly,
structuring a competitive and transparent procurement process is one of the key success factors
for PPPs. This section outlines the general procurement steps in any PPP project, together with
the weighing criteria for the private bidder’s offers. However, structuring of the procurement
model depends on the specifications of each project and it also depends on the risks that each
party carries. A case study is presented in the next chapter to show and validate the idea behind
structuring a procurement model custom-made for a specific PPP project and how to select bids
not based on price only. Data acquired for this section are gathered from the PPP Central Unit in
Egypt and the European Investment Bank (European Investment Bank EIB, 2015).
3.6.1 Bidding Steps
The bidding process of any PPP project involves a series of steps; these steps are:
procurement notice, prequalification and short listing; invitation to tender; interaction with
bidders; and evaluation of tenders and PPP contract award. Structuring of the procurement
process focuses only on the last bidding step of evaluating tenders and PPP contract award.
Once the bids are submitted, they must be evaluated in order to select the preferred
bidder. Technical bids are evaluated firstly then financial bids are compared with the
government’s financial model. The authority shall ensure that the technical solution proposed by
a bidder is feasible, deliverable and robust and it is based on reliable technologies, that it meets
all minimum technical requirements and that the costs and financial structure are consistent with
the technical solution.
In some cases, only one bidder will submit a tender despite the authority (or the line
ministry) having issued the invitation to tender to several shortlisted candidates. According to the
Egyptian PPP Law 67 for the year 2010 that regulates Partnership with the Private Sector in
infrastructure projects, services and public utilities and its executive regulations Article no.81 a

72
single bid may be accepted if other qualified bidders have failed technically and it appears that
the bid was made in the bidder’s belief that there would be a good level of competition. In other
cases, this single bid is not accepted if the other bidders failed at the prequalification stage,
therefore the best solution is to repeat the whole bidding process. According to Law 67/2010 and
its executive regulations Article no.81, a bid price higher than that expected by the government
can be accepted if the bid price is not more than 20% of that price expected the government.
Therefore, in good procurement practice case by case should be considered. At the end of the
procurement process the winning bidder is selected and announced.
3.6.2 Weighing Criteria
PPP projects are known for their complexity, sophistication, and long concession periods.
Therefore, the technical offer of such projects has to take higher weight or percentage based on
the degree of sophistication (technically) of the project. The technical offer according to common
practice usually weighs 70% while the financial offer weighs the remaining 30%. The following
table (3-4) shows the difference between the traditional selection process based on the Law 89
and the selection process of PPP projects according to Law 67. The Law 89 is the Tenders and
Auction Law of 1998 (Law 89/1998), and its executive regulations issued by the Ministry of
Finance in 1998. It governs all procurement of goods and services. However, the selection
process in PPP projects was developed by the PPP Central Unit in Egypt according to Law 67 for
the year 2010.
Table 3-4: Law 89 Procurement vs. Law 67/2010 PPP Procurement
Law 89
(selection based on lowest)
Law 67
(selection based on highest)
- Offers are evaluated on pointing system
basis
- The financial offer is divided by the
technical offer (F/T)
- The bid with the lowest point is selected
assuming the technical and financial
offers have the same weight (T=F).
- Technical offer wt.% + Financial offer
wt.% = 100%
- 𝑇𝑥
𝑇 ℎ𝑖𝑔ℎ𝑒𝑠𝑡∗ 𝑤𝑡 +
𝐹 𝑙𝑜𝑤𝑒𝑠𝑡
𝐹𝑥∗ 𝑤𝑡 = 1
(optimum or maximum value)
- By using this formula, the bid with the
highest value is selected assuming the
maximum or optimum value is 1.
( Source: Director of PPP Central Unit in Egypt)

73
CHAPTER 4 : APPLICATION
This chapter discusses the application of the integrated framework approach described
earlier in the methodology chapter. Each aspect in the integrated framework is applied and
validated on a different case study. The first section covers the first aspect in the framework
which is the technical structuring of a PPP project. It explains the concept of structuring a PPP
project and how it affects the success of the project by describing real cases and their solutions. It
also includes structuring of risks and contractual terms that will lead to the development of the
Public Sector Comparator (PSC). The second section is about applying the financial model
template on the Salam to 10th of Ramadan LRT project. The outputs of the model are compared
with the actual numbers for validation of the template. The third section adopts the value for
money analysis process for the Wastewater Treatment Plant (WWTP) project located in New
Cairo including both quantitative and qualitative assessments. It includes developing of the
public sector comparator in addition to the shadow bid model. The data acquired for this section
was gathered from the International Finance Corporation IFC (The PPP Central Unit advisor).
The final section tackles the last aspect in the integrated framework approach. This section is a
qualitative application of structuring of the procurement process. It includes the weighing criteria
of bids conducted by the PPP Central Unit in Egypt and a case study to validate the concept of
the customized procurement process for a specific project. All three sections summarize the full
front end process of a PPP project with application and validation for each part.
4.1 Technical Structuring of the Project
As described in the methodology chapter, the technical structure of the project is the first
step in developing a PPP project. It is part of the initial assessment of the project whether it
should be carried out as PPP or not. The first step in structuring a project is to identify and value
the risks through the steps explained in the previous chapter. After all risks are quantified, they
are allocated between the public and the private sectors based on the ability of each to handle
these risks. The second part of the technical structure is structuring the contractual terms of the
project to make the projects desirable for lenders and service providers. The concept of these two
aspects is validated by describing examples of risks and clauses, in addition to two case studies
adopted from the PPP Central Unit in Egypt.

74
4.1.1 Managing Risks
PPP projects are known for their long term concessions. Therefore to finance such
projects, sponsors will require long term debt from lenders so that the project will be able to
generate revenues during the operation period to start repaying the debt amount. Usually, the
loan tenor for PPP projects is 15 years or more. The problem in a locality like Egypt is that banks
do not agree on loan tenors more than 7 years. As explained in the risk allocation section in the
methodology, the government bears the financing risk. Therefore, this risk has to be mitigated to
make PPP projects bankable and affordable. The reason banks in Egypt do not agree on long
tenors is the instability of the economic environment in Egypt and the accompanying fluctuation
of interest rates. Therefore, as a risk mitigation strategy the way the government structured the
deal is that it agreed with the banks on a refinancing scheme. Every three years (or another
agreed period) both parties will revisit the interest rate and change it. If the value of the interest
rate is increased, the government will add this value to the private sector. On the other hand, if
the value of the interest rate decreases, the gains will be shared equally (50% / 50%) between the
government and the service provider. This is considered as an incentive for the service provider
to agree on the refinancing scheme. By doing so, banks will agree to provide project sponsors
with long debt tenors.
There are some cases when risk becomes a deal breaker. Any risk that cannot be
quantified is considered as a deal breaker for the PPP project. The waste water treatment plant
PPP project in Abou Rawash area in Egypt was considered a failure because of the environment
risk. In this project, the discharge of the plant was dumped at nearby water that polluted the
water and the whole area. That kind of risk may lead the private sector to go to jail; accordingly
no private sector will bid for that project or bear this risk. Thus, the environmental risk in that
project was considered as a deal breaker for the whole project because there are no ways to avoid
it or mitigate it.
4.1.2 Structuring of the Contractual Terms
The termination term is an example of the important clauses in a PPP contract. Upon
termination due to service provider default, the essential rights of the service provider shall be
terminated and the service provider shall no longer have the right to use or access the site. In
addition, the service provider shall bear any costs to be incurred as a result of the handover and
75
no compensation will be paid. In Egypt, in that case no penalty is paid by banks so that PPP
projects remain bankable. The banks will take 100% of the outstanding debt assuming it has
properly financed the project assets.
Upon receipt of the early termination notice sent by the government to the service
provider and the lenders, the lenders shall have the right to step in to rescue the PPP project and
protect their loan. They can take over the role of the service provider in the execution of the
project. Lenders may notify the government of their intention to step in within a certain period of
time from the date of receipt of the early termination notice. In this case, lenders shall bear all
obligations and enjoy all the rights of the service provider under the contract. In case lenders
decide to step in through replacing the service provider with a new entity, the new entity shall be
liable for all obligations of the service provider and its right under the contract. In other cases,
lenders may bring a co-service provider with the existing one to ensure the availability of the
service and the inflow of cash. The PPP contract will be terminated only if lenders choose not to
step in, fail in the step-in or choose to step out of the non-performing project.
In the UK, lenders are penalized in early termination of PPP projects due to private
sector’s default. Lenders shall only take 90% of its loan money assuming they have not properly
financed the project assets. This concept is not applied here in Egypt so that PPP projects remain
bankable and desirable. In other words, banks do not agree on loan tenors more than 7 years
unless there is a refinancing scheme and no penalty is applied in case of early termination due to
private sector’s default.
4.1.3 Case Study (1) – PPP Schools Project
The concept of the technical structuring of a PPP project including managing risks and
contractual terms is validated by presenting two case studies. The first one is the PPP schools
project that was a pilot project developed by the General Authority of the Educational Buildings
and the PPP Central Unit. The General Authority of the Educational Buildings is the authority
responsible for building public schools and their maintenance. The project is composed of 345
new public schools in 18 governorates for a period of 15 years divided into 7 geographical
groups. The role of the private sector was the design, construction, equipping, furnishing,
maintenance, financing, and provision of non-educational services (including cleaning, pest
control, security, help desk facilities, and other services of the schools). The failure of this

76
project was due to its technical structure. The project was tendered without an initial feasibility
study due to political reasons. Therefore, as a risk mitigation strategy the project had to be
restructured. The two main reasons behind this failure were:
1. The fact that the project consists of 345 schools scattered over 18 governorates increased
the operating and maintenance costs of the project. The private sector shall assign
different maintenance groups for each school in order to cover all schools in different
areas. This task incurs very high operation and maintenance expenses on the private
sector against the project’s income.
2. The second reason is that the private sector is only handling the non-educational services,
while the authority is the one dealing with the educational part. The fact that both the
private and the public sectors have different backgrounds made the communication
between both hard. Accordingly, this separation created very high friction between both
sectors which rendered the project not doable.
Solution
The project was re-structured and became eligible for a PPP procurement approach. The
PPP Central Unit together with the granting authority (The General Authority of the Educational
Buildings) started by making the private sector responsible for all school operation including the
educational services under certain conditions stated in the contract. These conditions are
acknowledged in order for the government to ensure the quality of the education service
provided by the private sector. Secondly, they reduced the number of schools to 290 and grouped
them into nearby areas to reduce the operating expenses incurred on the private sector. The
government considered providing the land with no fees to the private sector is an incentive in
order to make the project desirable for private consortia.
4.1.4 Case Study (2) – Nile River Bus Ferry in Cairo
The second case study is the Nile River Bus Ferry. The project is developed by the Cairo
Transport Authority (CTA), as the Tendering Authority with the technical assistance of the PPP
Central Unit of the Ministry of Finance and the River Transport Authority of Ministry of
Transportation. The private sector was requested to bid on a PPP tender to design, build, finance,
maintain and operate the Nile river bus vessels and the provision of the new service that will be
delivered through the PPP Contract. The Project includes financing and procuring the fleet;

77
rehabilitation of the existing piers and building new piers; in addition to the operation and the
maintenance of the fleet and piers, the ownership of the new assets, new piers and fleet shall be
transferred to the CTA at the end of the contract duration or upon earlier termination.
The CTA agreed that the demand risk will be allocated to the private sector; however
there is no track record or log for ridership for the private sector to estimate the amount of that
risk. As a result, this structuring will make the PPP project undesirable and not affordable to the
private sector.
Solution
In order to overcome the problem and make the PPP project affordable, the government
will give the private sector a minimum ridership in order to cover the expenses but not the profit.
The PPP Central Unit is currently studying the possibility of giving this minimum ridership for
only a certain period of time and not during all the concession period, assuming that the private
sector should develop a track record to estimate the ridership (demand).
4.2 Financial Model Validation
The financial model template is applied on the Salam to 10th of Ramadan LRT project.
The model outputs are compared to the actual numbers in order to validate that the template is
running properly and all financial formulas and equations are correct. Different financial models
for different projects are then compared in terms of utilization, units, funding ratios, and
financial outputs.
4.2.1 Model Application on the Salam to 10th of Ramadan LRT Project
Salam to 10th of Ramadan LRT project is a railway project with lifespan of 30 years. The
project is composed of the infrastructure of the railroad, the stations, and the rolling stock. The
railway stops at El Salam, Shorouk, 10th of Ramadan, and Belbeis areas with total number of 11
stations. The construction of the project was supposed to start on the 31st of December 2016 and
last for a duration of three years. The operation period will start at the end of year 2019 for the
remaining life of the project of 27 years. As described earlier in the methodology chapter, the
template design is composed of an assumption sheet, calculation sheets, and an output sheet. All
the assumptions made in this exercise were computed according to the time the model was

78
developed in 2014/2015. The macroeconomic, CAPEX, OPEX, revenue, funding, and the
working capital assumptions of the project are explained as follows:
Table 4-1: Macroeconomic Assumptions
Macroeconomic Assumptions Unit
FX Rate EGP/USD (2014) 7.15
Annual devaluation % per annum 2.5%
Foreign inflation rate % per annum 3%
Egypt inflation rate % per annum 10%
Tax rate % percentage 35%
Number of days in a year days 365
Number of working days days 300
Model start year Date 31-Dec-15
Financial statements start Date 31-Dec-16
CAPEX Assumptions
The project total distance is 69.7 km (9.5 km elevated and 60.3 at grade) with a total
number of stations 11 (2 elevated and 9 at grade). The total units of the rolling stock required in
each year are as follows:
In 2019 – 37.4 units
In 2024 - 44.2 units
In 2029 – 47.6 units
In 2034 – 49.3 units
Passengers per train (capacity) – 1482 Pax
The cost of construction of infrastructure is 13.88 $/km. The cost per station elevated is
2.8 mln $/station and the cost per station at grade is 2.38 mln $/station, therefore the total cost of
stations is 26.99 US$ mln. The total CAPEX of infrastructure and stations is 995.1 US$ mln
(14.27 US$/km X 69.7 km). The cost estimate of rolling stock is 13.5 $mln/vehicle. The CAPEX
implementation start year is 2016 and end 2018 with percentage per annum of 33.3%.
OPEX Assumptions
The maintenance for the infrastructure of the railroad is calculated as 0.5% of CAPEX
amount of infrastructure, while the maintenance for the stations is calculated as 3% of CAPEX
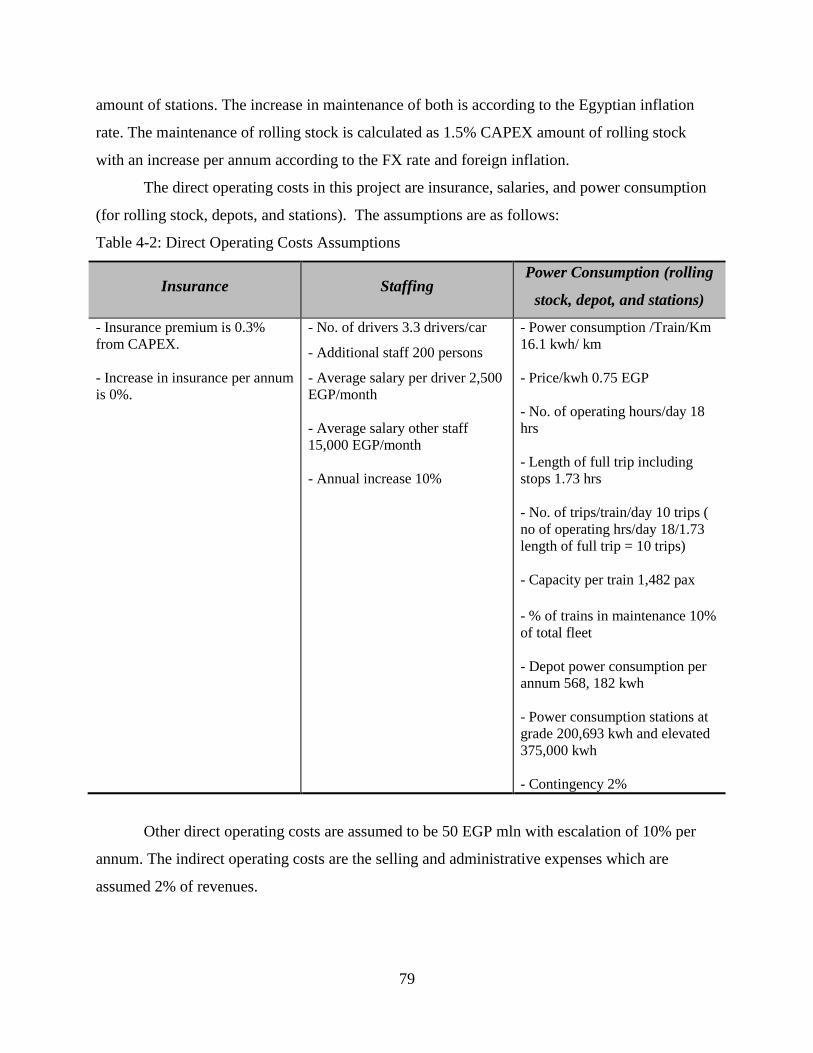
79
amount of stations. The increase in maintenance of both is according to the Egyptian inflation
rate. The maintenance of rolling stock is calculated as 1.5% CAPEX amount of rolling stock
with an increase per annum according to the FX rate and foreign inflation.
The direct operating costs in this project are insurance, salaries, and power consumption
(for rolling stock, depots, and stations). The assumptions are as follows:
Table 4-2: Direct Operating Costs Assumptions
Insurance Staffing Power Consumption (rolling
stock, depot, and stations)
- Insurance premium is 0.3%
from CAPEX.
- Increase in insurance per annum
is 0%.
- No. of drivers 3.3 drivers/car
- Additional staff 200 persons
- Average salary per driver 2,500
EGP/month
- Average salary other staff
15,000 EGP/month
- Annual increase 10%
- Power consumption /Train/Km
16.1 kwh/ km
- Price/kwh 0.75 EGP
- No. of operating hours/day 18
hrs
- Length of full trip including
stops 1.73 hrs
- No. of trips/train/day 10 trips (
no of operating hrs/day 18/1.73
length of full trip = 10 trips)
- Capacity per train 1,482 pax
- % of trains in maintenance 10%
of total fleet
- Depot power consumption per
annum 568, 182 kwh
- Power consumption stations at
grade 200,693 kwh and elevated
375,000 kwh
- Contingency 2%
Other direct operating costs are assumed to be 50 EGP mln with escalation of 10% per
annum. The indirect operating costs are the selling and administrative expenses which are
assumed 2% of revenues.

80
Revenue Assumptions
Table 4-3: Revenue Assumptions
Main Revenue Source 2019 2024 2029 2034 &
Thereafter
No. of Passengers (pax) 464,671 594,456 730,227 846,532
Annual Increase 5% 4.2% 3% 0%
Ticket Price 10
Increase in ticket price 5% 5% 5% 5%
Third Party Revenue (Other Revenue)
Advertisement per station EGP 200,000
Advertisement per train EGP 120,000
Increase in Ad revenue 5% 10% 10% 10%
Parking Space:
Cars slots per station
500
Parking ticket price EGP/day 3
Increase in parking revenue 5% 10% 10% 10%
Funding Assumptions
Table 4-4: Funding Assumptions
Funding Assumptions Unit
Equity % CAPEX 40%
Total debt % CAPEX 60%
LCY Debt (local currency) % Total debt 20%
LCY Debt Interest rate on avg. balance 14%
LCY Debt Drawdown years 3
LCY Debt Repayment years 12
LCY Debt Tenor 15 (drawdown + repayment)
FCY Debt (foreign currency) % Total debt 80%
FCY Debt Interest rate on avg. balance 5%
FCY Debt Drawdown years 3

81
FCY Debt Repayment years 12
FCY Debt Tenor 15 (drawdown + repayment)
Working Capital Assumptions
Table 4-5: Working Capital Assumptions
Working Capital Assumptions Unit
Initial cash EGP mln 40
Minimum cash maintained % Sales 2%
Initial inventory EGP 10
Inventory days Days of COGS 30
Initial receivables EGP -
Receivable days Days of sales 15
Initial payables EGP -
Payable Days Days of COGS 30
4.2.1.1 Model Calculations
After inputting all the above mentioned assumptions regarding the macroeconomic
assumptions, capex, opex, revenues and financing assumptions; the following was calculated; (1)
Revenues, (2) Capex, (3) Opex and (4) Project Financing. The Macroeconomic assumptions
applied in this model are the EGP/USD exchange rate, the devaluation rate for the exchange rate
and Egyptian inflation rate. The EGP/ USD exchange rate is indexed each year by the amount of
devaluation for that year. The devaluation rate for the exchange rate is fixed each year at 2.5%.
The inflation rate is also fixed at an amount equivalent to 10% throughout the model.
1. The revenue component is a function of the total demand of passengers per annum and
the ticket price for each passenger. The number of passengers per day for the year 2019 (start
year of operations) was given as well as the percentage increase in number of passengers per
annum. The total number of passengers per day was multiplied by 300 (number of working days)
to obtain the total passengers per year. The demand of passengers per year was then increased by
a given percent indicated in the above revenue assumptions. The cost component of the revenue
– ticket price, is projected throughout the project by indexing the current ticket price in 2014 by
5%. A delinquency rate of 0% was assumed throughout the model. Other revenues in the project

82
are composed of advertisements in the rolling stock and stations and parking tickets for each
station. The revenue advertisement in the stations is obtained by multiplying a given amount of
EGP 0.2 mln by the total number of stations. The given cost of advertising is indexed throughout
the project by 5% each year. Similarly, the revenue from advertising in the rolling stock is
projected by multiplying the number of rolling stock vehicles each year by a given amount of
EGP 0.12 mln. The cost of advertising in the vehicles was indexed by 5% per annum. The
methodology for obtaining the number of stock vehicles each year will be explained later in the
Capex section. The final component of other revenues is the revenue generated from the parking
slots in each of the stations. The number of parking slots available per day is multiplied by 300
to obtain the number of cars per annum (150, 000 car). The number of cars per annum is then
multiplied by the total number of stations (11 stations) to obtain the total available parking slots
per year for all the stations (1.5 mln parking slots). The cost of parking ticket is then multiplied
by the total number of available parking slots per year to obtain the total revenue of EGP 4.5 mln
- generated from the parking tickets (3 * 1,500,000 = 4,500,000). It is important to mention that
the parking ticket price is also indexed by 5% each year, up until year 2025 and then it is
assumed to increase by 10% until the end of the concession period. Total revenue is a summation
of the revenues obtained from the ticket sales and the revenues from advertisements and parking
tickets.
Table 4-6: Revenue Calculations
Passengers Tickets
Ads in Stations
Ads in Rolling
Stock
Parking Tickets
No. of car slots/station/day (500)*300 working days per year = 150,000
cars/year * total stations (10 excluding 1) = 1,500,000 * parking ticket
(3 EGP * %5 inc. per annum) = 4,500,000 EGP/annum
No. of passengers (464,671) *
% inc. per annum Ticket Price (10 EGP) *
%5 inc. per annum X
Total no. stations (11) X Revenue per station (0.2 mln) *
%5 inc. per annum
Total no. of
rolling stock in
each year
X Revenue per train (0.12 mln) *
%5 inc. per annum

83
2. The Capex is composed of cost of construction of infrastructure and stations, and cost
of rolling stock. The model assumed total cost of USD 14.27 mln per kilometer of construction
the infrastructure and stations. The total kilometers needed are given to be equivalent to 69.74
km. It is assumed that the construction will take place over a period of 3 years, dividing the total
cost of construction equally among each year. The cost of rolling stock is composed of the
number of stocks needed which is given in the model to be 38 vehicles in the first year. The cost
of each vehicle is USD 13.5 mln, which is indexed by the devaluation rate of the USD of 2.5%,
to obtain the cost of vehicle each year throughout the concession. The cost of the rolling stock is
then multiplied by the EGP/USD exchange rate to obtain the cost in EGP for each year. The
order for the vehicles is made two years prior to the year it is needed. Straight line depreciation
was used to calculate the depreciation expense. The accumulated depreciation was calculated by
adding the depreciation expense each year starting from the date the asset was bought throughout
its useful life. The net book value of the asset is calculated by deducting the total accumulated
depreciation. The useful life of infrastructure is assumed to be 50 years while the useful life of
the rolling stock is 30 years.
3. The three main components of Opex are maintenance, power consumption, and staff
salaries. For the first year of operations, the maintenance is calculated as a percentage of the cost
of capex. For infrastructure maintenance 0.5% is applied to the total cost of infra structure (EGP
11.378 mln) to give total maintenance expense for infrastructure of EGP56.9 mln. The same
methodology is applied for maintenance of rolling stock and stations with percentage of
maintenance of capex of 3% and 1.5% respectively. The second main cost component is the cost
of power consumption of the rolling stock. The power consumption is a function of the number
of kilometers traveled per annum multiplied by the fuel consumption per km. It was assumed that
10% of the total number of rolling stock was to be in maintenance throughout the day. The
remaining number of rolling stock was then assumed to be completing full round trips all day. In
order to find the total amount of power consumed, the number of operating hours per day were
divided by the length of one trip to find out the number of trips per train per day (18/1.73=10)
The total number of trips for all the rolling stocks were obtained by multiplying the number of
rolling stocks (330 vehicles) by the number of trips made by each vehicle per day (10 trips/ day).
Then the total distance covered by all trains was calculated by multiplying the total number of
trips per day (10 trips/ day) by the total distance covered in each route (69.744 km). This
84
distance is then multiplied by 300 working days to find the distance covered per annum (6.9 mln
km) To find the total power consumption, the distance covered per annum by all vehicles was
multiplied by the power consumption per km (16.1 *6.9 =111.1 kilowatt hour) Then the total
power consumption was multiplied by the price per kilowatt hour. (111.1* .75 – EGP 83.4 mln).
Similarly the power consumption for all the stations and the depot were calculated, by
multiplying the amount of power consumed by the cost of kwh. The total cost of power in the
project is then calculating by adding that of the rolling stock, depots and stations. The third main
component of the opex is the staff salaries. The number of drivers required per train is then
multiplied by the number of trains to get the total number of staff (3.3*37 =124 drivers). The
average salary per driver is then multiplied by the number of drivers to obtain the total salaries
paid per annum to drivers. The salary per annum was inflated each year by 10%. Salaries of
other staff have been added by applying the same logic explained previously. Another additional
opex component is the cost of insurance which is assumed to be fixed throughout the concession
period. It is calculated by multiplying a fixed rate of 0.3% by the total cost of infrastructure
excluding cost of stations and rolling stock. The final cost component is the Selling, General and
Administrative expenses. This is a fixed cost of EGP 50 mln and is indexed each year by 10%.
The total opex per year was calculated to be EGP 367 mln. This value constitutes about 5% from
the initial investment of the project which is considered higher than the normal which is 2-3%. In
order to account for the major maintenance or major over whole of the rolling stock cars every 8
years or another specified period; the opex amount in the model is higher than usual (5%) and it
was assumed a EGP 50 mln amount each year as other opex.

85
All Opex calculations are illustrated in the below figure.
Figure 4.1: OPEX Calculations
4. The total initial investment required during the construction phase of the project is the
total CAPEX which includes the cost of construction of infrastructure and stations, and initial
rolling stock which is estimated to be EGP 11,377 million. According to the funding
assumptions, 40% of this value will funded through equity together with the capitalized interest
expense during the construction period. The drawdown of equity is during the three years of
construction. The other 60% of the CAPEX amount is funded through debt in both foreign and
local currencies. The drawdown of debt will be during the construction period and the repayment
will start in 31 December 2019 with the start of the operation period. The weight of the local
currency debt is 20% from the total debt; therefore the total debt in local currency is EGP
OPEX
Maintenance
Infrastructure0.5% from total CAPEX * 10%
inflation inc. per annum
Stations3% from total CAPEX stations * 10%
inflation inc. per annum
Rolling Stock
1.5% from total CAPEX rolling stock * 3% foreign inflation rate * 2.5% FX devaluation per annum
Insurance0.3% from CAPEX infrastructure only
Salaries
DriversTotal no. of drivers 124 * (avg. salary
30,000 EGP * 10% annual inc. in salary)
Other StaffTotal no. of staff 200 * (avg. salary 180,000
EGP * 10% annual inc. in salary)
Power Consumption
Rolling Stock
No. of trains 37.4 * % trains in
maintenance 10% = 33 no. of trains
in operation
No. of trips/train 10 * no. of trains 33 = total no. of trips/day 330 * distance 69.7 km =
total distance covered by all trains/day 23,016 km/day
Distance covered by all trains/ year 6.9 * power consumption
16.1 kwh/km * price/kwh 0.75 = total consumption 83.4 mln
EGP
DepotPower consumption 568,182
kwh * price 0.75/kwh
StationsPower consumption/station * stations 11 * price 0.75/kwh
Other Opex50 * 10% inc. with inflation
SG & A2% from total
revenues
86
1,365.3 million. The weight of the foreign currency debt is 80% from the total debt; therefore the
total debt in foreign currency is $ 709.3 million which is equivalent to EGP 5,461.1 million.
4.2.1.2 Model Outputs
As explained earlier in the methodology chapter, the outputs of the financial model are;
key ratios such as DSCR and Equity IRR, financial statements, and an overall summary of the
entire model. Financial statements are income statement, balance sheet, and cash flow
statements.
Income Statement
The income statement is composed of total revenues and COGS to obtain the gross profit.
COGs and gross profit are also calculated as a percentage of revenues. Selling and administrative
expenses are deducted from the COGS to obtain the EBITDA. Depreciation expense is deducted
from the EBITDA to obtain the EBIT or the total operating income. The net of the interest
expense and interest income are calculated to obtain the taxable income (EBT). It was assumed
in the model a 5% of annual nominal interest rate earned on cash. The interest income is
calculated by multiplying the 5% earned on cash by the average of the beginning of cash
assumed in the first year 2017 (40 mln EGP) and the ending cash balance calculated at the end of
the same year. Tax expense was calculated by the automatic carry forward approach. The tax
expenses are then deducted from the taxable income or EBT to obtain the net income. The net
income of the project was in negative value for the first two years (2017 and 2018) and then it
started to break-even and producing positive value by the year 2019. The net income was
calculated as a percentage from revenues by starting as 21.3% in 2019 to 68.3% in 2045.
Balance Sheet
The current asset components in the balance sheet are cash, accounts receivables and
inventory; while the long term asset component is the net book value of fixed assets (obtained in
the Capex calculation sheet). Accounts receivables was calculated by multiplying receivable
days by total revenue for each year (15 days * 1,405/365 = 58 mln EGP) and following the same
methodology, inventory was calculated by multiplying the inventory days by total COGs for
each year (30 days * 339/365 = 28 mln EGP). The value of the total assets was calculated by
adding the value of the current assets and the long term assets for each year. Current liabilities
components are revolver (short term debt) which is in this project equal to zero and accounts
payable. Accounts payable was also calculated by multiplying payable days by total COGs for

87
each year (30 days * 339/365 = 28 mln EGP). All accounts receivables, payables, and inventory
will start with the operation period of the project. The long term liability is the long term debt
obtained from the funding calculation sheet. The shareholder’s equity is composed of paid in
capital and retained earnings. The paid in capital is the equity funding cumulative, and assuming
no dividends are distributed among shareholders, thus the retained earnings are equal to the net
income and the retained earnings of the previous year. Retained earnings are negative in the first
three years of the project and it will yield a positive value by year 2020. The balance sheet
checker indicates that all calculations are correct.
Cash Flow Statement
1. The cash flow from operations includes (net income + depreciation expense – change
in accounts receivables – change in inventory + change in accounts payables)
2. The cash flow from investing activities is the CAPEX in negative value
3. The cash flow from financing activities includes long term debt issuance in positive
value and repayment in negative value added to new equity investments in 2017 and 2018 (2,840
and 1,394 respectively).
The cash flows from operation, investing, and financing activities are calculated to obtain
the change in cash for each year. By adding the change amount to the beginning balance of cash,
an ending balance for each year is obtained.
Key Ratios
After obtaining the change in actual cash, the equity IRR was calculated. The equity IRR
calculation is based on equity cash flows; the cash outflow in the first three years (2016, 2017,
and 2018) is the equity investments of values 1,022, 2,840, and 1,394 mln EGP respectively,
while the cash inflow is the change in cash calculated in the cash flow statements taking into
account only the positive values starting from year 2019 (after equity investments). The Equity
IRR for the project was calculated to be 15%.
The Debt Service Coverage Ratio (DSCR) was calculated and it started to be more than
one in year 2019 (1.01) which is considered acceptable by lenders. The DSCR increased until it
reached a value of 19.34 in 2031 which indicates a fine ability of the project sponsor to repay
debt.
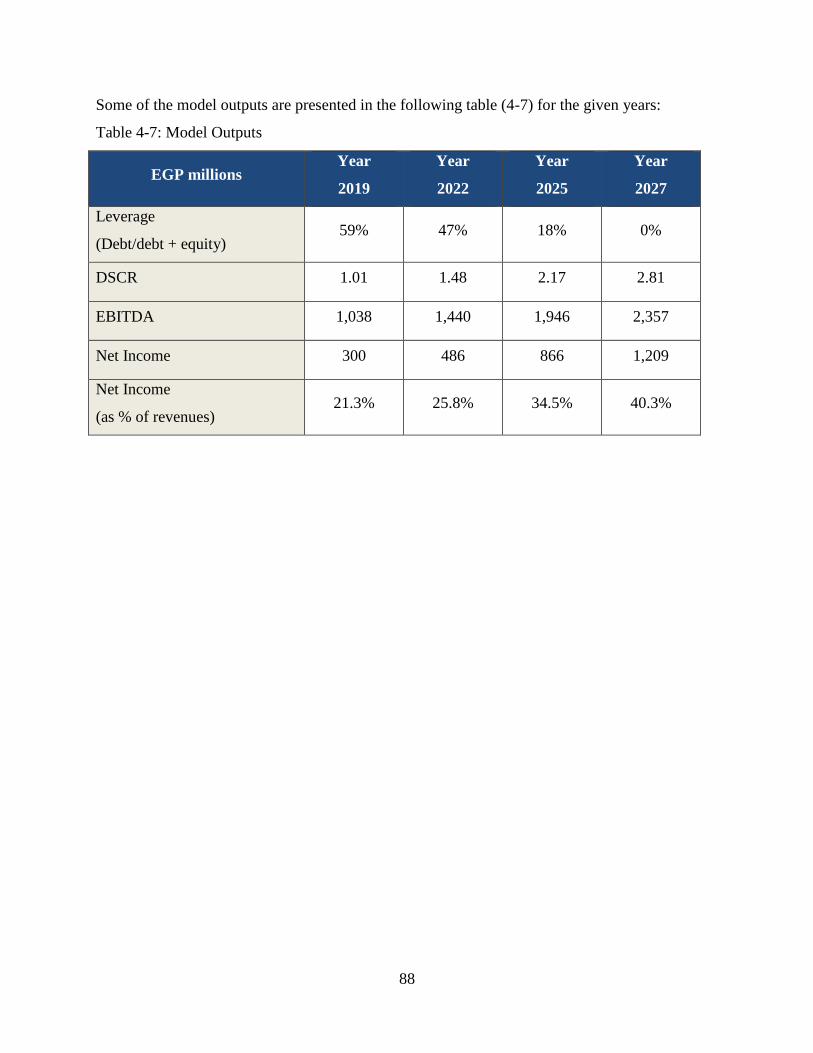
88
Some of the model outputs are presented in the following table (4-7) for the given years:
Table 4-7: Model Outputs
EGP millions Year
2019
Year
2022
Year
2025
Year
2027
Leverage
(Debt/debt + equity) 59% 47% 18% 0%
DSCR 1.01 1.48 2.17 2.81
EBITDA 1,038 1,440 1,946 2,357
Net Income 300 486 866 1,209
Net Income
(as % of revenues) 21.3% 25.8% 34.5% 40.3%

89
4.2.1.3 Sensitivity Analysis
Sensitivity analysis was conducted on the following key inputs; construction costs,
change in revenues (or change in demand), change in operating costs, and foreign exchange rate
(FX EGP/USD), and the change in the equity IRR was calculated. The following table shows the
original value for each variable and the percentage change in each with their corresponding
values.
Table 4-8: Change in Variables
Variable Unit Original
Value -30% -20% -10% 0% 10% 20% 30%
Construction
Cost EGP mln 7,292.84 5,105 5,834.3 6,563.6 7,292.8 8,022.1 8,751.41 9,480.69
Change in
Revenues
(Demand)
No. of
Passengers
464,671 325,270 371,737 418,204 464,671 511,138 557,605 604,073
594,456 416,119 475,565 535,010 594,456 653,902 713,347 772,793
730,227 511,159 584,181 657,204 730,227 803,249 876,272 949,294
846,532 592,572 677,226 761,879 846,532 931,185 1,015,838 1,100,492
FX Rate EGP/USD 7.15 5.01 5.72 6.44 7.15 7.87 8.58 9.30
OPEX EGP mln 367 257 294 330 367 404 440 477
The results are presented in following table showing the effect of change in each variable on the
equity IRR.
Table 4-9: Sensitivity Results
Key Inputs
Equity IRR
% Deviation in Variable from Base Case
-30% -20% -10% 0% 10% 20% 30%
Construction Cost 18% 17% 16% 15% 14% 14% 13%
Change in Revenues (Demand) 11% 12% 14% 15% 16% 18% 19%
Change in OPEX 17% 16% 15% 15% 15% 14% 13%
FX Rate 20% 18% 16% 15% 14% 13% 12%

90
Figure 4.2: Sensitivity Chart
The chart shows that the variables with the largest effect on IRR are the FX rate and
change in revenues. Changing the cost of construction from the original value and change in
opex also affects the equity IRR. The foreign exchange rate which has the largest effect on the
equity IRR, given the fact that 80% of the debt financing is in US dollars, was increased with
the percentages shown in the below table to calculate the expected equity IRR.
Table 4-10: FX Rate Sensitivity
8%
10%
12%
14%
16%
18%
20%
-40% -30% -20% -10% 0% 10% 20% 30% 40%
Equity IRR
% Deviation in Variable
Sensitivity Analysis Chart
Construction cost
Change in Revenues (Demand)
Change in OPEX
FX Rate
% Increase FX Rate Equity IRR
0% 7.15 15%
5% 7.51 14%
10% 7.87 14%
15% 8.22 13%
20% 8.58 13%
25% 8.94 12%
30% 9.30 12%

91
Figure 4.3: FX Rate Sensitivity Chart
4.2.2 Case Studies Comparison
The financial models of three case studies were compared according to: the type of each
project, total project duration, the CAPEX or project unit, CAPEX components, funding
assumptions (D/E ratios), unit of cost (OPEX), components of cost (OPEX), unit of revenue,
components of revenue, IRR, and NPV. These case studies are the Salam to 10th of Ramadan
LRT project described earlier in the previous section, East Port Said Port project, and the
Wastewater Treatment Plant project in 5th settlement in New Cairo area. This comparison is
conducted in order to show the main aspects of the financial model and how it differs from one
project to another.
Table 4-11: Financial Models Comparison
Case Studies Comparison (Financial Models)
Project
Name
Salam to 10th of Ramadan
LRT
East Port Said Port
Project
WWTP in 5th
Settlement
Duration 30 years 32 years 20 years
Type Rolling Stock Container Terminal + General
Cargo / Roro Terminal Waste Water Treatment
Plant
Project Unit
(CAPEX) km m2 m3
10%
11%
12%
13%
14%
15%
16%
7 7.5 8 8.5 9 9.5
Equity IRR (%)
FX Rate EGP/USD
FX Rate Sensitivity Chart

92
CAPEX
Components
Infrastructure
Stations
Rolling Stock
Infrastructure
Equipment
Service vehicles
Generators
IT
Buildings
Machinery and
equipment
Vehicles
Computers
Funding
Assumptions
Equity: 40%
Debt: 60%
Equity: 50%
Debt: 50%
Equity: 20%
Debt: 80%
Unit of Cost
(OPEX) Rolling Stock/Drivers Equipment/Staff
Machinery and
Equipment/staff
Components
of Cost
(OPEX)
Maintenance: - Infrastructure
- Rolling Stock
- Stations
Insurance
Staff/Drivers Salaries
Power Consumption
-Traction
-Depot
-Stations
SG & A
Maintenance: - Infrastructure (Quay Wall,
Yard Infrastructure)
- Equipment
- IT
Insurance
Staff Salaries
Other OPEX
SG & A
Fixed operating
expenses
Variable operating
expenses
Electricity expenses
SG & A
Unit of
Revenue Passengers Containers (TEU)
Sewage Treatment
Charge
Component
of Revenue
Main Revenue Source:
Ticket Sales.
Other Revenues: Advertisements in stations and
rolling stocks, parking tickets.
Transshipment Containers: Full
Empty
Foreign Trade: Import
Export
Main Revenue Source: Capacity Charge,
Fixed/variable
operations charge.
Other Revenues: Sludge Sales
IRR
Private Sector: Equity IRR
15%
Private Sector: Equity IRR
13%
Government: Project IRR
26%
Private Sector: Project
IRR
21.1%
NPV - Private sector (Developer)
$46.65 mln -

93
4.3 Value for Money Analysis
This section adopts the value for money analysis process of the Wastewater Treatment
Plant (WWTP) project in New Cairo including both quantitative and qualitative assessments. It
includes the development and validation of the Public Sector Comparator model together with
the shadow bid model derived from the financial model of the WWTP project. After obtaining
the net present value for both procurement options (public and PPP), values are compared in
order to achieve the VFM for different discount rates. The data acquired for this section was
gathered from the IFC (PPP Central Unit advisor).
4.3.1 Public Sector Comparator (PSC) for WWTP Project
The PSC was developed following the same methodology described in the previous
chapter. Results were validated by comparing the numbers obtained with the actual numbers
given by the IFC for that project. The total duration of the WWTP project is 20 years; the
construction was the first two years (2010 and 2011) in addition to the pre-construction costs
incurred 6 months beforehand (i.e. in 2009). The operation phase started in the year 2012 for the
remaining 18 years.
4.3.1.1 Raw PSC
1. CAPEX
The cost of construction for this project was obtained from reference projects, in other
words, the conventional public works of 15 plants (small, medium, and large) constructed over
the last 20 years in Egypt. It was concluded that the capital costs ranging average was 2,500-
3,000 EGP/m3 for comparable plants in the year 2007. As for the major maintenance for capex
components, it was assumed that mechanical equipment, civil works, electrical systems require
major refurbishment once in 20 years. The pre-construction and construction costs are 106.2,
305, and 266 EGP mln for years 2009, 2010, and 2011 respectively. Major maintenance costs
were calculated by adding the pre-construction and construction costs, and multiplying them
with the percentages given in the following table.
Table 4-12: Major Maintenance Percentages
Year 2016 2020 2021 2023 2028
% Capex Maintenance 0.43% 1.58% 2.10% 0.61% 7.95%

94
The nominal values of capex were obtained by applying the following inflation rates for
each year.
Table 4-13: Inflation Rates
Year 2007 2008 2009 2010 2011 2012 2013 2014 ..2028
Inflation 9.9% 7% 7.2% 6.5% 4.8% 5.2% 5.5% 7% 7%
2. OPEX
The operation and maintenance costs assumptions are based on the conventional public
works contracts in Egypt. The data were provided from the General Organization for Sanitary
Drainage GOSD. The operation and maintenance costs were assumed to be EGP 13.7 mln/year.
However, the insurance cost was accounted for in the capex (EGP 1.2 mln/year). Therefore, the
O&M costs are EGP 12.5 mln/year (13.7 – 1.2 = 12.5 mln). The nominal values of opex were
obtained by applying the inflation rates mentioned in the previous table 4-12.
4.3.1.2 Financing Costs
They are the cost of financing of the Government of Egypt to pay contractor under a
public works project. The cost of funds (or interest) was assumed to be 9.5% on a 20 years term
with grace period of three years (initial construction period). The beginning of year bond
principal is the initial capex amount cumulative. There are three bonds; bond no1 with value of
EGP 127.8 mln, bond no 2 with value of EGP 421.3 mln, and bond no 3 with value of EGP
320.2 mln. The drawdown of bonds was during the construction period of the project. Bond no.1
was collected in the first year, bond no.2 was collected in the second year, and bond no.3 was
collected in the third year. Repayment for bond no.1 was calculated by dividing the bond value
by the remaining years (127.8 / 19 = 6.7 mln), repayment for bond no.2 and 3 were also
calculated following the same methodology (421.3 / 18 = 23.4) (320.2 / 17 = 18.8). Total
repayment amount was calculated by adding the repayment values for the three bonds. The total
bond repayment was deducted from the beginning of year bond principal to obtain the end of
year bond principal. The interest paid during operation period was calculated by multiplying the
interest percentage (9.5%) by end of year bond principal. The net present value (NPV) for the
interest amount during operation is calculated to be added to the PSC components.
4.3.1.3 Risk Analysis
95
Risks were identified through two group discussions with panel of five experts as stated
by the IFC. The probability and quantity (or consequence) of each risk were obtained based on
international benchmarks of public works projects. A total of 25 risks were identified; 14 risks
associated with construction phase and 11 with operating phase. The most significant
construction risks identified by the panel are cost overrun, time overrun, changes in costs of
imported goods, latent defect risk, default risk (due to government), performance risk, and assets
condition. However, the most significant operating risks identified by the panel are; changes of
costs in imported goods, inflation risks, maintenance risks, and regulatory risk. The following
table (4-13) shows the probability of occurrence, the consequence, and the impact of each risk
(impact of risk = probability X consequence) under both conventional and PPP procurement. The
allocation of risks between retained, transferable and shared is also presented in table (4-13).
The value of each risk was calculated following the methodology described in the
methodology chapter by multiplying the percentage impact of risk by capex for construction
risks or opex for operating risks.

96
Table 4-14: Risk Analysis
Allocation Risk Description Consequence
Risk Quantification Risk Allocation as a %
Consequence
(%)
PSC
Probability
(%)
PSC
Impact
(%)
PSC
Consequence
(%)
PPP
Probability
(%)
PPP
Impact
(%)
PPP
Public
Procurement
PPP
Procurement
by SP by
Gov by SP
by
Gov
Transferable
Cost
Overrun (as a % of
CAPEX)
Risk that
construction
cost are
greater than
estimated
Increase in
costs
25% 50% 13% 25% 15% 4% 0% 100% 100% 0%
Transferable
Time
Overrun (as
a % of
CAPEX)
Risk that
construction
timelines are
not met
Increase in cost
including
escalation of
prices and time
delays
25% 50% 13% 25% 15% 4% 0% 100% 100% 0%
Transferable
Design Risk (as a % of
CAPEX)
Risk that the
design may
not achieve
output
specifications,
hence does
not
accommodate
demand needs
Additional cost
to rectify or
operate
5% 10% 1% 5% 10% 1% 0% 100% 100% 0%
Transferable
Changes in
costs of
imported
goods (as a % of
CAPEX)
Risk that
exchange rate
fluctuations
impact on the
envisaged
costs of
imported
inputs
required for
construction
Additional cost
or reduction in
cost
-10% 100% -10% -10% 100% -10% 0% 100% 100% 0%
Transferable
Insolvency
Risk (as a %
of CAPEX)
Risk that the
service
provider can
go insolvent
as a result of
cash flow
problems
Termination. If
PPP,
termination is
subject to
lender step in
right
20% 15% 3% 20% 15% 3% 0% 100% 100% 0%
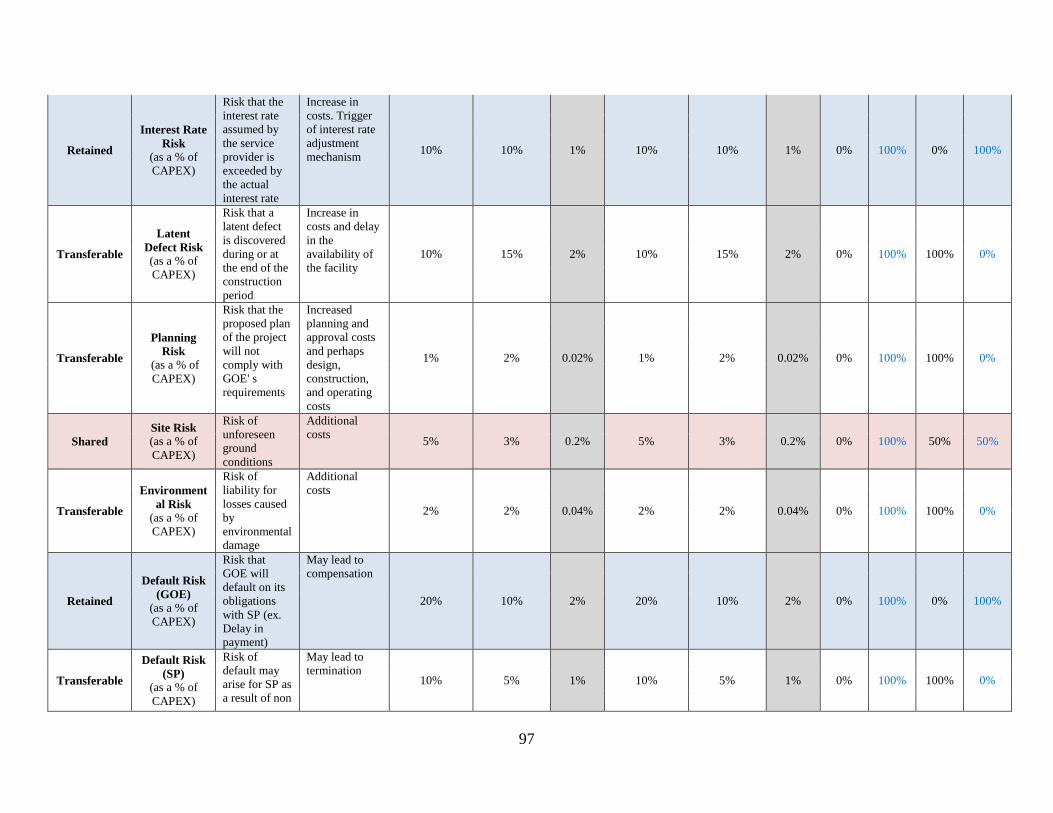
97
Retained
Interest Rate
Risk (as a % of
CAPEX)
Risk that the
interest rate
assumed by
the service
provider is
exceeded by
the actual
interest rate
Increase in
costs. Trigger
of interest rate
adjustment
mechanism 10% 10% 1% 10% 10% 1% 0% 100% 0% 100%
Transferable
Latent
Defect Risk (as a % of
CAPEX)
Risk that a
latent defect
is discovered
during or at
the end of the
construction
period
Increase in
costs and delay
in the
availability of
the facility
10% 15% 2% 10% 15% 2% 0% 100% 100% 0%
Transferable
Planning
Risk
(as a % of
CAPEX)
Risk that the
proposed plan
of the project
will not
comply with
GOE' s
requirements
Increased
planning and
approval costs
and perhaps
design,
construction,
and operating
costs
1% 2% 0.02% 1% 2% 0.02% 0% 100% 100% 0%
Shared
Site Risk (as a % of
CAPEX)
Risk of
unforeseen
ground
conditions
Additional
costs 5% 3% 0.2% 5% 3% 0.2% 0% 100% 50% 50%
Transferable
Environment
al Risk (as a % of
CAPEX)
Risk of
liability for
losses caused
by
environmental
damage
Additional
costs
2% 2% 0.04% 2% 2% 0.04% 0% 100% 100% 0%
Retained
Default Risk
(GOE) (as a % of
CAPEX)
Risk that
GOE will
default on its
obligations
with SP (ex.
Delay in
payment)
May lead to
compensation
20% 10% 2% 20% 10% 2% 0% 100% 0% 100%
Transferable
Default Risk
(SP) (as a % of
CAPEX)
Risk of
default may
arise for SP as
a result of non
May lead to
termination 10% 5% 1% 10% 5% 1% 0% 100% 100% 0%

98
performance
Transferable
Performance
Risk (as a % of
CAPEX)
Risk that the
quality of
service is not
as required
Partial or delay
in availability
of service 5% 50% 3% 5% 50% 3% 0% 100% 100% 0%
Transferable
Assets
Condition (as a % of
CAPEX)
Risk that the
project assets
condition will
not be in the
required
condition for
hand back to
the GOE
Increased
costs. There
may be a delay
in handover of
the plant or
delay in
operations after
handover
20% 30% 6% 5% 15% 1% 0% 100% 100% 0%
Transferable
Odor Risk (as a % of
O&M)
10% 25% 3% 10% 2% 0.2% 0% 100% 100% 0%
Transferable
Effluent
Wastewater
Quality Risk (as a % of
O&M)
Risk that
effluent
wastewater
does not meet
required
output
specifications
10% 5% 1% 10% 5% 1% 0% 100% 100% 0%
Transferable
Sludge Risk (as a % of
O&M)
Risk that
sludge does
not meet
required
output
specifications
2% 5% 0.1% 2% 5% 0.1% 0% 100% 100% 0%
Transferable
Changes of
costs in
imported
goods (as a % of
O&M)
30% 40% 12% 30% 40% 12% 0% 100% 100% 0%
Retained
Inflation
Risk
(as a % of
O&M)
Risk of
inflation
during O&M
period
Increased costs
50% 50% 25% 50% 50% 25% 0% 100% 0% 100%
Transferable Operating Risk that Increase in 1% 5% 0.1% 1% 5% 0.1% 0% 100% 100% 0%

99
Risk
(as a % of
O&M)
operating cost
are
underestimate
d
operating costs
Transferable
Maintenance
Risk
(as a % of
O&M)
Risk that
maintenance
costs differ
from
expectations
Increase in
operating and
maintenance
costs
10% 30% 3% 10% 2% 0.2% 0% 100% 100% 0%
Shared
Regulatory
Risk (as a % of
O&M)
Risk of
change in law
Increased costs
20% 40% 8% 20% 40% 8% 0% 100% 10% 90%
Transferable
Technology
Risk
(as a % of
O&M)
Risk that the
technology
may fail to
deliver
required
output specs
Increase in cost
to maintain or
replace
obsolete
technology
5% 10% 0.5% 5% 2% 0.1% 0% 100% 100% 0%
Retained
Utilities Risk
(as a % of
O&M)
Risk that the
utilities
required for
operation of
the plant may
not be
available
Delay in
construction or
operation of
the plant 10% 5% 0.5% 10% 5% 0.5% 0% 100% 0% 100%
Transferable
Public
Liability
Risk
(as a % of
O&M)
Risk for
liability for
injury or
damage to
any property
or item on the
premises
Compensation
costs
5% 25% 1% 5% 2% 0.1% 0% 100% 100% 0%

100
4.3.1.4 Discounted PSC
The net present value for capex, opex, financing costs, transferable risks, retained risks,
and shared risks were calculated at different discount rates, however the base case is the 12%, in
order to obtain the risk-adjusted PSC.
Table 4-15: Risk Adjusted PSC
NPV (EGP millions, discounted) 10% 11% 12% 13% 14%
Raw PSC
Capital Costs (CAPEX) 766 744 723.0 704 686
O&M Costs 163 148 133.7 121 111
Subtotal 929 892 857 825 797
Financing Costs
Financing Costs 363 340 319.0 300 282
Total non risk adjusted PSC 1,292 1,232 1,176 1,125 1,079
Transferable Risks
Cost Overrun 95.7 92.9 90.4 88.0 85.8
Time Overrun 95.7 92.9 90.4 88.0 85.8
Design Risk 3.8 3.7 3.6 3.5 3.4
Changes in costs of imports (76.6) (74.4) (72.30) (70.4) (68.6)
Insolvency Risk 23.0 22.3 21.7 21.1 20.6
Latent Defect Risk 11.5 11.2 10.8 10.6 10.3
Planning Risk 0.2 0.1 0.1 0.1 0.1
Environmental Risk 0.3 0.3 0.3 0.3 0.3
Default Risk (Service Provider) 3.8 3.7 3.6 3.5 3.4
Performance Risk 19.1 18.6 18.1 17.6 17.2
Assets Condition 45.9 44.6 43.4 42.2 41.2
Odor Risk 4.1 3.7 3.3 3.0 2.8
Effluent Wastewater Quality Risk 0.8 0.7 0.7 0.6 0.6
Sludge Risk 0.2 0.1 0.1 0.1 0.1
Changes in costs of imports 19.6 17.7 16.0 14.6 13.3
Operating Risk 0.1 0.1 0.1 0.1 0.1
Maintenance Risk 4.9 4.4 4.0 3.6 3.3
Technology Risk 0.8 0.7 0.7 0.6 0.6
Public Liability Risk 2.0 1.8 1.7 1.5 1.4
Subtotal 255.1 245.4 236.7 228.7 221.4
Retained Risk
Interest Rate Risk 7.7 7.4 7.2 7.0 6.9
Default Risk GOE 15.3 14.9 14.5 14.1 13.7
Inflation Risk 40.9 36.9 33.4 30.4 27.7
Utilities Risk 0.8 0.7 0.7 0.6 0.6
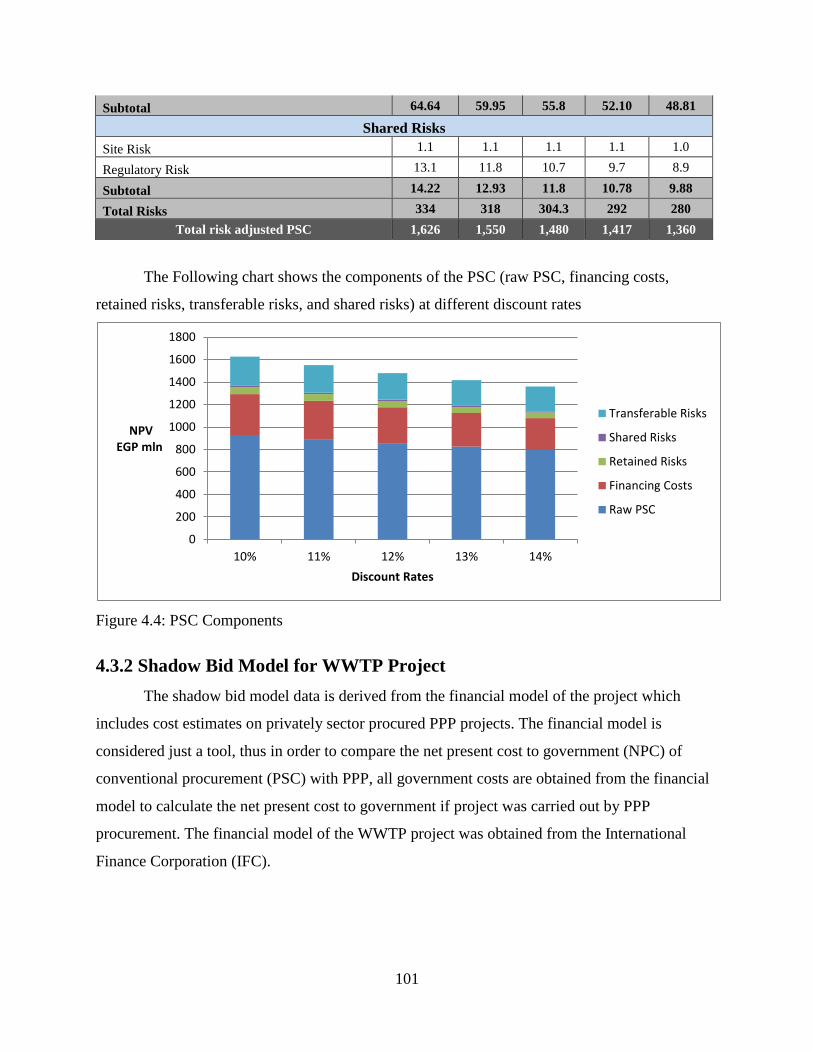
101
Subtotal 64.64 59.95 55.8 52.10 48.81
Shared Risks
Site Risk 1.1 1.1 1.1 1.1 1.0
Regulatory Risk 13.1 11.8 10.7 9.7 8.9
Subtotal 14.22 12.93 11.8 10.78 9.88
Total Risks 334 318 304.3 292 280
Total risk adjusted PSC 1,626 1,550 1,480 1,417 1,360
The Following chart shows the components of the PSC (raw PSC, financing costs,
retained risks, transferable risks, and shared risks) at different discount rates
Figure 4.4: PSC Components
4.3.2 Shadow Bid Model for WWTP Project
The shadow bid model data is derived from the financial model of the project which
includes cost estimates on privately sector procured PPP projects. The financial model is
considered just a tool, thus in order to compare the net present cost to government (NPC) of
conventional procurement (PSC) with PPP, all government costs are obtained from the financial
model to calculate the net present cost to government if project was carried out by PPP
procurement. The financial model of the WWTP project was obtained from the International
Finance Corporation (IFC).
0
200
400
600
800
1000
1200
1400
1600
1800
10% 11% 12% 13% 14%
NPV EGP mln
Discount Rates
Transferable Risks
Shared Risks
Retained Risks
Financing Costs
Raw PSC
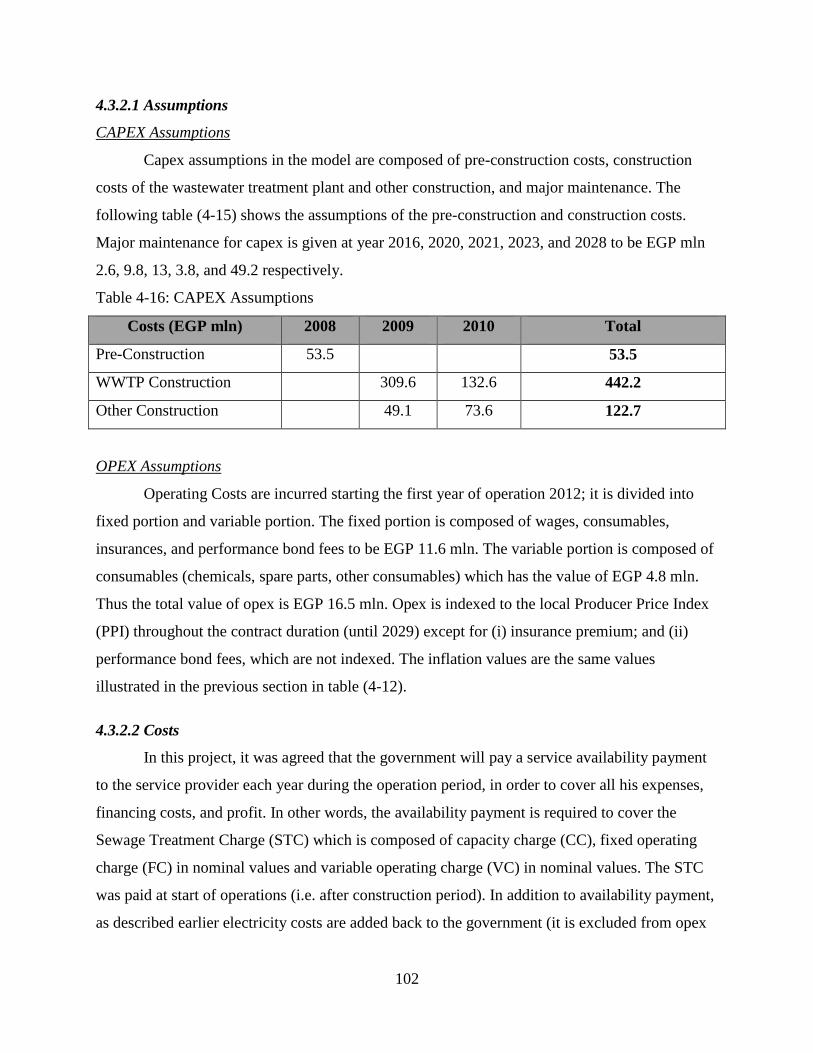
102
4.3.2.1 Assumptions
CAPEX Assumptions
Capex assumptions in the model are composed of pre-construction costs, construction
costs of the wastewater treatment plant and other construction, and major maintenance. The
following table (4-15) shows the assumptions of the pre-construction and construction costs.
Major maintenance for capex is given at year 2016, 2020, 2021, 2023, and 2028 to be EGP mln
2.6, 9.8, 13, 3.8, and 49.2 respectively.
Table 4-16: CAPEX Assumptions
Costs (EGP mln) 2008 2009 2010 Total
Pre-Construction 53.5 53.5
WWTP Construction 309.6 132.6 442.2
Other Construction 49.1 73.6 122.7
OPEX Assumptions
Operating Costs are incurred starting the first year of operation 2012; it is divided into
fixed portion and variable portion. The fixed portion is composed of wages, consumables,
insurances, and performance bond fees to be EGP 11.6 mln. The variable portion is composed of
consumables (chemicals, spare parts, other consumables) which has the value of EGP 4.8 mln.
Thus the total value of opex is EGP 16.5 mln. Opex is indexed to the local Producer Price Index
(PPI) throughout the contract duration (until 2029) except for (i) insurance premium; and (ii)
performance bond fees, which are not indexed. The inflation values are the same values
illustrated in the previous section in table (4-12).
4.3.2.2 Costs
In this project, it was agreed that the government will pay a service availability payment
to the service provider each year during the operation period, in order to cover all his expenses,
financing costs, and profit. In other words, the availability payment is required to cover the
Sewage Treatment Charge (STC) which is composed of capacity charge (CC), fixed operating
charge (FC) in nominal values and variable operating charge (VC) in nominal values. The STC
was paid at start of operations (i.e. after construction period). In addition to availability payment,
as described earlier electricity costs are added back to the government (it is excluded from opex

103
calculations in the model) due to the ‘pass through’ concept stated in the PPP contract.
Therefore, costs to government in this project under PPP procurement are the availability
payment and the electricity costs.
1. Availability Payment
The service availability payment or the sewage treatment charge was calculated by
adding the capacity charge, insurance, fixed charge, variable charge, and inflation. All values are
derived from the WWTP financial model. The capacity charge was calculated in the model by
setting a target return on equity (ROE) that equals to 22%. By doing so, the model will generate
this fixed portion of the tariff that will give the required ROE. The capacity charge value is EGP
177 mln/year.
It was assumed in the model that insurances are composed of; insurance breakdown
policy, insurance against theft, third party insurance, civil liability insurance, and insurance
against pollution. The insurance value is EGP 1.2 mln/year.
The fixed operating charge value was calculated to be EGP 8.2 mln/year, while the
variable operating charge was calculated to be EGP 4.9 mln/year. Inflation adjustments were
calculated only on the fixed and variables operating charges.
2. Electricity Costs
Electricity costs are divided into: (i) electricity connection cost which is part of the fixed
opex and represents 5% from the total fixed operating expenses; and (ii) electricity consumption
cost which is part of the variable opex and represents 49% from the total variable operating
expenses. It was assumed in the model that the electricity connection cost is 9.5 EGP/month
while the electricity fixed load is 4,530 KW. Thus, the electricity connection cost per year was
obtained by multiplying the cost 9.5 EGP/month by 12 months by the fixed electricity load to get
516,466 EGP/year (9.5*12*4530 = 516,466). This amount is inflated each year by the inflation
rates presented earlier in the previous section starting from the year 2012.
As for the variable portion, it was assumed that the electricity consumption cost is 0.21
EGP/kwh. The quantity of electricity purchased per day was calculated by deducting the
electricity generated per day from the electricity consumed per day for each year. The total
electricity consumption cost was calculated by multiplying the electricity cost per kwh by the
quantity of electricity purchased per day, this amount was then multiplied by 365 days to get the
consumption per year (0.21*56,259*365 = 4,394,405 EGP). The electricity consumption amount
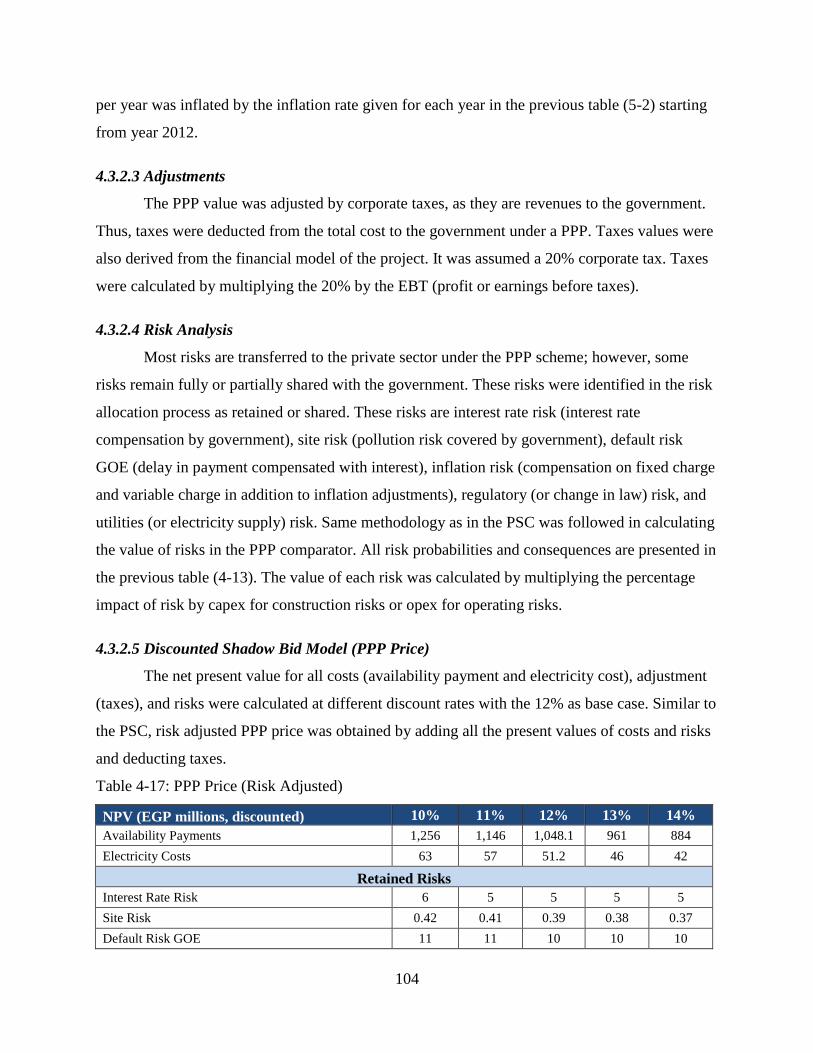
104
per year was inflated by the inflation rate given for each year in the previous table (5-2) starting
from year 2012.
4.3.2.3 Adjustments
The PPP value was adjusted by corporate taxes, as they are revenues to the government.
Thus, taxes were deducted from the total cost to the government under a PPP. Taxes values were
also derived from the financial model of the project. It was assumed a 20% corporate tax. Taxes
were calculated by multiplying the 20% by the EBT (profit or earnings before taxes).
4.3.2.4 Risk Analysis
Most risks are transferred to the private sector under the PPP scheme; however, some
risks remain fully or partially shared with the government. These risks were identified in the risk
allocation process as retained or shared. These risks are interest rate risk (interest rate
compensation by government), site risk (pollution risk covered by government), default risk
GOE (delay in payment compensated with interest), inflation risk (compensation on fixed charge
and variable charge in addition to inflation adjustments), regulatory (or change in law) risk, and
utilities (or electricity supply) risk. Same methodology as in the PSC was followed in calculating
the value of risks in the PPP comparator. All risk probabilities and consequences are presented in
the previous table (4-13). The value of each risk was calculated by multiplying the percentage
impact of risk by capex for construction risks or opex for operating risks.
4.3.2.5 Discounted Shadow Bid Model (PPP Price)
The net present value for all costs (availability payment and electricity cost), adjustment
(taxes), and risks were calculated at different discount rates with the 12% as base case. Similar to
the PSC, risk adjusted PPP price was obtained by adding all the present values of costs and risks
and deducting taxes.
Table 4-17: PPP Price (Risk Adjusted)
NPV (EGP millions, discounted) 10% 11% 12% 13% 14%
Availability Payments 1,256 1,146 1,048.1 961 884
Electricity Costs 63 57 51.2 46 42
Retained Risks
Interest Rate Risk 6 5 5 5 5
Site Risk 0.42 0.41 0.39 0.38 0.37
Default Risk GOE 11 11 10 10 10

105
Inflation Risk 42 38 34 31 28
Regulatory Risk 12 11 10 9 8
Utilities Risk 1 1 1 1 1
Subtotal 72 66 60.4 56 52
Adjustments (Taxes) (143) (129) (117.2) (106) (97)
PPP Price (risk adjusted) 1,248 1,140 1,043 957 881
4.3.3 Value for Money (VFM) Assessment
The Value for Money (VFM) concept is the essential element of the government decision
making on the PPP project. VFM assessment is done through quantitative and qualitative
assessments as described in the methodology chapter. The quantitative assessment is obtained by
the comparison between the risk-adjusted PPP price with the risk-adjusted PSC value. While, the
qualitative assessment includes intangible factors that are not included in the PSC as they are not
accurately quantifiable. These factors need to be considered in conjunction with PSC as part of a
fully informed evaluation process.
4.3.3.1 Quantitative Assessment
The cost to government through conventional procurement was calculated through the
PSC to give the following values in table 4-17.
Table 4-18: Cost to Government under Public Procurement - PSC
Net Present Value
(EGP mln)
Discount Rate
10% 11% 12% 13% 14%
CAPEX 766 744 723 704 686
O&M 163 148 134 121 111
Financing Costs 362.6 339.8 319.0 300.0 282.5
Total Risks 334 318 304 292 280
PSC Price (risk-adjusted) 1,625.5 1,550.1 1,480.0 1,416.6 1,359.6
However, the cost to government under PPP procurement was calculated to give the
following values in table 4-18.

106
Table 4-19: Cost to Government under PPP Procurement - Shadow Bid Model (PPP Price)
Net Present Value
(EGP mln)
Discount Rate
10% 11% 12% 13% 14%
Availability Payment 1,256 1,146 1,048 961 884
Electricity Cost 63 57 51 46 42
Retained Risks 71.9 65.8 60.4 55.7 51.5
Adjustments (143) (129) (117) (106) (97)
PPP Price (risk-
adjusted) 1,247.9 1,139.8 1,042.5 956.7 880.5
The value for money (VFM) was calculated to be the following values in table 4-19.
Table 4-20: Value for Money to Government - VFM (EGP mln)
Net Present Value
(EGP mln)
Discount Rate
10% 11% 12% 13% 14%
VFM 377.7 410.4 437.5 459.9 479.1
Figure 4.5: Value for Money Analysis
The chart shows cost savings for the government from structuring the project through
PPP procurement as opposed to traditional public sector procurement. For a 250,000 m3/day
plant, VFM estimates were around EGP 437.5 million at 12% discount rate over a 20-year
concession period. The results should only be taken as a reference to the government about the
1,626 1,550
1,480 1,417 1,360
1,248 1,140
1,043 957
881
-
200
400
600
800
1,000
1,200
1,400
1,600
1,800
10% 11% 12% 13% 14%
NPV (EGP mln)
Discount Rate (%)
Public vs. PPP Procurement
PSC Price (risk-adjusted)
PPP Price (risk-adjusted)

107
savings that the private sponsor could generate to the government if project is carried out by
PPP.
4.3.3.2 Qualitative Assessment
There are a number of qualitative intangible elements not captured in the VFM
quantitative analysis that should be taken into consideration in the decision to structure PPP
projects. These elements are:
Quality of Service: Usually higher quality construction, maintenance and operation in
PPP projects as concessionaire remains involved in the project over the long run to meet
contractual targets.
Contract Enforcement: Contracts easier to enforce under PPP scheme.
Institutional Capacity: PPP contract is an incentive for government to develop local
capacity to structure future PPP transactions.
Fiscal Savings: Freeing up of government funds to pursue other critical sectors (e.g.
Water).
Promotion of Competitive Markets: Competition for a PPP contract ensures the best
price to the government.
Innovation: Development of local capital markets to finance future PPP transactions.
108
4.4 Structuring of the Procurement Process
In this section a case study is presented in order to validate the concept of customizing
the procurement process. As described in the previous chapter, selection of the successful bidder
does not only depend on the lowest price; however, it depends on the nature of each project and
the risks assigned to each party in order to ensure the success of the project.
4.4.1 Case Study – New Cairo Wastewater Treatment Plant
The case study adopted in this section the New Cairo Wastewater Treatment Plant
(WWTP). This is the same project that was presented in the financial model and the value for
money sections. It is the first public-private partnership (PPP) project in Egypt. The plant will
initially have a capacity of 250,000m³/day, to serve over one million people. The final capacity
will be 500,000m³/day. The $472m project contract was awarded by the Egyptian Ministry of
Housing, Utilities & Urban Developments (MHUUD) through the New Urban Communities
Authority (NUCA) in June 2009. With a concession period of 20 years, the contract involves
design, construction, financing, operation and management of the new plant. The project
ownership will be transferred to NUCA at the end of the concession period. The purpose of this
project is to provide the city of New Cairo and the surrounding area with a cost-effective,
environmentally safe wastewater treatment facility to meet the requirements of present and
projected population growth. It is also intended to promote PPP as a model for future water and
wastewater projects in Egypt.
In this project, the government took over the electricity consumption risk through
following the concept of the “pass-through charge”. The “pass through charge” was stated in the
contract as the amount paid by NUCA to reimburse the Service Provider for the full cost of paid
electricity bills, up to the Maximum Electricity Consumption during Operations Period excluding
any costs related to the initial connection charge or the construction, operation and maintenance
of any transformer, electricity sub-station or back-up power. This risk was handled in the
contract by stating “Maximum Electricity Consumption” relating to the maximum consumption
stated by the private sector in its financial bid.
In the procurement process of this project, the selection of the successful bidder did not
depend only on the lowest cost. The fact that the government bears the electricity consumption
risk, the government tried to select the bidder with the higher technology offer. Bidders that

109
submit higher technology solutions in their offers consume less power or electricity.
Accordingly, the selection of the bidder was not based on the lower cost, but on the more
suitable technology level that will minimize the cost of the electricity risk to the government.

110
CHAPTER 5 : CONCLUSIONS
5.1 Conclusions
The research undertaken in this study depicts an integrated framework approach for PPP
projects in Egypt. In spite of the scale and scope of PPPs, there remain important gaps in
scholarly and practitioner understanding of how the concept has been applied. There are
important aspects other than financial modeling and risk allocation that were not considered in
literature that ensure the success of the PPP process. Accordingly, this thesis presents the
integrated approach that considers all aspects and concepts relating to PPP projects. This
integrated approach can contribute to the successful implementation of PPP projects. The
integrated framework is divided into three main pillars which are; the technical structuring of the
project, financial modeling, and structuring of the procurement process. In this thesis, the three
pillars were subdivided into a series of steps that structure the integrated framework. Each pillar
had its research methodology that was followed by an application on real life cases, and a
validation exercise.
The first pillar in the research is the technical structuring of the project. The technical
structuring of the project is the first step in the initial assessment of a PPP project. The initial
assessment of a PPP project also includes the development of the Public Sector Comparator
(PSC). The technical structuring of a PPP project includes structuring of the contractual terms,
quantification, and allocation of risk. The results concluded that one of the most important risks
in PPPs is the financing risk. In Egypt, this risk is allocated to the government so that PPP
projects become affordable and bankable. Moreover, as a risk mitigation strategy the government
agreed on refinancing scheme with the banks. This section also concluded that risks that cannot
be quantified are considered as deal breakers for the whole PPP process. Regarding the
contractual terms, it was concluded that the termination term is one of the most important clauses
in the contract. Upon termination due to service provider default, banks will receive 100% of the
outstanding debt; however this is not the case in other countries such as the United Kingdom.
This section was validated by presenting the PPP Schools project and the Nile River Bus Ferry
project. In each case study, the old structure of the project was described with its restructuring to
make the project eligible for PPP procurement.
111
The second pillar of the research is the financial modeling of PPPs. The financial model
is considered vital for the success of PPP projects. It is needed to evaluate Value for Money
(VFM) as opposed to the normal public procurement method. In this study, a template was
developed, applied, and validated on the Salam to 10th of Ramadan LRT project. The design of
the model consists of three main parts; assumptions, calculations, and outputs. By applying this
design on the Salam to 10th of Ramadan LRT project, the results concluded equity IRR of 15%
and Debt Service Coverage Ratio (DSCR) to be more than one (1.01) which is considered
acceptable by lenders. The DSCR increased until it reached a value of 19.34 which indicates a
fine ability of the project sponsor to repay debt. Sensitivity analysis was conducted on key inputs
such as; construction costs, change in revenues (or change in demand), change in operating costs,
interest rates (both on local and foreign currencies debt), inflation rate, and foreign exchange rate
(FX EGP/USD), and the change in the equity IRR was calculated. Sensitivity analysis results
showed the variables with the largest effect on the IRR are the FX rate and change in revenues.
Changing the cost of construction from the original value and change in opex also affects the
equity IRR.
In light of adopting the detailed front-end process of PPP projects in Egypt, this study
demonstrates the value for money analysis process. The value for money (VFM) is considered
the core concept of PPP projects. The financial model together with the PSC are required by the
government to evaluate the VFM of a PPP project as opposed to the normal public procurement.
Consequently, a value for money assessment was conducted both quantitatively and qualitatively
on the Wastewater Treatment Plant project in New Cairo. The quantitative assessment compares
the cost of the project to government under conventional public procurement and PPP
procurement, while the qualitative assessment considers the intangible elements that are not
accounted for in the quantitative assessment. The VFM assessment study involves the
application and validation of the PSC methodology. The results concluded that the risk-adjusted
net present cost to government under the PSC was EGP 1,480 millions, while the risk-adjusted
net present cost to government under PPP was EGP 1,042 millions at 12% discount rate.
However, the cost to government under both PSC and PPP were also calculated for different
discount rates (10%, 11%, 13%, and 14%). Thus, this project yielded a value for money of EGP
438 millions. The qualitative aspects for this project were concluded to be the quality of service,
112
contract enforcement, institutional capacity, fiscal savings, promotion of competitive markets,
and innovation.
Last but not least is the final pillar of the integrated framework which is structuring of the
procurement process. The proper handling of procurement activities is considered crucial to the
success of the PPP project. Accordingly, this section of study is a qualitative assessment of the
selection and the evaluation criteria of bidders. It was concluded that a single bid may be
accepted if other qualified bidders have failed technically and it appears that the bid was made in
the bidder’s belief that there would be a good level of competition. Moreover, the bid price shall
be within 20% of the price expected by government. The weighing criteria for technical and
financial offers for PPP proposals are explained according to the PPP Central Unit in Egypt and
compared to the procurement law 89. The results showed that the technical offer of PPP projects
has to take higher weight or percentage than the financial offer based on the degree of
sophistication (technically) of the project. The technical offer weighs 70% while the financial
offer weighs the remaining 30%. Moreover, the bid with the highest point value is selected
assuming the maximum or optimum value is 1. The concept of customizing the procurement
process was validated by the New Cairo Wastewater Treatment Plant project. The procurement
model of the WWTP concludes that the selection of the bidder was not based on the lowest cost,
but on the most suitable technology level bid that will minimize the consumption of electricity,
thus reduce electricity costs to the government.
Finally, the implementation of these three pillars can wrap up the idea of the integrated
framework approach that aims at ensuring the success of PPP projects. This framework was
intended for governmental use; however it can be used by the different stakeholders involved in
the process.
113
References
Akintoye, Akintola, Matthias Beck, and Cliff Hardcastle. Public-Private Partnerships:
Managing Risks and Opportunities. Oxford, UK: Blackwell Science, 2003. Wiley Online
Library. Wiley Online Library, 25 Feb. 2008.
Asenova, Darinka, and Matthias Beck. "A Financial Persepective on Risk Management in Public
Private Partnership." Public-Private Partnerships: Managing Risks and Opportunities.
Oxford, UK: Blackwell Science, 2003. Wiley Online Library. Wiley Online Library, 25
Feb. 2008.
Australia. Australian Government. Department of Infrastructure and Regional Development.
National Public Private Partnership Guidelines: Volume (4) Public Sector Comparator.
Australian Government, 2013.
Burger, Philippe. "Public-Private Partnerships: Affordability, Risk Sharing and Value for
Money." OECD Meeting. Rabat. May 2008.
Burger, Philippe, and Ian Hawkesworth. "How To Attain Value for Money: Comparing PPP and
Traditional Infrastructure Public Procurement." OECD Journal on Budgeting 1 (2011): 1-
50.
Chan, Joseph H.L, Daniel W.M Chan, Albert P.C Chan, Patrick T.I Lam, and John F.Y Yeung.
"Developing a Fuzzy Risk Assessment Model for Guaranteed Maximum." Journal of
Facilities Management (JFM) 9.1 (2011): 34-51.
Chan, Albert P.C, and Esther Cheung. Public Private Partnerships in International Construction.
Routledge, 2014. Routledge. Technology and Engineering, Jan. 2014.
Chang, L. and Chen, P. (2001). "BOT Financial Model: Taiwan High Speed Rail Case." J.
Constr. Eng. Manage., 10.1061/(ASCE)0733-9364(2001)127:3(214), 214-222.
Chinyio, Ezekiel, and Alasdair Fergusson. "A Construction Perspective on Risk Management in
Public Private Partnership." Public-Private Partnerships: Managing Risks and
Opportunities. Oxford, UK: Blackwell Science, 2003. Wiley Online Library. Wiley
Online Library, 25 Feb. 2008.
Cruz, Carlos Oliveira, and Rui Cunha Marques. "Public Sector Comparator." Infrastructure
Public Private Partnerships: Decision, Management, and Development. Verlag Berlin
Heidelberg: Springer, 2013.
Egypt. Ministry of Finance. PPP Central Unit. The National Program for Public Private
Partnership. Cairo: PPP Central Unit, 2009.

114
El Fathali, Hassan. Private Partner Selection and Bankability Assessment of PPP in
Infrastructure Projects. Thesis. Concordia University, Montreal, Canada, September
2015. Quebec, Montreal: Spectrum Library Concordia.
European Commission. Guidelines for Successful Public Private Partnerships. 2003.
European Investment Bank (EIB). How to Prepare, Procure, and Deliver PPP Projects.
European Investment Bank, 2015. The Epec PPP Guide.
Grout, Paul A. Value-for-money Measurement in Public Private Partnerships. Rep. 2nd ed. Vol.
10. European Investment Bank (EIB), 2005.
Hardcastle, C., et al. "Critical success factors for PPP/PFI projects in the UK construction
industry: A factor analysis approach." Construction management and economics 23.5
(2005): 459-471.
Hovy, Pauline. Risk Allocation in Public-Private Partnerships: Maximizing value for money.
International Institute for Sustainable Development (IISD), Aug. 2015.
Ismail, Kharizam, Roshana Takim, and Abdul Hadi Nawawi. "The Evaluation Criteria of Value
for Money (VFM) of Public Private." ResearchGate 5 (2011).
Ke, Yongjian, ShouQing Wang, et al. "Preferred risk allocation in China's public-private
partnership (PPP) projects." Elsevier Ltd. 28.5 (2010): 482-492.
Kerali, Henry. "Public sector comparator for highway PPP projects." Online Presentation. World
Bank. Retrieved from http://siteresources. worldbank.
org/INTTRANSPORT/Resources/336291-1122908670104/1504838-
1151587673078/PSCforHighwayPPPProjects-v2. pdf on 8.23 (2006): 09.
Khan, M. Fouzul Kabir, and Robert J. Parra. Financing Large Projects (Using Project Finance
Techniques and Practices). Singapore: Prentice Hall Pearson Education, 2003.
Kong, Yong Hee. "Different Models of PPP." Retrieved from Public-Private Infrastructure
Advisory Facility (PPIAF): http://www. ppiaf. org/sites/ppiaf.
org/files/documents/toolkits/Cross-Border-Infrastructure-Toolkit/Cross-Border%
20Compilation% 20ver 2029 (2007).
Kurniawan, Fredy, Sri Wiwoho Mudjanarko, and Stephen Ogunlana. "Best Practice for Financial
Models of PPP Projects." The 5th International Conference of Euro Asia Civil
Engineering Forum (EACEF-5) (2015): 124-32. Elsevier.
Laing, Ian, Partner, and Pinsent Masons. "Introduction to Public Private Partnerships; Where and
How to Select Investments." 2011.
115
Li, Bing, and Akintola Akintoye. "An Overview of Public-Private Partnership." Public-Private
Partnerships: Managing Risks and Opportunities. Oxford, UK: Blackwell Science, 2003.
Wiley Online Library. Wiley Online Library, 25 Feb. 2008.
Li, Bing, A. Akintoye, P.J Edwards, and C. Hardcastle. "Perceptions of Positive and Negative
Factors." Engineering, Construction and Architectural Management 12.2 (2005): 125-48.
Emerald Insight.
Macgillivray, John. "Project Finance and PPP Models." Project Planning and Management Ltd
(2010).
Melbourne Victoria Australia. Partnerships Victoria. Department of Treasury and Finance.
Public Sector Comparator - Technical Note. Melbourne: Partnerships Victoria, 2001. 1-
104.
Roehrich, Jans K., Michael A. Lewis, and Gerard George. "Are public - private partnerships a
healthy option? A systematic literature review." Social Science and Medicine 113 (2014):
110-19. Elsevier.
Salman, Ahmed, Mirosław Skibniewski, and Ismail Basha. "BOT Viability Model for Large-
Scale Infrastructure Projects." Journal Construction Engineering and Management 133.1
(2007): 50-63. ASCE.
Schaufelberger, John E., and Isr Wipadapisut. "Alternate financing strategies for build-operate-
transfer projects." American Society of Civil Engineers (ASCE). 129.2 (2003): 205-213.
Shen, Li-Yin , Andrew Platten, and X.P Dengc. "Role of public private partnerships to manage
risks in public sector projects in Hong Kong." the International Journal of Project
Management. 24.7 (2006): 587-594.
Swan, Jonathan. Practical Financial Modeling: A Guide to Current Practice. 2nd ed: CIMA,
2008. Elsevier.
Tang, LiYaning, Qiping Shen, and Eddie Cheng. "A review of studies on Public-Private
Partnership projects in the construction industry." Elsevier Ltd. 28.7 (2010): 683-694.
Thomson, Campbell, and Judith Goodwill. Evaluation of PPP Projects Financed by the EIB.
European Investment Bank (EIB), 2005.
Turhani, Altin, and Ali Turhani. "Financial Model of a PPP Project." Journal of Modern
Accounting and Auditing 7th ser. 8.1548-6583 (2012): 975-82.
United Nations Economic Commission for Europe. Guide Book on Promoting Good Governance
in Public Private Partnerships. Publication no. 08.11.E.1. New York and Geneva: United
Nations, 2008.

116
Victoria. Partnerships Victoria. Department of Treasury and Finance. Public Sector Comparator
- Supplementary Technical Note. Partnerships Victoria, 2003. 1-91.
Western Australia. Government of Western Australia. Department of Treasury. Public Sector
Comparator Policy: Additional Policy Guidance. Vol. 4: Government of Western
Australia, 2011. 1-22.
Xu, Yelin, John F.Y Yeung, et al. "Developing a risk assessment model for PPP projects in
China-A fuzzy synthetic evaluation approach." Elsevier. 19.7 (2010): 929-943.
Yun, Sungmin, Seung Heon Han, et al. "Capital structure optimization for build-operate- transfer
(BOT) projects using a stochastic and multi-objective approach." National Research
Council of Canada. 36.5 (2009): 777-790.
Zou, Patrick X.W., Shouqing Wang, and Dongping Fang. "A Life-cycle Risk Management
Framework for." Journal of Financial Management of Property and Construction 13.2
(2008): 123-42. Emerald Insight.