An integrated approach for the evaluation of technological ... · The Val d’Agri area (Basilicata...
12
Nat. Hazards Earth Syst. Sci., 14, 2133–2144, 2014 www.nat-hazards-earth-syst-sci.net/14/2133/2014/ doi:10.5194/nhess-14-2133-2014 © Author(s) 2014. CC Attribution 3.0 License. An integrated approach for the evaluation of technological hazard impacts on air quality: the case of the Val d’Agri oil/gas plant M. Calvello 1,2 , F. Esposito 3 , and S. Trippetta 1,2 1 IMAA, Istituto di Metodologie per l’Analisi Ambientale, CNR, C.da S. Loja, Z.I., 85050 Tito Scalo (PZ), Italy 2 Osservatorio Ambientale Val d’Agri, Via Vittorio Emanuele II, 3, 85052 Marsico Nuovo (PZ), Italy 3 Scuola di Ingegneria, Università degli Studi della Basilicata, Viale dell’Ateneo Lucano 10, 85100 Potenza, Italy Correspondence to: M. Calvello ([email protected]) Received: 27 February 2014 – Published in Nat. Hazards Earth Syst. Sci. Discuss.: 8 April 2014 Revised: 17 June 2014 – Accepted: 22 June 2014 – Published: 21 August 2014 Abstract. The Val d’Agri area (southern Italy) hosts one of the biggest onshore European reservoir and the largest oil/gas pre-treatment plant, named Centro Olio Val d’Agri (COVA), located in a rural/anthropized context. Several haz- ards are associated with this plant. These are mainly repre- sented by possible impacts of the COVA atmospheric emis- sions on the local air quality and human health. This work uses a novel approach based on the integration of air quality measurements from the regional monitoring network, addi- tional experimental measurements (i.e. sub-micrometre par- ticulate matter (PM 1 ) and black carbon (BC)) and advanced statistical analyses to provide a preliminary evaluation of the Val d’Agri air quality state and give some indication of spe- cific areas potentially affected by COVA hazards. Results show that the COVA plant emissions have a particular impact on the air quality of the area closest to it. In this area sev- eral pollutants specifically related to the COVA combustion processes (i.e. nitrogen oxides, benzene and toluene) show the highest concentration values and significant correlations. The proposed approach represents a first step in the assess- ment of the risks associated with oil/gas exploration and pre- treatment activities and a starting point for the development of effective and exportable air quality monitoring strategies. 1 Introduction The Val d’Agri area (Basilicata region – southern Italy) is characterized by the peculiar coexistence of natural features (woods and natural parks), large biodiversity, agricultural activities (cultivated and grazing areas) and several small towns alongside anthropogenic activities with potential en- vironmental and health impacts. In fact, the Val d’Agri area houses one of the biggest onshore European reservoir (crude oil and gas) and the largest existing oil/gas pre-treatment plant (identified as Centro Olio Val d’Agri – COVA) in a populated area. In this plant, the fluid extracted from the 25 currently productive wells is transported and separated into three phases: crude oil, natural gas and water. The crude oil is stabilized and conveyed to the Taranto refinery (Puglia re- gion – southern Italy) through a 136 km long oil pipeline. The natural gas, on the contrary, is treated and delivered to the Italian gas distribution network (Snam Rete Gas S.p.A.). COVA has a nominal treatment capacity of 16 500 m 3 day -1 of crude oil and 3.1 million sm 3 day -1 of associated gas and represents one of the main sources of atmospheric pol- lution in the entire area. In fact, the combustion processes occurring in the COVA plant during normal operating condi- tions originate both gaseous and particulate emissions, giv- ing rise to possible impacts on the local air quality and also posing health risks to the population living close to this plant (Trippetta et al., 2013). Moreover, the activation of emergency operating procedures deriving from plant mal- functions and anomalies represents a further risk for the en- vironment and human health due to additional and possi- bly enhanced emissions of atmospheric pollutants. Finally, the COVA plant is also classified as subject to considerable risk of industrial injury associated with accidental release of crude oil, methane, propane or other toxic products, or with accidental fires from methane and crude oil (COVA plant Ex- ternal Emergency Plan, which can be found (in Italian) at http://www.osservatoriovaldagri.it/). Published by Copernicus Publications on behalf of the European Geosciences Union.
Transcript of An integrated approach for the evaluation of technological ... · The Val d’Agri area (Basilicata...
Nat Hazards Earth Syst Sci 14 2133ndash2144 2014wwwnat-hazards-earth-syst-scinet1421332014doi105194nhess-14-2133-2014copy Author(s) 2014 CC Attribution 30 License
An integrated approach for the evaluation of technological hazardimpacts on air quality the case of the Val drsquoAgri oilgas plant
M Calvello12 F Esposito3 and S Trippetta12
1IMAA Istituto di Metodologie per lrsquoAnalisi Ambientale CNR Cda S Loja ZI 85050 Tito Scalo (PZ) Italy2Osservatorio Ambientale Val drsquoAgri Via Vittorio Emanuele II 3 85052 Marsico Nuovo (PZ) Italy3Scuola di Ingegneria Universitagrave degli Studi della Basilicata Viale dellrsquoAteneo Lucano 10 85100 Potenza Italy
Correspondence toM Calvello (mariarosariacalvelloimaacnrit)
Received 27 February 2014 ndash Published in Nat Hazards Earth Syst Sci Discuss 8 April 2014Revised 17 June 2014 ndash Accepted 22 June 2014 ndash Published 21 August 2014
Abstract The Val drsquoAgri area (southern Italy) hosts oneof the biggest onshore European reservoir and the largestoilgas pre-treatment plant named Centro Olio Val drsquoAgri(COVA) located in a ruralanthropized context Several haz-ards are associated with this plant These are mainly repre-sented by possible impacts of the COVA atmospheric emis-sions on the local air quality and human health This workuses a novel approach based on the integration of air qualitymeasurements from the regional monitoring network addi-tional experimental measurements (ie sub-micrometre par-ticulate matter (PM1) and black carbon (BC)) and advancedstatistical analyses to provide a preliminary evaluation of theVal drsquoAgri air quality state and give some indication of spe-cific areas potentially affected by COVA hazards Resultsshow that the COVA plant emissions have a particular impacton the air quality of the area closest to it In this area sev-eral pollutants specifically related to the COVA combustionprocesses (ie nitrogen oxides benzene and toluene) showthe highest concentration values and significant correlationsThe proposed approach represents a first step in the assess-ment of the risks associated with oilgas exploration and pre-treatment activities and a starting point for the developmentof effective and exportable air quality monitoring strategies
1 Introduction
The Val drsquoAgri area (Basilicata region ndash southern Italy) ischaracterized by the peculiar coexistence of natural features(woods and natural parks) large biodiversity agriculturalactivities (cultivated and grazing areas) and several small
towns alongside anthropogenic activities with potential en-vironmental and health impacts In fact the Val drsquoAgri areahouses one of the biggest onshore European reservoir (crudeoil and gas) and the largest existing oilgas pre-treatmentplant (identified as Centro Olio Val drsquoAgri ndash COVA) in apopulated area In this plant the fluid extracted from the 25currently productive wells is transported and separated intothree phases crude oil natural gas and water The crude oilis stabilized and conveyed to the Taranto refinery (Puglia re-gion ndash southern Italy) through a 136 km long oil pipelineThe natural gas on the contrary is treated and delivered tothe Italian gas distribution network (Snam Rete Gas SpA)COVA has a nominal treatment capacity of 16 500 m3 dayminus1
of crude oil and 31 million sm3 dayminus1 of associated gasand represents one of the main sources of atmospheric pol-lution in the entire area In fact the combustion processesoccurring in the COVA plant during normal operating condi-tions originate both gaseous and particulate emissions giv-ing rise to possible impacts on the local air quality andalso posing health risks to the population living close tothis plant (Trippetta et al 2013) Moreover the activationof emergency operating procedures deriving from plant mal-functions and anomalies represents a further risk for the en-vironment and human health due to additional and possi-bly enhanced emissions of atmospheric pollutants Finallythe COVA plant is also classified as subject to considerablerisk of industrial injury associated with accidental release ofcrude oil methane propane or other toxic products or withaccidental fires from methane and crude oil (COVA plant Ex-ternal Emergency Plan which can be found (in Italian) athttpwwwosservatoriovaldagriit)
Published by Copernicus Publications on behalf of the European Geosciences Union
2134 M Calvello et al Air quality and oilgas pre-treatment plants
All this implies the need for efficient monitoring of theair quality state in this area which should be carried outthrough the implementation of advanced and integrated ob-serving strategies able to characterize and possibly quantifythe environmental and human health impacts of such activ-ity In order to realize effective near-real-time monitoringof environmental hazards associated with the COVA emis-sions an advanced network of five stations devoted to the airquality state control has been established in the Val drsquoAgriarea This network is operated by the Agenzia Regionaleper la Protezione dellrsquoAmbiente (ARPA) of the Basilicataregion (ARPA Basilicata hereafter) and provides near-real-time concentration measurements of both regulated pollu-tants (ie sulfur dioxide carbon monoxide nitrogen diox-ide nitrogen oxides ozone particulate matter and benzene)and several pollutants specifically related to oilgas extrac-tion and treatment activities (ie nitrogen monoxide hydro-gen sulfide methane non-methane hydrocarbons total hy-drocarbons toluene ethylbenzene and isomers of xylene)To the best of our knowledge this is the first air qualitynetwork which provides continuous concentration measure-ments of so many pollutants in a such small area even whencompared for example to the very efficient observing net-work operating near the five refineries in the San FranciscoBay Area described in a recent comprehensive report by Fu-jita and Campbell (2013) More common monitoring strate-gies are mainly devoted to the study of volatile organic com-pounds (VOCs) and sulfur dioxide near refineries (Baltrenaset al 2011 Lin et al 2008) or near industrial parks in-cluding petrochemical facilities (Liu et al 2008 Hsieh etal 2006) Nevertheless more investigation should be doneIn fact previous studies carried out in the Val drsquoAgri areasuggested the need for the integration of the existing obser-vations with experimental measurements of sub-micrometreaerosol particles (ie PM1 aerosol particles with an aerody-namic diameter less than 10 microm) and black carbon (BC here-after) due to their possible association with combustion pro-cesses such as those occurring in the COVA plant (Trippettaet al 2013 Pavese et al 2012) The importance of the mea-surement of PM1 and BC is especially related to their ad-verse effects on environment and human health (eg Mo-hiuddin et al 2014 Anenberg et al 2011) Moreover BCalso contributes significantly to global warming (Bond et al2013) Despite this there is still a relatively limited amountof data for the sub-micrometre atmospheric particle fractionavailable at present (Mirante et al 2013) and only recentlythere has been growth for BC monitoring networks in manycountries around the world these networks often employAethalometers due to their good time resolution portabil-ity and low costs (see for example the US EPA networkin Solomon et al (2008) the UK Black Carbon Network inButterfield et al (2010) and the Swiss National Air PollutionMonitoring Network ndash NABEL in EMPA (2010))
The present study enters into this context and its maingoal is to provide a preliminary evaluation of the air qual-
ity state of the Val drsquoAgri area and to give some indication ofspecific areas potentially affected by hazards deriving fromthe COVA plant through the use of a novel approach basedon the integration of routine air quality measurements ad-ditional experimental measurements and advanced statisticalanalyses
To this aim as a preliminary phase daily concentrations ofthe main pollutants measured at the five monitoring stationslocated in the Val drsquoAgri area in the period 1 Septemberndash31 October 2013 were considered and analysed along withsimultaneous concentration measurements of PM1 and BCobtained at two of the five sampling sites and involving ad-ditional experimental facilities by the Istituto di Metodologieper lrsquoAnalisi Ambientale (IMAA) of the National ResearchCouncil of Italy (CNR) In particular the temporal and spa-tial variability of the pollutant concentration measurementsand the relative correlations were investigated using multi-variate statistical techniques which also provided a prelimi-nary indication of the source types contributing to their pres-ence in the local atmosphere
The possibility to integrate measurements from the exist-ing monitoring network with further key parameters as PM1and BC with an in-depth cluster and spatial variance analy-ses represents a powerful approach to study the COVA influ-ence on the Val drsquoAgri environment This will provide use-ful indications to the stakeholders in order to develop betteremission control strategies and to reach a sustainable equilib-rium between the environmental impact of energy supply byoilgas resources and the strong agricultural vocation of thearea and to improve the standards of living for the Val drsquoAgripopulation
2 Materials and methodologies
21 The ARPA Basilicata air quality monitoringnetwork
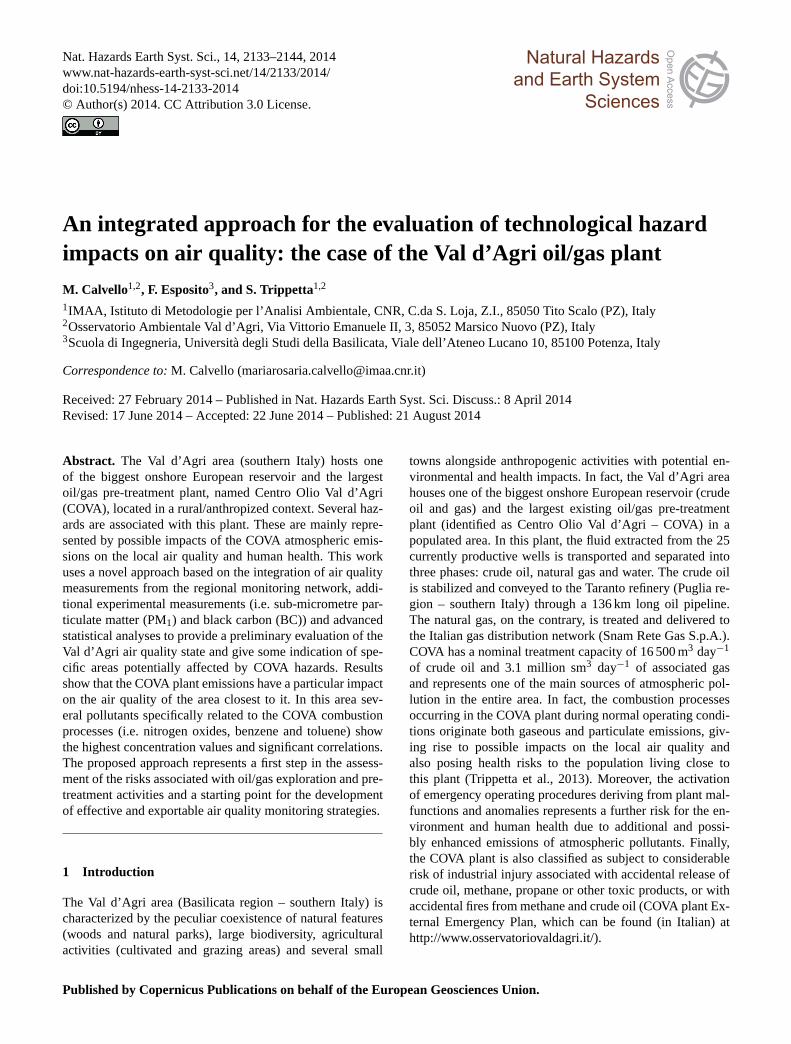
The Val drsquoAgri air quality monitoring network con-sists of five monitoring stations Viggiano Zona Indus-triale (VZI 4018prime5064primeprime N 1554prime1669primeprime E) Viggiano 1(V1 4020prime458primeprime N 1554prime190primeprime E) Masseria De Blasiis(MDB 4019prime2618primeprime N 1552prime258primeprime E) Grumento Nova(GN 4017prime1800primeprime N 1553prime2800primeprime E) and Costa MolinaSud 1 (CMS 4018prime5700primeprime N 1557prime1500primeprime E) The mon-itoring stations are located at a distance ranging betweenabout 500 m and about 4800 m from the COVA plant and arerepresentative of the air quality of an area of about 100 km2
around this plant (Fig 1)All the stations provide continuous and near-real-time
measurements of the concentrations of sulfur dioxide (SO2)carbon monoxide (CO) nitrogen monoxide and dioxide (NOand NO2 respectively) nitrogen oxides (NOx which is thesum of NO and NO2) ozone (O3) hydrogen sulfide (H2S)methane (CH4) non-methane hydrocarbons (NMHCs) total
Nat Hazards Earth Syst Sci 14 2133ndash2144 2014 wwwnat-hazards-earth-syst-scinet1421332014
M Calvello et al Air quality and oilgas pre-treatment plants 2135
Figure 1 Location of the five stations of the ARPA Basilicataair quality monitoring network The image also shows the loca-tion of the PM1 and BC sampling sites and of the Centro OlioVal drsquoAgri (COVA) plant Aerial photography courtesy of GoogleEarth (httpearthgooglecom) Legend Viggiano Zona Industri-ale (VZI) Viggiano 1 (V1) Masseria De Blasiis (MDB) GrumentoNova (GN) and Costa Molina Sud 1 (CMS)
hydrocarbons (THC ie the sum of CH4 and NMHCs) ben-zene (C6H6) toluene ethylbenzene and isomers of xyleneMoreover V1 MDB GN and CMS also provide continu-ous and near-real-time measurements of the concentrationsof particulate matter with an aerodynamic diameter less than10 and 25 microm (PM10 and PM25 respectively) RegardingVZI it is equipped for the measurement of the PM10 con-centrations only These measurements are provided with atime lag of several months due to the instrumentation used(ie a gravimetric sampler) A summary of the methods usedfor the measurements of the concentrations of each pollutantis reported in Table 1
All the air quality monitoring stations also provide mea-surements of the main meteorological parameters air tem-perature (T ) atmospheric pressure (P ) relative humidity(RH) wind speed (ws) and direction (wd) global radiation(GR) and rainfall (rf)
22 Experimental PM1 and BC measurements
PM1 measurements were performed in Viggiano at a dis-tance of about 170 m (SW direction) from V1ndashARPA Basil-icata monitoring station (Fig 1) This site was chosen sinceViggiano is the nearest town to the COVA plant at about2400 m from it and one of the most populated towns ofthe Val drsquoAgri area (about 3100 inhabitants) PM1 sampleswere collected using a low-volume (167 L minminus1 flow rate)gravimetric sampler (TCR Tecora) equipped with a PM1 cut-off inlet and polycarbonate filters (Oslash= 47 mm) The sam-pling time was 24 h (starting from 1200 pm) and each fil-ter was humidity-conditioned in a filter-conditioning cabi-
net (approximatelyT = 20plusmn 2C and RH= 50plusmn 5 ) be-fore and after sampling for 48 h The PM1 mass was deter-mined by means of a gravimetric method using an analyticalmicrobalance with a sensitivity ofplusmn1 microg
Regarding BC measurements they were performed closeto the COVA plant by placing a dedicated instrument atVZIndashARPA Basilicata monitoring station This location waschosen for its closeness to the COVA where continuouscombustion processes were thought to have an impact onBC content A rack-mount seven-wavelengths Magee Sci-entific Aethalometer AE31 (370 470 520 590 660 880and 950 nm) was used to estimate BC mass concentrationsand to detect the presence of its organic fraction throughthe UV-absorbing particulate matter (UVPM) quantity TheAethalometer measures light attenuation due to the presenceof absorbing carbonaceous aerosol deposits on a quartz fi-bre filter (Hansen 2005) Corresponding absorption coeffi-cients are obtained at the seven wavelengths and convertedto mass concentrations with in particular measurements atthe 880 nm wavelength used to obtain BC content assuminga mass-specific absorption cross section of 166 m2 gminus1 (Nairet al 2012 Reche et al 2011) If the organic component ispresent in carbonaceous aerosols an enhanced absorption atthe UV wavelengths is recorded leading to qualitative detec-tion of this component through measurements at 370 nm (Es-posito et al 2012) For the data considered in this work theinstrument was equipped with a cut size-selective cyclone tointake particles with aerodynamic diameters less than 25 micromat a flow rate of 4 L minminus1 and a time resolution of 5 min
23 Meteorology and air mass history
A summary of the main meteorological parameters averagedover the period 1 Septemberndash31 October 2013 is reported inTable 2 for the five monitoring stations
Low variations were observed for all parameters show-ing a quite homogeneous meteorological pattern all overthe study area Looking at the prevailing wind directionswesterly winds were more frequent for all the sites exceptfor VZI monitoring station where a southeastern compo-nent was present During the study period the area wasaffected by frequent anticyclonic systems as verified bythe map of the 850 hPa geopotential heights obtained fromthe NOAA-NCEPNCAR (National Oceanic and Atmo-spheric AdministrationndashNational Centers for Environmen-tal PredictionNational Center for Atmospheric Research)global reanalysis database (httpwwwesrlnoaagovpsddatagriddeddatancepreanalysisderivedhtml Kalnay etal 1996) (Fig 2)
The same database was used to initialize HYSPLIT(HYbrid Single-Particle Lagrangian Integrated TrajectoryDraxler and Rolph 2003) model cluster analysis of backwardtrajectories in order to assess the main air mass transport pat-terns affecting the study area from 1 September to 31 Oc-tober In particular five-day backward trajectories arriving
wwwnat-hazards-earth-syst-scinet1421332014 Nat Hazards Earth Syst Sci 14 2133ndash2144 2014
2136 M Calvello et al Air quality and oilgas pre-treatment plants
Table 1Summary of the methods used for measuring concentrations of each pollutant
Parameter Measurement principle
SO2 UV fluorescenceNO ChemiluminescenceNO2 ChemiluminescenceNOx ChemiluminescencePM25 Beta attenuationlowast
PM10 Beta attenuationlowastgravimetriclowastlowast
O3 UV absorptionCO Non-dispersive IR detection (NDIR)C6H6 Gas chromatography with photo-ionization detector (GC-PID)H2S UV fluorescenceCH4 Photo-ionization detection (PID)NMHCs Photo-ionization detection (PID)THC Photo-ionization detection (PID)Toluene Gas chromatography with photo-ionization detector (GC-PID)Ethylbenzene Gas chromatography with photo-ionization detector (GC-PID)Isomers of xylene Gas chromatography with photo-ionization detector (GC-PID)
lowast V1 GN MDB and CMS monitoring stationslowastlowast VZI monitoring station
Table 2Meanplusmn standard deviation (m plusmn SD) of the main meteorological parameters measured at the five air quality monitoring stations from1 September to 31 October 2013 Regarding the wind direction (wd) the prevailing directions evaluated for the entire period of observationare reported
Monitoring T RH P ws Prevailing wd GR rfstation (C) () (hPa) (msminus1) (Wmminus2) (mm)
VZI 17 plusmn 3 74plusmn 9 946plusmn 4 12plusmn 05 SESW 174plusmn 59 18plusmn 39V1 17plusmn 2 66plusmn 11 933plusmn 4 34plusmn 16 SWNW 159plusmn 55 14plusmn 43MDB 16plusmn 3 75plusmn 8 948plusmn 4 31plusmn 16 NW 149plusmn 47 11plusmn 35GN 17plusmn 3 64plusmn 11 932plusmn 4 24plusmn 13 SW 106plusmn 42 01plusmn 06CMS 18plusmn 3 73plusmn 11 939plusmn 4 37plusmn 17 NW 167plusmn 58 13plusmn 38
at 500 m above ground level (agl) were computed 4 timesdaily and further put together in different clusters accord-ing to similar transport patterns A map with the mean tra-jectory for each representative cluster and the correspondingpercentage of occurrence is shown in Fig 3 As Fig 3 shows48 of the total backward trajectories travelled very low be-fore reaching the study area and among these 45 wereof local origin remaining over the Tirrenian Sea This couldhave favoured the accumulation of pollutants in the lowestatmospheric layers during the study period
3 Results and discussion
31 Explorative statistical analysis
Table 3 reports a summary of the explorative statistical anal-ysis carried out on the pollutant mean daily concentrationsmeasured in the area under study from 1 September to 31 Oc-tober 2013 Concentration measurements of ethylbenzeneand isomers of xylene were not considered in this study due
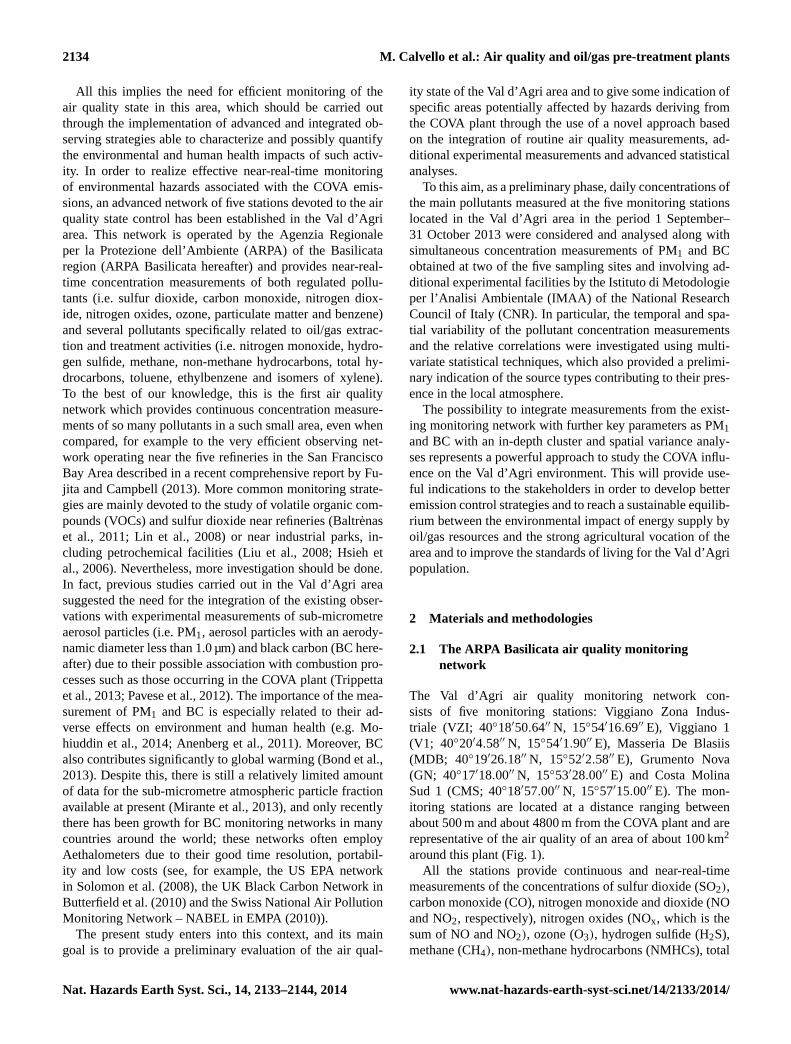
to the several data being missing As Table 3 shows signif-icantly higher values of NO NO2 NOx C6H6 and toluenedaily concentrations were registered at VZI monitoring sta-tion with respect to the other four stations These compoundsmainly originate from anthropogenic sources including theCOVA plant In fact NOx and VOCs represent some of themain gaseous emissions of this plant (ENI 2012) Thereforethe higher concentration values recorded at VZI monitoringstation should be also related to a contribution from COVAto their presence in the local atmosphere Furthermore CH4daily concentrations showed higher values at MDB monitor-ing station likely due to its proximity to several farms de-voted to the breeding of dairy cows In fact the livestocksector is one of the largest contributors to greenhouse gasemissions globally mostly as CH4 emissions (Van Middelaaret al 2014 Liang et al 2013) Finally higher H2S concen-tration values were registered at CMS station
Figure 4 reports the temporal pattern of the PM1 dailyconcentrations As Fig 4 shows the PM1 daily concentra-tions ranged from 11 to 74 microg mminus3 with a mean value of27 microg mminus3 Due to the lack of PM1 measurements performed
Nat Hazards Earth Syst Sci 14 2133ndash2144 2014 wwwnat-hazards-earth-syst-scinet1421332014
M Calvello et al Air quality and oilgas pre-treatment plants 2137
Table 3 Statistical parameters of the atmospheric pollutant daily concentrations measured at the five air quality monitoring stations from1 September to 31 October 2013 Meanplusmn standard deviation (m plusmn SD) and the range of variability (minndashmax) are reported for each pollutantLegend na= not available mu= measurement units
Parameter muARPA Basilicata monitoring stations
VZI V1 MDB GN CMS
SO2 microg mminus3 561plusmn 188 674plusmn 077 756plusmn 108 369plusmn 100 341plusmn 130(331ndash1239) (534ndash1068) (507ndash983) (191ndash685) (131ndash713)
NO microg mminus3 505plusmn 183 103plusmn 044 131plusmn 064 098plusmn 048 073plusmn 040(234ndash842) (012ndash248) (038ndash338) (018ndash260) (016ndash166)
NO2 microg mminus3 1263plusmn 430 436plusmn 196 489plusmn 134 362plusmn 154 349plusmn 130(645ndash2526) (109ndash1332) (262ndash795) (044ndash703) (046ndash725)
NOx microg mminus3 2035plusmn 663 594plusmn 236 689plusmn 198 513plusmn 205 460plusmn 175(995ndash3796) (221ndash1712) (321ndash1184) (122ndash933) (085ndash919)
PM10 microg mminus3 na1609plusmn 635 2097plusmn 721 1525plusmn 516 1831plusmn 568(612ndash3663) (1150ndash3940) (580ndash2580) (891ndash3600)
PM25 microg mminus3 na899plusmn 403 1169plusmn 459 874plusmn 373 863plusmn 394
(330ndash2220) (380ndash2190) (290ndash1640) (250ndash1880)
O3 microg mminus3 5868plusmn 1432 8273plusmn 1372 4876plusmn 1476 8532plusmn 1548 6999plusmn 1457(2596ndash9034) (5028ndash11638) (1824ndash8121) (4707ndash12472) (3757ndash10431)
CO microg mminus3 034plusmn 011 017plusmn 005 015plusmn 003 033plusmn 008 022plusmn 005(017ndash058) (005ndash040) (010ndash022) (011ndash060) (009ndash030)
C6H6 microg mminus3 091plusmn 016 030plusmn 011 028plusmn 011 017plusmn 010 022plusmn 007(063ndash144) (012ndash052) (008ndash060) (003ndash049) (010ndash039)
Toluene microg mminus3 101plusmn 038 043plusmn 019 034plusmn 015 019plusmn 010 024plusmn 008(050ndash227) (012ndash097) (013ndash081) (005ndash043) (012ndash043)
CH4 microC g mminus3 95803plusmn 3499 90269plusmn 1675 111494plusmn 9597 94444plusmn 3321 91192plusmn 2657(8870ndash10380) (8740ndash9460) (97200ndash160900) (81400ndash100500) (85600ndash97800)
NMHCs microC g mminus3 10326plusmn 10859 2408plusmn 908 10302plusmn 8156 14605plusmn 1085 6508plusmn 2381(2775ndash56358) (404ndash4469) (089ndash34268) (12175ndash16459) (487ndash11184)
THC microC g mminus3 106097plusmn 9091 92681plusmn 2303 121750plusmn 11653 109441plusmn 3938 97684plusmn 2193(97916ndash145515) (88184ndash98090) (106588ndash194911) (95969ndash116932) (93432ndash101841)
H2S microg mminus3 187plusmn 037 180plusmn 043 056plusmn 036 159plusmn 050 272plusmn 047(099ndash271) (102ndash279) (010ndash214) (050ndash314) (107ndash374)
in the area under study during the considered period thesevalues were compared with the unique PM1 concentrationmeasurements presently existing for this area and reported ina previous study (Trippetta et al 2013) Results show that thePM1 daily concentrations registered during the period underconsideration were lower than the PM1 concentration meanvalue (110plusmn 51 microg mminus3) measured close to the COVA plantfrom July to November 2011
Daily values of BC and UVPM content are reported inFig 5 BC daily concentrations were found in the range from288 to 1125 ng mminus3 with a mean value of 551 ng mminus3 Alsoin the case of BC a comparison was possible with the uniquedata set of BC concentration measurements available for the
area described in Pavese et al (2012) In that case a slightlylower monthly mean value of 494 ng mminus3 was obtained inFebruary 2011 while higher mean monthly values of 822735 and 858 ng mminus3 were found in January March and April2011 respectively
For UVPM estimated values were included in the rangefrom 2 to 267 ng mminus3 with a mean value of 84 ng mminus3 im-plying the constant presence of the organic component of car-bonaceous particles during the sampling period
32 Cluster analysis
In order to study the correlation pattern between the pollu-tant concentration data registered at each site and to obtain
wwwnat-hazards-earth-syst-scinet1421332014 Nat Hazards Earth Syst Sci 14 2133ndash2144 2014
2138 M Calvello et al Air quality and oilgas pre-treatment plants
Figure 2 Map of the 850 hPa geopotential heights averagedfor the period 1 Septemberndash31 October 2013 from the NOAA-NCEPNCAR (National Oceanic and Atmospheric AdministrationndashNational Centers for Environmental PredictionNational Center forAtmospheric Research) reanalysis database
a preliminary indication of the source types contributing totheir presence in the local atmosphere cluster analysis (CA)was used In particular a hierarchical-type clustering algo-rithm was applied to the Pearson correlation (ρ) matrix andthe furthest-neighbour method was chosen as a criterion forforming clusters (Legendre and Legendre 1985)
For this analysis THC was considered as the sum of CH4and NMHCs and NOx as the sum of NO and NO2 in orderto avoid redundant information
By applying CA to the pollutant concentration datarecorded at VZI monitoring site three clusters and three iso-lated variables were found (Fig 6a) In particular the firstcluster is composed of C6H6 and toluene the second in-cludes SO2 and NOx and the third consists of BC UVPMand THC CO H2S and O3 represent the isolated vari-ables By analysing each identified cluster it can be ob-served that C6H6 and toluene which belong to the aromaticVOCs group show a good correlation (ρ = 086) This couldsuggest a common source of these two compounds in theconsidered area Major sources of ambient VOCs ndash espe-cially of benzene toluene ethylbenzene and isomers of xy-lene (BTEX) ndash include vehicular emissions automobile ser-vice stations and industrial emissions (Caselli et al 2010)In particular the vehicular emissions come from different
Figure 3 Maps with average trajectories for each obtained clus-ter and corresponding percentage of occurrence (in brackets) forthe period 1 Septemberndash31 October 2013 The numbers outside thebrackets identify each cluster
Figure 4 Temporal pattern of the PM1 daily concentrations mea-sured at Viggiano town from 1 September to 31 October 2013
sources exhaust emissions (cold and hot) evaporative emis-sions and emissions from brake and tyre wear Among theBTEX industrial emissions those related to petroleum pro-duction processes represent an important source of thesecompounds (Godoi et al 2013) Therefore the presence ofC6H6 and toluene in the local atmosphere of the Viggianoindustrial area could be due to the contribution of both trafficand COVA emissions Focusing on the second cluster SO2and NOx show a significant correlation (ρ =069) These two
Nat Hazards Earth Syst Sci 14 2133ndash2144 2014 wwwnat-hazards-earth-syst-scinet1421332014
M Calvello et al Air quality and oilgas pre-treatment plants 2139
Figure 5 Temporal patterns of daily values of black carbon (BC)and UV-absorbing particulate matter (UVPM) content obtainedat Viggiano Zona Industriale (VZI) station from 6 September to23 October 2013
gaseous compounds represent the main gases emitted by theCOVA thermodestroyers (ENI 2012) Therefore the signif-icant SO2 and NOx correlation could suggest the influenceof the COVA emissions on the local air quality Regardingthe third cluster a good correlation is found between BCand UVPM (ρ = 053) as well as between these two param-eters and THC (ρ = 045) The formation of this cluster canbe explained by incomplete combustion processes as a com-mon source of all the three parameters and highlights thestrong interaction between the particle phase represented byBC and the organic molecular species contained in UVPMThese molecules quantitatively determined by THC concen-tration measurements are verified to have a high probabilityto be adsorbed on BC particles surfaces (Kim et al 2009)From concentration values in Table 3 it can be easily verifiedthat more than 90 of THC consists of methane and there-fore a good correlation between BC UVPM and CH4 can beinferred from CA Since the presence of methane in the localatmosphere of the area covered by VZI monitoring stationis very likely related to COVA combustion processes ratherthan traffic the same prevailing source can be attributed toBC and UVPM emissions at the sampling site under consid-eration
By considering V1 monitoring site the application of CAto the pollutant daily concentration data pointed out threeclusters and four isolated variables (Fig 6b) Since the PM1monitoring site is very close to V1 monitoring station itcan be assumed that these two sites are representative of thesame area implying that PM1 measurements can be consid-ered along with those performed at V1 monitoring station inCA As Fig 6b shows the first cluster includes PM10 andPM25 the second is composed of NOx C6H6 and tolueneand the third consists of CO and THC H2S O3 PM1 andSO2 represent the isolated variables Focusing on each sin-gle cluster it can be observed that PM10 and PM25 show the
highest value of the correlation coefficient (ρ = 093) Thisindicates that they could share some sources andor emis-sion processes (Parmar et al 2001) Due to the large num-ber of sources emitting particulate matter in the consideredarea the lack of the PM10 and PM25 chemical characteri-zation and the absence of significant correlations betweenPM10PM25 and other pollutants their main origin was notidentified Regarding the second cluster NOx and C6H6 aresignificantly correlated with each other (ρ = 074) and withtoluene (ρ = 065) Moreover focusing on the third cluster itcan be observed that CO and THC are characterized by a cor-relation coefficient of 054 All these compounds althoughincluded into two separate clusters could have originatedfrom common sources In fact CO NOx VOCs and hydro-carbons as NMHCs are the main emissions of petrol anddiesel-engine motor vehicles Moreover CO NOx VOCsand hydrocarbons in this case as CH4 are included amongthe main gaseous emissions of the COVA plant (ENI 2012)If one considers that V1 monitoring station is located at about5 m from the main road connecting the industrial area withthe town of Viggiano and at about 2300 m from the COVAplant this cluster could reveal the influence of both traffic-and COVA-plant-related emissions on the local atmosphere
When applying CA to the pollutant daily concentrationsmeasured at MDB monitoring site two clusters and four iso-lated variables are found (Fig 6c) In particular the first clus-ter is composed of PM10 PM25 and CO and the secondincludes C6H6 toluene and NOx H2S O3 SO2 and THCrepresent the isolated variables By considering the correla-tion coefficients it can be observed that PM10 and PM25are significantly correlated with each other (ρ = 094) andwith CO (ρ = 060) A significant correlation between COand PM measurements was found in areas affected by emis-sions coming from residential wood combustion (eg Bignalet al 2008) and agricultural-burning smoke (Gonccedilalves etal 2011) andor in sites exposed to traffic emissions (Perezet al 2004) All these types of emissions characterize thearea where MDB monitoring station is located In fact MDBis placed in a rural area where open burning of grass andforest is a common practice used for clearing field wastein farming and ranching Moreover MDB is about 1400 mfrom a high-speed motorway (ie SS 598) characterized by amoderate volume of traffic consisting of cars and heavy ve-hicles The proximity of the MDB monitoring station to theSS 598 could also justify the second cluster identified whereC6H6 and toluene are significantly correlated with each other(ρ = 086) and with NOx (ρ = 060) In fact benzene andtoluene are considered to be emitted from vehicle-related ac-tivity including vehicular exhaust and gasoline evaporation(Seco et al 2013 Wang et al 2012) while NOx is signifi-cantly related to heavy-duty vehicle emissions (eg Fu et al2013)
Focusing on GN monitoring site CA results point out twoclusters and three isolated variables (Fig 5d) In particularthe first cluster is composed of PM10 and PM25 and the
wwwnat-hazards-earth-syst-scinet1421332014 Nat Hazards Earth Syst Sci 14 2133ndash2144 2014
2140 M Calvello et al Air quality and oilgas pre-treatment plants
(a)
(c)
(e)
(b)
(d)
Figure 6 Dendrograms obtained by applying the furthest-neighbour clustering method to the pollutant concentration data recorded at(a)VZI monitoring site(b) V1 monitoring site(c) MDB monitoring site(d) GN monitoring site and(e)CMS monitoring site The clusters areshown in grey
second includes C6H6 toluene NOx and THC H2S O3 andSO2 represent the isolated variables In particular PM10 andPM25 show the highest value of the correlation coefficient(ρ = 091) meaning that they are characterized by a similarbehaviour However no suggestion about their origin and asa consequence no indication about the sources affecting thelocal air quality is provided by CA in this case Focusing onthe second cluster it can be observed that C6H6 and tolueneare significantly correlated with each other (ρ = 081) andwith NOx (ρ = 074) Then this group correlates with THC(ρ = 053) As found for V1 monitoring station these corre-lations highlight the traffic- and COVA-plant-related contri-butions that can be justified if it is considered that GN mon-itoring station is located in the suburbs of the town of Gru-mento where a contribution deriving from traffic is expectedand that GN is about 2800 m from the COVA plant
When applying CA to the pollutant daily concentrationsmeasured at CMS monitoring site three clusters and threeisolated variables are found (Fig 6e) In particular the firstcluster is composed of PM10 and PM25 the second includes
C6H6 THC and toluene and the third is represented by COand H2S NOx SO2 and O3 represent the isolated variablesBy considering the correlation coefficients between the vari-ables included in each cluster it can be observed that PM10and PM25 show the highest value of the correlation coef-ficient (ρ = 097) but CA does not provide any suggestionabout their origin in this case either Regarding the secondcluster C6H6 and THC are significantly correlated with eachother (ρ = 075) and with toluene (ρ = 048) As found forV1 and GN monitoring stations these correlations could beattributed to COVA-plant-related contributions Finally fo-cusing on the third cluster it can be observed that CO andH2S are correlated with each other (ρ = 048) This clustervery likely reveals the impact of the COVA emissions on thelocal air quality probably deriving from the incomplete com-bustion of the natural gas in the plantrsquos system of torches
33 Data spatial variance
In order to better assess the pollutant concentration spa-tial variability a coefficient of divergence (COD) and the
Nat Hazards Earth Syst Sci 14 2133ndash2144 2014 wwwnat-hazards-earth-syst-scinet1421332014
M Calvello et al Air quality and oilgas pre-treatment plants 2141
Pearson correlation coefficients (ρ) were calculated betweenthe pollutant concentrations measured at the five air qualitystations
Regarding the COD it was calculated for each parameterand for each pair of stations to obtain an estimate of the de-gree of the data set uniformity following Eq (1)
CODjk =
radicradicradicradic 1
p
psumi=1
[(xij minus xik)(xij + xik)
]2 (1)
wherex represents the daily concentrations and thei j andk indexes refer respectively to the sampling day and to thetwo sampling stations (Wongphatarakul et al 1998) TheCODs can vary from 0 (maximum degree of homogeneity)to 1 (minimum degree of homogeneity) for the consideredpollutant concentrations measured at each pair of samplingsites
COD and ρ values are reported in Tables 4 and 5respectively
Substantial homogeneity was observed for CH4 and O3when they were compared to the other pollutants In factthey show low values of CODs and relatively highρ val-ues very likely due to their longer residence times in the at-mosphere with respect to the other pollutants This peculiarfeature allowed for a more uniform distribution of the pol-lutants over the entire area which was also favoured by fre-quent high-pressure conditions characterizing the consideredperiod (see Fig 2)
Focusing on the comparison between the CH4 and O3concentrations measured at the five air quality stations thehigher COD and the lowerρ values found when the cou-pling with the MDB station was considered confirm the pe-culiarity of this site for CH4 production as already reportedin Sect 31 Then looking at the O3ρ values the highestvalues were found when VZI and MDB stations were ex-cluded from the coupling implying that these two stationsare different from the others with regard to ozone This is inaccordance with the lower mean values of O3 found at VZIand MDB stations (see Table 3) where at the same time highconcentration values of both NOx and NMHCs the two well-known main ozone precursors are found This confirms thelarger probability that ozone enhancement is detected at sitesfar from where it is formed through secondary processes (Liet al 2013)
Regarding PM10 and PM25 a comparison was possiblein all cases except for VZI station where no measurementswere available for these two parameters For the remainingstations very low CODs and very highρ values were ob-tained highlighting a spread and homogeneous diffusion ofsuch pollutants over the study area This could be due to com-mon sources of these two parameters and their uniform pres-ence in the local atmosphere could be also associated with theprevalence of high-pressure systems over the area during thestudy period
For benzene toluene and nitrogen compounds higher val-ues of COD and correspondingly lowerρ values were foundwhen the coupling with VZI station was considered This canbe attributed to an additional source of such compounds otherthan traffic present at VZI and related to the COVA emissionsas previously assessed by the CA Looking in particular atNOx benzene and toluene good values ofρ and low val-ues of COD were found when the other four stations wereconsidered suggesting a common source of traffic that is inagreement with CA results
Regarding SO2 COD values did not show any particulartrend while the lowestρ values were found when MDB sta-tion was considered In the case of H2S lowestρ valueswere found for VZI coupling suggesting the presence of asource of this pollutant at the sampling site located close tothe COVA plant At the same time the highest CODs cor-respond to the coupling with MDB station where particu-larly low mean values of this parameter were registered asreported in Table 3 probably due to the upwind position ofthis station with respect to the COVA (see Fig 1 and Table 2where prevailing wind direction is mentioned)
As to CO a lack of homogeneity was present for all thestations This in agreement with what was found by CAreflects the presence of several different sources of CO inthe area including COVA emissions traffic and combustionprocesses related to agricultural activities
Finally when NMHCs are considered a lack of homo-geneity was present for all the stations probably due to theirshort residence time in the atmosphere
4 Conclusions
Daily pollutant concentrations available in the Val drsquoAgriarea for the period 1 Septemberndash31 October 2013 were con-sidered and analysed along with simultaneous concentrationmeasurements of PM1 and BC obtained involving additionalexperimental facilities In particular the temporal and spa-tial variability of the pollutant concentration measurementsand the intra- and inter-site correlations were investigatedusing multivariate statistical techniques Preliminary indica-tions about the source types contributing to the presence ofpollutants in the local atmosphere as well as some indica-tions about specific areas potentially affected by hazards de-riving from the COVA plant have also been provided Re-sults show that the COVA plant emissions have an impacton the air quality over the entire area These impacts havemainly been found in the area closest to the COVA plantrepresented by VZI station Moreover the area where CMSmonitoring station is located seems also to be significantlyaffected by the COVA-plant-related emissions Focusing onVZI station it can be observed that several pollutants specif-ically related to the combustion processes occurring in thisplant (ie NOx benzene and toluene) show the highest con-centration values and significant correlations In particular
wwwnat-hazards-earth-syst-scinet1421332014 Nat Hazards Earth Syst Sci 14 2133ndash2144 2014
2142 M Calvello et al Air quality and oilgas pre-treatment plants
Table 4Coefficients of divergence (CODs) calculated for each pollutant and each pair of stations Legend nc ndash not calculable
COD VZIV1 VZICMS VZIGN VZIMDB V1CMS V1GN V1MDB CMSGN CMSMDB GNMDB
SO2 017 031 026 024 038 032 011 018 043 037NO 066 075 068 060 032 030 028 030 038 029NO2 052 057 056 044 021 023 018 019 019 023NOx 056 063 060 049 020 019 017 016 022 021PM10 nc nc nc nc 010 008 016 012 010 017PM25 nc nc nc nc 016 010 016 012 024 016O3 019 010 020 010 009 003 028 011 019 029CO 036 027 017 040 021 035 016 025 020 039C6H6 046 060 067 051 019 036 013 031 018 033Toluene 045 060 067 050 033 043 021 024 022 032CH4 003 003 002 008 001 003 011 002 010 009NMHCs 054 029 044 052 050 073 062 045 050 056THC 008 006 005 009 003 008 014 006 011 007H2S 020 023 023 060 024 021 058 032 069 055
Table 5Pearson correlation coefficients (ρ) calculated for each pollutant and each pair of stations Legend nc ndash not calculable
ρ VZIV1 VZICMS VZIGN VZIMDB V1CMS V1GN V1MDB CMSGN CMSMDB GNMDB
SO2 031 029 0002 minus026 040 050 minus014 04 minus031 minus022NO 004 037 015 032 037 019 027 055 041 018NO2 minus044 minus022 minus034 minus020 053 054 049 060 060 071NOx minus033 minus002 minus012 003 055 053 043 060 063 055PM10 nc nc nc nc 092 089 087 085 086 089PM25 nc nc nc nc 091 091 088 087 087 093O3 090 095 089 093 097 098 084 096 091 085CO minus008 012 019 022 minus007 006 002 025 059 031C6H6 050 055 04 048 07 074 073 064 072 076Toluene minus016 017 minus015 005 067 072 059 067 065 071CH4 055 089 063 037 063 049 037 074 037 020NMHCs minus039 048 minus054 025 011 077 022 minus005 054 023THC minus038 minus014 minus042 minus009 062 065 053 063 039 034H2S minus009 minus019 minus016 minus02 007 012 024 012 009 015
the significant correlation found between BC and UVPMcontent and THC (mainly consisting of CH4) could indi-cate the COVA incomplete combustion processes as a sourceof carbonaceous compounds in this area and highlights therole of BC as a vehicle for organic compounds in the envi-ronment Regarding CMS station the impact of the COVAemissions on the local air quality probably derives from theincomplete combustion of the natural gas in the plantrsquos sys-tem of torches Traffic represents an additional and importantsource of atmospheric pollutants over the entire area More-over the contribution of emission deriving from dairy cowbreeding and agriculture-related activities has been found inthe area where MDB monitoring station is located This is infair agreement with the prevailing rural features of this areaResults also show that PM1 is not correlated with any pollu-tant suggesting the need for further investigation of these pa-rameters so as to define its main origin Regarding the inter-site variability of the pollutant concentrations substantial ho-mogeneity was observed for CH4 O3 PM10 and PM25 when
they were compared to the other pollutants This is proba-bly due to peculiar features of these pollutants (referring toCH4 and O3) probable common sources (referring to PM10and PM25) and the prevalence of high-pressure systems overthe area during the study period (all pollutants) Focusing onthe single air quality station COD andρ values confirm thepresence of an additional CH4 source in the area where MDBstation is located Moreover a difference among the VZI andMDB stations and the remaining stations is observed if O3 isconsidered Finally remarkable differences between VZI andthe other stations have been confirmed when concentrationvalues of NOx benzene toluene and H2S are considered
In conclusion the present study preliminarily highlightsthat a novel approach based on the integration of routineair quality measurements innovative experimental measure-ments and advanced statistical analyses is suitable to givea realistic picture of the emission features of the area andto distinguish areas mainly affected by COVA plant emis-sions This methodology represents an attempt to build an
Nat Hazards Earth Syst Sci 14 2133ndash2144 2014 wwwnat-hazards-earth-syst-scinet1421332014
M Calvello et al Air quality and oilgas pre-treatment plants 2143
integrated observing strategy applicable to other similar in-dustrial sites
AcknowledgementsThis work was carried out in the frameworkof the research agreement between ldquoRegione Basilicata ndash Osserva-torio Ambientale della Val drsquoAgrirdquo and ldquoIstituto di Metodologieper lrsquoAnalisi Ambientalerdquo of the National Research Council(IMAA-CNR) The authors are indebted to Rosa Caggiano andGiulia Pavese for helpful discussions and suggestions The authorswould like to thank the Agenzia Regionale per la ProtezionedellrsquoAmbiente (ARPA) of the Basilicata region for providing envi-ronmental data and for the logistical support in BC measurementsoperations Moreover authors are grateful to the ldquoProtezione CivileGruppo Lucano ndash Viggianordquo for the logistical support given duringthe PM1 sampling campaign
Edited by F VallianatosReviewed by two anonymous referees
References
Anenberg S C Talgo K Arunachalam S Dolwick P JangC and West J J Impacts of global regional and sec-toral black carbon emission reductions on surface air qualityand human mortality Atmos Chem Phys 11 7253ndash7267doi105194acp-11-7253-2011 2011
Baltrenas P Baltrenaite E Šereviciene V and Pereira P At-mospheric BTEX concentrations in the vicinity of the crude oilrefinery of the Baltic region Environ Monit Asses 182 115ndash127 2011
Bignal K L Langridge S and Zhou J L Release of polycyclicaromatic hydrocarbons carbon monoxide and particulate matterfrom biomass combustion in a wood-fired boiler under varyingboiler conditions Atmos Environ 42 8863ndash8871 2008
Bond T C Doherty S J Fahey D W Forster P M BerntsenT De Angelo B J Flanner M G Ghan S Kaumlrcher B KochD Kinne S Kondo Y Quinn P K Sarofim M C SchultzM G Schulz M Venkataraman C Zhang H Zhang S Bel-louin N Guttikunda S K Hopke P K Jacobson M ZKaiser J W Klimont Z Lohmann U Schwarz J P Shin-dell D Storelvmo T Warren S G and Zender C S Bound-ing the role of black carbon in the climate system A scientificassessment J Geophys Res 118 5380ndash5552 2013
Butterfield D Beccaceci S Sweeney B Green D AlexanderJ and Grieve A Annual Report for the UK Black CarbonNetwork available athttpuk-airdefragovukreportscat051009031405_2009_BC_Annual_Report_Finalpdf(last accessFebruary 2014) 2010
Caselli M De Gennaro G Marzocca A Trizio L and TutinoM Assessment of the impact of the vehicular traffic on BTEXconcentration in ring roads in urban areas of Bari (Italy) Chemo-sphere 81 306ndash311 2010
COVA plant External Emergency Plan available athttpwwwosservatoriovaldagriit(last access February 2014) 2009 (inItalian)
Draxler R R and Rolph G D HYSPLIT (Hybrid Single-ParticleLagrangian Integrated Trajectory) model NOAA Air ResourLab Silver Spring MD available athttpreadyarlnoaagovHYSPLITphp(last access February 2014) 2003
EMPA Technischer Bericht zum Nationalen Beobachtungsnetzfuumlr Luftfremdstoffe (NABEL) Swiss Federal Laboratories forMaterials Testing and Research (EMPA) Duumlbendorf Switzer-land available athttpwwwempachnabel(last access March2013) 2010
ENI (Ente Nazionale Idrocarburi) ENI in Basilicata Local Re-port 2012 available athttpwwwenicomfilesdocumentieni-in-basilicatapdf 2012 (in Italian)
Esposito F Calvello M R Gueguen E and Pavese G Anew algorithm for brown and black carbon identification andorganic carbon detection in fine atmospheric aerosols by amulti-wavelength Aethalometer Atmos Meas Tech Discuss5 1003ndash1027 doi105194amtd-5-1003-2012 2012
Fu M Ge Y Wang X Tana J Yu L and Liang B NOx emis-sions from Euro IV busses with SCR systems associated with ur-ban suburban and freeway driving patterns Sci Total Environ452ndash453 222ndash226 2013
Fujita E M and Campbell D E Review of Current Air Monitor-ing Capabilities near Refineries in the San Francisco Bay AreaFinal Report available athttpwwwbaaqmdgov~mediaFilesTechnical20ServicesDRI_Final_Report_061113ashxlast access February 2014
Godoi R H M Godoi A F L Gonccedilalves Junior S J ParalovoS L Borillo G C Barbosa C G G Arantes M G CharelloR C Filho N A R Grassi M T Yamamoto C I Potgieter-Vermaake S Rotondo G G De Waelf K and van GriekenR Healthy environment ndash indoor air quality of Brazilian elemen-tary schools nearby petrochemical industry Sci Total Environ463ndash464 639ndash646 2013
Gonccedilalves C Evtyugina M Alves C Monteiro C Pio Cand Tomeacute M Organic particulate emissions from field burningof garden and agriculture residues Atmos Res 101 666ndash6802011
Hansen A D A The Aethalometer manual Magee Sci-entific available at httpmageescicomsupportdownloadsAethalometerbook20050703pdf(last accesse February 2014)2005
Hsieh L Yang H and Chen H Ambient BTEX and MBTE inthe neighbourhoods of different industrial parks in Southern Tai-wan J Hazard Mater A128 106ndash115 2006
Kalnay E Kanamitsu M Kistler R Collins W Deaven DGandin L Iredell M Saha S White G Woollen J Zhu YLeetmaa A Reynolds R Chelliah M Ebisuzaki W HigginsW Janowiak J Mo K C Ropelewski C Wang J Jenne Rand Joseph D The NCEPNCAR 40-year reanalysis project BAm Meteorol Soc 77 437ndash470 1996
Kim D Kumfe B M Anastasio C Kennedy I M and YoungT M Environmental aging of polycyclic aromatic hydrocarbonson soot and its effect on source identification Chemosphere 761075ndash1081 2009
Legendre L and Legendre P Numerical Ecology Elsevier Sci-ence Publishers Amsterdam 1985
Li Y Lau A K H Fung J C H Ma H and Tse Y Systematicevaluation of ozone control policies using an Ozone Apportion-ment method Atmos Environ 76 136ndash146 2013
wwwnat-hazards-earth-syst-scinet1421332014 Nat Hazards Earth Syst Sci 14 2133ndash2144 2014
2144 M Calvello et al Air quality and oilgas pre-treatment plants
Liang L Lal R Du Z Wu W and Meng F Estimation of ni-trous oxide and methane emission from livestock of urban agri-culture in Beijing Agr Ecosyst Environ 170 28ndash35 2013
Lin T-Y Sree U Tseng S-H Chiu K H Wu C-H and LoJ-G Volatile organic compound concentrations in ambient airof Kaohsiung petroleum refinery in Taiwan Atmos Environ 384111ndash4122 2008
Liu P-W Yao Y-C Tsai J-H Hsu Y-C Chang L-P andChang K-H Source impacts by volatile organic compounds inan industrial city of southern Taiwan Sci Total Environ 398154ndash163 2008
Mirante F Alves C Pio C Pindado O Perez R RevueltaM A and Artintildeano B Organic composition of size segregatedatmospheric particulate matter during summer and winter sam-pling campaigns at representative sites in Madrid Spain AtmosRes 132ndash133 345ndash361 2013
Mohiuddin K Strezov V Nelson P F and Stelcer E Charac-terisation of trace metals in atmospheric particles in the vicinityof iron and steelmaking industries in Australia Atmos Environ83 72ndash79 2014
Nair V S Solmon F Giorgi F MariottiL Babu S Sand Moorthy K K Simulation of South Asian aerosolsfor regional climate studies J Geophys Res 117 D04209doi1010292011JD016711 2012
Parmar R S Satsangi G S Kumari M Lakhani A SrivastavS S and Prakash S Study of size-distribution of atmosphericaerosols at Agra Atmos Environ 35 693ndash702 2001
Pavese G Calvello M and Esposito F Black Carbon and or-ganic components in the atmosphere of Southern Italy compar-ing emissions from different sources and production processes ofcarbonaceous particles Aerosol Air Qual Res 12 1146ndash11562012
Perez P Palacios R and Castillo A Carbon monoxide concen-tration forecasting in Santiago Chile J Air Waste Manage 54908ndash913 2004
Reche C Querol X Alastuey A Viana M Pey J Moreno TRodriacuteguez S Gonzaacutelez Y Fernaacutendez-Camacho R de la RosaJ DallrsquoOsto M Preacutevocirct A S H Hueglin C Harrison R Mand Quincey P New considerations for PM Black Carbon andparticle number concentration for air quality monitoring acrossdifferent European cities Atmos Chem Phys 11 6207ndash6227doi105194acp-11-6207-2011 2011
Seco R Pentildeuelas J Filella I Llusia J Schallhart S MetzgerA Muumlller M and Hansel A Volatile organic compounds inthe western Mediterranean basin urban and rural winter mea-surements during the DAURE campaign Atmos Chem Phys13 4291ndash4306 doi105194acp-13-4291-2013 2013
Solomon P A Hopke P K Foines J and Scheffe R Key sci-entific and policy- and health-relevant findings from the US En-vironmental Protection Agencyrsquos Particulate Matter SupersitesProgram and related studies an integration and synthesis of re-sults J Air Waste Manag Assoc 58 S3ndashS92 2008
Trippetta S Caggiano R and Telesca L Analysis of particu-late matter in anthropized areas characterized by the presence ofcrude oil pre-treatment plants The case study of the Agri Valley(Southern Italy) Atmos Environ 77 105ndash116 2013
Van Middelaar C E Dijkstra J Berentsen P B M and De BoerI J M Cost-effectiveness of feeding strategies to reduce green-house gas emissions from dairy farming J Dairy Sci 97 2427ndash2439 doi103168jds2013-7648 2014
Wang Y Ren X Ji D Zhang J Sun J and Wu F Characteri-zation of volatile organic compounds in the urban area of Beijingfrom 2000 to 2007 J Environ Sci 24 95ndash101 2012
Wongphatarakul V Friedlander S K and Pinto J P A compar-ative study of PM25 ambient aerosol chemical databases Envi-ron Sci Technol 32 3926ndash3934 1998
Nat Hazards Earth Syst Sci 14 2133ndash2144 2014 wwwnat-hazards-earth-syst-scinet1421332014
2134 M Calvello et al Air quality and oilgas pre-treatment plants
All this implies the need for efficient monitoring of theair quality state in this area which should be carried outthrough the implementation of advanced and integrated ob-serving strategies able to characterize and possibly quantifythe environmental and human health impacts of such activ-ity In order to realize effective near-real-time monitoringof environmental hazards associated with the COVA emis-sions an advanced network of five stations devoted to the airquality state control has been established in the Val drsquoAgriarea This network is operated by the Agenzia Regionaleper la Protezione dellrsquoAmbiente (ARPA) of the Basilicataregion (ARPA Basilicata hereafter) and provides near-real-time concentration measurements of both regulated pollu-tants (ie sulfur dioxide carbon monoxide nitrogen diox-ide nitrogen oxides ozone particulate matter and benzene)and several pollutants specifically related to oilgas extrac-tion and treatment activities (ie nitrogen monoxide hydro-gen sulfide methane non-methane hydrocarbons total hy-drocarbons toluene ethylbenzene and isomers of xylene)To the best of our knowledge this is the first air qualitynetwork which provides continuous concentration measure-ments of so many pollutants in a such small area even whencompared for example to the very efficient observing net-work operating near the five refineries in the San FranciscoBay Area described in a recent comprehensive report by Fu-jita and Campbell (2013) More common monitoring strate-gies are mainly devoted to the study of volatile organic com-pounds (VOCs) and sulfur dioxide near refineries (Baltrenaset al 2011 Lin et al 2008) or near industrial parks in-cluding petrochemical facilities (Liu et al 2008 Hsieh etal 2006) Nevertheless more investigation should be doneIn fact previous studies carried out in the Val drsquoAgri areasuggested the need for the integration of the existing obser-vations with experimental measurements of sub-micrometreaerosol particles (ie PM1 aerosol particles with an aerody-namic diameter less than 10 microm) and black carbon (BC here-after) due to their possible association with combustion pro-cesses such as those occurring in the COVA plant (Trippettaet al 2013 Pavese et al 2012) The importance of the mea-surement of PM1 and BC is especially related to their ad-verse effects on environment and human health (eg Mo-hiuddin et al 2014 Anenberg et al 2011) Moreover BCalso contributes significantly to global warming (Bond et al2013) Despite this there is still a relatively limited amountof data for the sub-micrometre atmospheric particle fractionavailable at present (Mirante et al 2013) and only recentlythere has been growth for BC monitoring networks in manycountries around the world these networks often employAethalometers due to their good time resolution portabil-ity and low costs (see for example the US EPA networkin Solomon et al (2008) the UK Black Carbon Network inButterfield et al (2010) and the Swiss National Air PollutionMonitoring Network ndash NABEL in EMPA (2010))
The present study enters into this context and its maingoal is to provide a preliminary evaluation of the air qual-
ity state of the Val drsquoAgri area and to give some indication ofspecific areas potentially affected by hazards deriving fromthe COVA plant through the use of a novel approach basedon the integration of routine air quality measurements ad-ditional experimental measurements and advanced statisticalanalyses
To this aim as a preliminary phase daily concentrations ofthe main pollutants measured at the five monitoring stationslocated in the Val drsquoAgri area in the period 1 Septemberndash31 October 2013 were considered and analysed along withsimultaneous concentration measurements of PM1 and BCobtained at two of the five sampling sites and involving ad-ditional experimental facilities by the Istituto di Metodologieper lrsquoAnalisi Ambientale (IMAA) of the National ResearchCouncil of Italy (CNR) In particular the temporal and spa-tial variability of the pollutant concentration measurementsand the relative correlations were investigated using multi-variate statistical techniques which also provided a prelimi-nary indication of the source types contributing to their pres-ence in the local atmosphere
The possibility to integrate measurements from the exist-ing monitoring network with further key parameters as PM1and BC with an in-depth cluster and spatial variance analy-ses represents a powerful approach to study the COVA influ-ence on the Val drsquoAgri environment This will provide use-ful indications to the stakeholders in order to develop betteremission control strategies and to reach a sustainable equilib-rium between the environmental impact of energy supply byoilgas resources and the strong agricultural vocation of thearea and to improve the standards of living for the Val drsquoAgripopulation
2 Materials and methodologies
21 The ARPA Basilicata air quality monitoringnetwork
The Val drsquoAgri air quality monitoring network con-sists of five monitoring stations Viggiano Zona Indus-triale (VZI 4018prime5064primeprime N 1554prime1669primeprime E) Viggiano 1(V1 4020prime458primeprime N 1554prime190primeprime E) Masseria De Blasiis(MDB 4019prime2618primeprime N 1552prime258primeprime E) Grumento Nova(GN 4017prime1800primeprime N 1553prime2800primeprime E) and Costa MolinaSud 1 (CMS 4018prime5700primeprime N 1557prime1500primeprime E) The mon-itoring stations are located at a distance ranging betweenabout 500 m and about 4800 m from the COVA plant and arerepresentative of the air quality of an area of about 100 km2
around this plant (Fig 1)All the stations provide continuous and near-real-time
measurements of the concentrations of sulfur dioxide (SO2)carbon monoxide (CO) nitrogen monoxide and dioxide (NOand NO2 respectively) nitrogen oxides (NOx which is thesum of NO and NO2) ozone (O3) hydrogen sulfide (H2S)methane (CH4) non-methane hydrocarbons (NMHCs) total
Nat Hazards Earth Syst Sci 14 2133ndash2144 2014 wwwnat-hazards-earth-syst-scinet1421332014
M Calvello et al Air quality and oilgas pre-treatment plants 2135
Figure 1 Location of the five stations of the ARPA Basilicataair quality monitoring network The image also shows the loca-tion of the PM1 and BC sampling sites and of the Centro OlioVal drsquoAgri (COVA) plant Aerial photography courtesy of GoogleEarth (httpearthgooglecom) Legend Viggiano Zona Industri-ale (VZI) Viggiano 1 (V1) Masseria De Blasiis (MDB) GrumentoNova (GN) and Costa Molina Sud 1 (CMS)
hydrocarbons (THC ie the sum of CH4 and NMHCs) ben-zene (C6H6) toluene ethylbenzene and isomers of xyleneMoreover V1 MDB GN and CMS also provide continu-ous and near-real-time measurements of the concentrationsof particulate matter with an aerodynamic diameter less than10 and 25 microm (PM10 and PM25 respectively) RegardingVZI it is equipped for the measurement of the PM10 con-centrations only These measurements are provided with atime lag of several months due to the instrumentation used(ie a gravimetric sampler) A summary of the methods usedfor the measurements of the concentrations of each pollutantis reported in Table 1
All the air quality monitoring stations also provide mea-surements of the main meteorological parameters air tem-perature (T ) atmospheric pressure (P ) relative humidity(RH) wind speed (ws) and direction (wd) global radiation(GR) and rainfall (rf)
22 Experimental PM1 and BC measurements
PM1 measurements were performed in Viggiano at a dis-tance of about 170 m (SW direction) from V1ndashARPA Basil-icata monitoring station (Fig 1) This site was chosen sinceViggiano is the nearest town to the COVA plant at about2400 m from it and one of the most populated towns ofthe Val drsquoAgri area (about 3100 inhabitants) PM1 sampleswere collected using a low-volume (167 L minminus1 flow rate)gravimetric sampler (TCR Tecora) equipped with a PM1 cut-off inlet and polycarbonate filters (Oslash= 47 mm) The sam-pling time was 24 h (starting from 1200 pm) and each fil-ter was humidity-conditioned in a filter-conditioning cabi-
net (approximatelyT = 20plusmn 2C and RH= 50plusmn 5 ) be-fore and after sampling for 48 h The PM1 mass was deter-mined by means of a gravimetric method using an analyticalmicrobalance with a sensitivity ofplusmn1 microg
Regarding BC measurements they were performed closeto the COVA plant by placing a dedicated instrument atVZIndashARPA Basilicata monitoring station This location waschosen for its closeness to the COVA where continuouscombustion processes were thought to have an impact onBC content A rack-mount seven-wavelengths Magee Sci-entific Aethalometer AE31 (370 470 520 590 660 880and 950 nm) was used to estimate BC mass concentrationsand to detect the presence of its organic fraction throughthe UV-absorbing particulate matter (UVPM) quantity TheAethalometer measures light attenuation due to the presenceof absorbing carbonaceous aerosol deposits on a quartz fi-bre filter (Hansen 2005) Corresponding absorption coeffi-cients are obtained at the seven wavelengths and convertedto mass concentrations with in particular measurements atthe 880 nm wavelength used to obtain BC content assuminga mass-specific absorption cross section of 166 m2 gminus1 (Nairet al 2012 Reche et al 2011) If the organic component ispresent in carbonaceous aerosols an enhanced absorption atthe UV wavelengths is recorded leading to qualitative detec-tion of this component through measurements at 370 nm (Es-posito et al 2012) For the data considered in this work theinstrument was equipped with a cut size-selective cyclone tointake particles with aerodynamic diameters less than 25 micromat a flow rate of 4 L minminus1 and a time resolution of 5 min
23 Meteorology and air mass history
A summary of the main meteorological parameters averagedover the period 1 Septemberndash31 October 2013 is reported inTable 2 for the five monitoring stations
Low variations were observed for all parameters show-ing a quite homogeneous meteorological pattern all overthe study area Looking at the prevailing wind directionswesterly winds were more frequent for all the sites exceptfor VZI monitoring station where a southeastern compo-nent was present During the study period the area wasaffected by frequent anticyclonic systems as verified bythe map of the 850 hPa geopotential heights obtained fromthe NOAA-NCEPNCAR (National Oceanic and Atmo-spheric AdministrationndashNational Centers for Environmen-tal PredictionNational Center for Atmospheric Research)global reanalysis database (httpwwwesrlnoaagovpsddatagriddeddatancepreanalysisderivedhtml Kalnay etal 1996) (Fig 2)
The same database was used to initialize HYSPLIT(HYbrid Single-Particle Lagrangian Integrated TrajectoryDraxler and Rolph 2003) model cluster analysis of backwardtrajectories in order to assess the main air mass transport pat-terns affecting the study area from 1 September to 31 Oc-tober In particular five-day backward trajectories arriving
wwwnat-hazards-earth-syst-scinet1421332014 Nat Hazards Earth Syst Sci 14 2133ndash2144 2014
2136 M Calvello et al Air quality and oilgas pre-treatment plants
Table 1Summary of the methods used for measuring concentrations of each pollutant
Parameter Measurement principle
SO2 UV fluorescenceNO ChemiluminescenceNO2 ChemiluminescenceNOx ChemiluminescencePM25 Beta attenuationlowast
PM10 Beta attenuationlowastgravimetriclowastlowast
O3 UV absorptionCO Non-dispersive IR detection (NDIR)C6H6 Gas chromatography with photo-ionization detector (GC-PID)H2S UV fluorescenceCH4 Photo-ionization detection (PID)NMHCs Photo-ionization detection (PID)THC Photo-ionization detection (PID)Toluene Gas chromatography with photo-ionization detector (GC-PID)Ethylbenzene Gas chromatography with photo-ionization detector (GC-PID)Isomers of xylene Gas chromatography with photo-ionization detector (GC-PID)
lowast V1 GN MDB and CMS monitoring stationslowastlowast VZI monitoring station
Table 2Meanplusmn standard deviation (m plusmn SD) of the main meteorological parameters measured at the five air quality monitoring stations from1 September to 31 October 2013 Regarding the wind direction (wd) the prevailing directions evaluated for the entire period of observationare reported
Monitoring T RH P ws Prevailing wd GR rfstation (C) () (hPa) (msminus1) (Wmminus2) (mm)
VZI 17 plusmn 3 74plusmn 9 946plusmn 4 12plusmn 05 SESW 174plusmn 59 18plusmn 39V1 17plusmn 2 66plusmn 11 933plusmn 4 34plusmn 16 SWNW 159plusmn 55 14plusmn 43MDB 16plusmn 3 75plusmn 8 948plusmn 4 31plusmn 16 NW 149plusmn 47 11plusmn 35GN 17plusmn 3 64plusmn 11 932plusmn 4 24plusmn 13 SW 106plusmn 42 01plusmn 06CMS 18plusmn 3 73plusmn 11 939plusmn 4 37plusmn 17 NW 167plusmn 58 13plusmn 38
at 500 m above ground level (agl) were computed 4 timesdaily and further put together in different clusters accord-ing to similar transport patterns A map with the mean tra-jectory for each representative cluster and the correspondingpercentage of occurrence is shown in Fig 3 As Fig 3 shows48 of the total backward trajectories travelled very low be-fore reaching the study area and among these 45 wereof local origin remaining over the Tirrenian Sea This couldhave favoured the accumulation of pollutants in the lowestatmospheric layers during the study period
3 Results and discussion
31 Explorative statistical analysis
Table 3 reports a summary of the explorative statistical anal-ysis carried out on the pollutant mean daily concentrationsmeasured in the area under study from 1 September to 31 Oc-tober 2013 Concentration measurements of ethylbenzeneand isomers of xylene were not considered in this study due
to the several data being missing As Table 3 shows signif-icantly higher values of NO NO2 NOx C6H6 and toluenedaily concentrations were registered at VZI monitoring sta-tion with respect to the other four stations These compoundsmainly originate from anthropogenic sources including theCOVA plant In fact NOx and VOCs represent some of themain gaseous emissions of this plant (ENI 2012) Thereforethe higher concentration values recorded at VZI monitoringstation should be also related to a contribution from COVAto their presence in the local atmosphere Furthermore CH4daily concentrations showed higher values at MDB monitor-ing station likely due to its proximity to several farms de-voted to the breeding of dairy cows In fact the livestocksector is one of the largest contributors to greenhouse gasemissions globally mostly as CH4 emissions (Van Middelaaret al 2014 Liang et al 2013) Finally higher H2S concen-tration values were registered at CMS station
Figure 4 reports the temporal pattern of the PM1 dailyconcentrations As Fig 4 shows the PM1 daily concentra-tions ranged from 11 to 74 microg mminus3 with a mean value of27 microg mminus3 Due to the lack of PM1 measurements performed
Nat Hazards Earth Syst Sci 14 2133ndash2144 2014 wwwnat-hazards-earth-syst-scinet1421332014
M Calvello et al Air quality and oilgas pre-treatment plants 2137
Table 3 Statistical parameters of the atmospheric pollutant daily concentrations measured at the five air quality monitoring stations from1 September to 31 October 2013 Meanplusmn standard deviation (m plusmn SD) and the range of variability (minndashmax) are reported for each pollutantLegend na= not available mu= measurement units
Parameter muARPA Basilicata monitoring stations
VZI V1 MDB GN CMS
SO2 microg mminus3 561plusmn 188 674plusmn 077 756plusmn 108 369plusmn 100 341plusmn 130(331ndash1239) (534ndash1068) (507ndash983) (191ndash685) (131ndash713)
NO microg mminus3 505plusmn 183 103plusmn 044 131plusmn 064 098plusmn 048 073plusmn 040(234ndash842) (012ndash248) (038ndash338) (018ndash260) (016ndash166)
NO2 microg mminus3 1263plusmn 430 436plusmn 196 489plusmn 134 362plusmn 154 349plusmn 130(645ndash2526) (109ndash1332) (262ndash795) (044ndash703) (046ndash725)
NOx microg mminus3 2035plusmn 663 594plusmn 236 689plusmn 198 513plusmn 205 460plusmn 175(995ndash3796) (221ndash1712) (321ndash1184) (122ndash933) (085ndash919)
PM10 microg mminus3 na1609plusmn 635 2097plusmn 721 1525plusmn 516 1831plusmn 568(612ndash3663) (1150ndash3940) (580ndash2580) (891ndash3600)
PM25 microg mminus3 na899plusmn 403 1169plusmn 459 874plusmn 373 863plusmn 394
(330ndash2220) (380ndash2190) (290ndash1640) (250ndash1880)
O3 microg mminus3 5868plusmn 1432 8273plusmn 1372 4876plusmn 1476 8532plusmn 1548 6999plusmn 1457(2596ndash9034) (5028ndash11638) (1824ndash8121) (4707ndash12472) (3757ndash10431)
CO microg mminus3 034plusmn 011 017plusmn 005 015plusmn 003 033plusmn 008 022plusmn 005(017ndash058) (005ndash040) (010ndash022) (011ndash060) (009ndash030)
C6H6 microg mminus3 091plusmn 016 030plusmn 011 028plusmn 011 017plusmn 010 022plusmn 007(063ndash144) (012ndash052) (008ndash060) (003ndash049) (010ndash039)
Toluene microg mminus3 101plusmn 038 043plusmn 019 034plusmn 015 019plusmn 010 024plusmn 008(050ndash227) (012ndash097) (013ndash081) (005ndash043) (012ndash043)
CH4 microC g mminus3 95803plusmn 3499 90269plusmn 1675 111494plusmn 9597 94444plusmn 3321 91192plusmn 2657(8870ndash10380) (8740ndash9460) (97200ndash160900) (81400ndash100500) (85600ndash97800)
NMHCs microC g mminus3 10326plusmn 10859 2408plusmn 908 10302plusmn 8156 14605plusmn 1085 6508plusmn 2381(2775ndash56358) (404ndash4469) (089ndash34268) (12175ndash16459) (487ndash11184)
THC microC g mminus3 106097plusmn 9091 92681plusmn 2303 121750plusmn 11653 109441plusmn 3938 97684plusmn 2193(97916ndash145515) (88184ndash98090) (106588ndash194911) (95969ndash116932) (93432ndash101841)
H2S microg mminus3 187plusmn 037 180plusmn 043 056plusmn 036 159plusmn 050 272plusmn 047(099ndash271) (102ndash279) (010ndash214) (050ndash314) (107ndash374)
in the area under study during the considered period thesevalues were compared with the unique PM1 concentrationmeasurements presently existing for this area and reported ina previous study (Trippetta et al 2013) Results show that thePM1 daily concentrations registered during the period underconsideration were lower than the PM1 concentration meanvalue (110plusmn 51 microg mminus3) measured close to the COVA plantfrom July to November 2011
Daily values of BC and UVPM content are reported inFig 5 BC daily concentrations were found in the range from288 to 1125 ng mminus3 with a mean value of 551 ng mminus3 Alsoin the case of BC a comparison was possible with the uniquedata set of BC concentration measurements available for the
area described in Pavese et al (2012) In that case a slightlylower monthly mean value of 494 ng mminus3 was obtained inFebruary 2011 while higher mean monthly values of 822735 and 858 ng mminus3 were found in January March and April2011 respectively
For UVPM estimated values were included in the rangefrom 2 to 267 ng mminus3 with a mean value of 84 ng mminus3 im-plying the constant presence of the organic component of car-bonaceous particles during the sampling period
32 Cluster analysis
In order to study the correlation pattern between the pollu-tant concentration data registered at each site and to obtain
wwwnat-hazards-earth-syst-scinet1421332014 Nat Hazards Earth Syst Sci 14 2133ndash2144 2014
2138 M Calvello et al Air quality and oilgas pre-treatment plants
Figure 2 Map of the 850 hPa geopotential heights averagedfor the period 1 Septemberndash31 October 2013 from the NOAA-NCEPNCAR (National Oceanic and Atmospheric AdministrationndashNational Centers for Environmental PredictionNational Center forAtmospheric Research) reanalysis database
a preliminary indication of the source types contributing totheir presence in the local atmosphere cluster analysis (CA)was used In particular a hierarchical-type clustering algo-rithm was applied to the Pearson correlation (ρ) matrix andthe furthest-neighbour method was chosen as a criterion forforming clusters (Legendre and Legendre 1985)
For this analysis THC was considered as the sum of CH4and NMHCs and NOx as the sum of NO and NO2 in orderto avoid redundant information
By applying CA to the pollutant concentration datarecorded at VZI monitoring site three clusters and three iso-lated variables were found (Fig 6a) In particular the firstcluster is composed of C6H6 and toluene the second in-cludes SO2 and NOx and the third consists of BC UVPMand THC CO H2S and O3 represent the isolated vari-ables By analysing each identified cluster it can be ob-served that C6H6 and toluene which belong to the aromaticVOCs group show a good correlation (ρ = 086) This couldsuggest a common source of these two compounds in theconsidered area Major sources of ambient VOCs ndash espe-cially of benzene toluene ethylbenzene and isomers of xy-lene (BTEX) ndash include vehicular emissions automobile ser-vice stations and industrial emissions (Caselli et al 2010)In particular the vehicular emissions come from different
Figure 3 Maps with average trajectories for each obtained clus-ter and corresponding percentage of occurrence (in brackets) forthe period 1 Septemberndash31 October 2013 The numbers outside thebrackets identify each cluster
Figure 4 Temporal pattern of the PM1 daily concentrations mea-sured at Viggiano town from 1 September to 31 October 2013
sources exhaust emissions (cold and hot) evaporative emis-sions and emissions from brake and tyre wear Among theBTEX industrial emissions those related to petroleum pro-duction processes represent an important source of thesecompounds (Godoi et al 2013) Therefore the presence ofC6H6 and toluene in the local atmosphere of the Viggianoindustrial area could be due to the contribution of both trafficand COVA emissions Focusing on the second cluster SO2and NOx show a significant correlation (ρ =069) These two
Nat Hazards Earth Syst Sci 14 2133ndash2144 2014 wwwnat-hazards-earth-syst-scinet1421332014
M Calvello et al Air quality and oilgas pre-treatment plants 2139
Figure 5 Temporal patterns of daily values of black carbon (BC)and UV-absorbing particulate matter (UVPM) content obtainedat Viggiano Zona Industriale (VZI) station from 6 September to23 October 2013
gaseous compounds represent the main gases emitted by theCOVA thermodestroyers (ENI 2012) Therefore the signif-icant SO2 and NOx correlation could suggest the influenceof the COVA emissions on the local air quality Regardingthe third cluster a good correlation is found between BCand UVPM (ρ = 053) as well as between these two param-eters and THC (ρ = 045) The formation of this cluster canbe explained by incomplete combustion processes as a com-mon source of all the three parameters and highlights thestrong interaction between the particle phase represented byBC and the organic molecular species contained in UVPMThese molecules quantitatively determined by THC concen-tration measurements are verified to have a high probabilityto be adsorbed on BC particles surfaces (Kim et al 2009)From concentration values in Table 3 it can be easily verifiedthat more than 90 of THC consists of methane and there-fore a good correlation between BC UVPM and CH4 can beinferred from CA Since the presence of methane in the localatmosphere of the area covered by VZI monitoring stationis very likely related to COVA combustion processes ratherthan traffic the same prevailing source can be attributed toBC and UVPM emissions at the sampling site under consid-eration
By considering V1 monitoring site the application of CAto the pollutant daily concentration data pointed out threeclusters and four isolated variables (Fig 6b) Since the PM1monitoring site is very close to V1 monitoring station itcan be assumed that these two sites are representative of thesame area implying that PM1 measurements can be consid-ered along with those performed at V1 monitoring station inCA As Fig 6b shows the first cluster includes PM10 andPM25 the second is composed of NOx C6H6 and tolueneand the third consists of CO and THC H2S O3 PM1 andSO2 represent the isolated variables Focusing on each sin-gle cluster it can be observed that PM10 and PM25 show the
highest value of the correlation coefficient (ρ = 093) Thisindicates that they could share some sources andor emis-sion processes (Parmar et al 2001) Due to the large num-ber of sources emitting particulate matter in the consideredarea the lack of the PM10 and PM25 chemical characteri-zation and the absence of significant correlations betweenPM10PM25 and other pollutants their main origin was notidentified Regarding the second cluster NOx and C6H6 aresignificantly correlated with each other (ρ = 074) and withtoluene (ρ = 065) Moreover focusing on the third cluster itcan be observed that CO and THC are characterized by a cor-relation coefficient of 054 All these compounds althoughincluded into two separate clusters could have originatedfrom common sources In fact CO NOx VOCs and hydro-carbons as NMHCs are the main emissions of petrol anddiesel-engine motor vehicles Moreover CO NOx VOCsand hydrocarbons in this case as CH4 are included amongthe main gaseous emissions of the COVA plant (ENI 2012)If one considers that V1 monitoring station is located at about5 m from the main road connecting the industrial area withthe town of Viggiano and at about 2300 m from the COVAplant this cluster could reveal the influence of both traffic-and COVA-plant-related emissions on the local atmosphere
When applying CA to the pollutant daily concentrationsmeasured at MDB monitoring site two clusters and four iso-lated variables are found (Fig 6c) In particular the first clus-ter is composed of PM10 PM25 and CO and the secondincludes C6H6 toluene and NOx H2S O3 SO2 and THCrepresent the isolated variables By considering the correla-tion coefficients it can be observed that PM10 and PM25are significantly correlated with each other (ρ = 094) andwith CO (ρ = 060) A significant correlation between COand PM measurements was found in areas affected by emis-sions coming from residential wood combustion (eg Bignalet al 2008) and agricultural-burning smoke (Gonccedilalves etal 2011) andor in sites exposed to traffic emissions (Perezet al 2004) All these types of emissions characterize thearea where MDB monitoring station is located In fact MDBis placed in a rural area where open burning of grass andforest is a common practice used for clearing field wastein farming and ranching Moreover MDB is about 1400 mfrom a high-speed motorway (ie SS 598) characterized by amoderate volume of traffic consisting of cars and heavy ve-hicles The proximity of the MDB monitoring station to theSS 598 could also justify the second cluster identified whereC6H6 and toluene are significantly correlated with each other(ρ = 086) and with NOx (ρ = 060) In fact benzene andtoluene are considered to be emitted from vehicle-related ac-tivity including vehicular exhaust and gasoline evaporation(Seco et al 2013 Wang et al 2012) while NOx is signifi-cantly related to heavy-duty vehicle emissions (eg Fu et al2013)
Focusing on GN monitoring site CA results point out twoclusters and three isolated variables (Fig 5d) In particularthe first cluster is composed of PM10 and PM25 and the
wwwnat-hazards-earth-syst-scinet1421332014 Nat Hazards Earth Syst Sci 14 2133ndash2144 2014
2140 M Calvello et al Air quality and oilgas pre-treatment plants
(a)
(c)
(e)
(b)
(d)
Figure 6 Dendrograms obtained by applying the furthest-neighbour clustering method to the pollutant concentration data recorded at(a)VZI monitoring site(b) V1 monitoring site(c) MDB monitoring site(d) GN monitoring site and(e)CMS monitoring site The clusters areshown in grey
second includes C6H6 toluene NOx and THC H2S O3 andSO2 represent the isolated variables In particular PM10 andPM25 show the highest value of the correlation coefficient(ρ = 091) meaning that they are characterized by a similarbehaviour However no suggestion about their origin and asa consequence no indication about the sources affecting thelocal air quality is provided by CA in this case Focusing onthe second cluster it can be observed that C6H6 and tolueneare significantly correlated with each other (ρ = 081) andwith NOx (ρ = 074) Then this group correlates with THC(ρ = 053) As found for V1 monitoring station these corre-lations highlight the traffic- and COVA-plant-related contri-butions that can be justified if it is considered that GN mon-itoring station is located in the suburbs of the town of Gru-mento where a contribution deriving from traffic is expectedand that GN is about 2800 m from the COVA plant
When applying CA to the pollutant daily concentrationsmeasured at CMS monitoring site three clusters and threeisolated variables are found (Fig 6e) In particular the firstcluster is composed of PM10 and PM25 the second includes
C6H6 THC and toluene and the third is represented by COand H2S NOx SO2 and O3 represent the isolated variablesBy considering the correlation coefficients between the vari-ables included in each cluster it can be observed that PM10and PM25 show the highest value of the correlation coef-ficient (ρ = 097) but CA does not provide any suggestionabout their origin in this case either Regarding the secondcluster C6H6 and THC are significantly correlated with eachother (ρ = 075) and with toluene (ρ = 048) As found forV1 and GN monitoring stations these correlations could beattributed to COVA-plant-related contributions Finally fo-cusing on the third cluster it can be observed that CO andH2S are correlated with each other (ρ = 048) This clustervery likely reveals the impact of the COVA emissions on thelocal air quality probably deriving from the incomplete com-bustion of the natural gas in the plantrsquos system of torches
33 Data spatial variance
In order to better assess the pollutant concentration spa-tial variability a coefficient of divergence (COD) and the
Nat Hazards Earth Syst Sci 14 2133ndash2144 2014 wwwnat-hazards-earth-syst-scinet1421332014
M Calvello et al Air quality and oilgas pre-treatment plants 2141
Pearson correlation coefficients (ρ) were calculated betweenthe pollutant concentrations measured at the five air qualitystations
Regarding the COD it was calculated for each parameterand for each pair of stations to obtain an estimate of the de-gree of the data set uniformity following Eq (1)
CODjk =
radicradicradicradic 1
p
psumi=1
[(xij minus xik)(xij + xik)
]2 (1)
wherex represents the daily concentrations and thei j andk indexes refer respectively to the sampling day and to thetwo sampling stations (Wongphatarakul et al 1998) TheCODs can vary from 0 (maximum degree of homogeneity)to 1 (minimum degree of homogeneity) for the consideredpollutant concentrations measured at each pair of samplingsites
COD and ρ values are reported in Tables 4 and 5respectively
Substantial homogeneity was observed for CH4 and O3when they were compared to the other pollutants In factthey show low values of CODs and relatively highρ val-ues very likely due to their longer residence times in the at-mosphere with respect to the other pollutants This peculiarfeature allowed for a more uniform distribution of the pol-lutants over the entire area which was also favoured by fre-quent high-pressure conditions characterizing the consideredperiod (see Fig 2)
Focusing on the comparison between the CH4 and O3concentrations measured at the five air quality stations thehigher COD and the lowerρ values found when the cou-pling with the MDB station was considered confirm the pe-culiarity of this site for CH4 production as already reportedin Sect 31 Then looking at the O3ρ values the highestvalues were found when VZI and MDB stations were ex-cluded from the coupling implying that these two stationsare different from the others with regard to ozone This is inaccordance with the lower mean values of O3 found at VZIand MDB stations (see Table 3) where at the same time highconcentration values of both NOx and NMHCs the two well-known main ozone precursors are found This confirms thelarger probability that ozone enhancement is detected at sitesfar from where it is formed through secondary processes (Liet al 2013)
Regarding PM10 and PM25 a comparison was possiblein all cases except for VZI station where no measurementswere available for these two parameters For the remainingstations very low CODs and very highρ values were ob-tained highlighting a spread and homogeneous diffusion ofsuch pollutants over the study area This could be due to com-mon sources of these two parameters and their uniform pres-ence in the local atmosphere could be also associated with theprevalence of high-pressure systems over the area during thestudy period
For benzene toluene and nitrogen compounds higher val-ues of COD and correspondingly lowerρ values were foundwhen the coupling with VZI station was considered This canbe attributed to an additional source of such compounds otherthan traffic present at VZI and related to the COVA emissionsas previously assessed by the CA Looking in particular atNOx benzene and toluene good values ofρ and low val-ues of COD were found when the other four stations wereconsidered suggesting a common source of traffic that is inagreement with CA results
Regarding SO2 COD values did not show any particulartrend while the lowestρ values were found when MDB sta-tion was considered In the case of H2S lowestρ valueswere found for VZI coupling suggesting the presence of asource of this pollutant at the sampling site located close tothe COVA plant At the same time the highest CODs cor-respond to the coupling with MDB station where particu-larly low mean values of this parameter were registered asreported in Table 3 probably due to the upwind position ofthis station with respect to the COVA (see Fig 1 and Table 2where prevailing wind direction is mentioned)
As to CO a lack of homogeneity was present for all thestations This in agreement with what was found by CAreflects the presence of several different sources of CO inthe area including COVA emissions traffic and combustionprocesses related to agricultural activities
Finally when NMHCs are considered a lack of homo-geneity was present for all the stations probably due to theirshort residence time in the atmosphere
4 Conclusions
Daily pollutant concentrations available in the Val drsquoAgriarea for the period 1 Septemberndash31 October 2013 were con-sidered and analysed along with simultaneous concentrationmeasurements of PM1 and BC obtained involving additionalexperimental facilities In particular the temporal and spa-tial variability of the pollutant concentration measurementsand the intra- and inter-site correlations were investigatedusing multivariate statistical techniques Preliminary indica-tions about the source types contributing to the presence ofpollutants in the local atmosphere as well as some indica-tions about specific areas potentially affected by hazards de-riving from the COVA plant have also been provided Re-sults show that the COVA plant emissions have an impacton the air quality over the entire area These impacts havemainly been found in the area closest to the COVA plantrepresented by VZI station Moreover the area where CMSmonitoring station is located seems also to be significantlyaffected by the COVA-plant-related emissions Focusing onVZI station it can be observed that several pollutants specif-ically related to the combustion processes occurring in thisplant (ie NOx benzene and toluene) show the highest con-centration values and significant correlations In particular
wwwnat-hazards-earth-syst-scinet1421332014 Nat Hazards Earth Syst Sci 14 2133ndash2144 2014
2142 M Calvello et al Air quality and oilgas pre-treatment plants
Table 4Coefficients of divergence (CODs) calculated for each pollutant and each pair of stations Legend nc ndash not calculable
COD VZIV1 VZICMS VZIGN VZIMDB V1CMS V1GN V1MDB CMSGN CMSMDB GNMDB
SO2 017 031 026 024 038 032 011 018 043 037NO 066 075 068 060 032 030 028 030 038 029NO2 052 057 056 044 021 023 018 019 019 023NOx 056 063 060 049 020 019 017 016 022 021PM10 nc nc nc nc 010 008 016 012 010 017PM25 nc nc nc nc 016 010 016 012 024 016O3 019 010 020 010 009 003 028 011 019 029CO 036 027 017 040 021 035 016 025 020 039C6H6 046 060 067 051 019 036 013 031 018 033Toluene 045 060 067 050 033 043 021 024 022 032CH4 003 003 002 008 001 003 011 002 010 009NMHCs 054 029 044 052 050 073 062 045 050 056THC 008 006 005 009 003 008 014 006 011 007H2S 020 023 023 060 024 021 058 032 069 055
Table 5Pearson correlation coefficients (ρ) calculated for each pollutant and each pair of stations Legend nc ndash not calculable
ρ VZIV1 VZICMS VZIGN VZIMDB V1CMS V1GN V1MDB CMSGN CMSMDB GNMDB
SO2 031 029 0002 minus026 040 050 minus014 04 minus031 minus022NO 004 037 015 032 037 019 027 055 041 018NO2 minus044 minus022 minus034 minus020 053 054 049 060 060 071NOx minus033 minus002 minus012 003 055 053 043 060 063 055PM10 nc nc nc nc 092 089 087 085 086 089PM25 nc nc nc nc 091 091 088 087 087 093O3 090 095 089 093 097 098 084 096 091 085CO minus008 012 019 022 minus007 006 002 025 059 031C6H6 050 055 04 048 07 074 073 064 072 076Toluene minus016 017 minus015 005 067 072 059 067 065 071CH4 055 089 063 037 063 049 037 074 037 020NMHCs minus039 048 minus054 025 011 077 022 minus005 054 023THC minus038 minus014 minus042 minus009 062 065 053 063 039 034H2S minus009 minus019 minus016 minus02 007 012 024 012 009 015
the significant correlation found between BC and UVPMcontent and THC (mainly consisting of CH4) could indi-cate the COVA incomplete combustion processes as a sourceof carbonaceous compounds in this area and highlights therole of BC as a vehicle for organic compounds in the envi-ronment Regarding CMS station the impact of the COVAemissions on the local air quality probably derives from theincomplete combustion of the natural gas in the plantrsquos sys-tem of torches Traffic represents an additional and importantsource of atmospheric pollutants over the entire area More-over the contribution of emission deriving from dairy cowbreeding and agriculture-related activities has been found inthe area where MDB monitoring station is located This is infair agreement with the prevailing rural features of this areaResults also show that PM1 is not correlated with any pollu-tant suggesting the need for further investigation of these pa-rameters so as to define its main origin Regarding the inter-site variability of the pollutant concentrations substantial ho-mogeneity was observed for CH4 O3 PM10 and PM25 when
they were compared to the other pollutants This is proba-bly due to peculiar features of these pollutants (referring toCH4 and O3) probable common sources (referring to PM10and PM25) and the prevalence of high-pressure systems overthe area during the study period (all pollutants) Focusing onthe single air quality station COD andρ values confirm thepresence of an additional CH4 source in the area where MDBstation is located Moreover a difference among the VZI andMDB stations and the remaining stations is observed if O3 isconsidered Finally remarkable differences between VZI andthe other stations have been confirmed when concentrationvalues of NOx benzene toluene and H2S are considered
In conclusion the present study preliminarily highlightsthat a novel approach based on the integration of routineair quality measurements innovative experimental measure-ments and advanced statistical analyses is suitable to givea realistic picture of the emission features of the area andto distinguish areas mainly affected by COVA plant emis-sions This methodology represents an attempt to build an
Nat Hazards Earth Syst Sci 14 2133ndash2144 2014 wwwnat-hazards-earth-syst-scinet1421332014
M Calvello et al Air quality and oilgas pre-treatment plants 2143
integrated observing strategy applicable to other similar in-dustrial sites
AcknowledgementsThis work was carried out in the frameworkof the research agreement between ldquoRegione Basilicata ndash Osserva-torio Ambientale della Val drsquoAgrirdquo and ldquoIstituto di Metodologieper lrsquoAnalisi Ambientalerdquo of the National Research Council(IMAA-CNR) The authors are indebted to Rosa Caggiano andGiulia Pavese for helpful discussions and suggestions The authorswould like to thank the Agenzia Regionale per la ProtezionedellrsquoAmbiente (ARPA) of the Basilicata region for providing envi-ronmental data and for the logistical support in BC measurementsoperations Moreover authors are grateful to the ldquoProtezione CivileGruppo Lucano ndash Viggianordquo for the logistical support given duringthe PM1 sampling campaign
Edited by F VallianatosReviewed by two anonymous referees
References
Anenberg S C Talgo K Arunachalam S Dolwick P JangC and West J J Impacts of global regional and sec-toral black carbon emission reductions on surface air qualityand human mortality Atmos Chem Phys 11 7253ndash7267doi105194acp-11-7253-2011 2011
Baltrenas P Baltrenaite E Šereviciene V and Pereira P At-mospheric BTEX concentrations in the vicinity of the crude oilrefinery of the Baltic region Environ Monit Asses 182 115ndash127 2011
Bignal K L Langridge S and Zhou J L Release of polycyclicaromatic hydrocarbons carbon monoxide and particulate matterfrom biomass combustion in a wood-fired boiler under varyingboiler conditions Atmos Environ 42 8863ndash8871 2008
Bond T C Doherty S J Fahey D W Forster P M BerntsenT De Angelo B J Flanner M G Ghan S Kaumlrcher B KochD Kinne S Kondo Y Quinn P K Sarofim M C SchultzM G Schulz M Venkataraman C Zhang H Zhang S Bel-louin N Guttikunda S K Hopke P K Jacobson M ZKaiser J W Klimont Z Lohmann U Schwarz J P Shin-dell D Storelvmo T Warren S G and Zender C S Bound-ing the role of black carbon in the climate system A scientificassessment J Geophys Res 118 5380ndash5552 2013
Butterfield D Beccaceci S Sweeney B Green D AlexanderJ and Grieve A Annual Report for the UK Black CarbonNetwork available athttpuk-airdefragovukreportscat051009031405_2009_BC_Annual_Report_Finalpdf(last accessFebruary 2014) 2010
Caselli M De Gennaro G Marzocca A Trizio L and TutinoM Assessment of the impact of the vehicular traffic on BTEXconcentration in ring roads in urban areas of Bari (Italy) Chemo-sphere 81 306ndash311 2010
COVA plant External Emergency Plan available athttpwwwosservatoriovaldagriit(last access February 2014) 2009 (inItalian)
Draxler R R and Rolph G D HYSPLIT (Hybrid Single-ParticleLagrangian Integrated Trajectory) model NOAA Air ResourLab Silver Spring MD available athttpreadyarlnoaagovHYSPLITphp(last access February 2014) 2003
EMPA Technischer Bericht zum Nationalen Beobachtungsnetzfuumlr Luftfremdstoffe (NABEL) Swiss Federal Laboratories forMaterials Testing and Research (EMPA) Duumlbendorf Switzer-land available athttpwwwempachnabel(last access March2013) 2010
ENI (Ente Nazionale Idrocarburi) ENI in Basilicata Local Re-port 2012 available athttpwwwenicomfilesdocumentieni-in-basilicatapdf 2012 (in Italian)
Esposito F Calvello M R Gueguen E and Pavese G Anew algorithm for brown and black carbon identification andorganic carbon detection in fine atmospheric aerosols by amulti-wavelength Aethalometer Atmos Meas Tech Discuss5 1003ndash1027 doi105194amtd-5-1003-2012 2012
Fu M Ge Y Wang X Tana J Yu L and Liang B NOx emis-sions from Euro IV busses with SCR systems associated with ur-ban suburban and freeway driving patterns Sci Total Environ452ndash453 222ndash226 2013
Fujita E M and Campbell D E Review of Current Air Monitor-ing Capabilities near Refineries in the San Francisco Bay AreaFinal Report available athttpwwwbaaqmdgov~mediaFilesTechnical20ServicesDRI_Final_Report_061113ashxlast access February 2014
Godoi R H M Godoi A F L Gonccedilalves Junior S J ParalovoS L Borillo G C Barbosa C G G Arantes M G CharelloR C Filho N A R Grassi M T Yamamoto C I Potgieter-Vermaake S Rotondo G G De Waelf K and van GriekenR Healthy environment ndash indoor air quality of Brazilian elemen-tary schools nearby petrochemical industry Sci Total Environ463ndash464 639ndash646 2013
Gonccedilalves C Evtyugina M Alves C Monteiro C Pio Cand Tomeacute M Organic particulate emissions from field burningof garden and agriculture residues Atmos Res 101 666ndash6802011
Hansen A D A The Aethalometer manual Magee Sci-entific available at httpmageescicomsupportdownloadsAethalometerbook20050703pdf(last accesse February 2014)2005
Hsieh L Yang H and Chen H Ambient BTEX and MBTE inthe neighbourhoods of different industrial parks in Southern Tai-wan J Hazard Mater A128 106ndash115 2006
Kalnay E Kanamitsu M Kistler R Collins W Deaven DGandin L Iredell M Saha S White G Woollen J Zhu YLeetmaa A Reynolds R Chelliah M Ebisuzaki W HigginsW Janowiak J Mo K C Ropelewski C Wang J Jenne Rand Joseph D The NCEPNCAR 40-year reanalysis project BAm Meteorol Soc 77 437ndash470 1996
Kim D Kumfe B M Anastasio C Kennedy I M and YoungT M Environmental aging of polycyclic aromatic hydrocarbonson soot and its effect on source identification Chemosphere 761075ndash1081 2009
Legendre L and Legendre P Numerical Ecology Elsevier Sci-ence Publishers Amsterdam 1985
Li Y Lau A K H Fung J C H Ma H and Tse Y Systematicevaluation of ozone control policies using an Ozone Apportion-ment method Atmos Environ 76 136ndash146 2013
wwwnat-hazards-earth-syst-scinet1421332014 Nat Hazards Earth Syst Sci 14 2133ndash2144 2014
2144 M Calvello et al Air quality and oilgas pre-treatment plants
Liang L Lal R Du Z Wu W and Meng F Estimation of ni-trous oxide and methane emission from livestock of urban agri-culture in Beijing Agr Ecosyst Environ 170 28ndash35 2013
Lin T-Y Sree U Tseng S-H Chiu K H Wu C-H and LoJ-G Volatile organic compound concentrations in ambient airof Kaohsiung petroleum refinery in Taiwan Atmos Environ 384111ndash4122 2008
Liu P-W Yao Y-C Tsai J-H Hsu Y-C Chang L-P andChang K-H Source impacts by volatile organic compounds inan industrial city of southern Taiwan Sci Total Environ 398154ndash163 2008
Mirante F Alves C Pio C Pindado O Perez R RevueltaM A and Artintildeano B Organic composition of size segregatedatmospheric particulate matter during summer and winter sam-pling campaigns at representative sites in Madrid Spain AtmosRes 132ndash133 345ndash361 2013
Mohiuddin K Strezov V Nelson P F and Stelcer E Charac-terisation of trace metals in atmospheric particles in the vicinityof iron and steelmaking industries in Australia Atmos Environ83 72ndash79 2014
Nair V S Solmon F Giorgi F MariottiL Babu S Sand Moorthy K K Simulation of South Asian aerosolsfor regional climate studies J Geophys Res 117 D04209doi1010292011JD016711 2012
Parmar R S Satsangi G S Kumari M Lakhani A SrivastavS S and Prakash S Study of size-distribution of atmosphericaerosols at Agra Atmos Environ 35 693ndash702 2001
Pavese G Calvello M and Esposito F Black Carbon and or-ganic components in the atmosphere of Southern Italy compar-ing emissions from different sources and production processes ofcarbonaceous particles Aerosol Air Qual Res 12 1146ndash11562012
Perez P Palacios R and Castillo A Carbon monoxide concen-tration forecasting in Santiago Chile J Air Waste Manage 54908ndash913 2004
Reche C Querol X Alastuey A Viana M Pey J Moreno TRodriacuteguez S Gonzaacutelez Y Fernaacutendez-Camacho R de la RosaJ DallrsquoOsto M Preacutevocirct A S H Hueglin C Harrison R Mand Quincey P New considerations for PM Black Carbon andparticle number concentration for air quality monitoring acrossdifferent European cities Atmos Chem Phys 11 6207ndash6227doi105194acp-11-6207-2011 2011
Seco R Pentildeuelas J Filella I Llusia J Schallhart S MetzgerA Muumlller M and Hansel A Volatile organic compounds inthe western Mediterranean basin urban and rural winter mea-surements during the DAURE campaign Atmos Chem Phys13 4291ndash4306 doi105194acp-13-4291-2013 2013
Solomon P A Hopke P K Foines J and Scheffe R Key sci-entific and policy- and health-relevant findings from the US En-vironmental Protection Agencyrsquos Particulate Matter SupersitesProgram and related studies an integration and synthesis of re-sults J Air Waste Manag Assoc 58 S3ndashS92 2008
Trippetta S Caggiano R and Telesca L Analysis of particu-late matter in anthropized areas characterized by the presence ofcrude oil pre-treatment plants The case study of the Agri Valley(Southern Italy) Atmos Environ 77 105ndash116 2013
Van Middelaar C E Dijkstra J Berentsen P B M and De BoerI J M Cost-effectiveness of feeding strategies to reduce green-house gas emissions from dairy farming J Dairy Sci 97 2427ndash2439 doi103168jds2013-7648 2014
Wang Y Ren X Ji D Zhang J Sun J and Wu F Characteri-zation of volatile organic compounds in the urban area of Beijingfrom 2000 to 2007 J Environ Sci 24 95ndash101 2012
Wongphatarakul V Friedlander S K and Pinto J P A compar-ative study of PM25 ambient aerosol chemical databases Envi-ron Sci Technol 32 3926ndash3934 1998
Nat Hazards Earth Syst Sci 14 2133ndash2144 2014 wwwnat-hazards-earth-syst-scinet1421332014
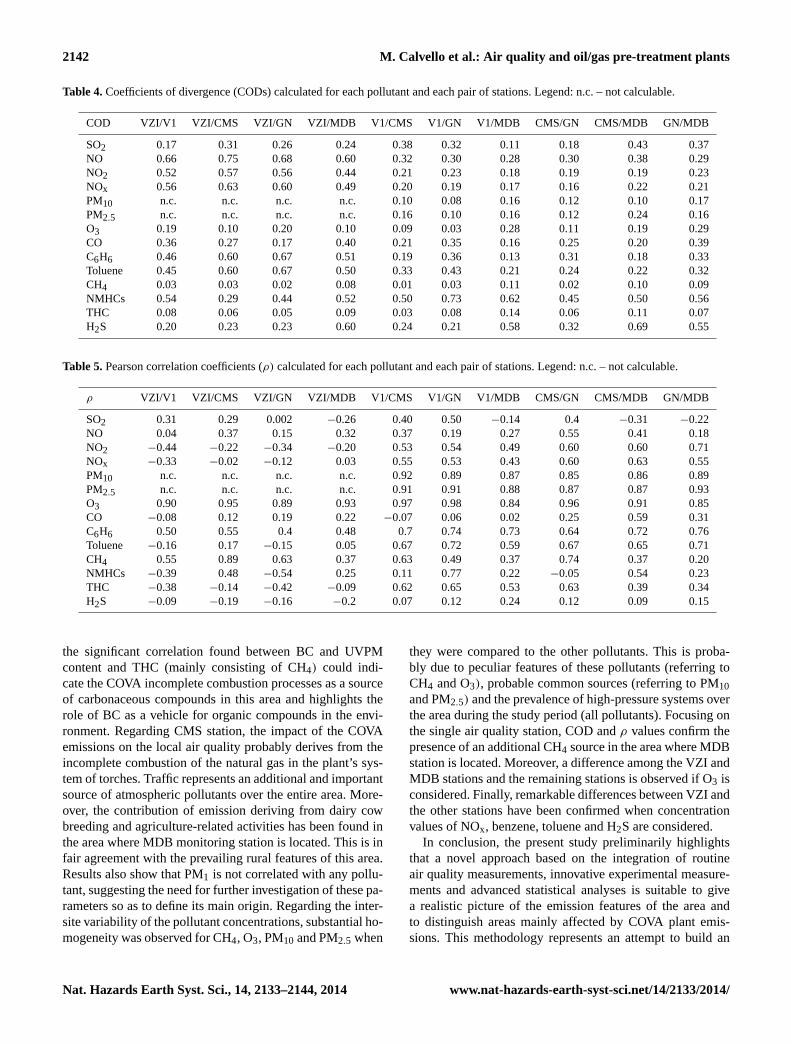
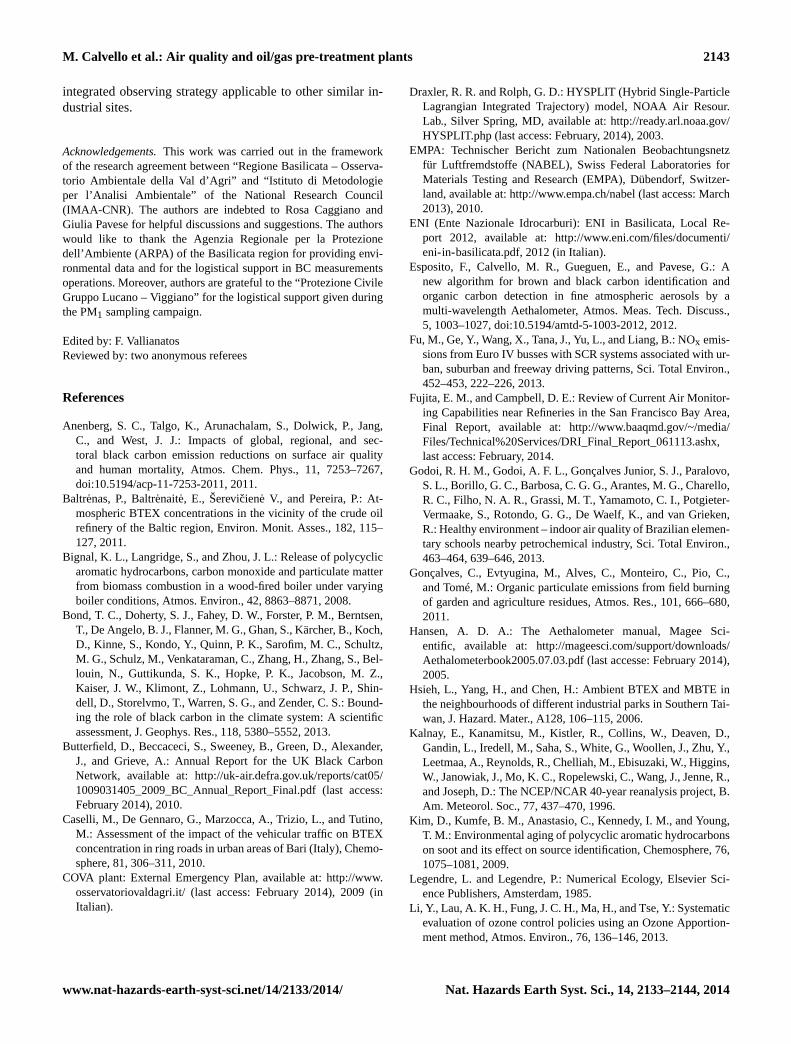