AN IN VIVO NEUROPHYSIOLOGICAL MODEL OF … · 4.5.3 Hemicortical localisation of post stroke EEG...
100
AN IN VIVO NEUROPHYSIOLOGICAL MODEL OF CORTICAL ISCHEMIA IN THE RAT by Luka Srejić A thesis submitted in conformity with the requirements for the degree of Master of Science Graduate Department of Physiology University of Toronto © Copyright by Luka Srejić (2009)
-
Upload
nguyenthien -
Category
Documents
-
view
214 -
download
1
Transcript of AN IN VIVO NEUROPHYSIOLOGICAL MODEL OF … · 4.5.3 Hemicortical localisation of post stroke EEG...

AN IN VIVO NEUROPHYSIOLOGICAL MODEL OF CORTICAL ISCHEMIA IN THE RAT
by
Luka Srejić
A thesis submitted in conformity with the requirements
for the degree of Master of Science
Graduate Department of Physiology
University of Toronto
© Copyright by Luka Srejić (2009)

ii
AN IN VIVO NEUROPHYSIOLOGICAL MODEL OF CORTICAL ISCHEMIA IN THE RAT Master of Science 2009, Luka Srejić, Department of Physiology, University of Toronto.
ABSTRACT
Spontaneous and evoked potentials (EPs) were recorded with cross-cortical
microelectrode arrays following partial occlusion of the MCA and ACA in urethane-
anaesthetised rats. The control group received no occlusion, while the treatment group
was injected with anti-stroke peptide Tat-NR2B9c 5min before ischemia. Spontaneous
EEG power significantly decreased in the stroke-only group when compared to controls
(p<0.001). A greater loss of EEG power was observed on anterior electrodes closer to the
occluded area versus posterior contacts in stroke-only rats (p<0.05). The Tat-
NR2B9c+stroke group lost significantly less power when compared to stroke-only
animals (p<0.05). EP amplitude in the stroke-only group was significantly reduced
following ischemia when compared to control and Tat-NR2B9c+stroke animals
(p<0.001). Epileptiform discharges were observed in 8/10 untreated stroke rats and 3/5
stroke rats treated with Tat-NR2B9c. The characteristic features of spontaneous and
evoked potentials validate this rat focal stroke model for in vivo testing of
pharmacological agents.

iii
ACKNOWLEDGEMENTS First, I would like to thank Dr. Bill Hutchison and Dr. Michelle Aarts for their
mentorship, guidance and support during my Master’s programme. I extend my gratitude
to Dr. Liang Zhang, Dr. Jonathan Dostrovsky and Dr. Joan Forder for their helpful
academic advice.
I would also like to thank my fellow lab mates Ian Prescott and Arun Sundaram for their
collegial help and encouragement.
This work is dedicated to my parents Radivoje and Gordana.

iv
TABLE OF CONTENTS 1 INTRODUCTION..................................................................................................... 1
1.1 Stroke: General Introduction .......................................................................... 1 1.2 Blood Supply to the Brain ................................................................................ 2 1.3 Neurophysiology................................................................................................ 3
1.3.1 Cerebral cortex.......................................................................................... 3 1.3.2 Electrophysiology ...................................................................................... 5 1.3.3 Spreading depression................................................................................ 9
1.4 Ischemia ........................................................................................................... 10 1.4.1 Ischemic core and penumbra ................................................................. 11 1.4.2 Ischemic cell death .................................................................................. 12 1.4.3 Uncoupling PSD-95 protein interactions as a therapeutic strategy ... 21 1.4.4 Rat models of stroke ............................................................................... 23
2 OBJECTIVE AND HYPOTHESIS....................................................................... 26 2.1 Objective .......................................................................................................... 26 2.2 Hypotheses ....................................................................................................... 26
3 METHODS .............................................................................................................. 27 3.1 Animals ............................................................................................................ 27 3.2 Pre-Experiment Surgery ................................................................................ 28 3.3 Microelectrodes ............................................................................................... 29
3.3.1 Triple recording electrode...................................................................... 29 3.3.2 Anteroposterior 8-channel array........................................................... 30 3.3.3 Mediolateral 6-channel array ................................................................ 30
3.4 Electrophysiological Recordings.................................................................... 32 3.4.1 Input-Output Curve................................................................................ 32 3.4.2 Stimulation parameters and ischemia induction ................................. 33 3.4.3 Tat-NR2B9c peptide synthesis and administration ............................. 35 3.4.4 Regional cerebral blood flow (rCBF) .................................................... 36
3.5 Data Analysis ................................................................................................... 36 4 RESULTS ................................................................................................................ 39
4.1 Early and late components ............................................................................. 39 4.2 Depth Profile.................................................................................................... 40 4.3 Current-source Density (CSD) Analysis ....................................................... 44 4.4 Regional Cerebral Blood Flow....................................................................... 46 4.5 Spontaneous Potentials ................................................................................... 47
4.5.1 Total loss of EEG power across channels after stroke ........................ 47 4.5.2 Greater recovery of EEG power in Tat-NR2B9c + stroke group....... 47 4.5.3 Hemicortical localisation of post stroke EEG power loss.................... 52
4.6 Effects of stroke on evoked potentials ........................................................... 53 4.6.1 Biphasic component P1/N1..................................................................... 56 4.6.2 Bilateral suppression of the evoked potentials following stroke......... 58
4.7 Periodic Epileptiform Discharges (PEDs) .................................................... 60 5 DISCUSSION .......................................................................................................... 63
5.1 Current-source Density Analysis and Unit Discharges ............................... 63 5.2 Regional Cerebral Blood Flow (rCBF) Following Ischemia ....................... 64

v
5.3 Suppression of Spontaneous Potentials After Stroke .................................. 65 5.4 Evoked Potentials............................................................................................ 66
5.4.1 EP attenuation following ischemia ........................................................ 68 5.4.2 Post-ischemic P1/N1 acute, transient potentiation............................... 70
5.5 Transhemispheric Changes in Cortical Potentials....................................... 72 5.6 Tat-NR2B9c Application Following Cortical Ischemia............................... 73 5.7 Post-ischemic Epileptiform Discharges......................................................... 75
5.7.1 High-frequency oscillations coinciding with post-stroke epileptiform activity 77
6 CONCLUSION ....................................................................................................... 80 7 FUTURE STUDIES................................................................................................ 80

vi
LIST OF FIGURES Fig. 1 The blood vessels of the brain viewed from the ventral surface ................................3
Fig. 2 Neurons in the cerebral cortex arranged in distinctive layers ....................................5
Fig. 3 Organization of PDZ proteins at a mammalian excitatory synapse ..........................20
Fig. 4 Illustration of Tat-NR2B9c uncoupling the PSD-95 protein from NMDAR............23
Fig. 5 Illustration of electrode array and placement with respect to the rat cortex .............31
Fig. 6 Illustration of the surface vessel area pattern ............................................................34
Fig. 7 Thalamic stimulation parameters before, during and after induction of ischemia....35
Fig. 8 Power histograms of spontaneous cortical potentials................................................37
Fig. 9 Diagram for current source-density analysis.............................................................38
Fig. 10 A cortical potential evoked via ventrolateral thalamic stimulation.........................40
Fig. 11 Depth profile of the thalamically evoked potential .................................................43
Fig. 12 Illustration of neuronal activity superimposed primarily on component N1 ..........44
Fig. 13 Spectral contour diagram of the current source density (CSD) calculations ..........45
Fig. 14 Cortical blood flow versus time following a stroke and in control rat....................46
Fig. 15 FFT waterfall illustration of EEG power loss after stroke ......................................48
Fig. 16 Total EEG power in control, stroke-only and TAT-NR2B9c + stroke animals......49
Fig. 17 EEG power change on individual electrodes ..........................................................51
Fig. 18 EEG power measured on both the stroke and control cortices................................52
Fig. 19 Illustration of the evoked potential across time in one rat ......................................54
Fig. 20 Illustration of the increased amplitude of the P1/N1 biphasic component..............55
Fig. 21 Overlay of the baseline and post-stroke evoked potentials .....................................57
Fig. 22 P1/N1 amplitudes averaged and normalised to baseline for each treatment ...........58
Fig. 23 Evoked potentials from both the stroke and control rat cortices.............................59
Fig. 24 Illustrations of epileptiform activity in the rat following cortical ischemia............62

vii
LIST OF ABBREVIATIONS ACA – anterior cerebral artery
AMPAR – α-amino-3-hydroxyl-5-methyl-4-isoxazolepropionic acid receptor
AUC – area under curve
CSD – current-source density
DCR – direct cortical response
EAA – excitatory amino acid
EEG – electroencephalogram
EP – evoked potential
HFO – high frequency oscillation
HSD – hypoxic spreading depression
iGluR – ionotropic glutamate receptor
MCA – middle cerebral artery
MCAo – middle cerebral artery occlusion
mGluR – metabotropic glutamate receptor
ICA – internal carotid artery
IED – interictal epileptiform discharges
MAGUK – membrane associated guanylate kinase
NMDAR – N-methyl-D-aspartate receptor
NO – nitric oxide
nNOS – neuronal nitric oxide synthase
OGD – oxygen-glucose deprivation
PED – periodic epileptiform discharge
PSD – post synaptic density
PSD95 – post synaptic density 95 scaffolding protein
rCBF – regional cerebral blood flow
SD – spreading depression
SEP – somatosensory evoked potential
tPA – tissue plasminogen activator
VPL – ventral posterior lateral nucleus of thalamus

1
1 INTRODUCTION
1.1 Stroke: General Introduction
Stroke is defined as a "neurological deficit of a cerebrovascular cause that persists
beyond 24 hours or is interrupted by death within 24 hours" by the World Health
Organisation. Stroke is the second most common cause of death worldwide after
ischemic heart disease and a serious cause of disability in both developed and developing
countries (Donnan et al., 2008). Because of the world’s ageing population, the burden on
society due to stroke-related impairments is expected to greatly increase by 2030 (Murray
& Lopez, 1997).
Development of treatment and prevention of stroke has advanced during the last
decade. Primary treatment options currently include thrombolytic drugs that break down
blood clots, such as the tissue plasminogen activator (tPA) and surgical intervention
(Donnan et al., 2008). tPA is also currently the only stroke therapeutic approved by the
Food and Drug Administration (FDA). Different forms of supportive care such as speech
therapy, physiotherapy and occupational therapy are coupled with pharmacological
interventions (Gilligan et al., 2005). Secondary prevention consists of antiplatelet drugs
(eg. aspirin), regular blood pressure control and removal of arteriolar plaques and
blockages in selected patients.
Although stroke awareness and prevention has increased clinical management of
stroke, therapeutics which protect the brain from post-stroke deterioration are notably
lacking. The translation from bench to bedside of potential ‘brain-protective’ drugs has
largely failed due to combinations of insufficient preclinical validation, poor clinical trial
2
design, and deleterious side effects. Currently, the primary goal of stroke research is
finding a treatment that stops the progression of stroke-related injury when given after
initial attack, without having serious adverse effects on the patient.
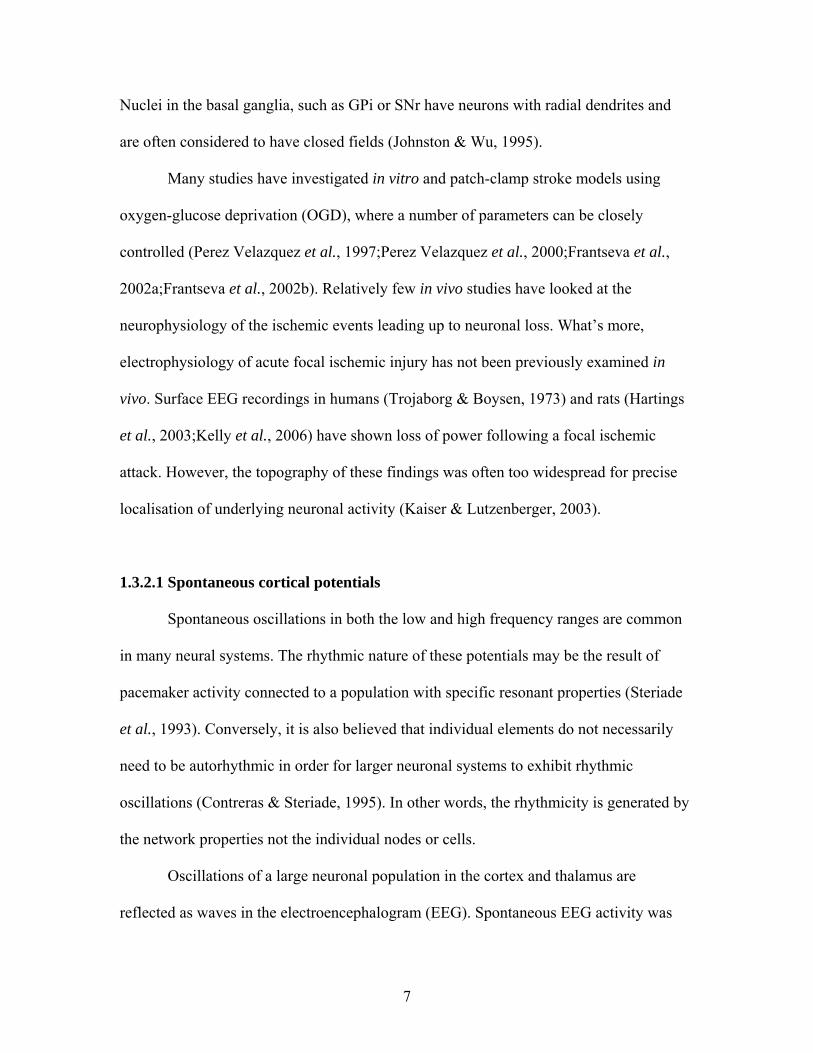
1.2 Blood Supply to the Brain
Although the human brain is only 2% of the total body weight, it uses 15% of the
total cardiac output via two vertebral and two internal carotid arteries (ICA) (Fix, 2008).
The brain consumes 20% of the oxygen used by the body and is perfused at a rate of 50
ml/100 g of brain tissue per minute. Together with the anterior and posterior cerebral and
communicating arteries, the ICA forms the Circle of Willis (Fig. 1). The ICA enters the
cranium via the carotid canal of the temporal bone and lies within the cavernous sinus as
the carotid siphon. It supplies direct branches to the optic nerve, optic chiasm,
hypothalamus and genu of the internal capsule. ICA also divides into seven critical
branches which supply most of the brain: ophthalmic artery, central artery of the retina,
posterior communicating artery, anterior choroidal artery, anterior cerebral artery (ACA),
anterior communicating artery and the middle cerebral artery (MCA). The MCA supplies
most of the cerebral cortex including the lateral and insular cortices, trunk, arm, and face
areas of the motor and sensory cortices and the speech areas. It also perfuses the caudate
nucleus, putamen, globus pallidus and anterior and posterior limbs of the internal capsule.
The ACA supplies the medial surface of the frontal and parietal lobes (surrounding the
midline) and corpus callosum and is responsible for perfusing the leg and foot area of the

3
motor and sensory cortices. These arteries are easily accessible following craniotomies
and their occlusion in the human often results in debilitating neuronal damage.
Figure 1 Blood vessels of the brain viewed from the ventral surface. The Circle of Willis is made up of the proximal posterior cerebral arteries, the posterior communicating arteries, the internal carotid arteries just before their bifurcations, proximal anterior cerebral arteries, and anterior communicating artery. (Figure from Kandel et al., 2000)
1.3 Neurophysiology
1.3.1 Cerebral cortex
The cerebral cortex is composed of six distinct layers each containing a
characteristic distribution of neuron types and connections to different cortical and

4
subcortical regions (Fig. 2) (Fix, 2008;Purves et al., 2007;Kandel et al., 2000). The
molecular layer I is located just beneath the pial surface and is mostly comprised of
dendritic extensions and horizontally-oriented axons. There are very few scattered
neurons because of the small size of this layer. The external layer II contains small
pyramidal cells and many stellate neurons. The external pyramidal layer III is made up of
small and medium sized pyramidal neurons in addition to non-pyramidal neurons with
vertically-oriented intracortical axons. Layer III is the main source of corticocortical
commissural fibres whose primary targets are layers I through III within the same
hemisphere. Internal granular layer IV contains a mixture of densely packed stellate cells
and some pyramidal neurons. It is the primary target of horizontally running myelinated
fibres from different thalamic centres. The internal pyramidal layer V is made up of large
pyramidal cells and is the primary source of axons going to subcortical areas such as the
basal ganglia. The deepest part of the cortex – multiform layer VI contains spindle-like
pyramidal and multiform neurons that send fibres to the thalamus creating a precise
corticothalamic connection.
The cerebral cortex sends information via efferent connections to various
subcortical structures including the thalamus and the basal ganglia. It also receives
signals from the same areas via afferent fibres. The thalamus acts as a relay for all
sensory and motor connections going to and out of the cortex (Sherman, 2001).

5
Figure 2 Three different stains of neurons in the cerebral cortex arranged in distinctive layers. The Golgi stain reveals neuronal cell bodies and dendritic trees. The Nissl method shows cell bodies and proximal dendrites. A Weigert stain for myelinated fibers reveals the pattern of axonal distribution. (Figure from Kandel et al., 2000) 1.3.2 Electrophysiology
Extracellular field recordings are measured between two points in the
extracellular space, as opposed to intracellular recordings which measure the voltage

6
difference across a neuronal membrane. As a result, the extracellular field potential is the
summated activity of a population of neuronal elements (Johnston & Wu, 1995).
Since the active neuron is not uniformly polarised, the dendrites may be at a
different potential from the cell body and cell body at a different potential from the axon.
As the action potential propagates along the neuronal fibre, different regions of the axon
are at different potentials with respect to each other. Since the extracellular fluid acts as a
volume conductor, current flow in a volume conductor establishes fields that can exert
force on electrical charge in the conductor. This force is measured in the form of a
potential difference. The area of current flow into the axon or soma is termed current
sink, while the area where current exits the axon/soma is called current source.
Extracellular recording at a current sink will yield a negative potential with respect to a
distant ground. A positive extracellular potential is recorded at a current source. Given
that an action potential is never static but is constantly propagating, the sink and source
are always changing (Johnston & Wu, 1995).
Extracellular fields in the central nervous system can be classified into two
different categories – open and closed. Open fields are characterised by a laminar
organisation of neurons where the dendrites face in one direction and somata in another.
The cortex and hippocampus are examples of open fields. If this population of neurons is
activated by a summated synaptic input, a dipole is established between the dendrites and
somata. Closed fields are made up of spherical arrays of neurons with the cell bodies
localised either at the centre or periphery. The polarity of measurement depends on
placement of electrode within the sphere, while recording outside yields zero potential.
7
Nuclei in the basal ganglia, such as GPi or SNr have neurons with radial dendrites and
are often considered to have closed fields (Johnston & Wu, 1995).
Many studies have investigated in vitro and patch-clamp stroke models using
oxygen-glucose deprivation (OGD), where a number of parameters can be closely
controlled (Perez Velazquez et al., 1997;Perez Velazquez et al., 2000;Frantseva et al.,
2002a;Frantseva et al., 2002b). Relatively few in vivo studies have looked at the
neurophysiology of the ischemic events leading up to neuronal loss. What’s more,
electrophysiology of acute focal ischemic injury has not been previously examined in
vivo. Surface EEG recordings in humans (Trojaborg & Boysen, 1973) and rats (Hartings
et al., 2003;Kelly et al., 2006) have shown loss of power following a focal ischemic
attack. However, the topography of these findings was often too widespread for precise
localisation of underlying neuronal activity (Kaiser & Lutzenberger, 2003).
1.3.2.1 Spontaneous cortical potentials
Spontaneous oscillations in both the low and high frequency ranges are common
in many neural systems. The rhythmic nature of these potentials may be the result of
pacemaker activity connected to a population with specific resonant properties (Steriade
et al., 1993). Conversely, it is also believed that individual elements do not necessarily
need to be autorhythmic in order for larger neuronal systems to exhibit rhythmic
oscillations (Contreras & Steriade, 1995). In other words, the rhythmicity is generated by
the network properties not the individual nodes or cells.
Oscillations of a large neuronal population in the cortex and thalamus are
reflected as waves in the electroencephalogram (EEG). Spontaneous EEG activity was

8
originally thought to represent the plastic and constantly changing condition of the brain
(Bremer, 1958). It was later proposed that these oscillations directly correlate with the
synaptic activity in cortical cells (Klee et al., 1965).
Delta waves (1-4 Hz) have been shown to appear during later stages of sleep
while slow oscillations (<1 Hz) are present throughout resting sleep (Steriade et al.,
1993). These two rhythms are also the predominant spontaneous oscillations recorded
from the cortex of animals anesthetised with both urethane and ketamine / xylazine
(Contreras & Steriade, 1995;Steriade et al., 1993). Delta rhythms are made up of two
different components – cortical and thalamic. The thalamic inputs to the 4th layer of the
cortex from thalamocortical cells generate an oscillation in the delta frequency range via
the interplay between two of their voltage gated currents. Low frequency oscillations (<1
Hz) are also present in the sensory, motor and associated areas, however unlike their delta
counterparts they are for the most part unaffected by thalamic lesions (Steriade et al.,
1993). Steriade and colleagues suggested that the cortical slow rhythm organises the
thalamically generated delta waves within slowly recurring oscillatory cycles. By
analysing these deep cortical EEG patterns before, during and following focal ischemic
injury we have the opportunity to look at neuronal impairment beyond the obvious
cortical injury.
1.3.2.2 Evoked potentials
When inputs to a population of neurons are simultaneously activated the response
of these neurons (assuming that input has the same effect on each) is synchronous and

9
there is an associated voltage fluctuation in the vicinity known as an evoked potential
(Stevens 1966).
Cortical SEPs evoked from the trigeminal, sciatic and median nerves via bipolar
stimulating electrodes were found to attenuate in rats following MCAo induction
(Sakatani et al., 1990;Astrup et al., 1977). Also, Mun-Bryce et al. used bipolar
stimulation of the contralateral snout to record from the SI cortex of the swine and
reported similar findings following intracerebral haemorrhage (Mun-Bryce et al., 2001).
Each SEP cortical recording site responds primarily to one somatosensory area of
stimulation and as such simultaneous cross-cortical recordings using this method require
multiple peripheral stimuli.
1.3.3 Spreading depression
Spreading depression (SD) is a fast depolarisation of a large population of
neurons and glia, concomitant with a considerable ionic exchange between the
intracellular and extracellular space (Sugaya et al., 1975;Somjen, 2004). It was first
discovered by Leão and manifested as a flattening of the electrocorticogram (ECoG) from
bipolar recordings in the exposed cortex of the anaesthetised rabbit (Leão, 1944). In
subsequent studies Leão recorded a sustained extracellular potential shift during SD using
direct current (DC)-coupled electrodes (Leão, 1947;Leão, 1951). Membrane potentials
were measured before, during and after SD using intracortical microelectrodes (Brožek,
1966). Voltages were less negative during SD than prior to it, indicating depolarisation,
and more negative after repolarisation, suggesting transient hyperpolarisation. Studies
performed using ion-sensitive electrodes found that extracellular K+ levels increase

10
(Vyskocil et al., 1972), while extracellular Ca2+, Na+ and Cl- dramatically decrease
during SD (Hansen & Olsen, 1980;Kraig & Nicholson, 1978). This seems to indicate that
K+ is leaving the neurons in exchange for Ca2+ and Na+ (Somjen, 2001).
Spreading depression in the presence of abnormally low oxygen levels is termed
hypoxic spreading depression (HSD) and is thought to be the most recognisable predictor
of rapid cell death following ischemia (Somjen, 2004). Normoxic spreading depression
does not cause injury to the brain when experimentally induced on non-ischemic animals
(Nedergaard & Hansen, 1988). Repolarisation and restoration of ion gradients following
HSD requires energy, which requires a significant increase in blood flow to cover oxygen
and glucose consumption (Mies et al., 1993;Hansen & Lauritzen, 1984). Thus, the
membrane potential can recover from HSD only if oxygen levels recover shortly after
depolarisation. The ischemic cortex, however, is not able to accomplish re-oxygenation
due to the drastic and often prolonged decrease in blood flow.
1.4 Ischemia
Ischemia is defined as a lack of blood supply caused by obstruction of arterial
inflow. Severe heart disorders, such as cardiac arrest, systemic hypotension and rhythm
disorders cause a loss of blood flow to the entire brain, leading to global ischemia. On the
other hand, acute disruption of brain circulation in one or several arteries is termed focal
brain ischemia, which typically manifests as a syndrome of ischemic stroke or transient
ischemic attack. Cerebral ischemia initiates a process called ischemic cascade, which in
turn releases proteolytic enzymes, reactive oxygen species and other pathogens

11
eventually causing brain damage (Martin, 1990). Physiological processes in the brain
depend on the state of its energy metabolism, which is dependent on a near constant
supply of oxygen and glucose via the bloodstream. Inadequate blood supply results in
hypoxic or anoxic tissue as well localized hypoglycaemia. Glucose is the most important
energy-providing substrate in the brain, however due to limited stores complete oxidation
of brain glucose and glycogen takes only 5-7 min (Gusev & Skvortsova, 2003). At
normal body temperature, the process of cell death as outlined later, takes 3 – 4 hours
before becoming irreversible in aerobic tissues, such as the brain and heart. (Martin,
1990)
1.4.1 Ischemic core and penumbra
Upon focal ischemia, there are two regions of reduced blood flow in the cortex –
the infarct core and bordering penumbra or ‘area at risk’ (Astrup et al., 1977). In animal
models, specifically the middle cerebral artery occlusion (MCAo), the core is defined as
the area of critical blood flow reduction (<15% of normal flow) (Tamura et al.,
1981b;Duverger & MacKenzie, 1988). Cell death in the ischemic core usually occurs
within minutes, as a result of rapid anoxic depolarization and a simultaneous rise in
extracellular K+ (Nedergaard & Hansen, 1993). At 1 – 2 min of reduced blood flow, there
is a significant decrease in extracellular Ca+ levels at the core, signifying entry into the
tissue (Harris & Symon, 1984). Even if K+ levels return to normal after adequate
reperfusion, the severity of the ischemic insult leads to considerable cell death (Gido et
al., 1997).

12
The penumbra surrounds the core and is also supplied by the occluded artery but
retains structural integrity due to residual perfusion from collateral blood vessels. Both
silencing of the EEG (Strong et al., 1983) and reduced amplitude of somatosensory
evoked potentials (Sakatani et al., 1990) have been recorded in the penumbral tissue
minutes after infarct. Because blood flow to the penumbra is not completely blocked, this
area experiences only moderate hypoxic spreading depression rather than complete
anoxic depolarization (Hossmann, 1994;Nedergaard & Hansen, 1993;Somjen, 2001).
Acute hypoxic periods in the ischemic penumbra have been shown to coincide with the
passing wave of every peri-infarct depolarization (Back et al., 1994).
1.4.2 Ischemic cell death
Clearly defining cell death has proven to be difficult, but is typically thought to be
the point at which the cell is unable to recover normal morphology and function even if
all processes leading to damage have stopped (Lipton, 1999). However, we do not know
enough about the development of neuronal death following ischemia to be able to
identify this point with certainty. At present, the only clear definition of cell death
includes morphological states thought to be precursors of disintegration and phagocytosis
(Nedergaard, 1987). The process of cell death in ischemia is characterized by a delay
between onset of injury and the first signs of major cellular damage. Depending on extent
and duration of energy deprivation and the brain region affected, this delay can last days
(Du et al., 1996) or only hours (McGee-Russell et al., 1970).

13
1.4.2.1 Apoptosis and necrosis
In general, there are two main types of cell death – apoptosis and necrosis (Majno
& Joris, 1995). Apoptosis is also termed programmed or gene-directed cell death and in a
healthy organism it serves as a normal method of eliminating nonessential tissue.
Apoptosis involves a series of biochemical events leading to morphological changes and
the formation of new structures that are integral to the cell death process (Kerr et al.,
1972). After an insult to the plasma membrane, K+ and Cl- leave the cell (Yu & Choi,
2000). Cell shrinkage occurs early in the process and the altered ion composition inside
the cell leads to a swelling and malformation of the mitochondria (Lipton, 1999). This
triggers a release of soluble mitochondrial proteins such as cytochrome C, into the
cytosol. Cytochrome C in turn initiates a protein signal cascade which results in the
activation various caspases (Siesjö et al., 1999). Caspases are a family of cysteine
proteases that cleave a variety of cellular targets including other caspases, proteins,
cytoskeletal elements and chromosomal DNA. The caspase proteins have been termed
“executioners” because of their role in mediating the disintegration of the cell structure
during programmed cell death.
Necrosis, on the other hand, is a premature or abnormal death of a cell or tissue
that occurs following external trauma such as infection or bioenergetic failure as seen in
ischemia. Unlike cell shrinkage seen in apoptosis, ischemic necrosis is marked by
neuronal swelling and loss of membrane integrity (Duchen, 1992). In vitro studies of
cortical neurons show that severe oxygen and glucose deprivation leads to purely necrotic
death. When the same ischemic cultures were protected by glutamate receptor
antagonists, cell death occurred via apoptosis (Gwag et al., 1995). In vivo studies are less

14
conclusive – some groups discovered signs of apoptosis following transient global
cerebral ischemia in rats (Siesjö et al., 1999), while others found only necrotic neurons
(Colbourne et al., 1999).
1.4.2.2 Excitotoxicity
Cell death in pathologies such as stroke, epilepsy and neurodegeneration is
thought to be mediated primarily via excessive release and inadequate reuptake of
excitatory amino acids (EAA), specifically glutamate (Aarts et al., 2003). Blocking
postsynaptic glutamate receptors in vitro results in reduced sensitivity to hypoxia (Kass &
Lipton, 1982;Rothman, 1983). It is also widely accepted that glutamate excitotoxicity
depends largely on Ca2+ (Choi, 1995). Cellular functions, such as excitability, growth and
synaptic activity are governed by intracellular Ca2+ ions. Calcium influx or release from
intracellular stores elevates intracellular Ca2+ to levels that exceed the capacity for
homeostatic regulation (Tymianski & Tator, 1996). This activates maladaptive
mechanisms, such as persistent accumulation of proteolytic and lipolytic enzymes that
mediate cell death (Deshpande et al., 1987).
Although loss of Ca2+ homeostasis is a significant factor in excitotoxic cell death,
it may not be the exclusive mediator of calcium toxicity. The ‘source specificity
hypothesis’ stipulates that calcium toxicity is not solely dependent on overall Ca2+
concentration, but is also tied to the route of Ca2+ entry into the cell and subsequent
secondary messenger activation (Tymianski et al., 1993). To support this, studies have
shown that blocking glutamate receptor-mediated Ca2+ entry results in survival of
neurons after many hours of hypoxia (Peng et al., 1991) while blocking voltage-gated

15
Ca2+-channels does not prevent neurotoxicity under anoxia (Dubinsky & Rothman,
1991). Therefore, glutamate and calcium both appear to be crucial in mediating ischemic
injury (Hossmann, 1994).
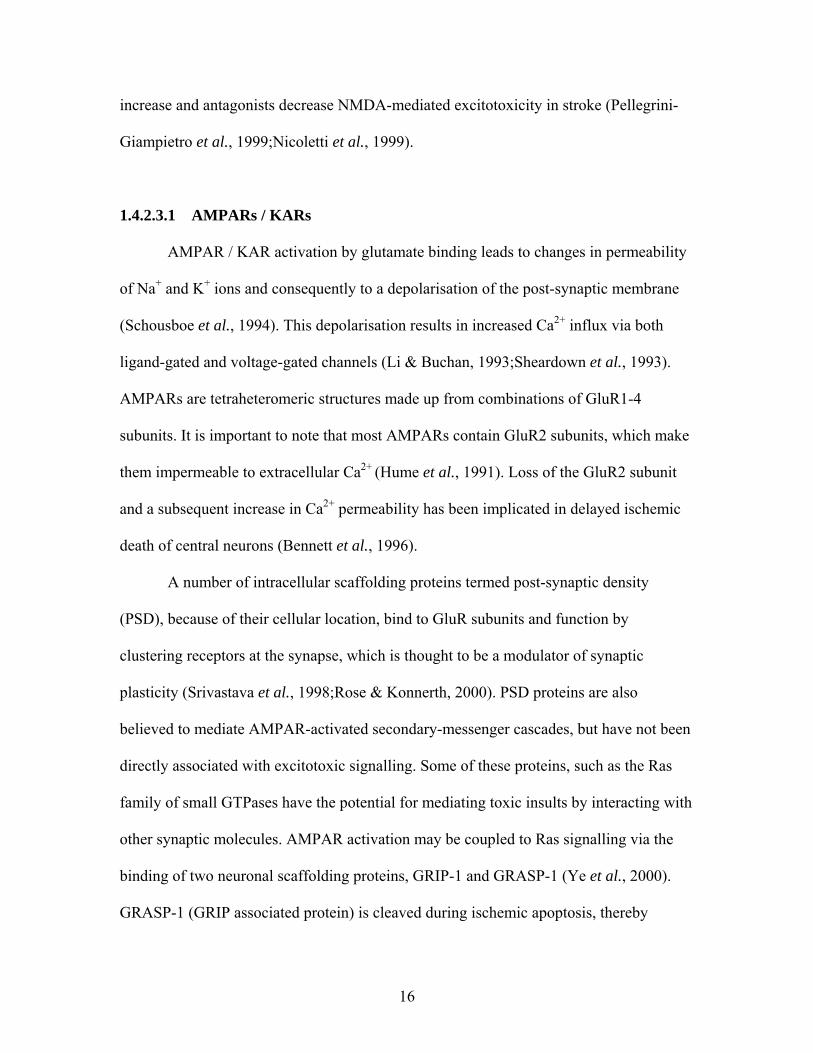
1.4.2.3 Glutamate Receptors
There are two functionally distinct families of glutamate receptors (GluR) –
ionotropic (iGluR) and metabotropic (mGluR).
Ionotropic GluRs are heteromeric ligand-activated ion channels that are
selectively permeable to extracellular Na+, K+ or Ca2+ when activated. Each receptor is
thought to be comprised of four individual subunits. Each subunit of the channel has four
transmembrane domains consisting of an extracellular N-terminus and an intracellular C-
terminus (Hollmann et al., 1994). iGluRs are important in mediating the synaptic
plasticity implicated in memory formation. Also, their activation has been associated with
glutamate-mediated toxicity (Choi, 1988). The iGluR family is typically grouped into two
pharmacologically different receptor subfamilies – α-amino-3-hydroxyl-5-methyl-4-
isoxazolepropionic acid / kainate receptors (AMPARs / KARs) and N-methyl-D-aspartate
receptors (NMDARs).
Metabotropic GluRs are monomeric proteins that activate intermediate
intracellular molecules called G-proteins following neurotransmitter binding. They do not
have ion channels as a part of their structure; instead G-protein subunits modulate ion
channels directly or indirectly through enzymes and secondary messengers. mGluRs have
been shown to play an important role in neuronal plasticity and nociception. Although
they haven’t been implicated directly in neurodegeneration, agonists of certain mGluRs
16
increase and antagonists decrease NMDA-mediated excitotoxicity in stroke (Pellegrini-
Giampietro et al., 1999;Nicoletti et al., 1999).
1.4.2.3.1 AMPARs / KARs
AMPAR / KAR activation by glutamate binding leads to changes in permeability
of Na+ and K+ ions and consequently to a depolarisation of the post-synaptic membrane
(Schousboe et al., 1994). This depolarisation results in increased Ca2+ influx via both
ligand-gated and voltage-gated channels (Li & Buchan, 1993;Sheardown et al., 1993).
AMPARs are tetraheteromeric structures made up from combinations of GluR1-4
subunits. It is important to note that most AMPARs contain GluR2 subunits, which make
them impermeable to extracellular Ca2+ (Hume et al., 1991). Loss of the GluR2 subunit
and a subsequent increase in Ca2+ permeability has been implicated in delayed ischemic
death of central neurons (Bennett et al., 1996).
A number of intracellular scaffolding proteins termed post-synaptic density
(PSD), because of their cellular location, bind to GluR subunits and function by
clustering receptors at the synapse, which is thought to be a modulator of synaptic
plasticity (Srivastava et al., 1998;Rose & Konnerth, 2000). PSD proteins are also
believed to mediate AMPAR-activated secondary-messenger cascades, but have not been
directly associated with excitotoxic signalling. Some of these proteins, such as the Ras
family of small GTPases have the potential for mediating toxic insults by interacting with
other synaptic molecules. AMPAR activation may be coupled to Ras signalling via the
binding of two neuronal scaffolding proteins, GRIP-1 and GRASP-1 (Ye et al., 2000).
GRASP-1 (GRIP associated protein) is cleaved during ischemic apoptosis, thereby

17
disrupting its regulation of Ras signalling. It has also been shown that synaptic targeting
of AMPARs is downregulated by GRASP-1 (Ye et al., 2002). It is possible that cleavage
during ischemia results in increased synaptic AMPAR activity and thus increases
vulnerability to glutamate overactivity (Aarts et al., 2003).
1.4.2.3.2 NMDARs
Like its AMPAR counterpart, the NMDA receptor is a heteromeric integral
membrane protein comprised of four subunits. Functional NMDARs are formed from the
co-assembly of the obligatory NR1 subunit with the NR2 and/or NR3 subunits. The
extracellular portion of the receptor is made up of two globular structures – the
mandatory domain and the ligand-binding domain (Stephenson, 2006). NR1 subunits
bind to the co-agonist glycine, while the NR2 subunits bind to glutamate. The NMDAR
membrane domain contains a voltage-dependent Mg+ block obstructing a Ca2+ and Na+-
permeable pore. NMDA receptors are unique in that they require both membrane
depolarization and ligand binding for full channel activity. Membrane depolarization is
required to remove the magnesium block and allow the receptor to become highly
conductive (Dale & Roberts, 1985). Na+ permeability contributes to further membrane
depolarisation, while influx of extracellular Ca2+ generates intracellular Ca2+ transients
mediating the primary physiological effects of NMDAR signaling (Waltereit & Weller,
2003). Each subunit also has a cytoplasmic domain with the C-terminal tails that contain
a number of motifs for phosphorylation and protein-protein interactions.
There are four NR2 subunits (A-D), however, NMDARs in the mature forebrain
consist of mostly NR2A and NR2B subtypes and are thought to have opposing roles in
18
synaptic plasticity (Massey et al., 2004). In vivo and in vitro studies implicate the
activation of NR2B-containg NMDA receptors in excitotoxicity and subsequent
apoptosis, while activation of NR2A subunits are thought to support neuronal survival
(Liu et al., 2007).
1.4.2.3.3 The Post synaptic density (PSD)
The PSD is an electron dense, subcellular structure made up of multiple
scaffolding and cytoskeletal proteins located beneath the postsynaptic membrane
(Schikorski & Stevens, 1997). The PSD is also thought to contain signal molecules that
can act as excitotoxic triggers downstream of glutamate receptors (Carlin et al., 1980). A
number of functions have been ascribed to the PSD, such as cell to cell adhesion,
regulation of receptor grouping and modulation of receptor coupling. In addition to
modulating signal transmission, synaptic activity at glutamate receptors can also lead to
structural remodelling of the PSD (Kennedy, 1993). Modulatory enzymes are associated
with the PSD and have been implicated in iGluR signalling. For instance, neuronal nitric
oxide synthase (nNOS) is activated by Ca2+ influx via NMDARs and can modulate
NMDAR signalling. Cytoskeletal proteins in the PSD domain play an important role in
receptor clustering, while scaffolding proteins function in clustering all the PSD
components. PSDs are found at both excitatory and inhibitory synapses. The excitatory
PSD is particularly abundant in scaffolding proteins containing protein-interaction PDZ
domains (Fig. 3). The PDZ acronym stands for the first letters of three proteins which
were first discovered to share the domain — post synaptic density protein (PSD-95),
Drosophila disc large tumor suppressor (DlgA), and zonula occludens-1 protein (ZO-1).
19
PDZ-containing scaffolds assemble specific proteins into large molecular complexes at
defined locations in the cell (Kim & Sheng, 2004). In the postsynaptic density PDZ
proteins organize glutamate receptors and their signalling proteins and regulate synaptic
size and strength. PDZ scaffolds are also implicated in the dynamic trafficking of
synaptic proteins by assembling cargo complexes for transport by molecular motors.
Synaptic PDZ-containing proteins fall into two families – GRIP and MAGUK. The GRIP
(glutamate receptor signalling protein) family is involved in glutamate receptor synaptic
targeting. GRIP1 and GRIP2/ABP are adaptor proteins for the AMPA receptor and
contain seven PDZ domains, which are thought to link AMPARs to other GRIP-
associated proteins (Kornau et al., 1995). The MAGUK (membrane associated guanylate
kinase) family of synaptic proteins is composed of four members and each can undergo
protein-protein interactions with multiple binding partners. MAGUK members include:
Post-Synaptic Density 95 (PSD-95), Synapse Associated Protein 97 (SAP97), chapsyn-
110/PSD-93 and SAP102. Each member is distributed differently across neuronal
compartments. PSD-95 and PSD-93 are highly concentrated in the PSD, whereas
SAP102 and SAP97 are found in dendrites and axons and are equally abundant in the
cytosol and the synapse (Gardoni, 2008). SAP97 is thought to be particularly relevant for
processing AMPA receptor subunits and NR2A subunits of NMDA receptors (Mauceri et
al., 2004), whereas SAP102 is crucial for driving NR2B complexes to spines (Sans et al.,
2003). PSD-95 preferentially binds NR2A in vivo, while SAP102 is mainly associated
with NR2B. In mature synapses, the NR2B-SAP102 complex is replaced by the NR2A-
PSD-95/PSD-93 complex. Also, overexpression of PSD-95 promotes synaptic insertion
of NR2A and not NR2B, thus modifying the functional properties of synaptic NMDARs.

20
On the whole, PSD-95 and PSD-93 are thought to be specifically associated with synaptic
functions, whereas SAP97 and SAP102 may be more important in trafficking. (Kim &
Sheng, 2004)
Figure 3 A schematic diagram of the organization of PDZ proteins at a mammalian excitatory synapse. AKAP79, A-kinase anchor protein 79; AMPAR, AMPA (α-amino-3-hydroxy-5- methyl-4-isoxazole propionic acid) receptor; βPIX, PAAK-interactive exchange factor; CaMKIIα, α-subunit of Ca2+/calmodulin-dependent protein kinase II; GK, guanylate kinase-like domain; EphR, ephrin receptor; ErbB2, EGF-related peptide receptor; GKAP, guanylate kinase-associated protein; GRIP, glutamate-receptor-interacting protein; IP3R, IP3 receptor; IRSp53, insulin-receptor substrate p53; K ch, potassium channel; LIN7, lin7 homologue; LIN10, lin10 homologue; mGluR, metabotropic glutamate receptor; NMDAR, NMDA (N-methyl-D-aspartate) receptor; nNOS, neuronal nitric oxide synthase; PICK1, protein interacting with C kinase 1; PSD-95, postsynaptic density protein 95; SER, smooth endoplasmic reticulum; SH3, Src homology 3 domain; Shank, SH3 and ankyrin repeat-containing potein; SPAR, spine-associated RapGAP; SynGAP, synaptic Ras GTPase-activating protein. (Figure from Kim & Sheng, 2004)
It is widely believed that Ca2+-dependent neuronal death is most efficiently
mediated through NMDAR activation (Tymianski et al., 1993). NR2A and NR2B

21
subunits bind to first and second PDZ domains of PSD-95, indicating that the receptor’s
interaction with PSD-95 plays an important role in synaptic NMDAR clustering. Still,
others have shown that PSD-95 knockout or suppressing PSD-95 expression has no effect
on normal NMDAR localisation and functioning (Migaud et al., 1998). Knockout mice
also show a significant increase in long term potentiation (LTP), suggesting that
interactions between NR2 subunits and PSD-95 play a key role in NMDAR signal
transduction. It is hypothesised that PSD-95 forms a connection between the calcium ions
entering the neuron and intracellular signal molecules (eg. nNOS – neuronal nitric oxide
synthase) (Brenman et al., 1996). If the expression of PSD-95 is suppressed NMDAR
excitotoxicity is selectively attenuated without affecting other GluR signalling and Ca2+
entry (Sattler et al., 2000). Selective suppression of PSD-95 also reduces Ca2+-effected
nitric oxide (NO) accumulation, but not nNOS expression. Recently it was shown that
PSD-95 and nNOS above other PDZ proteins are keys in modulating NMDAR-dependent
neurotoxicity (Cui et al., 2007). These data indicate that PSD-95 is necessary for
coupling of NMDAR activation to NO signalling and excitotoxicity.
1.4.3 Uncoupling PSD-95 protein interactions as a therapeutic strategy
The aim of numerous previously published studies has been to save the ischemic
penumbra and thus minimize total tissue damage (Mehta et al., 2007;Lo, 2008;Ginsberg,
2008). Excitotoxicity via glutamate receptor activation plays a key role in the necrotic
and apoptotic death of neurons in the ischemic penumbra (Choi & Rothman, 1990). In
light of this, many glutamate receptor blockers have been tested for stroke treatment. Of
these, the most extensively studied was the non-competitive NMDA-type glutamate

22
antagonist, MK-801 (Ginsberg, 2008). To date none of the glutamate receptor antagonists
have proven clinically useful for stroke due to poor pharmacology, poor neuroprotection
in long-term recovery and severe side-effects of blocking excitatory communication
including hallucination, catatonia and hypertension (Olney, 1994;Albers et al., 1995).
Subsequently, it was discovered that a more sophisticated approach to preventing
glutamate-mediated cell death would be to uncouple the NMDA receptors from their
intracellular signal transduction cascades (Aarts et al., 2002;Sattler et al., 1999). To this
end, Aarts and colleagues discovered that selective uncoupling of the scaffold protein
PSD-95 from the NMDA receptor can prevent excitotoxic neuronal death without
blocking normal NMDAR function. They accomplished this using a cell-permeable
peptide that incorporates the last nine amino acids of the NMDA receptor 2B subunit and
a membrane transduction domain from HIV-1 TAT protein (Tat-NR2B9c) (Fig. 4). The
transport of proteins across the blood-brain barrier and consequent entry to neurons is
limited. However, the HIV-1 TAT protein is able to enter the brain and cross cell
membranes even when coupled with large peptide sequences TAT has been successfully
used for therapeutic purposes following systemic application (Kilic et al., 2006). In short-
term survival (24h) experiments Tat-NR2B9c significantly reduced focal ischemic brain
damage in rats. It also improved neurological function when administered either one hour
before or up to three hours after stroke onset (Aarts et al., 2002). In long-term survival
(60 days) studies Tat-NR2B9c preserved motor, learning and behavioural abilities in
ischemic rats with little or no brain lesion evident upon histological assessment. These
results were significantly different from controls and the inactive Tat-NR2B-AA control
peptide (Sun et al., 2008). Also, it has recently been shown that by uncoupling PSD-95

23
from NR2B subunit Tat-NR2B9c acts in vivo by impairing pro-death p38 MAP kinase
signalling (Soriano et al., 2008).
Figure 4 Illustration of Tat-NR2B9c selectively uncoupling the scaffolding protein PSD-95 from NMDAR (right). Glutamatergic excitotoxicity is inhibited without blocking normal NMDAR function. (Figure from Aarts et al., 2003)
1.4.4 Rat models of stroke
There are many models of focal ischemic stroke in the rat cortex, but currently
the most common techniques are modifications of the original middle cerebral artery
occlusion (MCAo) model. Because it produces a survivable focal lesion, the MCAo is
the most investigated ischemia model in animals and closely resembles focal strokes
occurring in the human population. MCAo is a perfusion model that involves passing a
removable suture through the internal carotid artery to lodge in the junction of the
anterior and middle cerebral arteries (Koizumi et al., 1986). Even though it is classified
as a focal stroke, MCAo often results in extensive damage to the hemicortex, thalamus,
24
cervicomedullary junction, substantia nigra and hypothalamus (Kanemitsu et al.,
2002;Garcia et al., 1995). As a result, additional models were introduced to create
smaller infarcts. The so-called “Tamura MCAo” uses electrocoagulation to occlude the
main trunk of the MCA at the lateral part of the cerebral hemisphere (Tamura et al.,
1981a). An infracted core is produced in the frontal and parietal cortices, while
reperfusion via local collaterals from the anterior cerebral artery provides reflow (Lin et
al., 2002;Guegan & Sola, 2000). The 3-vessel occlusion model (3VO) involves transient
or permanent obstruction of the bilateral common carotid arteries and the MCA on the
surface of the brain (Chen et al., 1986). Similar cortical infarcts as seen in the “Tamura
MCAo” are induced; however prolonged common carotid occlusion often leads to
striatal and pallidal damage (Carmichael, 2005). Both models create smaller infarcts,
however extensive cortical and subcortical damage is still produced (Longa et al., 1989).
In order to carefully study reparative processes in the post-ischemic cortex, Wei et al.
selectively ligated small surface arterioles of the MCA with fine sutures (Wei et al.,
1995). The outcome is a small cortical stroke in a functionally defined area of the rat
barrel field. Whereas this method can be practical for chronic studies of ischemia, the
necessary microsurgery cannot be performed while acutely recording with
microelectrodes. Because of this, the Wei et al. ministroke was modified by
electrocoagulating the same surface arteries. Forder et al. previously used this technique
and showed a clearly reproducible infarct area in the rat whisker barrel cortex using
triphenyltetrazolium chloride (TTC) staining of coronal brain sections (Forder et al.,
2005). A similar microvessel coagulation technique has also been extensively studied in
squirrel monkeys to evaluate reorganization of the motor cortex when it was necessary to

25
make lesions localized to the forelimb area without damaging subcortical structures
(Nudo & Milliken, 1996).

26
2 OBJECTIVE AND HYPOTHESIS
2.1 Objective
Currently, there is a lack of viable therapeutics to protect neurons from ischemia
and excitotoxicity and poor bench to bedside translation of stroke therapies. One of the
reasons there is poor translation is because we don’t have a clear understanding of how
neurons function following ischemic injury and whether anti-excitotoxic drugs actually
preserve neuronal function. So, there is a need for an in vivo neurophysiologic model of
ischemia that will allow us to accurately document what happens to neurons in stroke
(not just changes in general tissue histology) and could be eventually used as a preclinical
model to validate the effectiveness of neuroprotective compounds.
2.2 Hypotheses
1. Focal cortical ischemia in our 8-channel rostrocaudal rat model results in a loss of
evoked and spontaneous potentials.
2. Systemic administration of Tat-NR2B9c leads to reduced ischemic damage as
measured by both evoked and spontaneous potentials.

27
3 METHODS
3.1 Animals
Experiments were conducted using adult male Sprague Dawley rats (350-600 g)
in compliance with the ethics protocol of the University Health Network Toronto
Hospital Animal Care Committee. Rats were housed in the animal care facility at the
Toronto Western Hospital with food and water ad libitum. Experiments were performed
in the light phase of a 12-12hr light-dark cycle.
Pre-surgery, animals were exposed to 3 mL isoflurane (Pharmaceutical Partners
of Canada, Richmond Hill, ON, Canada) in a bell jar until loss of righting reflex and
blink reflex was observed. The animals were then removed and anesthetised by an intra-
peritoneal (IP) injection of a urethane solution 0.2g/mL (Sigma Chemical Co., St. Louis,
MO, USA) in saline; diluted and injected at a concentration of 1.2 g/kg. During surgery
and the subsequent electrophysiology experiments anaesthesia was maintained by an
additional dose (20% of the initial dose) of urethane IP in four rats. Spontaneous
potentials measured in rats anaesthetised with urethane have similar characteristics to
those generated in the conscious animal (Ebenezer, 1986).
Adequate levels of anaesthesia were confirmed every fifteen minutes during
surgery and the experiment, by observation of a weak or absent withdrawal response to
pinching the rat’s hind paws with blunt forceps. A Homeothermic Blanket Control Unit
(Harvard Apparatus Ltd., Edenbridge, UK) was used to maintain the rat’s temperature at
36-37oC throughout the experiment via feedback of a rectal thermometer.

28
3.2 Pre-Experiment Surgery
After induction of anaesthesia, the hair on the dorsal surface of the head was
shaved, to facilitate incision making. The rat’s head was then mounted in a stereotaxic
frame (Stoelting Co., Wood Dale, IL, USA), with non-sharp earbars and a mouthpiece
with an incisor bar. Upon fixing the rat’s head in position, local anaesthetic, 2%
lidocaine (0.1-0.2ml) (Astra Pharma Inc., Mississauga, ON, Canada), was injected
intradermally and after 5 minutes an incision was made along the anterior-posterior axis
on the dorsal surface of the cranium. The skin was then retracted and clamped, exposing
bregma and lambda. The anterior-posterior (AP) and medial-lateral (ML) coordinates for
the area of stimulation and recording were located on the dorsal surface of the exposed
skull. The Paxinos and Watson stereotactic atlas was used to target the ventral posterior
lateral nucleus of thalamus (VPL) (coordinates AP -2.3, ML +1.8, DV 6.3mm). For
experiments with the anteroposterior 8-channel array and the 3-channel probe, a right
rostrocaudal cranial window (AP -5.0 to +4.0, ML midline to ridge) with the dura left
intact was made for access to the somatosensory cortex using a high-speed drill (Dremel
10.8V Lithium-ion Cordless rotary tool, Dremel, Racine, USA). In two experiments with
the mediolateral 6-channel array, another window was made on the left hemisphere (AP
0 to +4.0, ML midline to ridge), with the midline intact to prevent bleeding. In order to
access the middle cerebral artery (MCA) for ischemia induction, a lateral extension of
the craniotomy, approximately 5 mm in diameter, was made underneath the cranial ridge
on the right hemisphere. Lastly, an incision was made in the dorsal neck of the animal
for a common ground. The grounding consisted of a saline-soaked metal cup connected
by a silver thread to a ground pin in the electrode array.
29
3.3 Microelectrodes
Microelectrodes were assembled from parlyene-C-insulated tungsten wires
(Micro Probe, Inc., Potomac, MD, USA), with a 20 µm tip length. To decrease the
impedance for recording and/or stimulation, the electrode tips (Fig. 5c,d) (tip size ~1 μm)
were electroplated in 24 karat yellow gold electroplating solution (Krohn Technical
Products, Carlstadt, NJ) and then platinizing solution (VWR Scientific Products, West
Chester, USA) using a Stimulus Isolator (A360 World Precision Instruments, New
Haven, CT, USA) and 1 μA of cathodal direct current applied to the electrode for
approximately 10 s, giving final impedances of 200-400 kΩ. Finally, the microelectrodes
were insulated by a sleeve of polyimide Kapton (Micro ML Tubing Sales Inc., College
Point, NY, USA).
3.3.1 Triple recording electrode
Five experiments were performed using three microelectrodes glued together to
form a triple electrode probe with tips equidistant from each other (~1 mm). The probe
was inserted into the sensorimotor cortex (AP +2.0, ML +3.0, DV 2.1 mm). These
coordinates have previously been used by Eckert and Racine to test long term
potentiation in the cortex via thalamically evoked potentials (Eckert & Racine, 2006).
We used these electrodes in preliminary experiments to verify current sources and sinks
in the cortex by creating a depth profile of evoked field potentials. The electrodes were
advanced from the cortical surface for 3000 μm in 200 μm increments using a hydraulic
micropositioner (Scherr-Tumico Inc., St. James, MN, USA).

30
3.3.2 Anteroposterior 8-channel array
A total of 20 experiments were performed using an 8-channel microelectrode
array, with 1 mm tip separation (Fig 5a). Electrodes were inserted into a 10-channel
Omnetics connector (Omnetics Connector Corp, Minneapolis MN, USA) (Fig. 5 c,d).
Upon insertion into the connector, the ends of each microelectrode were coated with a
solvent based conductive compound (Permatex Inc., Hartford, CT, USA). Finally, the
electrodes were secured with hot glue and the impedance was tested through the
connector (200-400 kΩ) using NeuroAmp-1A (Axon Instruments, Union City, CA,
USA). The array was arranged rostrocaudally across the fronto-parietal hemicortex with
respect to Bregma (ML +3.0 to 3.5, DV 2.0 mm). Electrode 1 was the most anterior and
electrode 8 the most posterior electrode, with inner electrodes 4 and 5 centred on bregma.
3.3.3 Mediolateral 6-channel array
Additionally, to examine the neurophysiological effects of ischemia on the
contralateral cortex, we performed two experiments using a 6-channel microelectrode
array arranged mediolaterally, spanning both hemispheres and recording from 2 mm
below cortical surface (Fig. 5b). The array was a modification of the 8-channel electrode
(described in section 3.3.2) whereby electrodes 4 and 5 were removed in order to traverse
the intact midline bone. Stimulation was given to the thalamic VPL nuclei ipsilateral to
the ischemic cortex (see coordinates in section 3.2).

31
Figure 5 Illustration of electrode array and placement with respect to the rat cortex. Top two photographs are modified from Coyle et al (1982). Cerebral arteries have been injected with Vultex, a white latex based compound. Small circles indicate dorsal interarterial anastomoses. Numbers indicate electrodes or channels. MCA – middle cerebral artery, ACA – anterior cerebral artery, PCA – posterior cerebral artery. Blue X’s indicate points of occlusion corresponding to 3 branches of the MCA and one frontal branch of the ACA. A) Position of 8-channel frontoparietal electrode array in the rat cortex. Electrode spacing is 1 mm. B) Placement of the 6-channel mediolateral array. Ischemia is induced in only the left hemicortex. C) Photograph of the 8-channel array. The two middle electrodes are taken out in the 6-channel mediolateral array in order to avoid the cranial midline. D) Same array under a microscope.

32
3.4 Electrophysiological Recordings
Electrophysiological recordings of neuronal activity were made via a linear 8-
channel microelectrode array oriented in the parasagittal plane 2 mm from the midline. In
some cases a 6-microelectrode array was used, oriented in the coronal plane at the level
of Bregma. Biphasic cathodal or anodal electrical stimulation in the thalamus using the
A310 Accupulser and stimulus isolator (World Precision Instruments, New Haven, CT,
USA) evoked field-potentials in the cortex. The signals detected by the triple electrode
probe were amplified using the NeuroAmp-1A (Axon Instruments) (Gain 10,000, High
Pass filter 3 Hz, Low Pass filter 5 kHz). Signals detected by the two microelectrode
arrays were amplified using the Plexon Recorder/16 neural data acquisition systems
(Plexon Inc., Dallas, TX, USA) (filter settings 3 Hz – 5 kHz, Gain 5000). Each output
was digitized at a sampling rate of 12 kHz, displayed, and recorded using a MICRO 1401
mkII computer interface device, and Spike2 6.04 neurological capture software
(Cambridge Electronic Design Ltd., Cambridge, England) for offline analysis. Three
electrodes with the largest evoked potentials and most consistent components were
selected for online display to be monitored throughout the experiment. .
3.4.1 Input-Output Curve
Input-output curves were taken at the beginning of every experiment in order to
determine the optimal stimulation intensity. Biphasic current pulses (200 µS per phase)
of increasing intensity (20, 40, 60, 80, 100, 120 and 140 µA) were delivered at a rate of
0.1Hz. At each intensity level, the amplitude of the first positive peak evoked at 10 ms

33
was averaged (n = 10-20). The stimulation which yielded half of the maximal amplitude
response was chosen for subsequent baselines and post ischemic tests pulses.
3.4.2 Stimulation parameters and ischemia induction
At the beginning of every experiment, a stable baseline of 5 - 10 min of both
spontaneous and evoked potentials (EPs) was obtained. The EPs were grouped in clusters
of 20 test pulses (0.1 Hz). The right middle cerebral artery (MCA) was localised under a
high-power microscope (Carl Zeiss AG, Oberkochen, Germany). Ischemia was induced
the stroke-only and Tat-NR2B9c + stroke groups at T = 0 by coagulating the visible
arteriolar branches of the MCA using a microcautery pen (Fig. 6). This is a The control
animals received no microcoagulation. This procedure is a modification of a similar focal
coagulation from Forder et al. (2005).

34
Figure 6 Illustration of the surface vessel area pattern (modified from Forder et al. 2005). Distal arteries branching from the MCA are stained with Evans Blue dye in the picture (dark). Focal ischemia is induced by cauterising these critical branches with a microcautery pen as indicated by X.
After induction of stroke, stimulation pulses were administered every minute for
15 min, (n = 20 per cluster). Subsequently, the interval between clusters was increased to
5 minutes for the duration of 45 min (up to 1 h post stroke). From 1 h to 3 h after
occlusion, each cluster was administered every 15 min (Fig. 7).
XX

35
Figure 7 Schematic diagram of the thalamic stimulation parameters before, during and after induction of ischemia. Each horizontal line corresponds to a cluster of 20 test pulses (0.1Hz). Upon induction of ischemia (T = 0), a stimulation cluster was administered every minute for 15 min. Subsequently, the interval between clusters was increased to 5 minutes for the duration of 45 min (up to 1 h post stroke). From 1 h to 3 h post stroke, each cluster was administered every 15 min.
3.4.3 Tat-NR2B9c peptide synthesis and administration
Tat-NR2B9c was custom synthesized at the Advanced Protein Technology Centre
at The Hospital for Sick Children in Toronto. It was generated by solid phase peptide
synthesis and cleaved from the solid substrate using TFA (trifluoroacetate) then
lyophilised. Tat-NR2B9c was reconstituted in Dr. Michelle Aarts’ lab at a concentration
of 1M in water and dialysed overnight at 4˚C against 10mM ammonium bicarbonate
buffer pH 7.0 to remove TFA. The dialysed peptide was aliquoted and stored at -80˚C.
Tat-NR2B9c concentration was determined by the O.D. at 280nm, which is feasible for
small peptides because it contains a tyrosine residue. In the present study, Tat-NR2B9c
peptide (3 nmol/g of body weight) was hand injected via tail vein in 5 animals 5 minutes
before ischemia induction.

36
3.4.4 Regional cerebral blood flow (rCBF)
Cerebral blood flow was measured in one stroke rat and three control animals for
the duration of the experiment (3 h) with a Moore Instruments Doppler Flowmeter
(Devon, UK). The laser probe was placed 2 – 3 mm above the surface of the cortex near
in the vicinity of the 3rd and 4th electrode. Large veins and arteries were avoided in order
to obtain regional blood flow of multiple vessels.
3.5 Data Analysis
Following experiments, extracellular evoked potentials were smoothed, averaged
(Spike2, CED, Cambridge, UK) and plotted (Sigma Plot, SPSS, Chicago, USA). Fast
Fourier transforms (FFT) were used to analyze acute loss of power spectra following
stroke. Spontaneous EEG power was obtained from 1 min time windows before and after
ischemia without any overlap. The frequency spectrum was largely restricted to the 2-8
Hz range across all electrodes and animals. The delta slow wave activity (2-4 Hz) was the
most prevalent frequency band and was readily observed in ischemic and sham rats. In
order to characterize loss of FFT power across animals we calculated the area under
curve (AUC) by taking 0-20 Hz range on the x-axis (Fig. 8).

37
Figure 8 Power histograms of spontaneous cortical potentials taken over periods of 1 min before and after stroke. Delta waves 2-4 Hz are the most prevalent oscillatory frequencies. The gray shading indicates the area under curve (AUC) which was subsequently averaged across channels and animals in order to calculate loss of EEG power as a result of stroke.
Two-way ANOVAs were used to test main effects and a p value of 0.05 was
taken as significant (Sigma Stat, Systat Software, Inc., San Jose, USA). Suppression of
evoked potentials was evaluated using the biphasic W_FP script in Spike2. Amplitudes of
the first positive (P1) and first negative (N1) components were calculated and summated
to obtain a peak-to-trough (P1+N1) measurement. These measurements were then
normalised to baseline for channel 3 in each animal and baselines averaged across
experiments.
Filtering for different frequency bands was done by processing the raw waveform
data through a fourth order bandpass filter. A type of rectification function called root
mean squared (RMS) was then applied to the filtered data to render a rectified waveform
(positive only) of the specific oscillation.

38
),(),(
),(
2)()(
0
20
2
2
txxVVtxxVV
txVVX
VVVX
tVti
a
a
abm
Δ+=Δ−=
=Δ
−+=
∂∂
=
CSD analysis was used to determine the net extracellular current flow into and out
of the active neuronal tissue as a function of distance (Fig. 9). The current flow along an
axon is known to be equal to the second spatial derivative of the membrane potential.
constantality proportion K
densitycurrent or eacurrent/ar of units i m2
2
=
=∂∂
=XVi m
m
The current source density function was obtained by calculating the second
derivative of the voltages from the depth profile:
Figure 9 Diagram for current source-density analysis. Representations of two neurons is shown on the left. The dots represent point for measuring extracellular fields and Δx represents the distance between them (Johnston & Wu, 1995).

39
4 RESULTS
4.1 Early and late components
Evoked potentials in a rostrocaudal axis of the somatosensory cortex were
mapped out across time. Baseline potentials at a 2 mm depth had comparable
components across rats. The evoked potential had 4 discernable synaptic components
and one early presynaptic fibre volley across animals (Fig. 10). The fibre volley (FV)
was the most consistent component in all animals. It always had a negative deflection
and a poststimulus peak latency of 3.1±0.2ms (mean±S.E., n = 21) at this depth. The
subsequent components were named according to their orientation and assigned a
number based on order of latency. The first synaptic component (P1) had a positive peak
at 12.9±1.7ms (mean±S.E., n = 20). The second component (N1) was negative and had a
maximum deflection at 34.2±2.2ms (mean±S.E., n = 19). Both P1 and N1 were readily
noticeable and consistent across rats and have both been previously documented (Eckert
& Racine, 2006;Di & Barth, 1991). The third component (P2) was positive and displayed
a late peak at 103.0±8.8ms (mean±S.E., n = 19). The fourth and final component (N2)
had a very late negative deflection at 208.5±9.8ms (mean±S.E., n = 19). P2 and N2 were
not as consistent in amplitude and latency as the earlier P1 and N1, which has been
shown before (Di & Barth, 1991). Lastly, a few very late components that had an onset at
300ms were found to be particularly susceptible to change and have been previously
recorded in SEP studies (Henninger et al., 2007).

40
Figure 10 Illustration of a cortical potential evoked via ventrolateral thalamic stimulation. Typically, four distinct (P – positive, N – negative) components and a fibre volley (FV in inset) were present. The early P1/N1 biphasic component was followed by positive (P2) and negative (N2) slow waves.
4.2 Depth Profile
Figure 11 shows the primary responses to stimulation of the sensorimotor cortex
to VPL stimulation. In order to determine the evoked responses of neurons in the
sensorimotor cortex, potentials were evoked in increments of 200 um from the cortical
surface until the triple recording electrodes reached a depth of 3 mm which corresponds
to the deeper layer of the cortex (Paxinos & Watson, 1986). This yielded a depth profile
of individual components – the fibre volley (FV), the first positive component (P1) and

41
the first negative component (N1). The peak latency of all three components was shorter
in the deeper layers of the cortex.
Classic experiments have shown that small components with early post stimulus
latencies (<5ms) tend to represent afferent fibre volleys, while later larger components
represent synaptic activity in the neuron (Malis & Kruger, 1956;Shaw & Teyler,
1982;Mitzdorf & Singer, 1978). In the present study, FV had a negative deflection and
was present most clearly at 1.6 – 2.0 mm below the cortical surface (see also Fig. 10).
The amplitude of the volley reached approximately 100 uV at a depth of 1.8 mm after
which it decreased until 2.4 mm below surface, where it reached a stable inflection point.
The first positive component (P1) was found to be present throughout the cortex.
Like the FV, P1 also increased in amplitude until it reached a maximum of 140 uV at 1.8
mm below surface. It did not, however, decrease in amplitude at greater depth. The
latency of P1 also became shorter as the recording depth increased from cortical surface.
At 0 mm the component peaked at 10 ms, while at its 1.8 mm maximum it had a shorter
latency of 6.8 ms. P1 retained this latency until 3.0 mm.
The first negative component (N1) increased in amplitude with depth being
smallest at the surface and largest in the deep layers. N1 reached a maximal magnitude of
100uV at 2.0 mm, which was observed in all deeper recordings. The peak latency of this
component also changed with depth. At 0.4 mm N1 peaked at 30 ms, while at its
maximal amplitude the component had a latency of 19 ms. N1 did not further change its
latency with depth.
Figure 12 shows one example of activity of spikes to single pulse stimulation in
the thalamus. In this example, the post-stimulus time histogram (PSTH, bottom trace)

42
shows greatest spiking during the negative part of the EP (at 10-15 ms), and less average
spiking during the earlier (P1) and later (P2) components of the EP. Spontaneous spiking
neurons and spikes driven by thalamic stimulation most often occurred at depths of 2
mm.

43
Figure 11 Illustration of the depth profile of the thalamically evoked field potential in the rat sensorimotor cortex. The negative fibre volley (FV) is best seen at 1.6-1.8 mm (see arrows). P1 increased in amplitude with depth but did not attenuate. N1 was not present at the surface but was evoked at 0.4 mm and subsequently increased with depth until reaching a maximum at 2.0 mm. All three components had earlier latencies in the deeper layers of the cortex.

44
Figure 12 The top illustration is a raw trace of one evoked potential showing neuronal activity superimposed on N1. Recording was taken at depth of 2 mm below cortical surface. Middle trace is an averaged EP. Bottom trace is a post-stimulus time histogram (PSTH) corresponding to the average neuronal activity during the field evoked potential.
4.3 Current-source Density (CSD) Analysis
Figure 13 shows an example of a colour contour plot of the CSD associated with
the evoked potentials shown in figure 11. There are two apparent current sinks (blue) and
two current sources (red). The first sink appeared at a depth of 0.7 mm and was
attenuated at 1.2 mm. It peaked at a depth of 1 mm, which corresponds to the largest
amplitude of the fibre volley. The sink became active at a post-stimulus latency of 2 ms
and terminated at 7 ms. The first current source had a small area of activation from 1.2

45
mm to 1.5 mm below cortical surface while the highest power was at 1.4 mm. The source
started at 2 ms and terminated at 8 ms post stimulus. The second current sink covered a
large area from 1.5 mm to 2.0 mm below surface, with a power maximum at 1.8 mm.
This power maximum coincided with the maximum of P1. The current sink was observed
starting just before 2 ms and had two points of termination. At 1.6 mm it terminated at 9
ms, but at deeper levels (1.7-2.0 mm) the same sink terminated early at 4 ms. The second
current source was spatially localised at 2.2 mm below the surface of cortex, initiating at
2 ms and terminating at 4 ms.
Figure 13 Spectral contour diagram of the current source density calculations from one depth profile of the sensorimotor cortex in the anaesthetised rat. The large dark blue areas at depths of 1.0 mm and 1.8 mm below the cortical surface correspond to localised current sinks. The smaller bright red areas at subcortical depths of 1.4 and 2.2 mm are current sources.

46
4.4 Regional Cerebral Blood Flow
Regional cerebral blood flow (rCBF) as measured by a Doppler blood flux meter
in one rat dropped in a gradual manner over a period of 3 h to 27% of baseline following
induction of ischemia (Fig. 14). Three control experiments showed that rCBF steadily
increased over the duration of the experiment to 140% of baseline.
Figure 14 Cerebral blood flow versus time following a stroke (n = 1) and in control rat (n = 3) as measured with a Doppler laser probe placed in the middle of the array just above the cortical surface. The stroke rat experienced a slow drop in blood flow reaching 27% of pre-ischemic levels. The control group displayed a gradual increase in flow reaching 140% of baseline at 3 h.

47
4.5 Spontaneous Potentials
4.5.1 Total loss of EEG power across channels after stroke
Figure 15 illustrates the loss of spontaneous potentials across all 8 electrodes in
one animal after induction of ischemia. The stroke-only group displayed significantly less
power of spontaneous potentials when compared to control at both 20 min (two way
ANOVA F = 16.286, d.f. = 23 p<0.001) and 1 h after ischemia (p<0.001) (Fig. 16).
Twenty minutes after occlusion, the average area under the curve (AUC) of the power
histogram on all channels in the stroke group (n = 8) was 35.2±4.3% of baseline (Fig.
16). At the same time point the control animals (n = 5) displayed an AUC average of
103.5±4.8% of baseline. One hour after infarct, there was a partial recovery of power in
the stroke animals - average stroke AUC was 50.4±6.4% of pre ischemic levels. The
control group displayed an average of 100.9±6.6% of baseline.
4.5.2 Greater recovery of EEG power in Tat-NR2B9c + stroke group
Ischemic animals treated with Tat-NR2B9c also showed a drop in EEG power
after 20 min to an average across channels of 51.5±4.8% baseline (Fig. 16). Partial
recovery was observed at 1 h with an average of 69.4±5.7% of pre-stroke levels.
However, the spontaneous potentials in the Tat-NR2B9c + stroke treatment displayed
significantly more power than the stroke-only group at both 20 min (p<0.05) and 1 h
(p<0.05) after infarct.

48
Figure 15 FFT waterfall illustration of EEG power loss after stroke (T = 0 min). Each trace is a power histogram of a 1 min section of spontaneous cortical rhythms. Suppression of spontaneous potentials directly follows stroke on every channel. Epileptiform discharges were present in this particular experiment at 10 min and 30 min after stroke. Frequency scale on x-axis is from 1 – 25 Hz.

49
Figure 16 Total EEG power in control (n = 6), stroke (n = 8) and TAT-NR2B9c + stroke (n = 5) animals. Areas under curve (AUC, 0-20Hz, predominantly 3 – 4 Hz delta oscillations) were averaged across experiments and channels and normalized to % of baseline. Loss of power was not seen in control animals at either 20 min (104% baseline) or 1 h (101% baseline) post baseline. The stroke only group displayed a significant loss of power across channels compared to controls at 20 min (35% baseline) and 1 h (52.4% baseline) post stroke (p<0.001). The Tat-NR2B9c+stroke group lost significantly less power at both 20 min (51.5% baseline) and 1 h (69.4% baseline) when compared to stroke-only rats (p<0.05, *). Rats in the untreated stroke group exhibited stronger reduction of EEG power in
the anterior channels (Ch1-4) when compared to the posterior ones (Ch5-8). Anterior
channels recorded an average reduction in EEG power to 24.2±2.7% baseline 20 min
after stroke (Fig. 17c). The posterior channels showed significantly less reduction in EEG

50
power to 35.5±4.2% of baseline compared to anterior channels (one way ANOVA F =
15.885, d.f. = 7, p<0.05, n = 8). At 1 hour after ischemia, anterior electrodes displayed
significantly less recovery of spontaneous potentials when compared to posterior
channels (p<0.01) (Fig. 17d). Ch1-4 averaged 45.8±7.3% of baseline, whereas Ch5-8
averaged 64.9±10.9% of baseline. Differences between anterior and posterior electrodes
in both the controls and ischemic rats treated with the Tat-NR2B9c peptide were not
found to be significantly different (Fig. 17e,f).

51
Figure 17 Bar graphs illustrating change in EEG power. One bar in each graph corresponds to one channel on the electrode. Ch1 is the most anterior, Ch8 the most posterior and Bregma is located between channels 4 and 5 (refer to fig. 5a) A-B) Control animals (n = 6) did not lose power of spontaneous potentials at 20 and 1h after baseline; C) Stroke-only (n = 8) rats showed a decrease in EEG power 20 min after infarct with greater suppression in the anterior of the array (p<0.05, *); D) Partial recovery was observed in the stroke-only group at 1 h after ischemia. Anterior array still showed increased loss of EEG power (p<0.01, **); E) Ischemic rats treated with Tat-NR2B9c (n = 5) showed no difference in power loss between anterior and posterior contacts; F) At 1 h the Tat-NR2B9c recovered more than the stroke-only group.

52
4.5.3 Hemicortical localisation of post stroke EEG power loss
Experiments in two animals were performed with a mediolateral array spanning
both sides of the cerebrum, with the ischemic infarct localised to the right hemicortex.
Figure 18 illustrates the averages of the EEG power recorded by three electrodes on
either side of the brain. At 20 min post stroke, the ischemic hemicortex had a drop in
EEG power to 38.4±15.9% of baseline, while the control side averaged 79.9±16.7% of
pre-stroke levels. One hour after stroke, the ischemic hemicortex recovered only
minimally to 40.3±11.9% of baseline. At the same time the contralateral control cortex
recovered fully to 100.6±8.0% of baseline.
Figure 18 EEG power measured on both the L (stroke) and R (control) cortices. 20 min after infarct the stroke side lost more power (38.4% baseline) than control (79.9% baseline). No EEG recovery was observed on the stroke cortex (40.3% baseline), while the control half returned to pre-ischemic levels (100.7%).

53
4.6 Effects of stroke on evoked potentials
Suppression of evoked potentials (EP) after occlusion was ubiquitous across both
the stroke-only group and the ischemic rats treated with Tat-NR2B9c. This initial
flattening always occurred within 3 min of stroke (Fig. 19).
After partial recovery, further spontaneous attenuations of EPs occurred in both
stroke-only rats and ischemic animals treated with the TAT-NR2B9c peptide. This
decrease in amplitude occurred on all channels at the same time. In the stroke-only group
EPs were spontaneously suppressed in 4 out of 5 animals, ranging from 2 – 4 times
during the 3 h experiments. Figure 19 illustrates one such example where attenuation of
EP amplitude occurred at 5, 8 and 56 min after occlusion. We found a similar
phenomenon in the TAT-NR2B9c + stroke group. All 5 animals treated with the peptide
showed spontaneous EP suppression, ranging from 1 – 3 times during the experiment.
Lastly, the control animals (n = 5) showed no decrease in evoked potentials at any point.
Regional cerebral blood flow (rCBF) was measured in one rat after arteriolar occlusion.
Acute spontaneous decreases in EP amplitude coincided with short term increases in
rCBF (Fig. 20).

54
Figure 19 Illustration of the evoked potential across time in one rat. Note the complete EP suppression at 1 min post-infarct. Also, in this particular animal spontaneous attenuation is seen at 7, 20 and 50 min. The evoked components P1 and N1 are increased in amplitude between 2 - 4 min.

55
Figure 20 Illustration of the increased amplitude of the P1/N1 biphasic component correlated with an acute decrease of regional cerebral blood flow (rCBF, middle trace). The top four traces are averaged EPs at four different time points corresponding to events in the trigger channel.

56
4.6.1 Biphasic component P1/N1
The absolute value of the amplitudes of the first positive (P1) and the first
negative components (N1) were added together (P1/N1) in order to determine the total
change in evoked potential amplitude over time. In all cases following stroke (including
Tat-NR2B9c treated animals) the P1/N1 amplitude decreased to zero by 3 min. However,
in the minutes after infarct there was considerable variation in the peak-to-peak amplitude
across rats in both the stroke-only and the Tat-NR2B9c+stroke groups. In 3 out of 6
stroke-only experiments the P1/N1 amplitude recovered and exceeded baseline levels at
some point during the first 15 min after ischemia induction. An example of this is shown
in Fig. 21. The remaining 3 cases showed no post-stroke P1/N1 potentiation and either
remained partially attenuated or transiently returned to pre-ischemic levels. In the Tat-
NR2B9c treated animals 2 out of a total of 5 cases exhibited P1/N1 potentiation in the
minutes after infarct, while the remaining were suppressed below baseline, much like the
stroke cases. This early short-lasting potentiation was not observed in the controls (n =
4), where the biphasic levels remained at baseline.

57
Figure 21 Overlay of the baseline and post-stroke evoked potentials. Note the increase in the P1/N1 biphasic component after stroke.
Once the evoked potential recovered, either partially or completely, P1/N1
amplitudes in all three groups (stroke, Tat-NR2B9c+stroke and control) were stable to the
3 h end point. All treatments were averaged across time from 15 min to 3 h and
normalised to their baselines (Fig. 22). In stroke-only group (n = 4) the average P1/N1
amplitude was 61.9±4.3 % of baseline. This was significantly less than the controls (n =
4), where the P1/N1 biphasic amplitude average was 97.8±3.7% of baseline (two way
ANOVA, F = 49, d.f. = 35, p<0.001). There was only slight suppression of the evoked
potential components in the Tat-NR2B9c + stroke treatment (n = 4), P1+N1 averaging

58
91.7±5.2% of baseline. This was significantly greater than the stroke-only group
(p<0.001), but not different from the controls (p=0.642).
Figure 22 P1/N1 biphasic amplitudes averaged across all time points (15 min to 3 h) and normalised to baseline for each treatment. The evoked potential was significantly less in the stroke-only group (61.9% baseline, n = 4, p<0.001) when compared to controls (97.8% baseline, n = 4). Treatment with Tat-NR2B9c in stroke rats rescued the evoked potential (91.7%, n = 4) to the levels seen in control animals (p=0.642).
4.6.2 Bilateral suppression of the evoked potentials following stroke
The evoked response was also measured using the mediolateral array. A phase
shift was observed, whereby the primary components of the EP have changed orientation
(Fig. 23). Following ischemia on the right side of the cortex, attenuation of EP was seen

59
on both the ischemic and control hemispheres (n = 2). EP amplitudes recovered on both
sides within minutes as seen in the anteroposterior recordings.
Figure 23 Illustration of evoked potentials from both the stroke (R) and control (L) rat cortices. Loss of the evoked response is present on both sides to unilateral R side stimulation. Also, note the phase shift manifesting in inversion of the post-stimulus components of the EP.

60
4.7 Periodic Epileptiform Discharges (PEDs)
Upon induction of focal ischemia, 5Hz rhythmic, periodic epileptiform discharges
(PEDs) were observed in 8 out of 10 stroke-only rats. The duration of these events varied
widely across animals, ranging anywhere from 5 s to 5 min. In all 8 cases the discharges
began within an hour of infarct, which has been previously reported in an EEG-monitored
rat medial carotid artery occlusion (MCAo) model (Hartings et al. 2003). However, in 5
out of the 8 animals the discharges were recorded as early as 15 min after stroke. The
PEDs were localized on a single recording electrode in 5 out of 8 rats, whereas in 3
animals they propagated across contacts, often with a single point of origin. Three out of
five ischemic animals treated with Tat-NR2B9c also displayed PEDs. Discharges
presented within 1 h of ischemia in all three rats. In one instance the PEDs began 15 min
after stroke. In all Tat-NR2B9c treatments, the discharges propagated across electrodes.
High frequency oscillations (HFO) in the low and high gamma range (75 – 500
Hz) range were found to precede almost every post-ischemic epileptiform wave (Fig.
24a). HFOs started 5 – 15 s before the onset of the discharge and were terminated at the
onset. The actual PED was composed of mainly 5-6 Hz rhythmic discharges manifested
in sharp positive spikes and longer negative waves. Band pass analysis uncovered high
beta (11 – 30 Hz) activity during the negative slow waves in all cases of epileptiform
discharge (Fig. 24b).
Isolated interictal epileptiform discharges (IED) or single spike-wave discharges
were observed in four out of ten rats following ischemia (Fig. 24c). The IED consisted of
a short negative spike followed by a longer-lasting positive slow wave. Band pass
analysis uncovered low gamma oscillations superimposed on the spike and beta activity

61
was observed on the subsequent slow wave. In one experiment, a drop in blood flow was
shown to coincide with onset of IEDs (Fig. 24d).

62
Figure 24 Illustrations of epileptiform activity in the rat following cortical ischemia. Frequency analyses in A, B and C were performed using band pass filters. (hms – hour minute second from the start of the experiment); A) Illustration of intracortical EEG showing the gamma (31-175Hz) and ripple (200-500Hz) oscillations preceding the wave-like periodic epileptiform discharge (PED) (bottom trace). Beta oscillations (11-30Hz) are only present during epileptiform wave; B) Interictal beta waves were present between individual spikes of the discharge; C) Isolated interictal epileptiform discharges (IED) were also observed after ischemia (bottom). High frequency oscillations (middle) were present during the negative spike, while beta waves (top) were superimposed on the postspike slow wave; D) Regional cortical blood flow (rCBF) dropped during one instance of particularly strong IED activity.

63
5 DISCUSSION
5.1 Current-source Density Analysis and Unit Discharges
Current-source density analysis of the rat somatosensory cortex revealed a strong
current sink within the middle of the cortex, approximately corresponding to layer IV,
which contains afferent input from the thalamus. From there, the sink displayed a strong
spread to the upper cortical layers. Previous studies reported evoked responses in the rat
cortex following VPL stimulation and described a similar profile and localisation of
current sinks upon CSD analysis (Castro-Alamancos & Connors, 1996). The authors
show that relatively large negative field potentials were evoked, corresponding to a large
current sink that started at short latency (3 ms) within layer IV of the cortex. Within the
next 10 ms, this sink shifted higher into layer II-III, whereas a current source shifted in
the opposing direction.
Spike-like unit discharges were observed in the middle and latecortical layers of
the rat somatosensory cortex. Similar neuronal excitation was previously reported in
awake and ketamine anaesthetised rats (Kandel & Buzsaki, 1997) and typically indicates
a nearby excitatory field. The spiking occurred 15 ms after the stimulus and often rode
upon the first negative component (N1), which indicated post-synaptic activation (Fig.
11). As noted in the introduction, this corresponds to the region containing largest
pyramidal cell bodies (cortical layer V). Microelectrodes are more likely to record
extracellular spikes from large versus small cell bodies (so-called electrode sampling
bias).

64
5.2 Regional Cerebral Blood Flow (rCBF) Following Ischemia
The present study found a gradual drop in blood flow over a 3 h time course
following cauterisation of the distal branches of the MCA. The total occlusion of a
cerebral artery leads to initial cessation of blood flow in that vessel, so one would expect
this to be reflected in the recording as a sharp drop in the flux reading. However, the
Doppler blood flow monitor was raised 3 mm above the cortex so that it measured rCBF
over a large area, presumably deriving most of the signal from brain tissue with multiple
anastomoses and not the flow through a single blood vessel. Taking this into
consideration it is possible that when the primary arteries have been occluded, adjoining
vessels partially compensate for the lack of perfusion. Figure 20 illustrates these short-
lasting increases in blood flow, the largest deflections occurring at 45 min, 118 min and
135 min after stroke. It has been previously shown that rCBF increases after ischemia and
replenishes the affected area (Shi & Liu, 2007). Also because of artery-to-artery
anastomoses between the MCA and ACA, the affected area receives additional perfusion
even after a permanent occlusion (Coyle & Jokelainen, 1982). Depending on the type of
stroke, additional reflow may or may not be adequate for complete recovery to baseline
levels. In the present study, a decrease in rCBF to 20% of baseline occurred 3 h after
occlusion. Furthermore, it should be noted that only one stroke experiment was
performed while measuring blood flow. A larger sample size could yield different
degrees of flow changes over the course of the experiment.
Conversely, blood flow in the three control rats increased steadily over the
recording period to an average of 140% of baseline across animals. This rise may be due
to the initiation of a compensatory cardiac mechanism. Since a large part of the animal’s

65
cortex was exposed during the experiment it is possible that this brain region required an
increasing amount of blood in order to compensate for the stress. However, the observed
increase in blood flow was most likely due to brain swelling after prolonged exposure
following craniotomy.
5.3 Suppression of Spontaneous Potentials After Stroke
The EEG power of spontaneous potentials was significantly decreased at 20 min
and one hour after occlusion. While there was partial recovery at one hour, the power was
still considerably lower when compared to controls. In a seminal study, changes in
human EEG waveforms were monitored following a critical drop in blood pressure
(Trojaborg & Boysen, 1973). The authors performed a test occlusion of the internal
carotid arteries in patients undergoing reconstructive surgery to fix lesions in the ICA.
They observed a flattening of the EEG as the cerebral blood flow significantly dropped.
Subsequently, others have reported a long lasting (2 h) decrease of 60% in surface EEG
recordings following permanent rat MCAo (Hartings et al., 2003). Our study has reported
comparable power loss to 35% of baseline 20 min and 52% of baseline one hour after
stroke. These results show that loss of intracortical spontaneous oscillations occur after a
localised stroke to the distal MCA region of the anterior sensorimotor cortex in the
urethane anaesthetised rat, and underlie the EEG flattening observed in clinical studies.
The stroke-only group showed significantly more attenuation of spontaneous
potentials in the anterior cortex compared to the posterior cortex. This is a novel finding
made possible via the use of the 8-channel anteroposterior electrode array. One

66
explanation for this spatial localisation of EEG flattening can be found by looking at the
arteriolar regions of perfusion and middle-anterior cerebral artery anastomoses. Our
coagulation surgeries targeted the frontal and parietal branches of the MCA as well as the
fronto-dorsal protrusions of the ACA (Fig. 5). In this manner, the localisation of the
infarct was frontal (sensorimotor) and not parietal. Despite the fact that our model
induced a permanent occlusion of cerebral arteries, increases in rCBF are known to occur
after stroke and serve to replenish the affected area (Shi & Liu, 2007). However, only
regions where the arterial inflow is not completely compromised will get the benefit from
this reperfusion. The posterior parietal area, approximately corresponding to posterior
contacts Ch5 – Ch8, is farthest away from the stroke and additionally perfused by the
posterior cerebral artery (PCA) (Coyle & Jokelainen, 1982). The parietal region is thus
much less not affected by the stroke. Also, since the ischemia primarily affects the frontal
branches of the ACA, blood flow to the parietal cortex from the PCA is expected to
remain fairly stable.
5.4 Evoked Potentials
The present study reported an evoked response in the sensorimotor rat cortex
upon stimulation of the ventrolateral thalamus. The EP profile consisted of four post-
stimulus components – a positive-negative biphasic component (P1/N1) followed by two
late slow waves (P2 and N2).
A very similar pattern of EP components has previously been described using
somatosensory evoked potentials (SEP) recorded from the rat barrel cortex upon vibrissal

67
stimulation (Di & Barth, 1991). The authors reported four distinct response peaks - P1,
N1, P2 and N2. P1/N1 was a fast positive-negative biphasic wave sequence which was
followed by positive (P2) and negative (N2) slow waves. They also presented
topographical findings of evoked responses, which give us some idea as to the nature of
these individual components. The authors showed that while P1 is much more focal than
both N2 and P2, it is distributed over twice the epicortical area of the later N1. These
findings are in agreement with a previous study of the topography of auditory evoked
potentials (AEP) in the rat auditory cortex. The early positive P1 wave also covered
approximately twice the epicortical area of N1 (Barth & Di, 1990). The authors thus
concluded that the early positive P1 component of the EP was produced by distributed
neural processing through polysynaptic activation of pyramidal axon collaterals.
Conversely, the later negative N1 peak is thought to lead to focal monosynaptic and
disynaptic activation and is probably not exclusively the result of specific thalamocortical
afferents (Di & Barth, 1991).
In contrast to the early components of the evoked potential, the slow P2 and N2
waveforms have been shown to be widely distributed on the surface of barrel cortex (Di
& Barth, 1991). We have also observed that amplitude and latency of these peaks are
much more variable than that of the early sharp waves. Di and Barth (1991) hypothesised
that given their long latency and wide spatial distribution the later slow waves may reflect
integrative processing involving much of the cortex. They are thought to be the result of
both excitatory and inhibitory postsynaptic potentials. Studies of epicortical evoked
responses in the cat have categorised these longer latency peaks as associative responses,
produced outside of primary somatosensory cortex (Dong et al., 1982;Thomson et al.,

68
1963). However, data from Di and Barth (1991) study does not support this conclusion.
They discovered that all components of the evoked potential were approximately
localised to the primary somatosensory cortex and additional recordings posterior and
inferior to the barrel field yielded no response. Early studies of evoked potentials from
the human scalp also suggest that both late and early components of the SEP are
generated only in the primary sensory cortex (Stohr & Goldring, 1969). In the present
study the ventral posterior lateral nucleus of the thalamus in the rat sensorimotor cortex
was consistently stimulated according to previously verified coordinates (Eckert &
Racine, 2006). In agreement with Stohr and Goldring 1969, potentials evoked from the
most posterior electrodes (Ch7, 8) show weaker evoked responses when compared to the
stronger anterior potentials (Ch1, 2).
5.4.1 EP attenuation following ischemia
Results from our study show an immediate and complete attenuation of the
evoked response following ischemia. The P1/N1 biphasic component of the EP was
significantly attenuated in stroke animals when compared to controls. A similar
experiment was performed by Sakatani et al investigating SEPs at the hindlimb, forelimb
and trigeminal cortical regions after a standard MCAo in the rat (Sakatani et al., 1990).
They report a lasting suppression of the cortical potentials evoked by sciatic, median and
trigeminal nerves within 3 minutes of MCAo. The authors also show a spatial localisation
of the most profound SEP suppression to occur around the trigeminal region. They show
that once perfusion from the MCA is abolished, the trigeminal sensorimotor tissue has no
additional arteriolar inflow of blood. Poor arteriolar perfusion combined with inadequate

69
collateral circulation at the periphery of a circulatory field creates what is known as a
‘watershed effect’. The authors posit that a widespread loss of SEPs reflects a transient
ischemia in the entire MCA territory before compensating collateral blood flow takes
place. Artery-to-artery anastomoses connect the MCA to the anterior and posterior
cerebral arteries (Coyle & Jokelainen, 1982). Retrograde blood flow has been observed in
the distal ends of the ACA, but this process takes minutes to start. We have evidence of a
comparable time course of EP attenuation and partial recovery and hypothesise that a
similar loss and recovery of blood flow occurs in our model. Focal ischemia was induced
by cauterising the main distal branches of the MCA and one frontal branch of the ACA
instead of performing a more global version of the MCAo. Because of artery-to-artery
anastomoses between the MCA and ACA the affected area received additional perfusion
even after a permanent occlusion. It is possible that the acute recovery of evoked and
spontaneous potentials occurred as a result. However, the inadequate blood flow from
these anastomoses was probably the reason why full recovery of the evoked response and
EEG power was not observed 20 min and 1 h after stroke.
What’s more, we observed a short period of spontaneous suppression of evoked
potentials after the initial cautery-induced attenuation. If we assume that the loss of EP’s
is primarily due to the loss of blood perfusion to the affected area (i.e. stroke), then we
may suggest that any subsequent attenuation is also the result of additional drop in
perfusion. This was, however, not the case in the present study, since a correlation
between EP suppression and blood flow increase was found (Fig. 20). This unexpected
result may be a phenomenon called post-ischemic reperfusion injury. Histological
evidence has shown that excessive acute reperfusion and increased rCBF correlate with

70
more severe brain damage (Tamura et al., 1980). It is possible that the increased rCBF
associated with a decrease in absolute EP amplitude seen in the present study presents
early neurophysiological evidence of reperfusion injury.
There are however other explanations for the post-ischemic EP attenuation.
Specifically, K+ is known to be released from cells following an ischemic attack. Hence,
diffusion of K+ out of neurons may also be responsible for the widespread EP
suppression. Additionally, K+ is also thought to diffuse into white matter which underlies
the cortex and block axons from conducting the evoked potentials from the thalamus
(Sakatani et al., 1990). This idea is also supported by evidence of thalamic damage
following cortical stroke (Garcia et al., 1995;Kanemitsu et al., 2002). Sakatani and
colleagues suggest that spreading depression may be intimately linked with loss of SEP.
They hypothesised that neurons in the ischemic cortex may become excited as they
depolarise, releasing neurotransmitters into other areas of the cortex, thus transiently
inhibiting neuronal excitability.
5.4.2 Post-ischemic P1/N1 acute, transient potentiation
We have observed acute potentiation of the P1/N1 component following ischemia
in some rats from both the stroke-only rats and ischemic animals treated with Tat-
NR2B9c. Plasticity has been extensively described in stroke literature as both aberrant
and beneficial to the recovery of synaptic function (Calabresi et al., 2003). Early anoxic
plasticity has been classified as aberrant if it occurs minutes after energy or oxygen
deprivation ensues (Hammond et al., 1994). Conversely, long-term potentiation in the

71
days and weeks after stroke has been shown to lead to beneficial reorganisation of the
motor cortex in non-human primates (Nudo et al., 2001)
Specifically, the acute increase of the evoked response following ischemia
observed in the present study has been previously described with SEPs in the rat barrel
cortex (Sakatani et al., 1990). The authors hypothesised that cellular swelling may have
reduced the extracellular volume in the cortical area and increased the electrical
impedance of extracellular diffusion paths. Given that field potentials result from
extracellular currents (Johnston & Wu, 1995), an increase in tissue impedance would lead
to an increase in evoked potential amplitude (Sakatani et al., 1990). However, the
amplitude change of biphasic components P1/N1 in our study was not consistent. That is,
in some animals potentiation of either P1 or N1 was observed but in many cases there
was no change of the evoked response with respect to baseline. It is therefore possible
that variation in P1/N1 potentiation was the result of a change in extracellular currents
due to post-ischemic cell swelling. Another possibility is that the increase in components
of the EP represents synaptic alterations as a result of excess glutamate release. However,
since a consistent change was not observed in N1 or P1, the change in amplitude is most
likely not due to the release of one specific neurotransmitter. In order to confirm this,
subsequent experiments selectively targeting individual neurotransmitters would have to
be performed.

72
5.5 Transhemispheric Changes in Cortical Potentials
The mediolateral array was used to test evoked and spontaneous potentials on
both hemispheres after ischemia. Our results show that both the ischemic cortex and the
contralateral control side displayed an acute attenuation of EPs followed by a lasting
recovery. So why were both sides of the brain affected by an occlusion that was
completely localised to one half of the brain? The answer may have something to do with
the diaschisis phenomenon.
Diaschisis is defined as a series of remote changes in brain function following
stroke (Reinecke et al., 1999;von Monakow, 1969). Cerebral ischemia is known to affect
the function of widespread ipsilateral and contralateral brain regions in addition to the
area immediately affected by the reduced blood flow. The brain hemispheres are
connected through fibre tracts in the corpus callosum. Von Monakow posited in a seminal
study of diaschisis that loss of excitatory input from the injured area will render other
regions less responsive to stimuli (von Monakow, 1969). Currently there are competing
thoughts on this topic. A number of researchers found no significant change in
contralateral electrical activity following cortical stroke (Andrews, 1991). However,
others reported a contralateral decrease in EP amplitude, which is in agreement with the
results presented here and von Monakow’s original hypothesis (Molnar et al.,
1988;Kempinsky, 1958).
Upon transhemispheric investigation of spontaneous potentials, we report a
predominantly localised attenuation of EEG power loss to the ischemic cortex. However,
at 20 min after occlusion there was partial suppression of the EEG on the control
hemisphere (80% baseline). A previous study reported a comparable decrease in EEG

73
power less than an hour after infarct (79% of baseline) (Hossmann et al., 1985).
Contralateral power loss may be the result of the primary flow response following
ischemia. In order for the blood flow to be restored to the affected area rCBF is partially
decreased to the healthy brain early after infarct. This has been previously reported in the
Tamura rat model of MCA occlusion (Tamura et al., 1981b). However, diaschisis is the
more probable cause for this short-term partial suppression of EEG power as also
evidenced by the aforementioned EP attenuation. In our study, intracortical oscillatory
EEG power returned to baseline in the control hemisphere within 1 h of stroke.
Conversely, the spontaneous potentials on the control side remained suppressed.
5.6 Tat-NR2B9c Application Following Cortical Ischemia
It was recently discovered that selectively uncoupling the PSD-95 scaffolding
protein from the NR2B subunit of the NMDA receptor inhibits excitotoxic signalling via
oxidative compounds such as nNOS (Sattler et al., 1999;Sattler et al., 1999;Aarts et al.,
2002). Tat-NR2B9c is a membrane-permeable peptide that selectively uncouples the
PSD-95 protein from the NR2B subunit, without disrupting NMDA activity. It was
demonstrated with morphological analysis that Tat-NR2B9c improves stroke outcome
and limits infarct size when administered up to 3 h after stroke in vitro. Also, post-stroke
application of Tat-NR2B9c in vivo significantly improves behavioural performance
following transient MCAo. Rats displayed improved cognition and faster escape times in
the Morris water maze (Sun et al., 2008). The present study aims to show the in vivo
effect of Tat-NR2B9c on spontaneous and evoked potentials in the ischemic rat cortex.

74
In our preliminary studies we have provided new evidence of slowed stroke-
related neurophysiological dysfunction in anaesthetised rats following Tat-NR2B9c
injection in vivo. Neurophysiological parameters such as EEG suppression and EP
attenuation are known correlates of brain damage following stroke (Astrup et al.,
1977;Trojaborg & Boysen, 1973). We report less suppression of spontaneous intracortical
potentials and less attenuation of the evoked response in five ischemic rats treated with
Tat-NR2B9c when compared to stroke-only animals. However, epileptiform activity was
also observed in ischemic rats following Tat-NR2B9c administration, indicating that the
peptide did not have anti-epileptic effects. To our knowledge, these are novel findings
not previously reported in stroke literature.
Previously studied anti-stroke compounds such as MK-801 reduce glutamatergic
signalling through strong, non-competitive blockade of NMDA receptors (Ginsberg,
2008). This treatment was found to improve synaptic performance by decreasing post-
stroke-excitotoxicity but had a poor neuroprotective mechanism and led to serious side
effects upon human administration (Olney, 1994;Albers et al., 1995). In contrast we
know that Tat-NR2B9c does not alter glutamatergic calcium signalling via NMDARs
(Aarts et al., 2002). Disrupting PSD-95 with antisense oligonucleotides or PSD-95
inhibitors did not affect function or normal excitatory transmission (Sattler et al.,
1999;Aarts et al., 2002;Migaud et al., 1998). In addition, mutant mice lacking PSD-95
showed facilitation of long-term potentiation indicating that this scaffolding protein acts
as an inhibitor of LTP. At the same time, NMDAR currents, normal subunit expression
and synaptic morphology have all been unaffected by the selective uncoupling of PSD-95
from the NMDA receptor.

75
In regards to our studies, we cannot comment with certainty on the precise effect
the Tat-NR2B9c peptide that led to recovery of aforementioned neurophysiological
parameters. It is possible that the same mechanism which leads to LTP inhibition in PSD-
95 knock-outs is responsible for enhanced EP recovery post stroke. However, if this is the
case, then we would expect to see increased potentiation of the early P1/N1 wave in Tat-
NR2B9c treated animals, which was not observed in our study. It is more probable that
the uncoupling of PSD-95 from the NMDA receptor disrupts neuronal excitoxicity,
which not only has as effect on the size of ischemic infarct (Aarts et al., 2002;Sattler et
al., 1999), but also on neuronal excitability as evidenced by improved recovery of
cortical potentials in the present study.
5.7 Post-ischemic Epileptiform Discharges
We have shown evidence of periodic wave-like and isolated interictal spike-wave
discharges in ischemic rats occurring within an hour of infarct. These epileptiform
phenomena were observed on the intracortical EEG in 8 out of 10 stroke animals and 3
out of 5 stroke animals treated with Tat-NR2B9c.
Post-stroke epilepsy has been extensively documented in ischemic patients (Myint
et al., 2006;Afsar et al., 2003). The Oxford Community Stroke Project reported that
11.5% of patients with stroke were at risk of developing seizures by five years (Burn et
al., 1997). Epileptiform activity was also reported and studied in animal studies of stroke
(Hartings et al., 2003). Hartings and colleagues offer a detailed description of the
phenomena using EEG recordings in vivo following middle cerebral artery occlusion

76
(MCAo) in the rat. The authors report 80% incidence of non-convulsive seizures during
the first hour of cortical ischemia, which we have replicated in our model of focal cortical
stroke. Previous studies have shown that neuronal depolarisations in the ischemic core
are accompanied by a high rise in extracellular potassium, manifesting as waves of
spreading depression throughout the ischemic hemisphere (Nedergaard & Hansen, 1993).
It is hypothesised that these potassium-induced depolarisations are responsible for
mediating epileptiform discharges in the MCAo model (Hartings et al., 2003).
Periodic oscillating wave-like discharges seen in our animal experiments are
comparable to those reported by Hartings et al., which they classified as intermittent
rhythmic delta activity (IRDA). Like our periodic epileptiform waves, IRDA was shown
to occur against a background of flattened or desynchronised EEG activity. We report 5 –
6 Hz primary oscillations, whereas the Hartings study observed a slightly faster
oscillatory activity in the 6 – 8 Hz range. In the epileptic patient population IRDA is
primarily made up of delta (0 – 4 Hz) and lower theta bursts (4 – 6 Hz) and reported
incidences are largely confined to the frontal cortex (Neufeld et al., 1999;Fariello et al.,
1982). We have also noticed a more frontal concentration of epileptiform activity in our
model. However, it is probable that the actual physical insult to the anterior cortex as a
result of the focal cautery is responsible for this localisation.
Isolated epileptiform spike-wave discharges (IEDs) not occurring in a wave-like
or oscillatory pattern were also observed in our model. Hartings and colleagues have
reported similar seizures in their MCAo model and have termed this activity periodic
lateralised epileptiform discharges (PLEDs). PLEDs were characterised as biphasic with

77
an initial negative phase followed by a positive wave-like component, which is
comparable to IEDs seen in our rat model of focal ischemia.
5.7.1 High-frequency oscillations coinciding with post-stroke epileptiform activity
In the present study, high frequency oscillations (HFOs) in both gamma (80 – 200
Hz) and ripple (200 – 500 Hz) ranges occurred immediately before all epileptiform wave
seizures in the ischemic rat. During each seizure-like wave, oscillations predominantly in
the beta (10 – 30 Hz) but also in the gamma frequencies were observed. Lastly, we have
observed HFOs to occur during isolated interictal epileptiform discharges (IED) in
ischemic animals.
Oscillations in the 100 – 600 Hz frequency range indicate synchronisation of
neuronal ensembles (Jones et al., 2000). However, it is not known whether HFOs and
epileptic discharges are produced by the same neuronal generators. Previous studies in
humans with temporal lobe epilepsy and rodents with kainic acid (KA)-induced seizures
have reported ripples to be closely linked to zones of seizure onset (Bragin et al.,
1999;Jacobs et al., 2008). During ictal recordings, HFOs have been shown to occur
mostly in regions of primary epileptogenesis and less frequently in areas of secondary
spread. Bragin and colleagues have shown ripples to precede interictal spikes in the
entorhinal cortex of KA kindled rats (Bragin et al., 1999). HFO spiking was also reported
to occur on localised EEG contacts in human recordings immediately preceding seizures
that is comparable to our findings in the rat (Fisher et al., 1992). HFOs in the human were
largely localised to the seizure focus, which was not observed in our experiments. When
the epileptiform discharges propagated to different electrode contacts each recording also

78
displayed a local pre-epileptic gamma discharge. The authors suggest that 80Hz+ activity
at seizure onset may be due to several different mechanisms including synchronous
action potentials at seizure focus or harmonics of synaptic potentials of high frequency
transients associated with sharp EEG activity. Fast ripples (250-600 Hz) have also been
reported to occur in the hippocampus between the initial epileptic insult and the onset of
recurrent spontaneous discharges (Bragin et al., 2000). The authors hypothesise the fast
ripples reflect activity of the so-called pathologically interconnected clusters of neurons
(PIN). These clusters are proposed to play a role in initiating epilepsy by acting as a
trigger for pathologic synaptic modification in target brain areas. Subsequently, other
pathological ripple networks have been identified in epileptic mesial temporal areas of
humans (Staba et al., 2004). A higher density of local synaptic connections in the
epileptic brain has been attributed to neuronal death and subsequent synaptic
reorganisation. It has been suggested that these new regional collaterals may be a
substrate for synchronisation of activity resulting in spontaneous bursts of action
potentials or population spikes (Bragin et al., 2002). Other experts propose that fast
ripples reflect inhibitory post synaptic potentials of principal neurons as a result of
synchronised discharges of the interneuronal networks (Ylinen et al., 1995). To our
knowledge, this high frequency activity has not been previously reported in the post-
ischemic brain preceding epileptic discharges.
We have also observed individual large spike-wave discharges in the rat
sensorimotor cortex following stroke. IEDs are thought to reflect summated membrane
potentials from abnormally synchronised neurons within epileptic tissue. Population
spikes are believed to represent paroxysmal depolarisation shifts, while slow waves
79
following spikes are the result of prolonged hyperpolarisation (Matsumoto & Ajmone-
Marsan, 1964). Upon filtering for high frequency activity, we report gamma activity to
coincide with the negative spike of the IED. Beta activtity in the 10-30 Hz range was
superimposed on the longer positive wave. A recent study of patients with mesial
temporal lobe epilepsy has have also reported HFOs within the spike and a decrease in
the power of high-frequency bands and an increase in beta activity during the postspike
slow wave (Urrestarazu et al., 2006). Previous studies have shown that a decrease in
excitability following a depolarisation associated with an epileptiform EEG spike may
result from both intrinsic and synaptic currents. Seminal studies of penicillin-induced
epilepsy have demonstrated that postspike inhibition is widely spread around the epileptic
focus (Prince, 1968). This decrease in high frequency activity following the IED spike
may represent the suppression of post-synaptic potentials and neuronal firing as a result
of the widespread inhibition.

80
6 CONCLUSION
Presently, a viable treatment for brain ischemia is still being researched. Presented
here is an 8-channel model of focal cortical stroke that illustrates the spatial distribution
of EEG power loss and attenuation of evoked potentials following infarct. Cortical
ischemia results in loss of EEG power and initial suppression of evoked potentials, which
confirms the first hypothesis of this study. The Tat-NR2B9c peptide was used to validate
this model as a neurophysiological method of assessing anti-stroke therapy. Application
of Tat-NR2B9c via tail-vein injection 3 min before ischemia resulted in less EEG
flattening and partial recovery of the evoked response. Therefore, systemic application of
Tat-NR2B9c slows the progression of stroke-related neurophysiological dysfunction,
which confirms our second hypothesis.
7 FUTURE STUDIES
This study validates the focal ischemic model for investigation of novel stroke
therapies. In the future the 8-channel neurophysiological model will be used to evaluate
the control peptide (Tat-NR2B-AA), which does not uncouple the PSD-95 scaffolding
protein from the NMDA receptor. This will confirm whether the improved recovery of
EEG power and EP amplitude is mediated by anti-excitotoxic properties of NMDAR-
PSD-95 perturbation. It would also be of interest to test the effectiveness of other drugs
that haven’t been typically used to treat stroke. For instance, memantine is part of a new
class of Alzheimer’s disease medications, which targets neuronal excitotoxicity. As such,
memantine could serve as an effective treatment of excitotoxic sequelae associated with
ischemia.

81
Reference List
1. Aarts M, Liu Y, Liu L, Besshoh S, Arundine M, Gurd JW, Wang YT, Salter MW, & Tymianski M (2002). Treatment of ischemic brain damage by perturbing NMDA receptor- PSD-95 protein interactions. Science 298, 846-850.
2. Aarts MM, Arundine M, & Tymianski M (2003). Novel concepts in excitotoxic neurodegeneration after stroke. Expert Rev Mol Med 5, 1-22.
3. Afsar N, Kaya D, Aktan S, & Sykut-Bingol C (2003). Stroke and status epilepticus: stroke type, type of status epilepticus, and prognosis. Seizure 12, 23-27.
4. Albers GW, Atkinson RP, Kelley RE, & Rosenbaum DM (1995). Safety, tolerability, and pharmacokinetics of the N-methyl-D-aspartate antagonist dextrorphan in patients with acute stroke. Dextrorphan Study Group. Stroke 26, 254-258.
5. Andrews RJ (1991). Transhemispheric diaschisis. A review and comment. Stroke 22, 943-949.
6. Astrup J, Symon L, Branston NM, & Lassen NA (1977). Cortical evoked potential and extracellular K+ and H+ at critical levels of brain ischemia. Stroke 8, 51-57.
7. Back T, Kohno K, & Hossmann KA (1994). Cortical negative DC deflections following middle cerebral artery occlusion and KCl-induced spreading depression: effect on blood flow, tissue oxygenation, and electroencephalogram. J Cereb Blood Flow Metab 14, 12-19.
8. Barth DS & Di S (1990). Three-dimensional analysis of auditory-evoked potentials in rat neocortex. J Neurophysiol 64, 1527-1536.
9. Bennett MV, Pellegrini-Giampietro DE, Gorter JA, Aronica E, Connor JA, & Zukin RS (1996). The GluR2 hypothesis: Ca(++)-permeable AMPA receptors in delayed neurodegeneration. Cold Spring Harb Symp Quant Biol 61, 373-384.
10. Bragin A, Engel J, Jr., Wilson CL, Fried I, & Mathern GW (1999). Hippocampal and entorhinal cortex high-frequency oscillations (100--500 Hz) in human epileptic brain and in kainic acid--treated rats with chronic seizures. Epilepsia 40, 127-137.
11. Bragin A, Mody I, Wilson CL, & Engel J, Jr. (2002). Local generation of fast ripples in epileptic brain. J Neurosci 22, 2012-2021.

82
12. Bragin A, Wilson CL, & Engel J, Jr. (2000). Chronic epileptogenesis requires development of a network of pathologically interconnected neuron clusters: a hypothesis. Epilepsia 41 Suppl 6, S144-S152.
13. Bremer F (1958). Cerebral and cerebellar potentials. Physiol Rev 38, 357-388.
14. Brenman JE, Chao DS, Gee SH, McGee AW, Craven SE, Santillano DR, Wu Z, Huang F, Xia H, Peters MF, Froehner SC, & Bredt DS (1996). Interaction of nitric oxide synthase with the postsynaptic density protein PSD-95 and alpha1-syntrophin mediated by PDZ domains. Cell 84, 757-767.
15. Brožek G (1966). Changes in the membrane potential of cortical cells during spreading depression. Physiol Bohemoslov 15, 98-103.
16. Burn J, Dennis M, Bamford J, Sandercock P, Wade D, & Warlow C (1997). Epileptic seizures after a first stroke: the Oxfordshire Community Stroke Project. BMJ 315, 1582-1587.
17. Calabresi P, Centonze D, Pisani A, Cupini L, & Bernardi G (2003). Synaptic plasticity in the ischaemic brain. Lancet Neurol 2, 622-629.
18. Carlin RK, Grab DJ, Cohen RS, & Siekevitz P (1980). Isolation and characterization of postsynaptic densities from various brain regions: enrichment of different types of postsynaptic densities. J Cell Biol 86, 831-845.
19. Carmichael ST (2005). Rodent models of focal stroke: size, mechanism, and purpose. NeuroRx 2, 396-409.
20. Castro-Alamancos MA & Connors BW (1996). Spatiotemporal properties of short-term plasticity sensorimotor thalamocortical pathways of the rat. J Neurosci 16, 2767-2779.
21. Chen ST, Hsu CY, Hogan EL, Maricq H, & Balentine JD (1986). A model of focal ischemic stroke in the rat: reproducible extensive cortical infarction. Stroke 17, 738-743.
22. Choi DW (1988). Calcium-mediated neurotoxicity: relationship to specific channel types and role in ischemic damage. Trends Neurosci 11, 465-469.
23. Choi DW (1995). Calcium: still center-stage in hypoxic-ischemic neuronal death. Trends Neurosci 18, 58-60.
24. Choi DW & Rothman SM (1990). The role of glutamate neurotoxicity in hypoxic-ischemic neuronal death. Annu Rev Neurosci 13, 171-182.
25. Colbourne F, Sutherland GR, & Auer RN (1999). Electron microscopic evidence against apoptosis as the mechanism of neuronal death in global ischemia. J Neurosci 19, 4200-4210.
83
26. Contreras D & Steriade M (1995). Cellular basis of EEG slow rhythms: a study of dynamic corticothalamic relationships. J Neurosci 15, 604-622.
27. Coyle P & Jokelainen PT (1982). Dorsal cerebral arterial collaterals of the rat. Anat Rec 203, 397-404.
28. Cui H, Hayashi A, Sun HS, Belmares MP, Cobey C, Phan T, Schweizer J, Salter MW, Wang YT, Tasker RA, Garman D, Rabinowitz J, Lu PS, & Tymianski M (2007). PDZ protein interactions underlying NMDA receptor-mediated excitotoxicity and neuroprotection by PSD-95 inhibitors. J Neurosci 27, 9901-9915.
29. Dale N & Roberts A (1985). Dual-component amino-acid-mediated synaptic potentials: excitatory drive for swimming in Xenopus embryos. J Physiol 363, 35-59.
30. Deshpande JK, Siesjo BK, & Wieloch T (1987). Calcium accumulation and neuronal damage in the rat hippocampus following cerebral ischemia. J Cereb Blood Flow Metab 7, 89-95.
31. Di S & Barth DS (1991). Topographic analysis of field potentials in rat vibrissa/barrel cortex. Brain Res 546, 106-112.
32. Dong WK, Harkins SW, & Ashleman BT (1982). Origins of cat somatosensory far-field and early near-field evoked potentials. Electroencephalogr Clin Neurophysiol 53, 143-165.
33. Donnan GA, Fisher M, Macleod M, & Davis SM (2008). Stroke. Lancet 371, 1612-1623.
34. Du C, Hu R, Csernansky CA, Hsu CY, & Choi DW (1996). Very delayed infarction after mild focal cerebral ischemia: a role for apoptosis? J Cereb Blood Flow Metab 16, 195-201.
35. Dubinsky JM & Rothman SM (1991). Intracellular calcium concentrations during "chemical hypoxia" and excitotoxic neuronal injury. J Neurosci 11, 2545-2551.
36. Duchen MR (1992). Ca(2+)-dependent changes in the mitochondrial energetics in single dissociated mouse sensory neurons. Biochem J 283 ( Pt 1), 41-50.
37. Duverger D & MacKenzie ET (1988). The quantification of cerebral infarction following focal ischemia in the rat: influence of strain, arterial pressure, blood glucose concentration, and age. J Cereb Blood Flow Metab 8, 449-461.
38. Ebenezer IS (1986). The generation of cortical slow potentials in the rat anaesthetised with urethane and their modification by nicotine. Neuropharmacology 25, 639-643.

84
39. Eckert MJ & Racine RJ (2006). Long-term depression and associativity in rat primary motor cortex following thalamic stimulation. Eur J Neurosci 24, 3553-3560.
40. Fariello RG, Orrison W, Blanco G, & Reyes PF (1982). Neuroradiological correlates of frontally predominant intermittent rhythmic delta activity (FIRDA). Electroencephalogr Clin Neurophysiol 54, 194-202.
41. Fisher RS, Webber WR, Lesser RP, Arroyo S, & Uematsu S (1992). High-frequency EEG activity at the start of seizures. J Clin Neurophysiol 9, 441-448.
42. Fix JD (2008). Neuroanatomy, 4th ed. Lippincott Williams and Wilkins.
43. Forder JP, Munzenmaier DH, & Greene AS (2005). Angiogenic protection from focal ischemia with angiotensin II type 1 receptor blockade in the rat. Am J Physiol Heart Circ Physiol 288, H1989-H1996.
44. Frantseva M, Perez Velazquez JL, Tonkikh A, Adamchik Y, & Carlen PL (2002a). Neurotrauma/neurodegeneration and mitochondrial dysfunction. Prog Brain Res 137, 171-176.
45. Frantseva MV, Kokarovtseva L, & Perez Velazquez JL (2002b). Ischemia-induced brain damage depends on specific gap-junctional coupling. J Cereb Blood Flow Metab 22, 453-462.
46. Garcia JH, Liu KF, & Ho KL (1995). Neuronal necrosis after middle cerebral artery occlusion in Wistar rats progresses at different time intervals in the caudoputamen and the cortex. Stroke 26, 636-642.
47. Gardoni F (2008). MAGUK proteins: new targets for pharmacological intervention in the glutamatergic synapse. Eur J Pharmacol 585, 147-152.
48. Gido G, Kristian T, & Siesjo BK (1997). Extracellular potassium in a neocortical core area after transient focal ischemia. Stroke 28, 206-210.
49. Gilligan AK, Thrift AG, Sturm JW, Dewey HM, Macdonell RA, & Donnan GA (2005). Stroke units, tissue plasminogen activator, aspirin and neuroprotection: which stroke intervention could provide the greatest community benefit? Cerebrovasc Dis 20, 239-244.
50. Ginsberg MD (2008). Neuroprotection for ischemic stroke: Past, present and future. Neuropharmacology.
51. Guegan C & Sola B (2000). Early and sequential recruitment of apoptotic effectors after focal permanent ischemia in mice. Brain Res 856, 93-100.
52. Gusev E & Skvortsova VI (2003). Brain Ischemia Kluwer Academic / Plenum Publishers.

85
53. Gwag BJ, Lobner D, Koh JY, Wie MB, & Choi DW (1995). Blockade of glutamate receptors unmasks neuronal apoptosis after oxygen-glucose deprivation in vitro. Neuroscience 68, 615-619.
54. Hammond C, Crepel V, Gozlan H, & Ben Ari Y (1994). Anoxic LTP sheds light on the multiple facets of NMDA receptors. Trends Neurosci 17, 497-503.
55. Hansen AJ & Lauritzen M (1984). The role of spreading depression in acute brain disorders. An Acad Bras Cienc 56, 457-479.
56. Hansen AJ & Olsen CE (1980). Brain extracellular space during spreading depression and ischemia. Acta Physiol Scand 108, 355-365.
57. Harris RJ & Symon L (1984). Extracellular pH, potassium, and calcium activities in progressive ischaemia of rat cortex. J Cereb Blood Flow Metab 4, 178-186.
58. Hartings JA, Williams AJ, & Tortella FC (2003). Occurrence of nonconvulsive seizures, periodic epileptiform discharges, and intermittent rhythmic delta activity in rat focal ischemia. Exp Neurol 179, 139-149.
59. Henninger N, Heimann A, & Kempski O (2007). Electrophysiology and neuronal integrity following systemic arterial hypotension in a rat model of unilateral carotid artery occlusion. Brain Res 1163, 119-129.
60. Hollmann M, Maron C, & Heinemann S (1994). N-glycosylation site tagging suggests a three transmembrane domain topology for the glutamate receptor GluR1. Neuron 13, 1331-1343.
61. Hossmann KA (1994). Viability thresholds and the penumbra of focal ischemia. Ann Neurol 36, 557-565.
62. Hossmann KA, Mies G, Paschen W, Csiba L, Bodsch W, Rapin JR, Poncin-Lafitte M, & Takahashi K (1985). Multiparametric imaging of blood flow and metabolism after middle cerebral artery occlusion in cats. J Cereb Blood Flow Metab 5, 97-107.
63. Hume RI, Dingledine R, & Heinemann SF (1991). Identification of a site in glutamate receptor subunits that controls calcium permeability. Science 253, 1028-1031.
64. Jacobs J, Levan P, Chander R, Hall J, Dubeau F, & Gotman J (2008). Interictal high-frequency oscillations (80-500 Hz) are an indicator of seizure onset areas independent of spikes in the human epileptic brain. Epilepsia.
65. Johnston D & Wu MS (1995). Foundations of Cellular Neurophysiology, pp. 423-439. The MIT Press.

86
66. Jones MS, MacDonald KD, Choi B, Dudek FE, & Barth DS (2000). Intracellular correlates of fast (>200 Hz) electrical oscillations in rat somatosensory cortex. J Neurophysiol 84, 1505-1518.
67. Kaiser J & Lutzenberger W (2003). Induced gamma-band activity and human brain function. Neuroscientist 9, 475-484.
68. Kandel A & Buzsaki G (1997). Cellular-synaptic generation of sleep spindles, spike-and-wave discharges, and evoked thalamocortical responses in the neocortex of the rat. J Neurosci 17, 6783-6797.
69. Kandel ER, Schwartz JH, & Jessell TM (2000). Pinciples of Neural Science, 4th ed. McGraw-Hill.
70. Kanemitsu H, Nakagomi T, Tamura A, Tsuchiya T, Kono G, & Sano K (2002). Differences in the extent of primary ischemic damage between middle cerebral artery coagulation and intraluminal occlusion models. J Cereb Blood Flow Metab 22, 1196-1204.
71. Kass IS & Lipton P (1982). Mechanisms involved in irreversible anoxic damage to the in vitro rat hippocampal slice. J Physiol 332, 459-472.
72. Kelly KM, Jukkola PI, Kharlamov EA, Downey KL, McBride JW, Strong R, & Aronowski J (2006). Long-term video-EEG recordings following transient unilateral middle cerebral and common carotid artery occlusion in Long-Evans rats. Exp Neurol 201, 495-506.
73. Kempinsky W (1958). Experimental study of distant effects of acute focal brain injury; a study of diaschisis. AMA Arch Neurol Psychiatry 79, 376-389.
74. Kennedy MB (1993). The postsynaptic density. Curr Opin Neurobiol 3, 732-737.
75. Kerr JF, Wyllie AH, & Currie AR (1972). Apoptosis: a basic biological phenomenon with wide-ranging implications in tissue kinetics. Br J Cancer 26, 239-257.
76. Kilic E, Kilic U, & Hermann DM (2006). TAT fusion proteins against ischemic stroke: current status and future perspectives. Front Biosci 11, 1716-1721.
77. Kim E & Sheng M (2004). PDZ domain proteins of synapses. Nat Rev Neurosci 5, 771-781.
78. Klee M, Offenloch K, & Tigges J (1965). Cross-correlation analysis of electroencephalographic potentials and slow membrane transients. Science 147, 519-521.

87
79. Koizumi J, Yoshida Y, Nakazawa T, & Ooneda G (1986). Experimental studies of ischemic brain edema. I. A new experimental model of cerebral embolism in which recirculation can introduced into the ischemic area. Jpn J Stroke 8.
80. Kornau HC, Schenker LT, Kennedy MB, & Seeburg PH (1995). Domain interaction between NMDA receptor subunits and the postsynaptic density protein PSD-95. Science 269, 1737-1740.
81. Kraig RP & Nicholson C (1978). Extracellular ionic variations during spreading depression. Neuroscience 3, 1045-1059.
82. Leão AAP (1944). Spreading depression of activity in the cerebral cortex. J Neurophysiol 7, 359-390.
83. Leão AAP (1947). Further observations on the spreading depression of activity in the cerebral cortex. J Neurophysiol 10, 409-414.
84. Leão AAP (1951). The slow voltage variation of cortical spreading depression of activity. Electroencephalogr Clin Neurophysiol 3, 315-321.
85. Li H & Buchan AM (1993). Treatment with an AMPA antagonist 12 hours following severe normothermic forebrain ischemia prevents CA1 neuronal injury. J Cereb Blood Flow Metab 13, 933-939.
86. Lin TN, Sun SW, Cheung WM, Li F, & Chang C (2002). Dynamic changes in cerebral blood flow and angiogenesis after transient focal cerebral ischemia in rats. Evaluation with serial magnetic resonance imaging. Stroke 33, 2985-2991.
87. Lipton P (1999). Ischemic cell death in brain neurons. Physiol Rev 79, 1431-1568.
88. Liu Y, Wong TP, Aarts M, Rooyakkers A, Liu L, Lai TW, Wu DC, Lu J, Tymianski M, Craig AM, & Wang YT (2007). NMDA receptor subunits have differential roles in mediating excitotoxic neuronal death both in vitro and in vivo. J Neurosci 27, 2846-2857.
89. Lo EH (2008). A new penumbra: transitioning from injury into repair after stroke. Nat Med 14, 497-500.
90. Longa EZ, Weinstein PR, Carlson S, & Cummins R (1989). Reversible middle cerebral artery occlusion without craniectomy in rats. Stroke 20, 84-91.
91. Majno G & Joris I (1995). Apoptosis, oncosis, and necrosis. An overview of cell death. Am J Pathol 146, 3-15.
92. Malis L & Kruger L (1956). Multiple responses and excitability of cat's visual cortex. J Neurophysiol 19, 172-186.

88
93. Martin EAE (1990). Concise Medical Dictionary, 3rd ed. Oxford University Press: Market House Books.
94. Massey PV, Johnson BE, Moult PR, Auberson YP, Brown MW, Molnar E, Collingridge GL, & Bashir ZI (2004). Differential roles of NR2A and NR2B-containing NMDA receptors in cortical long-term potentiation and long-term depression. J Neurosci 24, 7821-7828.
95. Matsumoto H & Ajmone-Marsan C (1964). Cortical cellular phenomena in experimental epilepsy: ictal manifestations. Exp Neurol 9, 305-326.
96. Mauceri D, Cattabeni F, Di Luca M, & Gardoni F (2004). Calcium/calmodulin-dependent protein kinase II phosphorylation drives synapse-associated protein 97 into spines. J Biol Chem 279, 23813-23821.
97. McGee-Russell SM, Brown AW, & Brierley JB (1970). A combined light and electron microscope study of early anoxic-ischaemic cell change in rat brain. Brain Res 20, 193-200.
98. Mehta SL, Manhas N, & Raghubir R (2007). Molecular targets in cerebral ischemia for developing novel therapeutics. Brain Res Rev 54, 34-66.
99. Mies G, Iijima T, & Hossmann KA (1993). Correlation between peri-infarct DC shifts and ischaemic neuronal damage in rat. Neuroreport 4, 709-711.
100. Migaud M, Charlesworth P, Dempster M, Webster LC, Watabe AM, Makhinson M, He Y, Ramsay MF, Morris RG, Morrison JH, O'Dell TJ, & Grant SG (1998). Enhanced long-term potentiation and impaired learning in mice with mutant postsynaptic density-95 protein. Nature 396, 433-439.
101. Mitzdorf U & Singer W (1978). Prominent excitatory pathways in the cat visual cortex (A 17 and A 18): a current source density analysis of electrically evoked potentials. Exp Brain Res 33, 371-394.
102. Molnar L, Hegedus K, & Fekete I (1988). A new model for inducing transient cerebral ischemia and subsequent reperfusion in rabbits without craniectomy. Stroke 19, 1262-1266.
103. Mun-Bryce S, Wilkerson AC, Papuashvili N, & Okada YC (2001). Recurring episodes of spreading depression are spontaneously elicited by an intracerebral hemorrhage in the swine. Brain Res 888, 248-255.
104. Murray CJ & Lopez AD (1997). Mortality by cause for eight regions of the world: Global Burden of Disease Study. Lancet 349, 1269-1276.
105. Myint PK, Staufenberg EF, & Sabanathan K (2006). Post-stroke seizure and post-stroke epilepsy. Postgrad Med J 82, 568-572.

89
106. Nedergaard M (1987). Neuronal injury in the infarct border: a neuropathological study in the rat. Acta Neuropathol 73, 267-274.
107. Nedergaard M & Hansen AJ (1988). Spreading depression is not associated with neuronal injury in the normal brain. Brain Res 449, 395-398.
108. Nedergaard M & Hansen AJ (1993). Characterization of cortical depolarizations evoked in focal cerebral ischemia. J Cereb Blood Flow Metab 13, 568-574.
109. Neufeld MY, Chistik V, Chapman J, & Korczyn AD (1999). Intermittent rhythmic delta activity (IRDA) morphology cannot distinguish between focal and diffuse brain disturbances. J Neurol Sci 164, 56-59.
110. Nicoletti F, Bruno V, Catania MV, Battaglia G, Copani A, Barbagallo G, Cena V, Sanchez-Prieto J, Spano PF, & Pizzi M (1999). Group-I metabotropic glutamate receptors: hypotheses to explain their dual role in neurotoxicity and neuroprotection. Neuropharmacology 38, 1477-1484.
111. Nudo RJ & Milliken GW (1996). Reorganization of movement representations in primary motor cortex following focal ischemic infarcts in adult squirrel monkeys. J Neurophysiol 75, 2144-2149.
112. Nudo RJ, Plautz EJ, & Frost SB (2001). Role of adaptive plasticity in recovery of function after damage to motor cortex. Muscle Nerve 24, 1000-1019.
113. Olney JW (1994). Neurotoxicity of NMDA receptor antagonists: an overview. Psychopharmacol Bull 30, 533-540.
114. Paxinos G & Watson C (1986). The rat brain in stereotaxic coordinates Sydney: Academic Press.
115. Pellegrini-Giampietro DE, Peruginelli F, Meli E, Cozzi A, Albani-Torregrossa S, Pellicciari R, & Moroni F (1999). Protection with metabotropic glutamate 1 receptor antagonists in models of ischemic neuronal death: time-course and mechanisms. Neuropharmacology 38, 1607-1619.
116. Peng LA, Juurlink BH, & Hertz L (1991). Differences in transmitter release, morphology, and ischemia-induced cell injury between cerebellar granule cell cultures developing in the presence and in the absence of a depolarizing potassium concentration. Brain Res Dev Brain Res 63, 1-12.
117. Perez Velazquez JL, Frantseva MV, & Carlen PL (1997). In vitro ischemia promotes glutamate-mediated free radical generation and intracellular calcium accumulation in hippocampal pyramidal neurons. J Neurosci 17, 9085-9094.
118. Perez Velazquez JL, Frantseva MV, Huzar DV, & Carlen PL (2000). Mitochondrial porin required for ischemia-induced mitochondrial dysfunction and neuronal damage. Neuroscience 97, 363-369.

90
119. Prince DA (1968). Inhibition in "epileptic" neurons. Exp Neurol 21, 307-321.
120. Purves D, Augustine GJ, Fitzpatrick D, Hall WC, LaMantia A-S, McNamara JO, & Williams SM (2007). Neuroscience, 4th ed. Sinauer Associates Inc..
121. Reinecke S, Lutzenburg M, Hagemann G, Bruehl C, Neumann-Haefelin T, & Witte OW (1999). Electrophysiological transcortical diaschisis after middle cerebral artery occlusion (MCAO) in rats. Neurosci Lett 261, 85-88.
122. Rose CR & Konnerth A (2000). Self-regulating synapses. Nature 405, 413-415.
123. Rothman SM (1983). Synaptic activity mediates death of hypoxic neurons. Science 220, 536-537.
124. Sakatani K, Iizuka H, & Young W (1990). Somatosensory evoked potentials in rat cerebral cortex before and after middle cerebral artery occlusion. Stroke 21, 124-132.
125. Sans N, Prybylowski K, Petralia RS, Chang K, Wang YX, Racca C, Vicini S, & Wenthold RJ (2003). NMDA receptor trafficking through an interaction between PDZ proteins and the exocyst complex. Nat Cell Biol 5, 520-530.
126. Sattler R, Xiong Z, Lu WY, Hafner M, MacDonald JF, & Tymianski M (1999). Specific coupling of NMDA receptor activation to nitric oxide neurotoxicity by PSD-95 protein. Science 284, 1845-1848.
127. Sattler R, Xiong Z, Lu WY, MacDonald JF, & Tymianski M (2000). Distinct roles of synaptic and extrasynaptic NMDA receptors in excitotoxicity. J Neurosci 20, 22-33.
128. Schikorski T & Stevens CF (1997). Quantitative ultrastructural analysis of hippocampal excitatory synapses. J Neurosci 17, 5858-5867.
129. Schousboe A, Frandsen A, Wahl P, & Krogsgaard-Larsen P (1994). Neurotoxicity and excitatory amino acid antagonists. Neurotoxicology 15, 477-481.
130. Shaw C & Teyler TJ (1982). The neural circuitry of the neocortex examined in the in vitro brain slice preparation. Brain Res 243, 35-47.
131. Sheardown MJ, Suzdak PD, & Nordholm L (1993). AMPA, but not NMDA, receptor antagonism is neuroprotective in gerbil global ischaemia, even when delayed 24 h. Eur J Pharmacol 236, 347-353.
132. Sherman SM (2001). Tonic and burst firing: dual modes of thalamocortical relay. Trends Neurosci 24, 122-126.
133. Shi H & Liu KJ (2007). Cerebral tissue oxygenation and oxidative brain injury during ischemia and reperfusion. Front Biosci 12, 1318-1328.

91
134. Siesjö BK, Hu B, & Kristián T (1999). Is the cell death pathway triggered by the mitochondrion or the endoplasmic reticulum? J Cereb Blood Flow Metab 19, 19-26.
135. Somjen GG (2001). Mechanisms of spreading depression and hypoxic spreading depression-like depolarization. Physiol Rev 81, 1065-1096.
136. Somjen GG (2004). Ions in the Brain Oxford University Press.
137. Soriano FX, Martel MA, Papadia S, Vaslin A, Baxter P, Rickman C, Forder J, Tymianski M, Duncan R, Aarts M, Clarke P, Wyllie DJ, & Hardingham GE (2008). Specific targeting of pro-death NMDA receptor signals with differing reliance on the NR2B PDZ ligand. J Neurosci 28, 10696-10710.
138. Srivastava S, Osten P, Vilim FS, Khatri L, Inman G, States B, Daly C, DeSouza S, Abagyan R, Valtschanoff JG, Weinberg RJ, & Ziff EB (1998). Novel anchorage of GluR2/3 to the postsynaptic density by the AMPA receptor-binding protein ABP. Neuron 21, 581-591.
139. Staba RJ, Wilson CL, Bragin A, Jhung D, Fried I, & Engel J, Jr. (2004). High-frequency oscillations recorded in human medial temporal lobe during sleep. Ann Neurol 56, 108-115.
140. Stephenson FA (2006). Structure and trafficking of NMDA and GABAA receptors. Biochem Soc Trans 34, 877-881.
141. Steriade M, Nunez A, & Amzica F (1993). A novel slow (< 1 Hz) oscillation of neocortical neurons in vivo: depolarizing and hyperpolarizing components. J Neurosci 13, 3252-3265.
142. Stohr PE & Goldring S (1969). Origin of somatosensory evoked scalp responses in man. J Neurosurg 31, 117-127.
143. Strong AJ, Venables GS, & Gibson G (1983). The cortical ischaemic penumbra associated with occlusion of the middle cerebral artery in the cat: 1. Topography of changes in blood flow, potassium ion activity, and EEG. J Cereb Blood Flow Metab 3, 86-96.
144. Sugaya E, Takato M, & Noda Y (1975). Neuronal and glial activity during spreading depression in cerebral cortex of cat. J Neurophysiol 38, 822-841.
145. Sun HS, Doucette TA, Liu Y, Fang Y, Teves L, Aarts M, Ryan CL, Bernard PB, Lau A, Forder JP, Salter MW, Wang YT, Tasker RA, & Tymianski M (2008). Effectiveness of PSD95 inhibitors in permanent and transient focal ischemia in the rat. Stroke 39, 2544-2553.

92
146. Tamura A, Asano T, & Sano K (1980). Correlation between rCBF and histological changes following temporary middle cerebral artery occlusion. Stroke 11, 487-493.
147. Tamura A, Graham DI, McCulloch J, & Teasdale GM (1981a). Focal cerebral ischaemia in the rat: 1. Description of technique and early neuropathological consequences following middle cerebral artery occlusion. J Cereb Blood Flow Metab 1, 53-60.
148. Tamura A, Graham DI, McCulloch J, & Teasdale GM (1981b). Focal cerebral ischaemia in the rat: 2. Regional cerebral blood flow determined by [14C]iodoantipyrine autoradiography following middle cerebral artery occlusion. J Cereb Blood Flow Metab 1, 61-69.
149. Thomson R, Johnson R, & Hoopes J (1963). Organization of auditory, somatic sensory, and visual projection to association fields of cerebral cortex in the cat. J Neurophysiol 26, 343-364.
150. Trojaborg W & Boysen G (1973). Relation between EEG, regional cerebral blood flow and internal carotid artery pressure during carotid endarterectomy. Electroencephalogr Clin Neurophysiol 34, 61-69.
151. Tymianski M, Charlton MP, Carlen PL, & Tator CH (1993). Source specificity of early calcium neurotoxicity in cultured embryonic spinal neurons. J Neurosci 13, 2085-2104.
152. Tymianski M & Tator CH (1996). Normal and abnormal calcium homeostasis in neurons: a basis for the pathophysiology of traumatic and ischemic central nervous system injury. Neurosurgery 38, 1176-1195.
153. Urrestarazu E, Jirsch JD, Levan P, Hall J, Avoli M, Dubeau F, & Gotman J (2006). High-frequency intracerebral EEG activity (100-500 Hz) following interictal spikes. Epilepsia 47, 1465-1476.
154. von Monakow C (1969). Diaschisis [1914 article translated by G Harris]. In Brain and Behavior I: Moods, States and Mind, ed. Pribram KH, pp. 27-36. Penguin.
155. Vyskocil F, Kritz N, & Bures J (1972). Potassium-selective microelectrodes used for measuring the extracellular brain potassium during spreading depression and anoxic depolarization in rats. Brain Res 39, 255-259.
156. Waltereit R & Weller M (2003). Signaling from cAMP/PKA to MAPK and synaptic plasticity. Mol Neurobiol 27, 99-106.
157. Wei L, Rovainen CM, & Woolsey TA (1995). Ministrokes in rat barrel cortex. Stroke 26, 1459-1462.

93
158. Ye B, Liao D, Zhang X, Zhang P, Dong H, & Huganir RL (2000). GRASP-1: a neuronal RasGEF associated with the AMPA receptor/GRIP complex. Neuron 26, 603-617.
159. Ye B, Sugo N, Hurn PD, & Huganir RL (2002). Physiological and pathological caspase cleavage of the neuronal RasGEF GRASP-1 as detected using a cleavage site-specific antibody. Neuroscience 114, 217-227.
160. Ylinen A, Bragin A, Nadasdy Z, Jando G, Szabo I, Sik A, & Buzsaki G (1995). Sharp wave-associated high-frequency oscillation (200 Hz) in the intact hippocampus: network and intracellular mechanisms. J Neurosci 15, 30-46.
161. Yu SP & Choi DW (2000). Ions, cell volume, and apoptosis. Proc Natl Acad Sci U S A 97, 9360-9362.