
An exploratory analysis of the order book, and order flow...
35
An exploratory analysis of the order book, and order flow and execution on the Saudi stock market Mohammad Al-Suhaibani a , Lawrence Kryzanowski b, * a Department of Economics, Imam University, Riyadh, Saudi Arabia b Department of Finance, Faculty of Commerce, Concordia University, 1455 De Maisonneuve Blvd. West, Montreal, Que., Canada Received 27 October 1998; accepted 22 June 1999 Abstract The microstructure of the Saudi Stock Market (SSM) under the new computerized trading system, ESIS, is described, and order and other generated data sets are used to examine the patterns in the order book, the dynamics of order flow, and the probability of executing limit orders. Although the SSM has a distinct structure, its intraday pat- terns are surprisingly similar to those found in other markets with dierent structures. We find that liquidity, as commonly measured by width and depth, is relatively low on the SSM. However, liquidity is exceptionally high when measured by immediacy. Limit orders that are priced reasonably, on average, have a short duration before being ex- ecuted, and have a high probability of subsequent execution. Ó 2000 Elsevier Science B.V. All rights reserved. JEL classification: G15 Keywords: Market microstructure; Limit order book; Intraday patterns; Order execution Journal of Banking & Finance 24 (2000) 1323–1357 www.elsevier.com/locate/econbase * Corresponding author. Tel.: +1-514-848-2782; fax: +1-514-848-4500. E-mail addresses: [email protected] (M. Al-Suhaibani), ladfi53@vax2. concordia.ca (L. Kryzanowski). 0378-4266/00/$ - see front matter Ó 2000 Elsevier Science B.V. All rights reserved. PII: S 0 3 7 8 - 4 2 6 6 ( 9 9 ) 0 0 0 7 5 - 8
Transcript of An exploratory analysis of the order book, and order flow...
An exploratory analysis of the order book, and
order ¯ow and execution on the Saudi stock
market
Mohammad Al-Suhaibani a, Lawrence Kryzanowski b,*
a Department of Economics, Imam University, Riyadh, Saudi Arabiab Department of Finance, Faculty of Commerce, Concordia University,
1455 De Maisonneuve Blvd. West, Montreal, Que., Canada
Received 27 October 1998; accepted 22 June 1999
Abstract
The microstructure of the Saudi Stock Market (SSM) under the new computerized
trading system, ESIS, is described, and order and other generated data sets are used to
examine the patterns in the order book, the dynamics of order ¯ow, and the probability
of executing limit orders. Although the SSM has a distinct structure, its intraday pat-
terns are surprisingly similar to those found in other markets with di�erent structures.
We ®nd that liquidity, as commonly measured by width and depth, is relatively low on
the SSM. However, liquidity is exceptionally high when measured by immediacy. Limit
orders that are priced reasonably, on average, have a short duration before being ex-
ecuted, and have a high probability of subsequent execution. Ó 2000 Elsevier Science
B.V. All rights reserved.
JEL classi®cation: G15
Keywords: Market microstructure; Limit order book; Intraday patterns; Order
execution
Journal of Banking & Finance 24 (2000) 1323±1357
www.elsevier.com/locate/econbase
* Corresponding author. Tel.: +1-514-848-2782; fax: +1-514-848-4500.
E-mail addresses: [email protected] (M. Al-Suhaibani), lad®53@vax2.
concordia.ca (L. Kryzanowski).
0378-4266/00/$ - see front matter Ó 2000 Elsevier Science B.V. All rights reserved.
PII: S 0 3 7 8 - 4 2 6 6 ( 9 9 ) 0 0 0 7 5 - 8
1. Introduction
The recent availability of order, quote, and transaction data from stockmarkets around the world has stimulated research on intraday stock marketphenomena. Intraday patterns identi®ed in the data of US and other developedcountries include the persistent U-shaped patterns in returns, number of sharestraded, volumes, bid±ask spreads, and volatility. 1;2 Other studies that examineorder-driven markets provide new evidence on patterns in the order book,order ¯ow, and the interaction between the order book and order ¯ow. 3
In this paper, we study the Saudi Stock Market (SSM) which uses a com-puterized trading mechanism known as Electronic Securities InformationSystem (ESIS). The objective is to examine the behavior of market participantsin the SSM to understand better the e�ect of order placement on market li-quidity, and to determine whether certain patterns identi®ed in earlier studiescan be generalized to other trading structures. Our paper has several uniqueaspects. First, the SSM, which is described in detail in the next section, is a pureorder-driven market with no physical trading ¯oor, regulated brokers ormarket makers, and it is closed to foreign portfolio investments. The marketalso is di�erentiated by a long mid-day break, partially hidden order book, anda constant tick size. Second, the unique data set provided by the Saudi ArabianMonetary Agency (SAMA) includes all orders for listed stocks submittedduring the period from 31 October 1996 to 14 January 1997. This order data setallows for the construction of the complete limit order book for this order-driven market. The data set includes information that allows for the identi®-cation of market and limit orders, and what we called order packages. Third,we believe that our study is the ®rst to examine the market microstructure ofthe SSM. We provide evidence on several issues related to the interaction be-tween the order book and order ¯ow, which adds to the existing empiricalliterature on order-driven markets. Finally, our paper examines a number ofnew issues associated with order-driven markets. The literature on marketmicrostructure often discusses liquidity measures such as width, depth, resil-
1 U-shaped patterns refer to the heavy trading activity on ®nancial markets at the beginning and
at the end of the trading day, and the relatively light trading activity over the middle of the day
(Admati and P¯eiderer (1988)).2 For the US markets, these include studies by Wood et al. (1985), Jain and Joh (1988), McInish
and Wood (1991, 1992), Brock and Kleidon (1992), Gerety and Mulherin (1992), Foster and
Viswanathan (1993) and Chan et al. (1995a,b). McInish and Wood (1990) report similar results for
the Toronto Stock Exchange and Lehmann and Modest (1994) ®nd U-shaped patterns in trading
for the Tokyo Stock Exchange.3 A representative example is the empirical analysis by Biais et al. (1995) of the limit order book
and order ¯ow on the Paris Bourse. Niemeyer and Sand�as (1995), Hedvall and Niemeyer (1996),
Niemeyer and Sand�as (1996) and Hedvall et al. (1997) perform similar analyses for stock markets
in Stockholm and Helsinki.
1324 M. Al-Suhaibani, L. Kryzanowski / Journal of Banking & Finance 24 (2000) 1323±1357
iency, and immediacy that may have more relevance for market-order traders.Our unique data set allows us to examine liquidity measures that are relevantfor limit order traders, the only suppliers of liquidity on the SSM. Using orderduration and logit regressions, we present new evidence on the probability ofexecuting a limit order on the SSM.
The remainder of this paper is structured as follows. Section 2 presents adetailed description of the current trading system. The data sets are describedin Section 3. Sections 4 and 5 analyze the limit order book and order ¯ow,respectively. Section 6 presents and analyzes the empirical ®ndings on limitorder execution. Section 7 concludes the paper.
2. Market description
The SSM is relatively new in age compared to the stock markets in thedeveloped countries. The ®rst company went public in Saudi Arabia in 1954.By the end of 1982, 48 companies traded in the Saudi market, which wascompletely unregulated by the government. 4 The collapse of the unregulatedstock market in Kuwait motivated the Saudi government to take regulatoryaction in 1984. 5 The new regulations transferred share trading, which oc-curred in the over-the-counter market, from the hands of the uno�cialbrokers to the banks. Because of low volume and lack of coordination be-tween the banks, a delay of several days or weeks often occurred beforeorders were ®lled. Several other restrictions resulted in lengthy delays. Bankscould neither hold positions in stocks nor break up large blocks of shares toaccommodate buyers. 6
A major development in trading on the SSM post-market-regulation was theestablishment in 1990 of an electronic trading system known as ESIS. 7 Afterthe startup of ESIS, the banks established twelve Central Trading Units(CTUs). All the CTUs are connected to the central system at SAMA. The bankCTUs, and designated bank branches throughout the country that are con-nected to the CTU (ESISNET branches), are the only locations where buy andsell orders can be entered directly into ESIS.
4 Due to religious considerations, only stocks are traded in the market. From the viewpoint of
sharia (Islamic law), interest on bonds is regarded as usury.5 More information on the Kuwaiti ®nancial crises, which is known as the ``Souq al-Manakh''
crisis, is found in Darwiche (1986).6 In 1992, SAMA allowed the banks to manage open-ended mutual funds for public investors.
However, the banks are still not allowed to invest directly or indirectly, through the mutual funds,
in Saudi stocks.7 More on the history of the SSM up to 1990 is found in Malaikah (1990), Wilson (1991), and
Butler and Malaikah (1992).
M. Al-Suhaibani, L. Kryzanowski / Journal of Banking & Finance 24 (2000) 1323±1357 1325

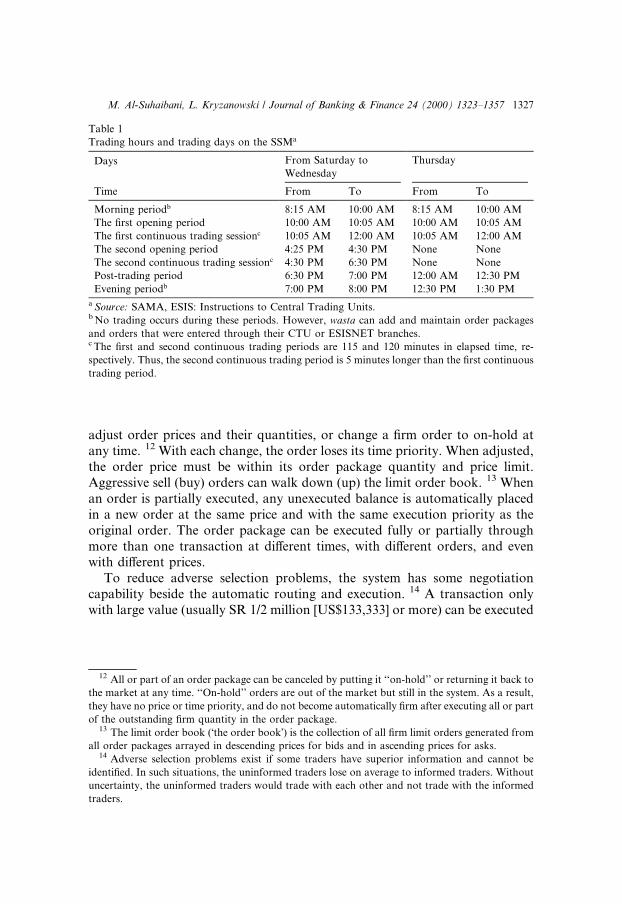
Trading on the SSM consists of four hours per day, divided into twodaily sessions for Saturday through Wednesday. The trading day consists ofone two-hour session on Thursday. Table 1 summarizes trading hours andtrading days on the SSM. During the morning and evening hours notrading occurs, but wasata can add and maintain order packages and ordersthat were entered through their CTU or ESISNET branches. The wasata areneither brokers nor dealers. They are order clerks whose assigned job ismerely to receive and verify orders from public traders at the CTU, andthen to enter these orders into the system. Conditional on SAMA approval,the banks hire and pay the wasata. Sell and buy orders are generated fromthe incoming sell and buy order packages. If an order package has many®rm orders, each is di�erentiated by parameters such as quantity, price andvalidity period. 8 Order packages entered into the system may be valid for aperiod from 1 to 12 days. 9
At some point of time during the ®rst ®ve-minute opening period, all ®rmbuy and sell orders participate in a call market. 10 Orders are executed at anequilibrium price calculated to be the best possible price for executing themaximum number of shares available in the market at the open. This is fol-lowed by a continuous auction market, where marketable orders by public in-vestors are transacted with the limit orders of other public investors. 11 In thepost-trading period, trades are routed to settlement, trading statistics areprinted, and no order package or order can be added or maintained.
Only limit orders with a speci®ed price and ®rm quantity are permitted.Firm orders are eligible for execution during the opening and continuoustrading periods according to price-then-time priority rules. An investor can
8 In ESIS terms, order packages are called orders, and orders are called quotes. These de®nitions
di�er from those usually used in the literature. Order in the literature usually refers to order with a
®rm quote that leads instantly to a bid or ask if it is a limit order, or to a trade if it is a market
order. The ®rm quotes (as de®ned by the ESIS) are more like orders as usually de®ned in the
literature. In the market, generating a ®rm quote is the same as placing an order. To be consistent
with the literature, orders are referred to as order packages, and quotes are referred to as orders.9 Before 28 May 1994, the validity period for an order package was either 1, 5 or 10 days.
Subsequently, the validity period became 1, 6 or 12 days. From 1 October 1994, the validity period
was allowed to be any period from 1 to 12 days.10 In a call market, orders for a stock are batched over time and executed at a particular point in
time.11 A limit order is an order with speci®c quantity and price and for a given period of time. For a
limit buy (sell) order, the price is below (above) the current ask (bid). Marketable limit order is a
limit order with a limit price at or better than the prevailing counterparty quote. For a marketable
buy (sell) order, the price must equal or better the current ask (bid). Notice that the standard
market order (order to buy or sell a given quantity for immediate execution at the current market
price, without specifying it) is not accepted by the system. Since marketable and market orders are
essentially similar, we use the term market order when referring to marketable orders in the
remainder of the paper.
1326 M. Al-Suhaibani, L. Kryzanowski / Journal of Banking & Finance 24 (2000) 1323±1357
adjust order prices and their quantities, or change a ®rm order to on-hold atany time. 12 With each change, the order loses its time priority. When adjusted,the order price must be within its order package quantity and price limit.Aggressive sell (buy) orders can walk down (up) the limit order book. 13 Whenan order is partially executed, any unexecuted balance is automatically placedin a new order at the same price and with the same execution priority as theoriginal order. The order package can be executed fully or partially throughmore than one transaction at di�erent times, with di�erent orders, and evenwith di�erent prices.
To reduce adverse selection problems, the system has some negotiationcapability beside the automatic routing and execution. 14 A transaction onlywith large value (usually SR 1/2 million [US$133,333] or more) can be executed
Table 1
Trading hours and trading days on the SSMa
Days From Saturday to
Wednesday
Thursday
Time From To From To
Morning periodb 8:15 AM 10:00 AM 8:15 AM 10:00 AM
The ®rst opening period 10:00 AM 10:05 AM 10:00 AM 10:05 AM
The ®rst continuous trading sessionc 10:05 AM 12:00 AM 10:05 AM 12:00 AM
The second opening period 4:25 PM 4:30 PM None None
The second continuous trading sessionc 4:30 PM 6:30 PM None None
Post-trading period 6:30 PM 7:00 PM 12:00 AM 12:30 PM
Evening periodb 7:00 PM 8:00 PM 12:30 PM 1:30 PM
a Source: SAMA, ESIS: Instructions to Central Trading Units.b No trading occurs during these periods. However, wasta can add and maintain order packages
and orders that were entered through their CTU or ESISNET branches.c The ®rst and second continuous trading periods are 115 and 120 minutes in elapsed time, re-
spectively. Thus, the second continuous trading period is 5 minutes longer than the ®rst continuous
trading period.
12 All or part of an order package can be canceled by putting it ``on-hold'' or returning it back to
the market at any time. ``On-hold'' orders are out of the market but still in the system. As a result,
they have no price or time priority, and do not become automatically ®rm after executing all or part
of the outstanding ®rm quantity in the order package.13 The limit order book (Ôthe order bookÕ) is the collection of all ®rm limit orders generated from
all order packages arrayed in descending prices for bids and in ascending prices for asks.14 Adverse selection problems exist if some traders have superior information and cannot be
identi®ed. In such situations, the uninformed traders lose on average to informed traders. Without
uncertainty, the uninformed traders would trade with each other and not trade with the informed
traders.
M. Al-Suhaibani, L. Kryzanowski / Journal of Banking & Finance 24 (2000) 1323±1357 1327
as a put-through transaction outside the system under SAMA supervision. 15
The parties to put-through transactions have no obligation to trade at thecurrent quotes or clear the limit orders in between. After execution, thetransaction is immediately reported to the market.
The minimum price variation, or tick size, for all stocks in the market is SR1 (�27 cents). Transaction fees are charged on each side of the trade, and havea minimum of SR 25 (�$6.66). Transaction fees range between 0.5% and 0.1%of the trade value depending on the number of shares executed. The com-mission is distributed in two parts: 95% to the banks, and 5% to the SSRC forsettlement and transfer services. 16 During continuous trading periods, ®rmorders must be priced within �10% of the opening price of the given tradingperiod. In turn, the opening price must lie within a price range that is within�10% of the previous dayÕs closing price. If no opening price exists for thatperiod, the opening price defaults to the previous dayÕs closing price. Occa-sionally SAMA can allow the price to exceed the present ¯uctuation limitprovided the new price is reasonably justi®ed by the earnings or prospects ofthe company.
The electronic limit order book is not fully visible to investors since in-formation is displayed publicly in an aggregate format (i.e., only the bestquote with all quantities available at that quote). The status of the bestquotes and quantities is updated (almost instantaneously) on bank screenseach time an order arrives, is canceled, or is executed. Public investors canview the price, quantity, and time of last trade. The terminals and big screenswhere traders can monitor the market are only available in the CTUs andESISNET branches of the banks. In the early releases of ESIS, only thewasata in the CTUs could view the best ®ve bids and asks, and valued bankcustomers could easily learn this information by calling their bankÕs CTU. Toprevent this type of unfair access to market information and related front-running problems, SAMA on 1 October 1994 restricted both the wasata inthe CTUs and the public to viewing only the best two bids and asks. The
15 Put-through transactions (so-called block trades) are not common on the SSM, and usually
are handled in an informal manner. In most cases, big traders agree in advance on the
transaction and ask SAMA to handle it as a put-through transaction. For this reason, the price
of the transaction may not re¯ect current market conditions. If this is the case, SAMA sends a
message communicating this information about the trade to the market. Occasionally, an
uno�cial broker brings in both sides of the put-through transaction. In rare cases, an uninformed
trader appeals for SAMA supervision to minimize the transaction costs associated with a very
large order by handling it as a put-through. To facilitate the transaction by this veri®ed
uninformed trader, SAMA sends a massage to the CTUs asking for counterparties to complete
the transaction.16 The SSRC (Saudi Share Registration Company) was formed in 1985 by the Saudi banks to
serve as a clearing system for executed trades. Under ESIS, the major role of SSRC is to keep up-to-
date records of shareholdings in stock companies.
1328 M. Al-Suhaibani, L. Kryzanowski / Journal of Banking & Finance 24 (2000) 1323±1357
wasata still have more information about the order book since they know thedetails of every order placed through their CTU or their ESISNET branchesconnected to it. This includes the identi®cation of investors, the price andquantities of ®rm and on-hold orders, and the type of ownership documentfor sell orders. Details of every order are only observable to surveillanceo�cials. This level of transparency on the SSM hides all ®rm orders outsidethe two best quotes. Unlike on-hold orders, hidden orders have price andtime priority and can be revealed to the market or executed at any time. Forexample, a ®rm order to buy with a price less than the second best bid ishidden but becomes visible when all the quantity at the ®rst best quote isexecuted. The order also can be executed while it is hidden by an aggressivemarket sell order. 17
Only the wasata in the CTUs have the right to enter orders directly intothe system. Investors in the SSM consist of public investors and bankphone customers. 18 Bank phone customers have an agreement with thebanks to change the price and ®rm quantity of their submitted orders atany time simply by calling their BankÕs CTU. As a result, they are lessa�ected than other public traders by the free trading option associated withlimit orders since they can change the condition of their orders very quicklybefore they are ``picked o�'' when new public information arrives. 19
This group of traders includes the institutional investors (e.g. mutual funds)and many technical traders who have trading and no fundamental infor-mation.
The date and time of transfer of bene®cial ownership for each transactionis the date and time of execution in the system. 20 Transaction con®rmationslips are usually printed at CTUs and ESISNET branches and distributed tothe clients after each trading session. Following the second trading session,transactions are routed for settlement. The settlement date depends on thetype of ownership document. Ishaar, which can be retained in the system for
17 Unlike some trading systems, ESIS does not allow traders to intentionally hide orders that are
part of the best two quotes.18 SAMA does not allow banks to grant their customers access to the system via any computer
network.19 As Stoll (1992) explains, a limit order provides the rest of the market with a free option. The
trader who places a buy (sell) limit order has written a free put (call) option to the market. For
example, suppose the trader submits a buy limit order at $100. If public information causes the
share price to fall below $100, this put option will be exercised and the public trader loses because
he cannot adjust the limit price quickly. The ability to change limit price more quickly by bank
phone customer makes the e�ective maturity of his limit order very short, and hence the value of
the put option associated with this order is almost zero.20 The ex-dividend day usually comes before the company closes its record for dividend
payments. The company and SAMA agree in advance on this date, and communicate the date to
the CTUs.
M. Al-Suhaibani, L. Kryzanowski / Journal of Banking & Finance 24 (2000) 1323±1357 1329

future sale or printed and given to the investor, are delivered next daymorning. 21 In contrast, certi®cates take from two days to one week ormore to be delivered. Ishaar takes less time because it can be handledelectronically through ESIS Fully Automated Share Transfer (ESISFAST),while the new certi®cate has to be issued from the companyÕs share regis-tration department. The goal is to abolish all existing share certi®cates atsome future point in time. 22 Because of the di�erence in settlement dates,and to prevent the creation of two markets for every security, the type ofownership document is not visible to market participants prior to a trans-action.
3. The data sets
The data set provided by SAMA consists of intraday data on ®rm orders forall stocks listed on the market for 65 trading days (31 October 1996 to 14January 1997). Four of the 71 stocks are excluded due to an absence of orders,three stocks are excluded because they have no transactions, and eight stocksare excluded because they have a small number of transactions. The ®nal dataset includes 267,517 orders for the remaining 56 stocks. For each order, thedata set reports security code, the date and time of creation, buy±sell indicator,limit price, quantity, and date and time when the order was terminated (can-celed, expired, or executed). Because the data uniquely identify the orderpackage that generates the order, the order package data set can be easilyconstructed from the order data set. Our data set has 86,425 order packages. 23
Given the information in our order data set, we construct another (a third)data set containing the end-of-minute best ®ve quotes and their associateddepths on both sides of the market for all 13,955 minutes of trading. 24 Sub-sequent references to quotes (bids and asks) are reserved for this data set. Weuse the date and time of termination, price and quantity of orders along with
21 On March 19, 1994, SAMA reduced the ishaar delivery date to one day instead of two days.
Starting from October 1, 1994, ishaar was allowed to be issued in the same branch where the order
was submitted. Since September 1995, the buyer can know the type of ownership document
immediately after executing his buy order. The latest version of ESIS released in June 1997 permits
real time settlement for ishaar (i.e., execution and settlement times are the same).22 During the sample period, around 95% to 97% of trades have ishaar documents.23 Chan and Lakonishok (1995) use the trading package terminology to describe the traderÕs
successive purchases of a stock. The correspondence between their de®nition of a trade package and
an ex ante order is approximate. In contrast, for our data set, we have more information about
orders since we know the set of orders that was generated from an order package. However, we still
are unable to con®rm that two orders belong to the same ex ante order if the investor broke up a
large order into two submitted order packages.24 The depth is the number of shares o�ered or demanded at a given bid or ask.
1330 M. Al-Suhaibani, L. Kryzanowski / Journal of Banking & Finance 24 (2000) 1323±1357
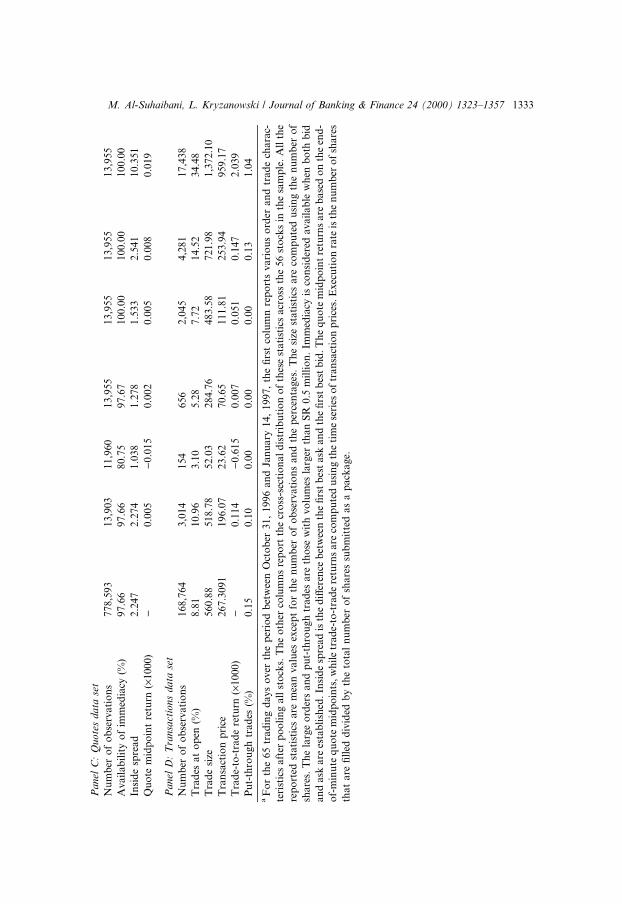
published daily statistics to identify the order that was part of a transaction(trade data set). The number of transactions in our sample is 84,382. Table 2presents some summary statistics for each of our four data sets.
Panel A in Table 2 reports summary statistics for the order data set. Limitorders account for 71% of the orders in the sample. The percentage of buy andsell orders is almost equal for most stocks. Most orders (63%) are executed.Based on Panel B, most of the order packages are to sell. Execution rates aresimilar and evolve around 0.5. Based on Panel C, the public limit order traderssupply immediacy to the market nearly all the time with an average insidespread equal to SR 2.24.
Panel D reports the summary statistics for the transaction data set whichincludes all market orders, the limit orders executed against them, and theorders executed against each other during the call market at the opening. Be-cause two orders constitute each trade, the number of observations in this dataset are twice the number of transactions as conventionally reported. Less than10% of the trades occur during the opening period, and a very small percentage(0.015%) of the trades are executed outside of the system (in the so-calledupstairs market). The average returns are positive since the market rose 9.23%over the sample period.
4. Descriptive statistics about the order book
The order book collects all limit orders at any given point of time. Orderscome into the book throughout the day at the time they are submitted to themarket, and are removed from the book as they are executed, canceled, orexpired. Using the quote data set, this section presents and discusses variousdescriptive statistics concerning the order book. Although our subsequentanalyses are based on the ®ve best quotes, it is important to remember thatmarket participants only observe the ®rst two best quotes.
4.1. Relative spreads and depths in the order book
Table 3 reports the time series means and medians of relative spreads be-tween adjacent quotes in the book, and depths at all levels for the 56 stocks inthe sample. The spread is usually one, two or three ticks in our sample. Basedon Panel A , the mean (median) relative inside spread is 1.79% (1.6%) which ishigh compared to other markets. 25 Angel (1997) uses data on the bid±ask
25 The inside spread is the di�erence between the ®rst best ask (A1) and the ®rst best bid (B1).
The relative inside spread is the inside spread divided by the quote midpoint, or:
2�A1ÿ B1�=�A1� B1�.
M. Al-Suhaibani, L. Kryzanowski / Journal of Banking & Finance 24 (2000) 1323±1357 1331

Tab
le2
Su
mm
ary
sta
tist
ics
for
each
of
the
fou
rd
ata
sets
a
Ord
ero
rtr
ad
ech
ara
cter
isti
cA
llo
bse
rva
tio
ns
Cro
ss-s
ecti
on
al
dis
trib
uti
on
acr
oss
the
56
sto
cks
Mea
nM
inF
irst
qu
art
ile
Med
ian
Th
ird
qu
art
ile
Max
Pan
elA
:O
rder
sd
ata
set
Nu
mb
ero
fo
bse
rvati
on
s267,5
17
4,7
77
411
1,1
04
3,0
27
6,9
46
26,2
40
Bu
y(%
)4
8.8
850.1
044.7
447.9
649.2
252.0
059.7
2
Lim
it(%
)7
1.2
473.8
467.4
471.3
472.6
377.0
983.1
0
Lim
itB
uy
(%o
fli
mit
ord
ers)
46
.24
49.3
841.0
045.9
148.5
752.2
063.3
9
Ma
rket
Bu
y(%
of
Ma
rket
ord
ers)
55
.41
51.0
932.7
148.5
353.8
656.3
561.3
6
Exec
ute
do
rder
s(%
)6
3.0
958.8
736.3
156.4
360.8
062.4
377.0
9
Ord
ersi
ze8
43
.40
814.7
9113.6
1464.9
9700.1
21,0
76.3
02,9
72.8
0
Larg
eo
rder
(%)
0.6
20.2
80.0
00.0
00.1
30.3
82.0
1
Pan
elB
:O
rder
pa
ckag
esd
ata
set
Nu
mb
ero
fo
bse
rvati
on
s86,4
25
1543
138
396
1109
1900
8180
Bu
y(%
)3
8.5
239.9
313.7
533.6
440.8
244.8
163.0
4
Pa
cka
ge
size
2,6
10
.64
2,3
59.9
0272.0
21,3
41.2
02,1
57.4
03,0
80.2
08,4
09.4
0
Ord
ers
per
pack
ag
e3
.09
52.9
69
2.0
15
2.6
37
2.9
09
3.2
06
4.3
50
Exec
uti
on
rate
0.5
71
10.5
48
0.3
43
0.5
16
0.5
46
0.5
90
0.7
93
1332 M. Al-Suhaibani, L. Kryzanowski / Journal of Banking & Finance 24 (2000) 1323±1357
Pa
nel
C:
Qu
ote
sd
ata
set
Nu
mb
ero
fo
bse
rvati
on
s778,5
93
13,9
03
11,9
60
13,9
55
13,9
55
13,9
55
13,9
55
Avail
ab
ilit
yo
fim
med
iacy
(%)
97.6
697.6
680.7
597.6
7100.0
0100.0
0100.0
0
Insi
de
spre
ad
2.2
47
2.2
74
1.0
38
1.2
78
1.5
33
2.5
41
10.3
51
Qu
ote
mid
po
int
retu
rn(´
10
00)
)0.0
05
)0.0
15
0.0
02
0.0
05
0.0
08
0.0
19
Pa
nel
D:
Tra
nsa
ctio
ns
da
tase
t
Nu
mb
ero
fo
bse
rvati
on
s168,7
64
3,0
14
154
656
2,0
45
4,2
81
17,4
38
Tra
des
at
op
en(%
)8
.81
10.9
63.1
05.2
87.7
214.5
234.4
8
Tra
de
size
56
0.8
8518.7
852.0
3284.7
6483.5
8721.9
81,3
72.1
0
Tra
nsa
ctio
np
rice
26
7.3
09
1196.0
723.6
270.6
5111.8
1253.9
4959.1
7
Tra
de-
to-t
rad
ere
turn
(´1
00
0)
)0.1
14
)0.6
15
0.0
07
0.0
51
0.1
47
2.0
39
Pu
t-th
rou
gh
tra
des
(%)
0.1
50.1
00.0
00.0
00.0
00.1
31.0
4
aF
or
the
65
tra
din
gd
ay
so
ver
the
per
iod
bet
wee
nO
cto
ber
31,
1996
an
dJa
nu
ary
14,
1997,
the
®rs
tco
lum
nre
po
rts
vari
ou
so
rder
an
dtr
ad
ech
ara
c-
teri
stic
sa
fter
po
oli
ng
all
sto
cks.
Th
eo
ther
colu
mn
sre
po
rtth
ecr
oss
-sec
tio
nal
dis
trib
uti
on
of
thes
est
ati
stic
sacr
oss
the
56
sto
cks
inth
esa
mp
le.
All
the
rep
ort
edst
ati
stic
sa
rem
ean
va
lues
exce
pt
for
the
nu
mb
ero
fo
bse
rvati
on
san
dth
ep
erce
nta
ges
.T
he
size
stati
stic
sare
com
pu
ted
usi
ng
the
nu
mb
ero
f
share
s.T
he
larg
eo
rder
san
dp
ut-
thro
ugh
trad
esare
tho
sew
ith
vo
lum
esla
rger
than
SR
0.5
mil
lio
n.
Imm
edia
cyis
con
sid
ered
avail
ab
lew
hen
bo
thb
id
an
da
ska
rees
tab
lish
ed.
Insi
de
spre
ad
isth
ed
i�er
ence
bet
wee
nth
e®
rst
bes
task
an
dth
e®
rst
bes
tb
id.
Th
eq
uo
tem
idp
oin
tre
turn
sare
base
do
nth
een
d-
of-
min
ute
qu
ote
mid
po
ints
,w
hil
etr
ad
e-to
-tra
de
retu
rns
are
com
pu
ted
usi
ng
the
tim
ese
ries
of
tran
sact
ion
pri
ces.
Exec
uti
on
rate
isth
en
um
ber
of
share
s
tha
ta
re®
lled
div
ided
by
the
tota
ln
um
ber
of
sha
res
sub
mit
ted
as
ap
ack
age.
M. Al-Suhaibani, L. Kryzanowski / Journal of Banking & Finance 24 (2000) 1323±1357 1333

Tab
le3
Th
ere
lati
ve
spre
ad
sa
nd
dep
ths
inth
eb
oo
ka
Pan
elA
:T
he
rela
tive
spre
ad
sb
etw
een
succ
essi
vele
vels
of
the
lim
itord
erbook
(x
100)
Rel
ati
ve
spre
ad
B4±
B5
B3
±B
4B
2±B
3B
1±B
2A
1±B
1A
2±A
1A
3±A
2A
4±A
3A
5±A
4
Mea
n1
.27
11
.29
71.2
40
1.1
93
1.7
90
1.2
81
1.3
37
1.4
12
1.3
48
Med
ian
1.2
88
1.2
05
1.1
15
1.0
57
1.6
00
1.2
46
1.2
51
1.3
93
1.4
36
Pan
elB
:T
he
ave
rage
volu
mes
at
di�
eren
tle
vels
of
the
lim
itord
erbook
Dep
thB
5B
4B
3B
2B
1A
1A
2A
3A
4A
5
Mea
n4
39
45
74
18321
10,3
19
5616
4072
6926
6374
5672
4410
Med
ian
20
81
27
11
3370
3448
1910
1514
2764
2949
2665
2443
Pan
elC
:T
est
of
equ
ali
tyo
fsp
rea
ds
an
dd
epth
sa
cross
leve
lsin
the
ord
erbook
Hy
po
thes
isT
est
sta
tist
icC
alc
ula
ted
F-p
rob
ab
ilit
y
All
rela
tiv
esp
rea
ds
are
equ
al
F(8
,49
2)�
1.9
380
0.0
526
All
rela
tiv
esp
rea
ds
excl
ud
ing
insi
de
spre
ad
are
equ
al
F(7
,49
2)�
0.2
884
0.9
698
All
dep
ths
are
equ
al
F(9
,55
0)�
2.6
379
0.0
054
All
dep
ths
are
equ
al
(ex
clu
din
gth
ed
epth
sa
t
the
seco
nd
bes
tq
uo
tes)
F(7
,55
0)�
1.3
255
0.2
203
aU
sin
gth
eb
est
bid
sa
nd
ask
sa
nd
thei
ra
sso
cia
ted
dep
ths,
this
tab
lere
po
rts
the
mea
ns
an
dm
edia
ns
of
the
rela
tive
spre
ad
sb
etw
een
ad
jace
nt
qu
ote
san
d
the
qu
an
titi
eso
�er
edo
rd
ema
nd
eda
tth
ese
qu
ote
s.T
he
rep
ort
edd
epth
isth
eo
rigin
al
nu
mb
ero
fsh
are
sd
ivid
edb
y100.
Aan
dB
den
ote
ask
an
db
id,
resp
ecti
vel
y.
B1
isth
e®
rst
bes
tb
id,
an
dA
1±
B1
isth
ere
lati
ve
insi
de
spre
ad
[(®
rst
bes
task
±®
rst
bes
tb
id)/
Qu
ote
mid
po
int]
tim
es100.
Th
eq
uo
te
mid
po
int
isca
lcu
late
das
(®rs
tb
est
ask
+®
rst
bes
tb
id)/
2.
1334 M. Al-Suhaibani, L. Kryzanowski / Journal of Banking & Finance 24 (2000) 1323±1357
spread for major market indices for ®fteen countries and ®nds that the medianrelative spread equals 0.65%. The relative tick size, as is shown in the nextsection, is the major contributing factor to this high relative spread. The rel-ative inside spread is larger than all other relative spreads on either side of thebook. The other relative spreads are moderately constant. In contrast, theaverage numbers of shares at the ®rst best quote are small (and the smallest onthe ask side), are the largest at the second best quote, and decrease beyond thesecond quotes. 26
Based on the test results reported in Panel C, the hypotheses that all relativespreads and all depths are equal are rejected, but not rejected when we excludethe inside relative spread, and the depth at the second quotes. 27 The liquidityprovision is greater on the bid side. On average, depths are larger and relativespreads are smaller on the bid side.
Our results lie somewhat between those of Biais et al. (1994) and Niemeyerand Sand�as (1995). Using data from the Paris Bourse, Biais et al. ®nd thatthe order book is slightly concave, with an inside spread more than twice aslarge as the di�erence between the other levels of the book (which is similarto our results). They also ®nd that the volumes o�ered or demanded at the®rst best quotes are smaller than the volumes further away from the bestlevels. In contrast, Niemeyer and Sand�as ®nd that the order book on theStockholm Stock Exchange is convex. Spreads are wider further away fromthe inside spread, and volumes are larger close to the inside spread. In fact,they ®nd as we do that the average volumes at the second best quote are thelargest.
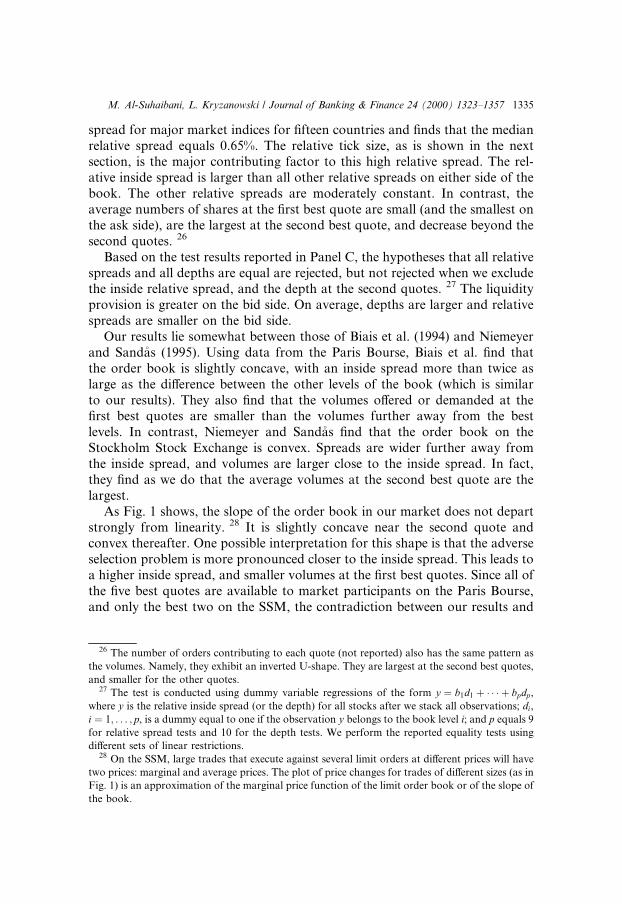
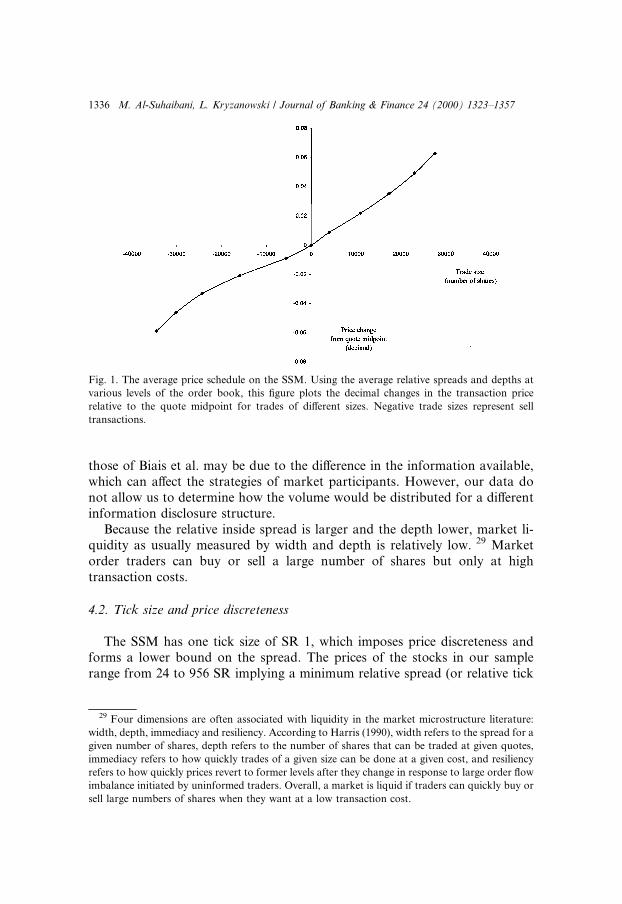
As Fig. 1 shows, the slope of the order book in our market does not departstrongly from linearity. 28 It is slightly concave near the second quote andconvex thereafter. One possible interpretation for this shape is that the adverseselection problem is more pronounced closer to the inside spread. This leads toa higher inside spread, and smaller volumes at the ®rst best quotes. Since all ofthe ®ve best quotes are available to market participants on the Paris Bourse,and only the best two on the SSM, the contradiction between our results and
26 The number of orders contributing to each quote (not reported) also has the same pattern as
the volumes. Namely, they exhibit an inverted U-shape. They are largest at the second best quotes,
and smaller for the other quotes.27 The test is conducted using dummy variable regressions of the form y � b1d1 � � � � � bpdp,
where y is the relative inside spread (or the depth) for all stocks after we stack all observations; di,
i � 1; . . . ; p, is a dummy equal to one if the observation y belongs to the book level i; and p equals 9
for relative spread tests and 10 for the depth tests. We perform the reported equality tests using
di�erent sets of linear restrictions.28 On the SSM, large trades that execute against several limit orders at di�erent prices will have
two prices: marginal and average prices. The plot of price changes for trades of di�erent sizes (as in
Fig. 1) is an approximation of the marginal price function of the limit order book or of the slope of
the book.
M. Al-Suhaibani, L. Kryzanowski / Journal of Banking & Finance 24 (2000) 1323±1357 1335
those of Biais et al. may be due to the di�erence in the information available,which can a�ect the strategies of market participants. However, our data donot allow us to determine how the volume would be distributed for a di�erentinformation disclosure structure.
Because the relative inside spread is larger and the depth lower, market li-quidity as usually measured by width and depth is relatively low. 29 Marketorder traders can buy or sell a large number of shares but only at hightransaction costs.
4.2. Tick size and price discreteness
The SSM has one tick size of SR 1, which imposes price discreteness andforms a lower bound on the spread. The prices of the stocks in our samplerange from 24 to 956 SR implying a minimum relative spread (or relative tick
Fig. 1. The average price schedule on the SSM. Using the average relative spreads and depths at
various levels of the order book, this ®gure plots the decimal changes in the transaction price
relative to the quote midpoint for trades of di�erent sizes. Negative trade sizes represent sell
transactions.
29 Four dimensions are often associated with liquidity in the market microstructure literature:
width, depth, immediacy and resiliency. According to Harris (1990), width refers to the spread for a
given number of shares, depth refers to the number of shares that can be traded at given quotes,
immediacy refers to how quickly trades of a given size can be done at a given cost, and resiliency
refers to how quickly prices revert to former levels after they change in response to large order ¯ow
imbalance initiated by uninformed traders. Overall, a market is liquid if traders can quickly buy or
sell large numbers of shares when they want at a low transaction cost.
1336 M. Al-Suhaibani, L. Kryzanowski / Journal of Banking & Finance 24 (2000) 1323±1357

size� 1/price) between 4.21% and 0.1%. The median relative tick size is 0.9%which is relatively large compared to the median relative tick size for majorstock markets. Using data for 2517 stocks that constitute the majority of thecapitalization in the world equity market, Angel (1997) ®nds that the medianrelative tick size is equal to 0.259%.
Theoretically, a large tick size encourages limit order traders to provide li-quidity to the market, and imposes higher transaction costs on market ordertraders. Given the price and time priority rules, the limit order trader has a ®rstmover advantage only if the tick size is large enough to prevent quotematching. 30 If the tick size is small, then the quote matcher obtains timeprecedence by submitting an order at a price slightly better than the standingquote.
Based on the summary statistics on tick size reported in Table 4, 53.77% ofthe inside spreads are binding (the inside spread equals one tick), 22.48%equal two ticks, and 23.75% equal three or more ticks. Tick size is moreimportant for lower priced stocks. The tick size is binding for 76.7% of theobservations for stocks in the lowest price category, and for only 25.86% ofthe stocks in the highest price category. In unreported results, we ®nd that themajority of the other spreads are binding even for highly priced stocks. Thelast row of Table 4 supports the assertion that large tick size encourages limitorder traders to provide liquidity to the market. The percentage of limit or-ders submitted to the market increases as the relative tick size increases. Thismight suggest that a larger tick induces liquidity. A larger tick however in-creases transaction costs for market order traders, which may reduce overallliquidity for stocks. The optimal tick, as Angel (1997) concludes, is not zero.Its optimal size represents a trade-o� between the bene®ts of a nonzero tickfor limit order traders and the cost that a tick imposes on market ordertraders.
4.3. Availability of immediacy
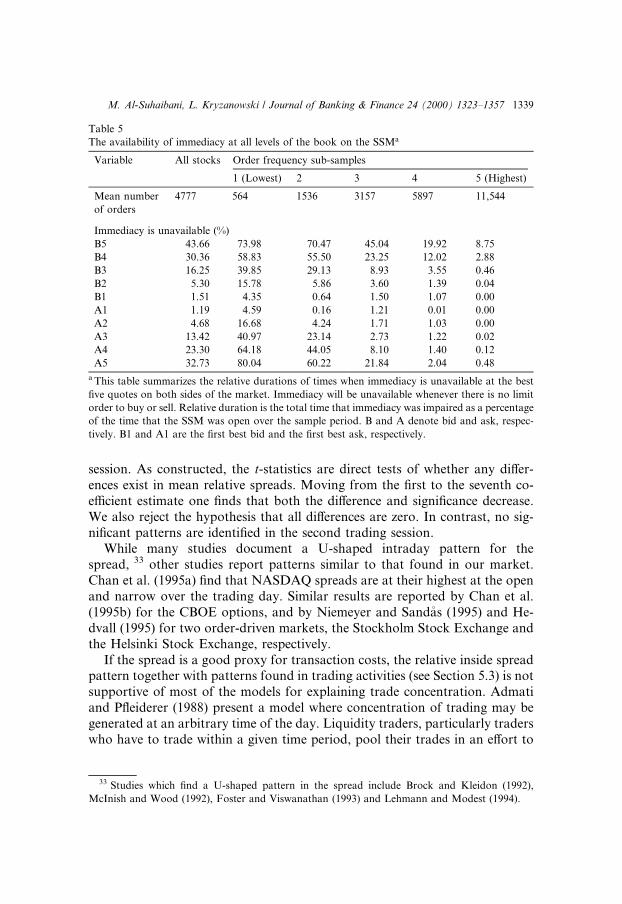
Immediacy is available in the market when a market order can be in-stantaneously executed. In an order-driven market as the SSM, the avail-ability of immediacy depends upon the limit order traders. Immediacy will beunavailable if no public limit orders are present. Table 5 summarizes thepercentages of time when immediacy is unavailable at all levels of the book.Despite the absence of market makers, market liquidity measured by im-mediacy is notably high. On average, the immediacy at the ®rst best bidand ask is unavailable for only 1.51% and 1.19% of the total trading time,
30 Quote-matchers are traders whose willingness to supply liquidity depends on the limit orders
of other liquidity suppliers. Harris (1990) discusses the quote-matcher problem in detail.
M. Al-Suhaibani, L. Kryzanowski / Journal of Banking & Finance 24 (2000) 1323±1357 1337

respectively. 31 As expected, most active stocks have even lower percentages.The di�erence between the ®ve categories becomes more evident as we moveaway from the ®rst best quotes.
4.4. Intraday pattern in the order book
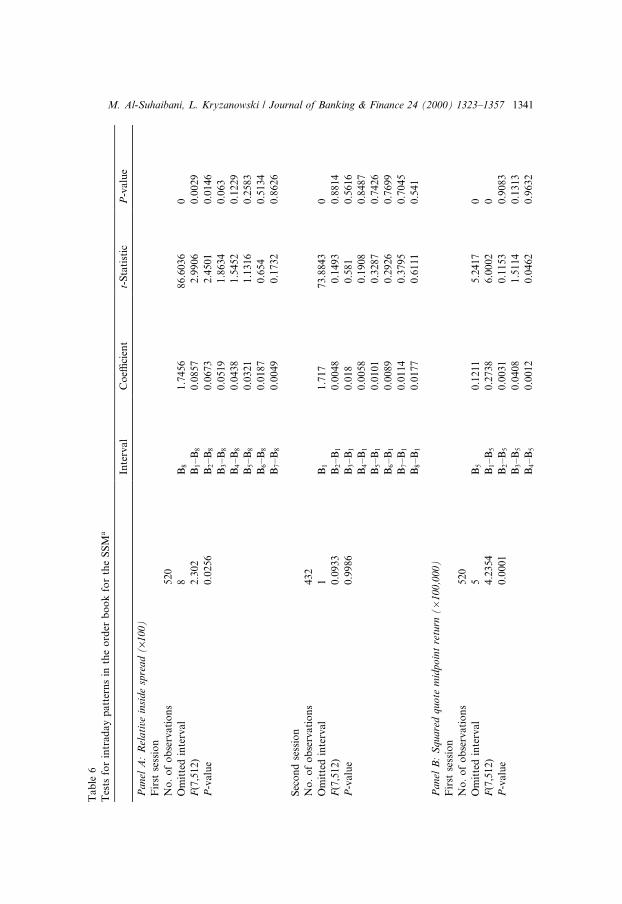
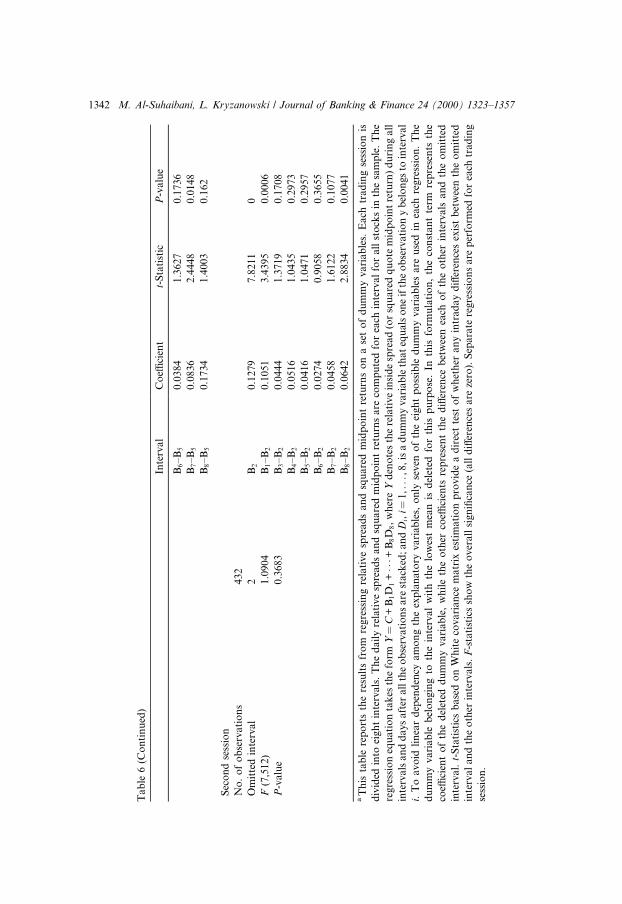
In this section we examine the intraday patterns in the relative inside spread,depth and the squared quote midpoint return. 32 As shown in Fig. 2, the rel-ative inside spread decreases over the ®rst trading session, and is fairly constantover the second. The test results reported in Panel A of Table 6 support thisresult. In the ®rst session, the last trading interval has the lowest relative spread(1.74%). The regression is constructed so that the slopes represent the di�erencebetween the mean relative spread in this interval and the other intervals in the
Table 4
Tick size statistics for the SSMa
Variable All
stocks
Price level sub-samples
1 (Lowest) 2 3 4 5 (Highest)
Number of quotes at all
levels (in millions)
5.688 0.913 1.111 1.120 1.255 1.164
Quote midpoint range 23.62 to
956.15
23.62 to
64.71
64.71 to
93.48
93.48 to
167.71
167.71 to
329.57
329.57 to
956.15
Average quote midpoint 195.27 46.37 77.94 118.72 226.32 469.73
Inside spreads that equal
one tick (%)
53.77 76.70 62.10 52.77 52.09 25.86
Inside spreads that equal
2 ticks (%)
22.48 16.89 21.98 25.34 25.97 21.97
Inside spreads that equal
3 or more ticks (%)
23.75 6.41 15.91 21.89 21.93 52.17
Spread (in ticks) 2.278 1.336 1.825 1.965 2.193 4.196
Relative inside spread 1.79% 3.12% 2.27% 1.70% 1.02% 0.91%
Relative tick size 1.04% 2.38% 1.30% 0.87% 0.46% 0.22%
Limit order (%) 59.4 64.2 61.4 60.9 58.1 56.8
a This table presents statistics on tick sizes on the SSM. The statistics are computed for all 56 stocks
in the sample and for ®ve sub-samples classi®ed by the mean of stock price during the sample
period. We classify the sample using price because the tick is constant and equal to SR 1 for all
stocks, which implies that the relative tick size can be measured by the inverse of price. Since the
tick size is one, the spread (in ticks) is the same as the observed spread in the market. The relative
inside spread is (®rst best ask ± ®rst best bid)/quote midpoint. Quote midpoint� (®rst best
ask + ®rst best bid)/2. The relative tick size is 1/quote midpoint. Limit order is the percentage of
limit orders to the total number of orders.
31 We should keep in mind that these statistics are for the more active stocks in the market since
we eliminated the most thinly traded stocks from our sample.32 The quote midpoint is the average of the best bid and ask quotes.
1338 M. Al-Suhaibani, L. Kryzanowski / Journal of Banking & Finance 24 (2000) 1323±1357
session. As constructed, the t-statistics are direct tests of whether any di�er-ences exist in mean relative spreads. Moving from the ®rst to the seventh co-e�cient estimate one ®nds that both the di�erence and signi®cance decrease.We also reject the hypothesis that all di�erences are zero. In contrast, no sig-ni®cant patterns are identi®ed in the second trading session.
While many studies document a U-shaped intraday pattern for thespread, 33 other studies report patterns similar to that found in our market.Chan et al. (1995a) ®nd that NASDAQ spreads are at their highest at the openand narrow over the trading day. Similar results are reported by Chan et al.(1995b) for the CBOE options, and by Niemeyer and Sand�as (1995) and He-dvall (1995) for two order-driven markets, the Stockholm Stock Exchange andthe Helsinki Stock Exchange, respectively.
If the spread is a good proxy for transaction costs, the relative inside spreadpattern together with patterns found in trading activities (see Section 5.3) is notsupportive of most of the models for explaining trade concentration. Admatiand P¯eiderer (1988) present a model where concentration of trading may begenerated at an arbitrary time of the day. Liquidity traders, particularly traderswho have to trade within a given time period, pool their trades in an e�ort to
Table 5
The availability of immediacy at all levels of the book on the SSMa
Variable All stocks Order frequency sub-samples
1 (Lowest) 2 3 4 5 (Highest)
Mean number
of orders
4777 564 1536 3157 5897 11,544
Immediacy is unavailable (%)
B5 43.66 73.98 70.47 45.04 19.92 8.75
B4 30.36 58.83 55.50 23.25 12.02 2.88
B3 16.25 39.85 29.13 8.93 3.55 0.46
B2 5.30 15.78 5.86 3.60 1.39 0.04
B1 1.51 4.35 0.64 1.50 1.07 0.00
A1 1.19 4.59 0.16 1.21 0.01 0.00
A2 4.68 16.68 4.24 1.71 1.03 0.00
A3 13.42 40.97 23.14 2.73 1.22 0.02
A4 23.30 64.18 44.05 8.10 1.40 0.12
A5 32.73 80.04 60.22 21.84 2.04 0.48
a This table summarizes the relative durations of times when immediacy is unavailable at the best
®ve quotes on both sides of the market. Immediacy will be unavailable whenever there is no limit
order to buy or sell. Relative duration is the total time that immediacy was impaired as a percentage
of the time that the SSM was open over the sample period. B and A denote bid and ask, respec-
tively. B1 and A1 are the ®rst best bid and the ®rst best ask, respectively.
33 Studies which ®nd a U-shaped pattern in the spread include Brock and Kleidon (1992),
McInish and Wood (1992), Foster and Viswanathan (1993) and Lehmann and Modest (1994).
M. Al-Suhaibani, L. Kryzanowski / Journal of Banking & Finance 24 (2000) 1323±1357 1339

reduce their transaction costs. Informed traders, in an attempt to hide theirtrading intentions, also trade at the same time. The model predicts that tradedvolume should be highest when transaction costs are lowest. Similarly, Brockand Kleidon (1992) conjecture that periodic market closure results in greaterliquidity demand at the open and close. In response, liquidity suppliers maypractice price discrimination by changing their quotes during these periods ofhigh demand. This model implies high transaction volumes and concurrentwide spreads at both the open and close.
Fig. 2. Intraday patterns in the order book. This ®gure reports the intraday relative inside spreads
and squared quote midpoint returns. Each trading session is divided into eight intervals, and the
daily relative spread and squared midpoint return are computed for each interval for all stocks in
the sample. The bars are the averages over the 65 days in the sample. The relative inside
spread� (best ask ) best bid)/QMP, where QMP denotes quote midpoint� (best ask + best bid)/2.
The quote midpoint return is calculated as log(QMPt) ) log(QMPtÿ1). (a) Intraday relative spread.
(b) Intraday squared return (´100,000).
1340 M. Al-Suhaibani, L. Kryzanowski / Journal of Banking & Finance 24 (2000) 1323±1357
Tab
le6
Tes
tsfo
rin
trad
ay
pa
tter
ns
inth
eo
rder
bo
ok
for
the
SS
Ma
Inte
rval
Co
e�ci
ent
t-S
tati
stic
P-v
alu
e
Pan
elA
:R
ela
tive
insi
de
spre
ad
(´1
00
)
Fir
stse
ssio
n
No
.o
fo
bse
rva
tio
ns
52
0
Om
itte
din
terv
al
8B
81.7
456
86.6
036
0
F(7
,51
2)
2.3
02
B1±B
80.0
857
2.9
906
0.0
029
P-v
alu
e0
.02
56
B2±B
80.0
673
2.4
501
0.0
146
B3±B
80.0
519
1.8
634
0.0
63
B4±B
80.0
438
1.5
452
0.1
229
B5±B
80.0
321
1.1
316
0.2
583
B6±B
80.0
187
0.6
54
0.5
134
B7±B
80.0
049
0.1
732
0.8
626
Sec
on
dse
ssio
n
No
.o
fo
bse
rva
tio
ns
43
2
Om
itte
din
terv
al
1B
11.7
17
73.8
843
0
F(7
,51
2)
0.0
933
B2±B
10.0
048
0.1
493
0.8
814
P-v
alu
e0
.99
86
B3±B
10.0
18
0.5
81
0.5
616
B4±B
10.0
058
0.1
908
0.8
487
B5±B
10.0
101
0.3
287
0.7
426
B6±B
10.0
089
0.2
926
0.7
699
B7±B
10.0
114
0.3
795
0.7
045
B8±B
10.0
177
0.6
111
0.5
41
Pan
elB
:S
qu
are
dq
uo
tem
idpo
int
retu
rn(�1
00
,00
0)
Fir
stse
ssio
n
No
.o
fo
bse
rva
tio
ns
52
0
Om
itte
din
terv
al
5B
50.1
211
5.2
417
0
F(7
,51
2)
4.2
354
B1±B
50.2
738
6.0
002
0
P-v
alu
e0
.00
01
B2±B
50.0
031
0.1
153
0.9
083
B3±B
50.0
408
1.5
114
0.1
313
B4±B
50.0
012
0.0
462
0.9
632
M. Al-Suhaibani, L. Kryzanowski / Journal of Banking & Finance 24 (2000) 1323±1357 1341
Ta
ble
6(C
on
tin
ued
)
Inte
rval
Co
e�ci
ent
t-S
tati
stic
P-v
alu
e
B6±B
50.0
384
1.3
627
0.1
736
B7±B
50.0
836
2.4
448
0.0
148
B8±B
50.1
734
1.4
003
0.1
62
Sec
on
dse
ssio
n
No
.o
fo
bse
rvati
on
s432
Om
itte
din
terv
al
2B
20.1
279
7.8
211
0
F(7
,51
2)
1.0
904
B1±B
20.1
051
3.4
395
0.0
006
P-v
alu
e0
.36
83
B3±B
20.0
444
1.3
719
0.1
708
B4±B
20.0
516
1.0
435
0.2
973
B5±B
20.0
416
1.0
471
0.2
957
B6±B
20.0
274
0.9
058
0.3
655
B7±B
20.0
458
1.6
122
0.1
077
B8±B
20.0
642
2.8
834
0.0
041
aT
his
tab
lere
po
rts
the
resu
lts
fro
mre
gre
ssin
gre
lati
ve
spre
ad
san
dsq
uare
dm
idp
oin
tre
turn
so
na
set
of
du
mm
yvari
ab
les.
Each
trad
ing
sess
ion
is
div
ided
into
eig
ht
inte
rva
ls.
Th
ed
ail
yre
lati
ve
spre
ad
san
dsq
uare
dm
idp
oin
tre
turn
sare
com
pu
ted
for
each
inte
rval
for
all
sto
cks
inth
esa
mp
le.
Th
e
reg
ress
ion
equ
ati
on
tak
esth
efo
rmY�
C+
B1D
1+���+
B8D
8,
wh
ere
Yd
eno
tes
the
rela
tive
insi
de
spre
ad
(or
squ
are
dq
uo
tem
idp
oin
tre
turn
)d
uri
ng
all
inte
rva
lsa
nd
da
ys
aft
era
llth
eo
bse
rva
tio
ns
are
sta
cked
;an
dD
i,i�
1,.
..,8
,is
ad
um
my
vari
ab
leth
at
equ
als
on
eif
the
ob
serv
ati
on
yb
elo
ngs
toin
terv
al
i.T
oa
vo
idli
nea
rd
epen
den
cya
mo
ng
the
exp
lan
ato
ryvari
ab
les,
on
lyse
ven
of
the
eigh
tp
oss
ible
du
mm
yvari
ab
les
are
use
din
each
regre
ssio
n.
Th
e
du
mm
yvari
ab
leb
elo
ngin
gto
the
inte
rval
wit
hth
elo
wes
tm
ean
isd
elet
edfo
rth
isp
urp
ose
.In
this
form
ula
tio
n,
the
con
stan
tte
rmre
pre
sen
tsth
e
coe�
cien
to
fth
ed
elet
edd
um
my
va
riab
le,
wh
ile
the
oth
erco
e�ci
ents
rep
rese
nt
the
di�
eren
ceb
etw
een
each
of
the
oth
erin
terv
als
an
dth
eo
mit
ted
inte
rva
l.t-
Sta
tist
ics
ba
sed
on
Wh
ite
cov
ari
an
cem
atr
ixes
tim
ati
on
pro
vid
ea
dir
ect
test
of
wh
eth
eran
yin
trad
ay
di�
eren
ces
exis
tb
etw
een
the
om
itte
d
inte
rval
an
dth
eo
ther
inte
rvals
.F
-sta
tist
ics
sho
wth
eo
ver
all
sign
i®ca
nce
(all
di�
eren
ces
are
zero
).S
epara
tere
gre
ssio
ns
are
per
form
edfo
rea
chtr
ad
ing
sess
ion
.
1342 M. Al-Suhaibani, L. Kryzanowski / Journal of Banking & Finance 24 (2000) 1323±1357
However, the observed spread pattern for the SSM can be explained usingthe model of Madhavan (1992). The high spread in the morning is due togreater uncertainty. As information asymmetries are partially resolved, tradersbecome informed by observing the market. This leads to a decline in the spreadduring the day. The explanation o�ered by Chan et al. (1995b) attributes such aspread pattern to the absence of specialist market power.
We use the squared midpoint quote returns as a measure of stock returnvolatility. As shown in Fig. 2 and the regression results reported in Panel B ofTable 6, volatility is at its highest during the ®rst trading interval, followed bythe last trading interval before the close. 34 Considered in isolation, this ®ndingis consistent with the information-based model of Admati and P¯eiderer(1988), which predicts that high volume periods have more informative andhence more volatile prices. No signi®cant patterns are identi®ed for the numberof shares and volume for the ®rst best quotes.
5. Order ¯ow dynamics on the SSM
In this section, we investigate the dynamics of order ¯ow on the SSM. Wecondition our analysis on order direction (buy or sell), price position, state ofthe book, and time of the day.
5.1. Order ¯ow and the limit price position
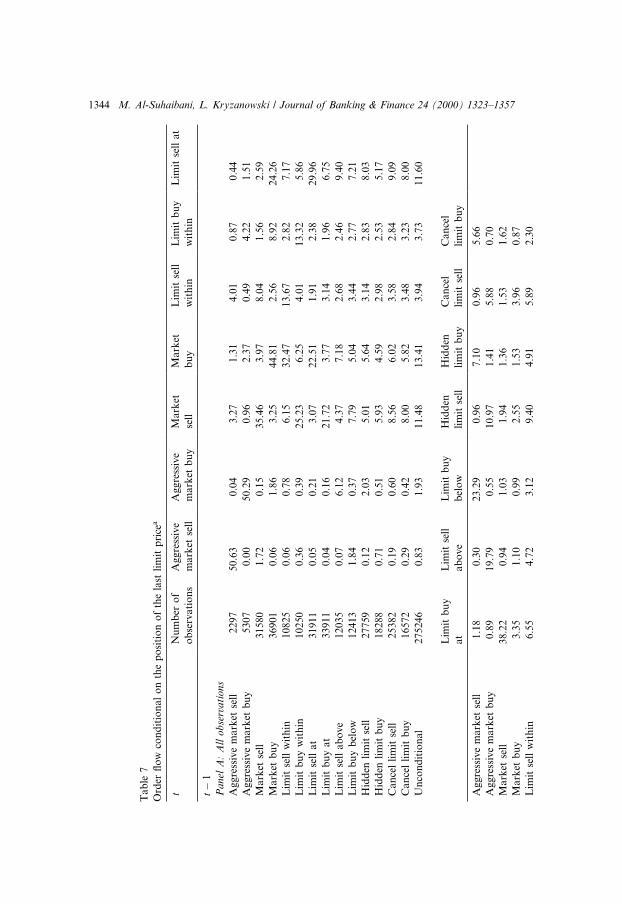
We divide the orders into 14 categories (or events) based on limit priceposition. On the buy side, the price position of a buy order may be above theprevailing ask (aggressive market buy), at the prevailing ask (market buy),within the existing spread (limit buy within), at the prevailing bid (limit buy at),below the prevailing bid but above or at the second bid (limit buy below), andbelow the second bid (hidden limit buy). The last event is the cancelation of apreviously posted limit buy. Orders on the sell side are categorized similarly.The frequency of each occurrence is documented in the last row of Table 7.With regard to market orders, the most frequent events are market sell and buyorders (11.48% and 13.41%, respectively). The frequency of aggressive orders isvery small. On the limit order side, the most frequent events are limit orders atprevailing quotes.
In Table 7, the columns correspond to an event at time t, and the rows toevents at time t ) 1. Each row reports the percent frequency of each of the
34 The U-shaped pattern in volatility is documented for other markets by Wood et al. (1985),
Harris (1986), McInish and Wood (1992), Foster and Viswanathan (1993), and Lehmann and
Modest (1994).
M. Al-Suhaibani, L. Kryzanowski / Journal of Banking & Finance 24 (2000) 1323±1357 1343
Ta
ble
7
Ord
er¯
ow
con
dit
ion
al
on
the
po
siti
on
of
the
last
lim
itp
rice
a
tN
um
ber
of
ob
serv
ati
on
s
Aggre
ssiv
e
mark
etse
ll
Aggre
ssiv
e
mark
etb
uy
Mark
et
sell
Mark
et
bu
y
Lim
itse
ll
wit
hin
Lim
itb
uy
wit
hin
Lim
itse
llat
tÿ1
Pa
nel
A:
All
ob
serv
ati
on
s
Ag
gre
ssiv
em
ark
etse
ll2
29
75
0.6
30.0
43.2
71.3
14.0
10.8
70.4
4
Ag
gre
ssiv
em
ark
etb
uy
53
07
0.0
050.2
90.9
62.3
70.4
94.2
21.5
1
Ma
rket
sell
31
580
1.7
20.1
535.4
63.9
78.0
41.5
62.5
9
Ma
rket
bu
y3
69
01
0.0
61.8
63.2
544.8
12.5
68.9
224.2
6
Lim
itse
llw
ith
in1
08
25
0.0
60.7
86.1
532.4
713.6
72.8
27.1
7
Lim
itb
uy
wit
hin
10
250
0.3
60.3
925.2
36.2
54.0
113.3
25.8
6
Lim
itse
lla
t3
19
11
0.0
50.2
13.0
722.5
11.9
12.3
829.9
6
Lim
itb
uy
at
33
911
0.0
40.1
621.7
23.7
73.1
41.9
66.7
5
Lim
itse
lla
bo
ve
12
035
0.0
76.1
24.3
77.1
82.6
82.4
69.4
0
Lim
itb
uy
bel
ow
12
413
1.8
40.3
77.7
95.0
43.4
42.7
77.2
1
Hid
den
lim
itse
ll2
77
59
0.1
22.0
35.0
15.6
43.1
42.8
38.0
3
Hid
den
lim
itb
uy
18
288
0.7
10.5
15.9
34.5
92.9
82.5
35.1
7
Ca
nce
lli
mit
sell
25
382
0.1
90.6
08.5
66.0
23.5
82.8
49.0
9
Ca
nce
lli
mit
bu
y1
65
72
0.2
90.4
28.0
05.8
23.4
83.2
38.0
0
Un
con
dit
ion
al
27
524
60.8
31.9
311.4
813.4
13.9
43.7
311.6
0
Lim
itb
uy
at
Lim
itse
ll
ab
ove
Lim
itb
uy
bel
ow
Hid
den
lim
itse
ll
Hid
den
lim
itb
uy
Can
cel
lim
itse
ll
Can
cel
lim
itb
uy
Ag
gre
ssiv
em
ark
etse
ll1
.18
0.3
023.2
90.9
67.1
00.9
65.6
6
Ag
gre
ssiv
em
ark
etb
uy
0.8
91
9.7
90.5
510.9
71.4
15.8
80.7
0
Ma
rket
sell
38
.22
0.9
41.0
31.9
41.3
61.5
31.6
2
Ma
rket
bu
y3
.35
1.1
00.9
92.5
51.5
33.9
60.8
7
Lim
itse
llw
ith
in6
.55
4.7
23.1
29.4
04.9
15.8
92.3
0
1344 M. Al-Suhaibani, L. Kryzanowski / Journal of Banking & Finance 24 (2000) 1323±1357

Lim
itb
uy
wit
hin
8.7
83.4
77.0
68.1
38.5
75.6
83.0
8
Lim
itse
lla
t5
.61
4.6
83.3
58.8
24.0
811.5
61.8
3
Lim
itb
uy
at
22
.06
3.3
66.7
78.6
75.9
87.2
98.4
1
Lim
itse
lla
bo
ve
7.4
71
7.5
74.1
517.0
35.5
715.0
976
0.8
475
Lim
itb
uy
bel
ow
12
.28
3.8
913.4
310.0
613.7
31.4
516.7
0
Hid
den
lim
itse
ll7
.38
5.8
64.1
326.4
66.5
721.8
60.9
5
Hid
den
lim
itb
uy
6.5
63.0
66.0
49.6
521.7
70.8
829.6
0
Ca
nce
lli
mit
sell
8.4
55.3
14.2
415.3
05.4
527.3
43.1
8
Ca
nce
lli
mit
bu
y1
1.2
43.9
67.5
210.4
216.7
03.5
017.6
2
Un
con
dit
ion
al
12
.32
4.3
74.5
110.0
96.6
59.2
26.0
1
Pa
nel
B:
Dia
go
na
lp
erce
nt
freq
uen
cies
inth
esu
b-s
am
ple
s
Nu
mb
ero
f
ob
serv
ati
on
s
Aggre
ssiv
e
mark
etse
ll
Aggre
ssiv
e
mark
etb
uy
Mark
et
sell
Mark
et
bu
y
Lim
itse
ll
wit
hin
Lim
itb
uy
win
thin
Lim
itse
llat
Th
esa
me
tra
der
79
62
78
6.9
288.9
473.5
277.1
943.9
251.4
622.8
2
Di�
eren
ttr
ad
ers
195563
2.7
310.4
12.8
38.8
14.7
94.2
031.1
3
Lim
itb
uy
at
Lim
itse
ll
ab
ove
Lim
itb
uy
bel
ow
Hid
den
lim
itse
ll
Hid
den
lim
itb
uy
Can
cel
lim
itse
ll
Can
cel
lim
itb
uy
Th
esa
me
tra
der
30
.21
12.2
48.5
30.4
527.1
18.7
517.1
6
Di�
eren
ttr
ad
ers
20.7
919.1
815.2
124.5
717.7
228.3
317.7
1
aF
or
all
trad
ing
days
an
dst
ock
s,th
ista
ble
rep
ort
sth
eem
pir
ical
per
cen
tfr
equ
enci
esfo
r14
even
tsre
late
dto
lim
itp
rice
po
siti
on
,co
nd
itio
nal
on
the
pre
vio
us
even
t.T
he
even
tsa
rea
sth
eya
red
e®n
edin
Sec
tio
n5.1
.R
ow
sco
rres
po
nd
toev
ents
at
tim
etÿ
1,
an
dco
lum
ns
corr
esp
on
dto
even
tsat
tim
et.
Ea
chro
wa
dd
su
pto
10
0%
.
M. Al-Suhaibani, L. Kryzanowski / Journal of Banking & Finance 24 (2000) 1323±1357 1345

twelve events conditional on the event in that row. The table supports the``diagonal e�ect'' found in Biais et al. (1995) that the probability that a givenevent will occur is larger after this event has just occurred than it would beunconditionally. For example, market sell (buy) orders are most frequent aftermarket sell (buy) orders. 35 Biais et al. put forward three explanations for thiscorrelation. First, the succession of identical types of orders could re¯ectstrategic order splitting, either to reduce the market impact of a non-infor-mational trade, or to get the most from private information about the value ofthe stock. Second, if di�erent traders are imitating each other, the cause of thecorrelation is the order ¯ow itself. Finally, traders could react similarly to thesame events related to a particular stock or the economy as a whole.
Since our data sets do not identify traders, we cannot explicitly investigatethe three hypotheses concerning individual order submission behavior. How-ever, we know that orders originating from the same order package certainlybelong to one trader, and this allows us to infer a subset of orders belonging tothe same trader. The fraction of observations where the same trader acted intwo subsequent events is 28.94% of all of the order ¯ow events. 36 If the order-splitting hypothesis is the dominant factor in explaining order ¯ow correlation,then we should observe higher percentages of subsequent events that areinitiated by the same trader. This is indeed the case as shown in Panel B inTable 7. The percentages of the same trader subsequent events are larger formost events, which indicates that the ``diagonal e�ect'' is more common in thesame trader subset. Hedvall and Niemeyer (1996) use a data set from theHelsinki Stock Exchange that includes dealer identities and ®nd, as in ourmarket, that strategic order splitting is more common than imitation. Further,the imitation hypothesis cannot explain the diagonal e�ect in hidden orders.Since the traders have no incentive to split hidden orders, the only possibleexplanation is traders reacting to similar information events.
The diagonal e�ect in the case of limit orders within the best quotes, notconditional on trader identity, has been explained by the undercutting andoverbidding behavior of traders competing to supply liquidity to the market(Biais et al., 1995). The results in Panel B of Table 7 do not support this ex-planation. The gradual narrowing of the spread, as a result of placing quoteswithin the spread, comes mainly from the same trader and not from compe-
35 The diagonal e�ect is present beyond one lag. When we account for additional lags, we ®nd
similar e�ects.36 Given the limited information concerning trader identi®cation for our data set, the frequencies
of subsequent order events on di�erent sides of the market from one trader are always zero. In
reality, these frequencies may not be zero. However, the fact that market regulation does not match
and execute two orders if they are generated from the same trader makes this possibility less likely.
One trader can make a market in one or more stocks by posting limit orders on both sides of the
market, but he can not make a false market by executing his market orders against his limit orders.
1346 M. Al-Suhaibani, L. Kryzanowski / Journal of Banking & Finance 24 (2000) 1323±1357
tition between di�erent traders. However, the succession of cancelation isconsistent with the explanation that traders imitate each other or react simi-larly to the same events.
Based on Panel A of Table 7, we ®nd that market buys (sells) are excep-tionally frequent after asks (bids) at and within the best quotes. Traders preferto wait for additional liquidity to be provided, and preferably at a better price,before deciding to trade. In contrast, limit orders to buy (sell) at the quotes areparticularly frequent after market sell (buy) orders. Since a market sell (buy)order consumes the existing liquidity and may lead to a downward (upward)shift in the book, the observed behavior may re¯ect competition between limitorder traders to restore liquidity. Market liquidity in terms of resiliency isconsiderable.
Several other observations are consistent with information e�ects in theorder process. After aggressive and market sell (buy) orders, there are oftennew limit sell (buy) orders placed within the quotes. Furthermore, limit buy(sell) orders placed away from the quote and cancelations on the buy (sell) sideof the book are more frequent after aggressive market sell (buy) orders. Theorder book tends to shift downward (upward) after aggressive market sell (buy)orders. This behavior could re¯ect the adjustment in market expectations to theinformation content of these trades. Biais et al. observe a similar e�ect afterlarge trades, and attribute their observation to the information e�ect.
Using v2 tests for the signi®cance of the equality between the conditionaland unconditional probability for all stocks, we reject the hypothesis at the 1%level.
5.2. Order ¯ow and the state of the order book
Table 8 reports the probabilities of di�erent types of orders and trades oc-curring given the previous state of the book. The state of the book is sum-marized by the size of the inside bid±ask spread and the depth at the ®rst bestquotes. Both the spread and depth for a given stock are de®ned to be large(small) when they are larger (smaller) than their respective time series mediansover the sample period. Consistent with earlier theoretical and empirical®ndings for order ¯ow, market orders occur more frequently when the spread istight. Limit orders occur within the spread more frequently when the spread islarge. Limit orders ``o�er liquidity when it is scarce'' and market orders``consume it when it is plentiful'' (Biais et al., 1995).
Limit orders within the spread occur more frequently when the depth at thequote is large, and limit orders at the quotes are relatively more frequent whenthe depth is small. Given the price and time priority rules, the only way toincrease the probability of execution when the depth is large (and especiallywhen the spread is large) is to undercut or overbid the best quote. Based on v2
M. Al-Suhaibani, L. Kryzanowski / Journal of Banking & Finance 24 (2000) 1323±1357 1347
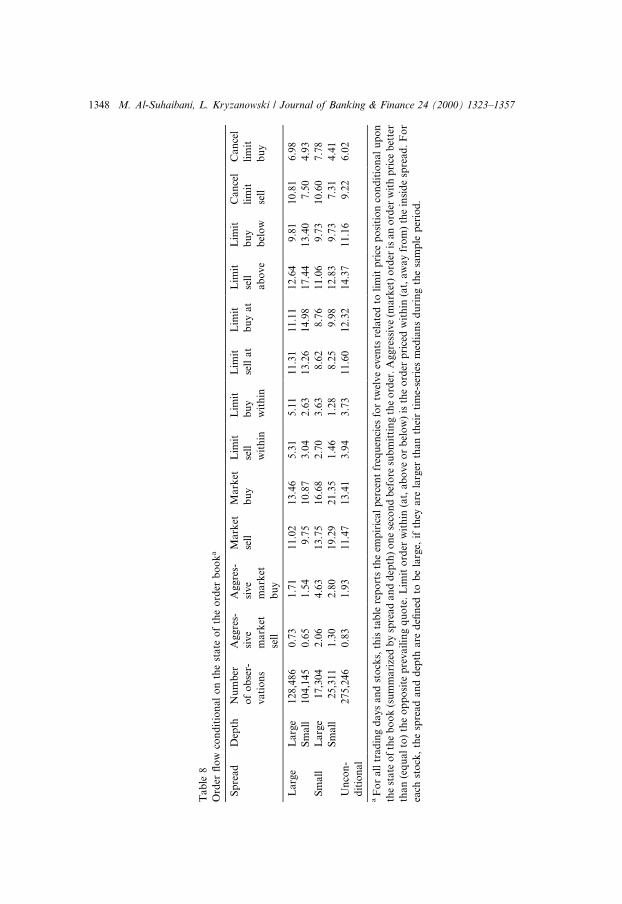
Tab
le8
Ord
er¯
ow
con
dit
ion
al
on
the
sta
teo
fth
eo
rder
bo
ok
a
Sp
read
Dep
thN
um
ber
of
ob
ser-
va
tio
ns
Ag
gre
s-
siv
e
ma
rket
sell
Ag
gre
s-
siv
e
ma
rket
bu
y
Mark
et
sell
Mark
et
bu
y
Lim
it
sell
wit
hin
Lim
it
bu
y
wit
hin
Lim
it
sell
at
Lim
it
bu
yat
Lim
it
sell
ab
ove
Lim
it
bu
y
bel
ow
Can
cel
lim
it
sell
Can
cel
lim
it
bu
y
Larg
eL
arg
e1
28
,48
60
.73
1.7
111.0
213.4
65.3
15.1
111.3
111.1
112.6
49.8
110.8
16.9
8
Sm
all
10
4,1
45
0.6
51
.54
9.7
510.8
73.0
42.6
313.2
614.9
817.4
413.4
07.5
04.9
3
Sm
all
La
rge
17
,304
2.0
64
.63
13.7
516.6
82.7
03.6
38.6
28.7
611.0
69.7
310.6
07.7
8
Sm
all
25
,311
1.3
02
.80
19.2
921.3
51.4
61.2
88.2
59.9
812.8
39.7
37.3
14.4
1
Un
con
-
dit
ion
al
27
5,2
46
0.8
31
.93
11.4
713.4
13.9
43.7
311.6
012.3
214.3
711.1
69.2
26.0
2
aF
or
all
tra
din
gd
ay
sa
nd
sto
cks,
this
tab
lere
po
rts
the
emp
iric
al
per
cen
tfr
equ
enci
esfo
rtw
elve
even
tsre
late
dto
lim
itp
rice
po
siti
on
con
dit
ion
al
up
on
the
state
of
the
bo
ok
(su
mm
ari
zed
by
spre
ad
an
dd
epth
)o
ne
seco
nd
bef
ore
sub
mit
tin
gth
eo
rder
.A
ggre
ssiv
e(m
ark
et)
ord
eris
an
ord
erw
ith
pri
ceb
ette
r
tha
n(e
qu
al
to)
the
op
po
site
pre
va
ilin
gq
uo
te.
Lim
ito
rder
wit
hin
(at,
ab
ove
or
bel
ow
)is
the
ord
erp
rice
dw
ith
in(a
t,aw
ay
fro
m)
the
insi
de
spre
ad
.F
or
each
sto
ck,
the
spre
ad
an
dd
epth
are
de®
ned
tob
ela
rge,
ifth
eyare
larg
erth
an
thei
rti
me-
seri
esm
edia
ns
du
rin
gth
esa
mp
lep
erio
d.
1348 M. Al-Suhaibani, L. Kryzanowski / Journal of Banking & Finance 24 (2000) 1323±1357

tests, we reject the null hypothesis at the 1% level of the independence betweenthe order and trade events and the state of the book.
5.3. Order ¯ow and the time of the day
In this section, we examine the pattern of number and volume of all, limitand sell orders, and all, small and large transactions. As Fig. 3 shows, thenumber and volume of all new orders and transactions exhibit a U-shapedpattern during each within-day session, and a W-shaped pattern over thetrading day. The proportions of orders and trades submitted are largest in themorning. The proportions in the ®rst trading interval in the second session areusually larger than the proportions at the end of the day. The concentrationaround the open and close are like those observed in many stock markets withdi�erent microstructures. 37
The call market may be a contributing factor to the concentration at theopening. Since all qualifying orders are executed at a single price at the open,traders bene®t from their orders being executed at a price better than theirquote. Limit order traders are less a�ected by free option problems at theopen, and lose less to informed traders if they trade during the call mar-ket. 38 The large proportion of limit orders during the ®rst interval of eachsession supports this explanation. The high level of limit orders at the end ofevery trading session could result from limit price adjusting. 39 Less patienttraders start to adjust their prices as the end of the session approaches inorder to induce other traders to execute against them (Niemeyer and Sand�as,1995).
A larger proportion of small orders is executed at the opening, whereaslarger proportions of large orders are executed during and at the end of thesession. One possible explanation for this behavior put forward by Biais et al.(1995) is that small traders at the opening contribute to price discovery, whilelarge trades tend to occur after price discovery has already occurred.
We test for the signi®cance of the patterns in number and volume for neworders and transactions using a similar regression to the regression used inSection 4.4. The unreported results indicate signi®cant U-shapes. No signi®-cant intraday pattern was identi®ed for transaction price.
37 See, for example, Jain and Joh (1988), McInish and Wood (1990,1991), Gerety and Mulherin
(1992), Foster and Viswanathan (1993), Biais et al. (1995) and Niemeyer and Sand�as (1995).38 If a trader trades only at the call, then the option value of his order is smaller because it is good
at the time of the call.39 Adjusting the limit order price or quantity results in the order receiving new date and time
stamps. Accordingly, an order adjustment leads to two events: canceling an existing order, and
submitting a new one.
M. Al-Suhaibani, L. Kryzanowski / Journal of Banking & Finance 24 (2000) 1323±1357 1349
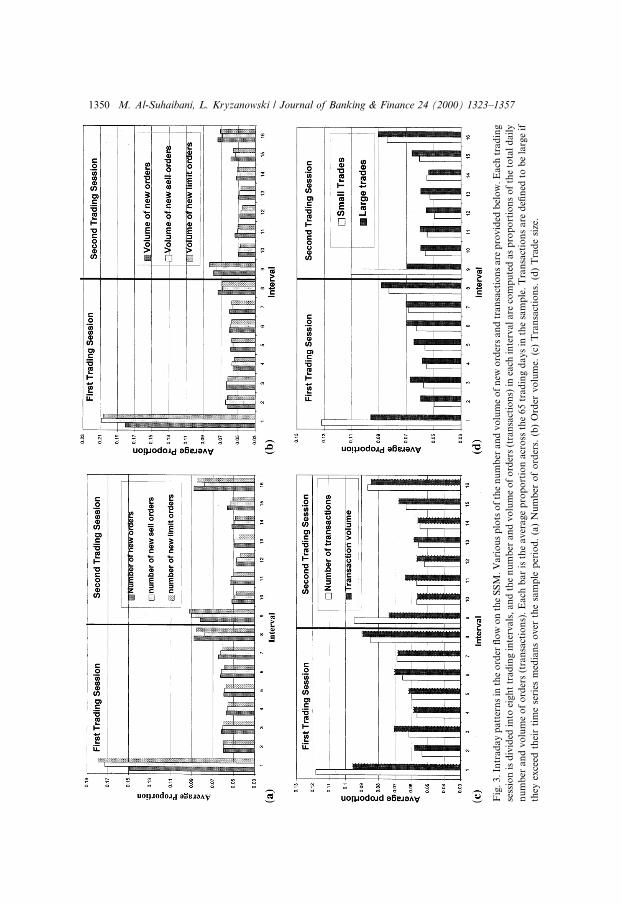
Fig
.3.
Intr
ad
ay
patt
ern
sin
the
ord
er¯
ow
on
the
SS
M.
Vari
ou
sp
lots
of
the
nu
mb
eran
dvo
lum
eo
fn
ewo
rder
san
dtr
an
sact
ion
sare
pro
vid
edb
elo
w.
Ea
chtr
ad
ing
sess
ion
isd
ivid
edin
toei
gh
ttr
ad
ing
inte
rvals
,an
dth
en
um
ber
an
dvo
lum
eo
fo
rder
s(t
ran
sact
ion
s)in
each
inte
rval
are
com
pu
ted
as
pro
po
rtio
ns
of
the
tota
ld
ail
y
nu
mb
eran
dvo
lum
eo
fo
rder
s(t
ran
sact
ion
s).
Each
ba
ris
the
aver
age
pro
po
rtio
nacr
oss
the
65
trad
ing
days
inth
esa
mp
le.
Tra
nsa
ctio
ns
are
de®
ned
tob
ela
rge
if
they
exce
edth
eir
tim
ese
ries
med
ian
so
ver
the
sam
ple
per
iod
.(a
)N
um
ber
of
ord
ers.
(b)
Ord
ervo
lum
e.(c
)T
ran
sact
ion
s.(d
)T
rad
esi
ze.
1350 M. Al-Suhaibani, L. Kryzanowski / Journal of Banking & Finance 24 (2000) 1323±1357

6. The analysis of order execution
Market liquidity can be measured by the cost of e�ecting a transaction at agiven point of time, or by the time it takes to transact (Lippman and McCall,1986; Amihud and Mendelson, 1989). In our examination of the order bookand order ¯ow, various aspects of the cost measure of market liquidity (such aswidth, depth, resiliency and the availability of immediacy) were addressed. Thecost measure of liquidity is more relevant to market order traders whose ob-jective is to obtain immediacy at a low cost. The time measure of liquidity ismore relevant to limit order traders, who supply liquidity on the SSM. In asetting where limit orders provide immediacy and wait for order execution,liquidity is measured by the expected time to execute a limit order at a givenprice, and more generally, by the probability of limit order execution. In thissection, we examine these issues.
6.1. Order duration given limit order characteristics
The duration of an order, Ti, is the length of time until the order is executed,canceled or expired. In this subsection, we analyze order duration data usingsurvival analysis. This statistical technique is very suitable for modeling orderduration, since order durations are non-negative and random. This statisticaltechnique allows us to estimate the conditional distribution of limit order ex-ecution times, Ti, as a function of explanatory variables, xi, such as ordercharacteristics and state of the book, F(Ti<t | xi). F ��� is the CDF of theWeibull distribution, 1ÿ exp�ÿkit�p and ki � exp�ÿx0ib�. 40 The parameters pand b can be estimated by maximum likelihood. Following Lo et al. (1997), wetreat limit orders that are canceled or expired as censored observations. Ig-noring the information in non-executed orders can bias the estimator of theconditional distribution of execution times.
We estimate the survival model for buy and sell limit orders. The set ofregressors in x includes a constant, an aggressiveness indicator, order size,number of orders per package, the inside spread, order imbalance, shares in thebook, prior market order, and a volatility measure. Following Harris (1996),we measure order aggressiveness by 1ÿ 2�Aÿ P �=�Aÿ B� for buy orders andthe negative of this quantity for sell orders, where A(B) denotes the ®rst bestask (bid), and P is the limit order price. This measure assigns a value of one tomarket orders and less than one to limit orders. Limit orders placed at the
40 We used the Weibull distribution because it allows for duration dependence. The hazard
function for the Weilbull distribution can be monotonically increasing or decreasing in t depending
on p.
M. Al-Suhaibani, L. Kryzanowski / Journal of Banking & Finance 24 (2000) 1323±1357 1351
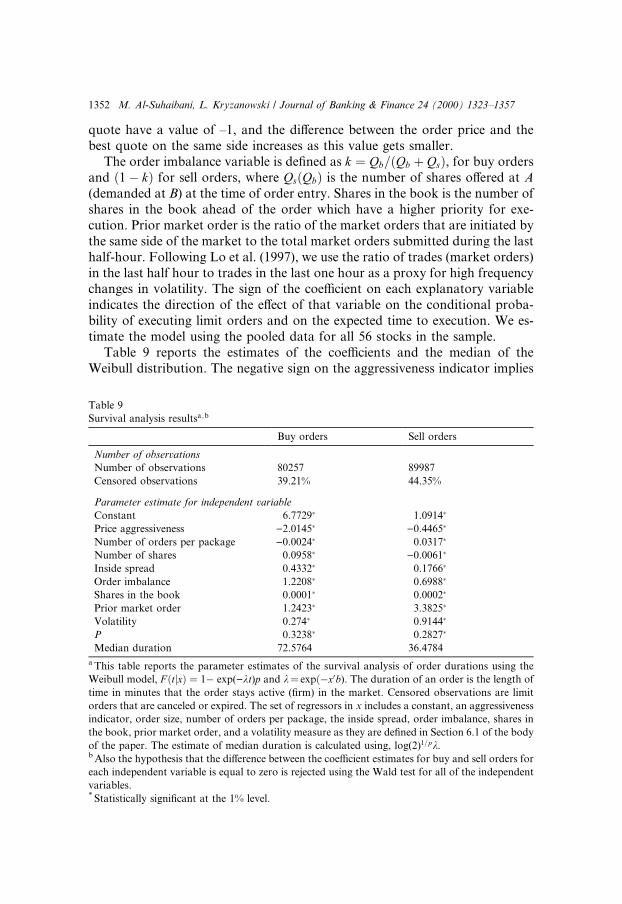
quote have a value of ±1, and the di�erence between the order price and thebest quote on the same side increases as this value gets smaller.
The order imbalance variable is de®ned as k � Qb=�Qb � Qs�, for buy ordersand �1ÿ k� for sell orders, where Qs�Qb� is the number of shares o�ered at A(demanded at B) at the time of order entry. Shares in the book is the number ofshares in the book ahead of the order which have a higher priority for exe-cution. Prior market order is the ratio of the market orders that are initiated bythe same side of the market to the total market orders submitted during the lasthalf-hour. Following Lo et al. (1997), we use the ratio of trades (market orders)in the last half hour to trades in the last one hour as a proxy for high frequencychanges in volatility. The sign of the coe�cient on each explanatory variableindicates the direction of the e�ect of that variable on the conditional proba-bility of executing limit orders and on the expected time to execution. We es-timate the model using the pooled data for all 56 stocks in the sample.
Table 9 reports the estimates of the coe�cients and the median of theWeibull distribution. The negative sign on the aggressiveness indicator implies
Table 9
Survival analysis resultsa;b
Buy orders Sell orders
Number of observations
Number of observations 80257 89987
Censored observations 39.21% 44.35%
Parameter estimate for independent variable
Constant 6.7729� 1.0914�
Price aggressiveness )2.0145� )0.4465�
Number of orders per package )0.0024� 0.0317�
Number of shares 0.0958� )0.0061�
Inside spread 0.4332� 0.1766�
Order imbalance 1.2208� 0.6988�
Shares in the book 0.0001� 0.0002�
Prior market order 1.2423� 3.3825�
Volatility 0.274� 0.9144�
P 0.3238� 0.2827�
Median duration 72.5764 36.4784
a This table reports the parameter estimates of the survival analysis of order durations using the
Weibull model, F �tjx� � 1ÿ exp()kt)p and k� exp�ÿx0b). The duration of an order is the length of
time in minutes that the order stays active (®rm) in the market. Censored observations are limit
orders that are canceled or expired. The set of regressors in x includes a constant, an aggressiveness
indicator, order size, number of orders per package, the inside spread, order imbalance, shares in
the book, prior market order, and a volatility measure as they are de®ned in Section 6.1 of the body
of the paper. The estimate of median duration is calculated using, log(2)1=pk.b Also the hypothesis that the di�erence between the coe�cient estimates for buy and sell orders for
each independent variable is equal to zero is rejected using the Wald test for all of the independent
variables.* Statistically signi®cant at the 1% level.
1352 M. Al-Suhaibani, L. Kryzanowski / Journal of Banking & Finance 24 (2000) 1323±1357
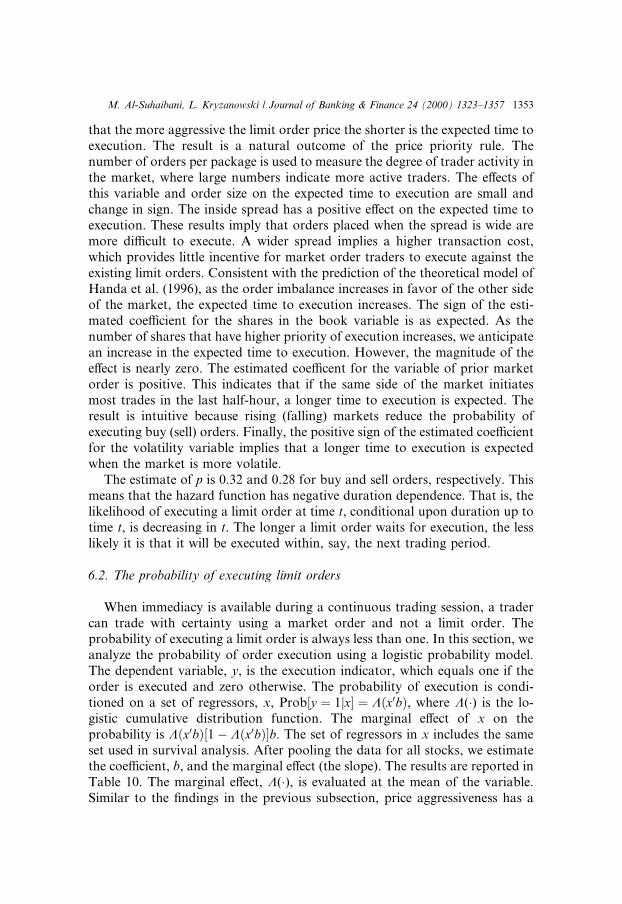
that the more aggressive the limit order price the shorter is the expected time toexecution. The result is a natural outcome of the price priority rule. Thenumber of orders per package is used to measure the degree of trader activity inthe market, where large numbers indicate more active traders. The e�ects ofthis variable and order size on the expected time to execution are small andchange in sign. The inside spread has a positive e�ect on the expected time toexecution. These results imply that orders placed when the spread is wide aremore di�cult to execute. A wider spread implies a higher transaction cost,which provides little incentive for market order traders to execute against theexisting limit orders. Consistent with the prediction of the theoretical model ofHanda et al. (1996), as the order imbalance increases in favor of the other sideof the market, the expected time to execution increases. The sign of the esti-mated coe�cient for the shares in the book variable is as expected. As thenumber of shares that have higher priority of execution increases, we anticipatean increase in the expected time to execution. However, the magnitude of thee�ect is nearly zero. The estimated coe�cent for the variable of prior marketorder is positive. This indicates that if the same side of the market initiatesmost trades in the last half-hour, a longer time to execution is expected. Theresult is intuitive because rising (falling) markets reduce the probability ofexecuting buy (sell) orders. Finally, the positive sign of the estimated coe�cientfor the volatility variable implies that a longer time to execution is expectedwhen the market is more volatile.
The estimate of p is 0.32 and 0.28 for buy and sell orders, respectively. Thismeans that the hazard function has negative duration dependence. That is, thelikelihood of executing a limit order at time t, conditional upon duration up totime t, is decreasing in t. The longer a limit order waits for execution, the lesslikely it is that it will be executed within, say, the next trading period.
6.2. The probability of executing limit orders
When immediacy is available during a continuous trading session, a tradercan trade with certainty using a market order and not a limit order. Theprobability of executing a limit order is always less than one. In this section, weanalyze the probability of order execution using a logistic probability model.The dependent variable, y, is the execution indicator, which equals one if theorder is executed and zero otherwise. The probability of execution is condi-tioned on a set of regressors, x, Prob�y � 1jx� � K�x0b�, where K(�) is the lo-gistic cumulative distribution function. The marginal e�ect of x on theprobability is K�x0b��1ÿ K�x0b��b. The set of regressors in x includes the sameset used in survival analysis. After pooling the data for all stocks, we estimatethe coe�cient, b, and the marginal e�ect (the slope). The results are reported inTable 10. The marginal e�ect, K(�), is evaluated at the mean of the variable.Similar to the ®ndings in the previous subsection, price aggressiveness has a
M. Al-Suhaibani, L. Kryzanowski / Journal of Banking & Finance 24 (2000) 1323±1357 1353

positive e�ect on the probability of execution. Overall, limit orders with``reasonable'' prices are highly liquid in terms of executability. The results alsoindicate that more active traders have higher probabilities of execution. Activetraders frequently have standing ®rm orders at and away from the quote eitherto make a market, or to seize the free option quickly. Since they also monitorthe market more closely, we expect them to adjust their exposed orders morefrequently than others. The negative signs on the estimated coe�cients for theorder size variable suggest that larger orders are more di�cult to execute. Thesigns of the estimated coe�cients of the volatility measure variable imply thatsell (buy) orders have higher (lower) probabilities of execution when marketconditions are more active. This could be attributed to the 9.23% rise in themarket index over the sample period. This rising market period also may
Table 10
Logit regression resultsa ;b
Number of observations and
R-squared values
Buy orders Sell orders
Number of observations 80257 89987
Dependent variable equals one 47.28% 48.71%
McFadden pseudo R-squared 0.4149 0.4149
Parameter estimates for following
independent variables
Coe�cient Slope Coe�cient Slope
Constant 3.3114� 2.7978�
Price aggressiveness 0.9419� 0.1448� 0.6327� 0.0946�
Number of orders per package 0.0063� 0.001� 0.0028� 0.0004�
Number of shares )0.0637� )0.0098� )0.0323� )0.0048�
Inside spread )0.2052� )0.0315� )0.1947� )0.0291�
Order imbalance )0.7468� )0.1148� )0.157� )0.0235�
Shares in the book )0.0000� )0.0000� )0.0000� )0.0000�
Prior market order )0.5502� )0.0846� )1.2109� )0.1811�
Volatility )0.2434� )0.0374� 0.2926� 0.0438�
a This table reports the results for the logit regressions, �yjx� �K(x0b�, where y is a dummy variable
that is equal to one if the order is executed, and zero otherwise. The set of regressors in x includes a
constant, an aggressiveness indicator, order size, number of orders per package, the inside spread,
order imbalance, shares in the book, prior market order, and a volatility measure as they are de-
®ned in Section 6.1 of the text of this paper. K(�) is the logistic cumulative distribution function. The
coe�cient is the b estimate. The slope is the marginal e�ect of x on the probability of execution, as
given by K�x0b)[1 ) K(x0b��b, when K(x0b) is evaluated at the mean of the regressors. McFadden
pseudo R-squared is 1)(ln L/ln L0), where ln L and ln L0 are the log-likelihood functions evaluated
at the unrestricted and restricted estimates (all coe�cients, except the constant, are zero), respec-
tively.b The hypothesis, that all the coe�cients (except the constant term) are equal to zero, is rejected
using both the Likelihood Ratio and Wald tests. The hypothesis, that the di�erence between the
estimated coe�cients for buy and sell orders for each independent variable is equal to zero, also is
rejected using the Wald test for all but one variable (namely, the Number of shares).* Statistically signi®cant at the 1% level.
1354 M. Al-Suhaibani, L. Kryzanowski / Journal of Banking & Finance 24 (2000) 1323±1357
explain the signi®cant di�erences between buy and sell orders identi®ed inTables 9 and 10. Other regression results in Table 10 are generally consistentwith the ®ndings that we obtained from the survival analysis.
7. Concluding remarks
In this paper, we describe and analyze the microstructure of the SSM underthe computerized trading system, ESIS. We analyze the order book, order ¯owand order execution using four rich data sets on orders, order packages, quotesand transactions. Although the SSM has a distinct structure, its intradaypatterns are surprisingly similar to those found in other markets with di�erentstructures. These include U-shaped patterns in traded volume, number oftransactions and volatility. Like other order-driven markets, the SSM exhibitsa U-shaped pattern in the placement of new orders.
We ®nd that the relative inside spread is higher only at the open and declinesgradually afterwards on the SSM. This pattern is similar to the one observedfor a number of markets without designated market makers. We ®nd that theaverage relative inside spread is large compared to other markets, mainly dueto a relatively high tick size. Tick size is an important determinant of the insidespread for low priced stocks, and for all other relative spreads. As in otherstudies, we detect a ``diagonal e�ect'' in order ¯ow. Strategic order splittingrather than imitation or competition hypothesis appears to be the dominantfactor causing this e�ect.
We ®nd that liquidity, as commonly measured by width and depth, is rel-atively low on the SSM. However, it is exceptionally high when measured byimmediacy. We also present new evidence on other measures of market li-quidity that are more relevant to order-driven markets. For example, we ®ndthat limit orders that are priced reasonably, on average, have a shorter ex-pected time to execution, and have a high probability of subsequent execution.
Acknowledgements
Financial support from FCAR (Fonds pour la formation de chercheurs etl'Aide �a la Recherche), SSHRC (Social Sciences and Humanities ResearchCouncil of Canada) and the Imam University are gratefully acknowledged. Weappreciate the comments of Anastasios Anastasopoulos, Abraham Brodt,Gordon Fisher, Michael Sampson and two referees of this journal on earlierversions of this paper. We would like to thank the Saudi Arabian MonetaryAgency for assistance in obtaining the data used in this paper. All remainingerrors are the authors' responsibility. Comments are welcomed.
M. Al-Suhaibani, L. Kryzanowski / Journal of Banking & Finance 24 (2000) 1323±1357 1355
References
Admati, A., P¯eiderer, P., 1988. A theory of intraday patterns: Volume and price volatility. The
Review of Financial Studies 1 (1), 3±40.
Amihud, Y., Mendelson, H., 1989. The e�ect of computer based trading on volatility and liquidity.
In: Lucas, H., Schwartz, R.A. (Eds.), The Challenge of Information Technology for the
Securities Markets: Liquidity, Volatility, and Global Trading. Dow Jones-Irwin, Homewood,
Illinois.
Angel, J., 1997. Tick size, share prices, and stock splits. Journal of Finance 52, 655±681.
Biais, B., Hillion, P., Spatt, C., 1995. An empirical analysis of the limit order book and the order
¯ow in the Paris Bourse. Journal of Finance 50, 1655±1690.
Brock, W., Kleidon, A., 1992. Periodic market closure and trading volume: A model of intraday
bids and asks. Journal of Economic Dynamics and Control 16, 451±489.
Butler, K., Malaikah, S., 1992. E�ciency and ine�ciency in thinly traded stock markets: Kuwait
and Saudi Arabia. Journal of Banking and Finance 16 (1), 197±210.
Chan, L., Lakonishok, J., 1995. The behavior of stock prices around institutional trades. Journal of
Finance 50, 1147±1174.
Chan, K., Christie, W., Schultz, P., 1995a. Market structure and the intraday pattern of the bid±ask
spreads for NASDAQ securities. Journal of Business 68 (1), 35±60.
Chan, K., Chung, P., Johnson, H., 1995b. The intraday behavior of bid±ask spreads for NYSE
stocks and CBOE options. Journal of Financial and Quantitative Analysis 30 (3), 329±346.
Darwiche, F., 1986. The Gulf Stock Exchange: The rise and fall of the Souq Al-Manakh. Croom
Helm, London.
Foster, F., Viswanathan, S., 1993. Variations in trading volume, return volatility and trading costs:
Evidence on recent price formation models. Journal of Finance 48, 187±211.
Gerety, M., Mulherin, H., 1992. Trading halts and market activity: An analysis of volume at the
open and the close. Journal of Finance 47, 1765±1784.
Handa, P., Schwartz, R., Tiwari, A., 1996. The determinants of bid±ask spread in an order-driven
market, Working paper.
Harris, L., 1986. A transaction data study of weekly and intradaily patterns in stock returns.
Journal of Financial Economics 16, 99±117.
Harris, L., 1990. Liquidity, trading rules, and electronic trading systems, New York University
Salomon Center, Leonard N. Stern School of Business, New York.
Harris, L., 1996. Does a large minimum price variation encourage order exposure, Working paper,
University of South California.
Hedvall, K., 1995. Trade concentration hypotheses: An empirical test of information vs. demand
models on the Helsinki Stock Exchange. Journal of International Financial Markets,
Institutions and Money 3, 135±163.
Hedvall, K., Niemeyer, J., 1996. Order ¯ow dynamics: Evidence from the Helsinki Stock Exchange,
Working paper, Swedish School of Economics and Business Administration.
Hedvall, K., Niemeyer, J., Rosenqvist, G., 1997. Do buyers and sellers behave similarly in a limit
order book? A high-frequency data examination of Finnish Stock Market. Journal of Empirical
Finance 4, 279±293.
Jain, P., Joh, G., 1988. The dependence between hourly prices and trading volume. Journal of
Financial and Quantitative Analysis 23 (3), 269±282.
Lehmann, N., Modest, D., 1994. Trading and liquidity on the Tokyo Stock Exchange: A birdÕs eye
view. Journal of Finance 49, 951±984.
Lippman, S., McCall, J., 1986. An operational measure of liquidity. American Economic Review 76
(1), 43±55.
Lo, A.W., MacKinlay, A.C., Zhang, J., 1997. Econometric models of limit-order executions.
Working paper no. W6257, Cambridge, MA.
1356 M. Al-Suhaibani, L. Kryzanowski / Journal of Banking & Finance 24 (2000) 1323±1357
Madhavan, A., 1992. Trading mechanism in securities markets. Journal of Finance 47, 607±641.
Malaikah, S., 1990. Saudi Arabia and Kuwait: A study of stock market behavior and its policy
implications, Ph.D. dissertation, Michigan State University.
McInish, T., Wood, R., 1990. An analysis of transactions data for the Toronto Stock Exchange.
Journal of Banking and Finance 14, 441±458.
McInish, T., Wood, R., 1991. Hourly returns, volume, trade size, and number of trades. Journal of
Financial Research 14 (4), 303±315.
McInish, T., Wood, R., 1992. An analysis of intraday patterns in bid±ask spreads for NYSE stocks.
Journal of Finance 47, 753±764.
Niemeyer, J., Sand�as, P., 1995. An empirical analysis of the trading structure at the Stockholm
Stock Exchange, Working paper, Stockholm School of Economics.
Stoll, H., 1992. Principles of trading market structure. Journal of Financial Research 6, 75±107.
Wilson, Peter W, 1991. A question of interest: The paralysis of Saudi banking. Westview, Boulder,
CO.
Wood, R., McInish, T., Ord, J., 1985. An investigation of transactions data from NYSE stocks.
Journal of Finance 40, 723±741.
M. Al-Suhaibani, L. Kryzanowski / Journal of Banking & Finance 24 (2000) 1323±1357 1357