George Howard, DrPH UAB School of Public Health Birmingham, AL
Upload
reginald-conleyCategory
view
218download
3
An Exploration of Policy Activities by Local Health Departments to
Improve Population Health
Lara Lamprecht, DrPH, MPH
2015 Public Health Services and Systems Research Keeneland Conference
April 22, 2015
2
Background• Local health departments
(LHD) play a critical role in public health systems that perform assurance, assessment and policy development functions.
• Historically, LHDs have contributed to health improvements by responding to the health threats of the time.
• The threat has shifted to chronic diseases.
IOM, 2011

3
Policy Strategies for Population-based Health Impact
• Population-based strategies for greater health value
• Policy has been effective as a population-based strategy
• “National call” for improved policy performance– Priority Areas for Improvement of
Quality in Public Health – For the Public’s Health: Revitalizing Law
and Policy to Meet New Challenges
• Patient Protection and Affordable Care Act of 2010 includes prevention
• Health in All Policies uses systems and ecological perspectives
Health Impact Pyramid (Frieden, 2010)
4
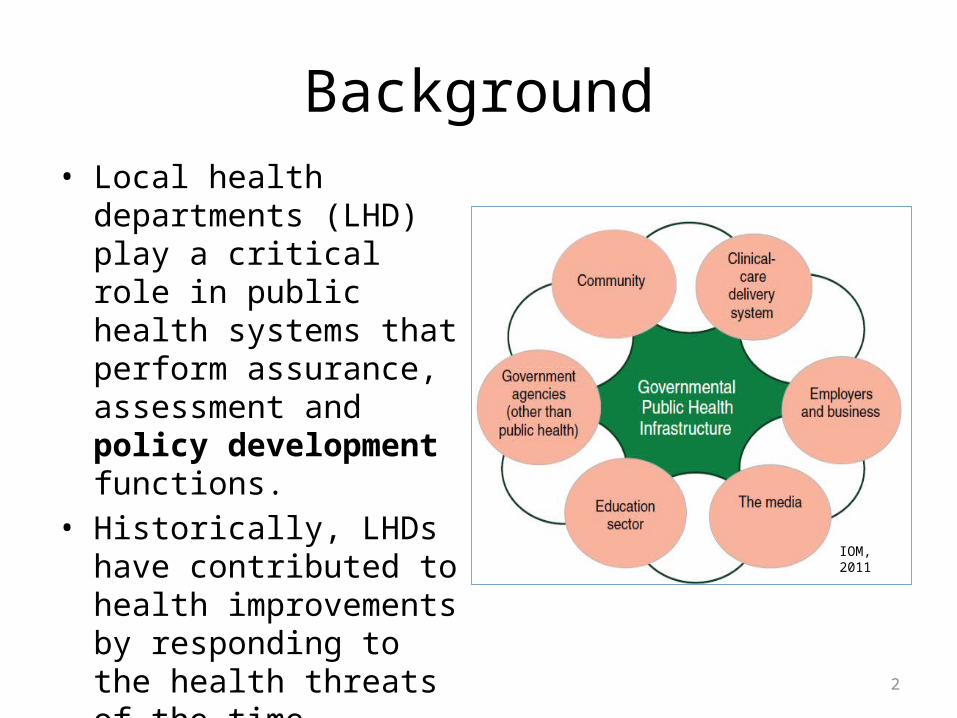
Gap and Research QuestionLHD policy development is not as thoroughly or uniformly studied and described in public health practice literature as the assurance and assessment functions
What characteristics are associated with LHD policy activity?• What organizational characteristics?• What community (service area) characteristics?• What leader characteristics?

5
Conceptual Model

6
Study Design and Sample• Exploratory study design• Secondary data from
National Association of County and City Health Officials (NACCHO) 2010 Profile Questionnaire
• Stratified random sample of 625 LHDs
• 516/625 (83%) responded• Restricted to 337 LHDs that
had complete data

Rhode Island
HawaiiReceived Profile QuestionnaireDid not receive Profile Questionnaire
7
Sample continued

8
Methods• Literature review• Data cleaning, variable creation, and data screening• Quantitative analysis using SAS 9.3 (Cary, NC)
– Survey procedures used to account for complex study design• Weight accounted for sampling and non-response • Strata statement indicated stratification variable during sampling
– Descriptive statistics• Frequency, percentage, quartile
– Analytic statistics • Bivariate and multivariable logistic regression• Statistical significance established at p-value <.05• Wald chi square test for independence taking into account complex survey
design
• Qualitative analysis of text responses

9
Independent VariablesDomain Characteristics Independent variablesLHD organizational characteristics
Relevant skill sets • Epidemiologist• Health educator• Public health informatics specialist• Public information specialist• Environmental health worker
Staff size • FTEs per 100,000 populationHigh functioning • Community health assessment (CHA)
• Health improvement plan (HIP)• Health impact assessment (HIA)
Governance •Governance (unit of local gov’t only, unit of state gov’t)Community (service area) characteristics
Size of population • Total population servedJurisdiction served • Jurisdiction served (single, multiple)Local Board of Health (LBOH)
• Policy authorities of the LBOH
LHD leader characteristics
Training/ background of leader
• Top executive has public health degree• Length of service as top executive• First experience as top executive
Demographic factors •Gender

10
Dependent VariableQuestionnaire question
Activity at the local level of government Response options
Participated in the policy-related activities during the past two years.
Prepared issue briefs for policy makers 0=no1=yes
Gave public testimony to policy makers 0=no1=yes
Participated on a board or advisory panel 0=no1=yes
Communicated with legislators, regulatory officials, or other policymakers
0=no1=yes
Provided technical assistance to legislative, regulatory or advocacy group
0=no1=yes
Raw summed policy score = 0, 1, 2, 3, 4, or 5 activities
Categories of policy activity 0-3 = Not or less policy active4-5 = More policy active

11
LHDs Participating in Local Policy Activities in Past Two Years, 2010
Provided technical assistance
Communicated with policy makers
Board participation
Gave public testimony
Prepared issue briefs
0% 10% 20% 30% 40% 50% 60% 70% 80% 90% 100%
43.2
69.1
54.5
45.2
49.7
56.8
30.9
45.5
54.8
50.3
YesNo
Percentage of LHDs
Policy activity

12
LHD Participation in HIAs
67%
5%
28%
Don't know
NoYes
1 2 3 4 100
2
4
6
8
10
12
14
16
14
5
1 1 1
Number of HIAs
Number of LHDs
Percentage of LHDs that have ever participated in an HIA
Number of HIAs that LHDs have participated in during the past year

13
Distribution of More Policy Active LHDs within Population Strata
<25,000 25,000-49,999 50,000-99,999 100,000-249,999 250,000-499,999 500,000-999,999 1,000,000+0.0
10.0
20.0
30.0
40.0
50.0
60.0
70.0
80.0
16.5
43.3 41.5
57.4 58.8
72.2 73.3
LDH Population Stratum
Percentage of More Policy Active LHDs

14
Multivariable Logistic Regression Results

15
Comparison of Multivariable Model Results
Model 1 – Domain model Model 2 – A priori model
Variable AOR 95% CI P-value Variable AOR 95% CI P-value
Population served
1.57 1.34, 1.84
<.0001 Population served
1.69 1.45, 2.00
<.0001
Governance 4.36 2.21, 8.62
<.0001 Governance 4.31 2.23, 8.36
<.0001
HIA 4.89 1.34, 17.81
0.0160
Gender 0.55 0.33, 0.93
0.0268
n=337Model Wald X2 = 47.07, df=4, p <.0001R2= 0.6614
n=337Model Wald X2 = 48.59, df=2, p<.0001R2=0.6100
16
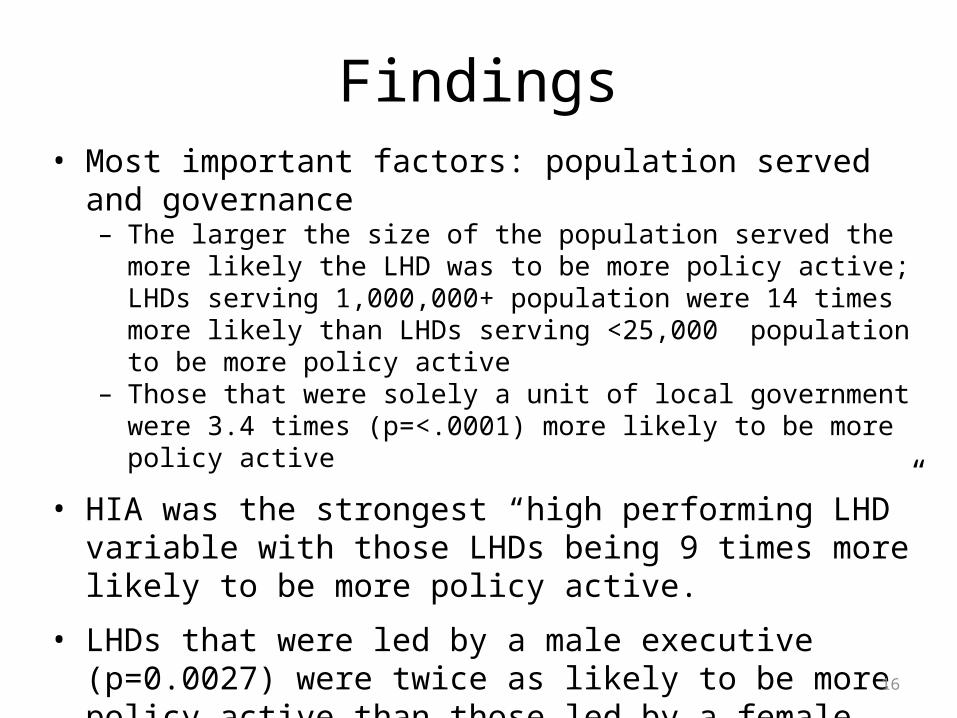
Findings• Most important factors: population served and governance
– The larger the size of the population served the more likely the LHD was to be more policy active; LHDs serving 1,000,000+ population were 14 times more likely than LHDs serving <25,000 population to be more policy active
– Those that were solely a unit of local government were 3.4 times (p=<.0001) more likely to be more policy active
• HIA was the strongest “high performing LHD” variable with those LHDs being 9 times more likely to be more policy active.
• LHDs that were led by a male executive (p=0.0027) were twice as likely to be more policy active than those led by a female executive.

17
Findings• The a priori approach led to a more parsimonious model; the
domain approach might have artificially increased the importance of some variables.
• Those with a LBOH with strong policy authority were twice as likely (p=0.0055) to be more policy active than those with no LBOH.
• “Policy analyst” and “planner” were suggested as occupation types for future questionnaires.
• Public health training of the LHD executive was important, but experience was not. Leaders holding a public health degree were 2.5 times (p=0.0006) more likely to be more policy active.
18
Strengths and Limitations
• Strengths– Used most comprehensive LHD dataset available – Extensively screened data to test for and reduce potential
bias – Provides a basis for more focused qualitative research
• Limitations– Definitive conclusions cannot be drawn– “Policy active” reflected the number (not frequencies) of policy
activities– Data reflected policy activity during 2008 and 2009– Questionnaire might not have been completed by LHD executive

19
Implications for Practice
• Leaders can advocate for change; and be champions of policy development within LHDs and the public health system
• LHDs considering becoming an academic health department might prioritize policy development for quality improvement
• State HDs might assess LHD policy development and target those that need improvement
• Strengthen leadership– Provide mentoring and leadership development opportunities to those
that don’t have public health training– Enhance leaders’ policy skills to bring about change– Establish mentoring relationships between high and low policy
performing LHDs

20
Implications for Practice
• Increase LHD workforce capability– Hire executives with public health training or a policy background– Provide HIA awareness and training– [Larger LHDs] assess workforce for specific skill sets; and hire to fill key
policy needs– [Smaller LHDs] offer targeted trainings to augment skills of staff; and
seek alternate approaches and organizational structures for ensuring policy development
– [Leaders might] mentor staff that have skill sets related to policy analysis
• Engage LBOHs• [LHDs can] collaborate with LBOHs that have strong policy authority• Provide policy trainings or orientations for Board members

21
Implications for Research• Improve the Profile Questionnaire series
– Define HIA and policy activities– Include questions on more policy analysis functions– Align policy questions with quality framework – Allow for frequency of policy activities– Add “policy analyst” and/or “planner”
• Expand upon this study– Study other potential influences on LHD policy activity– Analyze policy activity trends – Study relationship of a factor with policy activity
• Explore further questions– Study barriers to and facilitators of policy activity– Contrast high and low policy performers– Assess quantity/quality of policy strategies (and impact on health outcomes)– Describe how policy analysis is conducted in LHDs– Ascertain what motivates LHD leaders to build policy development capacity


![[XLS] · Web viewLAMSON SYSTEMS (PROPRIETARY) LIMITED 902/04 LAMPRECHT STEPHANUS REINER 6348/00 LAMPRECHT MATIAM 730119 5043 083 & 661025 0179 082 663/07 LAMPRECHT JOHANNES HENDRIK](https://static.fdocuments.in/doc/165x107/5abb9a7f7f8b9ad1768ce650/xls-viewlamson-systems-proprietary-limited-90204-lamprecht-stephanus-reiner.jpg)