5 電容 Capacitance National Ignition Facility. Explosions in Airborne Dust.
Upload
sergey-biryukovCategory
view
212download
1
Pergamon J. Aerosol SCI. Vol. 29, No. l/2, pp. 129-139, 1998 p 1998 Elsewr Science Ltd. All rights reserved
Printed in Great Brmm 0021-8502/98 $19.00 + 0.00 PII: SOO21-8502(97)00037-2
AN EXPERIMENTAL STUDY OF THE DRY DEPOSITION MECHANISM FOR AIRBORNE DUST
Sergey Biryukov
Ben-Gurion National Solar Energy Center, The Jacob Blaustein Institute for Desert Research, Ben-Gurion University of the Negev, Sede Boqer Campus, 84990, Israel
(First received 12 March 1996; and infinalform 29 May 1997)
Abstract-A study of dry deposition of the coarse mode of airborne dust on mirror surfaces has been performed at Sede Boqer, Israel, as a part of a research program to protect the reflective surfaces of solar concentrating collectors. In particular, the angular dependence of the deposition rate was measured in order to separate between its diffusive (isotropic) and vertical components. Dust was collected on a flat sampler with changeable slope, mounted on a wind vane. No deviation from a cosine-type angular dependence was found for dust particles larger than 4pm. This result is interpreted as domination, in the vicinity of the collecting surface, of vertically directed particle flux over diffusive components. This conclusion was compared to the results of existing dry-deposition models. The size distribution of particles, collected on the flat horizontal surface, was converted to a volume-mass concentration using calculated sedimentation velocity as the only component of deposition velocity. The resulting value was confirmed by our control measurements of the volume-mass concentration. Our results are also compared with recent data on deposition vel- ocities, published by Lin et al. (1994). 0 1998 Elsevier Science Ltd. All rights reserved
1. INTRODUCTION
Interest in the investigation of atmospheric dust deposition on surfaces arises in numerous branches of science and industry. Theoretical and experimental results of such investiga- tions are, e.g. summarized in the reviews of Pye (1989) and Williams and Loyalka (1991). Applied solar energy also turns out to be one of the fields where such knowledge would be useful. The reason for this is the fact that contamination, by airborne dust, of the reflecting surfaces of concentrating solar collectors may lead to considerable revenue losses for solar power stations.
Regular washing with water is the usual method employed for the reduction of such power losses. But for desert and semi-arid regions, which are the most attractive locations for solar energy production, this way of cleaning may not be feasible and, in any case, can become very expensive. For this reason we have developed a program to study the possibility of suppressing the deposition of dust on the collectors of solar power stations. As an alternative to washing we have examined various approaches to surface dust cleaning/ protection which are based on repulsive physical interactions between the surface and the dust particle.
The degradation rate r = Aq/r] of optical efJiciency y of a solar collector due to accumula- tion of particles with projected area diameter d, on its surface can be expressed on its initial stage in the following way:
44) = Cl - $(d,)ldd,)S(d,) J(d,). (1) (See Hinds, 1982, for definition of the projected urea diameter, and Stine and Harrigan, 1985, for optical efficiency of solar collectors.)
Here J(d,) = V(d,)n(d,) is the flux of particles with diameter d,, where V(d,) is the deposition velocity (see Williams and Loyalka, 1991, p. 327, for definition) and n(d,) the numerical volume concentration of particles, q(d,) S(d,) the reduction of mirror reflectivity or of glass transmissivity due to a single particle, where S(d,) is the particle projected area and coefficient q(d,) depends on surface properties (e.g. it is different for the first- or
129

130 Serpey Biryukov
second-surface reflectors) and on physical properties of dust, and $(d,) the efficiency of surface cleaning or protection against dust accumulation.
Our research program obviously requires a twofold starting point: determination of (a) the relevant particle-size distributions and (b) the principal mechanisms for their depos- ition. The first is important because their size is the main factor which determines the physical interaction of particles. The second, because knowledge of the actual deposition mechanisms provides-via deposition velocity-a quantitative basis for measuring the efficiency of any resulting cleaning or surface protecting techniques. This knowledge also results in a relationship between data on surface deposition rates and the corresponding particle-volume concentrations. In some cases, moreover, it renders possible the use of a reference sample in order to normalize other surface data. At the practical level, of course. such knowledge constitutes the required basis for designing solar collectors with better anti- soiling properties.
The atmospheric dust accumulation on solar collectors has previously been studied by Sayigh et al. (1987), Guddihy (1988) and El-Nashar (1994). These works present results which are integrated over long time periods and which include a wide spread of meteoro- logical conditions. They provide no quantitative information about the relative contribu- tion of particles with different sizes to surface contamination, or about the mechanisms of dust deposition on the solar collector surfaces from the ambient atmosphere. Quantitative information about the influence of artificially produced and deposited dust particles of different sizes (optically determined mean diameters 5, 10, 50, 60 and 80,~m) on the performance of photovoltaic panels can be extracted from the laboratory measurements of El-Shobokshy and Hussein (1993).
In the present article we report data on the size distribution of natural airborne particle flux J to glass-coated mirror samples for particles having projected area diameter larger than 4pm. As previously demonstrated by our measurements of specular refectivity degradation, accompanied with microscopic studies (Biryukov et NI., 1994) particles in this size range play the dominating role in the kind of optical degradation under investigation here.
The presently reported size distributions of deposition rates, on glass and glass-coated mirror samples of different orientations, demonstrate high stability of their shapes. They peak between 10 and 20,um in the projected area diameter. This shape repeats itself under similar meteorological conditions, which will be discussed later. This fact points to the existence of a definite mechanism for particle accumulation (at least for the coarse particle region, of interest to us) and provides the possibility to study it using both long-term (days) and short-term (hours) measurements.
In the present study we have placed a high level of importance on using natural rather than simulated dust-deposition conditions. On the other hand, the conditions had to be well defined in order to permit a clear-cut theoretical interpretation of the results. To these ends, the measurements reported here were all performed under conditions, corresponding to the dry-deposition process. Common definitions of this process can be found in Twomey (1977) and Brimblecombe (1986). This ensured the absence of complicating water condensation effects. Furthermore, we were also able to ensure that all particle deposition data would correspond to conditions of wind parallel to flat surfaces of known slope. In this manner we could determine the angular dependence of particle fluxes to glass surfaces, for particles of different sizes.
As will be shown below, one can use the measured angular dependence in order to estimate the relative contribution of the isotropic (diffusive) and vertically directed compo- nents in the particle flux. One must, however, ensure the absence of particle deposition by impact on the obstacle from the disturbed air stream. In order to eliminate this mechanism, glass samples with a variety of fixed slopes relative to the horizontal were kept parallel to the wind direction by attachment to a wind vane. In order to take into account effects of resuspension, measurements were performed with the samples half-coated with an adhesive layer. Particle-size distributions for the collected samples were then determined using a computerized microscope.

An experlmental study of the dry deposition 131
The common predictions of the model of dry deposition from turbulent flow under gravity are compared with our measured angular dependence of particle flux. We conclude from our results that, for the particle sizes of interest, gravitational settling effectively dominates over the totality of all diffusive mechanisms. That means that air motion parallel to a Aat collecting plate is slow enough to preserve laminar boundary layer near its surface (see the discussion of conditions for turbulent deposition from the flow parallel to surface in Friedlander, 1977, p.115).
Using this conclusion together with our data on particle fluxes to horizontal surfaces we are able to estimate the corresponding volume densities of dust particles with sizes in the range 4-64 pm. These results are compared with some direct control measurements of our own and with published data for the Negev region. We also compare our results with measurements of dry-deposition velocities, reported by Lin et al. (1994).
2. EXPERIMENTAL TECHNIQUE
2.1. Measurements of particle-size distributions on a surface
As previously stated, the particles of interest for our research have projected area diameters larger than 1 pm. This size is large enough to permit the use of optical microscopy for analysis purposes. For the study of particle-size distributions on mirror surfaces we developed a computerized set up, based on the MonoZoom- Video Microscope System of Cambridge Instruments Corp. The optical image of the microscope is viewed by a Javelin Corp. JE 7442X B/W video camera, which has a sensitive CCD-array of 756 x 512 pixels. The output of the CCD-camera was recorded by a DT-2855 “Quick Capture” frame grabber of Data Trunslation Corp.
Image processing of grey-scale frames was performed using a 486-based micro-computer, with the help of specially designed software for particle recognition. The latter included some standard image processing operations, which mostly are presented in Russ (1990). The grey-scale image was converted to a binary (black and white) one with the help of brightness discrimination before sizing (see Russ, 1990 for a discussion of the thresholding operation). This procedure was used for background subtraction. Each particle was charac- terized by its projected area in pixels. The last one was recalculated to the diameter of equivalent circle, i.e. the projected area diameter in pm, using the beforehand measured scale. Special corrections had to be applied to the effective diameters of the projected areas of irregular particles. In particular, it was necessary to take into account the fact that most particles are to some extent elongated and tend to settle on a surface so as to have minimum potential energy. This phenomenon makes the average projected area diameter for an ensemble of particles larger than it would be for the same particles if they were randomly oriented. Depending on particle and surface properties (electric charge, etc.) this correction, in the most common case, depends on particle size and, if neglected, can result in substantial errors when calculating mass distributions, aerodynamic diameters, etc.
Particles were grouped into predetermined size ranges according to their projected area diameters. All particles in each frame were counted and sorted into their size ranges. The histogram over size ranges was incremented using successive frames until at least 10 particles were counted in each size range (Hinds, 1982).
2.2. Dust sampling
Exposure of the glass samples to dust was performed in the field in the following manner. The sample holder (Fig. 1) consisted of a pair of light rectangular plastic plates, 10 x 20 cm2 in size, with rectangular hollows. These hollows were 2 or 3 mm deep and of different sizes (2 x 5 cm2, 3 x 3 cm2, 3 x 6 cm2) in order to permit the flush-type mounting of 2-3 mm thick samples of glass or glass-coated mirrors. The sample holder was mounted on a wind vane, in order to maintain its surface parallel to the wind direction.
132 Sergey Biryukov
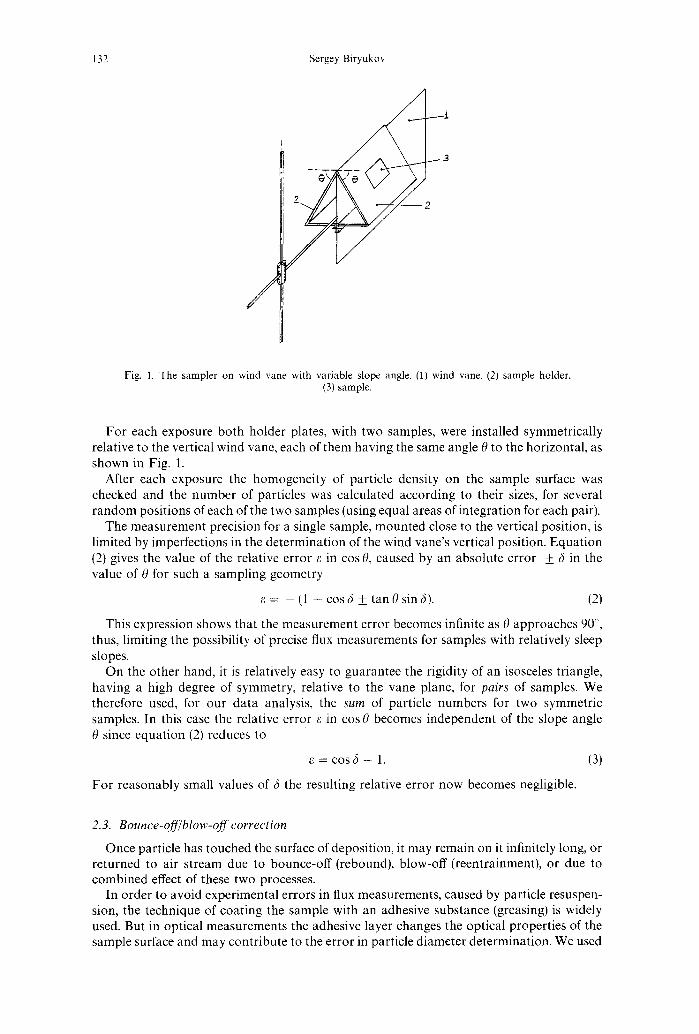
Fig. 1. The sampler on wind vane with variable slope angle. (1) wind vane, (2) sample holder, (3) sample.
For each exposure both holder plates, with two samples, were installed symmetrically relative to the vertical wind vane, each of them having the same angle 0 to the horizontal, as shown in Fig. 1.
After each exposure the homogeneity of particle density on the sample surface was checked and the number of particles was calculated according to their sizes, for several random positions of each of the two samples (using equal areas of integration for each pair).
The measurement precision for a single sample, mounted close to the vertical position, is limited by imperfections in the determination of the wind vane’s vertical position. Equation (2) gives the value of the relative error E in cos8, caused by an absolute error + 6 in the value of H for such a sampling geometry
c= -(l-cos6ftanQsin6). (2)
This expression shows that the measurement error becomes infinite as 0 approaches 90’, thus, limiting the possibility of precise flux measurements for samples with relatively sleep slopes.
On the other hand, it is relatively easy to guarantee the rigidity of an isosceles triangle, having a high degree of symmetry, relative to the vane plane, for pairs of samples. We therefore used, for our data analysis, the sum of particle numbers for two symmetric samples. In this case the relative error g in cos0 becomes independent of the slope angle 0 since equation (2) reduces to
c=cos6-1. (3)
For reasonably small values of 6 the resulting relative error now becomes negligible.
2.3. Bounce-@blow-ofS correction
Once particle has touched the surface of deposition, it may remain on it infinitely long, or returned to air stream due to bounce-off (rebound), blow-off (reentrainment), or due to combined effect of these two processes.
In order to avoid experimental errors in flux measurements, caused by particle resuspen- sion, the technique of coating the sample with an adhesive substance (greasing) is widely used. But in optical measurements the adhesive layer changes the optical properties of the sample surface and may contribute to the error in particle diameter determination. We used

An experimental study of the dry deposition 133
a modification of this technique, in which we prepared samples, “half-coated” with an adhesive layer. In this way about 50% of the sample surface area remains free of adhesive coating. This technique gives us the possibility of measuring both total and effective fluxes to the surface (J and Jeff, respectively) and of extracting from these measurements data about the probability for particles of different sizes not to be resuspended after their contact with the surface. It can be expressed as a ratio A = Jeff/J which we shall call below in the text the coejicient of attachment to surface, or attachment coefficient.
Our adhesive layer was prepared from a solution of white Vaseline in xylol according to recommendations in the manual for the SM16706 Konimeter of Sartorius-Membranjilter GmbH. Its quality was checked in an experiment on the re-entrainment of loess particles with d = 2&1OOpm from the surface. These measurements demonstrated zero probability of reentrainment from the layer.
According to our measurements the value of the attachment coefficient was close to 0.9 without any meaningful dependence on particle size. These measurements are illustrated by Fig. 2, where the average attachment coefficient over sizes 4-64pm equals 0.86 k 0.02.
Much efforts have been devoted to experimental and theoretical investigation of particle resuspension, especially in connection with a problem of dust samplers’ efficiency (Vincent and Gibson, 1981, Ingham and Yan, 1994). A review of models of particle reentrainment can be found in the article of Ziskind et al. (1995). Pau U and Braaten (1995) gave a review of rebound-reentrainment theories and made numerical simulations of combined effect of these processes. The last two authors conclude, that rebound is a dominant process in limiting net deposition of particles from flows parallel to collecting surfaces.
2000
1500
z 3
k 2 1000
f
500
0 I L I 1 / I I
2
1.5
I
3
1;
% .$
E 8
u
0.5
0 4 8 16 32 64
Particle size, micrometer
+ A: glass surface + B: glass with adhesive coating
+ coefficient of attachment
Fig. 2. Measurement of attachment coefficient on a sample, half-coated with a adhesive layer.
134 Sergey Biryukov
Relatively small resuspension from the non-greased part of our samples can be explained by low wind speeds during the reported measurements (see Section 3.2 of this article).
3. EXPERIMENTAL DATA AND DISCUSSION
3.1. Frequenqs distribution qfparticle sizes on suyfaces
We started by measuring the size distributions of dust particles which had accumulated on the surfaces of solar collectors. The reported results are limited to the case of dry deposition. This means that for all reported cases the samples were exposed to airborne dust under ambient conditions (of temperature and relative humidity) that were relatively far removed from the dew condensation point. As a result, the weight of the individual particles was conserved during deposition, not being changed by accumulated water. In addition, the collected dust was not washed out from the sample surface by dew and the picture of randomly deposited particles on the surface was not disturbed by water drops.
The average wind speed for different data sets during all reported particle-size distribu- tion measurements was usually 2.5-3.5 m s- ’ and did not exceed 5.8 m s- ‘. The highest registered average value for a lo-minute interval during the same period was 8.5 m s- ‘.
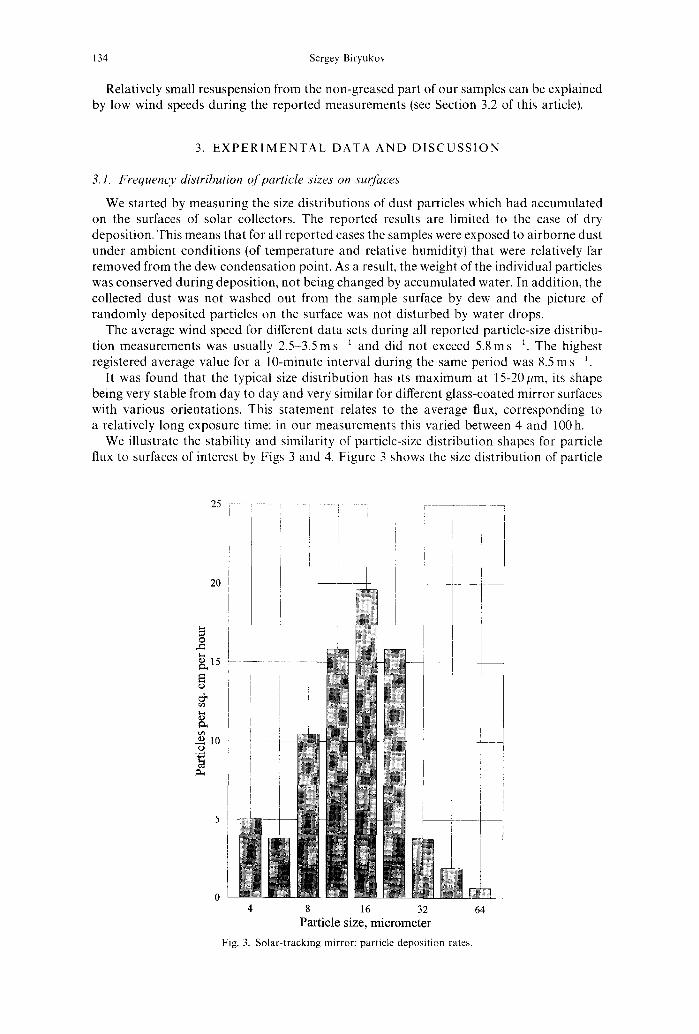
It was found that the typical size distribution has its maximum at 15-20/~rn, its shape being very stable from day to day and very similar for different glass-coated mirror surfaces with various orientations. This statement relates to the average flux, corresponding to a relatively long exposure time: in our measurements this varied between 4 and 100 h.
We illustrate the stability and similarity of particle-size distribution shapes for particle flux to surfaces of interest by Figs 3 and 4. Figure 3 shows the size distribution of particle
I i
4 8 16 32 64 Particle size, micrometer
Fig. 3. Solar-tracking mirror: particle deposition rates
An experimental study of the dry deposition 135
0.35
0.3
_ r -t
_r
--t---- -+ j
4
-
-
-
-
-
-
-
8 16 32 64
-
-_
-
4 i -I
I
I
I - 1 I !
-
-
-~
-
-.
-
-
Particle size, micrometer
1 horizontal sample “vertical” sample
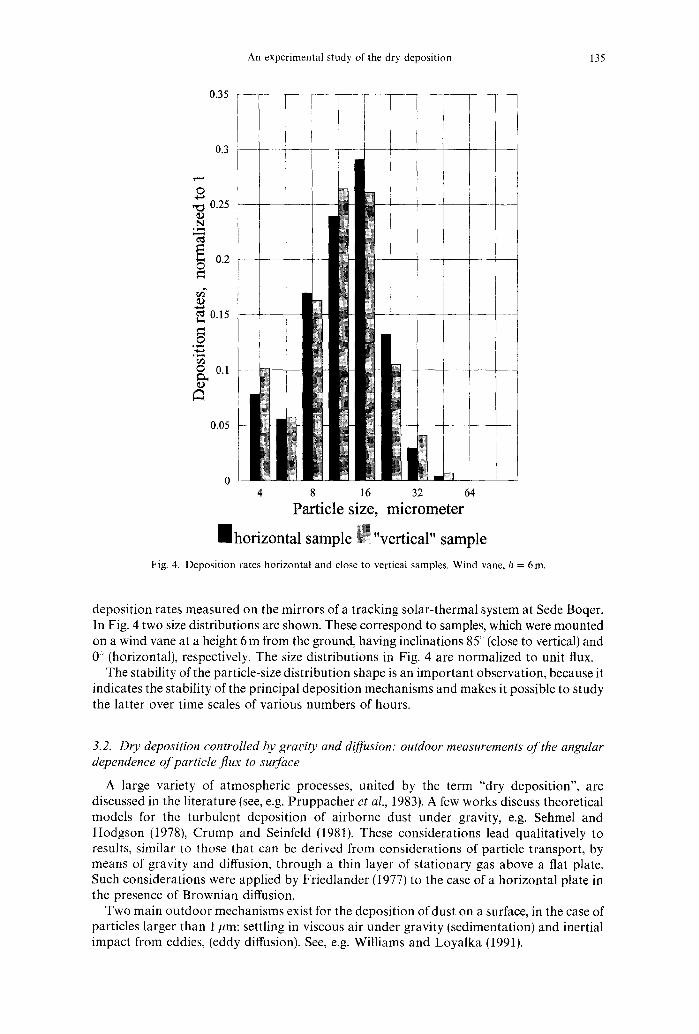
Fig. 4. Deposition rates horizontal and close to vertical samples. Wind vane, h = 6 m
deposition rates measured on the mirrors of a tracking solar-thermal system at Sede Boqer. In Fig. 4 two size distributions are shown. These correspond to samples, which were mounted on a wind vane at a height 6 m from the ground, having inclinations 85” (close to vertical) and 0” (horizontal), respectively. The size distributions in Fig. 4 are normalized to unit flux.
The stability of the particle-size distribution shape is an important observation, because it indicates the stability of the principal deposition mechanisms and makes it possible to study the latter over time scales of various numbers of hours.
3.2. Dry deposition controlled by gravity and diffusion: outdoor measurements of the angular dependence of particle flux to surface
A large variety of atmospheric processes, united by the term “dry deposition”, are discussed in the literature (see, e.g. Pruppacher et al., 1983). A few works discuss theoretical models for the turbulent deposition of airborne dust under gravity, e.g. Sehmel and Hodgson (1978) Crump and Seinfeld (1981). These considerations lead qualitatively to results, similar to those that can be derived from considerations of particle transport, by means of gravity and diffusion, through a thin layer of stationary gas above a flat plate. Such considerations were applied by Friedlander (1977) to the case of a horizontal plate in the presence of Brownian diffusion.
Two main outdoor mechanisms exist for the deposition of dust on a surface, in the case of particles larger than 1 ,nm: settling in viscous air under gravity (sedimentation) and inertial impact from eddies, (eddy diffusion). See, e.g. Williams and Loyalka (1991).

136 Sergey Biryukok
In order to derive an expression for the deposition velocity I/ via turbulent flow under gravity one may consider a stationary gas above a flat plate with slope 0 to the horizontal and particles that are transported, by means of gravity (V, cos 0) and diffusion, through a thin layer of the gas. For the particle sizes in our range of interest Brownian diffusion is negligible and we can describe by a diffusion coefficient D other diffusive mechanisms (in our case, turbulent diffusion).
Far enough from the leading edge of a thin flat plate 2 (Fig. 1) parallel to the wind, for a flush-type flat sample 3 (Fig. 1) in the middle of it which is small relative to the plate, and for reasonably low wind speed, which also enters the expressions for Reynolds number and for the thickness of the laminar boundary layer (Friedlander, 1977), there is practically no dependence of deposition rate on the coordinate in the wind direction. Our control measurements of dependence of the numerical surface density of deposited particles on the coordinate in the wind direction confirmed this assumption. The one-dimensional approxi- mation can be used for calculation of particle flux to the sample surface in this case and the linear equation for flux to the surface is
J = D$ + V,cosCln. (4)
Here V, is the sedimentation velocity, D the turbulent diffusivity. and n the particle concentration. The z-axis is normal to the surface.
Let n = N at the edge of the gas layer (at z = h) and at z = 0 let n = 0. The flux J is obtained from the integral of equation (4) under these boundary condi-
tions as
J= vs cos (IN
1 - exp(- V,cos0h/D)’
If Vs cos Gh/D >> 1 then J z Vs cos UN, or I’ 2 I/, cos 0 (a situation in which gravity controls deposition, the diffusion term being negligible). This gives similar particle-size distributions on a surface for different slopes and zero flux (deposition rate) on a vertical surface.
If, on the other hand, Vscos Bh/D<< 1 then J k DNjh, or V c D/h (gravity being now negligible). In this case the deposition velocity I/ and deposition rate do not depend on the surface slope.
We performed outdoor measurements in order to estimate the relative contribution of sedimentation and diffusion processes in the deposition rates for particles of different sizes. The measurements were performed at Sede Boqer, in the Negev highlands.
We measured the value of Je (flux on the inclined glass sample, kept parallel to the wind direction) relative to J (flux on a horizontal sample) using the previously described sampling technique and particle sizing by means of computerized optical microscopy. We also determined the coefficient of attachment for particles of different sizes d, in the manner described above. Our measurements with different slopes (for (1 = 45 and 60”) revealed a dependence of the form J,(d)/ J (II) = cos (1. Even for 0 > 80” we did not find a meaningful deviation from this “cos 0” dependence.
The results of these experiments are shown in Fig. 5. Experiments on horizontal but down-facing samples at heights of 2 and 6 m indicated a flux at least an order of magnitude lower than on vertical samples.
The average wind speed for different data sets during the measurements with variable sample inclinations never exceeded 3.6 m s- ‘. During measurements the highest individual value of this parameter approached 4.9 m s -I (10 min average). This range of wind speeds applies also to the measured values of the attachment coefficient.
3.3. Discussion of the model,fov dry deposition qf ambient dust
We can summarize the main properties of the measured deposition rates as follows:
(1) the particle-size distributions demonstrate a stability of shape under conditions of dry deposition and moderate average wind speeds of O-6 m s- ‘;
An experimental study of the dry deposition 137
JW 1 J(c) vse
for partides of all sizes 1.1 1
0.9 0.8 0.7 0.6 0.5 0.4 03 0.2 0.1 0
0 10 20 30 40 50 60 70 80 90 The slope angle, 8 (degrees)
for particles less than 8 micron 1.1 1
0.9 0.8 0.7 0.6 0.5 0.4 0.3 02 0.1 0
0‘ 10 20 30 40 50 60 70 -80 90 The slope angle, 8 (degrees)
for pat-tides between 8 and 16 micron for particles larger than 16 micron 1.1 1.1 1 1
0.9 0.9 0.8 0.8
9.7 0.7
0.6 0.6 OS 0.5
0.4 0.4
0.3 0.3 0.2 - \\ 0.2 \\ 0.1 1 0.1 \
0 2. o- 0 10 20 30 40 50 60 70 80 90 0 10 20 30 40 so 60 70 80 90 The slope angle, 0 (degrees) The slope angle, 8 (degrees)
Fig. 5. The measured deposition rates compared with the cos O-dependence.
(2) the shape of the particle-size distribution does not depend on the surface slope angle for particle sizes in the range 4-64 pm;
(3) the deposition rate is proportional to cos6 for 0 varying from 0” to at least 85”.
According to our discussion of the relative role of gravitational and diffusive types of deposition we conclude that the former mechanism dominates for particles with sizes 4-64pm under conditions of dry deposition and moderate wind speed (less than 4 m s- ‘), at least for quantities, averaged over periods of several hours.
This being the case, we can make an attempt to derive data about volume dust concentration versus particle size from data on the deposition rate on horizontal surfaces:
J,(d) 44 = I/,o.
The sedimentation velocity can be calculated as
(7)
where p is the particle density, g the acceleration due to gravity, p the air’s dynamic viscosity, C the Cunningham correction factor (x 1 for d > 1 pm), and K the dynamic shape factor (see: Williams and Loyalka, 1991, p. 52-66).
K depends on the nonsphericity of the particles and on their surface area. We estimate this factor, to be 1.0 < K < 1.2 for our case.
.
138 Sergey Biryukov
4 8 16 32 64
Particle size, micrometer
+ mass concentration (derived)
+ deposition rates (measured)
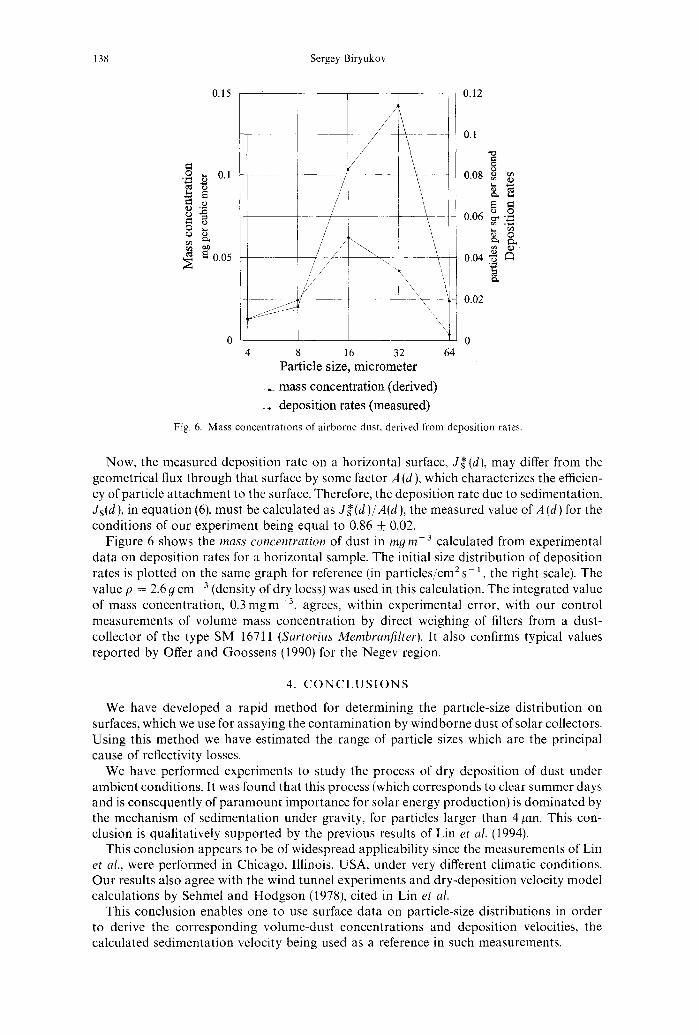
Fig. 6. Mass concentrations of airborne dust, derived from deposition rates
Now, the measured deposition rate on a horizontal surface, J?(d), may differ from the geometrical flux through that surface by some factor A(d), which characterizes the efficien- cy of particle attachment to the surface. Therefore, the deposition rate due to sedimentation, J,(d), in equation (6), must be calculated as J:(d)/A(d), the measured value of A(d) for the conditions of our experiment being equal to 0.86 k 0.02.
Figure 6 shows the mass concentration of dust in my mp3 calculated from experimental data on deposition rates for a horizontal sample. The initial size distribution of deposition rates is plotted on the same graph for reference (in particles/cm2 s ‘, the right scale). The value p = 2.6 g cm 3 (density of dry loess) was used in this calculation. The integrated value of mass concentration, 0.3 mgmd3, agrees, within experimental error, with our control measurements of volume mass concentration by direct weighing of filters from a dust- collector of the type SM 16711 (Sartorius Membraqjdter). It also confirms typical values reported by Offer and Goossens (1990) for the Negev region.
4. CONCLUSIONS
We have developed a rapid method for determining the particle-size distribution on surfaces, which we use for assaying the contamination by windborne dust of solar collectors. Using this method we have estimated the range of particle sizes which are the principal cause of reflectivity losses.
We have performed experiments to study the process of dry deposition of dust under ambient conditions. It was found that this process (which corresponds to clear summer days and is consequently of paramount importance for solar energy production) is dominated by the mechanism of sedimentation under gravity, for particles larger than 4pm. This con- clusion is qualitatively supported by the previous results of Lin et al. (1994).
This conclusion appears to be of widespread applicability since the measurements of Lin et czl., were performed in Chicago, Illinois, USA, under very different climatic conditions. Our results also agree with the wind tunnel experiments and dry-deposition velocity model calculations by Sehmel and Hodgson (1978), cited in Lin et al.
This conclusion enables one to use surface data on particle-size distributions in order to derive the corresponding volume-dust concentrations and deposition velocities, the calculated sedimentation velocity being used as a reference in such measurements.

An experimental study of the dry deposition 139
Using this technique, we derived values for the volume dust concentrations of particles of various sizes from about 4 pm to about 60 pm, from our outdoor measurements of particle size distributions on glass surfaces. Furthermore, the absolute values of such concentrations and their dependence on particle-size agreed with previously published values.
We plan to use the technique, developed here, as a key instrument for experiments aimed at protecting the surfaces of solar collectors from dust.
Acknowledgements-This research was partially funded by the Israel Ministry of Science and Arts and parts by the Israel Ministry of Energy and Infrastructure. The author is indebted to Prof. D. Faiman for drawing his attention to the practical importance of this problem and for many valuable discussions. It is also the author’s pleasant duty to express deep appreciation to Prof. J. Vincent for his instructive recommendations on preparation of the revised version of this paper.
REFERENCES
Biryukov, S., Faiman, D. and Goldfeld, A. (1994) Characterization of mirror reflectivity losses caused by dust deposited under different meteorological conditions. In Proc. Int. Conf on Compuratioe Assessments of Solar Power Technologies SOLCOM I (Edited by Roy, A., Ben Gurion University of the Negev, Beer-Sheva, Israel and Grasse,W., Deutsche Forschungsanstalt fur Luft- und Raumfahrt, e.V., Cologne, Germany. pp. 373-382. Jerusalem.
Brimblecombe, P. (1986) Air Composition and Chemistry. Cambridge University Press, New York. Crump, J. G. and Seinfeld, J. H. (1981) Turbulent deposition and gravitational sedimentation of an aerosol in
a vessel of arbitrary shape. J. Aerosol Sci. 12, 405415. El-Nashar, A. M. (1994) The effect of dust accumulation on the performance of evacuated tube collectors.
Sol. Energy 1, 105-l 15. El-Shobokshy, M. S. and Hussein, F. M. (1993) Effect of dust with different physical properties on the performance
of photovoltaic cells. Sol. Energy 51, 505-511. Friedlander, S. K. (1977) Smoke, Dust and Haze. Wiley, New York. Guddihy, E. F. (1988) Soiling mechanisms and performance of anti-soiling coatings. In Particles on Surfaces:
Detection, Adhesion, and Removal, Vol. 1 (Edited by Mittal, K. L.), p. 91. Plenum Press, New York and London. Hinds, W. C. (1982) Aerosol Technology. Properties, Behurior, and Measurement of Airborne Particles. Wiley,
New York. Ingham, D. B. and Yan, B. (1994) Re-entrainment of particles on the outer wall of a cylindrical blunt sampler.
J. Aerosol Sci. 25, 327-340. Lin, J. J., Noll, K. E. and Holsen, T. M. (1994) Dry deposition velocities as a function of particle size in the ambient
atmosphere. Aerosol Sci. Technol. 20, 239-252. Offer, Z. I. and Goossens, D. (1990) Airborne dust in the Northern Negev desert.J. Arid Environ. 18, 1-19. Paw U. K. T. and Braaten, D. A. (1995) New perspectives on rebound and reentrainment processes. Aerosol Sci.
Technol. 23, 72279. Pruppacher, H. R., Semonin, R. G. and Slinn, W. G. (coordinators) (1983) Precipitation scavenging, dry deposition,
and resuspension, In Vol: 1, 2. Proc. of the 4th Int. Conf Santa Monica, California, 29 November-3 December, 1982, Elsevier, New York.
Pye, K. (1989) Aeolian Dust and Dust Deposits. Academic Press, New York. Reeks, M. W., Reed, J. and Hall, D. (1988) On the resuspension of small particles by a turbulent flow. J. Phys. D:
Appl. Phys. 21, 574-589. Russ, J. S. (1990) Computer-Assisted Microscopy. The Measurement and Analysis of Images. Plenum Press,
New York and London. Sayigh, A. A. M., Al-Jandal, S. and Ahmed, H. (1987) Dust effect on solar flat surfaces devices in Kuwait. In 1985
Workshop on the Physics of Non-Conventional Energy Sources and Material Sciencefor Energy (Edited by Furlan, G., Mancini, N. A., Sayigh, A. A. M. and Seraphin, B. 0.) p. 353. World Scientific, Singapore.
Sehmel, G. A. and Hodgson, W. H. (1978) DOE Report PNL-SA-6721. Pacific Northwest Laboratory, Richland, Washington.
Stine, W. B. and Harrigan, R. W. (1985) Solar Energy Fundamentals and Design. Wiley, Brisbane-Toronto- Singapore.
Twomey, S. (1977) Atmospheric Aerosols. Elsevier, New York. Vincent, J. H. and Gibson, H. (1981) Sampling errors in blunt dust samplers arising from external wall loss effects.
J. Aerosol Sci. 15, 703-712. Williams, M. M. R. and Loyalka, S. K. (1991) Aerosol Science Theory and Practice. With Special Applications to the
Nuclear Industry. Pergamon Press, New York. Ziskind, G., Fichman, M. and Gutfinger, C. (1995) Resuspension of particulates from surfaces to turbulent
flows-review and analysis. J. Aerosol Sci. 26, 613-644.