
AN EXPERIMENTAL STUDY OF PARTICLE SIZE AND …etd.lib.metu.edu.tr/upload/12618813/index.pdf · an...
115
AN EXPERIMENTAL STUDY OF PARTICLE SIZE AND CONCENTRATION EFFECTS OF CALCIUM CARBONATE ON RHEOLOGICAL AND FILTRATION PROPERTIES OF DRILL-IN FLUIDS A THESIS SUBMITTED TO THE GRADUATE SCHOOL OF NATURAL AND APPLIED SCIENCES OF MIDDLE EAST TECHNICAL UNIVERSITY BY AYDIN ODABAŞI IN PARTIAL FULFILLMENT OF THE REQUIREMENTS FOR THE DEGREE OF MASTER OF SCIENCE IN PETROLEUM AND NATURAL GAS ENGINEERING MAY 2015
Transcript of AN EXPERIMENTAL STUDY OF PARTICLE SIZE AND …etd.lib.metu.edu.tr/upload/12618813/index.pdf · an...
AN EXPERIMENTAL STUDY OF PARTICLE SIZE AND CONCENTRATION
EFFECTS OF CALCIUM CARBONATE ON RHEOLOGICAL AND
FILTRATION PROPERTIES OF DRILL-IN FLUIDS
A THESIS SUBMITTED TO
THE GRADUATE SCHOOL OF NATURAL AND APPLIED SCIENCES
OF
MIDDLE EAST TECHNICAL UNIVERSITY
BY
AYDIN ODABAŞI
IN PARTIAL FULFILLMENT OF THE REQUIREMENTS
FOR
THE DEGREE OF MASTER OF SCIENCE
IN
PETROLEUM AND NATURAL GAS ENGINEERING
MAY 2015


Approval of the thesis:
AN EXPERIMENTAL STUDY OF PARTICLE SIZE AND
CONCENTRATION EFFECTS OF CALCIUM CARBONATE ON
RHEOLOGICAL AND FILTRATION PROPERTIES OF DRILL-IN FLUIDS
Submitted by AYDIN ODABASI in partial fulfillment of the requirements for the degree of Master of Science in Petroleum and Natural Gas Engineering Department Middle East Technical University by, Prof. Dr. Gülbin Dural Ünver ___________________ Dean, Graduate School of Natural and Applied Sciences Prof. Dr. M. Verşan Kök ___________________ Head of Department, Petroleum and Natural Gas Eng. Prof. Dr. M. Verşan Kök ___________________ Supervisor, Petroleum and Natural Gas Eng. Assoc. Prof. Dr. İ. Hakkı Gücüyener ___________________ Co-Supervisor, GEOS Energy Inc.
Examining Committee Members: Prof. Dr. Mahmut Parlaktuna Petroleum and Natural Gas Engineering Dept., METU ___________________ Prof. Dr. M. Verşan Kök Petroleum and Natural Gas Engineering Dept., METU ___________________ Associate Prof. Dr. İ. Hakkı Gücüyener GEOS Energy Inc. ___________________ Assistant Prof. Dr. Çağlar Sinayuc Petroleum and Natural Gas Engineering Dept., METU ___________________ Osman Gündüz, MS GEOS Energy Inc. ___________________
Date : ____________________

iv
I hereby declare that all information in this document has been obtained and
presented in accordance with academic rules and ethical conduct. I also
declare that, as required by these rules and conduct, I have fully cited and
referenced all material and results that are not original to this work.
Name, Last name: Aydın Odabaşı
Signature:
v
ABSTRACT
AN EXPERIMENTAL STUDY OF PARTICLE SIZE AND CONCENTRATION
EFFECTS OF CALCIUM CARBONATE ON RHEOLOGICAL AND
FILTRATION PROPERTIES OF DRILL-IN FLUIDS
Odabaşı Aydın
M.S., Department of Petroleum and Natural Gas Engineering
Supervisor: Prof. Dr. M. Verşan Kök
Co-Supervisor: Assoc. Prof. Dr. İ. Hakkı Gücüyener
May 2015, 97 pages
Specially designed non-damaging Drill-In Fluids (DIF) are being effectively applied
for drilling depleted zones worldwide. Shape, particle size distribution and
concentration of materials like calcium carbonate (CaCO3) are key parameters
determining the effectiveness of DIF. In this study, 3 different sized and 5 different
concentrations CaCO3 are used to examine the effects of these factors on rheology
and fluid loss of DIF. Sized calcium carbonates are used as major particles in
different concentrations and in different particle size distribution. Rheological
behavior of fluid, filter cake quality and filtrate volume are basic parameters to be
evaluated in this study. All samples were aged at 120 ºF for 4 hours. After ageing,
tests are performed at 75 °F and 100 psi of differential. It is observed that, the DIF
showed certain Yield Power Law charcteristics and some parameters ( PV,m) was
increased with increasing size and concentration whereas other parameters ( YP,k)
decreased .
Key words: Drilling, drilling fluid, drilling mud, calcium carbonate.

vi

vii
ÖZ
KALSİYUM KARBONAT KONSANTRASYONUNUN VE TANE
BOYUTUNUN POLİMER ESASLI REZERVUAR SONDAJ SIVILARININ
REOLOJİK VE FİLTRASYON ÖZELLİKLERİNE ETKİLERİ ÜSTÜNE
DENEYSEL BİR ÇALIŞMA
Odabaşı, Aydın
Yüksek Lisans, Petrol ve Doğal Gaz Mühendisliği Bölümü
Tez Yöneticisi: Prof. Dr. M. Verşan Kök
Ortak-Tez Yöneticisi: Doç. Dr. İ. Hakkı Gücüyener
Mayıs 2015, 97 sayfa
Formasyonu tahrip etmeyen özel olarak tasarlanmış Rezervuar Sondaj Sıvıları
(RSS) dünyanın her yerinde basıncı düşmüş alanların delinmesinde etkin bir şekilde
kullanılmaktadır. Kalsiyum karbonat(CaCO3) malzemelerinin şekli, tane boyutu
dağılımı ve konsantrasyonu RSS’nın etkinliğini belirleyen başlıca parametrelerdir.
Bu çalışmada, reolojiye ve su kaybına olan etkilerini incelemek adına, 3 farklı
boyutta ve 5 farklı konsantrasyonda CaCO3 kullanılmıştır. Değişik boyutta ve
konsantrasyondaki boyutlandırılmış kalsiyum karbonat rezervuar sondaj sıvıları
etkin malzemeleri olarak değerlendirilecektir. RSS’nın reoloji okumaları, kek
kalitesi ve toplam filtrat hacmi bu çalışmada değerlendirilen başlıca parametrelerdir.
Hazırlanan örnekler 120 ºF’de 4saat yaşlandırılmıştır. Yaşlandırma çalışmalarından
sonra, testler 75 ºF ve 100 psi basınç farkında gerçekleştirilmiştir. Bu deneysel
çalımada görüldü ki; RSS kesin olarak “Yield Power Law” akış modeli karakteri
göstermiştir ve bazı parametreler(PV,m) artan boyut ve konsantrasyonlarda artış
gösterirken bazı parametreler (YP,k) düşüş göstermiştir.
Anahtar kelimeler: Sondaj, sondaj sıvısı, sondaj çamuru, kalsiyum karbonat.

viii
To My Family

ix
ACKNOWLEDGEMENTS
I would like to thank my supervisor Prof. Dr. Verşan Kök and co-supervisor
Associate Prof. Dr. İ. Hakkı Gücüyener for their guidance, advice, criticism,
encouragements and insight throughout the study.
Also Osman Gündüz, Gökhan Bağatır and Hakan Çördük of GEOS Energy Inc.,
Burak Kayael of TPOFS and Bahri Kutlu are gratefully acknowledged of their help
and assistance.
I would also like to thank my whole family for their support and encouragement
throughout the study.

x
xi
TABLE OF CONTENTS
ABSTRACT ............................................................................................................. v
ÖZ .......................................................................................................................... vii
ACKNOWLEDGEMENTS .................................................................................... ix
TABLE OF CONTENTS ........................................................................................ xi
LIST OF FIGURES .............................................................................................. xiii
LIST OF TABLES ............................................................................................... xvii
CHAPTERS…………………………………………………………………………
1. INTRODUCTION .................................................................................... 1
2. LITERATURE REVIEW ......................................................................... 5
2.1. Overview to Loss Circulation ............................................................... 5
2.2. Size Selection of Bridging Material ..................................................... 7
2.3. Polymer & Other Additives Selection .................................................. 9
2.4. Dimensional Approach to CaCO3 ...................................................... 12
2.5. Rheological Study ............................................................................... 14
3. STATEMENT OF PROBLEM ............................................................... 21
4. EXPERIMENTAL SET-UP AND PROCEDURE ................................. 23
4.1. Determination of Particle Size Distribution ....................................... 23
4.2. Determination of Rheological Properties ........................................... 29
4.3. Measurement of Fluid Loss ................................................................ 32
4.4. Mixing and Ageing ............................................................................. 34
4.5. Additives ............................................................................................. 35
4.6. Formulation ......................................................................................... 36
5. RESULTS AND DISCUSSION ............................................................. 37
5.1 Effect of Concentration of CaCO3 on Rheological Behavior of Drill-In
Fluids. .................................................................................................. 37
5.2. Effect of Concentration and Particle Size of CaCO3 on Rheological
Properties ............................................................................................. 45
5.3. Effect of CaCO3 Concentration and Particle Size on Fluid Loss ....... 64
xii
6. CONCLUSIONS ..................................................................................... 67
7. RECOMMENDATIONS ........................................................................ 69
8. REFERENCES ....................................................................................... 71
APPENDICIES………………………………………………………………………
A MEASURED AND CALCULATED SHEAR STRESSES-SHEAR RATES
DATA FOR BINGHAM PLASTIC MODEL FOR < 45 MICRON SIZE ........... 75
B MEASURED AND CALCULATED SHEAR STRESSES-SHEAR RATES
DATA FOR POWER LAW MODEL FOR 45 MICRON SIZE ........................... 77
C MEASURED AND CALCULATED SHEAR STRESSES-SHEAR RATES
DATA FOR YIELD POWER LAW MODEL FOR < 45 MICRON SIZE ........... 79
D MEASURED AND CALCULATED SHEAR STRESSES-SHEAR RATES
DATA FOR BINGHAM PLASTIC MODEL FOR 75-45 MICRON SIZE .......... 81
E MEASURED AND CALCULATED SHEAR STRESSES-SHEAR RATES
DATA FOR POWER LAW MODEL FOR 75 - 45 MICRON SIZE .................... 83
F MEASURED AND CALCULATED SHEAR STRESSES-SHEAR RATES
DATA FOR YIELD POWER LAW MODEL FOR 75 - 45 MICRON SIZE ....... 85
G MEASURED AND CALCULATED SHEAR STRESSES-SHEAR RATES
DATA FOR BINGHAM PLASTIC MODEL FOR 250 - 75 MICRON SIZE ...... 87
H MEASURED AND CALCULATED SHEAR STRESSES-SHEAR RATES
DATA FOR POWER LAW MODEL FOR 250 - 75 MICRON SIZE .................. 89
I MEASURED AND CALCULATED SHEAR STRESSES-SHEAR RATES
DATA FOR YIELD POWER LAW MODEL FOR 250 - 75 MICRON SIZE ..... 91
J RHEOLOGICAL PROPERTIES AS A FUNCTION OF CACO3
CONCENTRATION AND PARTICLE SIZE ....................................................... 93
K FLUID LOSS DATA AS A FUNCTION OF CONCENTRATION AND
PARTICLE SIZE OF CACO3 ............................................................................... 97
xiii
LIST OF FIGURES
FIGURES
Figure 1 Plugging lost circulation zones with Drill-In Fluid. (MI Drilling Fluids
Engineering Manual, Copyright 1998) ........................................................................ 3
Figure 2 Lost Circulation Sections (MI Drilling Fluids Engineering Manual,
Copyright 1998) ........................................................................................................... 6
Figure 3 Wrongly Sized CaCO3 in Drill-In Fluid, (Gücüyener, 2010) ....................... 7
Figure 4 Correctly Sized CaCO3 in Drill-In Fluid, (Gücüyener, 2010) ...................... 8
Figure 5 Calcium Carbonate (Verret et al., 2000) ...................................................... 11
Figure 6 Laminar Flow of Newtonian Fluid (“Rheology of Drilling Muds”, n. d.) .. 16
Figure 7 Shear stress Vs Shear rate for a Newtonian fluid. (“Rheology of Drilling
Muds”, n. d.) .............................................................................................................. 17
Figure 8 Shear Rate Vs Shear Stress for a Bingham plastic fluid. (“Rheology of
Drilling Muds”, n. d.) ................................................................................................. 18
Figure 9 Flow curves for various types of time independent fluids. (“Rheology of
Drilling Muds”, n. d.) ................................................................................................. 20
Figure 10 ASTM-E11 numbers of sieves and their mesh sizes in microns ............... 25
Figure 11 ASTM-E11 numbers of sieves and their mesh sizes in microns. [ASTM
E175-82(1995) Standard Terminology of Microscopy, American Society for Testing
and Materials, West Conshohocken, PA (1995)] ....................................................... 26
Figure 12 ASTM-E11 numbers of sieves and their mesh sizes. [ASTM E175-
82(1995) Standard Terminology of Microscopy, American Society for Testing and
Materials, West Conshohocken, PA (1995) ] ............................................................ 26
Figure 13 Circular Vibratory Screen, Endecotts, EFL2 MK3, 300mm Dia .............. 27
Figure 14 FANN 35A Model Rotational Viscometer ( Fann Instrument Company,
Model 35 Viscometer Instruction Manual, 2015 ) ..................................................... 29
Figure 15 Overview of OFITE Low Pressure Filter Press (OFITE Instruments, 2009)33
Figure 16 The Sterling Multi Mixer (Sterling, Multimixer Instruction Manual, 2003)34
Figure 17 GEOS Aging Unit ...................................................................................... 34

xiv
Figure 18 Flow Curves for BP, PL and YPL Models (CaCO3<45µm, 5lb/bbl) ........ 38
Figure 19 Flow Curves for BP, PL and YPL Models (CaCO3<45µm, 15lb/bbl) ...... 38
Figure 20 Flow Curves for BP, PL and YPL Models (CaCO3<45µm, 30lb/bbl) ...... 39
Figure 21 Flow Curves for BP, PL and YPL Models (CaCO3<45µm, 45lb/bbl) ...... 39
Figure 22 Flow Curves for BP, PL and YPL Models (CaCO3<45µm, 60lb/bbl) ...... 40
Figure 23 Flow Curves for BP, PL and YPL Models (CaCO3 75-45µm, 5lb/bbl) .... 40
Figure 24 Flow Curves for BP, PL and YPL Models (CaCO3 75-45µm, 15lb/bbl) .. 41
Figure 25 Flow Curves for BP, PL and YPL Models (CaCO3 75-45µm, 30lb/bbl) .. 41
Figure 26 Flow Curves for BP, PL and YPL Models (CaCO3 75-45µm, 45lb/bbl) .. 42
Figure 27 Flow Curves for BP, PL and YPL Models (CaCO3 75-45µm, 60lb/bbl) .. 42
Figure 28 Flow Curves for BP, PL and YPL Models (CaCO3 250-75µm, 5lb/bbl) .. 43
Figure 29 Flow Curves for BP, PL and YPL Models (CaCO3 250-75µm, 15lb/bbl) 43
Figure 30 Flow Curves for BP, PL and YPL Models (CaCO3 250-75µm, 30 lb/bbl)44
Figure 31 Flow Curves for BP, PL and YPL Models (CaCO3 250-75µm, 45 lb/bbl)44
Figure 32 Flow Curves for BP, PL and YPL Models (CaCO3 250-75µm, 60 lb/bbl)45
Figure 33 Effect of CaCO3 Concentration on PV (<45 µm) ..................................... 46
Figure 34 . Effect of CaCO3 Concentration on PV (75-45 µm) ................................ 46
Figure 35 Effect of CaCO3 Concentration on PV (250-75 µm) ................................ 47
Figure 36 Effect of CaCO3 Concentration on PV for Different Particle Sizes .......... 47
Figure 37 Effect of CaCO3 Concentration on YP (<45 µm) ..................................... 48
Figure 38 Effect of CaCO3 Concentration on YP (75-45 µm) .................................. 49
Figure 39 Effect of CaCO3 Concentration on YP (250-75 µm) ................................ 49
Figure 40 Effect of CaCO3 Concentration on YP for Different Particle Sizes .......... 50
Figure 41 Effect of CaCO3 Concentration on na (<45 µm) ....................................... 51
Figure 42 Effect of CaCO3 Concentration on na (75-45 µm).................................... 51
Figure 43 Effect of CaCO3 Concentration on na (250-75 µm).................................. 52
Figure 44 Effect of CaCO3 Concentration on na for Different Particle Sizes ........... 52
Figure 45 Effect of CaCO3 Concentration on Ka (<45 µm) ...................................... 53
Figure 46 Effect of CaCO3 Concentration on Ka (75-45 µm) ................................... 53
Figure 47 Effect of CaCO3 Concentration on Ka (250-75 µm) ................................. 54
Figure 48 Effect of CaCO3 Concentration on na for Different Particle Sizes ........... 54
Figure 49 Effect of CaCO3 Concentration on np (<45 µm) ...................................... 55

xv
Figure 50 Effect of CaCO3 Concentration on np (75-45 µm) ................................... 55
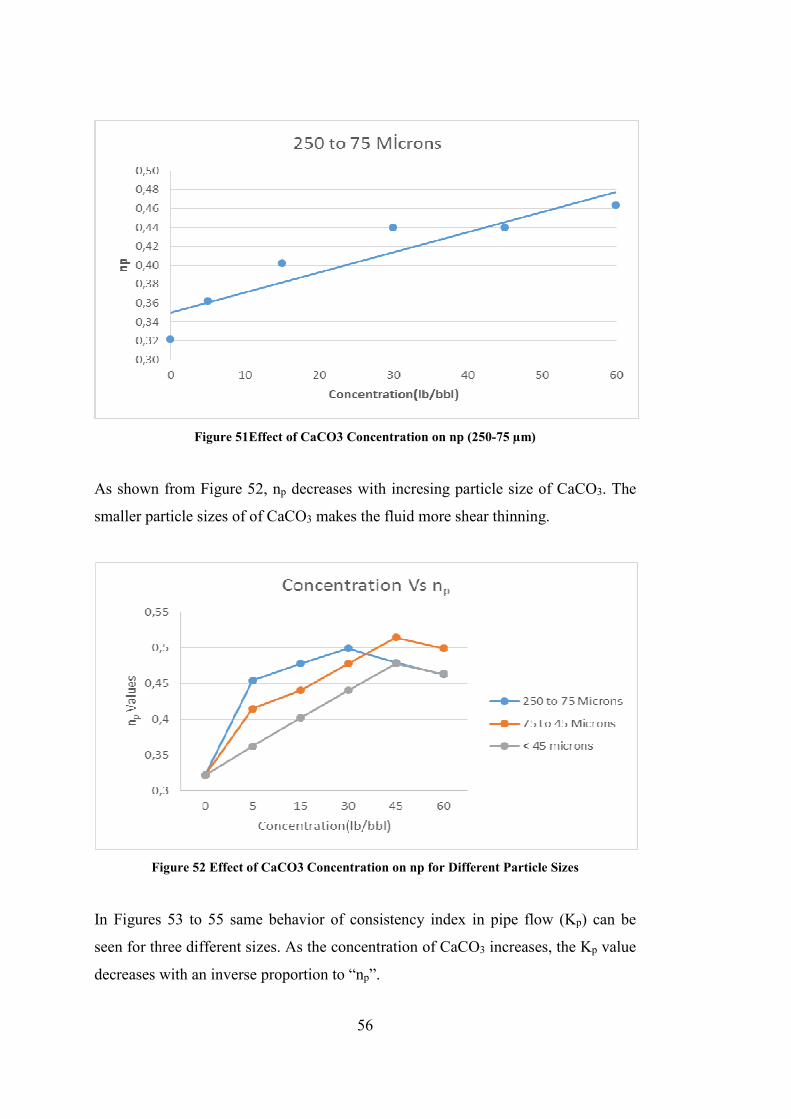
Figure 51Effect of CaCO3 Concentration on np (250-75 µm) .................................. 56
Figure 52 Effect of CaCO3 Concentration on np for Different Particle Sizes ........... 56
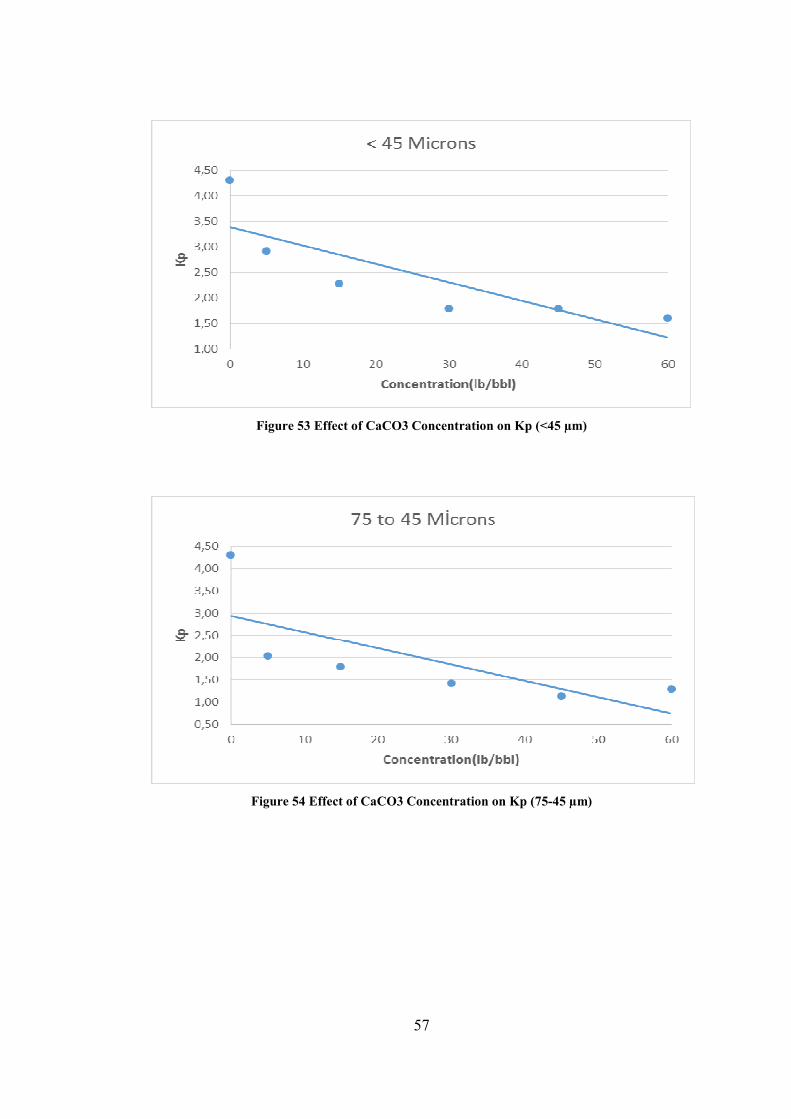
Figure 53 Effect of CaCO3 Concentration on Kp (<45 µm) ..................................... 57
Figure 54 Effect of CaCO3 Concentration on Kp (75-45 µm) .................................. 57
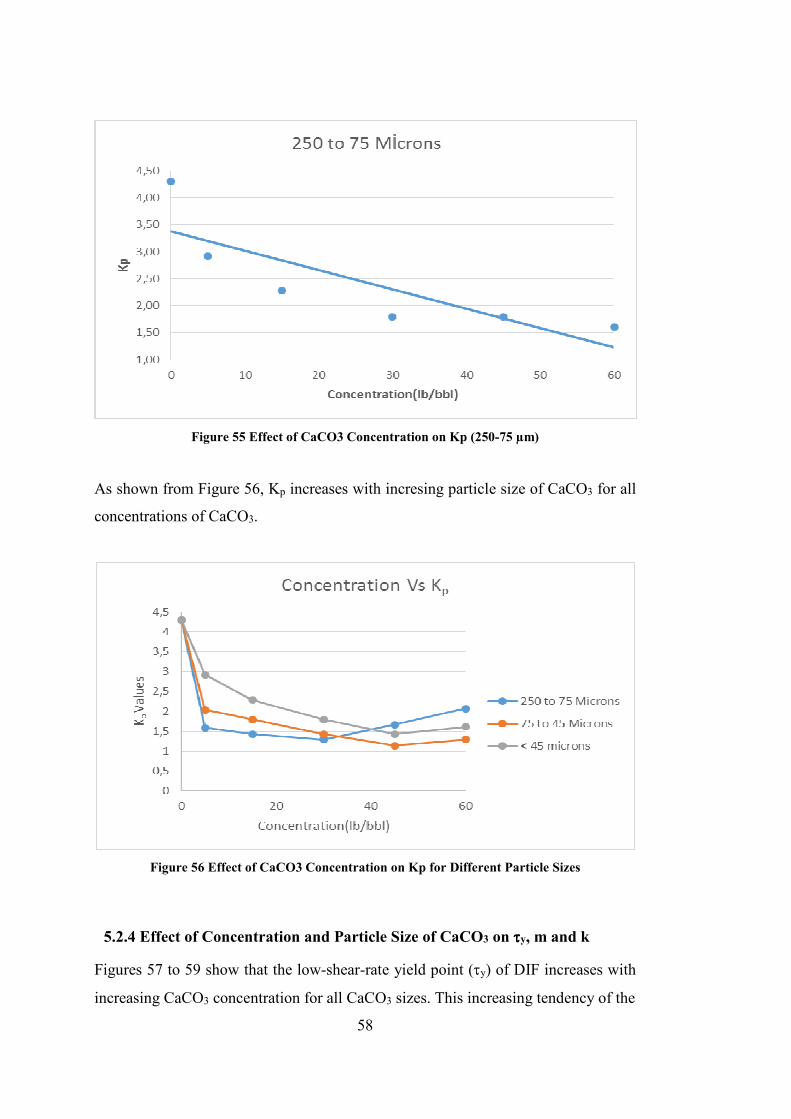
Figure 55 Effect of CaCO3 Concentration on Kp (250-75 µm) ................................ 58
Figure 56 Effect of CaCO3 Concentration on Kp for Different Particle Sizes .......... 58
Figure 57 Effect of CaCO3 Concentration on y (<45 µm) ..................................... 59
Figure 58 Effect of CaCO3 Concentration on y (75-45 µm) .................................. 59
Figure 59 Effect of CaCO3 Concentration on y (250-75 µm) ................................ 60
Figure 60 . Effect of CaCO3 Concentration on τy for Different Particle Sizes ......... 60
Figure 61 Effect of CaCO3 Concentration on m (<45 µm) ....................................... 61
Figure 62 Effect of CaCO3 Concentration on m (75-45 µm) .................................... 61
Figure 63 Effect of CaCO3 Concentration on m (250-75 µm) .................................. 62
Figure 64 Effect of CaCO3 Concentration on y for Different Particle Sizes ......... 62
Figure 65 Effect of CaCO3 Concentration on k (<45 µm) ........................................ 63
Figure 66 Effect of CaCO3 Concentration on k (75-45 µm) ..................................... 63
Figure 67 Effect of CaCO3 Concentration on k (250-75 µm) ................................... 64
Figure 68 Effect of CaCO3 Concentration on k for Different Particle Sizes ............. 64
Figure 69 Effect of CaCO3 Concentration on Fluid Loss (<45 µm) ......................... 65
Figure 70 Effect of CaCO3 Concentration on Fluid Loss (75-45 µm) ...................... 65
Figure 71 Effect of CaCO3 Concentration on Fluid Loss (250-75 µm) .................... 66
Figure 72 Effect of CaCO3 Concentration on FL for Different Particle Sizes .......... 66

xvi
xvii
LIST OF TABLES
TABLES
Table 1 Sieves Standard no. Mesh sizes and Standard sieves designations. (Dhanlal
De Lloyd, 2000) ......................................................................................................... 24
Table 2 Non-sized CaCO3 (Nidaş A.Ş. Product Sheet, Copyright © 2010) ............. 28
Table 3Composition of Base Fluid ............................................................................ 35
Table 4 5 lb/bbl Concentration Data .......................................................................... 75
Table 5 15 lb/bbl Concentration Data ........................................................................ 75
Table 6 30 lb/bbl Concentration Data ........................................................................ 75
Table 7 45 lb/bbl Concentration Data ........................................................................ 76
Table 8 60 lb/bbl Concentration Data ........................................................................ 76
Table 9 5 lb/bbl Concentration Data .......................................................................... 77
Table 10 15 lb/bbl Concentration Data ...................................................................... 77
Table 11 30 lb/bbl Concentration Data ...................................................................... 77
Table 12 45 lb/bbl Concentration Data ...................................................................... 78
Table 13 60 lb/bbl Concentration Data ...................................................................... 78
Table 14 5 lb/bbl Concentration Data ........................................................................ 79
Table 15 15 lb/bbl Concentration Data ...................................................................... 79
Table 16 30 lb/bbl Concentration Data ...................................................................... 79
Table 17 45 lb/bbl Concentration Data ...................................................................... 80
Table 18 60 lb/bbl Concentration Data ...................................................................... 80
Table 19 5 lb/bbl Concentration Data ........................................................................ 81
Table 20 15 lb/bbl Concentration Data ...................................................................... 81
Table 21 30 lb/bbl Concentration Data ...................................................................... 81
Table 22 45 lb/bbl Concentration Data ...................................................................... 82
Table 23 60 lb/bbl Concentration Data ...................................................................... 82
Table 24 5 lb/bbl Concentration Data ........................................................................ 83
Table 25 15 lb/bbl Concentration Data ...................................................................... 83
Table 26 30 lb/bbl Concentration Data ...................................................................... 83

xviii
Table 27 45 lb/bbl Concentration Data ...................................................................... 84
Table 28 60 lb/bbl Concentration Data ...................................................................... 84
Table 29 5 lb/bbl Concentration Data ........................................................................ 85
Table 30 15 lb/bbl Concentration Data ...................................................................... 85
Table 31 30 lb/bbl Concentration Data ...................................................................... 85
Table 32 45 lb/bbl Concentration Data ...................................................................... 86
Table 33 60 lb/bbl Concentration Data ...................................................................... 86
Table 34 5 lb/bbl Concentration Data ........................................................................ 87
Table 35 15 lb/bbl Concentration Data ...................................................................... 87
Table 36 30 lb/bbl Concentration Data ...................................................................... 87
Table 37 45 lb/bbl Concentration Data ...................................................................... 88
Table 38 60 lb/bbl Concentration Data ...................................................................... 88
Table 39 15 lb/bbl Concentration Data ...................................................................... 89
Table 40 5 lb/bbl Concentration Data ........................................................................ 91
Table 41 15 lb/bbl Concentration Data ...................................................................... 91
Table 42 30 lb/bbl Concentration Data ...................................................................... 91
Table 43 45 lb/bbl Concentration Data ...................................................................... 92
Table 44 60 lb/bbl Concentration Data ...................................................................... 92
Table 45 Effect of CaCO3 Concentration and Size on PV and YP ............................ 93
Table 46 . Effect of CaCO3 Concentration and Size on na and Ka ............................. 94
Table 47 Effect of CaCO3 Concentration and Size on np and Kp ............................... 95
Table 48 Effect of CaCO3 Concentration and Size on m , k and τy .......................... 96
Table 49 Fluid Loss Data of Concentrations- and Particle Size of CaCO3 ................ 97

1
CHAPTER 1
INTRODUCTION
While drilling of highly permeable, highly fractured and low pressured zones; partial
loss of circulation of fluids because of the migration through formation is known as
fluid invasion. Since 1900s, drilling the production zone has brought in great
problems to the petroleum industry, high costs for the fluid loss, insufficient
techniques and finally side tracks, altering the reservoir depth due to bypassing, new
wells to relief the original well and as a result unsatisfactory production rates due to
damaging reserves have still be seen in 2000s.
As stated before, lost circulation is one of the most troublesome and costly problem
encountered in both petroleum and geothermal drilling industry in Turkey. Classical
drilling process for drilling the highly fractured, low pressure and highly permeable
formations is not only difficult but also expensive and risky. It has historically been
one of the primary contributors to high mud cost. Pilehvari and Nyshadham (2002)
has characterized lost circulation by a “Reduction in the rate of mud returns from the
well compared to the rate at which it is pumped downhole during a lost circulation
an appreciable part or the entire volume of drilling fluid can be lost into the
formation. This may happen while drilling is in progress, due to excessive
hydrostatic and annular pressure drop, or during trips, when pressure surges occur
due to lowering of drill pipe or casing to the hole. ”
Moreover, lost circulation can be studied in three groups as; seepage loss (1-10
bbl/hr), partial loss (10-500 bbl/hr), and complete loss (over 500 bbl/hr) (Nayberg
and Petty, 1986).
2
There are plenty of studies made for solving the damaging problems during classical
drilling. Pumping a mix of lost circulation particles (LCP) may be a solution while
drilling the target zone with a seepage, partial or total lost circulation, either by
constructing bridges or increasing viscosity of the fluid to limit fluid migration in to
the formation but lost circulation materials used in the industry cannot be dissolved
in acid and it is highly possible to damage the target zone.
Bridging agents are often used to combat severe fluid loss, and calcium carbonate
(CaCO3) is the most common one. It is the most appropriate granular type of material
because of its mechanical and chemical properties. CaCO3 is resistant to pressure
differentials and swap and surge impacts in the wellbore. Its acid solubility allows
using it in production zones. In this work, CaCO3 will be tested as bridging material
with different particle sizes.
The range of particle size distribution of CaCO3 used in this study will be based on
the range of materials available in market.
The effects of particle size distribution on friction have been explained particularly
by Marone and coworkers, who made a series of experiments by varying the particle
size, shape, gouge thickness (Anthony & Marone, 2005) and particle size distribution
(Mair et al., 2002) as well as humidity, which affects interparticle cohesion (Frye and
Marone, 2002). Presence of fault gouge enhances dilation (e.g., Marone et al., 1990)
and compaction (e.g., Nakatani, 1998) and changes the friction compared to the case
without gouge.
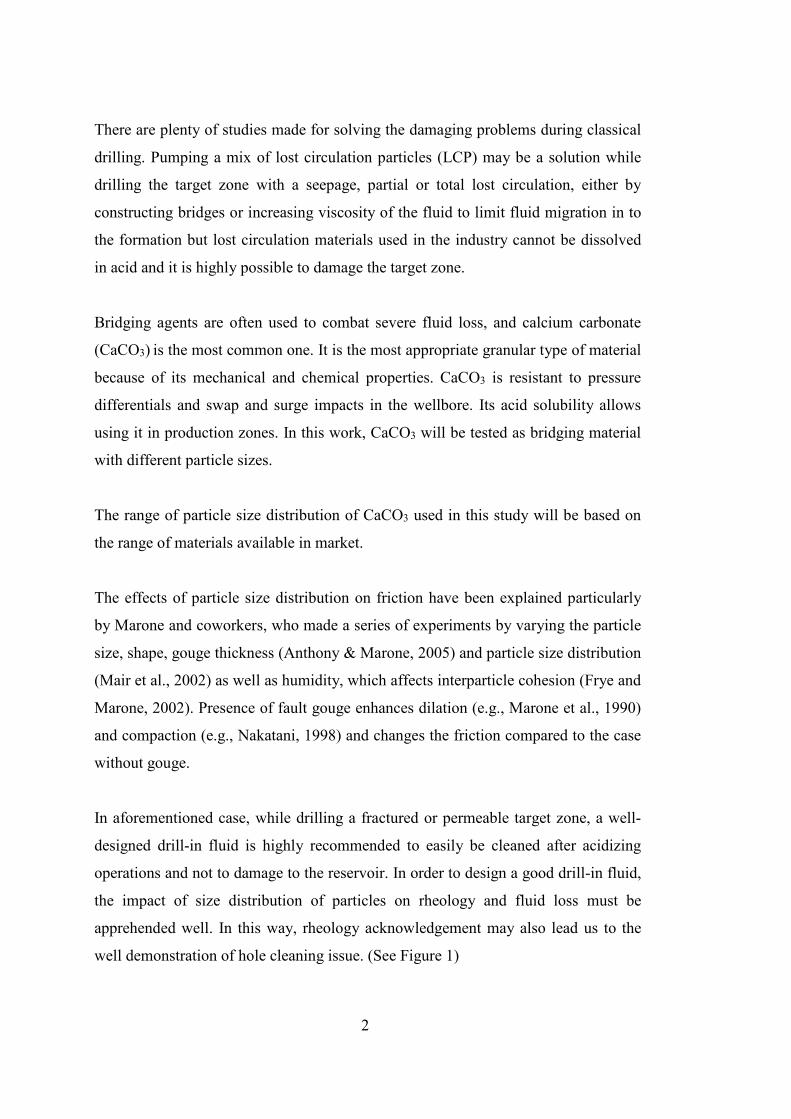
In aforementioned case, while drilling a fractured or permeable target zone, a well-
designed drill-in fluid is highly recommended to easily be cleaned after acidizing
operations and not to damage to the reservoir. In order to design a good drill-in fluid,
the impact of size distribution of particles on rheology and fluid loss must be
apprehended well. In this way, rheology acknowledgement may also lead us to the
well demonstration of hole cleaning issue. (See Figure 1)
3
In this study, compositions and rheological parameters are tested depending on
particle size, particle concentration difference and also filter loss is controlled by
basing upon creating a filter in formation, particle size distribution in the range of the
average pore throat size distribution which leads to an optimal filter cake effect of
small sized polymers (low molecular weight).
This study is intended to conduct an experimental investigation on determining the
methodology to be followed and optimum drill-in fluid rheology design criteria to
combat hole cleaning problem anticipated while drilling the highly fractured, low
pressure and highly permeable formations.
Figure 1 Plugging lost circulation zones with Drill-In Fluid. (MI Drilling Fluids Engineering
Manual, Copyright 1998)

4
5
CHAPTER 2
LITERATURE REVIEW
2.1. Overview to Loss Circulation
To begin with, it has to be reminded that calculated lost circulation effect on the
drilled wells is up to 75%. Lost circulation is an important subject for drilling
industry, mainly, because of economic reasons. Not only the increasing economic
effects on drilling operations but also the damaging effect of drill-in fluid on the
reservoir section of the well is another consideration, as well. While drilling the
production zone of the well, it is essential to design a non-damaging lost circulation
and reservoir drilling fluids. Moreover, lost circulation has even been believed in
minimizing production rates in the well where losses have resulted in failure to
secure production tests and samples while the plugging of production zones have to
lead to decrease productivity (Bugbee, 1953).
In 1980’s, J. F. Gockel and M. Brinemann (1987) illustrated a well-known usual
mistaken belief about the chance of the lost circulation is based on the idea that if the
drilling fluid weight does not exceed the fracture pressure of a given zone, fluid loss
is unlikely to occur. However, for subnormal pressure zones, it is not the best answer
for circulation losses. Subnormal pressure zones may occur in natural ways or be the
consequence of production depletion of a zone. In both cases the fracture gradient
can be normal, but the pore pressure cannot withstand the equal circulating pressure
of drilling fluid.
Consideration of granular materials, like CaCO3, particle size distribution influence
is presented based on a semi–experimental study (Andreasen and Andrersen, 1930).
This particle size distribution effect is latterly revised to calculate the smallest
6
particle size which is called modified Andreasen and Andrersen model (Funk and
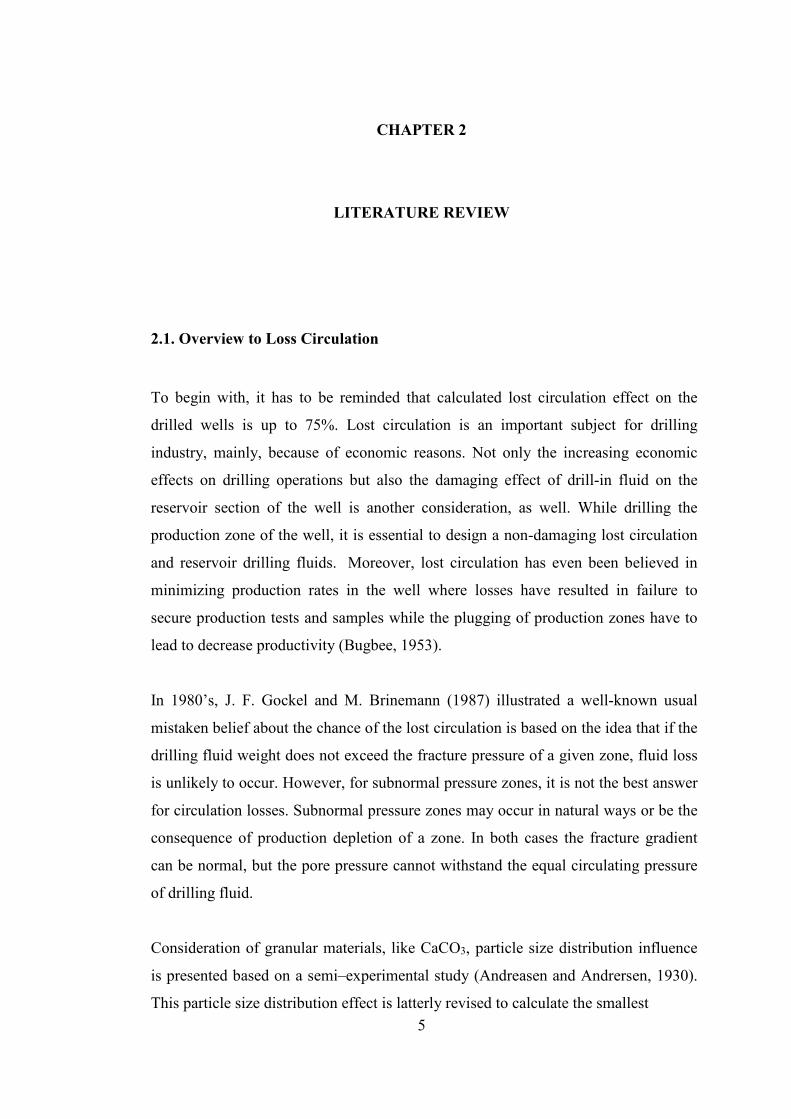
Digner, 1994). Commonly four types of formation are responsible for lost circulation
can be seen on Figure 2
a) High permeability unconsolidated sands and gravel
b) Cavernous or vugular zones in carbonates (limestone or dolomite).
c) Natural fractures, faults and transition zones in carbonates or hard shales
d) Induced fractures from extensive pressure.
Figure 2 Lost Circulation Sections (MI Drilling Fluids Engineering Manual, Copyright 1998)
Sand formations are not generally consolidated and permeability is quite high in
gravels. That is why, whole drilling fluid invasion may occur through the formation.
The higher permeability may result in higher lost circulation rates in shallow sands.
A cavity occurrence may be seen after lost circulation in this type of formations.
These types of fields, especially sands, are the production formations in which

7
subnormal pressure may be observed as to removal of fluids. In such a case, if mud
weight is not controlled, mud may invade to the formation. Moreover, low pressure
depleted formation can cause differential stuck if filtration loss of the drill-in fluid is
high because of the fluid flow from drilling fluid to formation.
Especially, while drilling in depleted zones, lost circulation is the most probable and
fatal problem. Since the greater length of formation is exposed, the narrow operating
window between pore pressure and fracture gradient. After fluid loss, well control
and stability problems can occur. Furthermore, if it is a productive zone, fluid loss
may cause productivity loss.
2.2. Size Selection of Bridging Material
During drilling, drilling fluid is the first foreign fluid contacting with reservoir. If the
drilling fluid design is incorrect, many problems can occur such as foreign solid
plugging, hydration swelling of reservoir rocks, particle migration, wettability
reversal, emulsion plugging, and so on (See Figure 3 and 4). Finally, relative
permeability will be decreased and reservoir will be damaged. (Guancheng Jiang;
Mutai Bao, 2010).
Figure 3 Wrongly Sized CaCO3 in Drill-In Fluid, (Gücüyener, 2010)

8
Figure 4 Correctly Sized CaCO3 in Drill-In Fluid, (Gücüyener, 2010)
Thus, here comes an issue of drill-in fluid selection. Selection of the proper drill-in
fluid can be a critical factor in obtaining undamaged completions. Choosing the right
drill-in fluid to avoid damage is an important part of this process. The drill-in fluid,
in addition to performing its functions as a drilling fluid, should satisfy these criteria;
• The fluid should be non-damaging to formation permeability.
• The fluid should be compatible with the completion method that will be used.
• The fluid should be responsive to any stimulation or clean-up techniques.
(Stephens,1995 )
While selecting the most suitable drill-in fluid in the target zone, another important
issue takes part: That is the particle size distribution selection of drill-in fluid. As
known generally, when a drill-in fluid is designed, CaCO3 is basically thought to be
the most suitable bridging material due to the mechanical properties. Since the
calcium carbonate has a strong resistivity to pressure differences causing a
differential stuck mostly, primer material for bridging is generally thought as CaCO3.
Solubility of CaCO3 in acid is the reason of choice to be the bridging material which
9
provides calcium carbonate a perfect clearance off the porous media after acidizing.
Solubility of CaCO3 in 15% HCl is greater than 98% at 76 °F. (GEOS Product
Manual, 2015)
As R.D. Cargnel and J. P. Luzardo et al. (1999) stated: Bridging agents are used in
Drill-In fluids to prevent problems of massive loss circulation to the formation and
formation damage through fine solids migration that invade the hydraulic flow
channels of the reservoir rock. Also, thick cake build up that induces a differential
sticking problem, as well as torque and drag of the drill string are avoided. (Cargnel,
Luzardo, 1999)
Bridging materials are often used in combat of massive lost circulation to the
formation and formation damage because of fine solid invasion. Regular mud
systems have large quantities of fine solids that invade to the formation causing
damage in productive zones. (Marqez 1996).
Physical property control of drilling fluid systems is essential for the improvement of
new wells and maintaining well operation. Drilling fluids engineers need to be well
equipped and have a good knowledge for drilling operations to access to the routine
particle size analysis capabilities. Control of the size distribution and concentration
of the particles in the drilling fluid is so important for a mud system that yields good
well stability and prevents fluid invasion. In order to form a filter cake that prevents
the solids dilled and other mud additives like polymers from entering the formation,
the fluid particle size should be small enough to construct a bridge between pores
and formation drilled. This prevents fluid loss, keeps the well under pressure, and
maintains a stabilization between shale-based formations. On the other hand, the
fluid particle size has to be also large enough to ensure that in-depth penetration of
the mud into the pore structures does not occur, because this would itself lead to
formation damage via pore blockage (Sharma et al., 2004).
2.3. Polymer & Other Additives Selection

10
A drill-in mud system may contain many components, such as Xhantan Gum
Polymer (XCD) to control the mud rheology, CaCO3 mineral as a weighting agent
and as a bridging solid, and other additives (starches and alkalinity agents) are added
in order to reduce filter loss. While drilling, it is essential to keep the physical
properties of the mud under control. Two most important properties to control are the
viscosity and the filtrate loss. “Viscosity is the internal friction supplied by a fluid
when an axial force is applied to cause it to flow. It is also relative to move the
cuttings away from the bottom hole of the well , suspending cuttings and weight
material in when the circulation is off, remove away cuttings at the surface, reducing
to a minimum any adverse effect upon the wellbore, and providing information about
formations penetrated.” (M. I. Abdou a & H. El-Sayed Ahmed, 2011).
The other important property of a mud is fluid loss which is the action of controlling
the volume of filtrate that passes through a filter medium called filter paper. Control
of fluid loss for a mud is ensured by several methods, one of them is addition of
fluid-loss-control materials to the mud system and the other is to make the materials
already present work better, altering the mud chemistry. (“The Oilfield Glossary:
Where the Oil Field Meets the Dictionary”, 2014)
During formation of an external filter cake, especially fine solids are forced into the
formation, building an internal filter cake. An internal filter cake plugs the near
surface pore and reduces the formation permeability. Fine particles penetrate deeper
into the pores and are not easily removed by back flushing. Invasion of larger
particles is usually localized to near surface. Studies conducted by Bailey et al.
(1999) show a strong correlation between invasion and damage. Owing to that,
minimizing of internal filter cake and quickly forming of external cake is very
important for both fluid loss and formation damage control. A semi permeable
slicker external filter cake can significantly reduce the invasion of the solids and the
filtrate.
11
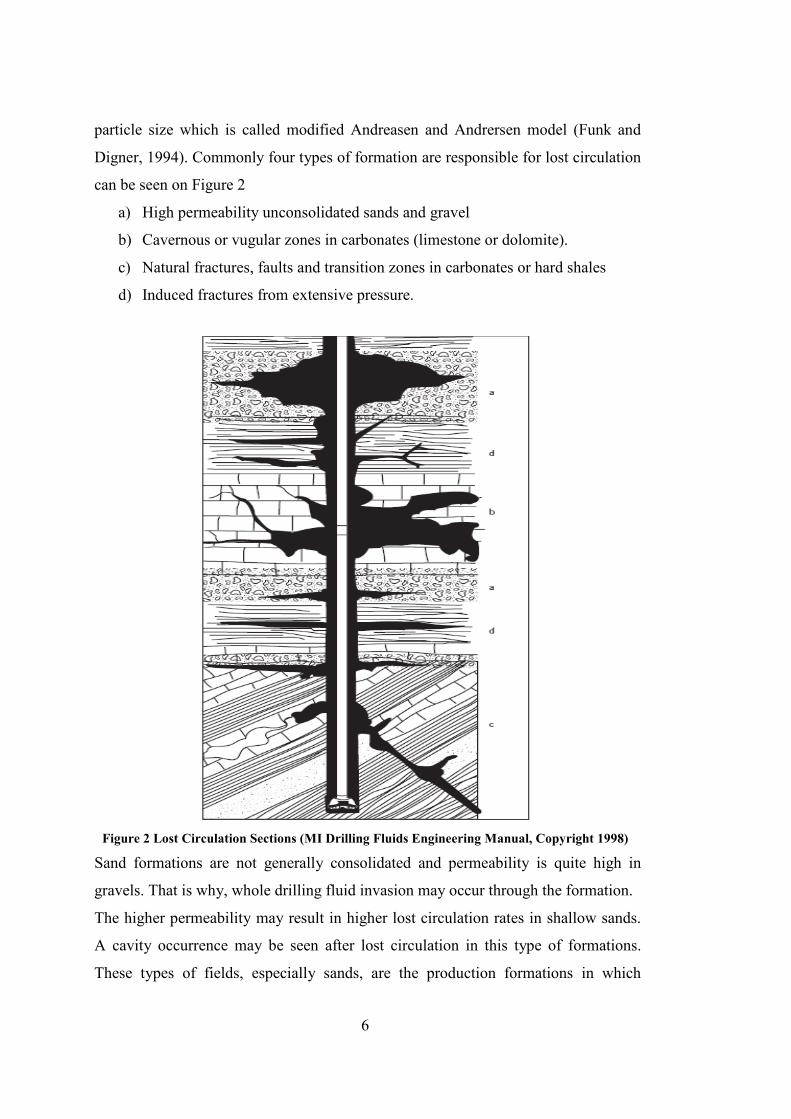
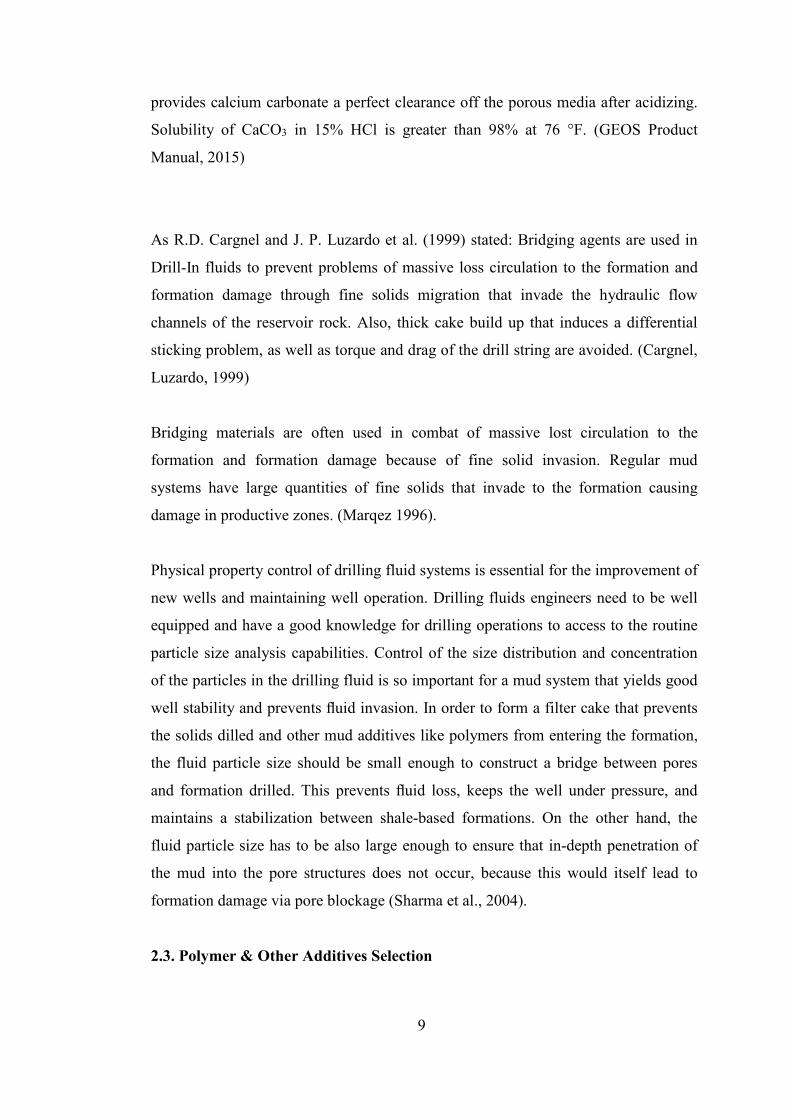
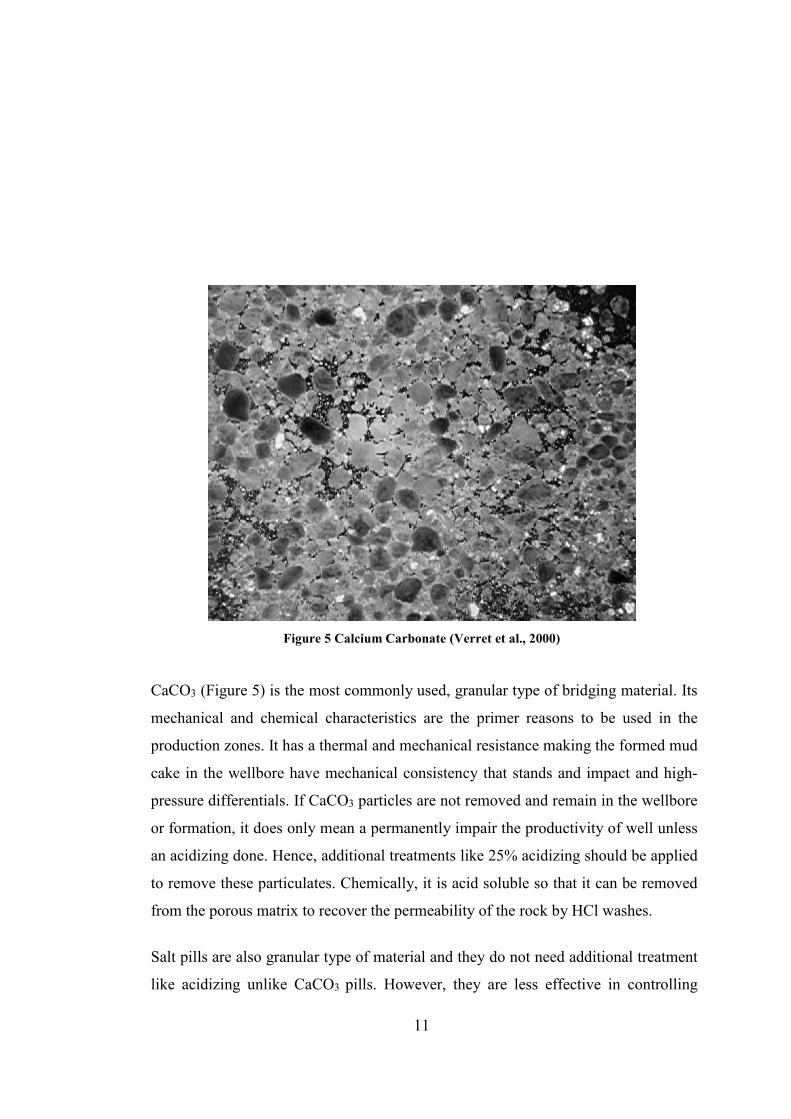
Figure 5 Calcium Carbonate (Verret et al., 2000)
CaCO3 (Figure 5) is the most commonly used, granular type of bridging material. Its
mechanical and chemical characteristics are the primer reasons to be used in the
production zones. It has a thermal and mechanical resistance making the formed mud
cake in the wellbore have mechanical consistency that stands and impact and high-
pressure differentials. If CaCO3 particles are not removed and remain in the wellbore
or formation, it does only mean a permanently impair the productivity of well unless
an acidizing done. Hence, additional treatments like 25% acidizing should be applied
to remove these particulates. Chemically, it is acid soluble so that it can be removed
from the porous matrix to recover the permeability of the rock by HCl washes.
Salt pills are also granular type of material and they do not need additional treatment
like acidizing unlike CaCO3 pills. However, they are less effective in controlling

12
losses and more difficult to design due to solubility issues (Rosato and Supriyono,
2002).
Proper fluid composition, a good bridging material with a good size selection and a
correct maintenance of the drilling fluid are the primer parameters to achieve a better
productivity. Careful design is required to minimize spurt loss and solid invasion
during drilling and completion operations.
2.4. Dimensional Approach to CaCO3
There are many studies with granular particles, especially with CaCO3, conducted to
observe the effect on lost circulation. G.E.Loeppke et al. (1990) viewed high-
temperature and high-fracture zones. It was stated that dimension of particle must be
greater than the fracture if the dimension is normal for single particle bridging. J.C.
Rojas et al. (1998) had discussed the effect of particle size and particle concentration
of the CaCO3 and concluded that for effective plugging of pores the mud should
contain wide range of particles size, and largest particles should be at least as large as
the fracture width. They concluded that high concentration provides better plugging
(Cargnel and Luzardo, 1999).
There is also a detailed study on the particle size and concentration. This study was
based on the study of Abrams’ Median Particle-Size Rule (Abrams 1977). They
concluded that as the range of particle size is between 1/7 and 1/3 of average pore
size, better sealing is performed which yields a small invasion of solids into the
porous media and particle concentration is optimum at 25 lb/bbl for effective
plugging. R.D. Cargnel et. al. stated that “The predominant size of particles in the
sample does not keep the geometric relationship to form a matrix that can avoid the
filtration invasion. That way, a thicker cake is formed and, with the higher filtrate
volume, the amount of particles in the cake is larger.” (1999).
Nowadays, in horizontal wells open hole completions are frequently used. More
attention needs to be paid to the cake forming properties of reservoir drilling fluids.

13
Solid invasion is one of the primary causes of formation damage caused from drilling
fluids.

14
2.5. Rheological Study
Rheology of the drill-in fluid (DIF) is also studied in this work. Although, almost all
rheological models were studied to explain the behavior of the fluid, yield power law
(YPL) (also known as Hershel Buckley Model), Bingham Plastic and Power Law
Model were the most used models.
“As known, Rheology is defined as the study of the deformation and flow of matter.
While drilling, the term rheology is also includes the shear stress/shear rate/time
relationships of drilling fluids. In order to design a good drilling fluid system,
rheological properties are strictly used. It is known that if the mud is not only
effected by pressure and temperature but also by velocity, mud behavior becomes
non-Newtonian. The velocity of the drilling fluid and its shear rate of a section
strongly defines the viscosity of the fluid. That is why, to calculate the hydraulic
phenomena of a drilling system, it is vital to know the viscosity in the range of shear
rate. In example, flow does not occur when the stress is less than yield point (YP). At
low shear rates there is a typical non-linear relationship between shear stress and
shear rate, which tends to be attenuated with the increase of shear rate.” (“Rheology
of Drilling Muds”, n. d.)
Measurements of rheology on drilling sites are made by a viscometer at two different
speeds of 600 and 300 rotation per minute (rpm). High shear rate region of the flow
is represented by these two speeds. Since there are very different shear rates for
drilling fluids, from very small velocities in the mud pits to very high velocities
through bit nozzles, the rheological parameters on two measurements will cause
significant discrepancies such as yield point overestimation. Generally, the
viscometer used on the oilfield allows measurements at 3, 6, 100, 200, 300 and 600
rpm.
As a result, rheological models are useful tools to describe mathematically the
relationship between shear stress and shear rate of a given fluid. Conventionally, oil
and gas industry uses the Bingham and Power Law models to illustrate drilling fluid
behavior. Also, standard American Petroleum Institute (API) methods for drilling
hydraulics makes an assumption of either a Power Law or a Bingham Plastic model.

15
Actually, most drilling fluids intersect mostly close to the Modified Power Law or
Herschel-Buckley rheological model. This is important for annular geometries of
normal drilling conditions where shear rates are usually low. Here comes a situation
which is, while the Power Law Model underestimates the frictional pressure drop,
Bingham Plastic Model overestimates.
2.5.1. Basic Rheological Definitions
2.5.1.1. Shear Rate
When fluid flow is laminar, fluid layers near the wall flow at a slower rate than those
further from the wall flow. The layers near the center of the flow channel have the
highest velocity. The velocity of a layer relative to the layers next to it is called the
shear rate and designated by the symbol γ. (Gücüyener, 2010).
2.5.1.2. Shear Stress
In laminar flow, there occurs a resistance to flow between fluid layers, because of the
shear rate. This resistivity to flow is called the shear stress and designated by the
symbol τ.
2.5.1.3. Viscosity
Viscosity is defined as the ratio of the shear stress to the shear rate, and has a symbol
µ. The relationship is given as,
µ = τ /γ (2.1)
The unit of viscosity is centipoise (cP) or millipascal × second (mPa× s).
16
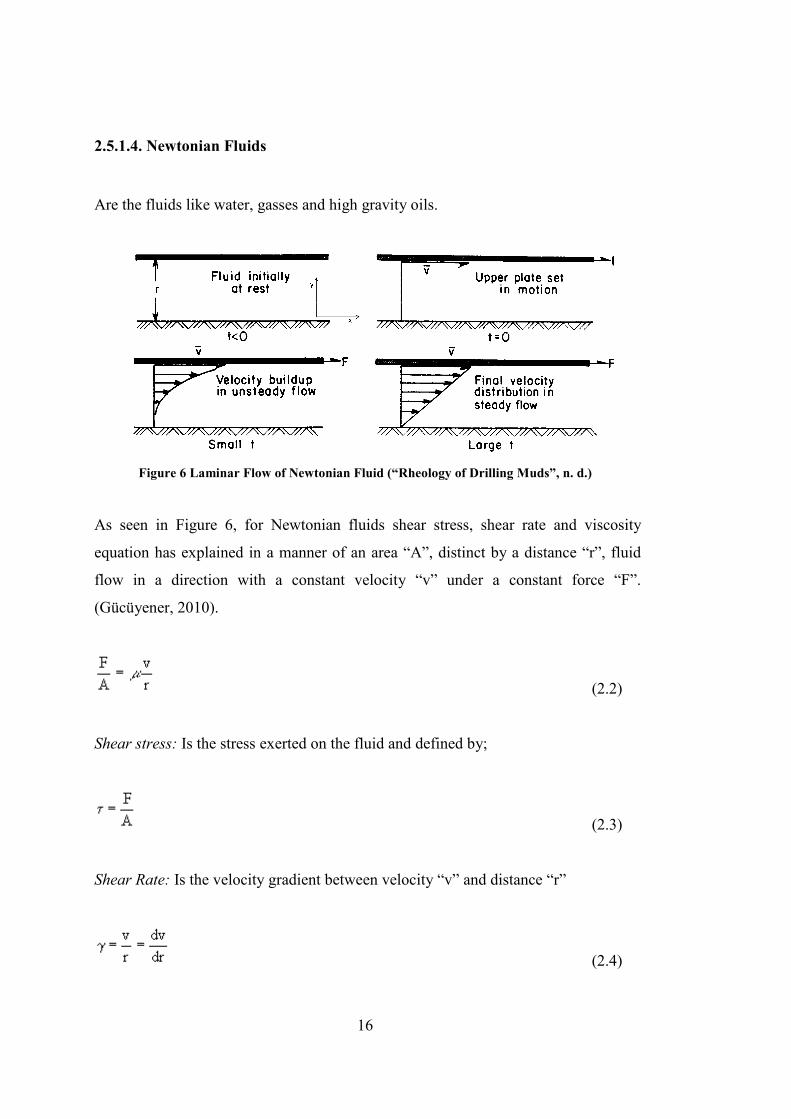
2.5.1.4. Newtonian Fluids
Are the fluids like water, gasses and high gravity oils.
Figure 6 Laminar Flow of Newtonian Fluid (“Rheology of Drilling Muds”, n. d.)
As seen in Figure 6, for Newtonian fluids shear stress, shear rate and viscosity
equation has explained in a manner of an area “A”, distinct by a distance “r”, fluid
flow in a direction with a constant velocity “v” under a constant force “F”.
(Gücüyener, 2010).
(2.2)
Shear stress: Is the stress exerted on the fluid and defined by;
(2.3)
Shear Rate: Is the velocity gradient between velocity “v” and distance “r”
(2.4)

17
From the equations above, Newtonian Models represent a direct proportionality
between shear stress τ to the shear rate γ. Giving the following equation;
τ = µ γ (2.5)
Where µ is a constant of proportionality and is the viscosity of the fluid. A graphical
view of shear stress and shear rate for a Newtonian fluid can be seen in Figure 7.
(Gücüyener, 2010).
Figure 7 Shear stress Vs Shear rate for a Newtonian fluid. (“Rheology of Drilling Muds”, n. d.)

18
2.5.1.5. Non-Newtonian Fluids
They are the fluids that does not represent a direct proportionality between shear rate
and shear stress. It is studied in three main models which are Bingham Plastic Model,
Power Law Model and Herschel-Buckley Model. (Gücüyener, 2010).
2.5.1.5.1. Bingham Plastic (BP) Fluids
Are fluids which does represent a Newtonian behavior with an initial yield stress
called yield point (YP). Mathematical demonstration is as below:
YP PVτ γ= + (2.6)
Where PV is Plastic Viscosity. As the shear rate of a Bingham Plastic Fluid increases, the AV of it decreases. That is
why, Bingham Plastic Fluids represent a shear thinning behavior. (Gücüyener I.H.,
Drilling Hydraulics, 2010).
Figure 8 Shear Rate Vs Shear Stress for a Bingham plastic fluid. (“Rheology of Drilling Muds”,
n. d.)

19
2.5.1.5.2. Power Law (PL) Model
Power law model is the model in which API uses and it generally exhibits a pseudo
plastic behavior of drilling fluids. (Bourgoyne, 2003). This model mainly has two
parameters which are consistency index (K) and flow behavior index (m). As shown
in Figure 8, when m equals to 1, the below equation becomes a Newtonian model.
Power Law model explains the situations where m<1 and m>1 (Chowdhury, 2009).
nKτ γ= (2.7)
Where K is consistency index and n is flow behavior index.
2.5.1.5.3. Yield Power Law (YPL) Model (Herschel Buckley Model)
Yield Power Law is the model known as the combination of the Power Law and
Bingham Plastic models. (Islam, 2008). While Herschel Buckley includes YP in its
calculations, Power Law does not. Mathematical demonstration of the model is;
m
y kτ τ γ= + (2.8)
The Herschel-Bulkley behaves like Power law model when τy = 0 and behaves like
Bingham plastic model when m = 1. (Islam A, 2008).
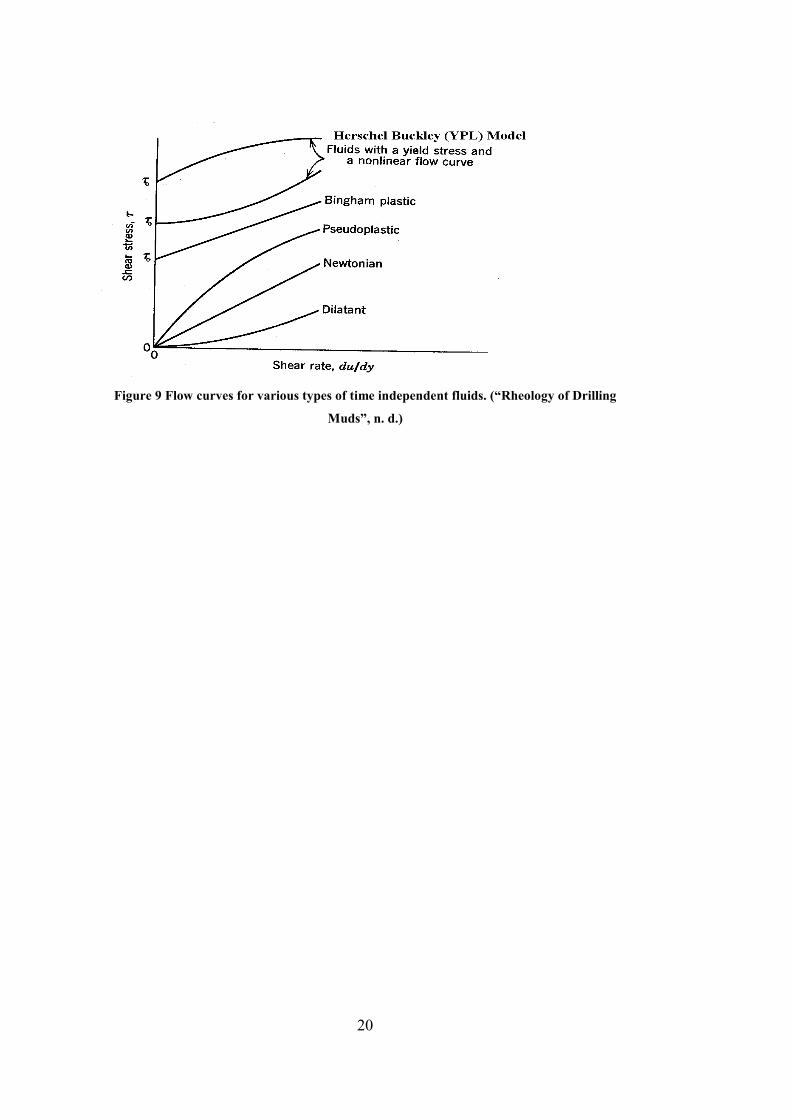
A general summary of flow behaviors of fluids can be seen in Figure 9.
20
Figure 9 Flow curves for various types of time independent fluids. (“Rheology of Drilling
Muds”, n. d.)

21
CHAPTER 3
STATEMENT OF PROBLEM
Drill-In Fluid (DIF) is one of the primary issue while drilling target zone of a well
due to reservoir damage and hole cleaning problems. The design of DIF is
determined as non-damaging DIF to eliminate the damaging problem. Considering
the hole cleaning problem, size distribution effect on drill-in fluid’s rheology and
fluid loss for most suitable drill-fluid design is studied in this part. Using calcium
carbonate (CaCO3) is the most popular way for constructing a bridge between
drilling fluid and wellbore because of simplicity of usage, economic reasons and
mechanical durability. It is important to determine the particle size and
concentration, the rheology and fluid loss of the fluid successfully.
The aim of this work is to investigate effect of concentration and particle size of
CaCO3 on the rheological and filtration properties of drill-in fluids. During the study,
some contributing polymers, caustic soda, distilled water and CaCO3 at different
particle sizes at different concentrations have been used. Ageing process has been
done to provide the well conditions and then tests have been run at room
temperature.

22
23
CHAPTER 4
EXPERIMENTAL SET-UP AND PROCEDURE
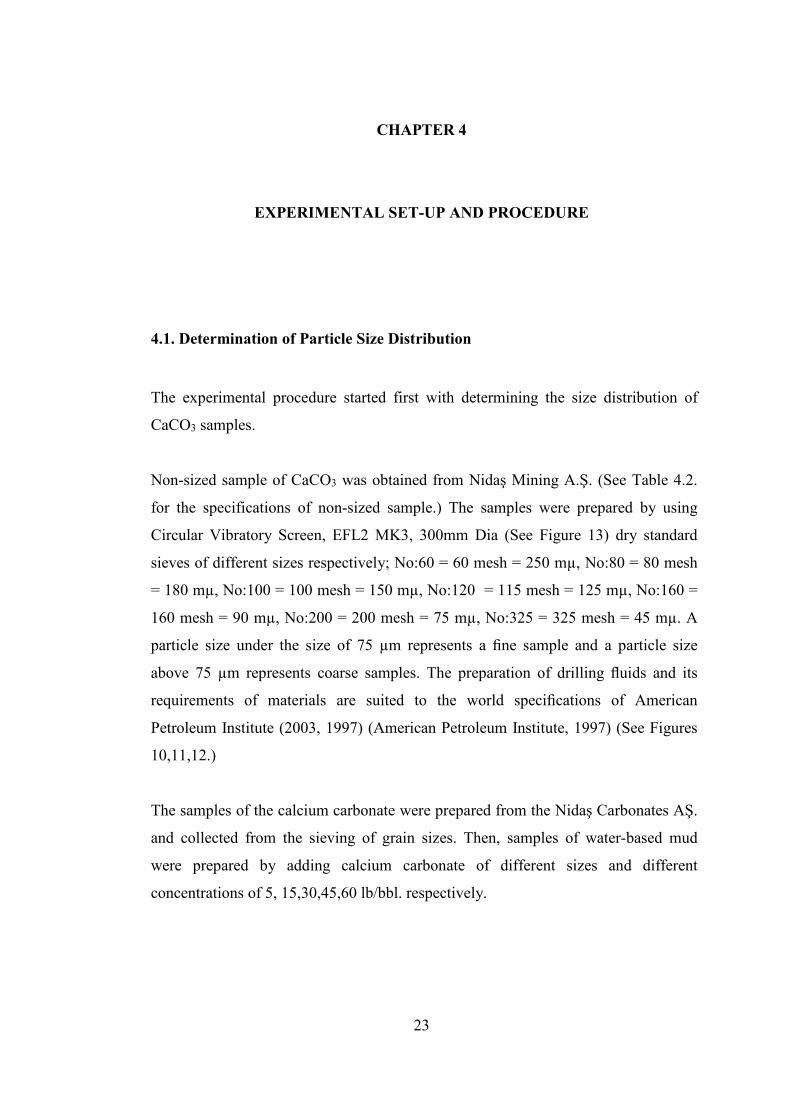
4.1. Determination of Particle Size Distribution
The experimental procedure started first with determining the size distribution of
CaCO3 samples.
Non-sized sample of CaCO3 was obtained from Nidaş Mining A.Ş. (See Table 4.2.
for the specifications of non-sized sample.) The samples were prepared by using
Circular Vibratory Screen, EFL2 MK3, 300mm Dia (See Figure 13) dry standard
sieves of different sizes respectively; No:60 = 60 mesh = 250 mµ, No:80 = 80 mesh
= 180 mµ, No:100 = 100 mesh = 150 mµ, No:120 = 115 mesh = 125 mµ, No:160 =
160 mesh = 90 mµ, No:200 = 200 mesh = 75 mµ, No:325 = 325 mesh = 45 mµ. A
particle size under the size of 75 µm represents a fine sample and a particle size
above 75 µm represents coarse samples. The preparation of drilling fluids and its
requirements of materials are suited to the world specifications of American
Petroleum Institute (2003, 1997) (American Petroleum Institute, 1997) (See Figures
10,11,12.)
The samples of the calcium carbonate were prepared from the Nidaş Carbonates AŞ.
and collected from the sieving of grain sizes. Then, samples of water-based mud
were prepared by adding calcium carbonate of different sizes and different
concentrations of 5, 15,30,45,60 lb/bbl. respectively.
24
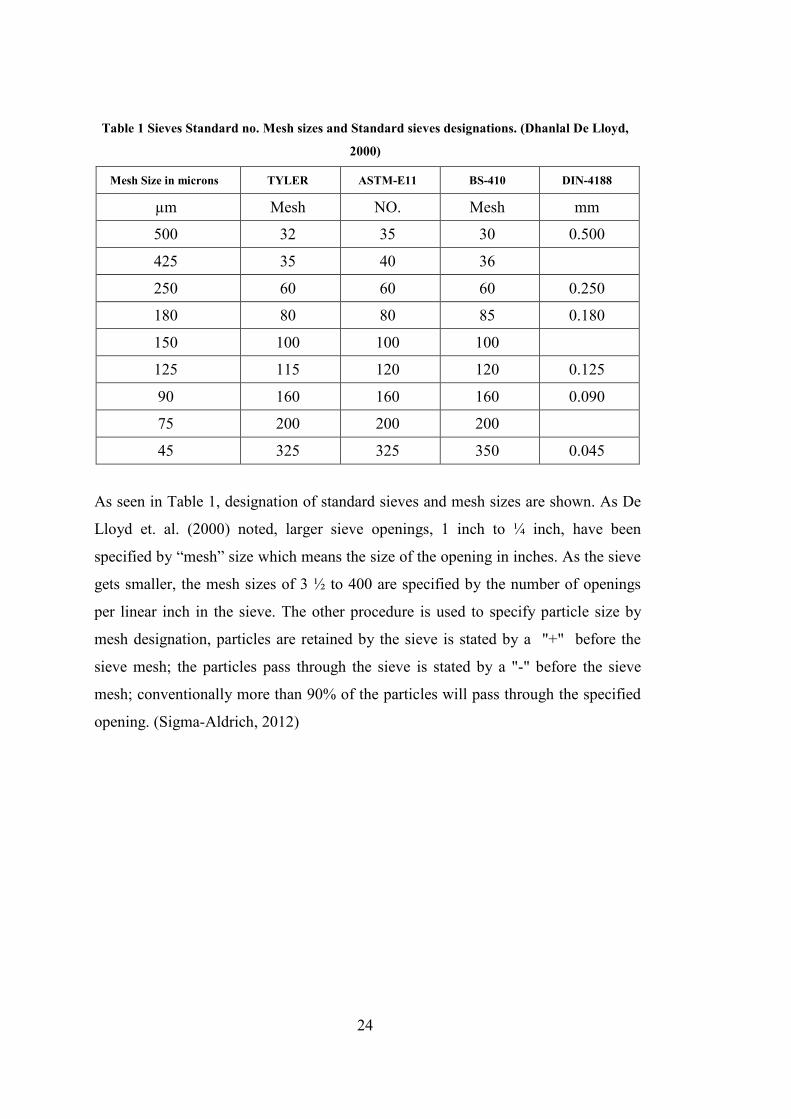
Table 1 Sieves Standard no. Mesh sizes and Standard sieves designations. (Dhanlal De Lloyd,
2000)
Mesh Size in microns TYLER ASTM-E11 BS-410 DIN-4188
µm Mesh NO. Mesh mm
500 32 35 30 0.500
425 35 40 36
250 60 60 60 0.250
180 80 80 85 0.180
150 100 100 100
125 115 120 120 0.125
90 160 160 160 0.090
75 200 200 200
45 325 325 350 0.045
As seen in Table 1, designation of standard sieves and mesh sizes are shown. As De
Lloyd et. al. (2000) noted, larger sieve openings, 1 inch to ¼ inch, have been
specified by “mesh” size which means the size of the opening in inches. As the sieve
gets smaller, the mesh sizes of 3 ½ to 400 are specified by the number of openings
per linear inch in the sieve. The other procedure is used to specify particle size by
mesh designation, particles are retained by the sieve is stated by a "+" before the
sieve mesh; the particles pass through the sieve is stated by a "-" before the sieve
mesh; conventionally more than 90% of the particles will pass through the specified
opening. (Sigma-Aldrich, 2012)

25
Figure 10 ASTM-E11 numbers of sieves and their mesh sizes in microns
26
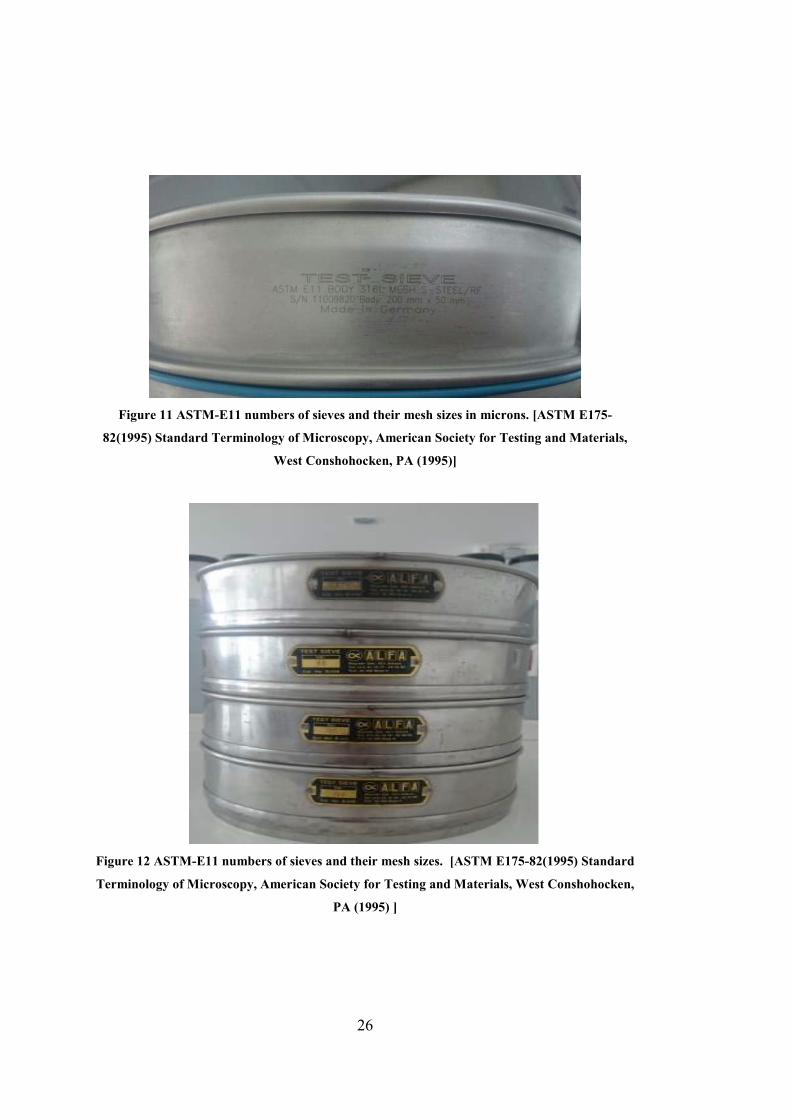
Figure 11 ASTM-E11 numbers of sieves and their mesh sizes in microns. [ASTM E175-
82(1995) Standard Terminology of Microscopy, American Society for Testing and Materials,
West Conshohocken, PA (1995)]
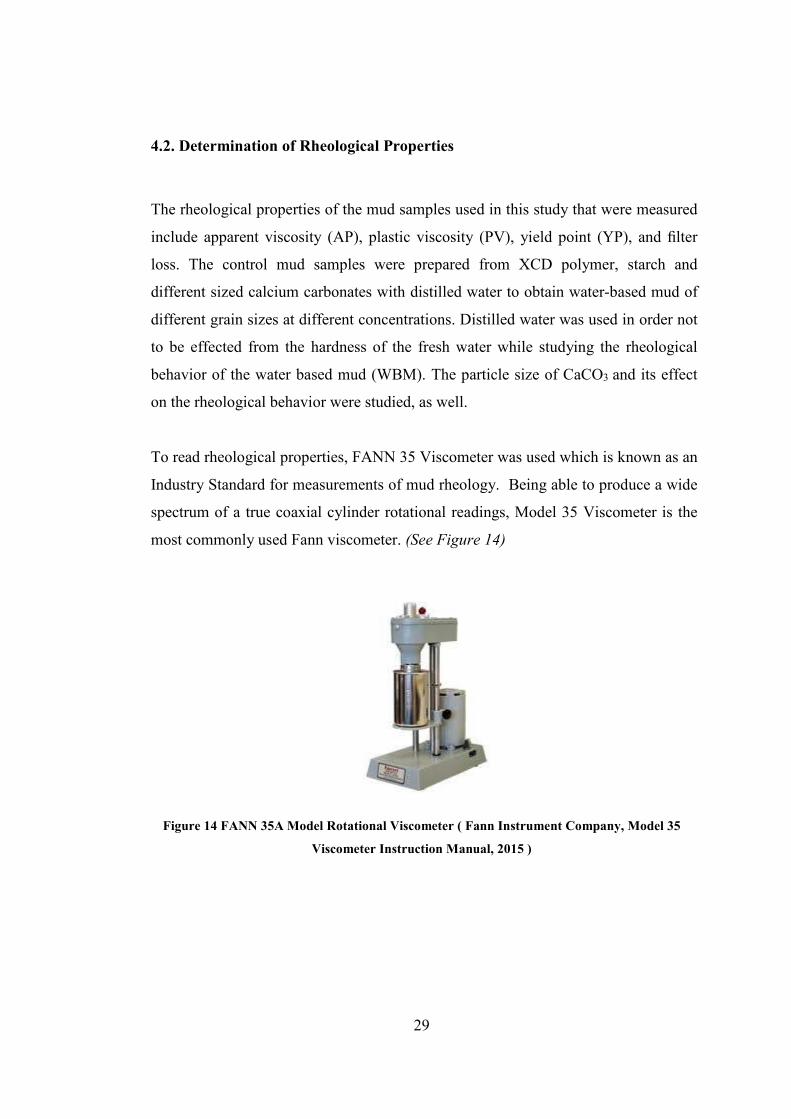
Figure 12 ASTM-E11 numbers of sieves and their mesh sizes. [ASTM E175-82(1995) Standard
Terminology of Microscopy, American Society for Testing and Materials, West Conshohocken,
PA (1995) ]

27
Figure 13 Circular Vibratory Screen, Endecotts, EFL2 MK3, 300mm Dia

28
Table 2 Non-sized CaCO3 (Nidaş A.Ş. Product Sheet, Copyright © 2010)
RAW MATERIALS NİDAŞ A.Ş. NİĞDE / TÜRKİYE
PRODUCT SPECIFICATIONS
High purity and whiteness, very finely ground natural, micronized
calcium carbonate, low-oil absorption
MAIN APPLICATIONS
PAPER,PAINT,PLASTIC,PVC
GRANULE,CABLE,CHEMICALS ETC.
CHEMICAL PROPERTIES
CaCO3 >99,6 %
MgO <0,20 %
Fe2O3 <0,01 %
SiO2 <0,01 %
AI2O3 <0,02 %
HCl insoluble content <0,01 %
PHYSICAL PROPERTIES
DENSTIY (ISO 787-10) 2,7 gr/cm³
HARDNES 3 MOHS
REFRACTIVE INDEX 1,59
GENARAL PROPERTIES
PACKET BULK DENSITY 0,9 g/ml
pH 9
OIL ABSORPTION 13 g /100 g
DOP ABSORPTION 23 g /100 g
MOISTURE-EX WORKS 0.3%
Whiteness’ (ASTM E-313) 97%
Moisture-Ex Works 94%
PACKING
Bulk in Big bag 25kg craft bags or pp bags in sling
bags or palletized
SYMPATEC HELOS PARTICLE SIZE ANALYSIS
PARTICLE SIZE DISTRIBUTIONS
d 50 Mean particle size 12,00 - 18,00 µm
d 97 Particle size 60,00 - 70,00 µm
Under 2µm Particles 9 - 12 %
RESIDUE ON 45µm SIEVE 10,00
29
4.2. Determination of Rheological Properties
The rheological properties of the mud samples used in this study that were measured
include apparent viscosity (AP), plastic viscosity (PV), yield point (YP), and filter
loss. The control mud samples were prepared from XCD polymer, starch and
different sized calcium carbonates with distilled water to obtain water-based mud of
different grain sizes at different concentrations. Distilled water was used in order not
to be effected from the hardness of the fresh water while studying the rheological
behavior of the water based mud (WBM). The particle size of CaCO3 and its effect
on the rheological behavior were studied, as well.
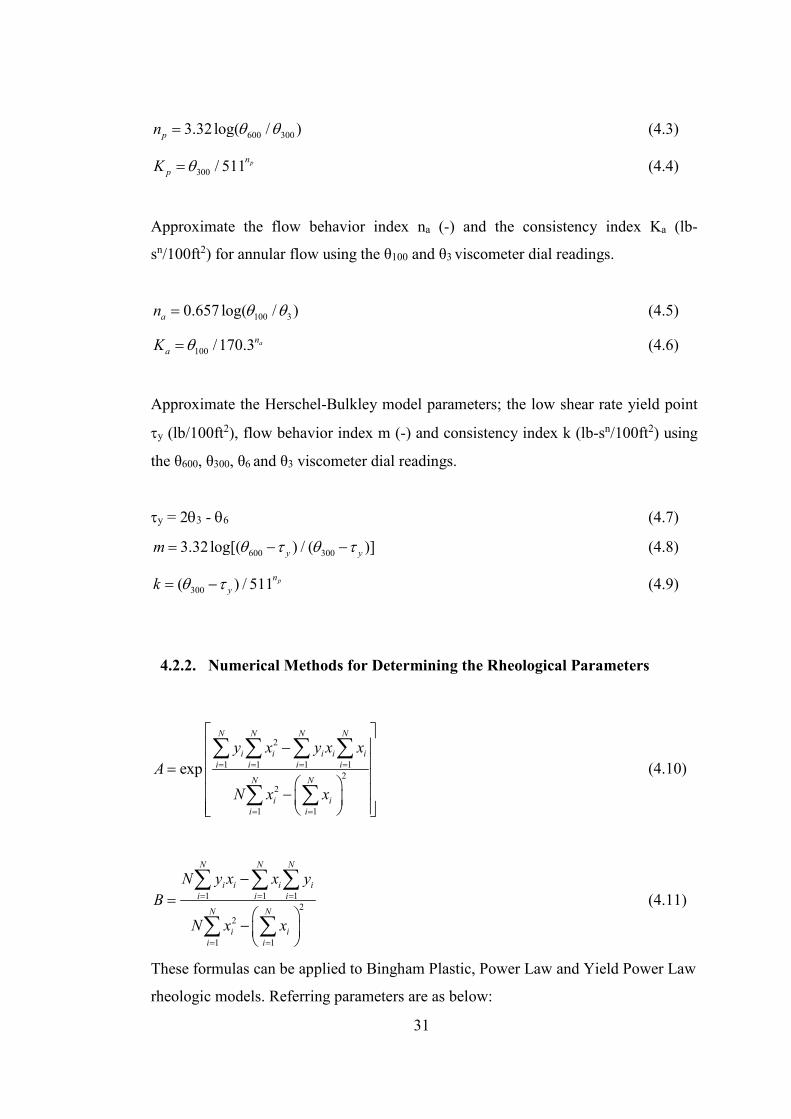
To read rheological properties, FANN 35 Viscometer was used which is known as an
Industry Standard for measurements of mud rheology. Being able to produce a wide
spectrum of a true coaxial cylinder rotational readings, Model 35 Viscometer is the
most commonly used Fann viscometer. (See Figure 14)
Figure 14 FANN 35A Model Rotational Viscometer ( Fann Instrument Company, Model 35
Viscometer Instruction Manual, 2015 )

30
Procedure required for determining PV and YP, is listed below: (Fann Instrument
Company, Model 35 Viscometer Instruction Manual, 2015)
1. Collect the drilling fluid sample.
2. Place the sample in a thermostatically controlled viscometer cup.
3. Immerse the viscometer rotor sleeve exactly to the scribed line.
4. Heat the sample to the selected temperature. (in this study, 25 0C)
5. Rotate the viscometer sleeve at 600 rpm until a steady dial reading is
obtained. Record the dial reading (θ600).
6. Rotate the viscometer sleeve at 300 rpm until a steady dial reading is
obtained. Record the dial reading (θ300).
7. Rotate the viscometer sleeve at 200 rpm until a steady dial reading is
obtained. Record the dial reading (θ200).
8. Rotate the viscometer sleeve at 100 rpm until a steady dial reading is
obtained. Record the dial reading (θ100).
9. Rotate the viscometer sleeve at 6 rpm until a steady dial reading is
obtained. Record the dial reading (θ6).
10. Rotate the viscometer sleeve at 3 rpm until a steady dial reading is
obtained. Record the dial reading (θ3).
4.2.1. Approximate Methods for Determining the Rheological Parameters
Approximate the plastic viscosity PV (cp) and yield point YP (lb/100ft2) using the θ600
and θ300 viscometer dial readings.
600 300PV θ θ= − (4.1)
300 600 3002YP PVθ θ θ= − = − (4.2)
Approximate the flow behavior index np (-) and the consistency index Kp (lb-
sn/100ft2) for pipe flow using the θ600 and θ300 viscometer dial readings.
31
600 3003.32log( / ) pn θ θ= (4.3)
300 / 511 pn
pK θ= (4.4)
Approximate the flow behavior index na (-) and the consistency index Ka (lb-
sn/100ft2) for annular flow using the θ100 and θ3 viscometer dial readings.
100 30.657 log( / ) an θ θ= (4.5)
100 /170.3 an
aK θ= (4.6)
Approximate the Herschel-Bulkley model parameters; the low shear rate yield point
τy (lb/100ft2), flow behavior index m (-) and consistency index k (lb-sn/100ft2) using
the θ600, θ300, θ6 and θ3 viscometer dial readings.
τy = 2θ3 - θ6 (4.7)
600 3003.32log[( ) / ( )] y ym θ τ θ τ= − − (4.8)
300( ) / 511 pn
yk θ τ= − (4.9)
4.2.2. Numerical Methods for Determining the Rheological Parameters
2
1 1 1 12
2
1 1
exp
N N N N
i i i i i
i i i i
N N
i i
i i
y x y x x
A
N x x
= = = =
= =
− = −
∑ ∑ ∑ ∑
∑ ∑ (4.10)
1 1 12
2
1 1
N N N
i i i i
i i i
N N
i i
i i
N y x x y
B
N x x
= = =
= =
−=
−
∑ ∑ ∑
∑ ∑ (4.11)
These formulas can be applied to Bingham Plastic, Power Law and Yield Power Law
rheologic models. Referring parameters are as below:

32
Bingham Plastic Model: Where the parameters refer to:
i i i ix y A YP B PVγ τ= = = =
Power Law Model: Where the parameters refer to:
ln lni i i ix y A K B nγ τ= = = =
Herschel-BulkleyModel: Where the parameters refer to:
3 6ln ln( ) 2i i i i y yx y A k B mγ τ τ τ θ θ= = − = − = =
4.3. Measurement of Fluid Loss
In this study, the American Petroleum Institute (API) API filter press is used to
measure the fluid loss at a differential of 100 psi.
The OFITE low pressure low temperature filtration press is used in this study which
helps to determine filtration and filter cake properties of drilling fluids. The filter
press design features, a steel body called cell to hold the fluid sample, an inlet
pressure, and a cap with screen and filter paper. OFITE low pressure filter press can
be seen in Figure 15 To obtain reasonable results, a proper 9-cm filter paper must be
used. In this study, Whitman No. 50 Filter Paper is used. (OFITE Instruments, 2009)

33
Figure 15 Overview of OFITE Low Pressure Filter Press (OFITE Instruments, 2009)
Procedure for determining the filtration can be observed step by step below (OFITE
Instruments, 2009):
1. Collect the mud sample.
2. Assemble the cell with the filter paper in place.
3. Pour the sample into the cell to within ½ inch from the top.
4. Set the cell into the frame; place and tighten the top on the cell.
5. Place a dry, graduated cylinder under the drain tube.
6. Close the relief valve and adjust the regulator so a pressure of 100 ± 5 psi
7. Maintain the pressure at 100 ± 5 psi (690 ± 35 kPa) for 30 minutes.
8. Report the spurt loss at the very beginning of process if exists.
9. Shut off the flow through the pressure regulator and open the relief
valve carefully.
10. Report the volume of filtrate in the graduated cylinder to the nearest mL.
11. Release the pressure, verify that all pressure has been relieved, and
remove the cell from the frame.
12. Disassemble the cell and discard the mud.
34
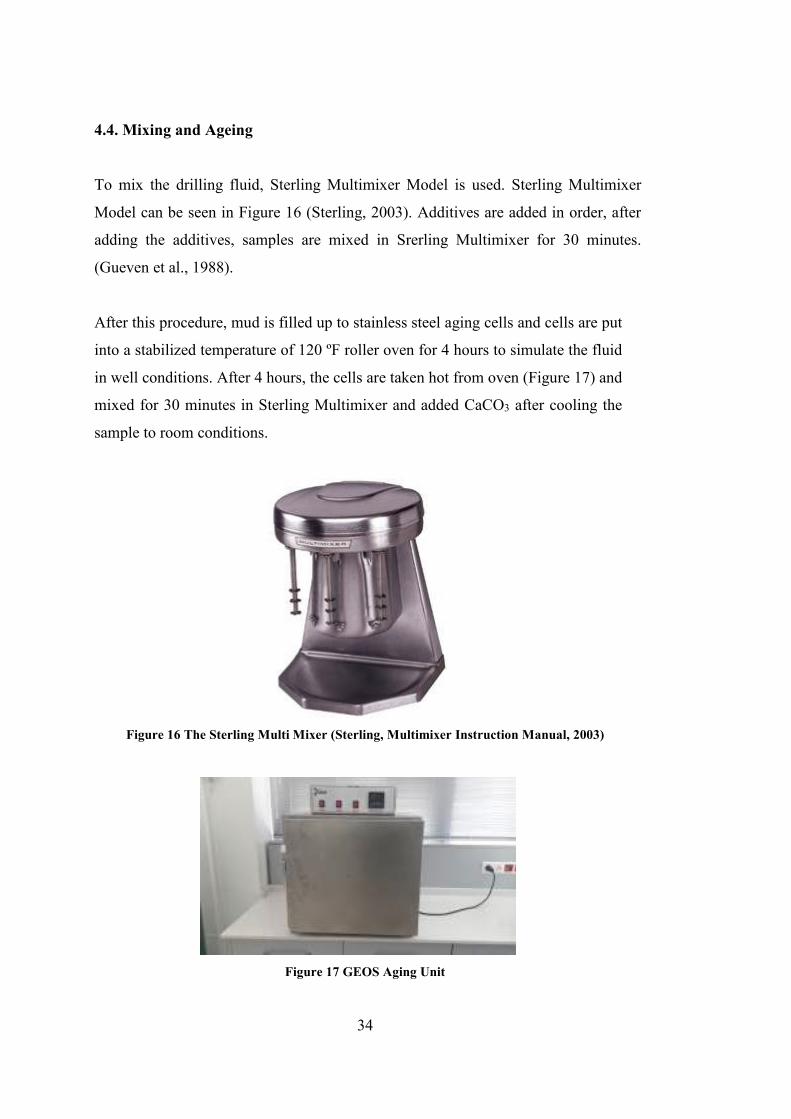
4.4. Mixing and Ageing
To mix the drilling fluid, Sterling Multimixer Model is used. Sterling Multimixer
Model can be seen in Figure 16 (Sterling, 2003). Additives are added in order, after
adding the additives, samples are mixed in Srerling Multimixer for 30 minutes.
(Gueven et al., 1988).
After this procedure, mud is filled up to stainless steel aging cells and cells are put
into a stabilized temperature of 120 ºF roller oven for 4 hours to simulate the fluid
in well conditions. After 4 hours, the cells are taken hot from oven (Figure 17) and
mixed for 30 minutes in Sterling Multimixer and added CaCO3 after cooling the
sample to room conditions.
Figure 16 The Sterling Multi Mixer (Sterling, Multimixer Instruction Manual, 2003)
Figure 17 GEOS Aging Unit

35
4.5. Additives
In order to prepare a drill-in fluid; XCD polymer, starch and NaOH are mixed as
base fluid. As bridging material, CaCO3 different sized samples were sieved and
used. Distilled water was used in this study not to be effected from the hardness of
the fresh water. Composition of base fluid is shown in Table 4.3.
Table 3Composition of Base Fluid
Additives Amount
XCD, lb/bbl 1.5
Starch, lb/bbl 6
NaOH, lb/bbl 0.75
4.5.1. XCD Polymer
It is a high molecular weight Xanthan Gum biopolymer. It is used to viscosity water
based drilling and completion fluids. It is known as the primer viscosity modifier
which is used for this study in concentration of 1,5 lb/bbl.
4.5.2. Starch
Starch is a filter loss agent in fresh drilling fluids water based. It is an anionic
polymer which is cellulose based. In this study, it is used in concentration of 6 lb/bbl.
4.5.3. Caustic Soda (NaOH)
NaOH is used the increase the pH of the water-based drilling fluids.
36
4.5.4. CaCO3
Different sizes of CaCO3 are used. These commercially available CaCO3s’ named
regarding to their micron sizes after being sieved. The specifications of CaCO3 s are
given in Table 4.2. Specific gravity of CaCO3 s are taken as 2.7. The most leading an
differenting part of the experiment is the CaCO3 s.
4.6. Formulation
To make the final volume of mud samples 350 cc, the volume increasing factor of
CaCO3 was taken into account. After ageing all of the distilled water-polymer
mixtures were collected in a jar and then divided into 5 different volumes as seen
below. Thus, as the concentration of the CaCO3 increased, the volume of distilled
water-polymer mixture decreased according to volume increasing the calculation of
CaCO3. Volume increases per 100 bbl of mud due to adding CaCO3; (Lapeyrouse,
2002)
Vinc = 100 x (W2 – W1) ÷ (22.5 – W2) (4.5)
Where;
W1 = current mud weight in ppg
W2 = new mud weight in ppg
1. 5 lb/bbl CaCO3 (348,1 ml distilled water + 1,5 lb/bbl XCD + 6 lb/bbl starch)
2. 15 lb/bbl CaCO3 (344,4 ml distilled water + 1,5 lb/bbl XCD + 6 lb/bbl starch)
3. 30 lb/bbl CaCO3 (338,9 ml distilled water + 1,5 lb/bbl XCD + 6 lb/bbl starch)
4. 45 lb/bbl CaCO3 (333,3 ml distilled water + 1,5 lb/bbl XCD + 6 lb/bbl starch)
5. 60 lb/bbl CaCO3 (327,8 ml distilled water + 1,5 lb/bbl XCD + 6 lb/bbl starch)

37
CHAPTER 5
RESULTS AND DISCUSSION
Based on the data from several tests of drill-in fluids with different sized CaCO3
samples with different concentrations, both the size distribution and concentration
effects on both rheology and fluid loss are evaluated. The shear stress versus shear
rate curves for the different samples of drill-in fluids under constant temperature and
pressure are presented. The results are compared with three different rheological
models namely Bingham plastic, power law and Herschel Buckley (Yield Power
Law). Effects of CaCO3 concentration and particle size on fluid loss of the fluids
under consideration are also evaluated in this section.
5.1 Effect of Concentration of CaCO3 on Rheological Behavior of Drill-In
Fluids.
Rheological behavior of DIFs is evaluated as a function of sized CaCO3 at five
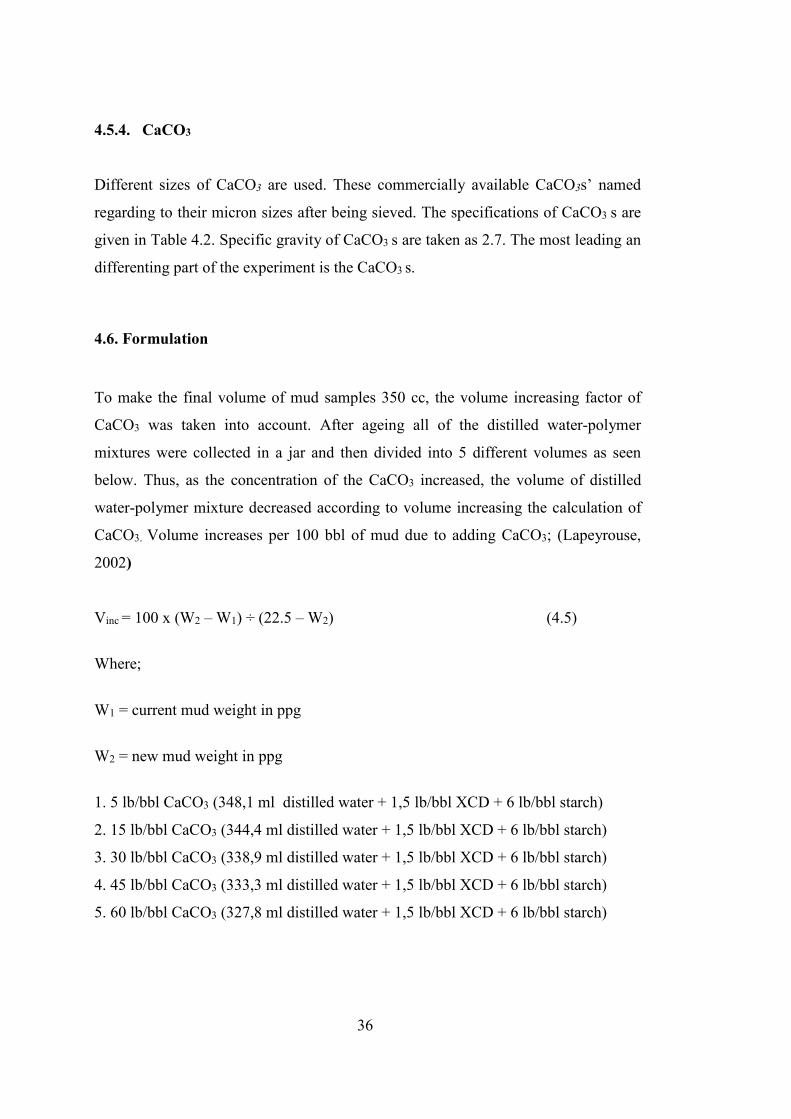
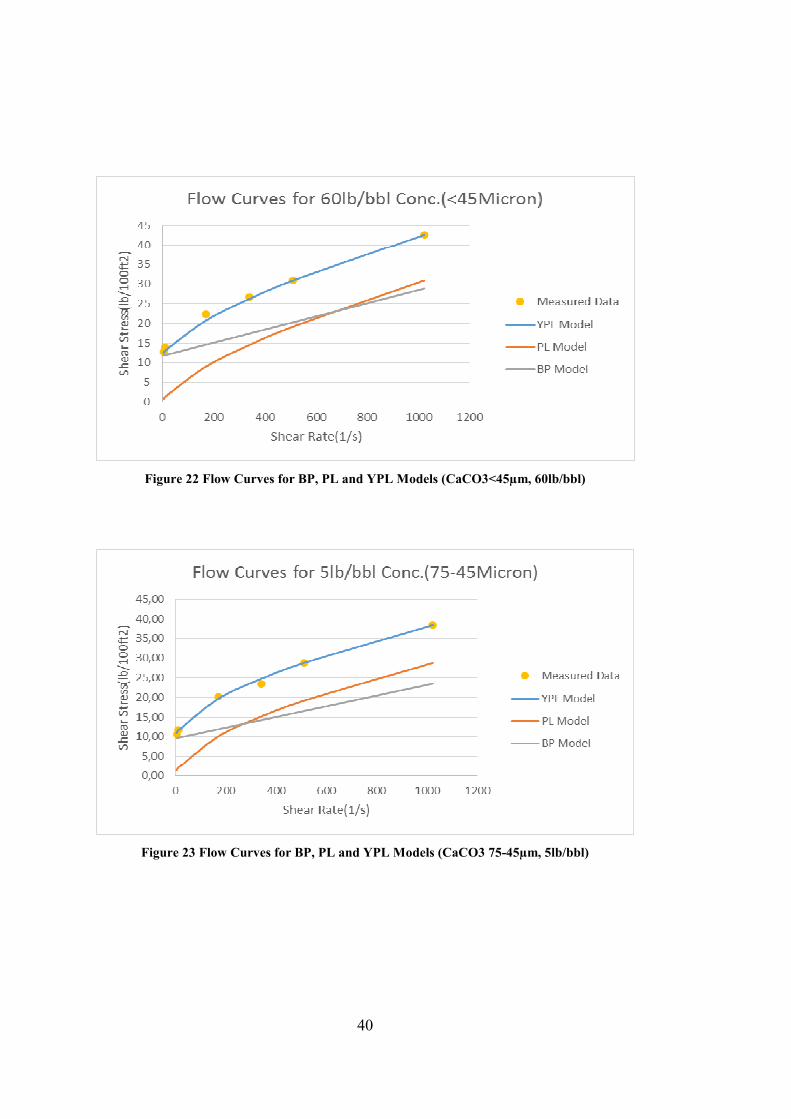
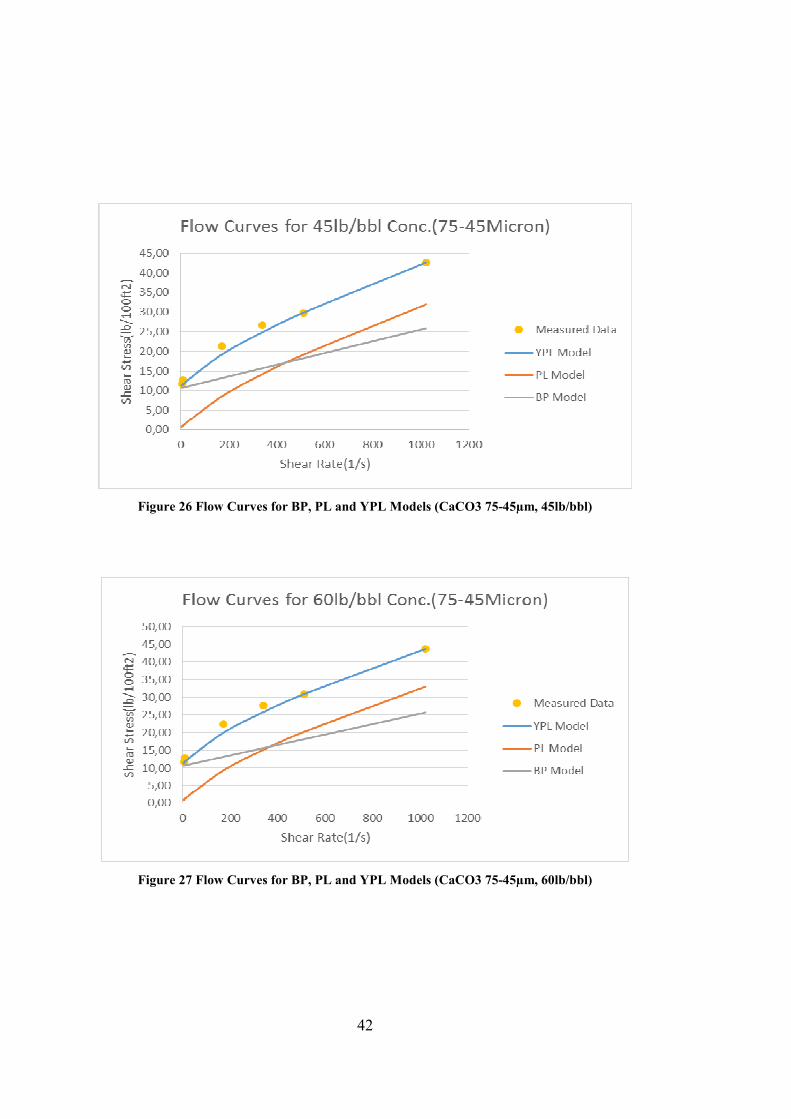
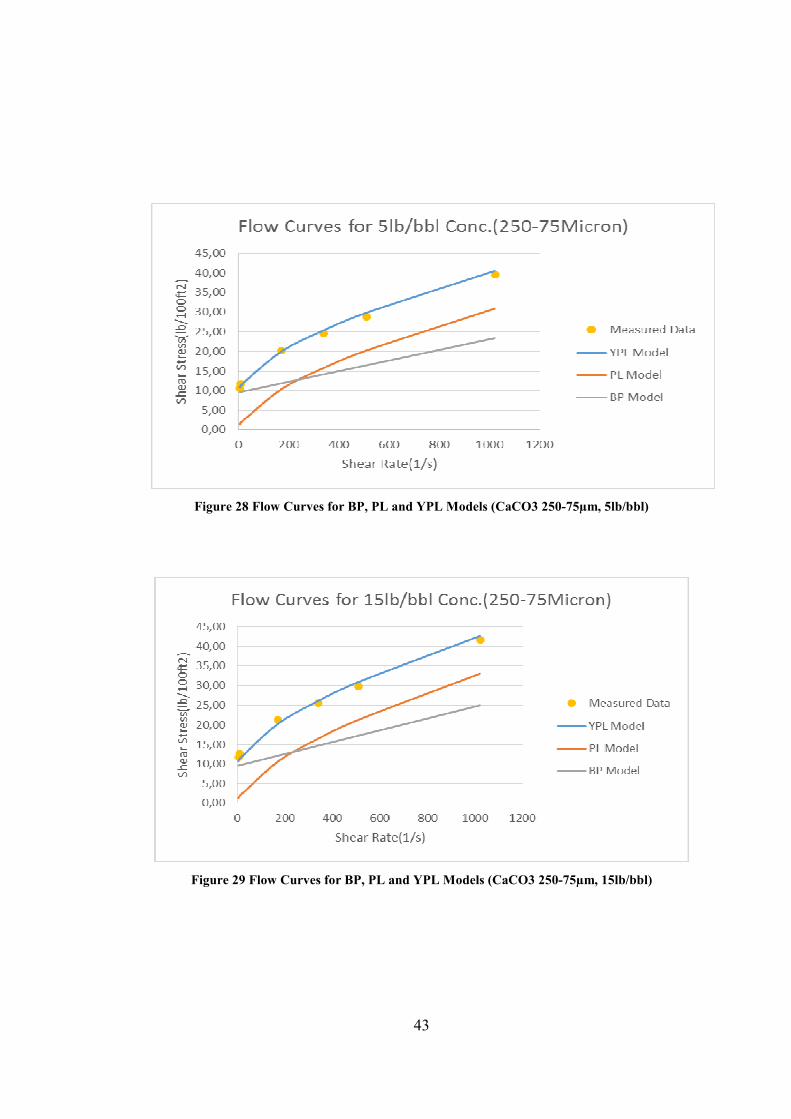
different concentrations and the results are illustrated through Figures 18 to 32 As
apparently seen from these figures, the DIFs under consideration are well
characterized with a non-linear flow curve above the yield stress. In other words,
these fluids exhibit yield-pseudoplastic behavior significantly deviating from the
Bingham plastic and pseudoplastic rheology. The Herschel-Bulkley (Yield Power
Law) model accurately describes the relationship between the shear stress and the
shear rate for these fluids at any CaCO3 concentration and particle size distribution.
The numerical data of the flow curves can be seen at Appendices.

38
Figure 18 Flow Curves for BP, PL and YPL Models (CaCO3<45µm, 5lb/bbl)
Figure 19 Flow Curves for BP, PL and YPL Models (CaCO3<45µm, 15lb/bbl)

39
Figure 20 Flow Curves for BP, PL and YPL Models (CaCO3<45µm, 30lb/bbl)
Figure 21 Flow Curves for BP, PL and YPL Models (CaCO3<45µm, 45lb/bbl)
40
Figure 22 Flow Curves for BP, PL and YPL Models (CaCO3<45µm, 60lb/bbl)
Figure 23 Flow Curves for BP, PL and YPL Models (CaCO3 75-45µm, 5lb/bbl)

41
Figure 24 Flow Curves for BP, PL and YPL Models (CaCO3 75-45µm, 15lb/bbl)
Figure 25 Flow Curves for BP, PL and YPL Models (CaCO3 75-45µm, 30lb/bbl)
42
Figure 26 Flow Curves for BP, PL and YPL Models (CaCO3 75-45µm, 45lb/bbl)
Figure 27 Flow Curves for BP, PL and YPL Models (CaCO3 75-45µm, 60lb/bbl)
43
Figure 28 Flow Curves for BP, PL and YPL Models (CaCO3 250-75µm, 5lb/bbl)
Figure 29 Flow Curves for BP, PL and YPL Models (CaCO3 250-75µm, 15lb/bbl)

44
Figure 30 Flow Curves for BP, PL and YPL Models (CaCO3 250-75µm, 30 lb/bbl)
Figure 31 Flow Curves for BP, PL and YPL Models (CaCO3 250-75µm, 45 lb/bbl)

45
Figure 32 Flow Curves for BP, PL and YPL Models (CaCO3 250-75µm, 60 lb/bbl)
5.2. Effect of Concentration and Particle Size of CaCO3 on Rheological
Properties
Effect of sized CaCO3 at different concentrations on rheological parameters of the
Bingham plastic, power law and yield-power law model are evaluated in this
section.
5.2.1. Effect of Concentration and Particle Size of CaCO3 on PV and YP
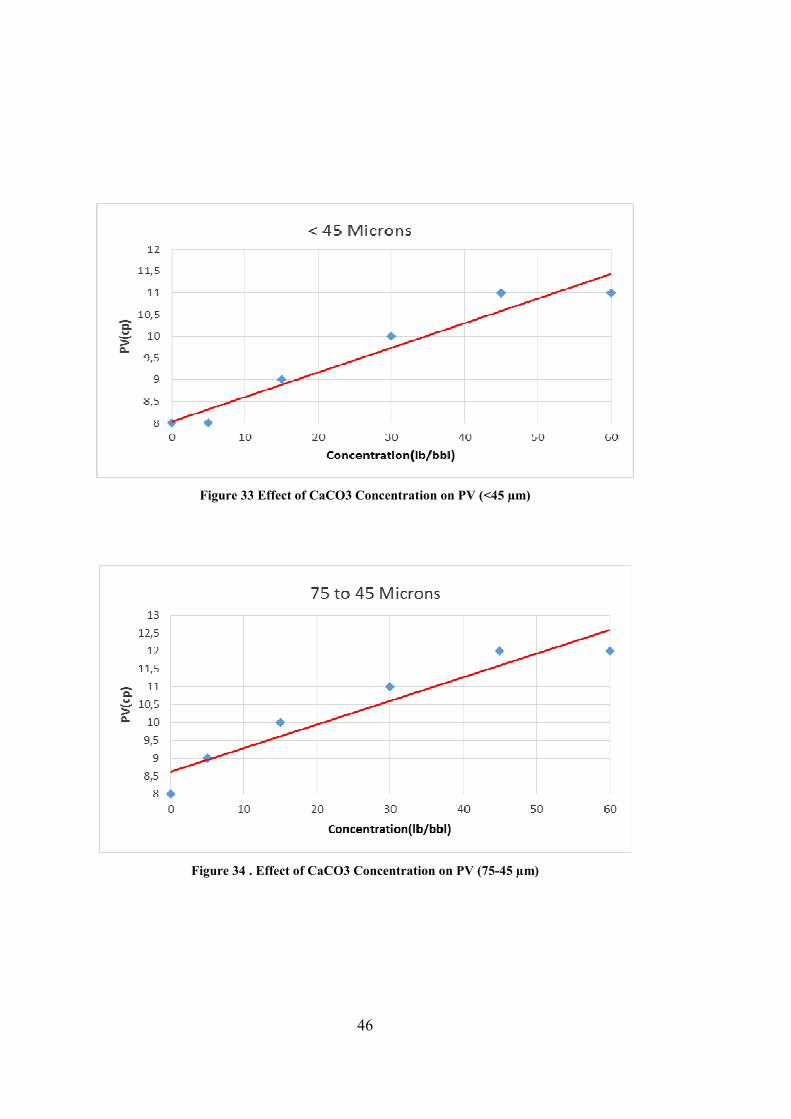
As shown from Figures 33 to 35 plastic viscosity (PV) of DIFs increases
proportionally with concentration for all sizes of CaCO3. Increase in plastic
viscosity is largely due to increasing mechanical friction between solid particles as a
function CaCO3 concentration in DIFs.
46
Figure 33 Effect of CaCO3 Concentration on PV (<45 µm)
Figure 34 . Effect of CaCO3 Concentration on PV (75-45 µm)
47
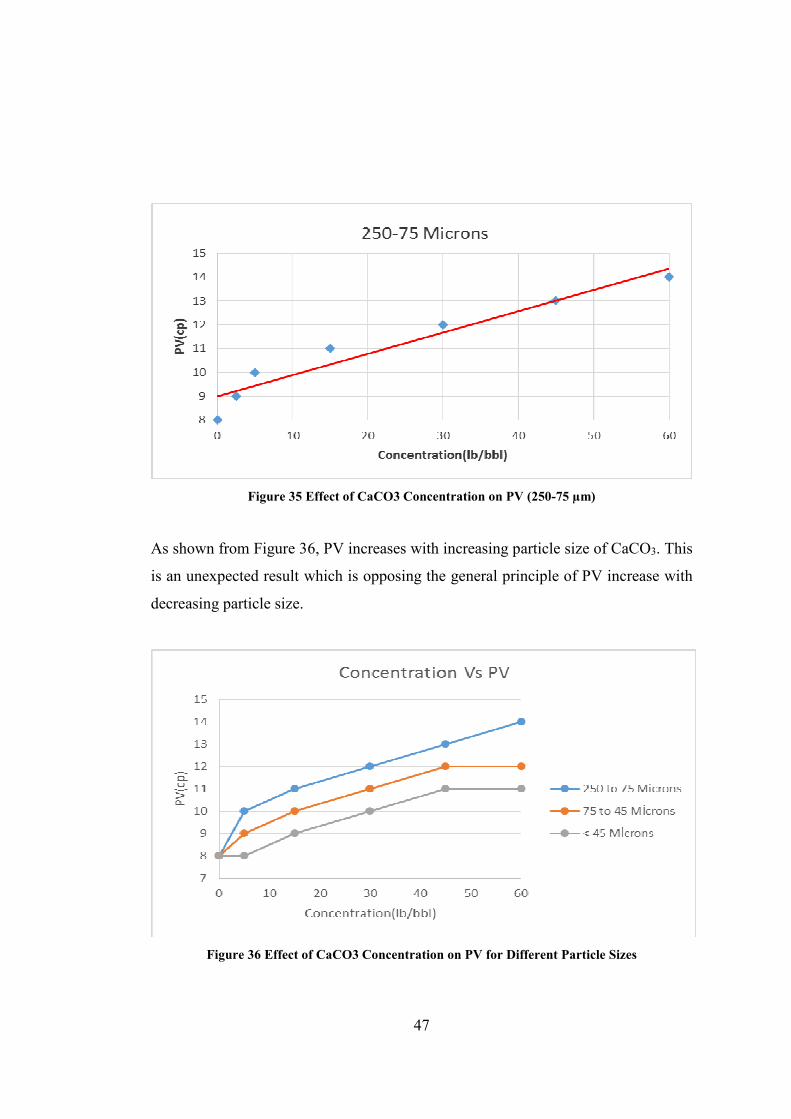
Figure 35 Effect of CaCO3 Concentration on PV (250-75 µm)
As shown from Figure 36, PV increases with increasing particle size of CaCO3. This
is an unexpected result which is opposing the general principle of PV increase with
decreasing particle size.
Figure 36 Effect of CaCO3 Concentration on PV for Different Particle Sizes

48
As shown from Figures 37 to 39, yield point (YP) does not show sensitivity to
concentration of CaCO3 for any size. YP values for sizes less than 45 micron and
size 75 to 45 micron show a decrement for increasing concentrations but for size
250 to 75 micron, YP remains nearly constant except zero concentration of CaCO3.
YP decreases suddenly from 0 lb/bbl concentration to 5 lb/bbl concentration of
CaCO3. It can be explained as the consumption of XCD polymer by CaCO3
particles.
Figure 37 Effect of CaCO3 Concentration on YP (<45 µm)

49
Figure 38 Effect of CaCO3 Concentration on YP (75-45 µm)
Figure 39 Effect of CaCO3 Concentration on YP (250-75 µm)
These Figures 37,38 and 39 have two parts as seen , first part is the sharp decrease
between 0lb/bbl and 5lb/bbl and the second part is the slight decrease between
5lb/bbl and other concentrations.
50
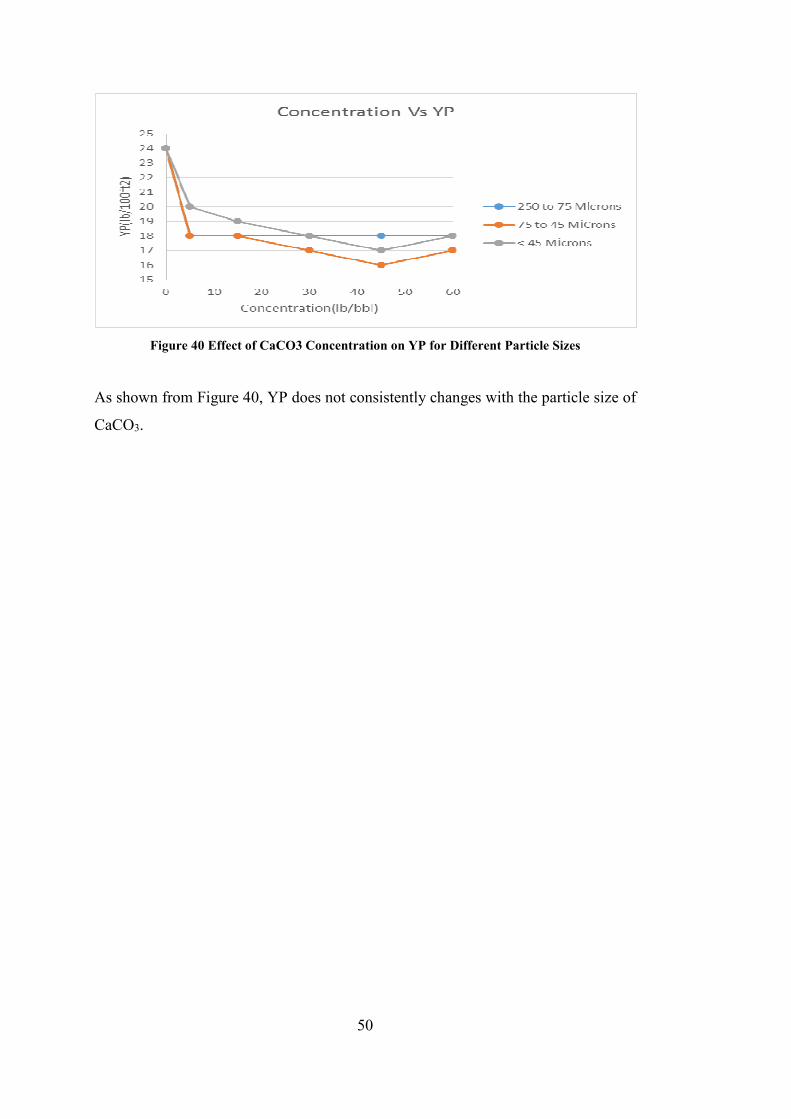
Figure 40 Effect of CaCO3 Concentration on YP for Different Particle Sizes
As shown from Figure 40, YP does not consistently changes with the particle size of
CaCO3.

51
5.2.2. Effect of Concentration and Particle Size of CaCO3 on na and Ka
As seen in Figures 41 to 43; Flow behavior index in annulus (na) shows a decreasing
tendency as the concentration of CaCO3 increases for all sizes. This means that the
fluid becomes more shear thinning with increasing concentration of CaCO3.
Figure 41 Effect of CaCO3 Concentration on na (<45 µm)
Figure 42 Effect of CaCO3 Concentration on na (75-45 µm)
52
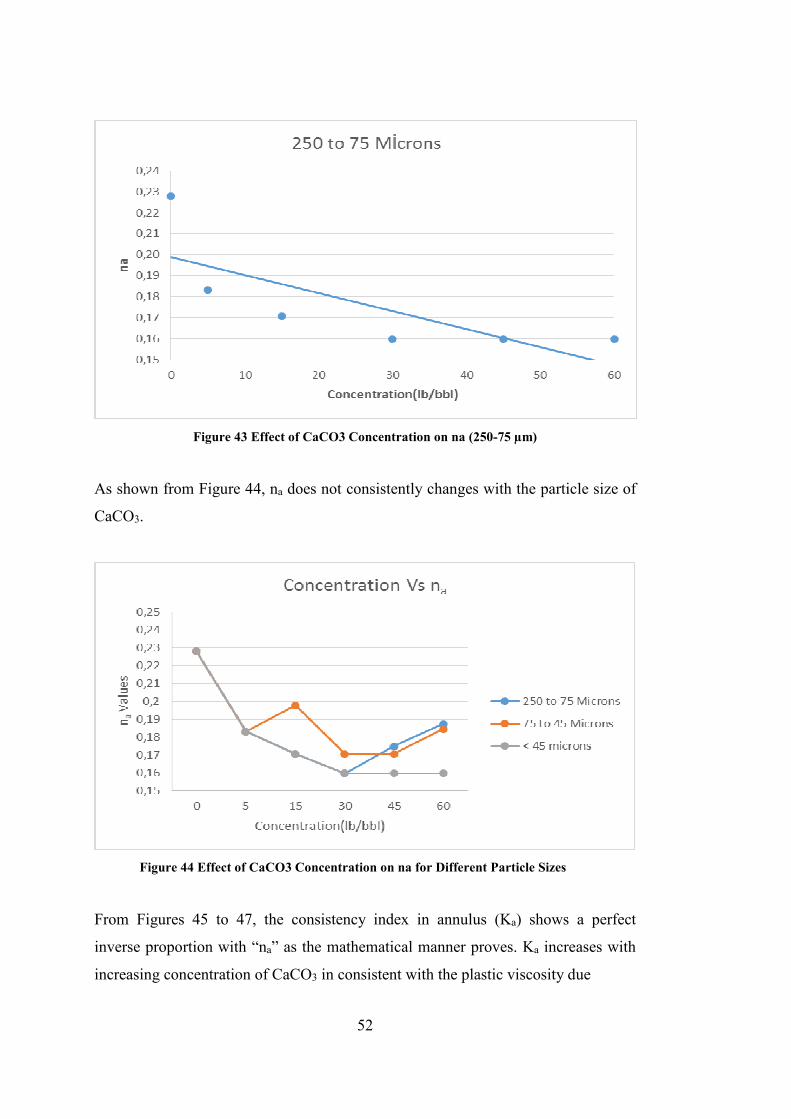
Figure 43 Effect of CaCO3 Concentration on na (250-75 µm)
As shown from Figure 44, na does not consistently changes with the particle size of
CaCO3.
Figure 44 Effect of CaCO3 Concentration on na for Different Particle Sizes
From Figures 45 to 47, the consistency index in annulus (Ka) shows a perfect
inverse proportion with “na” as the mathematical manner proves. Ka increases with
increasing concentration of CaCO3 in consistent with the plastic viscosity due

53
increasing mechanical friction between solid particles as a function CaCO3
concentration in DIFs.
Figure 45 Effect of CaCO3 Concentration on Ka (<45 µm)
Figure 46 Effect of CaCO3 Concentration on Ka (75-45 µm)

54
Figure 47 Effect of CaCO3 Concentration on Ka (250-75 µm)
As shown from Figure 48, Ka does not consistently changes with the particle size of
CaCO3
Figure 48 Effect of CaCO3 Concentration on na for Different Particle Sizes

55
5.2.3 Effect of Concentration and Particle Size of CaCO3 on np and Kp
Figures 49 to 51 illustrates the increment of flow behavior index in pipe flow (np) as
the concentration of CaCO3 increases. This indicates that increasing concentration
of CaCO3 makes the fluid more Newtonian at high shear rates.
Figure 49 Effect of CaCO3 Concentration on np (<45 µm)
Figure 50 Effect of CaCO3 Concentration on np (75-45 µm)
56
Figure 51Effect of CaCO3 Concentration on np (250-75 µm)
As shown from Figure 52, np decreases with incresing particle size of CaCO3. The
smaller particle sizes of of CaCO3 makes the fluid more shear thinning.
Figure 52 Effect of CaCO3 Concentration on np for Different Particle Sizes
In Figures 53 to 55 same behavior of consistency index in pipe flow (Kp) can be
seen for three different sizes. As the concentration of CaCO3 increases, the Kp value
decreases with an inverse proportion to “np”.
57
Figure 53 Effect of CaCO3 Concentration on Kp (<45 µm)
Figure 54 Effect of CaCO3 Concentration on Kp (75-45 µm)
58
Figure 55 Effect of CaCO3 Concentration on Kp (250-75 µm)
As shown from Figure 56, Kp increases with incresing particle size of CaCO3 for all
concentrations of CaCO3.
Figure 56 Effect of CaCO3 Concentration on Kp for Different Particle Sizes
5.2.4 Effect of Concentration and Particle Size of CaCO3 on ττττy, m and k
Figures 57 to 59 show that the low-shear-rate yield point (τy) of DIF increases with
increasing CaCO3 concentration for all CaCO3 sizes. This increasing tendency of the
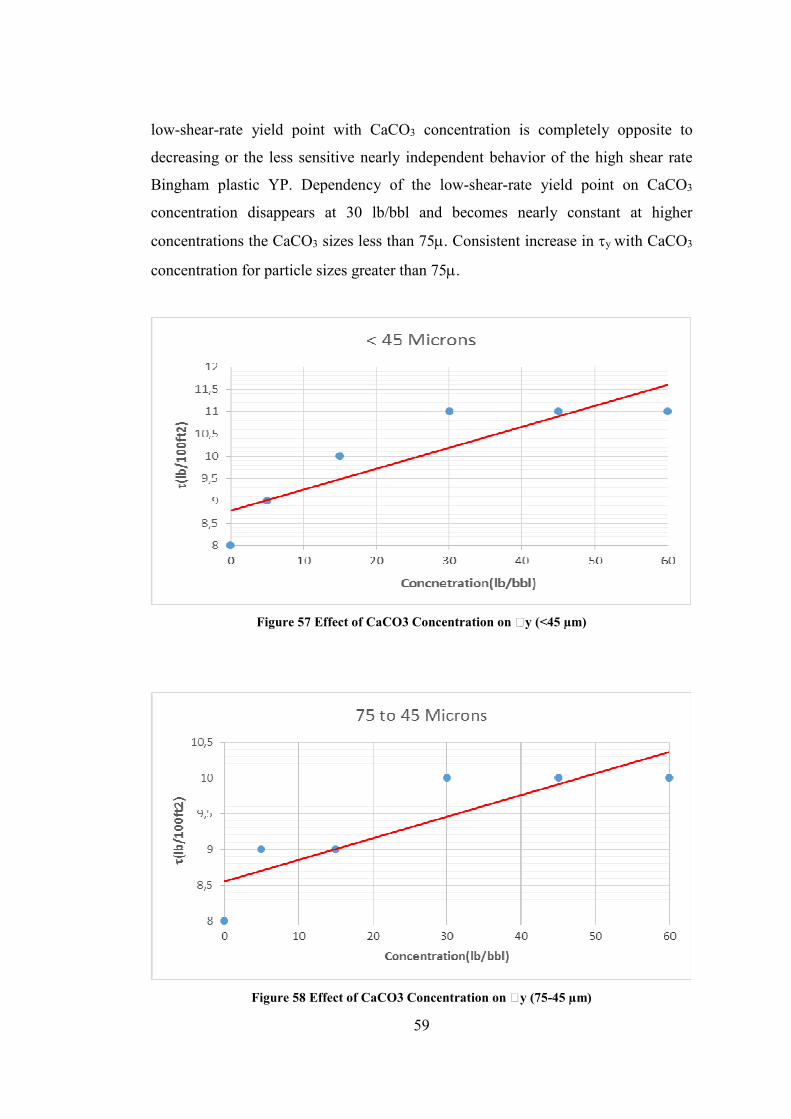
59
low-shear-rate yield point with CaCO3 concentration is completely opposite to
decreasing or the less sensitive nearly independent behavior of the high shear rate
Bingham plastic YP. Dependency of the low-shear-rate yield point on CaCO3
concentration disappears at 30 lb/bbl and becomes nearly constant at higher
concentrations the CaCO3 sizes less than 75µ. Consistent increase in τy with CaCO3
concentration for particle sizes greater than 75µ.
Figure 57 Effect of CaCO3 Concentration on y (<45 µm)
Figure 58 Effect of CaCO3 Concentration on y (75-45 µm)
60
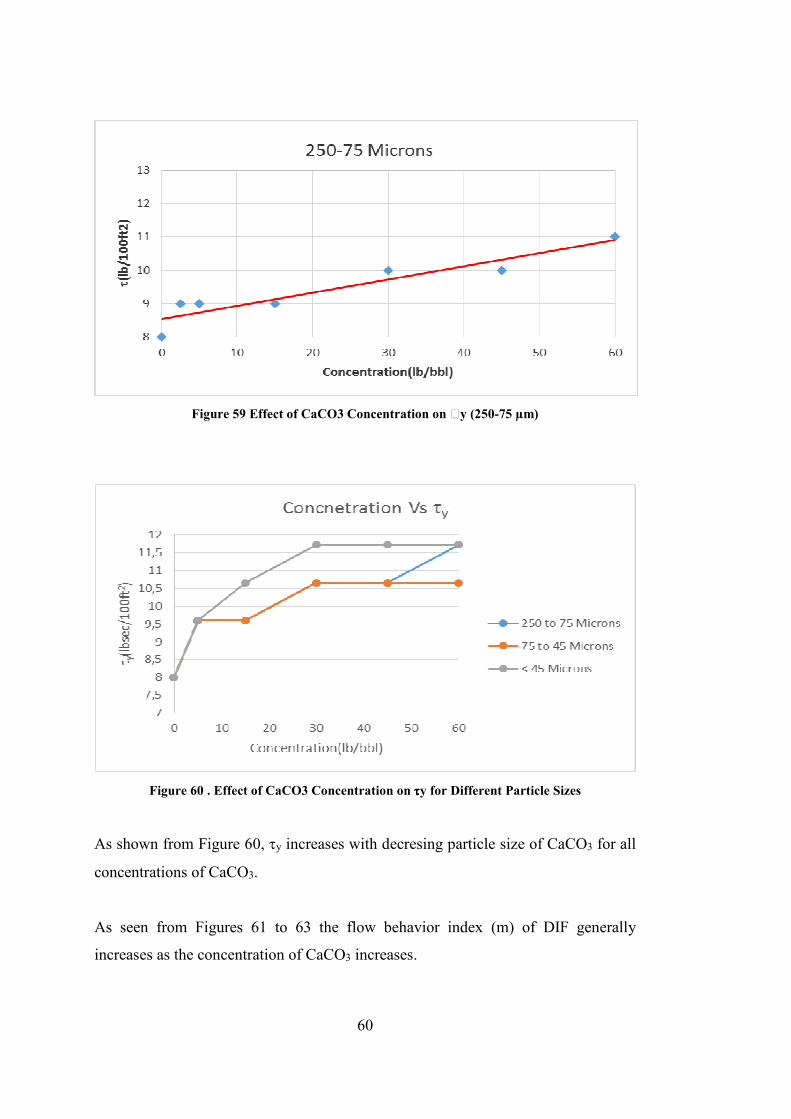
Figure 59 Effect of CaCO3 Concentration on y (250-75 µm)
Figure 60 . Effect of CaCO3 Concentration on ττττy for Different Particle Sizes
As shown from Figure 60, τy increases with decresing particle size of CaCO3 for all
concentrations of CaCO3.
As seen from Figures 61 to 63 the flow behavior index (m) of DIF generally
increases as the concentration of CaCO3 increases.

61
Figure 61 Effect of CaCO3 Concentration on m (<45 µm)
Figure 62 Effect of CaCO3 Concentration on m (75-45 µm)
62
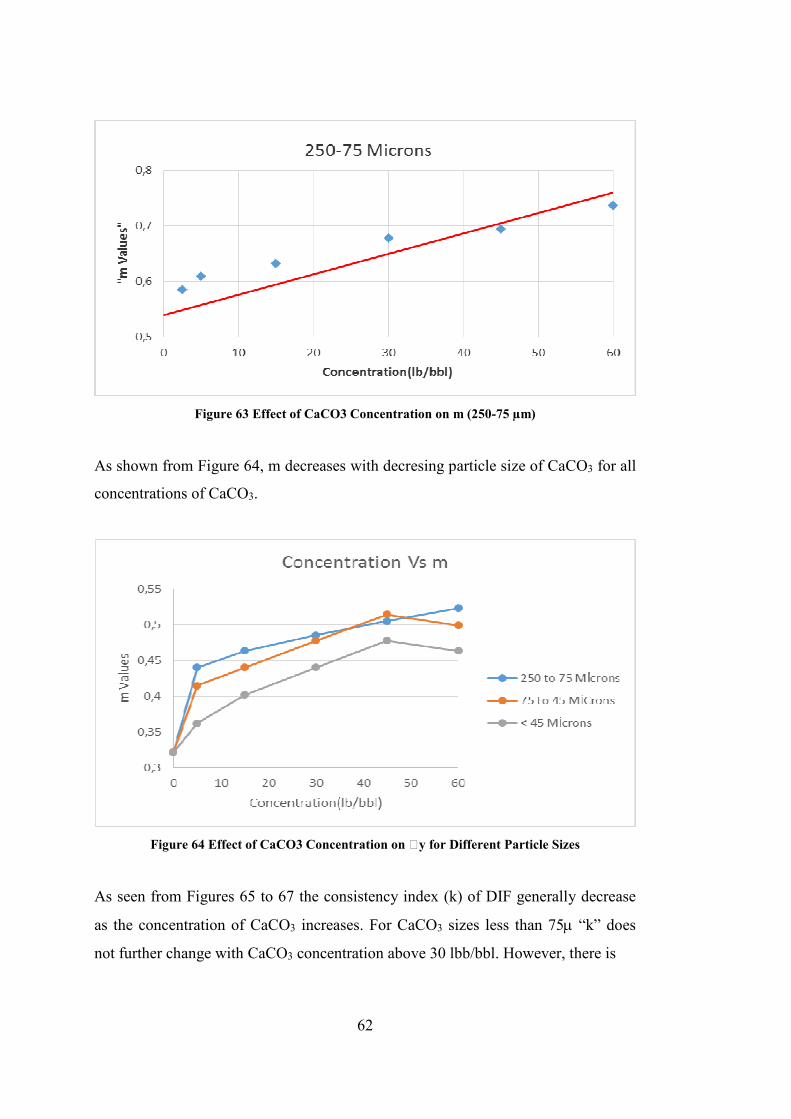
Figure 63 Effect of CaCO3 Concentration on m (250-75 µm)
As shown from Figure 64, m decreases with decresing particle size of CaCO3 for all
concentrations of CaCO3.
Figure 64 Effect of CaCO3 Concentration on y for Different Particle Sizes
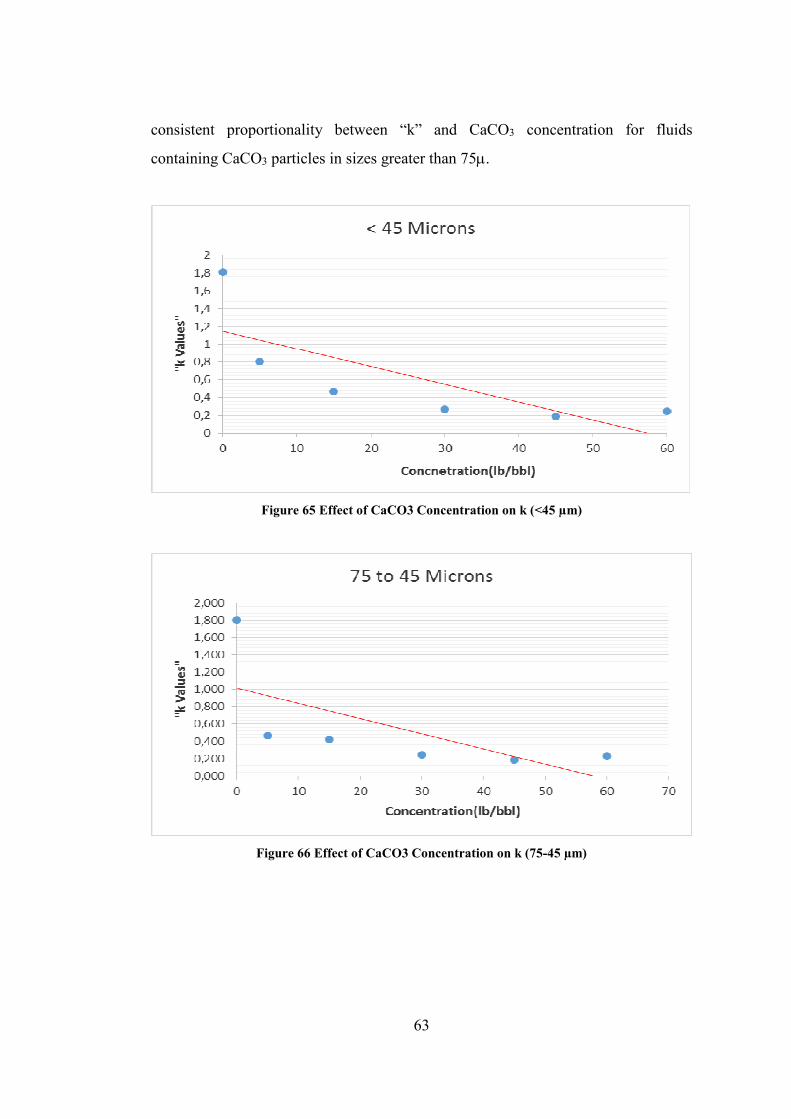
As seen from Figures 65 to 67 the consistency index (k) of DIF generally decrease
as the concentration of CaCO3 increases. For CaCO3 sizes less than 75µ “k” does
not further change with CaCO3 concentration above 30 lbb/bbl. However, there is
63
consistent proportionality between “k” and CaCO3 concentration for fluids
containing CaCO3 particles in sizes greater than 75µ.
Figure 65 Effect of CaCO3 Concentration on k (<45 µm)
Figure 66 Effect of CaCO3 Concentration on k (75-45 µm)

64
Figure 67 Effect of CaCO3 Concentration on k (250-75 µm)
As shown from Figure 68, k increeases with decresing particle size of CaCO3 for all
concentrations of CaCO3.
Figure 68 Effect of CaCO3 Concentration on k for Different Particle Sizes
5.3. Effect of CaCO3 Concentration and Particle Size on Fluid Loss
Fom Figure 69 to 71 it is obviously seen that as the concentration of CaCO3
increases, the fluid loss of DIFs decreases. The graphs devided into two parts; the
first part describes how the addition of small amount of CaCO3 affects the fluid loss.

65
When no CaCO3 is added, particles needed to form the main skeloton of filter cake
are not available. Therefoe, the spurt loss occurs for CaCO3 free (0 lb/bbl) DIF. In
the second part between 5 lb/bbl of CaCO3 to 60 lb/bbl of CaCO3, fluid loss
consistently decreases with increasing CaCO3 concentration for all particle sizes.
Figure 69 Effect of CaCO3 Concentration on Fluid Loss (<45 µm)
Figure 70 Effect of CaCO3 Concentration on Fluid Loss (75-45 µm)
66
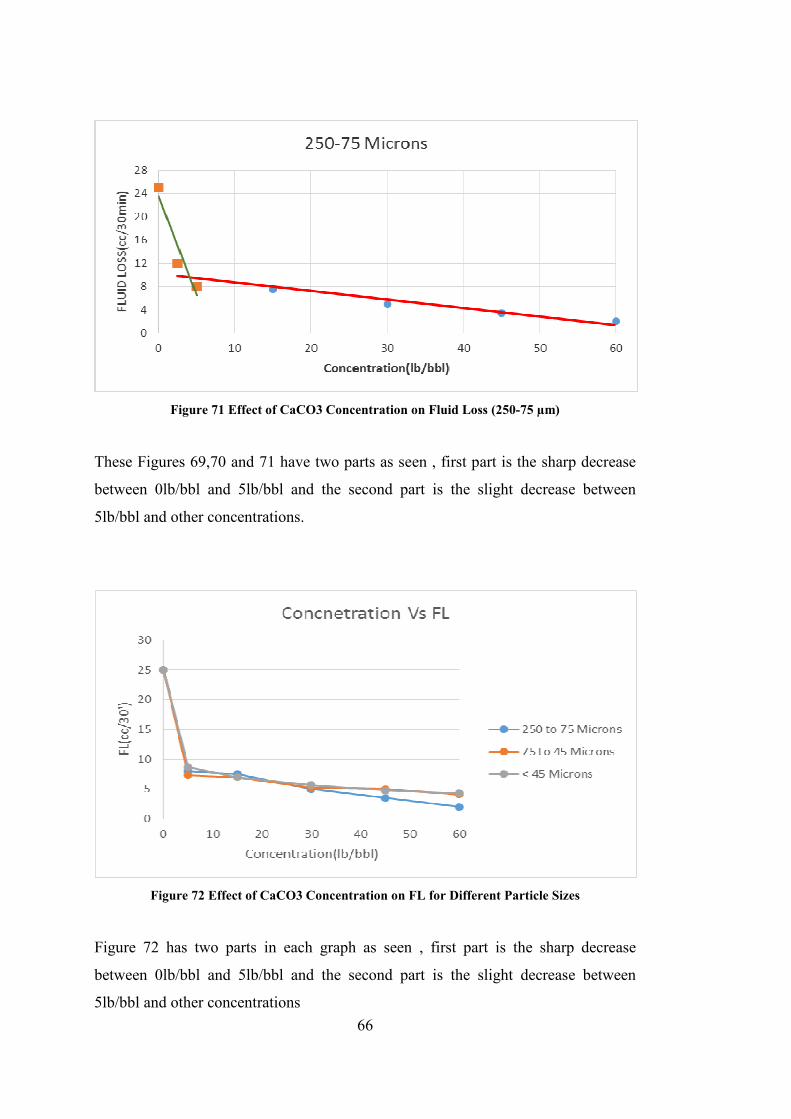
Figure 71 Effect of CaCO3 Concentration on Fluid Loss (250-75 µm)
These Figures 69,70 and 71 have two parts as seen , first part is the sharp decrease
between 0lb/bbl and 5lb/bbl and the second part is the slight decrease between
5lb/bbl and other concentrations.
Figure 72 Effect of CaCO3 Concentration on FL for Different Particle Sizes
Figure 72 has two parts in each graph as seen , first part is the sharp decrease
between 0lb/bbl and 5lb/bbl and the second part is the slight decrease between
5lb/bbl and other concentrations

67
CHAPTER 6
CONCLUSIONS
During this study, performance of CaCO3 is tested as a bridging material for DIFs
in polymer base mud. Different sizes and concentrations of CaCO3 are tested for
several tests. The experiments were carried out in GEOS Central Laboratory. The
results are analyzed and the following conclusions can be drawn:
• Drill-in fluids tested here exhibit the yield-pseudo plastic behavior which is
characterized non-linear relationship between the shear stress and the shear
rate above the low shear rate yield point (τy).
• The Herschel Buckley Model accurately describes the yield-pseudo plastic
rheology of the DIFs in a range of shear rate from 5.11 to 1022 sec-1compared
to the Bingham plastic and power law models.
• Plastic viscosity (PV) of DIFs increases proportionally with concentration for
all sizes of CaCO3 due to increasing mechanical friction between solid
particles as a function CaCO3 concentration.
• The Bingham plastic yield point (YP) gives consistent decrease with addition
of small amount of CaCO3 but after 5 lb/bbl it does not show sensitivity to
concentration of CaCO3 for any size. This behavior becomes more pronounced
for CaCO3 sizes greater than 75µ.
• Flow behavior index in annulus (na) shows a decreasing tendency as the
concentration of CaCO3 increases for all sizes making the fluid more shear
thinning.

68
• Consistency index in annulus (Ka) increases with increasing concentration of
CaCO3 in consistent with the plastic viscosity due increasing mechanical
friction between solid particles as a function CaCO3 concentration in DIFs.
• Flow behavior index in pipe flow (np) increases as the concentration of
CaCO3 increases making the fluid more Newtonian at high shear rates.
• Consistency index in pipe flow (Kp) decreases with the increasing CaCO3
concentration.
• The low-shear-rate yield point (τy) of DIF increases with increasing CaCO3
concentration for all CaCO3 sizes.
• Dependency of the low-shear-rate yield point on CaCO3 concentration
disappears at 30 lb/bbl and becomes nearly constant at higher concentrations
the CaCO3 sizes less than 75µ.
• The Herschel-Bulkley flow behavior index (m) generally increases as the
concentration of CaCO3 increases. For CaCO3 sizes less than 75µ “n” does
not further change with CaCO3 concentration above 30 lbb/bbl.
• The Herschel-Bulkley consistency index (k) decreases with the concentration
of CaCO3.
• Fluids without CaCO3 concentration increases, the fluid loss of DIFs
decreases.
• Spurt loss occurs due to the lack of bridging materials when no CaCO3 is
added. Therefore addition of small amount of CaCO3 leads to significant
reduction in fluid loss contributing to the formation of filter cake.
69
CHAPTER 7
RECOMMENDATIONS
This study is a well experimented stage to see the effect of particle size and
concentration of CaCO3 used in DIF’s and the relationship between the size and
concentration of CaCO3 in other properties of DIF like fluid Loss. Although all of
the experiments run and results obtained with this study, further studies are highly
recommended for better understanding the effect of size and concentration of
CaCO3.
• Different sizes of CaCO3 like nano-particle sized CaCO3 can be used to see
the different effects on DIF.
• Different microfiber celluloses and viscosity agents can be used to see the
new rheological parameters to compare the effects of polymers.
• Different types of fluids, like synthetic drilling fluids, can be tested.
• Tests should be run in different temperatures and pressure differentials to
compare the temperature and pressure effects.

70
71
REFERENCES
Abdou, M.I. and El-Sayed Ahmed H. (2011). “Effect of Particle Size of Bentonite on
“Rheological Behavior of the Drilling Mud” Petroleum Science and
Technology, 29:2220–2233.
Abrams, A. (1977). “Mud Design to Minimize Rock Impairment due to Particle
Invasion,” Journal Petroleum Technology.
Adachi, J., Bailey, L., Houwen, O.H., Meeten, G.H. and Way, P.W., Schlemmer,
R.P. (2004). Depleted Zone Drilling: Reducing Mud Losses Into Fractures,
IADC/SPE 87224. IADC/SPE Drilling Conference, Dallas, Texas, U.S.A.
American Petroleum Institute. (1997). “Recommended Practice Standard Procedure
for Field Testing Water-based Drilling Fluids,” 2nd Ed.
ASTM E175-82 .(1995). “Standard Terminology of Microscopy,” American Society
for Testing and Materials, West Conshohocken, PA.
Baker Huges Drilling Fluids Manual (1998). Baker Fluid Facts.
Bourgoyne Jr, A., Millheim, K., Chenevert, M. and Young Jr, F. (2003). Applied
Drilling Engineering, SPE Textbook Series, Vol. 2, SPE, Richardson, Texas.
Bugbee, J. M. (1953). Lost Circulation-A Major Problem in Exploration and
Development. Southwestern District, Division of Production, Forth Worth,
Texas.
Cargnel, R.D. and Luzardo, J.P. (1999). Particle Size Distribution Selection of
72
CaCO3 in Drill-In Fluids: Theory and Applications, SPE 53937. SPE Latin
American and Caribbean Petroleum Engineering Conference, Caracas,
Venezuela.
Chowdhury,D., Skalle, P., Rahman, M.M. (2009). Prediction of Stand Pipe
Pressure using Conveintional Approach.
Dick, M.A., Heinz, T.J., Svoboda, C.F., Aston, M. (2000, 23-24
February). Optimizing the Selection of Bridging Particles for Reservoir
Drilling Fluids, SPE 58793. 2000 SPE International Sypmposium on
Formation Damage, Lafayette, Louisiana.
Fann Instrument Company. (2015). Model 35 Viscometer Instruction Manual.
GEOS Drilling Fluids Inc. (2015). Product Data Sheet, GeoCarb.
Gücüyener, I.H. (2010). Drilling Hydraulics, lecture notes at METU.
Gücüyener, I.H. (2010). Drilling Fluids Engineering, lecture notes at METU.
Gueven, N., Hemphill, D. J., and Carney, L. L. (1988). Comparative Rheology of
Water-Base Drilling Fluids with Various Clays. Richardson, TX: Society of
Petroleum Engineers.
Gockel, J.F., Gockel C.E., and Brinemann, M. (1987, 15–18 March). Lost
Circulation: A Solution Based on the Problem, SPE/IADC 16082. SPE/IADC
Drilling Conference, New Orleans, L.A.
De Lloyd, D. (2000). Chemistry Department, the University of The West Indies, St.
Augustine campus, The Republic of Trinidad and Tobago.
Rheology of Drilling Muds. (n.d.). Retrieved March, 2015 from
http://rishibabuadari.tripod.com/MudRheology/Rheology.htm
Particle Size Conversion Table. (2015). In Chemicals - Technical Library. Retrieved

73
April, 2015from
http://www.sigmaaldrich.com/chemistry/stockroomreagents/learning-
center/technical-library/particle-size-conversion.html
Hand N., Kowbel K., Maikranz S., Nouris R. (1998, 13 July). Drill-in Fluid Reduces
Formation Damage, Increases Production Rates. Oil & Gas Journal.
Islam A. (2008). Drilling Fluid Rheology Note, lecture note at IPT, NTNU,
Trondheim.
Lapeyrouse N.J. (2002). Formulas and Calculations for Drilling, Production and
Workover, Second Edition.
M-I Drilling Fluids. L.C. (1998). Drilling Fluids Engineering Manual.
Nayberg T. M. And Petty B. R. (1986, 10-12 February). Laboratory Study of Lost
Circulation Materials for Use in both Oil-Base and Water-Base Drilling
Muds. IDAC/SPE 14723.
Pilehvari; Nyshadham, V. R. (2002, 20-21 February). Effect of Material Type and
Size Distribution on Performance of Loss/Seepage Control Material, SPE
73791. SPE International Symposium and Exhibition on Formation Damage
Control Lafayette. Louisiana.
Schafer, D.M., Loeppke, G.E., Glowka, D.A. and Scott, D.D. (1992, February 18-
21). An Evaluation of Flowmeters for the Detection of Kicks and Lost
Circulation During Drilling. In Sandia National Laboratories, and Wright,
E.K. Ktech Corp. IADC/SPE 1992 Drilling Conference, New Orleans,
Louisianna.
Nidaş A.Ş. (2010). Product Sheet

74
OFITE Instruments. (2009). OFITE API Filter Press Instruction Manual.
OFITE Instruments. (2009). OFITE Metal Mud Balance Instruction Manual.
Rojas, J.C., Bern, P.A., Fitzgerald, B.L., Modi, S., Bezant, P.N. (1998, 3 -6 March).
Minimizing Down Hole Mud Losses IADC/SPE 39398. 1888 IADC/SPE
Drilling Conference, Dallas, Texas,.
Rosato, M.J. and Supriono, A. (2002, April 9-10). Use of a Crosslinked Polymer
Fluid-Loss Control Agent to Aid Well Cleanouts SPE 74845. SPE/ICOTA
Coiled Tubing Conference, Houston, Texas.
Sharma, U., Suri, A., and Mukul, M. (2004). Strategies for sizing particles in
drilling and completion fluid. SPE J. 9:13–23.
Fluid Loss. (2015). In Schlumberger. Retrieved February, 2015 from
http://www.glossary.oilfield.slb.com/en/Terms/f/fluid_loss.aspx
Stephens, M. (1995). M-I Drilling Fluids L.L.C.
Sterling Multimixer Model #983 Instruction Manual. (2003).
Verret, R., Robinson, B., Cowan J., Fader, P., Looney, M. (2000, 23-24 February).
Use of Micronized Cellulose Fibers to Protect Producing Formations SPE
58794 SPE International Symposium on Formation Damage Control,
Lafayette, Louisiana.
AZO Materials. (2015). Particle Size - US Sieve Series and Tyler Mesh Size
Equivalents. In Azo-Materials. Retrieved January from
http://www.azom.com/details.asp?AticleID=1417

75
APPENDIX A
Measured and Calculated Shear Stresses-Shear Rates Data for Bingham Plastic
Model for Less Than 45 Micron Size
Table 4 5 lb/bbl Concentration Data
SR (1/s) SS (lb/100ft2) SSc (lb/100ft2) γγγγ(1/s) ττττm (lb/100ft2) ττττc (lb/100ft2) %Error
1022,22 38,38 23,64 1022,22 38,38 23,64 38,41
511,11 29,85 16,62 511,11 29,85 16,62 44,33
340,66 24,52 14,27 340,66 24,52 14,27 41,78
170,33 20,25 11,93 170,33 20,25 11,93 41,08
10,22 11,73 9,73 10,22 11,73 9,73 16,98
5,11 10,66 9,66 5,11 10,66 9,66 9,34
Less Than 45 Micron Size/ 5lb/bbl Concentration
YP(lb/100ft2) PV(lbsec/100ft2) PV(cp) AVERAGE STDDEV
9,59 0,01 7,02 31,99 14,90
Table 5 15 lb/bbl Concentration Data
SR (1/s) SS (lb/100ft2) SSc (lb/100ft2) γγγγ(1/s) ττττm (lb/100ft2) ττττc (lb/100ft2) %Error
1022,22 39,44 26,24 1022,22 39,44 26,24 33,46
511,11 29,85 18,45 511,11 29,85 18,45 38,18
340,66 25,58 15,85 340,66 25,58 15,85 38,03
170,33 21,32 13,26 170,33 21,32 13,26 37,82
10,22 12,79 10,82 10,22 12,79 10,82 15,45
5,11 11,73 10,74 5,11 11,73 10,74 8,43
Less Than 45 Micron Size/ 15lb/bbl Concentration
YP(lb/100ft2) PV(lbsec/100ft2) PV(cp) AVERAGE STDDEV
10,66 0,02 7,79 28,56 13,19
Table 6 30 lb/bbl Concentration Data
SR (1/s) SS (lb/100ft2) SSc (lb/100ft2) γγγγ(1/s) ττττm (lb/100ft2) ττττc (lb/100ft2) %Error
1022,22 40,51 28,79 1022,22 40,51 28,79 28,93
511,11 29,85 20,26 511,11 29,85 20,26 32,13
340,66 26,65 17,41 340,66 26,65 17,41 34,66
170,33 22,39 14,57 170,33 22,39 14,57 34,92
10,22 13,86 11,90 10,22 13,86 11,90 14,15
5,11 12,79 11,81 5,11 12,79 11,81 7,67
Less Than 45 Micron Size/ 30lb/bbl Concentration
YP(lb/100ft2) PV(lbsec/100ft2) PV(cp) AVERAGE STDDEV
11,73 0,02 8,53 25,41 11,62
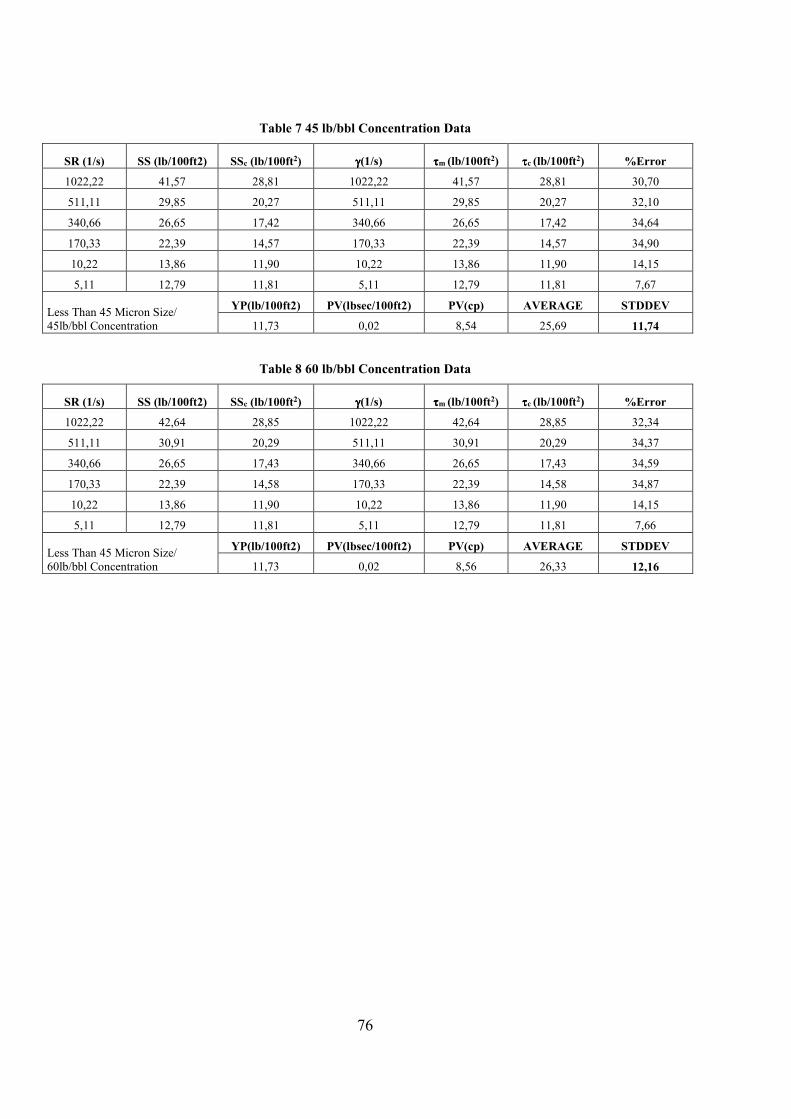
76
Table 7 45 lb/bbl Concentration Data
SR (1/s) SS (lb/100ft2) SSc (lb/100ft2) γγγγ(1/s) ττττm (lb/100ft2) ττττc (lb/100ft2) %Error
1022,22 41,57 28,81 1022,22 41,57 28,81 30,70
511,11 29,85 20,27 511,11 29,85 20,27 32,10
340,66 26,65 17,42 340,66 26,65 17,42 34,64
170,33 22,39 14,57 170,33 22,39 14,57 34,90
10,22 13,86 11,90 10,22 13,86 11,90 14,15
5,11 12,79 11,81 5,11 12,79 11,81 7,67
Less Than 45 Micron Size/ 45lb/bbl Concentration
YP(lb/100ft2) PV(lbsec/100ft2) PV(cp) AVERAGE STDDEV
11,73 0,02 8,54 25,69 11,74
Table 8 60 lb/bbl Concentration Data
SR (1/s) SS (lb/100ft2) SSc (lb/100ft2) γγγγ(1/s) ττττm (lb/100ft2) ττττc (lb/100ft2) %Error
1022,22 42,64 28,85 1022,22 42,64 28,85 32,34
511,11 30,91 20,29 511,11 30,91 20,29 34,37
340,66 26,65 17,43 340,66 26,65 17,43 34,59
170,33 22,39 14,58 170,33 22,39 14,58 34,87
10,22 13,86 11,90 10,22 13,86 11,90 14,15
5,11 12,79 11,81 5,11 12,79 11,81 7,66
Less Than 45 Micron Size/ 60lb/bbl Concentration
YP(lb/100ft2) PV(lbsec/100ft2) PV(cp) AVERAGE STDDEV
11,73 0,02 8,56 26,33 12,16
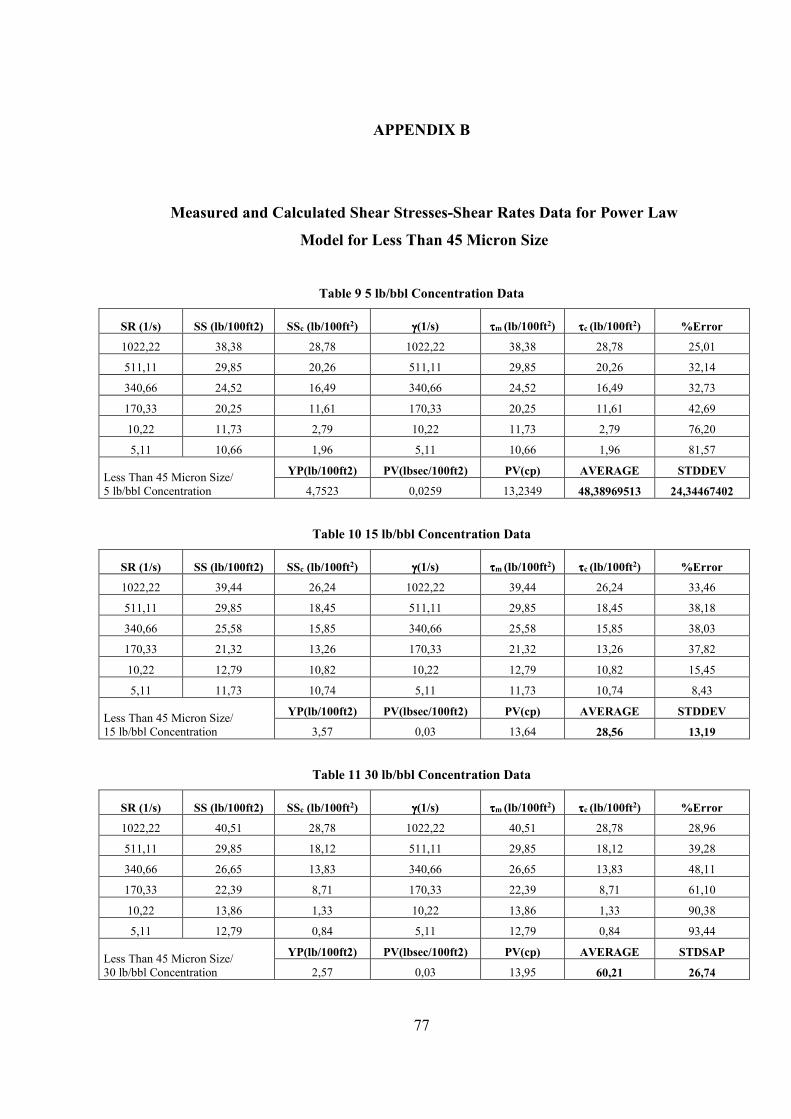
77
APPENDIX B
Measured and Calculated Shear Stresses-Shear Rates Data for Power Law
Model for Less Than 45 Micron Size
Table 9 5 lb/bbl Concentration Data
SR (1/s) SS (lb/100ft2) SSc (lb/100ft2) γγγγ(1/s) ττττm (lb/100ft2) ττττc (lb/100ft2) %Error
1022,22 38,38 28,78 1022,22 38,38 28,78 25,01
511,11 29,85 20,26 511,11 29,85 20,26 32,14
340,66 24,52 16,49 340,66 24,52 16,49 32,73
170,33 20,25 11,61 170,33 20,25 11,61 42,69
10,22 11,73 2,79 10,22 11,73 2,79 76,20
5,11 10,66 1,96 5,11 10,66 1,96 81,57
Less Than 45 Micron Size/ 5 lb/bbl Concentration
YP(lb/100ft2) PV(lbsec/100ft2) PV(cp) AVERAGE STDDEV
4,7523 0,0259 13,2349 48,38969513 24,34467402
Table 10 15 lb/bbl Concentration Data
SR (1/s) SS (lb/100ft2) SSc (lb/100ft2) γγγγ(1/s) ττττm (lb/100ft2) ττττc (lb/100ft2) %Error
1022,22 39,44 26,24 1022,22 39,44 26,24 33,46
511,11 29,85 18,45 511,11 29,85 18,45 38,18
340,66 25,58 15,85 340,66 25,58 15,85 38,03
170,33 21,32 13,26 170,33 21,32 13,26 37,82
10,22 12,79 10,82 10,22 12,79 10,82 15,45
5,11 11,73 10,74 5,11 11,73 10,74 8,43
Less Than 45 Micron Size/ 15 lb/bbl Concentration
YP(lb/100ft2) PV(lbsec/100ft2) PV(cp) AVERAGE STDDEV
3,57 0,03 13,64 28,56 13,19
Table 11 30 lb/bbl Concentration Data
SR (1/s) SS (lb/100ft2) SSc (lb/100ft2) γγγγ(1/s) ττττm (lb/100ft2) ττττc (lb/100ft2) %Error
1022,22 40,51 28,78 1022,22 40,51 28,78 28,96
511,11 29,85 18,12 511,11 29,85 18,12 39,28
340,66 26,65 13,83 340,66 26,65 13,83 48,11
170,33 22,39 8,71 170,33 22,39 8,71 61,10
10,22 13,86 1,33 10,22 13,86 1,33 90,38
5,11 12,79 0,84 5,11 12,79 0,84 93,44
Less Than 45 Micron Size/ 30 lb/bbl Concentration
YP(lb/100ft2) PV(lbsec/100ft2) PV(cp) AVERAGE STDSAP
2,57 0,03 13,95 60,21 26,74

78
Table 12 45 lb/bbl Concentration Data
SR (1/s) SS (lb/100ft2) SSc (lb/100ft2) γγγγ(1/s) ττττm (lb/100ft2) ττττc (lb/100ft2) %Error
1022,22 41,57 29,84 1022,22 41,57 29,84 28,21
511,11 29,85 18,12 511,11 29,85 18,12 39,28
340,66 26,65 13,54 340,66 26,65 13,54 49,21
170,33 22,39 8,22 170,33 22,39 8,22 63,28
10,22 13,86 1,09 10,22 13,86 1,09 92,16
5,11 12,79 0,66 5,11 12,79 0,66 94,84
Less Than 45 Micron Size/ 45 lb/bbl Concentration
YP(lb/100ft2) PV(lbsec/100ft2) PV(cp) AVERAGE STDDEV
2,11 0,03 14,61 61,16 27,60
Table 13 60 lb/bbl Concentration Data
SR (1/s) SS (lb/100ft2) SSc (lb/100ft2) γγγγ(1/s) ττττm (lb/100ft2) ττττc (lb/100ft2) %Error
1022,22 42,64 30,91 1022,22 42,64 30,91 27,51
511,11 30,91 19,19 511,11 30,91 19,19 37,92
340,66 26,65 14,52 340,66 26,65 14,52 45,52
170,33 22,39 9,01 170,33 22,39 9,01 59,73
10,22 13,86 1,30 10,22 13,86 1,30 90,60
5,11 12,79 0,81 5,11 12,79 0,81 93,68
Less Than 45 Micron Size/ 60 lb/bbl Concentration
YP(lb/100ft2) PV(lbsec/100ft2) PV(cp) AVERAGE STDDEV
2,52 0,03 15,02 59,16 27,64
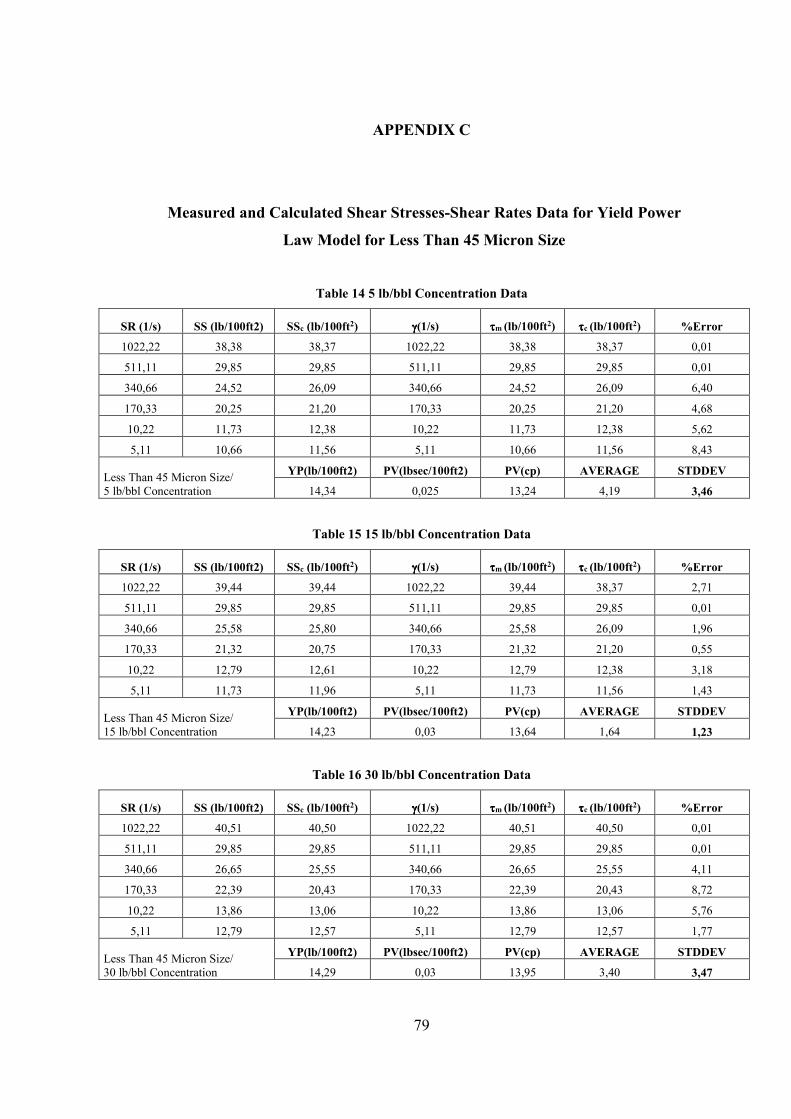
79
APPENDIX C
Measured and Calculated Shear Stresses-Shear Rates Data for Yield Power
Law Model for Less Than 45 Micron Size
Table 14 5 lb/bbl Concentration Data
SR (1/s) SS (lb/100ft2) SSc (lb/100ft2) γγγγ(1/s) ττττm (lb/100ft2) ττττc (lb/100ft2) %Error
1022,22 38,38 38,37 1022,22 38,38 38,37 0,01
511,11 29,85 29,85 511,11 29,85 29,85 0,01
340,66 24,52 26,09 340,66 24,52 26,09 6,40
170,33 20,25 21,20 170,33 20,25 21,20 4,68
10,22 11,73 12,38 10,22 11,73 12,38 5,62
5,11 10,66 11,56 5,11 10,66 11,56 8,43
Less Than 45 Micron Size/ 5 lb/bbl Concentration
YP(lb/100ft2) PV(lbsec/100ft2) PV(cp) AVERAGE STDDEV
14,34 0,025 13,24 4,19 3,46
Table 15 15 lb/bbl Concentration Data
SR (1/s) SS (lb/100ft2) SSc (lb/100ft2) γγγγ(1/s) ττττm (lb/100ft2) ττττc (lb/100ft2) %Error
1022,22 39,44 39,44 1022,22 39,44 38,37 2,71
511,11 29,85 29,85 511,11 29,85 29,85 0,01
340,66 25,58 25,80 340,66 25,58 26,09 1,96
170,33 21,32 20,75 170,33 21,32 21,20 0,55
10,22 12,79 12,61 10,22 12,79 12,38 3,18
5,11 11,73 11,96 5,11 11,73 11,56 1,43
Less Than 45 Micron Size/ 15 lb/bbl Concentration
YP(lb/100ft2) PV(lbsec/100ft2) PV(cp) AVERAGE STDDEV
14,23 0,03 13,64 1,64 1,23
Table 16 30 lb/bbl Concentration Data
SR (1/s) SS (lb/100ft2) SSc (lb/100ft2) γγγγ(1/s) ττττm (lb/100ft2) ττττc (lb/100ft2) %Error
1022,22 40,51 40,50 1022,22 40,51 40,50 0,01
511,11 29,85 29,85 511,11 29,85 29,85 0,01
340,66 26,65 25,55 340,66 26,65 25,55 4,11
170,33 22,39 20,43 170,33 22,39 20,43 8,72
10,22 13,86 13,06 10,22 13,86 13,06 5,76
5,11 12,79 12,57 5,11 12,79 12,57 1,77
Less Than 45 Micron Size/ 30 lb/bbl Concentration
YP(lb/100ft2) PV(lbsec/100ft2) PV(cp) AVERAGE STDDEV
14,29 0,03 13,95 3,40 3,47

80
Table 17 45 lb/bbl Concentration Data
SR (1/s) SS (lb/100ft2) SSc (lb/100ft2) γγγγ(1/s) ττττm (lb/100ft2) ττττc (lb/100ft2) %Error
1022,22 41,57 41,57 1022,22 41,57 41,57 0,01
511,11 29,85 29,85 511,11 29,85 29,85 0,01
340,66 26,65 25,26 340,66 26,65 25,26 5,21
170,33 22,39 19,95 170,33 22,39 19,95 10,90
10,22 13,86 12,81 10,22 13,86 12,81 7,55
5,11 12,79 12,39 5,11 12,79 12,39 3,18
Less Than 45 Micron Size/ 45 lb/bbl Concentration
YP(lb/100ft2) PV(lbsec/100ft2) PV(cp) AVERAGE STDDEV
14,29 0,03 13,95 4,47 4,31
Table 18 60 lb/bbl Concentration Data
SR (1/s) SS (lb/100ft2) SSc (lb/100ft2) γγγγ(1/s) ττττm (lb/100ft2) ττττc (lb/100ft2) %Error
1022,22 42,64 42,64 1022,22 42,64 42,64 0,01
511,11 30,91 30,92 511,11 30,91 30,92 0,01
340,66 26,65 26,24 340,66 26,65 26,24 1,52
170,33 22,39 20,74 170,33 22,39 20,74 7,35
10,22 13,86 13,03 10,22 13,86 13,03 5,99
5,11 12,79 12,53 5,11 12,79 12,53 2,01
Less Than 45 Micron Size/ 60 lb/bbl Concentration
YP(lb/100ft2) PV(lbsec/100ft2) PV(cp) AVERAGE STDDEV
14,25 0,03 15,02 2,81 3,12

81
APPENDIX D
Measured and Calculated Shear Stresses-Shear Rates Data for Bingham Plastic
Model for 75 to 45 Micron Size
Table 19 5 lb/bbl Concentration Data
SR (1/s) SS (lb/100ft2) SSc (lb/100ft2) γγγγ(1/s) ττττm (lb/100ft2) ττττc (lb/100ft2) %Error
1022,22 38,376 23,52 1022,22 38,38 23,52 38,72
511,11 28,782 16,56 511,11 28,78 16,56 42,48
340,66 23,452 14,23 340,66 23,45 14,23 39,31
170,33 20,254 11,91 170,33 20,25 11,91 41,18
10,22 11,726 9,73 10,22 11,73 9,73 16,99
5,11 10,66 9,66 5,11 10,66 9,66 9,35
75 to 45 Micron Size/ 5 lb/bbl Concentration
YP(lb/100Fft2) PV(lbsec/100ft2) PV(cp) AVERAGE STDDEV
9,59 0,014 6,95 31,34 14,34
Table 20 15 lb/bbl Concentration Data
SR (1/s) SS (lb/100ft2) SSc (lb/100ft2) γγγγ(1/s) ττττm (lb/100ft2) ττττc (lb/100ft2) %Error
1022,22 40,51 23,24 1022,22 40,51 23,24 42,64
511,11 29,85 16,42 511,11 29,85 16,42 45,00
340,66 25,58 14,14 340,66 25,58 14,14 44,73
170,33 21,32 11,87 170,33 21,32 11,87 44,34
10,22 11,73 9,73 10,22 11,73 9,73 17,02
5,11 10,66 9,66 5,11 10,66 9,66 9,36
75 to 45 Micron Size/ 15 lb/bbl Concentration
YP(lb/100Fft2) PV(lbsec/100ft2) PV(cp) AVERAGE STDDEV
9,594 0,013 6,796 33,847 16,205
Table 21 30 lb/bbl Concentration Data
SR (1/s) SS (lb/100ft2) SSc (lb/100ft2) γγγγ(1/s) ττττm (lb/100ft2) ττττc (lb/100ft2) %Error
1022,22 41,57 26,01 1022,22 41,57 26,01 37,43
511,11 29,85 18,34 511,11 29,85 18,34 38,57
340,66 26,65 15,78 340,66 26,65 15,78 40,80
170,33 21,32 13,22 170,33 21,32 13,22 38,00
10,22 12,79 10,81 10,22 12,79 10,81 15,47
5,11 11,73 10,74 5,11 11,73 10,74 8,44
75 to 45 Micron Size/ 30 lb/bbl Concentration
YP(lb/100Fft2) PV(lbsec/100ft2) PV(cp) AVERAGE STDDEV
10,660 0,015 7,665 29,783 14,037

82
Table 22 45 lb/bbl Concentration Data
SR (1/s) SS (lb/100ft2) SSc (lb/100ft2) γγγγ(1/s) ττττm (lb/100ft2) ττττc (lb/100ft2) %Error
1022,22 42,64 25,91 1022,22 42,64 25,91 39,25
511,11 29,85 18,28 511,11 29,85 18,28 38,75
340,66 26,65 15,74 340,66 26,65 15,74 40,94
170,33 21,32 13,20 170,33 21,32 13,20 38,08
10,22 12,79 10,81 10,22 12,79 10,81 15,48
5,11 11,73 10,74 5,11 11,73 10,74 8,44
75 to 45 Micron Size/ 45 lb/bbl Concentration
YP(lb/100Fft2) PV(lbsec/100ft2) PV(cp) AVERAGE STDDEV
10,660 0,015 7,614 30,155 14,301
Table 23 60 lb/bbl Concentration Data
SR (1/s) SS (lb/100ft2) SSc (lb/100ft2) γγγγ(1/s) ττττm (lb/100ft2) ττττc (lb/100ft2) %Error
1022,22 43,71 25,74 1022,22 43,71 25,74 41,10
511,11 30,91 18,20 511,11 30,91 18,20 41,12
340,66 27,72 15,69 340,66 27,72 15,69 43,40
170,33 22,39 13,17 170,33 22,39 13,17 41,15
10,22 12,79 10,81 10,22 12,79 10,81 15,49
5,11 11,73 10,74 5,11 11,73 10,74 8,45
75 to 45 Micron Size/ 60 lb/bbl Concentration
YP(lb/100Fft2) PV(lbsec/100ft2) PV(cp) AVERAGE STDDEV
10,660 0,015 7,563 31,785 15,536
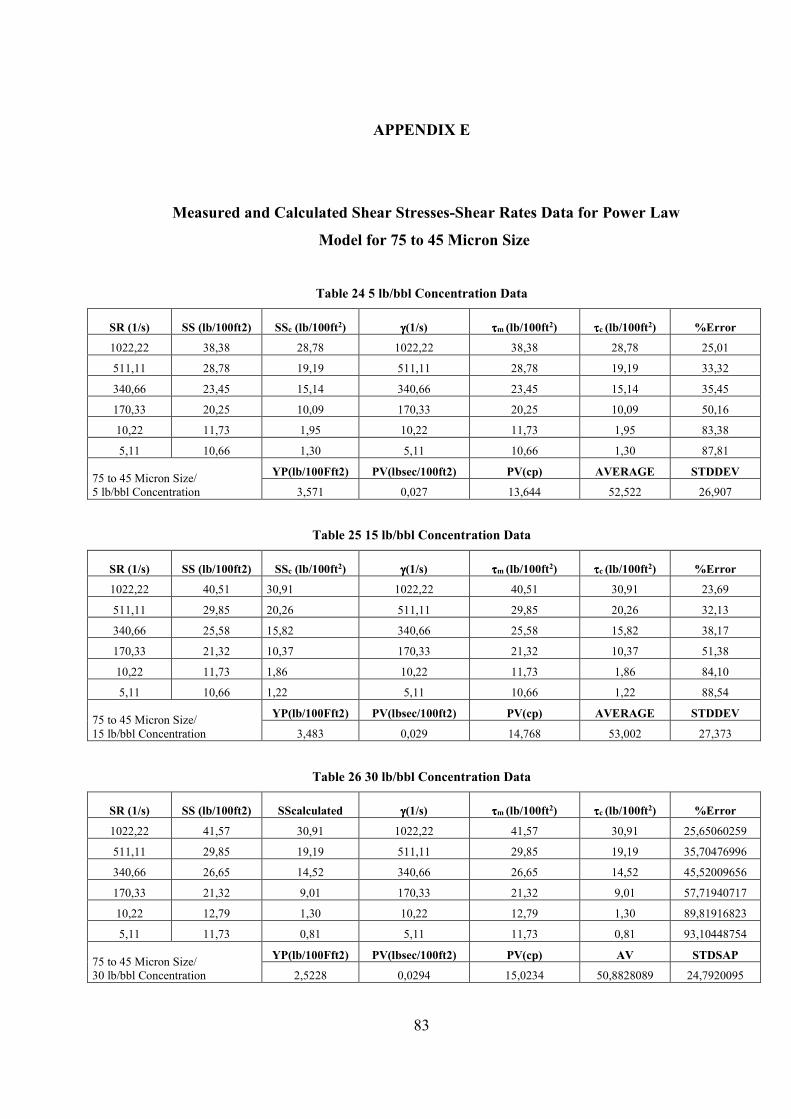
83
APPENDIX E
Measured and Calculated Shear Stresses-Shear Rates Data for Power Law
Model for 75 to 45 Micron Size
Table 24 5 lb/bbl Concentration Data
SR (1/s) SS (lb/100ft2) SSc (lb/100ft2) γγγγ(1/s) ττττm (lb/100ft2) ττττc (lb/100ft2) %Error
1022,22 38,38 28,78 1022,22 38,38 28,78 25,01
511,11 28,78 19,19 511,11 28,78 19,19 33,32
340,66 23,45 15,14 340,66 23,45 15,14 35,45
170,33 20,25 10,09 170,33 20,25 10,09 50,16
10,22 11,73 1,95 10,22 11,73 1,95 83,38
5,11 10,66 1,30 5,11 10,66 1,30 87,81
75 to 45 Micron Size/ 5 lb/bbl Concentration
YP(lb/100Fft2) PV(lbsec/100ft2) PV(cp) AVERAGE STDDEV
3,571 0,027 13,644 52,522 26,907
Table 25 15 lb/bbl Concentration Data
SR (1/s) SS (lb/100ft2) SSc (lb/100ft2) γγγγ(1/s) ττττm (lb/100ft2) ττττc (lb/100ft2) %Error
1022,22 40,51 30,91 1022,22 40,51 30,91 23,69
511,11 29,85 20,26 511,11 29,85 20,26 32,13
340,66 25,58 15,82 340,66 25,58 15,82 38,17
170,33 21,32 10,37 170,33 21,32 10,37 51,38
10,22 11,73 1,86 10,22 11,73 1,86 84,10
5,11 10,66 1,22 5,11 10,66 1,22 88,54
75 to 45 Micron Size/ 15 lb/bbl Concentration
YP(lb/100Fft2) PV(lbsec/100ft2) PV(cp) AVERAGE STDDEV
3,483 0,029 14,768 53,002 27,373
Table 26 30 lb/bbl Concentration Data
SR (1/s) SS (lb/100ft2) SScalculated γγγγ(1/s) ττττm (lb/100ft2) ττττc (lb/100ft2) %Error
1022,22 41,57 30,91 1022,22 41,57 30,91 25,65060259
511,11 29,85 19,19 511,11 29,85 19,19 35,70476996
340,66 26,65 14,52 340,66 26,65 14,52 45,52009656
170,33 21,32 9,01 170,33 21,32 9,01 57,71940717
10,22 12,79 1,30 10,22 12,79 1,30 89,81916823
5,11 11,73 0,81 5,11 11,73 0,81 93,10448754
75 to 45 Micron Size/ 30 lb/bbl Concentration
YP(lb/100Fft2) PV(lbsec/100ft2) PV(cp) AV STDSAP
2,5228 0,0294 15,0234 50,8828089 24,7920095

84
Table 27 45 lb/bbl Concentration Data
SR (1/s) SS (lb/100ft2) SSc (lb/100ft2) γγγγ(1/s) ττττm (lb/100ft2) ττττc (lb/100ft2) %Error
1022,22 42,64 31,98 1022,22 42,64 31,98 25,01
511,11 29,85 19,19 511,11 29,85 19,19 35,70
340,66 26,65 14,23 340,66 26,65 14,23 46,59
170,33 21,32 8,54 170,33 21,32 8,54 59,93
10,22 12,79 1,08 10,22 12,79 1,08 91,59
5,11 11,73 0,65 5,11 11,73 0,65 94,49
75 to 45 Micron Size/ 45 lb/bbl Concentration
YP(lb/100Fft2) PV(lbsec/100ft2) PV(cp) AVERAGE STDDEV
2,078 0,031 15,688 58,887 28,896
Table 28 60 lb/bbl Concentration Data
SR (1/s) SS (lb/100ft2) SSc (lb/100ft2) γγγγ(1/s) ττττm (lb/100ft2) ττττc (lb/100ft2) %Error
1022,22 43,71 33,04 1022,22 43,71 33,04 24,40
511,11 30,91 20,26 511,11 30,91 20,26 34,47
340,66 27,72 15,21 340,66 27,72 15,21 45,11
170,33 22,39 9,33 170,33 22,39 9,33 58,34
10,22 12,79 1,28 10,22 12,79 1,28 89,99
5,11 11,73 0,78 5,11 11,73 0,78 93,31
75 to 45 Micron Size/ 60 lb/bbl Concentration
YP(lb/100Fft2) PV(lbsec/100ft2) PV(cp) AVERAGE STDDEV
2,485 0,032 16,148 57,603 28,698
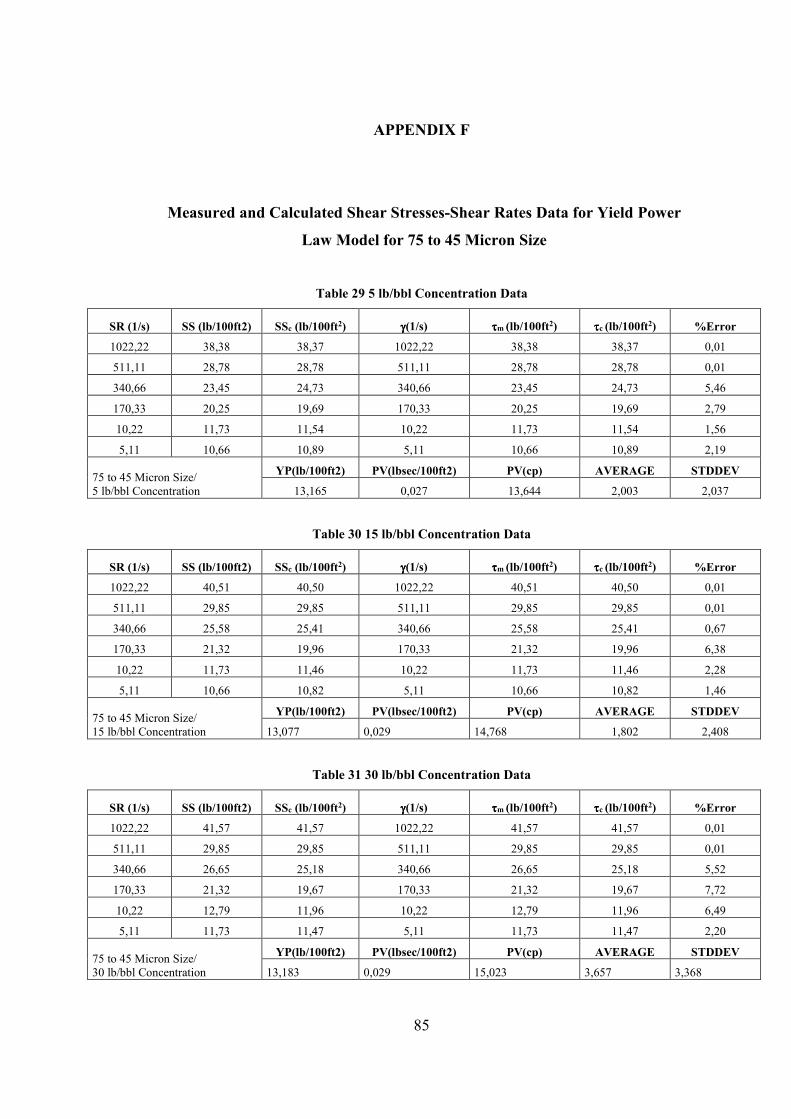
85
APPENDIX F
Measured and Calculated Shear Stresses-Shear Rates Data for Yield Power
Law Model for 75 to 45 Micron Size
Table 29 5 lb/bbl Concentration Data
SR (1/s) SS (lb/100ft2) SSc (lb/100ft2) γγγγ(1/s) ττττm (lb/100ft2) ττττc (lb/100ft2) %Error
1022,22 38,38 38,37 1022,22 38,38 38,37 0,01
511,11 28,78 28,78 511,11 28,78 28,78 0,01
340,66 23,45 24,73 340,66 23,45 24,73 5,46
170,33 20,25 19,69 170,33 20,25 19,69 2,79
10,22 11,73 11,54 10,22 11,73 11,54 1,56
5,11 10,66 10,89 5,11 10,66 10,89 2,19
75 to 45 Micron Size/ 5 lb/bbl Concentration
YP(lb/100ft2) PV(lbsec/100ft2) PV(cp) AVERAGE STDDEV
13,165 0,027 13,644 2,003 2,037
Table 30 15 lb/bbl Concentration Data
SR (1/s) SS (lb/100ft2) SSc (lb/100ft2) γγγγ(1/s) ττττm (lb/100ft2) ττττc (lb/100ft2) %Error
1022,22 40,51 40,50 1022,22 40,51 40,50 0,01
511,11 29,85 29,85 511,11 29,85 29,85 0,01
340,66 25,58 25,41 340,66 25,58 25,41 0,67
170,33 21,32 19,96 170,33 21,32 19,96 6,38
10,22 11,73 11,46 10,22 11,73 11,46 2,28
5,11 10,66 10,82 5,11 10,66 10,82 1,46
75 to 45 Micron Size/ 15 lb/bbl Concentration
YP(lb/100ft2) PV(lbsec/100ft2) PV(cp) AVERAGE STDDEV
13,077 0,029 14,768 1,802 2,408
Table 31 30 lb/bbl Concentration Data
SR (1/s) SS (lb/100ft2) SSc (lb/100ft2) γγγγ(1/s) ττττm (lb/100ft2) ττττc (lb/100ft2) %Error
1022,22 41,57 41,57 1022,22 41,57 41,57 0,01
511,11 29,85 29,85 511,11 29,85 29,85 0,01
340,66 26,65 25,18 340,66 26,65 25,18 5,52
170,33 21,32 19,67 170,33 21,32 19,67 7,72
10,22 12,79 11,96 10,22 12,79 11,96 6,49
5,11 11,73 11,47 5,11 11,73 11,47 2,20
75 to 45 Micron Size/ 30 lb/bbl Concentration
YP(lb/100ft2) PV(lbsec/100ft2) PV(cp) AVERAGE STDDEV
13,183 0,029 15,023 3,657 3,368

86
Table 32 45 lb/bbl Concentration Data
SR (1/s) SS (lb/100ft2) SSc (lb/100ft2) γγγγ(1/s) ττττm (lb/100ft2) ττττc (lb/100ft2) %Error
1022,22 42,64 42,64 1022,22 42,64 42,64 0,01
511,11 29,85 29,85 511,11 29,85 29,85 0,01
340,66 26,65 24,89 340,66 26,65 24,89 6,59
170,33 21,32 19,20 170,33 21,32 19,20 9,93
10,22 12,79 11,74 10,22 12,79 11,74 8,26
5,11 11,73 11,31 5,11 11,73 11,31 3,59
75 to 45 Micron Size/ 45 lb/bbl Concentration
YP(lb/100ft2) PV(lbsec/100ft2) PV(cp) AVERAGE STDDEV
12,738 0,031 15,688 4,731 4,214
Table 33 60 lb/bbl Concentration Data
SR (1/s) SS (lb/100ft2) SSc (lb/100ft2) γγγγ(1/s) ττττm (lb/100ft2) ττττc (lb/100ft2) %Error
1022,22 43,71 43,70 1022,22 43,71 43,70 0,01
511,11 30,91 30,92 511,11 30,91 30,92 0,01
340,66 27,72 25,87 340,66 27,72 25,87 6,65
170,33 22,39 19,99 170,33 22,39 19,99 10,72
10,22 12,79 11,94 10,22 12,79 11,94 6,66
5,11 11,73 11,44 5,11 11,73 11,44 2,40
75 to 45 Micron Size/ 60 lb/bbl Concentration
YP(lb/100ft2) PV(lbsec/100ft2) PV(cp) AVERAGE STDDEV
13,145 0,032 16,148 4,407 4,304

87
APPENDIX G
Measured and Calculated Shear Stresses-Shear Rates Data for Bingham Plastic
Model for 250 to 75 Micron Size
Table 34 5 lb/bbl Concentration Data
SR (1/s) SS (lb/100ft2) SSc (lb/100ft2) γγγγ(1/s) ττττm (lb/100ft2) ττττc (lb/100ft2) %Error
1022,22 39,44 23,38 1022,22 39,44 23,38 40,71
511,11 28,78 16,49 511,11 28,78 16,49 42,71
340,66 24,52 14,19 340,66 24,52 14,19 42,12
170,33 20,25 11,89 170,33 20,25 11,89 41,29
10,22 11,73 9,73 10,22 11,73 9,73 17,01
5,11 10,66 9,66 5,11 10,66 9,66 9,35
250 to 75 Micron Size/ 5 lb/bbl Concentration
YP(lb/100ft2) PV(lbsec/100ft2) PV(cp) AVERAGE STDDEV
9,594 0,014 6,899 32,198 14,945
Table 35 15 lb/bbl Concentration Data
SR (1/s) SS (lb/100ft2) SSc (lb/100ft2) γγγγ(1/s) ττττm (lb/100ft2) ττττc (lb/100ft2) %Error
1022,22 41,57 24,98 1022,22 41,57 24,98 39,91
511,11 29,85 17,29 511,11 29,85 17,29 42,08
340,66 25,58 14,72 340,66 25,58 14,72 42,45
170,33 21,32 12,16 170,33 21,32 12,16 42,97
10,22 12,79 9,75 10,22 12,79 9,75 23,80
5,11 11,73 9,67 5,11 11,73 9,67 17,53
250 to 75 Micron Size/ 15 lb/bbl Concentration
YP(lb/100ft2) PV(lbsec/100ft2) PV(cp) AVERAGE STDDEV
9,594 0,015 7,716 34,789 11,170
Table 36 30 lb/bbl Concentration Data
SR (1/s) SS (lb/100ft2) SSc (lb/100ft2) γγγγ(1/s) ττττm (lb/100ft2) ττττc (lb/100ft2) %Error
1022,22 43,71 27,62 1022,22 43,71 27,62 36,80
511,11 30,91 19,14 511,11 30,91 19,14 38,08
340,66 27,72 16,31 340,66 27,72 16,31 41,14
170,33 22,39 13,49 170,33 22,39 13,49 39,75
10,22 13,86 10,83 10,22 13,86 10,83 21,85
5,11 12,79 10,74 5,11 12,79 10,74 16,00
250 to 75 Micron Size/ 30 lb/bbl Concentration
YP(lb/100ft2) PV(lbsec/100ft2) PV(cp) AVERAGE STDDEV
10,660 0,017 8,483 32,272 10,603
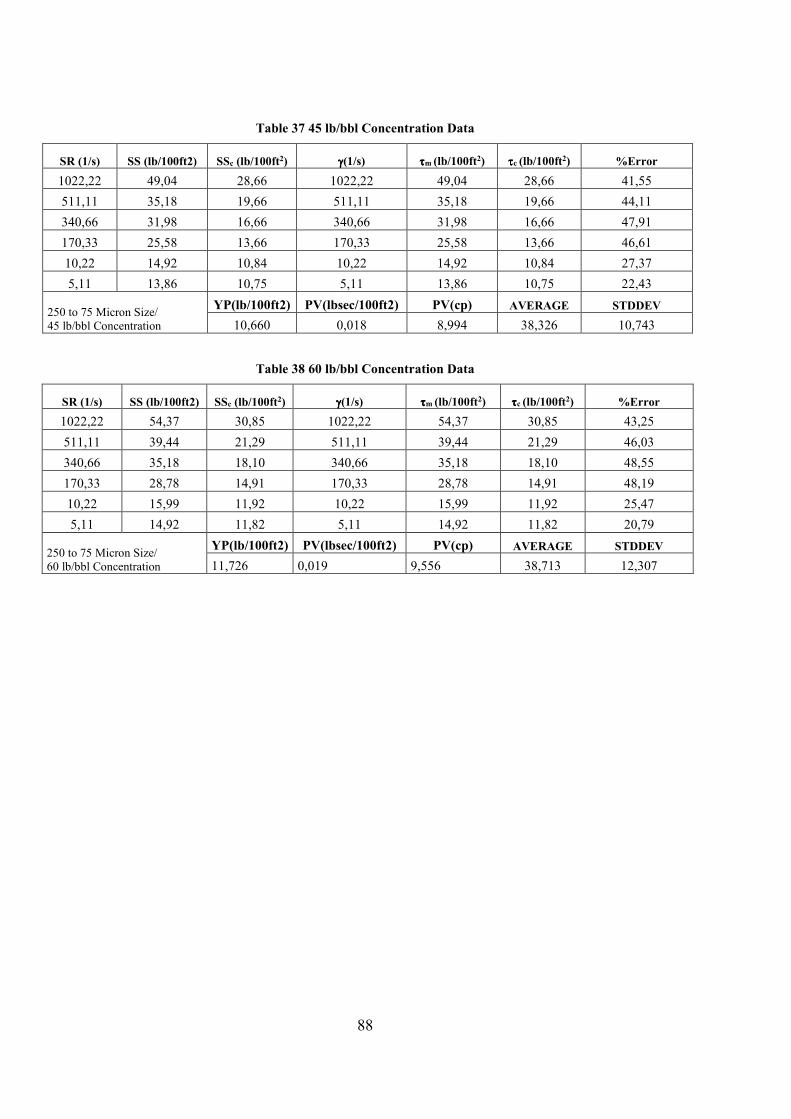
88
Table 37 45 lb/bbl Concentration Data
SR (1/s) SS (lb/100ft2) SSc (lb/100ft2) γγγγ(1/s) ττττm (lb/100ft2) ττττc (lb/100ft2) %Error
1022,22 49,04 28,66 1022,22 49,04 28,66 41,55
511,11 35,18 19,66 511,11 35,18 19,66 44,11
340,66 31,98 16,66 340,66 31,98 16,66 47,91
170,33 25,58 13,66 170,33 25,58 13,66 46,61
10,22 14,92 10,84 10,22 14,92 10,84 27,37
5,11 13,86 10,75 5,11 13,86 10,75 22,43
250 to 75 Micron Size/ 45 lb/bbl Concentration
YP(lb/100ft2) PV(lbsec/100ft2) PV(cp) AVERAGE STDDEV
10,660 0,018 8,994 38,326 10,743
Table 38 60 lb/bbl Concentration Data
SR (1/s) SS (lb/100ft2) SSc (lb/100ft2) γγγγ(1/s) ττττm (lb/100ft2) ττττc (lb/100ft2) %Error
1022,22 54,37 30,85 1022,22 54,37 30,85 43,25
511,11 39,44 21,29 511,11 39,44 21,29 46,03
340,66 35,18 18,10 340,66 35,18 18,10 48,55
170,33 28,78 14,91 170,33 28,78 14,91 48,19
10,22 15,99 11,92 10,22 15,99 11,92 25,47
5,11 14,92 11,82 5,11 14,92 11,82 20,79
250 to 75 Micron Size/ 60 lb/bbl Concentration
YP(lb/100ft2) PV(lbsec/100ft2) PV(cp) AVERAGE STDDEV
11,726 0,019 9,556 38,713 12,307
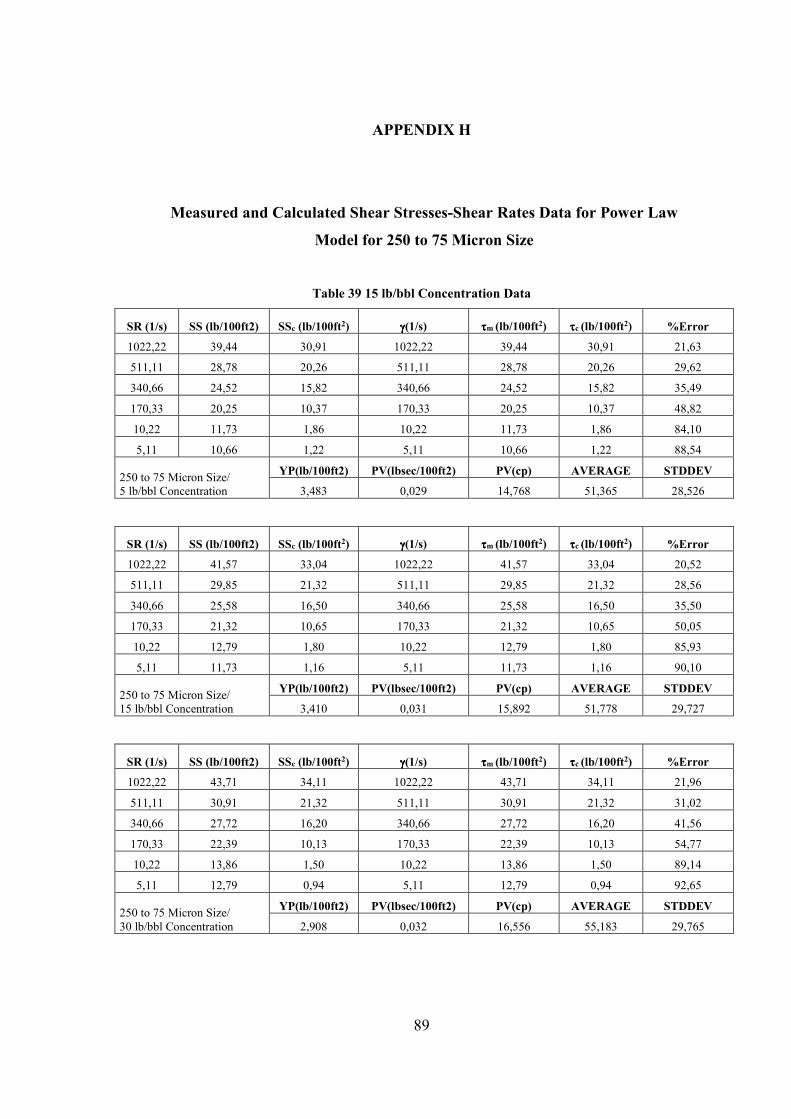
89
APPENDIX H
Measured and Calculated Shear Stresses-Shear Rates Data for Power Law
Model for 250 to 75 Micron Size
Table 39 15 lb/bbl Concentration Data
SR (1/s) SS (lb/100ft2) SSc (lb/100ft2) γγγγ(1/s) ττττm (lb/100ft2) ττττc (lb/100ft2) %Error
1022,22 39,44 30,91 1022,22 39,44 30,91 21,63
511,11 28,78 20,26 511,11 28,78 20,26 29,62
340,66 24,52 15,82 340,66 24,52 15,82 35,49
170,33 20,25 10,37 170,33 20,25 10,37 48,82
10,22 11,73 1,86 10,22 11,73 1,86 84,10
5,11 10,66 1,22 5,11 10,66 1,22 88,54
250 to 75 Micron Size/ 5 lb/bbl Concentration
YP(lb/100ft2) PV(lbsec/100ft2) PV(cp) AVERAGE STDDEV
3,483 0,029 14,768 51,365 28,526
SR (1/s) SS (lb/100ft2) SSc (lb/100ft2) γγγγ(1/s) ττττm (lb/100ft2) ττττc (lb/100ft2) %Error
1022,22 41,57 33,04 1022,22 41,57 33,04 20,52
511,11 29,85 21,32 511,11 29,85 21,32 28,56
340,66 25,58 16,50 340,66 25,58 16,50 35,50
170,33 21,32 10,65 170,33 21,32 10,65 50,05
10,22 12,79 1,80 10,22 12,79 1,80 85,93
5,11 11,73 1,16 5,11 11,73 1,16 90,10
250 to 75 Micron Size/ 15 lb/bbl Concentration
YP(lb/100ft2) PV(lbsec/100ft2) PV(cp) AVERAGE STDDEV
3,410 0,031 15,892 51,778 29,727
SR (1/s) SS (lb/100ft2) SSc (lb/100ft2) γγγγ(1/s) ττττm (lb/100ft2) ττττc (lb/100ft2) %Error
1022,22 43,71 34,11 1022,22 43,71 34,11 21,96
511,11 30,91 21,32 511,11 30,91 21,32 31,02
340,66 27,72 16,20 340,66 27,72 16,20 41,56
170,33 22,39 10,13 170,33 22,39 10,13 54,77
10,22 13,86 1,50 10,22 13,86 1,50 89,14
5,11 12,79 0,94 5,11 12,79 0,94 92,65
250 to 75 Micron Size/ 30 lb/bbl Concentration
YP(lb/100ft2) PV(lbsec/100ft2) PV(cp) AVERAGE STDDEV
2,908 0,032 16,556 55,183 29,765

90
SR (1/s) SS (lb/100ft2) SSc (lb/100ft2) γγγγ(1/s) ττττm (lb/100ft2) ττττc (lb/100ft2) %Error
1022,220 49,036 36,239 1022,220 49,036 36,239 26,097
511,110 35,178 22,389 511,110 35,178 22,389 36,354
340,660 31,980 16,890 340,660 31,980 16,890 47,185
170,330 25,584 10,435 170,330 25,584 10,435 59,213
10,220 14,924 1,478 10,220 14,924 1,478 90,097
5,110 13,858 0,913 5,110 13,858 0,913 93,411
250 to 75 Micron Size/ 45 lb/bbl Concentration
YP(lb/100ft2) PV(lbsec/100ft2) PV(cp) AVERAGE STDDEV
2,886 0,035 17,630 58,726 27,878
SR (1/s) SS (lb/100ft2) SSc (lb/100ft2) γγγγ(1/s) ττττm (lb/100ft2) ττττc (lb/100ft2) %Error
1022,220 54,366 37,305 1022,220 54,366 37,305 31,382
511,110 39,442 22,390 511,110 39,442 22,390 43,234
340,660 35,178 16,606 340,660 35,178 16,606 52,794
170,330 28,782 9,967 170,330 28,782 9,967 65,372
10,220 15,990 1,255 10,220 15,990 1,255 92,152
5,110 14,924 0,753 5,110 14,924 0,753 94,953
250 to 75 Micron Size/ 60 lb/bbl Concentration
YP(lb/100ft2) PV(lbsec/100ft2) PV(cp) AVERAGE STDDEV
2,424 0,036 18,294 63,314 25,963

91
APPENDIX I
Measured and Calculated Shear Stresses-Shear Rates Data for Yield Power
Law Model for 250 to 75 Micron Size
Table 40 5 lb/bbl Concentration Data
SR (1/s) SS (lb/100ft2) SSc (lb/100ft2) γγγγ ( ( ( (1/s) ττττm (lb/100ft2) ττττc (lb/100ft2) %Error
1022,22 40,51 40,50 1022,22 40,51 40,50 0,01
511,11 29,85 29,85 511,11 29,85 29,85 0,01
340,66 25,58 25,41 340,66 25,58 25,41 0,67
170,33 20,25 19,96 170,33 20,25 19,96 1,45
10,22 11,73 11,46 10,22 11,73 11,46 2,28
5,11 10,66 10,82 5,11 10,66 10,82 1,46
250 to 75 Micron Size/ 5 lb/bbl Concentration
YP(lb/100ft2) PV(lbsec/100ft2) PV(cp) AVERAGE STDDEV
13,077 0,029 14,768 0,981 0,908
Table 41 15 lb/bbl Concentration Data
SR (1/s) SS (lb/100ft2) SSc (lb/100ft2) γγγγ (1/ (1/ (1/ (1/s) ττττm (lb/100ft2) ττττc (lb/100ft2) %Error
1022,22 42,64 42,64 1022,22 42,64 42,64 0,01
511,11 30,91 30,92 511,11 30,91 30,92 0,01
340,66 26,65 26,09 340,66 26,65 26,09 2,08
170,33 21,32 20,24 170,33 21,32 20,24 5,05
10,22 11,73 11,39 10,22 11,73 11,39 2,83
5,11 10,66 10,76 5,11 10,66 10,76 0,90
250 to 75 Micron Size/ 15 lb/bbl Concentration
YP(lb/100ft2) PV(lbsec/100ft2) PV(cp) AVERAGE STDDEV
13,003 0,031 15,892 1,814 1,948
Table 42 30 lb/bbl Concentration Data
SR (1/s) SS (lb/100ft2) SSc (lb/100ft2) γγγγ (1/ (1/ (1/ (1/s) ττττm (lb/100ft2) ττττc (lb/100ft2) %Error
1022,220 44,772 44,768 1022,220 44,772 44,768 0,010
511,110 31,980 31,983 511,110 31,980 31,983 0,010
340,660 26,650 26,858 340,660 26,650 26,858 0,779
170,330 21,320 20,786 170,330 21,320 20,786 2,504
10,220 12,792 12,165 10,220 12,792 12,165 4,904
5,110 11,726 11,601 5,110 11,726 11,601 1,069
250 to 75 Micron Size/ 30 lb/bbl Concentration
YP(lb/100ft2) PV(lbsec/100ft2) PV(cp) AVERAGE STDDEV
13,568 0,032 16,556 1,546 1,883
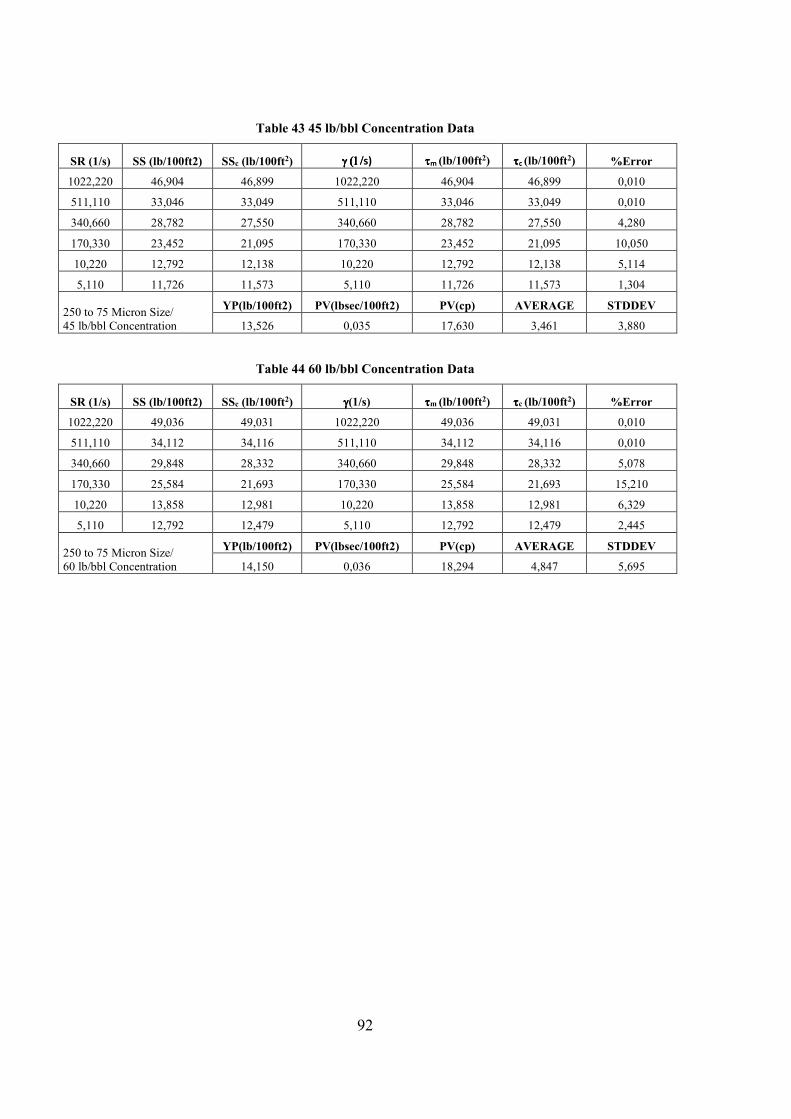
92
Table 43 45 lb/bbl Concentration Data
SR (1/s) SS (lb/100ft2) SSc (lb/100ft2) γγγγ (1/ (1/ (1/ (1/s) ττττm (lb/100ft2) ττττc (lb/100ft2) %Error
1022,220 46,904 46,899 1022,220 46,904 46,899 0,010
511,110 33,046 33,049 511,110 33,046 33,049 0,010
340,660 28,782 27,550 340,660 28,782 27,550 4,280
170,330 23,452 21,095 170,330 23,452 21,095 10,050
10,220 12,792 12,138 10,220 12,792 12,138 5,114
5,110 11,726 11,573 5,110 11,726 11,573 1,304
250 to 75 Micron Size/ 45 lb/bbl Concentration
YP(lb/100ft2) PV(lbsec/100ft2) PV(cp) AVERAGE STDDEV
13,526 0,035 17,630 3,461 3,880
Table 44 60 lb/bbl Concentration Data
SR (1/s) SS (lb/100ft2) SSc (lb/100ft2) γγγγ(1/s) ττττm (lb/100ft2) ττττc (lb/100ft2) %Error
1022,220 49,036 49,031 1022,220 49,036 49,031 0,010
511,110 34,112 34,116 511,110 34,112 34,116 0,010
340,660 29,848 28,332 340,660 29,848 28,332 5,078
170,330 25,584 21,693 170,330 25,584 21,693 15,210
10,220 13,858 12,981 10,220 13,858 12,981 6,329
5,110 12,792 12,479 5,110 12,792 12,479 2,445
250 to 75 Micron Size/ 60 lb/bbl Concentration
YP(lb/100ft2) PV(lbsec/100ft2) PV(cp) AVERAGE STDDEV
14,150 0,036 18,294 4,847 5,695

93
APPENDIX J
Rheological Properties as a Function of CaCO3 Concentration and Particle Size
Table 45 Effect of CaCO3 Concentration and Size on PV and YP
CONCENTRATION
Size PV YP
0 <45 µm
8 24
5 <45 µm
8 20
15 <45 µm
9 19
30 <45 µm
10 18
45 <45 µm
11 17
60 <45 µm
11 18
CONCENTRATION
Size PV YP
0 75-45 µm
8 24
5 75-45 µm
9 18
15 75-45 µm
10 18
30 75-45 µm
11 17
45 75-45 µm
12 16
60 75-45 µm
12 17 CONCENTRATION
Size
PV YP
0 250-75µm
8 24
5 250-75µm
10 18
15 250-75µm
11 18
30 250-75µm
12 18
45 250-75µm
13 18
60 250-75µm 14 18

94
Table 46 . Effect of CaCO3 Concentration and Size on na and Ka
CONCENTRATION Size na Ka
0 <45 µm 0,2278 6,2040
5 <45 µm 0,1831 7,4153
15 <45 µm 0,1706 8,3258
30 <45 µm 0,1597 9,2459
45 <45 µm 0,1597 9,2459
60 <45 µm 0,1597 9,2459
CONCENTRATION Size na Ka
0 75-45 µm 0,2278 6,2040
5 75-45 µm 0,1831 7,4153
15 75-45 µm 0,1978 7,2402
30 75-45 µm 0,1706 8,3258
45 75-45 µm 0,1706 8,3258
60 75-45 µm 0,1845 8,1387
CONCENTRATION Size na Ka
0 250-75 µm 0,2278 6,2040
5 250-75 µm 0,1831 7,4153
15 250-75 µm 0,1706 8,3258
30 250-75 µm 0,1597 9,2459
45 250-75 µm 0,1597 9,2459
60 250-75 µm 0,1597 9,2459

95
Table 47 Effect of CaCO3 Concentration and Size on np and Kp
CONCENTRATION Size np Kp
0 <45 µm 0,3217 4,3027
5 <45 µm 0,3624 2,9224
15 <45 µm 0,4019 2,2842
30 <45 µm 0,4403 1,7972
45 <45 µm 0,4403 1,7972
60 <45 µm 0,4637 1,6090
CONCENTRATION Size np Kp
0 75-45 µm 0,3217 4,3027
5 75-45 µm 0,4148 2,0320
15 75-45 µm 0,4403 1,7972
30 75-45 µm 0,4778 1,4228
45 75-45 µm 0,5143 1,1331
60 75-45 µm 0,4993 1,2886
CONCENTRATION Size np Kp
0 250-75 µm 0,3217 4,3027
5 250-75 µm 0,3624 2,9224
15 250-75 µm 0,4019 2,2842
30 250-75 µm 0,4403 1,7972
45 250-75 µm 0,4403 1,7972
60 250-75 µm 0,4637 1,6090
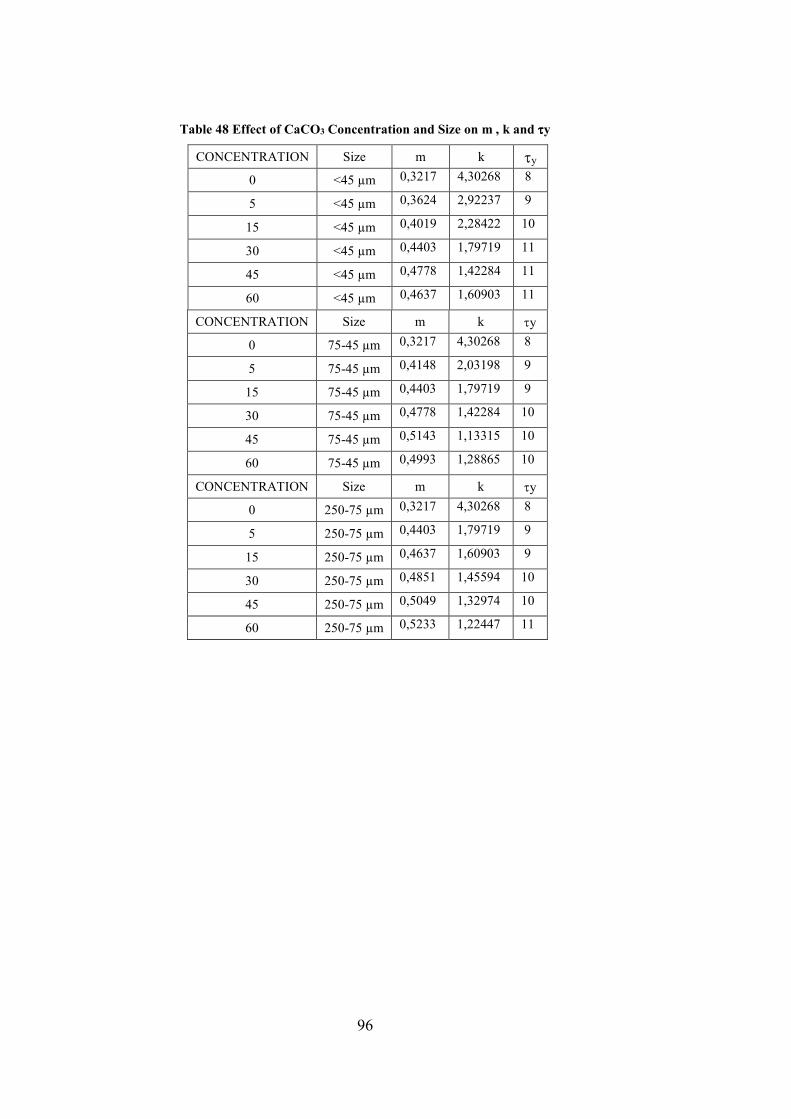
96
Table 48 Effect of CaCO3 Concentration and Size on m , k and ττττy
CONCENTRATION Size m k τy
0 <45 µm 0,3217 4,30268 8
5 <45 µm 0,3624 2,92237 9
15 <45 µm 0,4019 2,28422 10
30 <45 µm 0,4403 1,79719 11
45 <45 µm 0,4778 1,42284 11
60 <45 µm 0,4637 1,60903 11
CONCENTRATION Size m k τy
0 75-45 µm 0,3217 4,30268 8
5 75-45 µm 0,4148 2,03198 9
15 75-45 µm 0,4403 1,79719 9
30 75-45 µm 0,4778 1,42284 10
45 75-45 µm 0,5143 1,13315 10
60 75-45 µm 0,4993 1,28865 10
CONCENTRATION Size m k τy
0 250-75 µm 0,3217 4,30268 8
5 250-75 µm 0,4403 1,79719 9
15 250-75 µm 0,4637 1,60903 9
30 250-75 µm 0,4851 1,45594 10
45 250-75 µm 0,5049 1,32974 10
60 250-75 µm 0,5233 1,22447 11

97
APPENDIX K
Fluid Loss Data As a Function of Concentration and Particle Size of CaCO3
Table 49 Fluid Loss Data of Concentrations- and Particle Size of CaCO3
CONCENTRATION Size FL (cc/30 min.)
0 <45 µm 25,0
5 <45 µm 8,7
15 <45 µm 7,0
30 <45 µm 5,7
45 <45 µm 4,8
60 <45 µm 4,3
0 75-45 µm 25,0
5 75-45 µm 7,3
15 75-45 µm 7,0
30 75-45 µm 5,2
45 75-45 µm 5,0
60 75-45 µm 4,1
0 250-75µm 25,0
5 250-75µm 8,0
15 250-75µm 7,5
30 250-75µm 5,0
45 250-75µm 3,5
60 250-75µm 2,0


![PARTICLE SIZE, PARTICLE SIZE DISTRIBUTION & COMPACTION AND COMPRESSION [PREFORMULATION STUDY] (1-32)](https://static.fdocuments.in/doc/165x107/56649e855503460f94b87eac/particle-size-particle-size-distribution-compaction-and-compression-preformulation.jpg)