An Experimental Investigation on the Flow Separation on a ...huhui/paper/2007/AIAA-2007-0275.pdf ·...
11
45th AIAA Aerospace Sciences Meeting and Exhibit Jan 8 – 11, 2007, Reno, Nevada AIAA-2007-0275 American Institute of Aeronautics and Astronautics 1 An Experimental Investigation on the Flow Separation on a Low-Reynolds-Number Airfoil Zifeng Yang 1 , Fred L. Haan 2 , Hu Hui 3 ( ) Iowa State University, Ames, Iowa, 50011 and Hongwei Ma 4 Beijing University of Aeronautics and Astronautics, Beijing 100083, P. R. China An experimental investigation was conducted to study the transient behavior of the flow separation on a NASA low-speed GA (W)-1 airfoil at the chord Reynolds numbers of 68,000. A high-resolution PIV system was used to make detailed flow field measurements in addition to the surface static pressure distribution mapping around the airfoil. The measurement results visualized clearly that a separation bubble would be generated on the airfoil upper surface if the adverse pressure gradient is adequate. The length of the separation bubble could be up to 20% of airfoil chord length and its height only about 1% of the cord length. The transient behavior of the flow separation on the airfoil, which includes the “taking-off” of the laminar boundary layer from the airfoil surface at the separation point, the generation of unsteady Kelvin-Helmholtz vortex in the separated boundary layer, the rapid transition of the separated laminar boundary layer to turbulent flow, the reattachment of the turbulent flow to the airfoil surface to form separation bubble, and the burst of the separation bubble to cause airfoil stall, were elucidated clearly and quantitatively from the detailed flow field measurements. Nomenclature AOA = angle of attack C = chord length of airfoils p C = pressure coefficient, ) 2 1 /( ) ( 2 ∞ ∞ − = U p p C p ρ D L C C , = lift coefficient and drag coefficient Re C = chord Reynolds number N = total number of the frames of instantaneous PIV measurements TKE = normalized turbulent kinetic energy, ) 5 . 0 /( ) ' ' ( 5 . 0 2 2 2 ∞ + = U v u TKE ρ ρ i i v u , = instantaneous velocity components in x, y directions V U , = mean velocity components in x, y directions, ∑ = = N i i N u U 1 / , ∑ = = N i i N v V 1 / ' , ' v u = turbulent velocity fluctuations, N U u u N i i / ) ( ' 1 2 ∑ = − = , ∑ = − = N i i V v v 1 2 ) ( ' ∞ U = wind tunnel operating velocity z ϖ = Spanwise voriticity, y u x v i i z ∂ ∂ − ∂ ∂ = ϖ 1 Graduate Student, Department of Aerospace Engineering. 2 Assistant Professor, Department of Aerospace Engineering, and AIAA Member. 3 Assistant Professor, Department of Aerospace Engineering, and AIAA Senior Member. Email: [email protected] 4 Professor, School of Jet Propulsion, and AIAA Member.
Transcript of An Experimental Investigation on the Flow Separation on a ...huhui/paper/2007/AIAA-2007-0275.pdf ·...

45th AIAA Aerospace Sciences Meeting and Exhibit Jan 8 – 11, 2007, Reno, Nevada AIAA-2007-0275
American Institute of Aeronautics and Astronautics
1
An Experimental Investigation on the Flow Separation on a Low-Reynolds-Number Airfoil
Zifeng Yang1, Fred L. Haan2, Hu Hui3( ) Iowa State University, Ames, Iowa, 50011
and
Hongwei Ma4 Beijing University of Aeronautics and Astronautics, Beijing 100083, P. R. China
An experimental investigation was conducted to study the transient behavior of the flow separation on a NASA low-speed GA (W)-1 airfoil at the chord Reynolds numbers of 68,000. A high-resolution PIV system was used to make detailed flow field measurements in addition to the surface static pressure distribution mapping around the airfoil. The measurement results visualized clearly that a separation bubble would be generated on the airfoil upper surface if the adverse pressure gradient is adequate. The length of the separation bubble could be up to 20% of airfoil chord length and its height only about 1% of the cord length. The transient behavior of the flow separation on the airfoil, which includes the “taking-off” of the laminar boundary layer from the airfoil surface at the separation point, the generation of unsteady Kelvin-Helmholtz vortex in the separated boundary layer, the rapid transition of the separated laminar boundary layer to turbulent flow, the reattachment of the turbulent flow to the airfoil surface to form separation bubble, and the burst of the separation bubble to cause airfoil stall, were elucidated clearly and quantitatively from the detailed flow field measurements.
Nomenclature AOA = angle of attack C = chord length of airfoils
pC = pressure coefficient, )21/()( 2
∞∞−= UppC p ρ
DL CC , = lift coefficient and drag coefficient ReC = chord Reynolds number N = total number of the frames of instantaneous PIV measurements TKE = normalized turbulent kinetic energy, )5.0/()''(5.0 222
∞+= UvuTKE ρρ
ii vu , = instantaneous velocity components in x, y directions VU , = mean velocity components in x, y directions, ∑
=
=N
ii NuU
1
/ , ∑=
=N
ii NvV
1/
',' vu = turbulent velocity fluctuations, NUuuN
ii /)('
1
2∑=
−=, ∑
=
−=N
ii Vvv
1
2)('
∞U = wind tunnel operating velocity
zϖ = Spanwise voriticity, yu
xv ii
z ∂∂
−∂∂
=ϖ
1 Graduate Student, Department of Aerospace Engineering. 2 Assistant Professor, Department of Aerospace Engineering, and AIAA Member. 3 Assistant Professor, Department of Aerospace Engineering, and AIAA Senior Member. Email: [email protected] 4 Professor, School of Jet Propulsion, and AIAA Member.
45th AIAA Aerospace Sciences Meeting and Exhibit Jan 8 – 11, 2007, Reno, Nevada AIAA-2007-0275
American Institute of Aeronautics and Astronautics
2
I. Introduction OW-Reynolds-number aerodynamics is important for both military and civilian applications. These applications include propellers, sailplanes, ultra-light man-carrying/man-powered aircraft, high-altitude vehicles, wind
turbines, unmanned aerial vehicles (UAVs) and Micro-Air-Vehicles (MAVs). Non-dimensional chord Reynolds number is defined as the cruise speed times the mean wing chord divided by kinematic viscosity of air. For the applications listed above, the combination of small length scale and low flight velocities results in flight regimes with low wing-chord Reynolds number (i. e. chord Reynolds numbers ranging from 10,000 ~ 500,000). The aerodynamic design methods and principles developed over the past 40 years have produced efficient airfoils for conventional, large-scale, high-speed aircraft whose chord Reynolds numbers (Re) are usually in the range of 96 10~10 . It is well known that the aerodynamic performances of the airfoils and wing planform designs that are optimal for conventional, large-scale and high-speed aircraft (therefore, high Reynolds numbers) would degrade significantly when they are used for low-Reynolds-number applications where the chord Reynolds numbers are several orders smaller. While conventional design principles usually either neglect viscosity effect or restrict its influence to a thin region near the aircraft body at high Reynolds numbers, the predominance of fluid viscosity effect for the low Reynolds number applications would result in “boundary layers” growing rapidly and separating form the surfaces of the airfoils easily. It is well know that the boundary layers on low-Reynolds-number airfoils would remain laminar at the onset of the pressure recovery unless artificially tripped. The behavior of the laminar boundary layer on low-Reynolds-number airfoils would affect the aerodynamic performance of the airfoils significantly. Since laminar boundary layers are unable to withstand any significant adverse pressure gradient, laminar flow separation is usually found on the low-Reynolds-number airfoils, and post-separation behavior of the laminar boundary layers accounts for the deterioration in the aerodynamic performances of low-Reynolds-number airfoils. The deterioration is exhibited in an increase in drag and decrease in lift. Extensive reviews about the flows over low-Reynolds-number airfoils can be found at Tani [1], Carmichael [2], Lissaman [3], Mueller [4] and Gad-el-Hak [5]. It has been suggested that the separated laminar boundary layers around a low-Reynolds-number airfoils would behavior more like free shear layers, which are highly unstable, therefore, rolling-up of Kelvin-Helmholtz vortex structures and transition to turbulent flows would be readily realized. When the adverse pressure gradient over the airfoil surface is adequate, the transition of the separated laminar boundary layer to turbulent flow could be conducted rapidly, and the increased entrainment of the turbulent flow could make the turbulent flows to reattach the airfoil surface as turbulent boundary layers. This would form what is called a laminar separation bubble. The reattached turbulent boundary could stay in attaching to the airfoil surface firmly up to the airfoil trailing edge. As the adverse pressure gradient become more severe with the increasing angle of attack, the separation bubble would burst suddenly, which result in airfoil stall subsequently. In order to control the flow separations and suppress the sudden burst of the laminar separation bubbles for better aerodynamic performances of low-Reynolds-number airfoils, a good physical understanding is essential, which requires a detailed knowledge about transient behavior of the separated laminar boundary layers and the evolution of the laminar separation bubbles. Although extensive studies, both experimental and numerical, have been conducted in the past to investigate the characteristics of the flow separation and laminar separation bubbles generated on low-Reynolds-number airfoils, most of those previous experimental studies were based on total aerodynamic force (drag and lift) measurements, surface static pressure distribution quantifications as well as qualitative flow visualization, very few whole-field flow measurements are available to reveal the details of the flow structures associated with the formation, evolution and burst processes of the laminar separation bubbles quantitatively. In this study, we report a detailed experimental investigation on the transient behavior of the separated laminar boundary layer and the laminar separation bubble generated on the curved surface of a NASA low-speed GA (W)-1 airfoil at the chord Reynolds number of 68,000. The experimental study was conducted in a wind tunnel; a high-resolution Particle Image Velocimetry (PIV) system was used to make detailed flow field measurements in addition to the surface static pressure distribution mapping around the airfoil. The objectives of the present study are twofold: The first is to gain further insight into fundamental physics about the transient behavior of the flow separation on the low-Reynolds-number airfoil, such as the “taking-off” of the laminar boundary layer from the airfoil surface, the generation of the unsteady vortex structures in the separated boundary layer due to the Kelvin-Helmholtz instabilities, the rapid transition of the separated laminar boundary layers to turbulent flow, and reattachment of the separated boundary layers to the airfoil surface to form separation bubble, and the sudden burst of the separation bubble to cause airfoil stall. The second objective is to provide detailed measurement data for the benchmark of Computational Fluid Dynamics simulations to accurately predict low-Reynolds-number airfoil aerodynamics for the optimum designs of the low-Reynolds-number airfoils.
L

45th AIAA Aerospace Sciences Meeting and Exhibit Jan 8 – 11, 2007, Reno, Nevada AIAA-2007-0275
American Institute of Aeronautics and Astronautics
3
II. Experimental Setup and the Studied Airfoil
The experiments were performed in a closed-circuit low-speed wind tunnel located in the Aerospace Engineering Department of Iowa State University. The tunnel has a test section with a 1 × 1 ft (30 × 30 cm) cross section and all the walls of the test section optically transparent. The tunnel has a contraction section upstream the test section with honeycomb, screen structures and cooling system installed ahead of the contraction section to provide uniform low turbulent incoming flow to enter the test section.
Figure 1 shows the airfoil used in the present study: a GA (W)-1 airfoil (also labeled as NASA LS(1)-0417). The GA (W)-1 has the maximum thickness of 17% of the chord length. Compared with standard NACA airfoils, the GA (W)-1 airfoil was specially designed for low-speed general aviation applications with a large leading-edge radius in order to flatten the peak in pressure coefficient near the airfoil nose to discourage flow separation [6]. The chord length of the airfoil is 101mm, i. e., C = 101mm, for the present study. The flow velocity at the inlet of the test section was set as 0.10=∞U m/s, which corresponds to a chord Reynolds number of
000,68Re =c .
The airfoil is quipped with 43 pressure taps at its median span, and the locations of the pressure taps are also indicated in Fig.1. The 43 pressure taps were connected by plastic tubing to 43 channels of a pressure acquisition system (model DSA3217, Scanivalve Corp). The DSA3217 digital sensor arrays incorporate temperature compensated piezoresistive pressure sensors with a pneumatic calibration valve, RAM, 16 bit A/D converter, and a microprocessor in a compact self-contained module. The precision of the pressure acquisition system is ±0.2% of the full scale (± 10 inch H2O). Each of the pressure transducer inputs was scanned at 400 Hz during 20s. The pressure coefficient distributions, pC , around the airfoil at different angles of attack are measured by using the
pressure acquisition system. The lift and drag coefficients ( LC and DC ) were determined by numerically integrating the pressure distribution around the airfoil.
Figure 2 shows the experimental setup used in the present study for the PIV measurement. During the experiment, the test airfoil was installed in the middle of the test section. A PIV system was used to make flow velocity field measurements along the chord at the middle span of the airfoils. The flow was seeded with 1~5μm oil droplets. Illumination was provided by a double-pulsed Nd:YAG laser (NewWave Gemini 200) adjusted on the second harmonic and emitting two pulses of 200 mJ at the wavelength of 532 nm with a repetition rate of 10 Hz. The laser beam was shaped to a sheet by a set of mirrors, spherical and cylindrical lenses. The thickness of the laser sheet in the measurement region is about 0.5mm. A high resolution 12-bit (1376 x 1040 pixel) CCD camera was used for PIV image acquisition with the axis of the camera perpendicular to the laser sheet. The CCD cameras and the double-pulsed Nd:YAG lasers were connected to a workstation (host computer) via a Digital Delay Generator (Berkeley Nucleonics, Model 565), which controlled the timing of the laser illumination and the image acquisition.
Instantaneous PIV velocity vectors were obtained by a frame to frame cross-correlation technique involving successive frames of patterns of particle images in an interrogation window 32×32 pixels. An effective overlap of 50% was employed to satisfy the Nyquist criterion. The PIV measurements were conducted at three spatial resolutions: a coarse level to study the global features of the flow structures around the airfoil with the measurement window size of about 160mm×140mm; a refined level to investigate the detailed flow structures near the nose of the airfoil with the measurement window size of about 40mm×30mm; and a super fine level to elucidate the unsteady vortex shedding process in the separated laminar boundary layer and the reattachment of the separated boundary layer to the airfoil surface at the rear end of the separation bubble with the measurement window size of about 14mm×8mm. The effective resolutions of the PIV measurements, i.e., grid sizes, were Δ/C = 0.04, 0.01, and 0.035 respectively. After the instantaneous velocity vectors ( ii vu , ) were determined, spanwise vorticity ( zϖ ) could be
derived. The time-averaged quantities such as mean velocity ( VU , ), turbulent velocity fluctuations ( 'u , 'v ) and
-0.10-0.05
00.050.100.15
0 0.1 0.2 0.3 0.4 0.5 0.6 0.7 0.8 0.9 1.0
X/C
Y/C
Figure 1. Airfoil geometry and pressure tap locations

45th AIAA Aerospace Sciences Meeting and Exhibit Jan 8 – 11, 2007, Reno, Nevada AIAA-2007-0275
American Institute of Aeronautics and Astronautics
4
normalized turbulent kinetic energy ( EKT .. ) distributions were obtained from a cinema sequence of 200 frames of instantaneous velocity fields. The measurement uncertainty level for the velocity vectors is estimated to be within 2.0%, and that of the turbulent velocity fluctuations ( ',' vu ) and turbulent kinetics energy ( EKT .. ) are about 5.0%. The uncertainty level of the spanwise vorticity data is expected to be within 10.0%.
Figure 2. Experimental setup for the PIV measurements
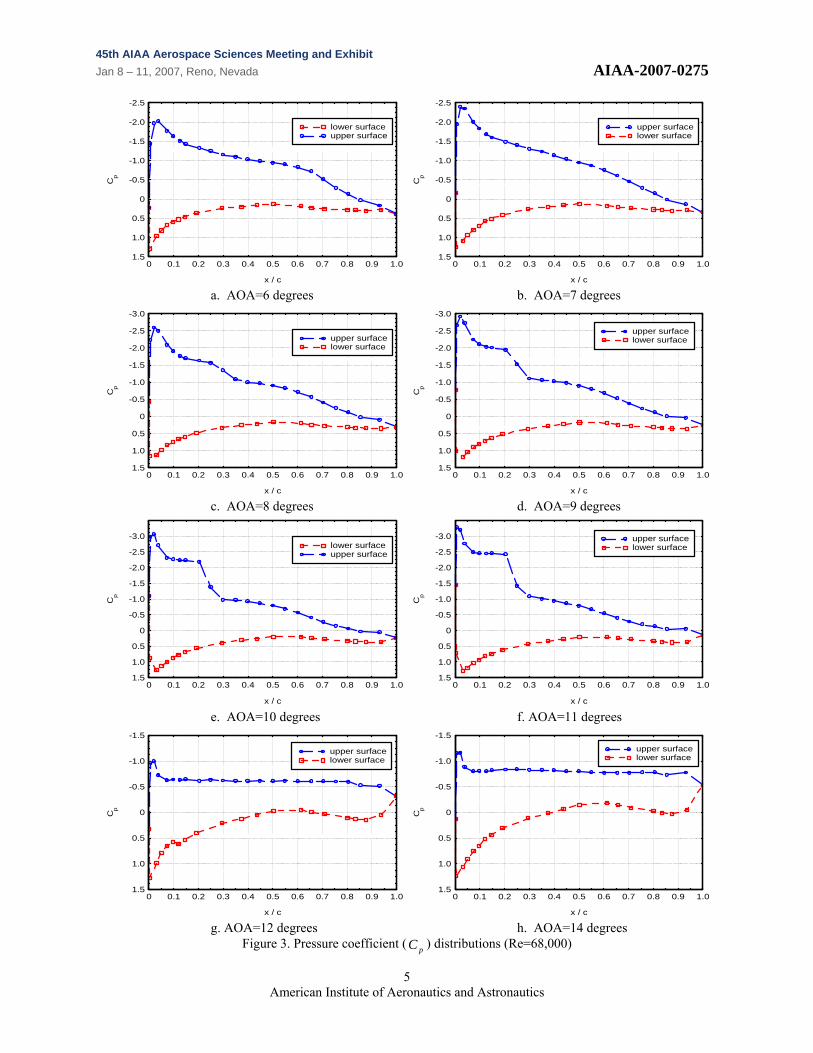
III. Experimental Results and Discussions Figure 3 shows the pressure coefficient distributions around the GA (W)-1 airfoil as the angle of attack changing
from 6 degrees to 14 degrees. When the angle of attack is relatively small ( i.e., < 8 degrees), the static pressure near the nose of the GA (W)-1 airfoil was found to decrease quickly along the upper surface of the airfoil, and reached its negative pressure coefficient peak rapidly, then, the static pressure was found to recover over the upper surface of the airfoil gradually and smoothly up to the trailing edge of the airfoil, which is a typical behavior of the static pressure distribution over the upper surface of an airfoil without any flow separation.
As the angle of attack increased to 9 ~ 11 degrees, one distinctive characteristic of the pressure coefficient profiles along the upper surface of the airfoil is the region of nearly constant pressure (i.e., the “plateau” region) at
2.0/08.0 << CX . Such “plateau” region in the pressure coefficient profiles would indicate the separation of the laminar boundary layer from the airfoil upper surface (i.e., flow separation occurred) [7]. The sudden increase in static pressure following the “plateau” serves to indicate the rapid transition of the separated laminar shear layer to turbulent flow, which would lead to the reattachment of the separated boundary layer and formation of a laminar separation bubble [8]. The static pressure profile was found to recover gradually and smoothly at downstream region of 30.0~25.0/ >CX , which is as the same as those cases with smaller angle of attack and no flow separation. It indicates that the reattachment point, where the separated boundary layer reattach to the airfoil upper surface (i.e., the rear end of the separation bubble) would be located in the neighborhood of 30.0~25.0/ ≈CX .
When the angle of attack becoming bigger than 12 degrees, the maximum absolute value of the pressure coefficient on airfoil upper surface near the leading edge was found to be only about 1.0, which is much smaller than that with smaller angle of attack (about 3.0). The static pressure over the entire upper surface of airfoil was found be nearly constant, i.e., the nearly constant pressure region was found to extend to the trailing edge of the airfoil, which indicates the separated shear layer fails to reattach to the airfoil upper surface, and flow separation would occur over entire upper surface of the airfoil [9], i.e., the airfoil is found to stall completely as the angle of attack becoming greater than 12 degree.
45th AIAA Aerospace Sciences Meeting and Exhibit Jan 8 – 11, 2007, Reno, Nevada AIAA-2007-0275
American Institute of Aeronautics and Astronautics
5
-2.5
-2.0
-1.5
-1.0
-0.5
0
0.5
1.0
1.50 0.1 0.2 0.3 0.4 0.5 0.6 0.7 0.8 0.9 1.0
lower surfaceupper surface
x / c
Cp
-2.5
-2.0
-1.5
-1.0
-0.5
0
0.5
1.0
1.50 0.1 0.2 0.3 0.4 0.5 0.6 0.7 0.8 0.9 1.0
upper surfacelower surface
x / c
Cp
a. AOA=6 degrees b. AOA=7 degrees
-3.0
-2.5
-2.0
-1.5
-1.0
-0.5
0
0.5
1.0
1.50 0.1 0.2 0.3 0.4 0.5 0.6 0.7 0.8 0.9 1.0
upper surfacelower surface
x / c
Cp
-3.0
-2.5
-2.0
-1.5
-1.0
-0.5
0
0.5
1.0
1.50 0.1 0.2 0.3 0.4 0.5 0.6 0.7 0.8 0.9 1.0
upper surfacelower surface
x / c
Cp
c. AOA=8 degrees d. AOA=9 degrees
-3.0
-2.5
-2.0
-1.5
-1.0
-0.5
0
0.5
1.0
1.50 0.1 0.2 0.3 0.4 0.5 0.6 0.7 0.8 0.9 1.0
lower surfaceupper surface
x / c
Cp
-3.0
-2.5
-2.0
-1.5
-1.0
-0.5
0
0.5
1.0
1.50 0.1 0.2 0.3 0.4 0.5 0.6 0.7 0.8 0.9 1.0
upper surfacelower surface
x / c
Cp
e. AOA=10 degrees f. AOA=11 degrees
-1.5
-1.0
-0.5
0
0.5
1.0
1.50 0.1 0.2 0.3 0.4 0.5 0.6 0.7 0.8 0.9 1.0
upper surfacelower surface
x / c
Cp
-1.5
-1.0
-0.5
0
0.5
1.0
1.50 0.1 0.2 0.3 0.4 0.5 0.6 0.7 0.8 0.9 1.0
upper surfacelower surface
x / c
Cp
g. AOA=12 degrees h. AOA=14 degrees
Figure 3. Pressure coefficient ( pC ) distributions (Re=68,000)

45th AIAA Aerospace Sciences Meeting and Exhibit Jan 8 – 11, 2007, Reno, Nevada AIAA-2007-0275
American Institute of Aeronautics and Astronautics
6
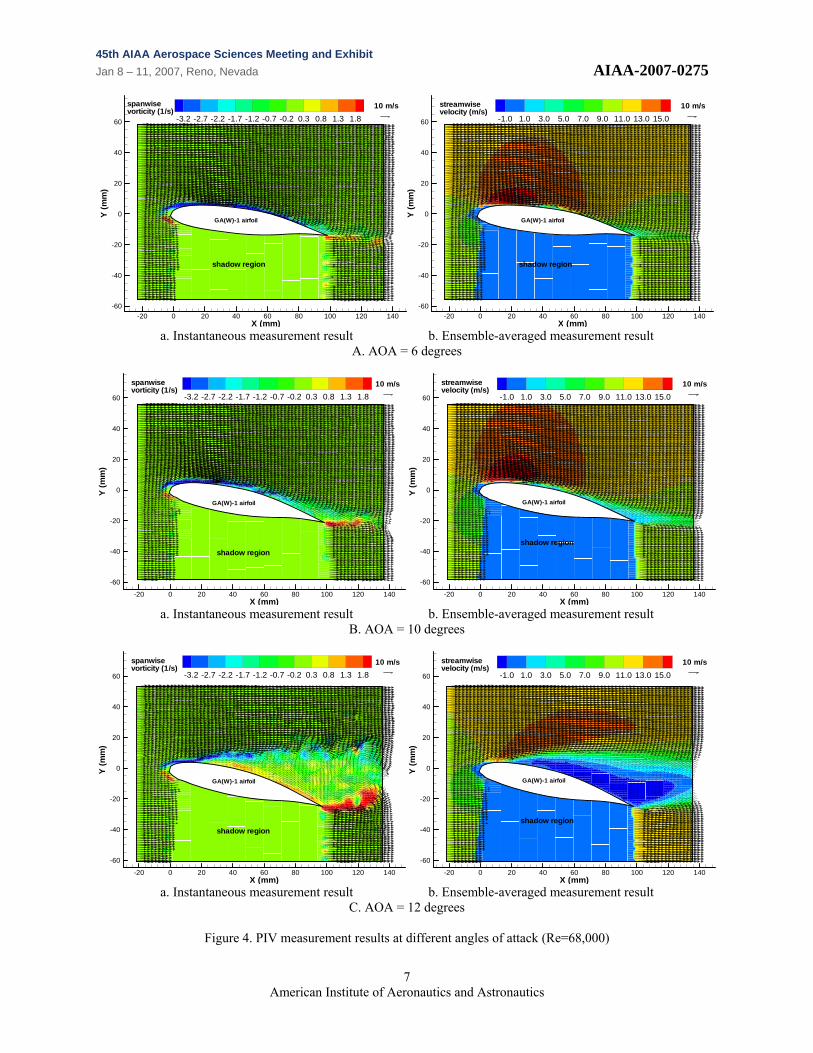
While the pressure coefficient distribution could be used to interpret the global characteristics of the laminar boundary layer over the airfoil, the quantitative flow velocity fields obtained through the PIV measurements could reveal more details about the transient behavior of the flow structures around the airfoil. As visualized clearly in the PIV measurement results shown in Fig. 4, the flow around the airfoil would attach to the both the upper and lower surfaces of the airfoil firmly when the angle of attack is relatively small (i.e., Fig. 4A with AOA =6 degrees), and no flow separation could be found on the airfoil surface. Since the flow could follow the profile of the airfoil faithfully at both upper and lower surfaces, the flow would leave the streamlined airfoil at the trailing edge smoothly, which resulted in a very small wake region (i.e., the deficit of the velocity profile) downstream the airfoil. The small wake region (i.e., velocity deficit) downstream the airfoil indicates a quite small aerodynamic drag force acting on the airfoil, which was verified from the measured drag coefficient given in Fig.7.
As the angle of attack increasing to 9 to 11 degrees, the measured surface pressure coefficient distributions given in Fig. 3 revealed that a separation bubble would be generated on the upper surface of the airfoil at
25.0~10.0/ ≈CX . However, since the height of separation bubble is quite small (only ~1.0% of the chord length based on the measurement results shown in Fig. 6), the separation bubble could not be seen clearly from the PIV measurement results shown in Fig. 4B due to the limited spatial resolution ( 04.0/ ≈Δ C ). However, the reattachment of the separated shear layer on the airfoil upper surface could be confirmed from both the instantaneous and ensemble-averaged velocity fields, i.e., the flow was found to stay in attaching to airfoil upper surface firmly up to the trailing edge after the reattachment. As a result, the wake region (i.e., the velocity deficit) downstream the airfoil is still quite small. However, it should be noted that the wake region or the velocity deficit become slightly bigger compared with the case with AOA = 6 degrees. It would indicate a slightly bigger aerodynamic drag force.
The adverse pressure gradient over the upper surface of the airfoil would become bigger and bigger as the angle of attack increases. The measured surface pressure coefficient distributions given in Fig. 3 revealed that the separated shear layer would not be able to reattach to the upper surface of the airfoil anymore when the angle of attack being bigger than 12 degrees, and the airfoil would stall completely due to the significant adverse pressure gradient. The large-scale flow separation occurring over almost entire upper surface of the airfoil was visualized clearly and quantitatively from the instantaneous PIV measurement result given in Fig. 4C. The large-scale flow separation would generate a very large separation bubble in the wake of the airfoil as visualized in the ensemble-averaged flow velocity field. The wake region (or the velocity deficit) downstream the airfoil was found to increase greatly, which indicates a significant increase in the aerodynamic drag force acting on the airfoil, which is confirmed for the measured drag coefficient data given in Fig. 7.
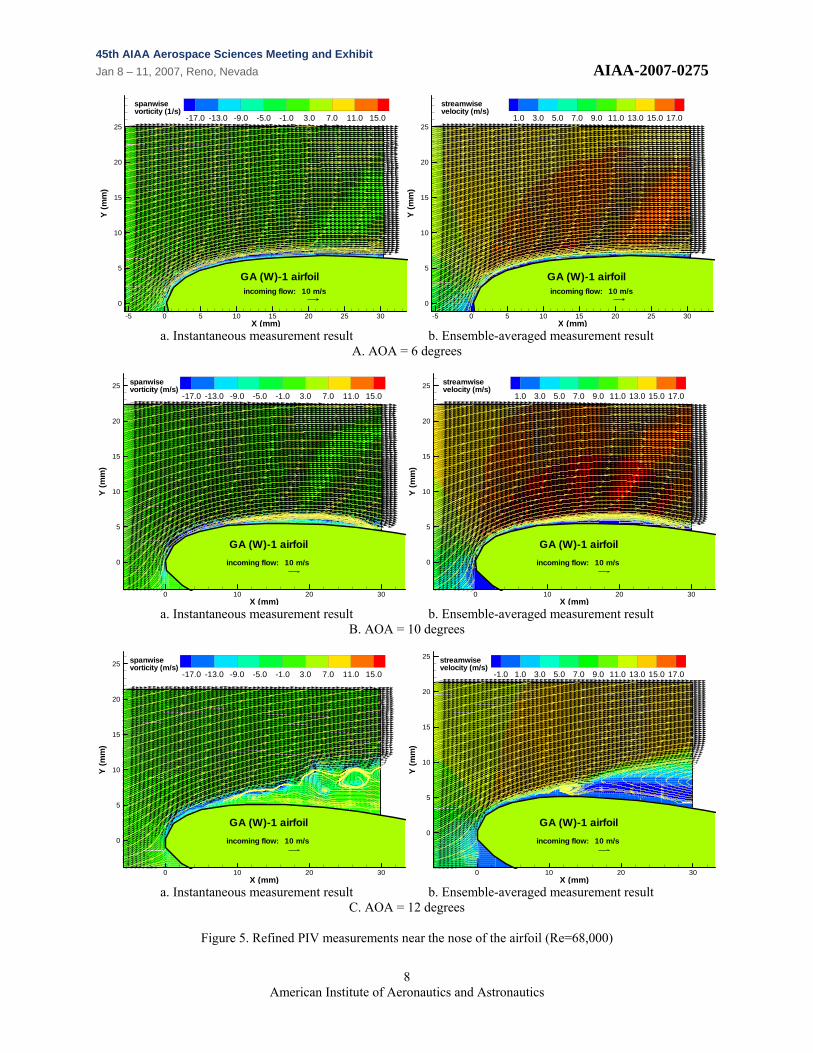
The PIV measurement results given in Fig. 4 revealed the global features of the flow structures around the airfoil clearly. However, the detailed information about the transient behavior of the flow separation on the upper surface of the airfoil, such as the “taking-off” of the laminar boundary layer from the airfoil surface and the formation of the laminar separation bubble could not be revealed clearly due to the limited spatial resolution. In order to elucidate the underlying physics, refined PIV measurements near the nose of the airfoil were made, and the measured flow velocity field, the derived spanwise vorticity distributions and the corresponding streamlines are shown in Fig. 5.
As shown in Fig. 5A, the laminar boundary layer around the airfoil was visualized as a thin vortex layer in the instantaneous velocity field, which would affix to the airfoil surface firmly when the adverse pressure gradient over the upper surface of the airfoil is rather mild as the angle of attack is relatively small (i.e., AOA < 8 degree). As the angle of attack become bigger than 9 degrees, the increased adverse pressure gradient would cause the laminar boundary layer separate from the upper surface of the airfoil, and flow separation would occurs. The separation of the laminar boundary layer from the airfoil upper surface was visualized clearly by the streamlines and flow velocity vectors given in Fig. 5B. The separation point, where the laminar boundary took off from the airfoil surface, was found to be in the neighborhood of 1.0/ ≈CX . The location is found to agree with the starting point of the “plateau” region in the surface pressure coefficient profiles shown in Fig. 3. The separated shear layer was found to reattach to the upper surface of the airfoil in the region of 30.0~25.0/ ≈CX , the existence of a separation bubble was visualized clearly in the PIV measurement results. The separation bubble was found to sit in the region between the point where the laminar boundary layer separates from the airfoil surface ( 1.0/ ≈CX ) and the location where the separated shear layer reattach to the airfoil surface ( i.e. at 3.0~25.0/ ≈CX ), i.e., the length of the separation bubble is about 20% of the chord length when the angle of attack is 10 degrees. As the angle of attack reached 12 degrees, the adverse pressure gradient over the upper surface of the airfoil become more severe, the separation bubble would burst eventually. As visualized in the PIV measurements given in Fig. 5C, the laminar boundary layer
45th AIAA Aerospace Sciences Meeting and Exhibit Jan 8 – 11, 2007, Reno, Nevada AIAA-2007-0275
American Institute of Aeronautics and Astronautics
7
X (mm)
Y(m
m)
-20 0 20 40 60 80 100 120 140-60
-40
-20
0
20
40
60 -3.2 -2.7 -2.2 -1.7 -1.2 -0.7 -0.2 0.3 0.8 1.3 1.810 m/sspanwise
vorticity (1/s)
shadow region
GA(W)-1 airfoil
X (mm)
Y(m
m)
-20 0 20 40 60 80 100 120 140-60
-40
-20
0
20
40
60 -1.0 1.0 3.0 5.0 7.0 9.0 11.0 13.0 15.010 m/sstreamwise
velocity (m/s)
shadow region
GA(W)-1 airfoil
a. Instantaneous measurement result b. Ensemble-averaged measurement result
A. AOA = 6 degrees
X (mm)
Y(m
m)
-20 0 20 40 60 80 100 120 140
-60
-40
-20
0
20
40
60 -3.2 -2.7 -2.2 -1.7 -1.2 -0.7 -0.2 0.3 0.8 1.3 1.810 m/sspanwise
vorticity (1/s)
shadow region
GA(W)-1 airfoil
X (mm)
Y(m
m)
-20 0 20 40 60 80 100 120 140
-60
-40
-20
0
20
40
60 -1.0 1.0 3.0 5.0 7.0 9.0 11.0 13.0 15.010 m/sstreamwise
velocity (m/s)
shadow region
GA(W)-1 airfoil
a. Instantaneous measurement result b. Ensemble-averaged measurement result
B. AOA = 10 degrees
X (mm)
Y(m
m)
-20 0 20 40 60 80 100 120 140
-60
-40
-20
0
20
40
60 -3.2 -2.7 -2.2 -1.7 -1.2 -0.7 -0.2 0.3 0.8 1.3 1.810 m/sspanwise
vorticity (1/s)
shadow region
GA(W)-1 airfoil
X (mm)
Y(m
m)
-20 0 20 40 60 80 100 120 140
-60
-40
-20
0
20
40
60 -1.0 1.0 3.0 5.0 7.0 9.0 11.0 13.0 15.010 m/sstreamwise
velocity (m/s)
shadow region
GA(W)-1 airfoil
a. Instantaneous measurement result b. Ensemble-averaged measurement result
C. AOA = 12 degrees
Figure 4. PIV measurement results at different angles of attack (Re=68,000)
45th AIAA Aerospace Sciences Meeting and Exhibit Jan 8 – 11, 2007, Reno, Nevada AIAA-2007-0275
American Institute of Aeronautics and Astronautics
8
X (mm)
Y(m
m)
-5 0 5 10 15 20 25 30
0
5
10
15
20
25-17.0 -13.0 -9.0 -5.0 -1.0 3.0 7.0 11.0 15.0
incoming flow: 10 m/s
spanwisevorticity (1/s)
GA (W)-1 airfoil
X (mm)
Y(m
m)
-5 0 5 10 15 20 25 30
0
5
10
15
20
251.0 3.0 5.0 7.0 9.0 11.0 13.0 15.0 17.0
incoming flow: 10 m/s
streamwisevelocity (m/s)
GA (W)-1 airfoil
a. Instantaneous measurement result b. Ensemble-averaged measurement result
A. AOA = 6 degrees
X (mm)
Y(m
m)
0 10 20 30
0
5
10
15
20
25-17.0 -13.0 -9.0 -5.0 -1.0 3.0 7.0 11.0 15.0
incoming flow: 10 m/s
spanwisevorticity (m/s)
GA (W)-1 airfoil
X (mm)
Y(m
m)
0 10 20 30
0
5
10
15
20
251.0 3.0 5.0 7.0 9.0 11.0 13.0 15.0 17.0
incoming flow: 10 m/s
streamwisevelocity (m/s)
GA (W)-1 airfoil
a. Instantaneous measurement result b. Ensemble-averaged measurement result
B. AOA = 10 degrees
X (mm)
Y(m
m)
0 10 20 30
0
5
10
15
20
25-17.0 -13.0 -9.0 -5.0 -1.0 3.0 7.0 11.0 15.0
incoming flow: 10 m/s
spanwisevorticity (m/s)
GA (W)-1 airfoil
X (mm)
Y(m
m)
0 10 20 30
0
5
10
15
20
25
-1.0 1.0 3.0 5.0 7.0 9.0 11.0 13.0 15.0 17.0
incoming flow: 10 m/s
streamwisevelocity (m/s)
GA (W)-1 airfoil
a. Instantaneous measurement result b. Ensemble-averaged measurement result
C. AOA = 12 degrees
Figure 5. Refined PIV measurements near the nose of the airfoil (Re=68,000)

45th AIAA Aerospace Sciences Meeting and Exhibit Jan 8 – 11, 2007, Reno, Nevada AIAA-2007-0275
American Institute of Aeronautics and Astronautics
9
would separate from the upper surface of the airfoil almost right from the airfoil leading edge. The separated boundary layer could not reattach to the upper surface of the airfoil anymore due to the more severe adverse pressure gradient, which would result in the large-scale flow separation over entire upper surface of the airfoil, and airfoil was found to stall completely.
As revealed in the PIV measurement results given in Fig. 5B, the length of the separation bubble could be about 20% of the airfoil chord length. However, the height of the separation bubble is very small, which is only about 1% of the chord length. In order to provide further insight into the fundamental physics about the evolution of the laminar separation bubble, PIV measurements with super-fine spatial resolution ( 0035.0/ ≈Δ C ) were also conducted to elucidate the unsteady vortex shedding process in the separated laminar boundary layer and the reattachment of the separated boundary layer to the airfoil surface at the rear end of the separation bubble. The measurement results were shown in Fig. 6, which include flow velocity vectors, the spanwise vortcity distribution and the corresponding streamlines.
a. instantaneous measurement results b. streamlines of the instantaneous velocity field
X (mm)
Y(m
m)
12 13 14 15 16 17 18 19 20 21 22 23 24 25
4
5
6
7
8
9
10
11
12
0.0 2.0 4.0 6.0 8.0 10.0 12.0 14.0 16.0 18.0 20.0
10 m/sstreamwisevelocity (m/s)
GA (W)-1 airfoil
X (mm)
Y(m
m)
12 13 14 15 16 17 18 19 20 21 22 23 24 25
4
5
6
7
8
9
10
11
12
0.0 2.0 4.0 6.0 8.0 10.0 12.0 14.0 16.0 18.0 20.0
10 m/sstreamwisevelocity (m/s)
GA (W)-1 airfoil
c. ensemble-averaged velocity field d. streamlines of the ensemble-averaged flow field
Figure 6. PIV measurements of the separation bubble.
As visualized in the PIV measurement results given in Fig. 5B, the laminar boundary layer would separate from the upper surface of the airfoil at 1.0/ ≈CX due to the rather severe adverse pressure gradient as the angle of attack being 10 degrees. The separated laminar boundary layer would behave more like a free shear layer, which was highly unstable; therefore, rolling-up of unsteady vortex structures due to the Kelvin-Helmholtz instabilities and transition of the laminar boundary layer to turbulent flow would be readily realized. The rolling-up of Kelvin-Helmholtz vortex structures in the separated shear layer was visualized clearly from the instantaneous PIV measurement result given in Fig. 6(a). As revealed clearly in the measurement results given in Fig. 6, the separated laminar shear layer would transit to turbulent flow rapidly. The increased entrainment of the turbulent flow could make the turbulent flow reattach to the upper surface of the airfoil as a turbulent boundary layer at the location of
25.0/ ≈CX . Since a turbulent boundary layer is usually more capable (at least by a factor of 10) of advancing against adverse pressure gradient without flow separation compared with laminar flow [2], therefore, the turbulent
X (mm)
Y(m
m)
12 13 14 15 16 17 18 19 20 21 22 23 24 25
4
5
6
7
8
9
10
11
12
-22.0 -18.0 -14.0 -10.0 -6.0 -2.0 2.0 6.0 10.0
10 m/sSpanwisevorticity (1/s)
GA (W)-1 airfoil
X (mm)
Y(m
m)
12 13 14 15 16 17 18 19 20 21 22 23 24 25
4
5
6
7
8
9
10
11
12
0.0 2.0 4.0 6.0 8.0 10.0 12.0 14.0 16.0 18.0 20.0
10 m/sstreamwisevelocity (m/s)
GA (W)-1 airfoil

45th AIAA Aerospace Sciences Meeting and Exhibit Jan 8 – 11, 2007, Reno, Nevada AIAA-2007-0275
American Institute of Aeronautics and Astronautics
10
boundary layer could stay in attaching to the upper surface of the airfoil firmly from reattachment point up to the trailing edge of the airfoil, which was confirmed in the measurement results given in Fig. 4.
The lift and drag coefficients of the airfoil at different angle of attack were determined by numerically integrating the pressure distribution around the airfoil, and the results are shown in Fig. 7. For comparison, the lift coefficient profile predicted by thin airfoil theory [10] was also given in the figure.
As the angle of attack is relatively small (i.e.,< 7 degree), the adverse pressure gradient over the upper surface of the airfoil is mild. As revealed from the pressure coefficient distributions and the PIV measurements results given above, the laminar boundary layer around the airfoil would attach to the airfoil surface faithfully all the way from the leading edge to the airfoil trailing edge, and no flow separation was found. Therefore, the drag coefficient of the airfoil was very small and nearly a constant at different angel of attack. The lift coefficient of the airfoil was found to increase almost linearly with the increasing angle of attack. The increase rate was found to be almost as the same as that predicted by the thin airfoil theory.
The adverse pressure gradient on the upper surface of the airfoil would become more severe as the angle of attack increasing. Since the laminar boundary layer is unable to withstand any significant adverse pressure gradient, it would separate from the upper surface of the airfoil, and laminar flow separation would occur as the angle of attack becoming bigger than 9 degrees. The flow separation is evident as the “plateau” region in the measured surface pressure coefficient profiles and visualized clearly in the PIV measurement results given above. The separated laminar boundary layer would transit to turbulent flow rapidly by generating unsteady Kelvin-Helmholtz vortex structures, and the turbulent flow could reattach to the upper surface of the airfoil as a turbulent boundary by forming a separation bubble on the airfoil. Since the reattached turbulent boundary could attach to the upper surface of the airfoil firmly from the reattachment point up to the airfoil trailing edge, the lift coefficient of the airfoil was found to keep on increasing with the increasing angle of attack. However, the increase rate was found to slow down due to the formation of the separation bubble. The drag coefficient of the airfoil was also found to increase slightly with the increasing angle of attack.
As the angle of attack reaches 12 degrees, the adverse gradient becoming so severe that the separation bubble burst suddenly, and the separated boundary layer could not to reattach to the upper surface of the airfoil anymore. Large-scale flow separation was found to occur over entire upper surface of the airfoil as visualized in the PIV measurements given above, and the airfoil was found to stall completely. Therefore, the lift coefficient was found to drop rapidly, and the drag coefficient increased significantly. After airfoil stalls, the lift coefficient of the airfoil was found to increase slowly, and the drag coefficient increases rapidly with the increasing angle of attack.
IV. Conclusion
An experimental investigation was conducted to study the transient behavior of the flow separation on a NASA low-speed GA (W)-1 airfoil at the chord Reynolds number of ReC.= 68,000. The experimental study was conducted in a wind tunnel, a high-resolution PIV system was used to made detailed flow field measurements in addition to the surface static pressure mapping around the airfoil.
The detailed measurements elucidated clearly that the laminar boundary layer around the airfoil would stay in attaching to the surface of the airfoil faithfully when the adverse pressure gradient over the airfoil upper surface is rather mild at relatively small angle of attack (i.e. < 7 degrees). As the angle of attack increasing to 9 to 11 degrees, the increased adverse pressure gradient would cause the laminar boundary layer separate from the airfoil upper surface. The separated laminar boundary layer would transit to turbulent flow rapidly by generating unsteady vortex structures due to Kelvin-Helmholtz instabilities, and reattach to the upper surface of the airfoil as a turbulent
Figure 7. Lift and drag coefficients
00.10.20.30.40.50.60.70.80.91.01.11.21.31.41.51.61.71.81.92.0
4 5 6 7 8 9 10 11 12 13 14 15 16 17 18 19 2000.10.20.30.40.50.60.70.80.91.01.11.21.31.41.51.61.71.81.92.0
Thin airfoil theoryCL (Re=68,000)CD (Re=68,000)
angle of attack (degree)
C L
CD
45th AIAA Aerospace Sciences Meeting and Exhibit Jan 8 – 11, 2007, Reno, Nevada AIAA-2007-0275
American Institute of Aeronautics and Astronautics
11
boundary layer. As a result, a separation bubble would be formed on the airfoil with its length up to 20% of the airfoil chord length and its height only 1% of the chord length. The detailed PIV measurements also elucidated further details about the transient behavior of the laminar separation process, which includes the “taking-off” of the laminar boundary layers from the airfoil surfaces, the generation of the unsteady Kelvin-Helmholtz vortex structures in the separated boundary layer, the rapid transition of the separated laminar boundary layers to turbulent flow, the reattachment of the separated boundary layers to the airfoil surface, and the sudden burst of the separation bubble to cause airfoil stall.
The lift and drag coefficients of the airfoil at different angle of attack were determined by numerically integrating the pressure distribution around the airfoil. As the angle of attack is relatively small (i.e., < 7 degrees), the lift coefficient was found to increase linearly with the increasing angle of attack, while the drag coefficient was found to be almost constant. The increase rate of the lift coefficient was found to be almost as the same as that predicted by thin airfoil theory. After the formation of the separation bubbles at the angle of attack of 9 to 11 degrees, the increase rate of the measured lift coefficient was found to slow down, and the drag coefficient was found to increase slightly with the increasing angle of attack. As the angle of attack reaches 12 degrees, where the separation bubble was found to burst suddenly, and the airfoil stall occurred, the lift coefficient was found to drop greatly, and the drag coefficient increased significantly. After the airfoil stall, the drag coefficient was found to increase greatly with the increasing angle of attack, while the lift coefficient increased slightly.
Acknowledgments
The authors also want to thank Prof. Partha Sarkar, Mr. Bill Rickard, Mr. De Huang and Mr. Masatoshi Tamai of Iowa State University for their help in conducting the experiments.
References
[1] Tani, I., "Low Speed Flows Involving Bubble Separations," Progress in Aeronautical Science. Vol.5, 1964.
[2] Carmichael, B. H., “Low Reynolds Number Airfoil Survey”, Vol. 1, NASA CR-165803, 1981.
[3] Lissaman, P. B. S., “Low-Reynolds-Number Airfoils,” Annual Review of Fluid Mechanics, Vol. 15, 1983, pp.223–239.
[4] Mueller, T. J. (ed.), Fixed and Flapping Wing Aerodynamics for Micro Air Vehicle Applications (Progress in Astronautics and Aeronautics), ISBN 1-56347-517-0. 2001.
[5] Gad-el-Hak, M. “Micro-Air-Vehicles: Can They be Controlled Better,” Journal of Aircraft, Vol. 38, No. 3, 2001.
[6] McGee, R.J. and Beasley W.D., “Low-speed Aerodynamics Characteristics of a 17-Percent-Thick Airfoil Section Designed for General Aviation Applications”, NASA TN D-7428, 1973.
[7] Shum Y. K. and Marsden D. J., “Separation Bubble Model for Low Reynolds Number Airfoil Applications”, Journal of Aircraft, Vol.31, No.4, 1994.
[8]. Yaruseych S., Sullivan P.E. and Kawall, J.G., “Coherent Structure in an Airfoil Boundary Layer and Wake at Low Reynolds Numbers”, Physics of Fluids, Vol, 18, 044101, 2006.
[9] Lin, J.C. M. and Pulley, L. L., “Low-Reynolds-Number Separation on an Airfoil”, AIAA Journal, Vol.34, No. 8, 1996.
[10] Anderson, J. D., “Fundamentals of Aerodynamics”, fourth edition, McGraw-Hill Higher Education, 2005.