An experimental investigation on the effect of grain size ...
11
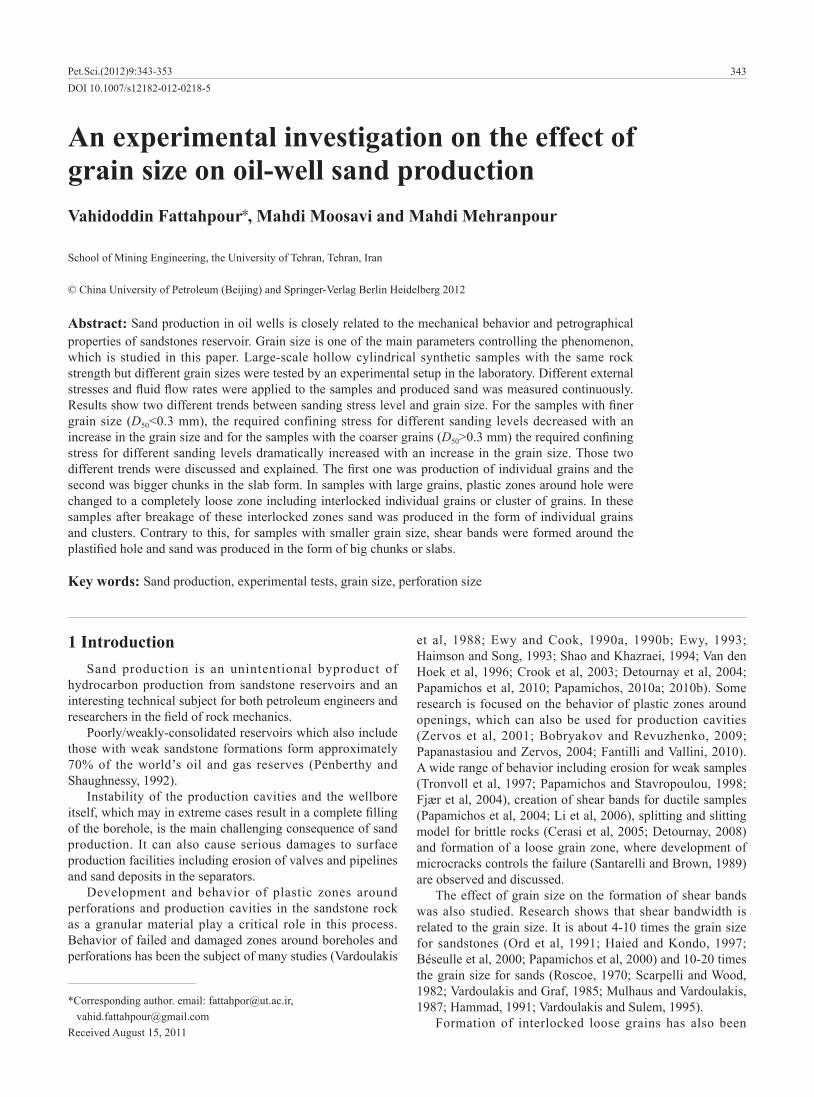
343 DOI 10.1007/s12182-012-0218-5 Vahidoddin Fattahpour , Mahdi Moosavi and Mahdi Mehranpour School of Mining Engineering, the University of Tehran, Tehran, Iran © China University of Petroleum (Beijing) and Springer-Verlag Berlin Heidelberg 2012 Abstract: Sand production in oil wells is closely related to the mechanical behavior and petrographical properties of sandstones reservoir. Grain size is one of the main parameters controlling the phenomenon, which is studied in this paper. Large-scale hollow cylindrical synthetic samples with the same rock strength but different grain sizes were tested by an experimental setup in the laboratory. Different external stresses and fluid flow rates were applied to the samples and produced sand was measured continuously. Results show two different trends between sanding stress level and grain size. For the samples with finer grain size (D 50 <0.3 mm), the required confining stress for different sanding levels decreased with an increase in the grain size and for the samples with the coarser grains (D 50 >0.3 mm) the required confining stress for different sanding levels dramatically increased with an increase in the grain size. Those two different trends were discussed and explained. The first one was production of individual grains and the second was bigger chunks in the slab form. In samples with large grains, plastic zones around hole were changed to a completely loose zone including interlocked individual grains or cluster of grains. In these samples after breakage of these interlocked zones sand was produced in the form of individual grains and clusters. Contrary to this, for samples with smaller grain size, shear bands were formed around the plastified hole and sand was produced in the form of big chunks or slabs. Key words: Sand production, experimental tests, grain size, perforation size An experimental investigation on the effect of grain size on oil-well sand production *Corresponding author. email: [email protected], [email protected] Received August 15, 2011 1 Introduction Sand production is an unintentional byproduct of hydrocarbon production from sandstone reservoirs and an interesting technical subject for both petroleum engineers and researchers in the field of rock mechanics. Poorly/weakly-consolidated reservoirs which also include those with weak sandstone formations form approximately 70% of the world’s oil and gas reserves (Penberthy and Shaughnessy, 1992). Instability of the production cavities and the wellbore itself, which may in extreme cases result in a complete filling of the borehole, is the main challenging consequence of sand production. It can also cause serious damages to surface production facilities including erosion of valves and pipelines and sand deposits in the separators. Development and behavior of plastic zones around perforations and production cavities in the sandstone rock as a granular material play a critical role in this process. Behavior of failed and damaged zones around boreholes and perforations has been the subject of many studies (Vardoulakis et al, 1988; Ewy and Cook, 1990a, 1990b; Ewy, 1993; Haimson and Song, 1993; Shao and Khazraei, 1994; Van den Hoek et al, 1996; Crook et al, 2003; Detournay et al, 2004; Papamichos et al, 2010; Papamichos, 2010a; 2010b). Some research is focused on the behavior of plastic zones around openings, which can also be used for production cavities (Zervos et al, 2001; Bobryakov and Revuzhenko, 2009; Papanastasiou and Zervos, 2004; Fantilli and Vallini, 2010). A wide range of behavior including erosion for weak samples (Tronvoll et al, 1997; Papamichos and Stavropoulou, 1998; Fjær et al, 2004), creation of shear bands for ductile samples (Papamichos et al, 2004; Li et al, 2006), splitting and slitting model for brittle rocks (Cerasi et al, 2005; Detournay, 2008) and formation of a loose grain zone, where development of microcracks controls the failure (Santarelli and Brown, 1989) are observed and discussed. The effect of grain size on the formation of shear bands was also studied. Research shows that shear bandwidth is related to the grain size. It is about 4-10 times the grain size for sandstones (Ord et al, 1991; Haied and Kondo, 1997; Béseulle et al, 2000; Papamichos et al, 2000) and 10-20 times the grain size for sands (Roscoe, 1970; Scarpelli and Wood, 1982; Vardoulakis and Graf, 1985; Mulhaus and Vardoulakis, 1987; Hammad, 1991; Vardoulakis and Sulem, 1995). Formation of interlocked loose grains has also been Pet.Sci.(2012)9:343-353
Transcript of An experimental investigation on the effect of grain size ...
343DOI 10.1007/s12182-012-0218-5
Vahidoddin Fattahpour , Mahdi Moosavi and Mahdi Mehranpour
School of Mining Engineering, the University of Tehran, Tehran, Iran
© China University of Petroleum (Beijing) and Springer-Verlag Berlin Heidelberg 2012
Abstract: Sand production in oil wells is closely related to the mechanical behavior and petrographical properties of sandstones reservoir. Grain size is one of the main parameters controlling the phenomenon, which is studied in this paper. Large-scale hollow cylindrical synthetic samples with the same rock strength but different grain sizes were tested by an experimental setup in the laboratory. Different external stresses and fluid flow rates were applied to the samples and produced sand was measured continuously. Results show two different trends between sanding stress level and grain size. For the samples with finer grain size (D50<0.3 mm), the required confining stress for different sanding levels decreased with an increase in the grain size and for the samples with the coarser grains (D50>0.3 mm) the required confining stress for different sanding levels dramatically increased with an increase in the grain size. Those two different trends were discussed and explained. The first one was production of individual grains and the second was bigger chunks in the slab form. In samples with large grains, plastic zones around hole were changed to a completely loose zone including interlocked individual grains or cluster of grains. In these samples after breakage of these interlocked zones sand was produced in the form of individual grains and clusters. Contrary to this, for samples with smaller grain size, shear bands were formed around the plastified hole and sand was produced in the form of big chunks or slabs.
Key words: Sand production, experimental tests, grain size, perforation size
An experimental investigation on the effect of grain size on oil-well sand production
*Corresponding author. email: [email protected], [email protected] August 15, 2011
1 Introduction Sand production is an unintentional byproduct of
hydrocarbon production from sandstone reservoirs and an interesting technical subject for both petroleum engineers and researchers in the field of rock mechanics.
Poorly/weakly-consolidated reservoirs which also include those with weak sandstone formations form approximately 70% of the world’s oil and gas reserves (Penberthy and Shaughnessy, 1992).
Instability of the production cavities and the wellbore itself, which may in extreme cases result in a complete filling of the borehole, is the main challenging consequence of sand production. It can also cause serious damages to surface production facilities including erosion of valves and pipelines and sand deposits in the separators.
Development and behavior of plastic zones around perforations and production cavities in the sandstone rock as a granular material play a critical role in this process. Behavior of failed and damaged zones around boreholes and perforations has been the subject of many studies (Vardoulakis
et al, 1988; Ewy and Cook, 1990a, 1990b; Ewy, 1993; Haimson and Song, 1993; Shao and Khazraei, 1994; Van den Hoek et al, 1996; Crook et al, 2003; Detournay et al, 2004; Papamichos et al, 2010; Papamichos, 2010a; 2010b). Some research is focused on the behavior of plastic zones around openings, which can also be used for production cavities (Zervos et al, 2001; Bobryakov and Revuzhenko, 2009; Papanastasiou and Zervos, 2004; Fantilli and Vallini, 2010). A wide range of behavior including erosion for weak samples (Tronvoll et al, 1997; Papamichos and Stavropoulou, 1998; Fjær et al, 2004), creation of shear bands for ductile samples (Papamichos et al, 2004; Li et al, 2006), splitting and slitting model for brittle rocks (Cerasi et al, 2005; Detournay, 2008) and formation of a loose grain zone, where development of microcracks controls the failure (Santarelli and Brown, 1989) are observed and discussed.
The effect of grain size on the formation of shear bands was also studied. Research shows that shear bandwidth is related to the grain size. It is about 4-10 times the grain size for sandstones (Ord et al, 1991; Haied and Kondo, 1997; Béseulle et al, 2000; Papamichos et al, 2000) and 10-20 times the grain size for sands (Roscoe, 1970; Scarpelli and Wood, 1982; Vardoulakis and Graf, 1985; Mulhaus and Vardoulakis, 1987; Hammad, 1991; Vardoulakis and Sulem, 1995).
Formation of interlocked loose grains has also been
Pet.Sci.(2012)9:343-353

344
discussed in the literature. Zaitsev (1985) introduced a model for concrete, which can (to some extent) be applied to sandstone. He proposed that when there was a notable difference between the fracture toughness of the matrix and the grains, microcracks preferred to develop in the matrix and they could be blocked when they reached a grain. Two factors control the propagation of these microcracks; the first is the difference between the fracture toughness of grains and matrix and the second is blockage of microcracks by grains in the matrix-grain boundary. Santarelli and Brown (1989) discussed a similar qualitative model of failure development for Doddington sandstones with 23% porosity. In the sample discussed by Santarelli and Brown, the stiffness of grains was higher than that of the matrix and the numbers of blocking boundaries were high. They concluded that developed microcracks in the matrix were soon blocked by grains. The crack would therefore propagate in tangential and radial steps. These steps result in a completely loose zone. In the case of Doddington sandstones they thought that the only possible path for cracks to grow, once initiated, is towards the wall. The result of such a failure process is the formation of a small cluster when the crack has reached the wall. Note that the tangential stress stops this cluster from being produced. It should be mentioned that depending on different parameters like the blockage of microcracks, the result of microcrack development could be the formation of both individual loose grains and clusters of grains. It can be concluded from previous research that grains and their relation with cementation can cause different failure mechanisms around boreholes.
To model sand production in the laboratory, a cylindrical sample with a central hole was made and was then subjected to fluid flow, while the sample was subjected to the radial and axial stresses. Meanwhile the produced sand was measured (Tronvoll et al, 1993; 1997; Tronvoll and Fjær, 1994; Nouri et al, 2005; Papamichos, 2006).
The most problematic stage in the laboratory tests is the continuous measurement of produced sand. In previous studies different methods have been used, including sonic and acoustic sand detection systems (Tronvoll and Fjær, 1994), direct measurement of precipitated sand grains by a submerged scale (Cerasi et al, 2005). There are also some discontinuous methods such as the method used by Nouri et al (2005). The apparatus which is used in this study for continuous measurement of produced sand is based on precipitation. This apparatus has been used in some similar research by the authors for experimental investigations of sand production and the details of the system have been discussed earlier (Fattahpour et al, 2011; 2012).
According to Fjær et al (2008), observations of sand production can be classified into three types including transient sand production, continuous sand production and catastrophic sand production. The same stages with some modifications can be determined from experimental tests (Fattahpour et al, 2012).
The purpose of this study is to investigate the influence of the grain size on sand production. The effect of strength has been discussed with same procedure and setup by Fattahpour et al (2012). It seems that there is no special report about
the effect of grain size on sand production. However there has been comprehensive research into the effect of different elements of granular rock skeletons on strength.
Granular rocks, like sandstone, are made out of grains, pores and bonding cement. Deformation of these rocks involves changes in shape and size of one or more of these constitutive elements (Aydin et al, 2006). From these elements, grains form the skeleton of granular materials. The strength of this skeleton depends on the strength of the grains themselves and their interaction with each other as well as the interactions with cement and matrix.
According to existing knowledge, the effect of grain size seems to be unclear and depends on the particular type of sandstone. Singh (1988) for greywacke and Fahy and Guccione (1979) for their investigated sandstones showed that an increase in the grain size resulted in decrease in uniaxial compressive strength (UCS). On the other hand Bell and Culshaw (1993) demonstrated that there was an inverse relation between mean grain size and strength for the Sherwood Sandstone Group, Nottinghamshire, England. Other research by Bell and Culshaw (1999) into sandstones in the Sneinton Formation, Nottinghamshire, shows that the particle size had no influence on the compressive and tensile strength. Other research has also shown that there was no special relation between grain size and strength (Bell, 1978; Shakoor and Bonelli, 1991; Plachik, 1999).
Bell (1978), and Bell and Culshaw (1993) showed that, as another impacting factor, any increase in packing density, resulted in an increase in strength of Fell sandstones and Sherwood sandstones. Ulusay et al (1994) found a similar relationship. According to Dobereiner and de Freitas (1986) weak sandstones generally had low packing density.
Castro and Bell (1995) showed for sandstones from the Clarens Formation, South Africa that samples with UCS>40 MPa could be described as densely packed and grains had three or more contacts and were usually interlocked and grain contacts were concavo-convex and sutured. On the other hand, for samples with UCS<40 MPa, contacts were usually floating or tangent and few grains possessed sutured contacts. Similarly, Yates (l992) reported that poor compaction and tangential grain contacts were common characteristics in the very weak sandstones in the Sherwood Sandstone Group. Dyke and Dobereiner (1991) and Dobereiner and de Freitas (1986) found that the amount of grain contact (i.e. the ratio of the contact length a grain has with its neighbors to its own total length, measured in two dimensions and expressed as a percentage) had a major influence on the strength. Shakoor and Bonelli (l99l) concluded that those sandstones with higher proportions of sutured contacts exhibited higher values of compressive and tensile strength and Young's modulus than those without direct contact between grains (grain to cement, grain to void) and with long contacts. Ulusay et al (1994) also showed that in the sandstones, which they examined, those with higher percentages of sutured contacts had higher strength.
According to the existing studies, influence of mineral content on the geomechanical properties of sandstones is not clear and even in some cases completely inconsistent results were reported. For instance, Bell and Lindsay (1999)
Pet.Sci.(2012)9:343-353

345
found that the UCS increased as the quartz content increased in the sandstones of Natal Group, South Africa and on the other hand, Bell (1978) found no significant relationship between quartz content and strength in the Fell Sandstones of Northumberland, England.
Bell showed that, in the Fell Sandstones, an increase in the amount of cement resulted in an increase in strength. Ulusay et al (1994) drew the same conclusion about the Kozln Sandstone, Turkey, and showed that interlocking of quartz grains was more important than quartz content.
It can be concluded that the main factors, which control the strength of sandstones, are the interlocking between grains and the cement content. It seems that in the cases where the connection due to the cementation between the grains is removed due to the development of microcracks, interlocking between the grains is the main factor keeping the structure together.
2 Experimental test setup and procedureThe experimental setup and methods used in this work are
the same as reported earlier by Fattahpour et al (2011, 2012).Large-scale natural samples that can be used to investigate
sand production are usually rare due to difficulties in core drilling from weak formations. Therefore, synthetic samples were prepared with sand grains, which were produced by crushing and sorting. The composition of sand grains used is listed in Table 1.
Table 1 Composition of sand grains used to prepare the tested samples
Composition SiO2 Al2O3 Fe2O3 CaO MgO Na2O K2O
Content, % 97.6 0.48 0.12 0.18 0.08 0.63 0.14
In order to investigate the effect of grain size on sand production, tests were done on 7 types of synthetic samples with different grain size distributions.
These samples had the same rock strength (i.e. uniaxial compressive strength (UCS)) to avoid a possible effect of rock strength on sand production. In order to achieve samples with the same rock strength, before making the main samples, small size samples with different composition of cement, water to cement ratio and compaction were made and tested.
The experimental procedure is like the typical procedure
for hollow cylinder tests, in which confining stress is increased in different steps and for each stress step fluid is injected at different pressures, which in turn causes different fluid flow rates. In the present study, both axial and radial stresses increase together and the axial stress is taken at one third of the radial stress. Radial and axial stresses are increased in the steps of 15 and 5 bars respectively. Fluid flow rates are usually applied in 4 steps. The maximum fluid flow rate is 1.5 L/min. Each confining stress step is kept for about 45 min.
The reduction in the well pressure (depletion) is modeled by different confining stresses and fluid flow rates. Reduction in well pressure increases the fluid flow and depletion can increase the effective stress. This excess stress is believed to be the main cause for sand production.
Diesel fuel with a viscosity of 4.5 cp and density of 0.82 g/mL is used to model the oil field fluid where the viscosity of hot oil at the depth of completion is close to the viscosity of diesel fuel.
3 Properties of the tested samplesThe properties and sand grain distributions of these
synthetic samples were measured and shown in Table 2 and Fig. 1. Experimental results indicate that sample A had the lowest mean grain size and sample G had the highest mean
Table 2 Properties of 7 types of synthetic samples
Sample Cement content%
D10
mmD50
mmD60
mm
Uniformity coefficient
Cu
Porosity%
Uniaxial compressive strength (UCS)
MPa
Internal friction angle φdegrees
CohesionMPa
A 12 0.06 0.09 0.10 1.67 35.0 4.5 28.6 1.33
B 12 0.12 0.18 0.195 1.63 28.5 4.4 28.0 1.32
C 14 0.12 0.21 0.235 1.96 31.75 4.3 26.2 1.34
D 14 0.17 0.26 0.28 1.65 32.2 4.5 28.6 1.35
E 14 0.18 0.38 0.46 2.56 27.5 4.7 28.7 1.39
F 16 0.43 0.79 0.87 2.02 36.0 4.5 37.82 1.10
G 15 0.74 1.28 1.36 1.84 34.3 4.5 38.82 1.08
Fig. 1 Grain size distribution of 7 types of synthetic samples
100
90
80
70
60
50
40
30
20
10
0
Cum
ulat
ive
perc
enta
ge
0.01 0.1 1 10
A
B
C
D
E
F G
Grain size, mm
Pet.Sci.(2012)9:343-353

346
size (Fig. 1). The grain size distribution of samples A, B and E were similar to the samples from one of the Iranian oil fields and the grain size distribution of the other samples are chosen in a way that a wide range of mean grain size is covered.
The uniformity coefficient Cu value of samples varied from 1.63 to 2.56. This means that all the samples were relatively well sorted. It should be mentioned that the uniformity coefficient was not the same for all of the samples because the grain size distribution of some samples (A, B and E) were based on natural samples and the others were chosen by the authors. The differences between sorting of grains in different samples may have some effect on the results but this effect is ignored because all of the samples are relatively well sorted.
All samples had similar UCS. This similarity was achieved by preparing different samples with different combinations of cement, compaction, and water to cement ratio. The amount of cement in each sample is also listed in Table 2. To achieve the same UCS, samples with larger grain sizes required more cement.
As it was concluded in the introduction, interlocking of grains and cement content are the two main factors that control the strength of granular materials. Interlocking of grains depends on the type of contacts and the shape of grains. Fig. 2 shows pictures taken from thin sections of these synthetic samples under both plane and crossed-polarized light. As it can be seen, most of the grains were angular, which was due to their crushed nature. Most of the grains were ‘floating’ in the samples except for the fine-grained samples (A and B) with considerable tangent (point) contacts. It can be concluded that the percentage of floating grains increased with increasing grain size.
It seems that an increase in the amount of cement in samples with coarse grains compensated for the decrease in interlock between grains. Studies of thin sections show that the main mineral of the grains was quartz, which is in accordance with high values of SiO2 in the composition of grains as depicted in Table 1.
Sand grains used in this study were produced by crushing and sorting. Thin sections show the position of cement, grains and pores. Most of the grains were ‘floating’ in the samples, which indicates that there was no direct contact between grains and the spaces between grains were mostly filled with cement. In pictures under the crossed-polarized light, both pores and cement were depicted as black zones. Therefore, the cement could be identified by comparing pictures under different light.
Cohesion and internal friction angle of samples are also summarized in Table 2, which shows that both values were similar for the first five samples A-E. However, for samples F and G, the internal friction angle was higher and the cohesion was lower than those of other samples. As mentioned before, the interlocking between grains can be neglected and the strength of samples is mostly due to the cement. So the high friction angle for samples with coarse grains is due to the occurrence of large cemented areas between grains, which can be seen in thin sections (Figs. 2F2 and 2G2).
4 Experimental results and discussionResults of the test can be plotted as the produced sand
over time for different fluid flow rates. This graph can be used to study the trend of sanding during time. It can also be used for classification of different stages of sand production. As mentioned in the introduction, field observations of sand production can be classified in different stages of sanding according to Fjaer et al (2008) as transient, continuous and catastrophic sand production. The authors (Fattahpour et al, 2012) also proposed a similar classification from experimental results.
Fig. 3 shows the schematic view of different stages of sand production during tests. Sanding for different radial stress levels and different fluid flows during time is shown for the test on the sample D in Fig. 4. Different sanding types are determined for this sample based on the definition introduced by Fattahpour et al, (2012) in the following paragraphs.
1) Sand occurrence or sand initiation This is the first step of sand production and is assumed to be the result of a pure mechanical failure and the role of fluid flow is just carrying the produced particles in this type of sand production (Fattahpour et al, 2012). The same type of production can be seen in Fig. 4, for radial stresses of 60 and 75 bar.
2) Transient sand production In the experimental tests this step is very similar to transient sand production in the field experiences. It seems that the level of grain interlock between failed sand particles around the perforation controls the gradual removal of grains for different fluid flow rates. As shown in Fig. 4, transient production started in a radial stresses of 90 bar for sample D.
3) Semicontinuous production This stage was recognized by Fattahpour et al (2012), which was intermediate between transient and continuous sand production. According to them, in this stage the fluid flow role changed from just being a carrier to an eroding force. Therefore erosion became important only after reaching this stage.
As shown in Fig. 4, after the first increase in fluid flow rate under a radial stress of 105 bar sand was produced in several steps without any changes in the fluid flow rate. After the last change of the fluid flow rate at the same radial stress, the behavior of sand production became like continuous production, which will be described in the next paragraph.
4) Continuous production According to Fattahpour et al (2012), in this type of sand production, sanding is controlled by the erosion induced with fluid flow, which means that there should be a large plastic region created by high stress level, which can be easily eroded by fluid flow.
As shown in Fig. 4, there were some indications of a continuous production at the highest fluid flow rate, under the radial stress of 105 bar. When the radial stress increased to 120 bar, continuous sand production occurred, and this resulted in a complete closure of perforation. This type of production can be also called catastrophic sand production, which would be described as the next type of sanding.
5) Catastrophic sand production In the laboratory tests this type of production was often followed by a reduction in the radial pressure due to failure of a large region around the borehole.
Pet.Sci.(2012)9:343-353

347
A1 A2
B1 B2
C1 C2
D1 D2
Pet.Sci.(2012)9:343-353

348
Catastrophic sand production occurred at a radial stress level of 120 bar for sample D, which resulted in borehole blockage.
Several tests were performed on the samples at different stress levels for sanding and the experimental results are shown in Table 3.
Table 3 indicates that the ratio of sand initiation stress to UCS was 1.27-3.34. High apparent strength of the thick-walled cylinder samples is one of the controversial behavior in the literature. Based on failure theories, rock around the borehole of the thick-walled cylinder should fail when an external uniform stress equal to 0.5 UCS is applied to it. In
Fig. 2 Images from thin sections of tested samples. Left images were captured under crossed-polarized light and right ones were under plane light. The actual width of all the images was 3.3 mm and the height was 2.64 mm
E1 E2
F1 F2
G1 G2
similar tests by Papamichos (2006), where the cavity was continuous, cavity failure was observed at pressures 2.0-2.5 times higher than the UCS value. As mentioned before, this ratio for current test series is roughly around 2. This ratio was 1.6-2.1 for similar tests by Fattahpour et al. (2012). These results can be interpreted as an evidence for the inability of theoretical criterion based on failure theories to explain completely sand production around boreholes, where it seems that the rock near the cavity does not detach from the hole wall when it reaches its peak strength and instead of that yields and form a plastic region which is still stable by internal friction.
Pet.Sci.(2012)9:343-353

349
Results can be also presented as the total produced sand for all fluid flow rates for each confining stress level. These graphs can be used to study the sanding trend at different confining stresses. Fattahpour et al (2012) proposed an exponential relation to describe the relation between produced sand and confining stress. Fig. 5 shows the natural logarithm of produced sand at different stress levels. An exponential relation can also be fitted to the current data.
The test results for samples A, B, C and D are shown in Fig. 5 with solid lines. It can be seen that the curves are positioned one after another according to their grain size (D50). This means that for these four types of samples, any increase in the mean grain size results in a decrease in required radial stress for different sanding levels. It also means that the required confining stress for producing the same amount of sand (for example 1 g), for sample D is lower than sample A. In other words, it can be concluded that for the same confining stress, the amount of produced sand is higher for coarse grains in this type of samples (A to D). For samples E, F and G, with an increase in the mean grain size, the sample strength become higher and more resistant to sand production, i.e. the stress levels of sanding are higher for samples with
higher mean sizes. Dashed lines in Fig. 5 show the curves related to samples E, F and G.
The stress level at which 1 g of sand was produced is compared in Fig. 6. The stress level required for production of 1 g sand decreased with an increase in the grain size, up to the D50 of 0.3 mm. For coarser sandstone (D50> 0.3 mm) the stress level increased.
The change in behavior of samples with D50 around 0.3 mm can be explained by a change in the production mechanism. According to the observations of the current tests and other similar works, for samples with small grain sizes (D50<0.3 mm), shear bands are created around the hole after being plastified and hence sand is produced in the form of slabs. Fig. 7 shows the produced sand in the sand trap from sample A.
The differences between the required confining stresses for different sanding levels for fine grain samples (A, B, C and D) need more consideration. The bandwidth is related to the grain size. It seems that the shear bandwidth increases
Fig. 3 A schematic view of different stages of sand production during tests (Fattahpour et al, 2012)
35
16
14
12
10
8
6
4
2
0
Pro
duce
d sa
nd, g
/Con
finin
g st
ress
, MP
a
2.7
2.4
2.1
1.8
1.5
1.2
0.9
0.6
0.3
-2.66E-15
Confining stressProduced sandFluid flow rate
Catastrophicsand
production
Continuousproduction
Flui
d flo
w ra
te, L
/min
0 2000 4000 6000 8000 10000 12000
Time, s
Sandinitiation
Transientsand
production
SemicontinuousProduction
Table 3 Summary of radial pressures associated with different sanding levels
SampleSand initiation or
occurrencebar
Transient production
bar
Semi continuous sand production
bar
Continuous sand production
bar
Catastrophic sand production
bar
UCSbar
Sand initiation stress/UCS
A 90 120 135 135 135 45 2.00
B 90 ‒ 120 135 135 44 2.04
C 60 120 135 135 135 43 1.40
D 60 90 105 120 120 45 1.34
E 60 105 120 135 135 47 1.27
F 150 150 150 165 175 45 3.34
G 150 165/180 ‒ ‒ 195 45 3.34
Fig. 4 Sand production in sample D at different fluid flow rates and radial stresses (Black circles indicate points where the fluid flow rate was increased)
38
30
22
10
8
6
4
2
0
Pro
duce
d sa
nd, g
Time, s0 250 500 750 1000 1250 1500 1750 2000 2250 2500 2750
120 bar
105 bar
90 bar
75 bar
60 bar
Pet.Sci.(2012)9:343-353

350
with increasing grain size. This can be an explanation for the decrease in the required confining stress for different sanding levels for samples with larger grain size in the category of fine grain samples (A, B, C and D).
For samples with larger mean size (D50> 0.3 mm) (E, F and G), instead of the creation of shear bands, the plastic zone is changed to loose grains, which are interlocked together. It should be mentioned that formation of loose grain zones does not mean that all the grains become detached. Usually some grains remain linked to the neighboring grains and form a cluster of grains. Fig. 8 shows the produced sand in the sand trap after test on sample G. In this sample, produced sand is mainly in the form of grains and clusters.
Table 2 shows that samples with coarse grains (i.e. F and G) had lower cohesion and higher friction angle. Higher friction angle under the confined conditions around the borehole may lead to higher borehole failure stress. Although the condition around the borehole is unconfined, immediately inside the rock, the stress condition is not unconfined.
A scenario like the model proposed by Santarelli and Brown (1989) for granular and porous rocks like sandstone is expected for samples with large mean size in this study (samples E, F & G). The propagation of microcracks near the borehole wall creates a zone of interlocked loose grains. It should be emphasized again that depending on the different parameters like the blockage of microcracks, the development of microcracks could result in the formation of both individual loose grains and clusters of grains. The plastified zone in these samples is changed to an area of grains, interlocked together by friction between grains, which are not produced at the time of failure. Samples with large grains have a high apparent stability. This phenomenon is similar to sand arching, which is the result of interlocking of grains around the perforation entry point. The interlocked grains support each other until the external stress reaches a point, which forces the interlocked grains to drop. This production seems to be accompanied by crushing of sand grains. For samples
5
4
3
2
1
0
-1
-2
-330 60 90 120 150 180 210
Radial stress, bar
Increase in the grain size (E, F and G)
Increase in the grain size (A, B, C and D)
A
BC
D
E
F
G
ln(p
rodu
ced
sand
(g))
Fig. 5 Natural logarithm of produced sand under different radial stresses
Fig. 6 Stress level required to produce 1 g of sand for different samples
180
160
140
120
100
80
600 0.2 0.4 0.6 0.5 1.0 1.2 1.4
A
Stre
ss le
vel f
or 1
g s
and
prod
uctio
n, b
ar
D50, mm
B
C
DE
F
G
Fig. 7 Produced sand in the sand trap for sample A
68.5m m
Fig. 8 Produced sand in the sand trap for sample G
68.5 mm
Pet.Sci.(2012)9:343-353

351
E, F and G, a comparison between the grain size distribution of the sample itself and produced sand is shown in Fig. 9. It can be seen, that by increasing the grain size (sample E to sample F), the curve of produced sand is shifted to the left step by step in comparison to the initial curve of grain size distribution related to the sample itself. Fig. 9 shows coarser grain size for produced sand in comparison with the grain size before test, for sample E, which seems to be in the middle of changing the production mechanism, from the slab form to grain and grain clusters. Most of the produced sand for this sample consists of clusters of cemented grains. It seems that microcracks did not develop through all grains and hence, could not detach all grains. Cracks are forced to propagate due to blockage. According to the relatively wide-ranging grain size distribution of sample E, it seems to be a mixture of large and smaller grain sizes, so blockage is less probable than samples with larger grain size (samples F and G).
In sample F (Fig. 9), the percentage of grains smaller than 0.3 mm is about zero, but this value for produced sand is about 5%. This means that some grains were crushed during production and these crushed grains were produced when the interlocked grain mass was forced to be produced by increasing external stress. Again for larger grain sizes produced sand shows higher percentage which is related to
clusters. For sample G (Fig. 9), percentage of clusters was very low, indicating that the crack propagation completely covers all grains and a complete loosening happened. The percentage of crushed parts also increased in comparison to sample F.
The above mentioned diagrams show the evolution from clusters to individual grain production. It should be mentioned that for other grain sizes similar diagrams cannot be drawn because the main part of the production in those samples comprises large weak slabs rather than individual grains.
Figs. 10 and 11 show the entrance holes of samples A and G after the test. Each figure is a typical example of different types of slab production due to the shear bands (Fig. 10) and individual grain production (Fig. 11).
E
F
G
100
90
80
70
60
50
40
30
20
10
00.01 1 100.1 Grain size, mm
Cum
ulat
ive
perc
enta
ge
100
90
80
70
60
50
40
30
20
10
00.01 1 100.1 Grain size, mm
Cum
ulat
ive
perc
enta
ge
100
90
80
70
60
50
40
30
20
10
00.01 1 100.1 Grain size, mm
Cum
ulat
ive
perc
enta
ge
Fig. 9 A comparison between the grain size distributions of the produced sand and the samples itself. Dashed lines are for the
sample and solid lines are for the produced sand
Fig. 10 Entrance of the hole after test for sample A
65mm
Fig. 11 Entrance of the hole after test for sample G
65mm
5 ConclusionsThe effect of grain size on sand production was studied
with tests on 7 synthetic samples with different D50, ranging from 0.09 mm to 1.28 mm. Different stresses and fluid flow rates in different steps were applied to the samples and the produced sand was measured continuously. Two different trends were determined for sand production based on change of sanding levels. For samples with fine grains (D50< 0.3 mm), the required stress for different sanding levels decreased
Pet.Sci.(2012)9:343-353

352
smoothly with increasing grain size. This means also that, for the same confining stress, the amount of produced sand was higher for coarse grains in these samples. On the other hand, for samples with coarser grain size (D50>0.3 mm) the required stress for different sanding levels increased dramatically with increasing grain sizes. This change can be explained by a change in the mechanism of production. For samples with fine grains, shear bands are developed around the hole after being plastified. Due to the dilation of shear bands, sand is produced in the slab form. The width of shear bands seems to increase with increase in grain size; therefore in samples with larger grains, slabs seem to be detached more easily. In samples with coarse grains, microcracks propagate in the plastic zone and make a mass of loose grains or cluster of grains. This mass of grains is interlocked together. This interlock and friction between the grains stop them from being produced, which causes a notably high stability for perforation. Interlocked grains are forced to be produced when the external stress reaches a threshold level. This type of production is accompanied by breakage of grains. It can be concluded that the failure and post failure behavior of sandstone around perforations is related to the mean grain size.
ReferencesAyd in A, Borja R I and Eichhubl P. Geological and mathematical
framework for failure modes in granular rock. Journal of Structural Geology. 2006. 28: 83-98
Bel l F G. Some petrographic factors relating to porosity and permeability in the Fell Sandstones of Northumberland. Quarterly Journal Engineering Geology. 1978. 11: 113-126
Bel l F G and Culshaw M G. A survey of the geomechanical properties of some relatively weak Triassic sandstones. In: Cripps J C, Coulthard J M, Culshaw M G, et al (eds), The Engineering Geology of Weak Rock. Engineering Geology Special Publication Geological Society, A. A. Balkema, Rotterdam. 1993. Volume 8, 139-148
Bel l F G and Culshaw M G. Petrographic and engineering properties of sandstone from the Sneinton Formation, Nottinghamshire, England. Quarterly Journal Engineering Geology. 1998. 31: 5-21
Bel l F G and Lindsay P. The petrographic and geomechanical properties of some sandstones from the Newspaper Member of the Natal Group, near Durban, South Africa. Engineering Geology. 1999. 52: 57-81
Bés uelle P, Desrues J and Raynaud S. Experimental characterization of the localisation phenomenon inside a Vosges sandstone in a triaxial cell. International Journal of Rock Mechanic and Mining Science. 2000. 37(8): 1223-1237
Bob ryakov A P and Revuzhenko A F. Experimental simulation of spiral slip lines on granular materials. Journal of Mining Science. 2009. 45(2): 99-104
Cas tro D J and Bell F G. An engineering geological appraisal of the sandstones of the Clarens Formation, Lesotho, in relation to tunneling. Geotechnical and Geological Engineering. 1995. 13: 117-142
Cer asi P, Papamichos E and Stenebråten J F. Quantitative sand-production prediction: Friction-dominated flow model. SPE Latin American and Caribbean Petroleum Engineering Conference, 20-23 June, 2005, Rio de Janeiro, Brazil (paper SPE 94791)
Cro ok T, Willson S, Yu J G and Owen R. Computational modelling of the localized deformation associated with borehole breakout in quasi-brittle materials. Journal of Petroleum Science and Engineering. 2003. 38(3-4): 177-186
Det ournay C. Numerical modeling of the slit mode of cavity evolution associated with sand production. SPE Annual Technical Conference and Exhibition, Denver, USA, 2008 (paper SPE 116168)
Det ournay C, Wu B and Tan C. Hydro-mechanical modeling of damage around borehole in laboratory experiments. Proceeding of the 6th North America Rock Mechanics, 2004. ARMA/NARMS 04-590, Texas, USA
Dob ereiner L and de Freitas M H. Geotechnical properties of weak sandstones. Geotechnique. 1986. 36: 79-94
Dyk e C G and Dobereiner L. Evaluating the strength and deformability of sandstones. Quarterly Journal Engineering Geology. 1991. 24: 23-34
Ewy R T and Cook N G W. Deformation and fracture around cylindrical openings in rock—I. Observations and analysis of deformations. International Journal of Rock Mechanics and Mining Sciences & Geomechanics Abstracts. 1990a. 27(5): 387-407
Ewy R T and Cook N G W. Deformation and fracture around cylindrical openings in rock—II. Initiation, growth and interaction of fractures. International Journal of Rock Mechanics and Mining Sciences & Geomechanics Abstracts. 1990b. 27(5): 409-427
Ewy R T. Yie ld and c losure of d i rec t iona l and hor izonta l wells. International Journal of Rock Mechanics and Mining Sciences & Geomechanics Abstracts. 1993. 30(7): 1061-1067
Fah y M P and Guccione M J. Estimating strength of sandstone using petrographic thin-section data. Bulletin of the Association of Engineering Geologists XVI. 1979. 16(4): 467-485
Fan tilli A P and Vallini P. Crushing failure in hollow cylinders made of quasi-brittle materials. Computers & Structures. 2010. 88(7-8): 426-436
Fat tahpour V, Moosavi M and Mehranpour M. An experimental rock mechanics investigation for sand production in oil fields. 45th U.S. Rock Mechanics/Geomechanics Symposium, June 26-29, 2011, San Francisco, California
Fat tahpour V, Moosavi M and Mehranpour M. An experimental investigation on the effect of rock strength and perforation size on sand production. Journal of Petroleum Science and Engineering. 2012. (86-87): 172-189
Fjæ r E, Cerasi P, Li L and Papamichos E. Modeling the rate of sand production. 6th North America Rock Mechanics Symposium (NARMS), 04-588, June 5 - 9, 2004, Houston, Texas
Fjæ r E, Holt R M, Horsrud P, et al. Petroleum Related Rock Mechanics (2nd edition). 2008. Elsevier
Hai ed A and Kondo D. Strain localization in Fontainebleau sandstone: Macroscopic and microscopic investigations. International Journal of Rock Mechanics and Mining Sciences. 1997. 34(3-4): 161.e1-161.e13
Hai mson B C and Song I. Laboratory study of borehole breakouts in Cordova Cream: A case of shear failure mechanism. International Journal of Rock Mechanics and Mining Sciences & Geomechanics Abstracts. 1993. 30(7): 1047-1056
Ham mad W. Modélisation non linéaire et étude expérimentale de la localisation dans les sables. Thèse de l’Université J. Fourier de Grenoble. 1991. France (in French)
Li L, Papamichos E and Cerasi P. Investigation of sand production mechanisms using DEM with fluid flow. EUROCK 2006. Taylor & Francis Group, London. 2006. 241-247
Muh lhaus H B and Vardoulakis I. The thickness of shear bands in granular materials. Geotechnique. 1987. 37(3): 271-83
Nou ri A, Vaziri H, Kuru E, et al. A comparison of two sanding criteria in physical and numerical modeling of sand production. Journal of Petroleum Science and Engineering. 2006. 50(1): 55-70
Ord A, Vardoulakis I and Kajewski R. Shear band formation in Gosford sandstone. International Journal of Rock Mechanics and Mining Sciences & Geomechanics Abstracts. 1991. 28(5): 397-409
Pet.Sci.(2012)9:343-353

353
Pap amichos E and Stavropoulou M. An erosion-mechanical model for sand production rate prediction. International Journal of Rock Mechanics and Mining Sciences. 1998. 35(4-5): 531-532
Pap amichos E, Tronvoll J, Skjaestein A, et al. Constitutive testing of a weak sandstone. Mechanics of Cohesive-frictional Materials. 2000. 5: 1-40
Pap amichos E, Liolios P and van den Hoek P J. Breakout stability experiments and analysis. Gulf Rocks 2004, the 6th North America Rock Mechanics Symposium (NARMS), June 5-9, 2004, Houston, Texas
Pap anastasiou P and Zervos A. Wellbore stability analysis: From linear elasticity to post bifurcation modeling. International Journal of Geomechanics. ASCE. 2004. 4(1): 2-12
Pap amichos E. Sand production physical and experimental evidence, 18th ALERT School – Geomechanical and Structural Issues in Energy Production. 2006. Aussois, France
Pap amichos E. Analysis of borehole failure modes and pore pressure effects. Computers and Geotechnics. 2010a. 37: 141-152
Pap amichos E. Borehole failure analysis in a sandstone under anisotropic stresses. International Journal for Numerical and Analytical Methods in Geomechanics. 2010b. 34(6): 581-603
Pap amichos E, Tronvoll J, Skjærstein A, et al. Hole stability of Red Wildmoor sandstone under anisotropic stresses and sand production criterion. Journal of Petroleum Science and Engineering. 2010. 72(1-2): 78-92
Pen berthy W L and Shaughnessy C M. Sand Control. SPE Series on Special Topics. Volume 1. 1992
Pla chik V. Influence of porosity and elastic modulus on uniaxial compressive strength in soft brittle porous sandstones. Rock Mechanics and Rock Engineering. 1999. 32: 303-309
Ros coe K H. The influence of strains in soil mechanics. Geotechnique. 1970. 16: 129-70
San tarelli F J and Brown E T. Failure of three sedimentary rocks in triaxial and hollow cylinder compression tests. International Journal of Rock Mechanics and Mining Sciences & Geomechanics Abstracts. 1989. 26(5): 401-413
Sca rpelli G and Wood D M. Experimental observations of shear bandpatterns in direct shear tests. Deformation and failure of granular materials. Rotterdam: Balkema, 1982. 473-84
Sha koor A and Bonelli R E. Relationship between petrographic characteristics, engineering index properties and mechanical properties of selected sandstones. Bulletin Association Engineering Geologists. 1991. 28: 55-71
Sha o J F and Khazraei R. Wellbore stability analysis in brittle rocks with continuous damage model. Rock Mechanics in Petroleum Engineering, 29-31 August 1994, Delft, Netherlands (paper SPE 28054-MS)
Sin gh S K. Relationship among fatigue strength, mean grain size and compressive strength of a rock. Rock Mechanics and Rock Engineering. 1988. 21: 271-276
Tro nvoll J and Fjær E. Experimental study of sand production from perforation cavities. International Journal of Rock Mechanics and Mining Sciences & Geomechanics Abstracts. 1994. 31: 393-410
Tro nvoll J, Kessler N, Morita N, et al. The effect of anisotropic stress state on the stability of perforation cavities. International Journal of Rock Mechanics and Mining Sciences. 1993. 30(7): 1085-1089
Tro nvoll J, Skjvrstein A and Papamichos E. Sand production: Mechanical failure or hydrodynamic erosion. International Journal of Rock Mechanics and Mining Sciences. 1997. 34(3-4): 291.e1-291.e17
Ulu say R, Turrell K and Ider M H. Prediction of engineering properties of a selected litharenite sandstone from its petrographic characteristics using correlation and multi-variate statistical techniques. Engineering Geology. 1994. 38: 135-157
Van den Hoek P J, Hertogh G M M, Kooijman A P et al. New concept of sand production prediction: Theory and laboratory experiments. SPE Drilling & Completion. 2000. 15(4): 261-273
Var doulakis I and Graf B. Calibration of constitutive models for granular materials using data from biaxial experiments. Geotechnique. 1985. 35(3): 299-317
Var doulakis I, Sulem J and Guenot A. Borehole instabilities as bifurcation phenomena. International Journal of Rock Mechanics and Mining Sciences & Geomechanics Abstracts. 1988. 25(3): 159-170
Var doulakis I and Sulem J. Bifurcation analysis in geomechanics. Blackie Academic and Professional. 1995
Yat es P G J. The material strength of sandstones of the Sherwood Sandstone Group of north Staffordshire with reference to microfabric. Quarterly Journal Geological Society. 1992. 25: 107-113
Zai tsev Y V. Inelastic properties of solids with random cracks. In: Mechanics of Geomaterials: Rocks and Concrete and Solids. Wiley, New York, 1985. 89-128
Zer vos A, Papanastasiou P and Vardoulakis I . Modelling of localisation and scale effect in thick-walled cylinders with gradient elastoplasticity. International Journal of Solids and Structures. 2001. 38(30-31): 5081-5095
(Edited by Sun Yanhua)
Pet.Sci.(2012)9:343-353