An Experimental Investigation of Crossflow Jet Influence ...
10
1 Copyright © 2010 by ASME Proceedings of ASME 2010 3rd Joint US-European Fluids Engineering Summer Meeting and 8th International Conference on Nanochannels, Microchannels, and Minichannels August 2-4, 2010, Montreal, Canada FEDSM-ICNMM2010-30684 AN EXPERIMENTAL INVESTIGATION OF CROSSFLOW JET INFLUENCE ON DILUTE GAS-SOLID FLOW IN A RECTANGULAR DUCT Fu Yao Wang Tong* Gu Chuangang Key Lab. for Power Machinery and Engineering (Ministry of Education), Shanghai Jiao Tong University, Shanghai, 200240, China (* Associate Professor and author of correspondence) ABSTRACT In this paper an experimental setup was built to investigate jet flow normal to a confined rectangular multiphase crossflow. In order to achieve uniform particle distribution, the inlet and transition channel were carefully designed and adjusted. The experiments were carried out with 2 test conditions, with Re c /Re jet of 7.9×10 4 /3.1×10 4 and 7.0×10 4 /1.8×10 4 . Four classes of particles were used in both of the test conditions. The planar gas flow field and particle distribution on the symmetric cross section were measured by DPIV system. Mean fluid velocity results and transient flow visualization images were used to analyze the jet influence on the gas flow field. In the transient images of some classes of particles, vortex structures were found to be similar but not exactly the same to the free jet structure. A new set of arithmetic was developed to distinguish particle spots from noisy raw images. The results getting from this arithmetic reveals the time-average particle concentration on the jet influence. The analysis proved that the jet control method may set a gas barrier in the flow field to influence the particle distribution. Such an effect is diameter-selective. The experimental results showed a good prospect on the application of wall jet control method in inertia separator. Key word: jet, crossflow, confined space, particle distribution 1 INTRODUCTION In the practical use of fluid machinery, the gas phase working material is inevitably mixed with small solid particles. The solid particles have greater inertia than the gas, so they cannot fully follow the gas phase path in the flow passage, and may collide with the solid wall and cause great damage to the high speed rotary machinery. To reduce such damage, inertia particle separator, which has great separation efficiency for large particles and causes low energy loss, is used in front of the fluid machinery for protection. But for small particles on the scale of 10 microns, because of their relatively low inertia, they may form a uniform distribution in the separator flow channel, which lead to a low separation efficiency. These tiny particles may jam the oil hole, stick to the blades and cause dynamic unbalance to the rotor. For safety consideration, traditionally some filter may be set before the engineering, but this cause great resistance to the flow, and raise burden to the power engineering. To improve the separation efficiency for small particles in inertia separator, we should first make efforts to cause concentration nonuniformity for the small particles in the flow channel, while not obviously affecting the large scale particle distribution. In the previous CFD works [1], we found that by adding a wall jet in the flow passage, the small particle concentration field may be affected. An obvious low concentration zone was formed in the flow field, which indicates that by adjusting the jet parameters we may form a protection zone in the separator flow passage, and help separating the small particles. Gas crossflow jet in a confined space [2] has been studied experimentally by Linscinsky et.al as the prototype of the dilute zone of a gas turbine combustor. The main focus about this single phase flow is on the mixing rate of the coolant jet flow with mainstream. The dynamics of particles in multiphase free jet has also been widely studied due to its importance for a broad range of practical applications [3], such as oil or pulverized coal jet. But, experimental investigation for the jet flow normal to a confined rectangular multiphase crossflow, which is the prototype of the jet flow structure in an inertia separator, is still rarely seen. In this paper we carried out such an experimental investigation, aiming at improving the understanding in this field and guiding the optimal design of wall jet control method in the inertia separator. 2 EXPERIMENTAL FACILITY In the gas-solid multiphase experiments, test sections were usually set up vertically [4,5], to prevent the particles sediment, gravity bias, or cross-trajectory effect. But the vertical test section takes great space and makes difficulties in the set up and operation. In the current study we tried to investigate the gas-solid multiphase flow in a horizontal test section. To prevent particle sediment the inlet and transition channels were carefully designed to make solid particles distribute almost uniformly at the symmetric plane in the original undisturbed state. And the small variance in particle distribution caused by 1 Copyright © 2010 by ASME Proceedings of the ASME 2010 3rd Joint US-European Fluids Engineering Summer Meeting and 8th International Conference on Nanochannels, Microchannels, and Minichannels FEDSM-ICNMM2010 August 1-5, 2010, Montreal, Canada FEDSM-ICNMM2010-30684
Transcript of An Experimental Investigation of Crossflow Jet Influence ...
1 Copyright © 2010 by ASME
Proceedings of ASME 2010 3rd Joint US-European Fluids Engineering Summer Meeting and 8th International Conference on Nanochannels, Microchannels, and Minichannels
August 2-4, 2010, Montreal, Canada
FEDSM-ICNMM2010-30684
AN EXPERIMENTAL INVESTIGATION OF CROSSFLOW JET INFLUENCE ON DILUTE GAS-SOLID FLOW IN A RECTANGULAR DUCT
Fu Yao Wang Tong* Gu Chuangang Key Lab. for Power Machinery and Engineering (Ministry of Education),
Shanghai Jiao Tong University, Shanghai, 200240, China (* Associate Professor and author of correspondence)
ABSTRACT
In this paper an experimental setup was built to investigate jet flow normal to a confined rectangular multiphase crossflow. In order to achieve uniform particle distribution, the inlet and transition channel were carefully designed and adjusted. The experiments were carried out with 2 test conditions, with Rec/Rejet of 7.9×10⁴/3.1×104 and 7.0×10⁴/1.8×104. Four classes of particles were used in both of the test conditions. The planar gas flow field and particle distribution on the symmetric cross section were measured by DPIV system. Mean fluid velocity results and transient flow visualization images were used to analyze the jet influence on the gas flow field. In the transient images of some classes of particles, vortex structures were found to be similar but not exactly the same to the free jet structure. A new set of arithmetic was developed to distinguish particle spots from noisy raw images. The results getting from this arithmetic reveals the time-average particle concentration on the jet influence. The analysis proved that the jet control method may set a gas barrier in the flow field to influence the particle distribution. Such an effect is diameter-selective. The experimental results showed a good prospect on the application of wall jet control method in inertia separator. Key word: jet, crossflow, confined space, particle distribution
1 INTRODUCTION
In the practical use of fluid machinery, the gas phase working material is inevitably mixed with small solid particles. The solid particles have greater inertia than the gas, so they cannot fully follow the gas phase path in the flow passage, and may collide with the solid wall and cause great damage to the high speed rotary machinery. To reduce such damage, inertia particle separator, which has great separation efficiency for large particles and causes low energy loss, is used in front of the fluid machinery for protection. But for small particles on the scale of 10 microns, because of their relatively low inertia, they may form a uniform distribution in the separator flow channel, which lead to a low separation efficiency. These tiny particles may jam the oil hole, stick to the blades and cause dynamic unbalance to the rotor. For safety consideration, traditionally
some filter may be set before the engineering, but this cause great resistance to the flow, and raise burden to the power engineering. To improve the separation efficiency for small particles in inertia separator, we should first make efforts to cause concentration nonuniformity for the small particles in the flow channel, while not obviously affecting the large scale particle distribution. In the previous CFD works [1], we found that by adding a wall jet in the flow passage, the small particle concentration field may be affected. An obvious low concentration zone was formed in the flow field, which indicates that by adjusting the jet parameters we may form a protection zone in the separator flow passage, and help separating the small particles. Gas crossflow jet in a confined space [2] has been studied experimentally by Linscinsky et.al as the prototype of the dilute zone of a gas turbine combustor. The main focus about this single phase flow is on the mixing rate of the coolant jet flow with mainstream. The dynamics of particles in multiphase free jet has also been widely studied due to its importance for a broad range of practical applications [3], such as oil or pulverized coal jet. But, experimental investigation for the jet flow normal to a confined rectangular multiphase crossflow, which is the prototype of the jet flow structure in an inertia separator, is still rarely seen. In this paper we carried out such an experimental investigation, aiming at improving the understanding in this field and guiding the optimal design of wall jet control method in the inertia separator.
2 EXPERIMENTAL FACILITY
In the gas-solid multiphase experiments, test sections were usually set up vertically [4,5], to prevent the particles sediment, gravity bias, or cross-trajectory effect. But the vertical test section takes great space and makes difficulties in the set up and operation. In the current study we tried to investigate the gas-solid multiphase flow in a horizontal test section. To prevent particle sediment the inlet and transition channels were carefully designed to make solid particles distribute almost uniformly at the symmetric plane in the original undisturbed state. And the small variance in particle distribution caused by
1 Copyright © 2010 by ASME
Proceedings of the ASME 2010 3rd Joint US-European Fluids Engineering Summer Meeting and 8th International Conference on Nanochannels, Microchannels, and Minichannels
FEDSM-ICNMM2010 August 1-5, 2010, Montreal, Canada
FEDSM-ICNMM2010-30684

2 Copyright © 2010 by ASME
Fig.1 Schematic of the experimental tunnel apparatus
experiment setup is eliminated in the post-processing of experiment data. The experiments were conducted in a turbulent test section of H × W × L=0.08 × 0.3m × 1m. The schematic of the experimental tunnel apparatus is shown in Fig.1.The gas flow rate was tested by the inlet flow meter. Particles were fed into the riser channel by a screw particle feeder with a consistent mass flow rate of 0.74g/s. This data was checked before and after each test, displaying a variance of not greater than 5%. Particles entering the riser channel have an initial downward velocity, and then were taken upward to the turning section on the effect of gas-solid drag force. In the riser channel, several wire-mesh screens were set to help solid particles mixing with the gas flow. After the flow passing the turning section, particles gather toward the up solid wall on the effect of centrifugal force. Particle cluster has a large average height in the channel. In the transition section, on the effect of gravity, particles may start sediment and lower the average height. But this process is uncontrollable and would take a long distance till the particle cluster’s average height become H/2. So several wire meshes screens were set in the transition section. By adjusting the number and position of the meshes, 5 screens with a distance of 100mm between each other, uniformity of particle distribution is reached to some extant in the symmetric plane in the test section, as shown in Chapter3.3. In the grid before the test section, particle vertical velocity was suppressed and particle vertical position entering the test section is fixed. The wall jet hole, with a diameter of D=10mm, is located at the center position on the downside solid wall. The jet flow carries no particles. Pictures were taken by the DPIV system on the symmetric section of the channel, as shown in Fig2.
Fig2 Schematic of the tested channel and symmetric section
After mixing with the main flow, the whole flow was discharged through a blower to a filter to recollect the particles and prevent environment pollution. All particle distributions and gas velocities were measured using DPIV, which record the particle transient distributions in images and get the gas velocity by cross-correlation calculation of tracer image pairs. For each class of particles used in each test condition, at least 200 pairs of images were recorded. The DPIV system is consisted with a Nd-YAG laser, frequency doubled to 532nm, series of optics to create a light sheet less than 1mm thick, a Kodak CCD of 4000×2096 pixels with 12-bit resolution, a synchronizer and a computer. Four classes of particles were used in the experiment. Table 1 shows the particle parameters. The diameter parameters were tested by Beckman Coulter Co. LS13 320 particle characterization analyzer. All four classes of particles were used in the two test conditions shown in Tabel2, and each test condition is carried out with and without jet flow. Parameters of Vmain, Vc and Vjet were tested by inlet flow meter, Pitot’s tube and hotwire respectively. There’re several major assumptions made in this study: 1) The temporal average fluid flow field does not change
while we adding different classes of particles. The particle
2 Copyright © 2010 by ASME

3 Copyright © 2010 by ASME
Symbol Material ρs(kg/m3) dm(μm) d10 (μm) d50 (μm) d90 (μm) τv (ms) P1 Titanium dioxide 3900 0.3 ~ 0.0011 P2
Glass 2500 31.85 16.47 31.99 44.84 7.83
P3 59.64 43.89 57.04 75.41 27.45 P4 114.3 92.34 113.5 138.6 100.81
Table1 Properties of particles used in the experiment
Vm(m/s) Vc(m/s) Vj(m/s) M Rec Rejet
TC-I 13.3±0.3 14.9±0.5 46.9±1.9 3.53±0.23 7.9×10⁴ 3.1×10⁴
TC-II 11.8±0.2 13.2±0.7 27.2±2.3 2.31±0.24 7.0×10⁴ 1.8×10⁴ Table2 Experimental parameters of the two test conditions
flow rate was kept consistent to be 0.74g/s, indicating a particle volume fraction of about 0.92‰ and 1‰ for the two test condition and volumetric flow rate in the test section of 1.23×10⁻⁵m3/(m2s), which is in the range of dilute flow. And the particle collisions with the wall and with each other were ignored as well.
2) The sample number of 200 pairs of fluid flow field and 200 transient images for the particle distribution is large enough to depict the time-average air flow field and particle distribution.
3) An order of magnitude analysis[6,7] has revealed that the forces caused by the virtual mass and the pressure gradient are of the order of density ratio ρg /ρs, and Basset force is of the order of (ρg /ρs)0.5. In the present study, ρg /ρs~4×10-4. Thus, the forces listed upside are not considered in the analysis.
4) In some previous studies [8], it is shown that Saffman forces and Magnus effects may affect the particle distribution while there is very large spatial velocity gradient. But 3D fluid vorticity and particle rotation velocity was not available in this experiment, so this effect is not analyzed in the present study.
5) In the 1m length channel flow with Vm of over 10m/s, which indicate the particles’ travelling time in the channel is on the scale of 0.1s. In such a little time period, the gravity effects on the particle velocity and vertical position are 0.0047m/s and 0.46mm respectively, if the initial vertical velocity is 0. It suggests that gravity has little effect on the particles’ distribution in our experiment while there’s no-jet. So the variance on the flow field and particle distribution on the streamwise direction in the no-jet condition is ignorable.
6) To diminish the static electricity effect, the whole experimental apparatus was winded with brass wires and firmly grounded. Any differences in the gas flow field and particle distribution between the no-jet flow and jet flow are only caused by the jet influence.
3 PRESENTATION AND DISCUSSION OF RESULTS
3.1 Gas flow field measured by PIV For each test condition, 200 pairs of tracer images were taken. The time intervals between two consecutive exposures for the two TCs are 40 and 60μs respectively. The space magnification is 0.0388mm/pixel. The interrogation zone is 32×32 pixels, with a 50% overlap between adjacent interrogations. Concerning the space magnification and interrogation region, the relative error of cross-correlation calculation is about 1% in our study [9]. By the correlation calculation, we got 200 transient 2D velocity fields on the symmetric cross section for each TC. By averaging the transient results, time-average velocity fields are available for both of the TCs. And the time-average main flow direction velocity U and vertical direction velocity V on different flow positions are shown in Fig.3 The equivalent velocity profile in the no-jet flow is drawn in dotted lines as comparison. From Fig.3, we could find that in the trailing region on the symmetric cross section, U is decreased, which indicated the jet effect as setting an obstacle for the main gas flow in the channel. And in the upside part of the channel, U is slightly raised. The velocity profiles of the two TCs’ flow field were obviously different. In TC-I, with a great ratio of jet velocity over main flow velocity, it shows kind of similarity of impinging jet, that the jet fluid impinged onto the upside solid wall and the jet influence covered the whole channel height. In Fig.3(b), the vertical velocity suggested the same state, V is positive in the whole channel height, which proved that jet gas flow impinged onto the upside solid wall. As a contrast, in TC-II, the jet influence is confined in a limited height. In Fig.3(d) the vertical velocity approached zero in the upside half of the channel, also indicated a limited range of jet influence. We connected the minimum U’s height coordinates in different streamwise positions, shown in Fig3 as red dash lines, this range was considered as a criterion for jet influence range in the symmetric section. Within about 10D downstream the jet
3 Copyright © 2010 by ASME
4 Copyright © 2010 by ASME
(a) U of TC-I
(b) V of TC-I
(c) U of TC-II
(d) V for TC-II
Fig.3 Mean flow field along the streamwise direction.
hole position, the jet disturbance in TC-I seems greater and cover a larger range than in TC-II. But, as the flow developed downstream, on the effect of fluid viscosity, the jet disturbance is dissipated. Though the jet velocity is much higher in TC-I and the local jet disturbance is also greater, it seems that on the symmetric section, the jet influence on the gas flow field dissipated more quickly in TC-I than in TC-II by comparing U and V profile in the flow positions over 10dj downstream the jet hole. It suggested that the jet flow loses much energy in the impingement to the solid wall, and the large vortex formed by
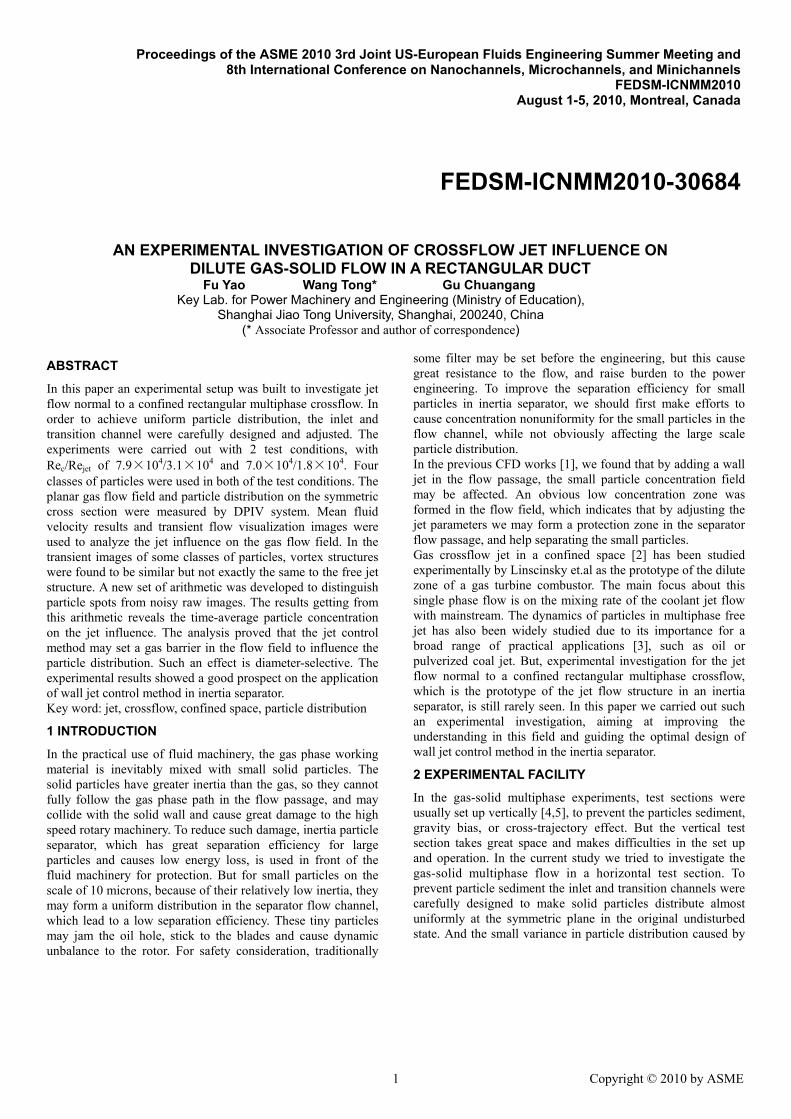
the jet flow quickly break up into small vortices in the downstream region. The small vortices had random rotary axis and vorticity, this explained why it showed less effect on the time-average velocity field though the jet flow in TC-I caused larger disturbance. 3.2 Transient particle preferential concentration Transient flow visualization images may freeze the jet structure not visible in the time-averaged data. Two images from the tracer images in both TCs and one picture of transient P2 particle distribution are shown here along with one of the visualization images of free jet from Ref.[10] as comparison. In TC-I, as the jet velocity is much greater than the main flow velocity, the jet flow influence dominated the flow structure near the jet hole. The jet vortex generation process is quite similar to the free jet flow, especially in near wall region where the main flow direction velocity is low. While the jet fluid moving out of the boundary layer zone, as contrast to the symmetric vortex structure in the free jet flow, the vortex structures, which are still formed and swirled in pairs like the free jet, is tilted to the main flow direction. The vortices swirl and involved more fluid to grow bigger, then they broke up and dissipated on the viscous effect. In the TC-II, the jet velocity is lower. So the effect of the main flow is much greater. The jet fluid moves upside to a distance about the half channel height, which is consistent to the analysis from mean flow field. The vortices on the upwind side of the jet structure were strengthened and involved more main flow fluid in the vortex swirling process. They grew bigger and broke off while transferring downstream. And the vortices on the downwind side of the jet structure were suppressed significantly. We think there’re two reasons for this suppression. Firstly, from Fig.3 we could see that the fluid velocity in the trailing area of the jet structure is low. This leaded to a relatively lower shear effect, which is the main cause for vortex generation and development. Secondly, the flow field in the trailing area of the jet structure is complex and strongly unsteady. There exists lots of vortices in the trailing region, these vortices affect and merge the jet structure on the downwind side.
a) P1,TC-I b) P2,TC-I c) P1,TC-II d) Free jet
Fig.4 Flow visualization images
4 Copyright © 2010 by ASME

5 Copyright © 2010 by ASME
In both of the TCs, P1 particles showed obvious preferential concentration. On the centrifugal force of the large vortex, P1 particles are ejected from the vortex core and cluster in the regions between consecutive vortices to depict the structures. In TC-I while the vortex structure is strong enough, P2 particles are also involved in and show preferential concentration phenomenon. But as the particles have larger inertia, P2 particles only cluster around large eddies, so the vortex structure visually depicted by P2 particles seems larger and more blurry. P2 particles in TC-II and P3,P4 particles in both TCs didn’t show such a phenomena. It indicated whether preferential concentration occurred in the flow we studied depended on both the gas flow condition and particle characteristics. From Fig.4 we could see that the tracer particles form nonuniform distribution at the outlet of the jet hole. According to Ref.[6], such nonuniformity is an error source in the PIV correlation calculation, the tracer pattern may bias the correlation peak. Also, there is a blank area of tracer particles in the flow field. This will also lead to an error to the flow field calculation. Fortunately, the tracers, as will be discussed below, quickly resume uniform distribution. That’s why the gas velocity within 10mm range downstream the jet hole is not discussed in this paper. 3.3 Noise elimination and particle distinguishing for DPIV photographs A particle distinguishing algorithm is employed in the commercial code of the PIV system. It’s based on the pixel intensity and spot size. Any pixel with an intensity greater than a given threshold value is associated with the object pixel. Some consecutive object pixels, if the number of the pixels is within a given range, form a particle spot. This method seems to be plausible. But there’re two reasons keeping us from using this method. First and foremost, the solid walls are included in our image scope. The low frequency noise from wall transmission and reflection, much stronger than the particle scatter light, is taken in the judgment and this leads to lots of faked particles near solid wall. Particle concentration results, which are not shown here, from the commercial code overestimate the particle sediment on the wall. Secondly, the particles we used in the experiment are small scale particles, which mean that they form spots with a diameter on the same scale of one pixel. From the optic calculation [11], a single particle with a diameter of dp, form a spot of an equivalent diameter of:
2 # 2 2(2.44(1 ) ) /e pd d Mag f Magλ= + + (1)
The parameters in the optic setup used for this study included: M=1/4.85, l=532nm and f#=5.6. So the mean spot equivalent diameters of the 4 classes of particles are 42.5, 52.0, 73.5, 117.9μm respectively. While the particle diameter is on the scale of λ, the particle spot is formed most by laser diffraction. And while the particle diameter is much larger than λ, the particle spot is formed mainly by particle scattering. All the
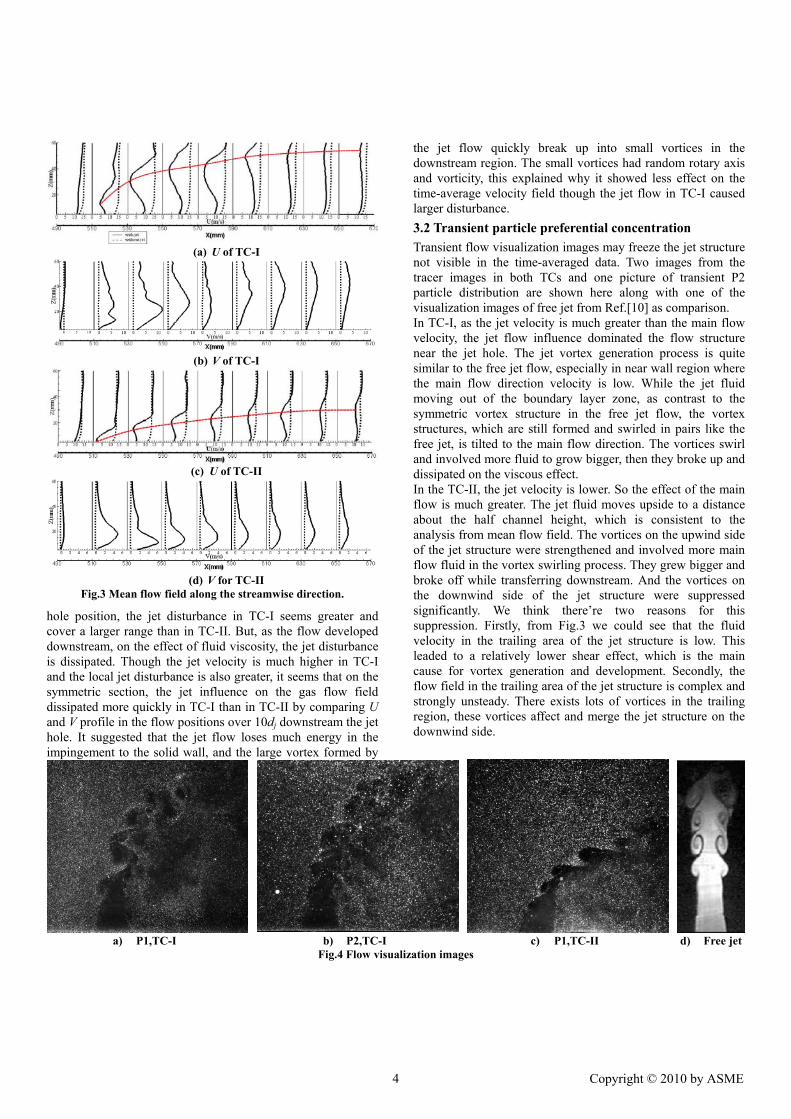
particle spot diameters here are within 1 to 3 pixels. It’s hard to distinguish among all different classes of particles from spot size. This is also why we cannot add both tracers and solid particles into the experiment channel simultaneously. So, in this paper we tried to develop a new set of algorithms to distinguish particles from DPIV images. In the image preprocessing, all the 12-bit intensity DPIV images were read into the MATLAB software as an intensity matrix, and were divided by 212 for unitary process. The mean intensity of all the pixels [Im], shown in the image form in Fig.5, was subtracted from each image to eliminate the background noise. Then the intensity variance [Iv] for each class of particle images by each test condition was calculated and shown in Fig.6 with a proper intensity magnification for visual ease.
∗Fig.5 an example of [Im] picture
Fig.5 shows that all the particle spots and high frequency noise in the origin PIV images are weaken in [Im]. And the only clearly visible part is from the low frequency noise. It indicated that the low frequency noise zone could be judged from [Im]. And in Fig.6, the particle spots as well as the high frequency noise are augmented. And in each [Iv] of all the 4 classes of particles in both TCs, the particle information of all 200 images were collected in a single image. So we could intuitively observe the particle distribution and jet influence on the particles from Fig.6. Firstly, in the no-jet condition, the particle distributions are uniform on some extent. No blanking area or serious particle sediment were observed. Secondly, the jet influence in both TCs is kind of like setting a gas barrier in the flow field. Different particles showed great difference in their response to the barrier. Tiny particles could immediately respond to the local velocity change, and get a upward velocity. But due to their tiny inertia, the particles could travels around the gas barriers and reach the downstream region of the jet hole. So the low concentration region is small and only near the jet hole. Images taken from other downstream positions (not shown here) showed that the tiny particles downstream quickly resume uniform distribution, which is thought to be due to the particle response to turbulence dissipation. P2 particles are blocked by the gas barrier and in TC-I particles gather in a small region on the trailing edge of the jet hole, but in TC-II it doesn’t happen. This is thought to
∗Take P2 particle in test condition I as an example, and the same in the following text if not specially noted
5 Copyright © 2010 by ASME
6 Copyright © 2010 by ASME
a) P1, TC-I, without jet b) P1, TC-I, with jet
c) P2, TC-I, without jet d) P2, TC-I, with jet
e) P3, TC-I, without jet f) P3, TC-I, with jet
g) P4, TC-I, without jet h) P4, TC-I, with jet
i) P1, TC-II, without jet j) P1, TC-II, with jet
k) P2, TC-II, without jet l) P2, TC-II, with jet
m) P3, TC-II, without jet n) P3, TC-II, with jet
o) P4, TC-II, without jet p) P4, TC-II, with jet
Fig.6 [Iv] of all the 4 classes of particles by 2 test conditions with/without jet
be due to the symmetric streamwise vortex found in the channel on jet influence [1]. It indicated that larger jet velocity may cause stronger streamwise vortex structure and P2 particles only respond to the vortex with enough strength. P3 particles behave quite like P2 to form low concentration region. But as contrast to P1, the low concentration region starts from a relatively downstream position and in TC-I they didn’t respond to the streamwise structure like P2. For the largest particles we used in this study, P4 particles’ distribution shows the characteristic of great inertia. In both of the test conditions, P4 particles just penetrate through the gas barrier and travel downstream. Even in TC-I, the jet influence is limited both on the region and strength.
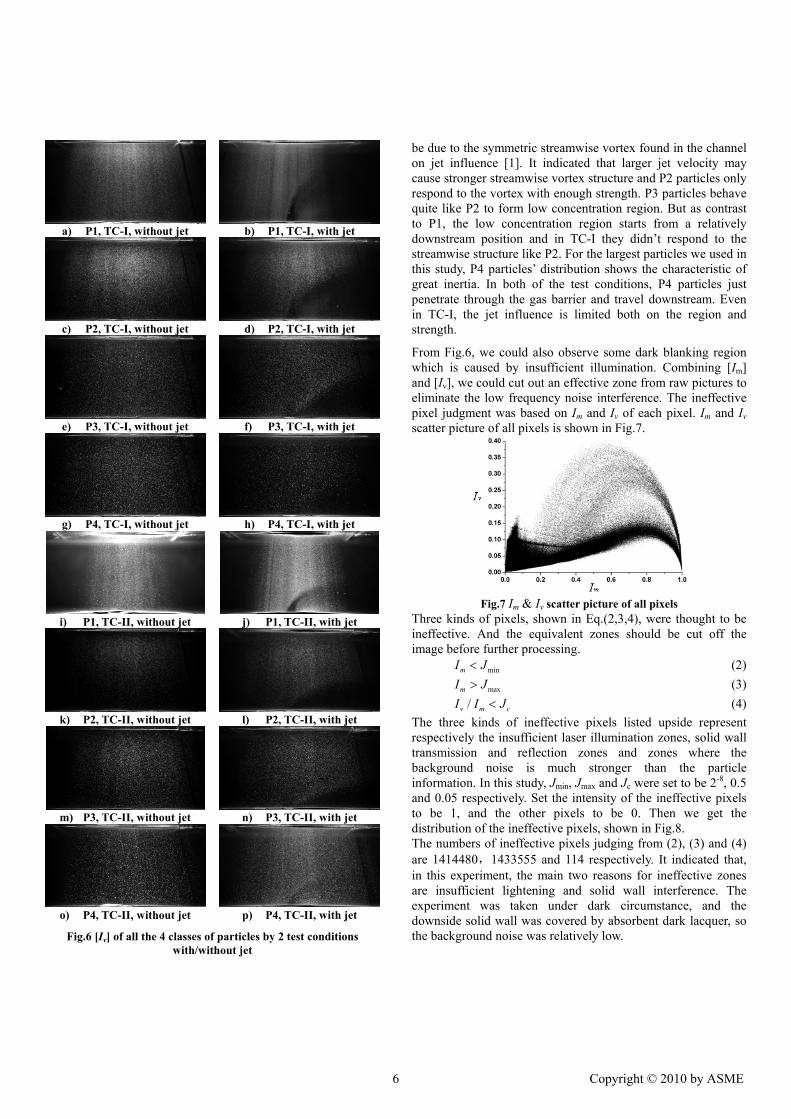
From Fig.6, we could also observe some dark blanking region which is caused by insufficient illumination. Combining [Im] and [Iv], we could cut out an effective zone from raw pictures to eliminate the low frequency noise interference. The ineffective pixel judgment was based on Im and Iv of each pixel. Im and Iv scatter picture of all pixels is shown in Fig.7.
Fig.7 Im & Iv scatter picture of all pixels
Three kinds of pixels, shown in Eq.(2,3,4), were thought to be ineffective. And the equivalent zones should be cut off the image before further processing.
minmI J< (2)
maxmI J> (3)/v m cI I J< (4)
The three kinds of ineffective pixels listed upside represent respectively the insufficient laser illumination zones, solid wall transmission and reflection zones and zones where the background noise is much stronger than the particle information. In this study, Jmin, Jmax and Jc were set to be 2-8, 0.5 and 0.05 respectively. Set the intensity of the ineffective pixels to be 1, and the other pixels to be 0. Then we get the distribution of the ineffective pixels, shown in Fig.8. The numbers of ineffective pixels judging from (2), (3) and (4) are 1414480,1433555 and 114 respectively. It indicated that, in this experiment, the main two reasons for ineffective zones are insufficient lightening and solid wall interference. The experiment was taken under dark circumstance, and the downside solid wall was covered by absorbent dark lacquer, so the background noise was relatively low.
6 Copyright © 2010 by ASME

7 Copyright © 2010 by ASME
Fig.8 ineffective pixels’ distribution
A rectangle zone of effective pixels was sketched out in Fig.8 to be the part of the images we take further processing with. By such a method we could quantify the effective zone for each class of particles in each test condition. But for consistencies we took 5 to 60mm in height as effective zone for all the image groups. By subtracting [Im] from every image in an individual class and cutting out the inefficient zone from each image, the image preprocessing was finished and low frequency noise was eliminated. About the particle distinguishing method, the algorithm in Ref[12] was used with some improvement to make it suit for the small scale particles. Five-point Gaussian blurring, shown in Eq(5), was used to eliminate the high frequency noise, mainly caused by multiple scatterings out of plane:
, , 1, 1, , 1 , 11 ( )
4newi j i j i j i j i j i jI cI I I I I
c − + − += + + + ++
(5)
For each image the blurring operation is repeated for np times. Larger np and smaller c lead to stronger blurring effect. For the 4 classes of particles we chose the blurring parameters as shown in Table3.
Symbol dm(μm) c np P1 0.3 1 16 P2 31.85 1 8 P3 59.64 2 7 P4 114.3 8 4
Table3 parameters of Gaussian blurring process for different class of particles
Pixels satisfied Eq.(6) or Eq.(7) were considered to belong to an object.
2 2
2 20, 0new newd I d I
dx dy< < (6)
saI I> (7) In Ref[12], the author thought that for particles with a obviously larger scale than one pixel, taking lnInew instead of Inew in Eq.(6) would assign more grayscale pixels to the objects thus making particle shapes smoother. But as for the small scale particles in this paper, as stated before, the particle spot size is on the same scale of one pixel, and larger than the actual size of the particle. So we take Inew in Eq.(6) for the small scale particles to weaken the light diffraction effect. Then we get a
polarized matrix [K] for each image, with value 1 on the object pixels and 0 on the other pixels. The effect of blurring and polarization is shown in Fig.9. Each picture is a magnified picture of 100×100pixel2 zone.
(a) P1
(b) P2
(c) P3
(d) P4
Fig.9 Origin, blurred and polarized image for different class of particles
From the polarized image, consecutive object pixels, under a threshold size, were considered to be a particle spot. Particle spot size were calculated in Eq(1), so the threshold size for P1, P2, P3 and P4 are 4, 9, 16 and 25 respectively. As the thickness of the laminated laser is larger than the particle diameters, by setting a threshold maximum size, large particle spots consisted by particle overlap are eliminated. So the arithmetic here is only suitable for dilute small scale particle images. Particle centroid position is calculated from the mean coordinate of the pixels form a particle spot. 3.4 Particle distributions in the TCs with and without jet Using the arithmetic stated in Chapter.3.3, we could start a quantitative analysis on the particle distribution in the test channel with and without jet influence. As stated in the assumptions in Chapter.2, in the no-jet conditions, we ignore the particle concentration variation in the streamwise direction. Count the number of particles in an appointed height range (1mm here) we get the amount of particles by channel height Np(Z) and the relative particle concentration in the no-jet condition PC(Z):
( ) ( ) /p pPC Z N Z N= (8) shown in Fig.10 as the dispersed symbols.
7 Copyright © 2010 by ASME

8 Copyright © 2010 by ASME
a) TC-I b) TC-II Fig.10 Relative particle concentration profile by the height
direction without the jet influence
There seems to be more oscillation for the distribution of P3 and P4 particles, this may be due to the relatively less number of particles counted. The mean numbers of counted particle from 200 images for the four different classes were 15.6, 35.3, 70.1 and 352/mm2 respectively. As the particle mass flow was kept consistent, the number of particles with larger diameter is relatively less. This also happen in Fig.11. It is shown in Fig.10 that PC(Z) varies between 0.4 and 2. It indicated that with the measures we took on the inlet and transition channels, small scale particles dispersed in the whole channel height, formed neither sedimentation nor blanking area. These data from no-jet condition will be used as contrast to the particle concentration in the flow with jet. With the same method, spatial particle number in the jet condition Npj(X,Z) was calculated. And relative concentration on the jet influence:
( , ) ( , ) / ( ) / ( )j pj pjPC X Z N X Z N X PC Z= (9) is calculated and shown in Fig.11. PC(Z) is divided from the particle distribution with jet influence to diminish the effect of particle distribution nonuniformity by the height direction in the no-jet condition. The jet effect shows different effects to different particles. For P1, the influence is limited in a small region, and on turbulence dissipation effect, P1 particles quickly resume a uniform distribution again. The particle distribution is almost stable after about 10D. P2 particles formed obviously low concentration zone in both TCs, which is consistent to the observation from Fig.6. But it’s interesting that on the trailing edge of the jet hole, near the down side solid wall, P2 particles form a small cluster zone in TC-I, but it didn’t happen in TC-II. This could also be observed in Fig.6. P2 particles should not have enough inertia to travel across the gas jet barrier. It suggested this cluster zone is formed on the effect of streamwise vortex structure, which is not testable in this study but had already been observed in a previous CFD study. In TC- I, the streamwise vortex is strong enough to involve P2, but not in TC-II. This indicated that in
the real application of the wall jet control method, there exists an up limit to jet velocity to prevent strong streamwise vortex. P3 particles also has formed low concentration zone in the flow field near the downside solid wall. And after about 10dj downstream the jet hole, there is obvious solid sedimentation near the downside solid wall in TC-I. But such a phenomenon didn’t happen in TC-II, which also suggest an effect of the streamwise vortex structure. From Fig.3 we could see that the gas velocity in the trailing region of both test conditions is low. Particles entering this region were dragged by the gas phase and their kinetic energy decreased, this lead to a longer particle travelling time in the flow channel. Gravity effect is raised by time increasing. That’s why we could ignore gravity effect in the no-jet test conditions, but not in the jet conditions. P4 particle’s concentration, though showed some oscillation because of the relative less sample number, also reveal the large particle response to the jet influence. P4 particles showed little response to the jet flow in TC-II. Particles with great inertia traveled across the jet flow barrier to the downstream zone. In TC-I, P4 particles were influenced by the strong jet flow, but the effect was much less comparing to P2 and P3. As jet influences on different size of particles are much different, we could conclude that the wall jet control method is diameter-selective. Tiny particles could travel around the jet barrier, while large particles could go through, only the particles on the 10 microns scale would be blocked by the barrier and form an obvious low concentration zone. For P2, P3 and P4, the jet flow influence on particle distribution lasted for a longer distance than that on the gas flow shown in Fig.3. It reveals greater inertia of the particles than the gas phase. It indicated that though the control flow rate is usually much less than the main flow, the jet influence on the particle concentration field may last a long distance along the mainstream direction.
4 CONCLUSIONS
In this paper, an experimental setup was built to investigate non-reacting jet flow injected normal to a confined rectangular multiphase crossflow. 4 classes of particles were used in the 2 test conditions. Through the analysis of the experimental results, the following remarks could be obtained. 1) A new arithmetic of noise elimination and particle
distinguishing is developed in this paper to process the raw DPIV particle images. Time-average particle concentration is calculated using this arithmetic. The result revealed different jet effect on different particles, which suggest that the wall jet control method on particle distribution is a diameter-selective method. Tiny particles could travel around the jet barrier, while large particles could go through, only the particles on the scale of 10 microns were obviously affected by the jet flow.
8 Copyright © 2010 by ASME

9 Copyright © 2010 by ASME
a) P1
b) P2
c) P3
d) P4
Fig.11 Relative particle concentration in the jet influence
2) In the situations of large momentum jet, such as TC-I in this experiment, the jet flow impinged onto the upside solid wall. And jet influence on the gas flow field covered the whole channel height. The jet flow loses much energy in the impingement. This lead to a faster dissipation of jet influence. For the relatively lower momentum jet, the jet influence is confined in a specific height. A low mainstream velocity zone in the jet trailing area is created by the jet flow. Low particle concentration zone is found in the equivalent area, only for 10 microns scale particles.
3) From the transient flow visualization images, vortices in this study were found to be similar but not exactly the same to the free jet structures. The vortices were tilted and became unsymmetrical as compare to the free jet flow. In such coherent structures, P1 particles showed preferential concentration in both TCs. And P2 particles in TC-I also showed preferential concentration. But in the other tests
such a phenomenon didn’t occur, which indicate the occurrence of preferential concentration depends both on gas flow condition and particle inertia.
4) The experiment study suggested that wall jet is an effective control method for particle distribution, especially for the particles on the 10 microns scale. It could form an obvious and long distance low concentration zone in the flow field. It has a good prospect in separator application, as the jet influence the distribution of small particles which is hard to separate in the traditional facilities. By the mean time, large particles, of which the original separation efficiency was already acceptable, were merely affected if the jet parameters were chosen reasonably. Also, maybe this control method could be applied to the fluid machinery channel to form a particle blanking region and protect some sensitive local positions.
9 Copyright © 2010 by ASME

10 Copyright © 2010 by ASME
NOMENCLATURE
Roman symbols c = the central point weight in the
five point blurring process D = jet hole diameter
d10, d50, d90 = 10, 50, 90 percent of the particles in the tested class have a diameter less than these parameters respectively
de = particle spot diameter dm = mean diameter of the particle
class f# = f-number of the lensH = height of the test section Im = mean intensity of a single pixel
[Im] = mean intensity of all pixels Iv = intensity variance of a single
pixel [Iv] = intensity variance of all pixels
Jmin, Jmax, Jc = parameters for ineffective pixel judgment
[K] = polarized matrix of each image L = length of the test section
M = mass flux (blowing) ratio of jet to mainstream( /j j m mU Uρ ρ= )
Mag = magnification of the optic lens np = times of blurring repitition
Np(Z) = amount of particles by the height direction in the no-jet condition
Npj(X,Z) = spatial particles number in the jet condition
pN = mean value of Np(Z)
( )pjN X = mean value on the stream position of Np(X,Z)
PC(Z) = relative particle concentration in the no-jet condition
Rec = main flow Reynolds number( /cV H υ= )
Rej = jet flow Reynolds number( /jV D υ= )
Vc = main flow centerline velocity Vj = jet flow centerline velocity
Vm = main flow average velocity W = width of the test section
Greek symbols λ = wavelength of the laser light. υ = air dynamic viscosity
ρg = gas phase density ρs = solid particle density
vτ = relaxation time for particle velocity based on Stokes drag
coefficient ( 2 /18s mdρ μ= ) Glossary
DPIV = digital particle image velocimetry TC = test condition
ACKNOWLEDGMENTS
This research was supported by National Science Foundation under grant No. 50776056 and National High Technology Research and Development of China (863 Program, No. 2009AA05Z201).
REFERENCES
[1] Fu, Y., Wang T. and Gu, Ch.G., 2009, Computational and Theoretical Analysis on the Jet Influence to the Gas Flow Field Containing Small Particles. September, 2009 Jilin, China. Conference of Chinese Society of Engineering Thermophysics, 096139.
[2] Liscinsky, D.S. and True, B., 1993, Experimental investigation of crossflow jet mixing in a rectangular duct. 29th Joint Propulsion Conference and Exhibit. June,1993 Monterey, CA. 93-2037
[3] Fessler, J.R., Kulick, J.D. and Eaton, J.K., 1994, Preferential concentration of heavy particles in a turbulent channel flow. Phys. Fluids 6(11): 3742-3749.
[4] Fessler, J.R. and Eaton, J.K., 1997, Particle Response in a Planar Sudden Expansion Flow. Experimental Thermal and Fluid Science; 15:413-423
[5] Wu, X.Ch., Wang, Q.H., Luo, Zh.Y., Fang, M.X. and Cen, K.F., 2008, Experimental study of particle rotation characteristics with high-speed digital imaging system. Powder Technology 181: 21-30.
[6] Chung, J.N. and Troutt, T.R., 1988, Simulation of particle dispersion in an axisymmetric jet. J. Fluid. Mech. 186, 199-222.
[7] Sbrizzai, F., Verzicco, R., Pidria, M.F., Soldati, A., 2004, Mechanisms for selective radial dispersion of microparicles in the transition region of a confined turbulent round jet. Int. J. Multiphase Flow 30, 1389-1417.
[8] Cerecedo, L.M., Aisa, L. and Ballester, J., 2009, Experimental study on a non-dilute two-phase coflowing jet: Dynamics of particles in the near flow field. Int. J. Multiphase Flow 35, 468-483.
[9] Westerweel, J, 1997, Fundamental of digital particle image velocimetry. Meas. Sci. Technol. 8: 1379-1392
[10] Liang, H.ZH. and Maxworthy, T., 2005, An experimental investigation of swirling jets. J. Fluid Mech. Vol 525: 115-159.
[11] Forliti, D.J., Strykowski, P.J. and Debatin, K., 2000, Bias and precision errors of digital particle image velocimetry. Experiments in Fluids, 28:436-4
[12] Khalitov, D.A. and Longmire, E.K., 2002, Simultaneous two-phase PIV by two-parameter phase discrimination. Experiments in Fluids, 32:252-268.
10 Copyright © 2010 by ASME