
An experimental investigation into the fate of entrained ...
135
An experimental investigation into the ‘fate’ of entrained peritectic minerals in I-type granite magmas intruded at below 2kbar. By Sara Kathryn Zarrebini Thesis presented in partial fulfilment of the requirements for the Degree of Master of Science at Stellenbosch University. Supervisor: Prof. Gary Stevens Faculty of Science Department of Earth Sciences March 2016
Transcript of An experimental investigation into the fate of entrained ...

An experimental investigation into the ‘fate’ of entrained peritectic
minerals in I-type granite magmas intruded at below 2kbar.
By
Sara Kathryn Zarrebini
Thesis presented in partial fulfilment of the requirements for the Degree of Master of Science
at Stellenbosch University.
Supervisor: Prof. Gary Stevens
Faculty of Science
Department of Earth Sciences
March 2016

DECLARATION
i
Declaration
By submitting this thesis/dissertation electronically, I declare that the entirety of the work
contained therein is my own, original work, that I am the sole author thereof (save to the
extent explicitly otherwise stated), that reproduction and publication thereof by Stellenbosch
University will not infringe any third party rights and that I have not previously in its entirety or
in part submitted it for obtaining any qualification.
Date: March 2016
Copyright © 2016 University of Stellenbosch All rights reserved
Stellenbosch University https://scholar.sun.ac.za

ABSTRACT
ii
Abstract
Entrainment of a peritectic mineral assemblage, formed through the incongruent melting of
biotite and hornblende in a source of intermediate composition, has been proposed to account
for the fact that I-type granites are commonly more mafic in composition than the melts from
which they are derived. Magma consisting of variable proportions of melt and a distinct
peritectic assemblage (Pl + Cpx + Opx + Ilm ± Grt) has been proposed to explain the
substantial compositional range of I-type granitic rocks. Geochemical evidence to support the
entrainment of a peritectic assemblage includes the strong, positive correlation between Ti vs
maficity (atomic Fe + Mg) (with correlation coefficients typically higher than 0.9 for suites from
individual plutons), as well as the very weak correlation between K and maficity in all granitic
rocks. Despite this compelling geochemical evidence for the entrainment of a peritectic mineral
assemblage, there is distinct lack of both mineral textural and mineral compositional evidence
of these peritectic phases within I-type granites. In order to ascertain the ‘fate’ of the proposed
entrained peritectic phases; the mechanisms and reactions by which these phases equilibrate
with the surrounding magma, as well as the corresponding rates of these reactions needs to
be established. This research used experimental techniques to determine the kinetic
processes involved in the digestion of a high-pressure peritectic assemblage within a
granodioritic magma under plutonic conditions within the upper crust (~2kbar and 763 to
720°C). A synthetic silicate gel (representative of the melt fraction) was mixed with a
hypothetical, natural peritectic mineral assemblage (13.1Pl + 9.3Cpx + 1.1Opx + 0.8Ilm ±
5.7Grt) in a 7:3 ratio to form the experimental starting material. The peritectic mineral
assemblage comprised of natural minerals of suitable compositions that were crushed and
sieved to produce crystals with an average 200µm - 600µm size range. The 1.60 wt. % water
within the starting composition was accommodated as kaolinite, which was added to the
completed silicate gel in the correct stoichiometric proportions. The overall mineral-melt
mixture was intended to represent the bulk composition of an I-type granodioritic magma
produced by the fluid-absent melting of biotite and hornblende within an intermediate source
composition at 10kbar and 850 - 900°C. The starting material (melt + mineral mixture) was
loaded into gold capsules, which were then welded shut. The material was then reacted at
pressures of 1.90kbar and 1.40kbar and at temperatures of 763 – 723°C within a cold-seal
pressure vessel, with each experiment lasting 10 days. The findings of this research identified
two principal reaction processes by which the high-pressure peritectic minerals react out within
the experimental run products, namely; dissolution-precipitation and mineral-melt reactions.
A coupled dissolution-precipitation mechanism is proposed to account for the rapid re-
equilibration of ‘peritectic’ phases that are predicted (by phase equilibrium modelling) to be
Stellenbosch University https://scholar.sun.ac.za
ABSTRACT
iii
stable, but out of compositional equilibrium with the surrounding magma at the investigated
PT conditions. ‘Peritectic’ plagioclase was seen to dissolve completely and reprecipitate a
more albitic composition across all experimental pressure and temperature conditions, and
within the experimental run-time (10 days). Consequently, a coupled dissolution-precipitation
mechanism is inferred to be a sufficiently rapid and efficient process to account for the
predominantly magmatic origin of feldspathic crystals within natural granitic rocks. At
corresponding PT conditions, unstable mineral phases were seen to change both
compositionally and texturally according to a separate reaction process, i.e. reaction with the
surrounding melt portion. High pressure and temperature ferromagnesian minerals, such as
garnet and orthopyroxene, which were not stable phases in the magma at the condition of the
experiments were seen to react with the melt to produce reaction rims of biotite, which was a
stable phase in the magma. The rapid growth rate of biotite resulting from this process
suggests phaneritic textural features typically associated with granite bodies do not require
long residency times to form within upper crustal magma chambers. The persistence of both
garnet and orthopyroxene at the low pressure (1.40 – 1.90kbar) and temperature (763 - 720°C)
conditions of experimentation indicates that at these conditions the mineral-melt reactions
were too ‘sluggish’ to completely digest these phases. The rapid dissolution-precipitation rates
of plagioclase within the experiments suggests that where garnet and orthopyroxene crystals
are evident in natural granitic rocks these minerals bear no compositional or textural
resemblance to the originally entrained ‘peritectic’ phases. The findings of this research
corresponds well with the theory that I-type granites’ compositional trends form as a
consequence of a peritectic mineral assemblage (Pl + Cpx + Opx + Ilm ± Grt) being entrained
within a leucocratic melt. However, this research has far-reaching implications in terms of other
formational theories, such as; fractional crystallization, magma mixing at depth and restite
entrainment, that similarly involve the production of crystal-rich magmas at depth. Regardless
of which process is responsible for generating the vast compositional heterogeneity of I-type
granitic rocks, if the temperature conditions of the granitic magmas remain sufficiently high
(>700°C) the magma will have the propensity to either partially or fully equilibrate any crystal
component that is not in equilibrium with the surrounding magma.
Keywords: I-type granite, Peritectic Entrainment, Dissolution-Precipitation, Experimental
Stellenbosch University https://scholar.sun.ac.za

UITTREKSEL
iv
Uittreksel
Optel-en-meevoer van ‘n peritektiese mineraal versameling gevorm deur die ongelykvormige
smelting van biotiet en hornblende in ‘n bron van intermediêre samestelling, was voorgestel
om die I-tiepe graniet in ag te neem. Die I-tiepe graniet is oor die algemeen meer mafies in
samestelling as wat smelt is. Magma bestaan uit verskillende hoeveelhede van smelt en ‘n
spesifieke peritektiese versameling (Pl + Cpx + Opx + Ilm ± Grt) was voorgestel om die
aansienlike komposisionele reeks van I-tiepe graniet smelt te verduidelik. Geochemiese
bewyse om die optel-en-meevoer van die peritektiese versameling te ondersteun sluit in ‘n
sterk, positiewe korrelasie tussen die Ti vs mafiese (atomies Fe + Mg) (met ‘n
korrelasiekoëffisiënt wat gewoontlik hoër as 0.9 is vir rock groepe van individuele plutone)
asook die baie swak korrelasie tussen K en mafiese in alle graniet klippe. Ten spyte van
hierdie geochemiese bewyse van die optel-en-meevoer van die peritektiese mineraal
versameling, is daar ‘n duidelike gebrek van bewyse vir beide mineraal tekstuur en mineraal
komposisie van hierdie peritektiese fases in die I-tiepe graniet. Om die ‘lot’ van die
voorgestelde optel-en-meevoer peritetiese fases te bepaal, moet die meganismes en reaksies
van hierdie ewewigsfases, sowel as die magma in die omliggende en hul ooreenstemmende
tempos, bepaal word. Hierdie navorsing het van eksperimentele tegnieke gebruik gemaak om
die kinetiese prosesse te bepaal. Die prosesse is betrokke in die vertering van ‘n hoë druk
perifiese mineraal versameling in ‘n granodioritiese magma onder plutoniese omstandighede
in die boonste kors (~2kbar en 763 tot 720°C). ‘n Sintetiese silikahouende gel
(verteenwoordiger van die smelt fraksie) was gemeng met ‘n hipotetiese, natuurlike
peritektiese mineraal versameling (13.1Pl + 9.3Cpx + 1.1Opx + 0.8Ilm ± 5.7Grt) in ‘n 7:3
verhouding om die eksperimentele begin materiaal te vorm. Die peritektiese mineraal
versameling bestaan uit natuurlike minerale van geskikte komposisies wat vergruis en gesif
was sodat die kristalle ‘n gemiddeld grootte van 200µm - 600µm het. Die 1.6 wt. % water in
die begin komposisie was geakkommodeer as kaoliniet, wat bygelas was om die
silikahouende gel in die regte stoïgiometriese proporsies volledig te maak. Die hele mineraal
mengsel was bedoel om die mederheid komposisies van ‘n I-tiepe granodiorite magma voor
te stel en was geproduseer by die vloeistof-afwesige smelting van biotiet en hornblende in ‘n
intermediêre bron komposisie by 10 kbar en 850 - 900°C. Die begin materiaal (smelt +
mineraal mengsel) was in ‘n goue capsule gelaai, wat dan toe gesweis was. Die materiaal het
gereageer by ‘n druk van 1.9 kbar en 1.4 kbar en by die temperatuur van 763 - 720°C wat in
‘n koue geseëlde drukvat geplaas was met elke eksperiment wat 10 dae lank geduur het. Die
resultate van hierdie navorsing identifiseer twee beginsel reaksie prosesse, ontbinding-
neerslag en minerale-smelt hidrasie reaksies, waar die hoë druk peritektiese minerale reageer
in die eksperimentele resultante. ‘n Gekoppelde oplossings-presipitasie meganisme is
voorgestel om die vinnige herewewigsproses van peritektiese fases in ag te neem wat
voorspel is (deur fase ewewig modellering) om stabiel te wees, maar uit komposisionele
ewewig saam met die magma in die omliggende gebied by die ondersoekte PT
Stellenbosch University https://scholar.sun.ac.za

UITTREKSEL
v
omstandighede. Peritektiese plagioklaas was gesien en het heeltemal opgelos en neerslag ‘n
meer albeitiese komposisie oor al die eksperimentele druk en temperatuur omstandighede,
asook in die eksperimentele looptyd (10 dae). Gevolglik is ‘n gekoppelde oplossings-
presipitasie meganisme afgelei as ‘n effektiewe proses teen voldoende tempo om die
oorwegende magmatiese oorsprong van feldspatiese kristalle in natuurlike graniet klip waar
te neem. By ooreenkomstige PT omstandighede was daar onstabiele mineraal fases gesien
wat volgens die afsonderlike reaksie fase in beide komposisionele en teksturele minerale
verander het, bv. reaksies met die omgewind smelt proporsies. Hoë druk en temperatuur
minerale met hoë Fe en Mg konsentrasies, soos granaat en ortopirokseen, was nie in stabiele
fases in die magma by die omstandighede van die eksperiment nie en waargeneem dat dit
reageer met die smelt om reaksie rande van ‘n stabiele biotiet fases te vorm. Dit was
waargeneem dat ortopirokseen in laer druk eksperimente (1.40 kbar) reageer met die
omliggende smelt proporsie om biotiet vervang ortopirokseen te vorm teen ‘n spoed van
omtrent vier keer stadiger as die herewewig van peritektiese plagioklaas by die oplossings-
presipitasie proses. Die vinnige groeitempo van biotiete, as gevolg van hieride proses, stel
voor dat ‘phaneritic’ teksturele funksies wat tipies geassosieer word met graniet liggame,
vereis nie lang verblyf tye om te vorm in die boonste kristal magma kamers nie. Die volharding
van beide granaat en ortopirokseen by die lae druk (1.40 – 1.90kbar) en temperatuur (763 -
720°C) omstandighede van eksperimentasie toon dat by hieride omstandighede van
eksperimentasie die mineraal-smelt hidrasie reaksies was te trae om volledig te verteer in
hierdie fases. Die vinnige oplossings-presipitasie tempos van plagioklaas in die eksperimente
dui duidelik aan dat granaat en ortopirokseen kristalle in natuurlike graniet klippe is. Hierdie
minerale hou geen komposisionele of teksturele ooreenkoms met die oorspronklike opgetel
en weggedra peritektiese fases nie. Die resultate van die navorsing stem goed ooreen met
die teorie dat I-tiepe graniete komposisionele tendense vorm as ‘n gevolg van ‘n peritektiese
mineraal versameling (Pl + Cpx + Opx + Ilm ± Grt) wat opgetel en weggedra is in ‘n
leukokratiese smelt. Maar hierdie navorsing het verreikende gevolge in terme van ander
magmatiese teorieë, bv. fraksionele kristalisering, magma vermenging in diepte en die optel-
en-meevoer van die oorblywende minerale uit die bron, wat soortgelyk die produksie van
kristalryk magmas in diepte insluit. Ongeag van watter van hierdie prosesse verantwoordelik
is vir die generering van die oorgrote komposisionele heterogeniteit van I-tiepe graniet klippe,
as die temperatuur omstandighede van die graniet magmas by voldoende hoë hoeveelhede
bly (>700°C), dan sal die magma die geneigdheid hê om gedeeltlik of heeltemal ewewig te
bereik met enige kristal komponent wat nie in komposisionele ewewig met die omliggende
magma is nie.
Sleutelwoorde: I-tipe granaat, Peritektiese Optel-en-Meevoer, Oplossings – Presipitasie,
Eksperimentele
Stellenbosch University https://scholar.sun.ac.za

ACKNOWLEDGEMENTS
vi
Acknowledgements
This research was funded by the South African National Research Foundation (NRF) in the
form of grant funding to Professor Gary Stevens via the SARChI programme and an MSc
bursary to Sara Zarrebini. Gautier Nicoli provided the Limpopo granulite samples from which
the ‘peritectic’ minerals utilized within this research were obtained.
I would like to extend my sincerest thanks and appreciation to my supervisor, Professor Gary
Stevens for guiding me through the last three years of my academic career. Your mentorship,
patience, and insights into the granite topic were paramount in the completion of this thesis.
Stellenbosch University https://scholar.sun.ac.za
vii
Table of Contents
Declaration ............................................................................................................................. i
Abstract..................................................................................................................................ii
Uittreksel ............................................................................................................................... iv
Acknowledgements ............................................................................................................... vi
List of Figures ....................................................................................................................... ix
List of Tables ........................................................................................................................ ix
List of Abbreviations .............................................................................................................. x
Chapter 1: Introduction ...................................................................................................... 1
Chapter 2: I- vs. S-type Granites ....................................................................................... 4
2.1 A Geochemical Perspective ......................................................................................... 5
2.1.1 Major Element Chemistry ............................................................................... 10
2.1.2 Trace Element Chemistry............................................................................... 12
2.2 Geodynamic Environments ........................................................................................ 14
Chapter 3: Explaining Granite Geochemistry ................................................................... 16
3.1 Compositional Variation of Granitic Melts .................................................................. 16
3.1.1 Chemical Heterogeneity in the Source ........................................................... 16
3.1.2 Pulsed Melt Extractions from a Progressively Melted Source ......................... 16
3.2 Models of Formation .................................................................................................. 17
3.2.1 Source Inheritance Models ............................................................................ 17
3.2.2 Magma-Mixing ............................................................................................... 24
3.2.3 Assimilation ................................................................................................... 26
3.2.4 Fractional Crystallization ................................................................................ 27
3.3 Concluding Remarks ................................................................................................. 28
Chapter 4: Experimental Design ...................................................................................... 29
4.1 Analytical Techniques ................................................................................................ 30
4.2 Phase Equilibrium Modelling – A Rationale of Experimental Techniques ................... 31
4.3 Experimental Methodology ........................................................................................ 38
Stellenbosch University https://scholar.sun.ac.za

viii
Chapter 5: Results........................................................................................................... 47
5.1 Mineral and Melt Compositions .................................................................................. 48
5.2 Textures in the Experimental Run Products ............................................................... 61
5.3 Mineral and Textural Descriptions.............................................................................. 67
Higher Pressure Experiments (1.90kbar) ..................................................................... 67
Lower Pressure Experiments (1.40kbar) ...................................................................... 74
Chapter 6: Discussion and Interpretation ......................................................................... 78
6.1 Non-Equilibrium Studies ............................................................................................ 78
6.2 Mineral Kinetic Processes ......................................................................................... 80
6.2.1 Dissolution-Precipitation Mechanism ................................................................... 80
6.2.2 Mineral-Melt Reactions........................................................................................ 89
6.3 Melt Compositions .................................................................................................... 98
6.4 Phase Equilibrium Modelling vs. Experimental Findings .......................................... 101
6.5 Implications for Natural Systems ............................................................................. 111
Chapter 7: Conclusions and Recommendations ............................................................ 115
7.1 Conclusions ............................................................................................................. 115
7.2 Summary of Contributions ....................................................................................... 115
7.3 Future Research ...................................................................................................... 116
References ....................................................................................................................... 117
Appendix ........................................................................................................................... 123
Stellenbosch University https://scholar.sun.ac.za

ix
List of Figures
Figure 1 - Major and Trace Element Compositional Arrays for I- and S-type Granitic Rock Suites .................... 7
Figure 2 - Chondrite Normalized REE Plots ....................................................................................................... 8
Figure 3 - Trace Element Spidergram ............................................................................................................... 9
Figure 4 - Pseudosection 1 ............................................................................................................................. 34
Figure 5 - Pseudosection 2 ............................................................................................................................. 35
Figure 6 - Photograph of the Experimental Machinery ................................................................................... 42
Figure 7 - Schematic of the Standard Cold-Seal Pressure Vessel Set-up.......................................................... 43
Figure 8 - Cross-section of Inconel vessel (Calibration Experiment – Test 2) ................................................... 45
Figure 9 - Side profile of Inconel vessel base (Calibration Experiment – Test 2) ............................................. 46
Figure 10 - BSE SEM Images Experiment 1 (1.90kbar; 733°C).......................................................................... 62
Figure 11 - BSE SEM Images Experiment 2 (1.90kbar; 763°C).......................................................................... 63
Figure 12 - BSE SEM Images Experiment 3 (1.90kbar; 723°C).......................................................................... 64
Figure 13 - BSE SEM Images Experiment 4 (1.40kbar; 743°C).......................................................................... 65
Figure 14 - BSE SEM Images Experiment 5 (1.40kbar; 730°C).......................................................................... 66
Figure 15 - Schematic of Dissolution - Precipitation Mechanism in Plagioclase .............................................. 80
Figure 16 - Plagioclase Hypersolidus Stability Fields for an Average I-type Granitic Magma Composition. ..... 81
Figure 17 - Clinopyroxene Hypersolidus Stability Fields for an Average I-type Granitic Magma Composition.85
Figure 18 - Theoretical Dissolution Rates for ‘Peritectic’ Plagioclase .............................................................. 87
Figure 19 - Schematic of Reaction between Garnet and Melt to Produce Biotite ........................................... 89
Figure 20 - Garnet Hypersolidus Stability Fields for an Average I-type Granitic Magma Composition. ........... 92
Figure 21 -Orthopyroxene Hypersolidus Stability Fields for an Average I-type Granitic Magma Composition 97
Figure 22 - Bivariate Plots of Melt Major Element Compositions ................................................................... 98
Figure 23 - Modelled vs. Experimental Mineral Assemblages ...................................................................... 102
List of Tables
Table 1 - Synthetic Silicate Melt Composition ................................................................................................ 39
Table 2 - Peritectic Mineral Assemblage Bulk Composition ............................................................................ 40
Table 3 - Starting Bulk Composition ............................................................................................................... 40
Table 4 - Calibration Experiment Results (Test 1) ........................................................................................... 44
Table 5 - Calibration Experiment Results (Test 2) ........................................................................................... 45
Table 6 - Experimental PT Conditions and Mineral Assemblages ................................................................... 47
Table 7 - Peritectic Assemblage Mineral Compositions .................................................................................. 48
Table 8 - Experiment 1 Average Mineral Compositions .................................................................................. 50
Table 9 - Experiment 2 Average Mineral Compositions .................................................................................. 52
Table 10 - Experiment 3 Average Mineral Compositions ................................................................................ 54
Table 11 - Experiment 4 Average Mineral Compositions ................................................................................ 56
Stellenbosch University https://scholar.sun.ac.za

x
Table 12 - Experiment 5 Average Mineral Compositions ................................................................................ 58
Table 13 - Experimental Melt Average Compositions ..................................................................................... 60
Table 14 - Mineral Assemblage Summary .................................................................................................... 103
Table 15 - Predicted vs. Experimental Mineral Volume Percentages ............................................................ 105
Table 16 - Predicted vs. Experimental Mineral Compositions (1.90kbar) ..................................................... 109
Table 17 - Predicted vs. Experimental Mineral Compositions (1.40kbar) ..................................................... 110
List of Abbreviations
Mineral Abbreviations
Grt Garnet Cpx Clinopyroxene Bt Biotite Cam Clinoamphibole Opx Orthopyroxene Qtz Quartz Pl Plagioclase Ilm Ilmenite Spn Sphene Rt Rutile Hbl Hornblende Alm Almandine Garnet Pyr Pyrope Garnet Grs Grossular Garnet Sps Spessartine Garnet *Mineral Abbreviations based upon Whitney and Evans, 2010.
General Abbreviations
SEM Scanning Electron Microscope XRD X-ray Diffraction XRF X-ray Fluorescence BSE Backscattered Electron Image PAE Peritectic Assemblage Entrainment
Stellenbosch University https://scholar.sun.ac.za

CHAPTER 1: INTRODUCTION
1
Chapter 1: Introduction
Granitic magmas, from which granites of average to mafic compositions are derived, are
undoubtedly mixtures of crystals and melt throughout their magmatic history (Clemens et al.,
2011; Clemens and Stevens, 2012; Stevens et al., 2007; Villaros et al., 2009a; White and
Chappell, 1977). These granitic magmas are formed by the fluid-absent, incongruent melting
of hydrous minerals, such as micas and amphiboles within their lower crustal sources
(Clemens, 2012; Clemens and Vielzeuf, 1987; Thompson and Connolly, 1995). The
aforementioned process has enabled the melt compositions of granitic magmas to be well
constrained by experiments (e.g., Stevens et al., 2007). In particular, the analysis of natural
melt inclusions in peritectic minerals within anatectic granulites (Taylor and Stevens, 2010),
and quenched melts from experimental studies (e.g., Montel and Vielzeuf, 1997), have shown
granitic melt compositions to typically be more leucocratic in composition than average
granites (Montel and Vielzeuf, 1997; Stevens et al., 2007; Taylor and Stevens, 2010). Even at
the highest inferred temperatures of crustal anatexis (~1000°C), the melts produced by
incongruent melting reactions would be too silicic to produce mafic granites, such as common
granodiorites (Clemens et al., 2011 and references therein). This, along with the fact that
granites are typically enriched in compatible elements, such as Mg, Fe, Ca, Ti etc. over
experimental melts and natural melt inclusions suggests that petrogenetic processes that
involve a crystal-rich granitic magma are able to account for the formation of granite
compositions that lie towards the mafic end of the compositional spectrum (Clemens et al.,
2011). The aforementioned is implicit in the leucocratic character of granitic melts (Montel and
Vielzeuf, 1997; Stevens et al., 2007; Taylor and Stevens, 2010). Where granites are more
mafic in composition than the melts from which they are derived they must exist as a
combination of melt and crystals ‘throughout’ their magmatic history.
Theories that revolve around the concept of deeper crustal, crystal-bearing magmas intruding
to higher levels include; restite entrainment (Chappell et al., 1987), peritectic mineral
entrainment (Clemens and Stevens, 2012; Clemens et al., 2011; Stevens et al., 2007; Villaros
et al., 2009a), magma mixing at depth (e.g., Chappell, 1996; Karsli et al., 2010; Vernon, 2007;
Zorpi et al., 1989) and fractional crystallization at depth (e.g., Soesoo, 2000). Each of these
hypotheses has been met with varying levels of contention within the literature. It should be
noted at this point that it is not the goal of this research to argue against the validity of any of
the above hypotheses. This research is instead seen to have general applicability within all of
these aforementioned petrogenetic processes, as it aims to determine the ‘fate’ of the high
temperature mineral assemblage within an I-type magma as it cools following ascent. The
peritectic assemblage entrainment (PAE) model has been utilized as the basis for this
Stellenbosch University https://scholar.sun.ac.za
CHAPTER 1: INTRODUCTION
2
research over the other aforementioned hypotheses, because it is both simple and quantifiable
in terms of the amount of entrained residuum that is required to produce a relatively mafic
granite composition. Its usage is further supported by its unique ability to successfully recreate
distinct geochemical trends that can be observed within all granitic rock varieties, specifically
the strong positive correlation between Ti and maficity (atomic Fe+ Mg) (Clemens and
Stevens, 2012; Steven et al., 2007).
It is the entrained peritectic mineral phases that are proposed to be one of the primary controls
in producing the geochemical heterogeneity of granitic rocks (Clemens and Stevens, 2012;
Stevens et al., 2007). In the case of I-type granitic rocks the strong positive correlation
between Ti, Mg#, Ca and maficity can largely be ascribed to the entrainment of peritectic
clinopyroxene, ilmenite and plagioclase (Clemens et al., 2011). And yet, there is little to no
textural or compositional evidence of these high pressure and temperature minerals within the
crystallized assemblages of granitic rocks (Clemens et al., 2011; Clemens and Stevens, 2012;
Clemens and Wall, 1988; Vernon et al., 2009). Instead, granites appear to consist largely of
crystals that are magmatic in nature (Clemens and Stevens, 2012; Vernon, 2010). This is a
key observation, which raises the question as to why granitic rocks typically do not display
textural or mineral compositional evidence of the entrained residuum, peritectic minerals or
the early formed high temperature magmatic phases that are implied to exist by the various
granite petrogenetic processes.
In order to understand the ‘fate’ of the entrained residuum, peritectic minerals or the early
formed high temperature magmatic phases, it is essential to understand the kinetics of the
reactions by which they may equilibrate. Entrained residuum is not necessarily in equilibrium
with the surrounding magma at the point of magma segregation. Partial melting of the source
rocks is able to produce both spatially, temporally and geochemically distinct batches of
granitic melts (McLeod et al., 2012), which result from sequentially higher temperature melting
reactions within the source material (Clemens and Stevens, 2012). At the point of magma
segregation the effective bulk composition is altered such that equilibrated phases within the
residuum are likely out of equilibrium with the segregated magma. The residuum produced in
one melting episode is therefore likely to be in both major and trace element disequilibrium
with the melt and residuum produced by a later melting event within the source. The system
responds to this disequilibrium by attempting to reduce its Gibbs energy, and in doing so is
able to spontaneously move in the direction of equilibrium (Giddings, 1991; Zhu and Anderson,
2002). Equilibrium is attained within the natural granitic system either through the complete
re-equilibration of entrained minerals to the composition and pressure-temperature conditions
of the surrounding magma (Clemens and Stevens, 2012; Clemens et al., 2011; Villaros et al.,
2009a). According to the literature, mineral phases, such as garnet, are able to equilibrate
Stellenbosch University https://scholar.sun.ac.za

CHAPTER 1: INTRODUCTION
3
rapidly and efficiently within ascending granitic magmas according to a simultaneous
dissolution-precipitation mechanism (Villaros et al., 2009a). Although Villaros et al., (2009)
determined that as the temperatures and melt volumes of the cooling magma decreases, so
does the efficiency of the dissolution-precipitation mechanism to re-equilibrate the entrained
phases to the surrounding magmatic conditions. During magma ascent and corresponding
crystallization the activities of both H2O and K2O are raised within the melt which allows for
anhydrous minerals, such as garnet and orthopyroxene, to be partially/completely replaced by
hydrous minerals; such as hornblende and biotite (Clemens et al., 2011). It is these
aforementioned dissolution-precipitation and mineral-melt reaction processes that are
proposed to be responsible for the textural and compositional destruction of the original,
entrained residuum within granitic magmas emplaced at upper crustal levels.
In spite of granite’s global presence and the abundance of research on granitic rocks, little is
understood about the kinetic processes involved in their magmatic evolution during their
ascent and later emplacement at higher crustal levels (Kemp et al., 2007). Furthermore, the
processes and reactions that are responsible for producing the equilibrium mineral
assemblages of I-type granitic rocks remain enigmatic. In order to resolve some of these
outstanding uncertainties, this study takes an experimental approach to determine the ‘fate’ of
entrained peritectic minerals within an I-type granite magma that is emplaced ‘instantaneously’
within an upper crustal magma chamber. The research will look to analyse and quantify the
compositional and textural changes experienced by an entrained ‘peritectic’ mineral
assemblage at the approximate granulite facies conditions of the magma’s emplacement (~2
kbar and ~800°C). The appositeness of a coupled ‘dissolution-precipitation’ mechanism, as
well as mineral-melt reactions, to either partially/fully equilibrate various entrained ‘peritectic’
phases within an I-type granite magma will be evaluated. Finally, comparisons between phase
equilibrium modelling and experimental datasets will be made to determine the relative degree
of equilibration within the experimental run products.
Stellenbosch University https://scholar.sun.ac.za

CHAPTER 2: I- VERSUS S-TYPE GRANITES
4
Chapter 2: I- vs. S-type Granites
The term ‘granite’, sensu stricto, describes a broad group of felsic, intrusive igneous rocks that
are typically characterised by mineral assemblages of quartz (≥20%) and feldspars (≥40%
alkali), and to a lesser degree amphiboles and micas (Clemens, 2012). However, this research
defines ‘granites’, sensu lato, including more mafic varieties, such as common granodiorites,
within its definition. Petrological examination of granitic rocks around the globe has shown
their compositions to vary substantially on both a metre to kilometre wide scale (Clemens and
Stevens, 2012). It is this substantial range in granite compositions that has prompted the
development of various granitic classification systems (see Barbarin, 1999; Chappell and
White, 1974).
I- and S-type granites are subsets of the alphabetical classification system developed by
Chappell and White (1974) after a ground-breaking study into the Palaeozoic batholiths of the
Lachlan Fold Belt (south-eastern Australia). The prefixes ‘I’ and ‘S’ denote the terms ‘igneous’
and ‘sedimentary’ respectively, and were intended by Chappell and White to describe the
types of sources from which the granites formed (Chappell, 1999; Chappell and White, 1974).
Noteworthy examples of I-type granite outcrops include; the Lachlan Fold Belt (Australia), the
Cape Granite Suite (South Africa), the Eastern Cordilleras (Columbian Andes) and Cordilleran
granites of western North America (Sierra Nevada, California). Consequently, the locality of
I-type granites appears to be largely restricted to areas associated with lithospheric
subduction, such as continental arcs (Athari et al., 2007; Barbarin, 1999; Clemens and
Stevens, 2012; Pearce, 1996). Accordingly, their protoliths are thought to be arc volcanic rocks
of intermediate composition, such as dacites/andesites (Castro, 2014; Chappell et al., 1998;
Clemens et al., 2011). In contrast, S-type granites are typically associated with syn-collisional
environments (Barbarin, 1999; Pearce, 1996; Pearce et al., 1984). Their protoliths are
suggested to be sedimentary in origin, such as metapelites and metagreywackes (Clemens et
al., 2011).
Stellenbosch University https://scholar.sun.ac.za

CHAPTER 2: I- VERSUS S-TYPE GRANITES
5
2.1 A Geochemical Perspective
Numerous studies have been conducted on both I-and S-type granites around the world.
These studies range from stable isotopic studies, field observations and petrological
experiments to theoretical modelling. Each one of these studies forms an integral piece in the
on-going attempt by the geological community to understand the greater puzzle that is granite
genesis.
The following figures provide the reader with a visual representation of the geochemical
differences between studied I- and S-type granite suites across South America, Europe and
Australia. The I-type granites are represented by squares, whilst the S-type granites are
denoted by triangles. The data used to create the graphs has been compiled from the literature
(Almeida et al., 2007; Antunes et al., 2008; Hine et al., 1978; Villaseca et al., 2009). For the
purposes of consistency attempts have been made to ensure that the majority of each suites’
data is from a single source. A comprehensive discussion relating the graphical data to a
broader literature base can be found after the diagrams.
LEGEND
Kosciusko Batholith (I-type Granites)
Kosciusko Batholith (S-type Granites)
Iberian Massif (I-type Granites)
Castelo Branco (S-type Granites)
Martins Pereira (I-type Granites)
Serra Dourada (S-type Granites)
Berridale – Kosciusko Batholith (I-type Granites)
Berridale – Kosciusko Batholith (S-type Granites)
Cooma Batholith (S-type Granites)
Stellenbosch University https://scholar.sun.ac.za

CHAPTER 2: I- VERSUS S-TYPE GRANITES
6
0.8
0.9
1
1.1
1.2
1.3
1.4
0 0.05 0.1 0.15
ASI
Fe + Mg
0
0.02
0.04
0.06
0.08
0.1
0.12
0.14
0 0.05 0.1 0.15
K
Fe + Mg
0
0.05
0.1
0.15
0.2
0.25
0.3
0.35
0.4
0 0.05 0.1 0.15
Al
Fe + Mg
0
0.002
0.004
0.006
0.008
0.01
0.012
0.014
0.016
0 0.05 0.1 0.15
Ti
Fe + Mg
0
0.02
0.04
0.06
0.08
0.1
0.12
0.14
0 0.05 0.1 0.15
Ca
Fe + Mg
0
0.02
0.04
0.06
0.08
0.1
0.12
0.14
0.16
0 0.05 0.1 0.15
Na
Fe + Mg
0
5
10
15
20
25
0 0.05 0.1 0.15
Na/
Ca
Fe + Mg
0
0.5
1
1.5
2
2.5
3
0 0.05 0.1 0.15
Na/
K
Fe + Mg
A. B.
C. D.
E. F.
G. H.
Stellenbosch University https://scholar.sun.ac.za

CHAPTER 2: I- VERSUS S-TYPE GRANITES
7
0
100
200
300
400
500
0 0.05 0.1 0.15
Rb
(p
pm
)
Fe + Mg
0
100
200
300
400
500
0 200 400 600
Rb
(p
pm
)
Sr (ppm)
Figure 1 - Major and Trace Element Compositional Arrays for I- and S-type Granitic Rock Suites Figures A-H are plots of various major element/element ratios versus maficity (atomic Fe + Mg per 100g of rock). Figures I-K are plots of trace elements against maficity. Figure L is a trace element plot of Rb versus Sr.
I. J.
K. L.
0
100
200
300
400
500
600
700
0 0.05 0.1 0.15
Zr (
pp
m)
Fe + Mg
0
100
200
300
400
500
600
0 0.05 0.1 0.15
Sr (
pp
m)
Fe + Mg
Stellenbosch University https://scholar.sun.ac.za

CHAPTER 2: I- VERSUS S-TYPE GRANITES
8
I-type Granite (Iberian Massif, Spain)
I-type Granite (Martins Pereira, Brazil)
I-type Granite (Kosciusko Batholith, Australia)
S-type Granite (Castelo Branco, Portugal)
Figure 2 - Chondrite Normalized REE Plots
Each colour region represents the overall range in REE values within an individual suite of rocks. Normalization standard is CI
Chondrite taken from McDonough and Sun, 1995. The y-axis of the graph denotes the log of the sample values obtained from the
literature. As ratios are typically asymetric, the log of the sample values have been taken in an attempt to restore normality to the data.
Stellenbosch University https://scholar.sun.ac.za
Stellenbosch University https://scholar.sun.ac.za

CHAPTER 2: I- VERSUS S-TYPE GRANITES
9
I-type Granite (Iberian Massif, Spain)
S-type Granite (Castelo Branco, Portugal)
Figure 3 - Trace Element Spidergram
Each colour region represents the overall range in Trace Element values within an individual suite of rocks. Normalization standard is CI
Chondrite taken from McDonough and Sun, 1995. The y-axis of the graph denotes the log of the sample values obtained from the
literature. As ratios are typically asymmetric, the log of the sample values have been taken in an attempt to restore normality to the data.
Stellenbosch University https://scholar.sun.ac.za
Stellenbosch University https://scholar.sun.ac.za

CHAPTER 2: I- VERSUS S-TYPE GRANITES
10
2.1.1 Major Element Chemistry
I-type granites are typically metaluminous (A/CNK < 1), and appear to range in composition
from mafic granodiorites to leucogranites (Clemens et al., 2011). These rocks are
characterised by a mineral assemblage which includes: biotite ± hornblende, with accessory
sphene and magnetite. Hornblende-bearing I-type granitic rocks can also contain
clinopyroxene within their assemblages (Brown, 2013; Clemens et al, 2011; Nedelec et al.,
2015). S-type granitic rocks are peraluminous (A/CNK > 1), and can range in composition from
mafic tonalities to leucogranites (Clemens, 2003). Although described as ‘two-mica’ bearing
granites, S-type granites are far more mineralogically diverse (Clemens and Wall, 1988) and
can contain an array of minerals including: muscovite ± biotite, garnet, cordierite,
aluminosilicates (andalusite/sillimanite), corundum, spinel, tourmaline and quartz (Clarke,
1981).
Geochemical analysis of exposed granitic rocks indicates that I-type granites are generally
more sodic than their S-type granite counterparts that are commonly potassium- rich (Brown,
2013). I-type granites lying towards the felsic end of the compositional spectrum contain >3.2
wt. % Na2O, whilst more mafic I-type granites contain >2.2 wt. %. In general I-type granites
typically have 3.5-5.5 wt. % K2O (Clemens et al., 2011) It has been suggested that the partial
melting of hydrous, calc-alkaline to high-K calc-alkaline metamorphic rocks are appropriate to
produce high-K I-type granite magmas. Whilst metabasaltic rocks are considered to be
unsuitable protoliths as they contain insufficient K2O (Roberts and Clemens, 1993). Clemens
et al., (2011, pg. 175) also propose that basaltic protoliths produce melts that are too sodic to
produce even “medium K-series” granitic magmas. Potassic-rich (K2O ~ 5 wt. %) S-type
granite rocks have Na2O values <3.2 wt. %, whilst those with lower Na2O values of <2.2 wt.
% typically have K2O values of 2 wt. % (Chappell and White, 2001). Figure 1 (F) (pg. 6)
demonstrates that at lower maficity values (<0.1) there is an overlap in the Na/K values for
both the I- and S-type rock suites.
Another important contrast between the two granite types relates to the Aluminum Saturation
Index (ASI). Relatively leucocratic I-type granites are weakly peraluminous (ASI value > 1.0),
becoming increasingly metaluminous (ASI value < 1.0) with increasing maficity (Fe + Mg)
(Clemens et al., 2011). Whilst their comparatively leucocratic S-type granite counterparts are
moderately to strongly peraluminous resulting in an ASI value typically above 1.1 (Clemens et
al., 2011; Harris et al., 1997). Analysis of both I- and S-type granites demonstrated an overlap
in ASI values between the two granite types. It is here that Clemens et al., (2011) postulate
that the similarity in ASI value equates to a closeness in composition between the two granites’
parental melts. The similarities in ASI values as proposed by Clemens et al., (2011) are
supported by Figure 1(H) (pg. 6) developed in the section above. In this graph the ASI value
Stellenbosch University https://scholar.sun.ac.za

CHAPTER 2: I- VERSUS S-TYPE GRANITES
11
is seen to range narrowly between 1.0 and 1.3 for the most leucocratic rocks within the chosen
I- and S-type granitic suites.
By analysing the bulk geochemistry of granites, Clemens et al., (2011) established there is a
positive correlation between increasing maficity (Fe + Mg) and increasing metaluminosity
within I-type granites. They attribute this relationship to the entrainment of the peritectic
mineral assemblage, specifically clinopyroxene, which results from the incongruent melting of
hornblende (Clemens et al., 2011). This is illustrated within Figure 1 (H) (pg. 6) where the I-
type granites of the Kosciusko Batholith show a weak, negative trend between maficity and
ASI, with a coefficient of determination equal to 0.60. At the lowest recorded maficity value
(0.03) for this suite the corresponding ASI value is 1.04, whilst at the highest maficity value
(0.14) the corresponding ASI value is lower at 0.94. Conversely the S-type granites of the
Kosciusko Batholith are shown to have a slightly weaker, but positive correlation with a
coefficient of determination equal to 0.45. The S-type trend is inferred to be a consequence of
the entrainment of peritectic garnet, ilmenite ± orthopyroxene within the melt (Stevens et al.,
2007).
Clemens et al., (2011) also determined there to be a strong positive correlation between Ti
and maficity in both I- and S-type granites. This relationship can be observed in Figure 1 (B)
(pg. 6). All suites within this graph show high correlation coefficients ranging from between
0.91 (Martins Pereira, I-type granites) to 1.00 (Serra Dourada, S-type granites). The coefficient
of determination for the suites is similarly high ranging from 0.79 (Martins Pereira I-type
granites) to 0.94 (Kosciusko Batholith S-type granites). As these values are not ideal (i.e. R2
= 1), the difference between the actual R2 value and the ideal R2 value indicates that the
change in ASI values (dependent variables) are not solely a consequence of the change in
maficity (independent variables). In the case of the Martin Pereira I-type granites
approximately 21% of the variation in Ti is unaccounted for by the change in maficity, and can
thus be ascribed to factors other than maficity. However, in the case of the Kosciusko S-type
granites the variation in Ti content within the rocks can be ascribed largely to the change in
maficity, as the R2 value is significantly closer to unity. At lower maficity values (<0.07) the Ti
versus maficity trends for both I- and S-type suites appear to be positioned closely around the
regression line, whilst at higher maficity contents (>0.07) there appears to be greater
dispersion of the values particularly within the I-type suites (Kosciusko Batholith and Martins
Pereira). The strong Ti versus maficity trend observed in the S-type granite suites is a direct
result of the entrained peritectic mineral assemblage mimicking the stoichiometry of the biotite
only melting reaction (Clemens et al., 2011). The greater dispersion of Ti values in I-type
granites at higher (>0.07) maficities can be ascribed to the fact that their magmas are formed
from the incongruent melting of both biotite and hornblende (Clemens et al., 2011). The
Stellenbosch University https://scholar.sun.ac.za

CHAPTER 2: I- VERSUS S-TYPE GRANITES
12
different trend lines seen in various I-type granite suites (see Kosciusko Batholith and Martins
Pereira) result from the differing proportions of biotite to hornblende within their sources
(Clemens, 2012). These behaviours are unlikely to arise from restite entrainment or mixing
with mantle derived magmas, as these processes would generate highly variable Ti:maficity
ratios across compositionally different granitic rocks (Clemens et al., 2011).
Clemens et al., (2011) also noted a weak, negative relationship between K and maficity in both
granite types, which can be seen clearly in Figure 1(P) on page 7. This weak trend is ascribed
to the fact that K is soluble within the melt and its concentration is dependent on the solubility
and proportion of the feldspathic material within the protolithic material (Clemens et al., 2011;
Clemens and Stevens, 2012).
Major element isotopes studies have proven to be useful tools to differentiate between I- and
S-type granites (O’Neil and Chappell, 1977). A study conducted by the University of Cape
Town examined the oxygen and hydrogen isotope geochemistry of the I- and S-type granites
of the Cape Granite Suite (CGS) (Harris et al., 1997). Their aim was to see if distinct
differences between the two granite subgroups did in fact exist. The I –type granites of the
suite were determined to have δ18O values of between 6.6 and 9.9‰ for quartz, whereas the
S-types were found to have between 9.5 and 11.4‰. From this it was determined that the
δmagma values for I-type granites were lower than those observed in S-type granites. These
noticeable differences, with minimal overlap, suggest that the I- and S- type granites of the
CGS formed from different, distinct protoliths. It is still unclear from the study the exact source
of the I-type granites within the region. However, the authors interpreted the average oxygen
isotope value of 7.8‰ to imply a meta-igneous source (Harris et al., 1997). This interpretation
corresponds well with Chappell and Whites’ (1974) initial surmising of I-type granites being
derived from meta-igneous sources.
2.1.2 Trace Element Chemistry
Stable isotope studies can also provide valuable insight into the nature of I- and S-type granite
protoliths. McCulloch and Chappell conducted a stable isotope study comparing the Nd and
Sr isotope characteristics of the I- and S- type granites found within batholiths of the Lachlan
Fold Belt. Each granite type has a distinct range of initial 87Sr/86Sr values; with I-types having
a range of values between 0.70453 and 0.7119. This was far more restricted than the ԐNd
values which vary significantly between 0.4 to -8.9. The authors hypothesize that the variation
in Sr and Nd values for the studied I-type granites indicates multiple protoliths of varying ages.
Age calculations on the I-type granites showed that they formed from a mantle-derived crust
that was produced ~ 1000 Ma before partial melting began to produce the granites (McCulloch
& Chappell, 1982). Both the ԐNd and 87Sr/86Sr values for S-type granites differ considerably
Stellenbosch University https://scholar.sun.ac.za

CHAPTER 2: I- VERSUS S-TYPE GRANITES
13
from the I-types. S-type granites have a range of ԐNd values of between-6.1 to -9.2, and a range
of initial Sr values of 0.7094 to 0.7184. In regards to the S-type granites they attributed the
variation to; differential amounts of chemical weathering of the protoliths, along with the overall
maficity concentration within the protoliths (McCulloch & Chappell, 1982). Attempts were
made to find stable isotope studies that provide major element data in order to establish the
relationship between 87Sr/86Sr and maficity in both I- and S-type granitic rocks. The accessible
literature did not include both of the aforementioned datasets for individual rock suites, which
is why this data was not included in the major and trace element arrays (Figure 1, pg. 6 - 7).
Accessory minerals are also a key feature that differentiate I- and S- type granites. Inherited
zircons, along with monazite, apatite and xenotime are typically more prevalent in S-type
granites (Broska, 2003; Villaros et al., 2009a); whilst I-types are commonly characterised by
allanite, apatite and sphene (Broska, 2003). Inherited zircons demonstrate unequivocally that
granites entrain components of their sources (Clemens and Stevens, 2012). According to the
literature, both granitic types show a reasonably strong Zr-maficity relationship. However, in
the maficity graphs (Figure 1, pg. 6- 7) the relationship appears weakly positive. Even though
I-type granites usually contain fewer inherited zircons, they can sometimes display higher Zr
concentrations than their S-type equivalents (Clemens et al., 2011). Zircon solubility is a
function of both magma chemistry and temperature, and at similar temperatures is higher in I-
type compositions than S-type granites (Clemens et al., 2011) This is evident in the above
maficity plots (Figure 1, pg. 6 -7), as the highest Zr values in the granitic suites exist in the
Martins Pereira I-type granites, at around 400 ppm. It should also be noted that a steeper
gradient between Zr and maficity indicates the entrainment of accessory zircon within the
granitic magma is more efficient when compared to rock suites with lower gradients (Clemens
et al., 2011).
Examination of the ‘Chondrite Normalized REE plot (Figure 2, pg. 8) shows that I-type granites
are typically more enriched in the LREE than their S-type granite counterparts. Consequently,
the S-type granites appear to display an overall flatter profile. In Figure 2 there is also clear
evidence for an overlap between the two granites’ anomalies, particularly in relation to Eu.
Examination of Figure 2 indicates that the Eu anomalies vary significantly, particularly between
the various I-type granitic rock suites. The largest Eu anomaly is present within the I-type
granitic rocks of the Iberian Massif (Spain). This large Eu anomaly can be attributed to a variety
of factors, such as; a higher proportion of Eu being preferentially integrated into residual
plagioclase from partial melting of the protolith (Villaros et al., 2009a); the fractional
crystallization of plagioclase within the magma; or a source characterised by a strong, negative
Eu anomaly (Rudnick, 1992).
Stellenbosch University https://scholar.sun.ac.za

CHAPTER 2: I- VERSUS S-TYPE GRANITES
14
By looking at the ‘Trace Element Spidergram’ (Figure 3, pg. 9) in the section above it is clear
to see that both the I- and S- type granite batholiths have similar trace element patterns. The
I- and S-type granites show marked depletion in Nb, Pb, Sr and Eu relative to CI Chondrite.
Both granites also show depletion in Nb, Hf, Zr, Y and Yb over Ce and Sm when compared to
CI chondrite, which is to be expected in the case of both volcanic arc and collision related
granites (Pearce et al., 1984). These characteristics may live on through episodes of crystal
recycling. There are slight variations between the profiles of I- and S-type granite suites
(Pearce et al., 1984), which can be observed in Figure 3. The S-type granites in the spidergram
show lower contents of Zr, Hf, Sm and Ce than the I-type granite profile.
2.2 Geodynamic Environments
The idea that different geodynamic settings can be linked with the formation of specific granite
geochemistry (e.g., Barbarin, 1999; Pearce et al., 1984) is not a new concept. However, it is
one of the more controversial methods to discriminate between granitoid types within the
literature. The controversy arises with the misapplication of ‘tectonic discrimination’ diagrams
(see Pearce, 1984) to infer the environmental conditions of magmatism and emplacement
(Clemens, 2012; Nedelec et al., 2015). Instead, geodynamic setting can be used to infer the
formational conditions of the relevant protolithic material (Clemens, 2012; Roberts and
Clemens, 1993).
Barbarin, (1999) suggests that when coupled with relevant and accurate petrological,
structural and geodynamic data granitoids can be used as reliable geodynamic indicators.
When it comes to his Amphibole-bearing Calc-alkaline Granitoids (ACG) classification group,
of which I-type granites are a subset, Barbarin defines the general geodynamic environment
to be a subduction zone. Here massive, shallow-lying intrusive bodies containing I-type
granites stretch parallel to the trench, and are often overlain by andesitic volcanoes (Barbarin,
1999). Unlike the ACG grouping, the Cordierite-bearing Peraluminous Granitoids group (CPG)
to which S-type granites belong, are typically associated with crustal thickening in areas of
continental collision (Barbarin, 1999). This process is a consequence of the oceanic
lithosphere being completely consumed by subduction processes; resulting in a transitional
environment and ultimately continental-continental collision (Barbarin, 1999). This implies that
ACGs are generally older features than CPGs.
An example of ACGs and CPGs can be found in the European Variscan fold belt, where a late
Palaeozoic Cordilleran-type bilateral subduction event is thought to have taken place (Finger
and Steyrer, 1990; Franke, 1989). It is here that calc-alkaline plutonism, specifically in the form
of I-type granites, tonalities and granodiorites appear similar to those of the American
Cordilleras. Structurally, these I-type granitoids form a belt-like formation running from the
Stellenbosch University https://scholar.sun.ac.za

CHAPTER 2: I- VERSUS S-TYPE GRANITES
15
western to eastern Alps (~1000km length), which lies parallel to both the Variscan and Alpine
fronts. The few S-type granites of the region are located in the northern most areas and are
believed to be Carboniferous in age. The earlier (late Devonian) I-type granites are most
prevalent in the southern zone (Finger and Steyrer, 1990). The age, geochemical and
structural relationship between both granite types in this case fits well within Barbarin’s ACG
and CPG constructs. However, the same cannot be said of the I- and S-type granites located
in eastern Australia, as well as those of the Cape Granite Suite in South Africa.
The Cape Granite Suite can be separated into three main phases of intrusive events. The first
phase is characterized by S-type granites, which intruded into the Tygerberg terrane (600-540
Ma) during, as well as after, collisional related tectonics. These S-type granites are the most
voluminous granitic rock type in the Cape Granite Suite. This phase was followed by a post-
tectonic intrusion of I-type granites at 560 to 520Ma in the Swartland and Boland terranes to
the north-east of the Tygerberg terrane. At ~517Ma the alkali feldspar granites intruded into
the monzogranites and granite plutons before a later intrusion of A-type granites at ~520Ma
(Scheepers, 1995). These events were later followed by S-type volcanic magmatism
(~515Ma) in the form of ignimbrite flows and quartz porphyry intrusions that generated the
Postberg ignimbrite and Saldanha quartz porphyry respectively (Scheepers and Poujal, 2002).
What is important to note from this example is that the environment was a purely collisional
one, in which the S-type granites preceded the younger I-type granite intrusions. This directly
contradicts the ideas put forward by Barbarin in his 1999 paper.
An earlier paper by Roberts and Clemens (1993) discredits the theory that I-type calc-alkaline
magmas must form as a result of; subduction related process; as a product of volcanic
sediments undergoing decompression melting in the post-collisional tectonic stages; or as a
consequence of magma mixing with a more mafic magma. Instead Roberts and Clemens
(1993) put forward their own model, which revolves around the fluid-absent partial melting of
metaluminous rocks located within the lower crust. According to Roberts and Clemens, (1993,
pg. 827) in order to satisfactorily recreate the high K2O contents and the commonly high
Na2O/K2O ratio seen in I-type calc-alkaline rocks, the most appropriate source material would
be “hydrated, calc-alkaline, and high-K calc-alkaline andesites and basaltic andesites.” The
proposed partial melting process is triggered by the underplating/intraplating of the lower
crustal rocks by a hot, mafic magma. As the conditions for partial melting are fluid-absent,
any water that is present in the newly formed, water-undersaturated felsic magma is
considered to exclusively be a product of the breakdown of hydrous minerals, such as micas
and amphiboles. The authors draw the conclusion that it is the chemical characteristic of the
source material that influences the chemical nature of the magma, rather than the processes
or geodynamic environment involved in their generation (Roberts and Clemens, 1993).
Stellenbosch University https://scholar.sun.ac.za

CHAPTER 3: EXPLAINING GRANITE GEOCHEMISTRY
16
Chapter 3: Explaining Granite Geochemistry
As mysterious and controversial as granites are to geologists, the debate does not simply end
there. Historically the geological community has been, and continues to be, largely divided
about the processes that are responsible for shaping the geochemistry of granitic magmas.
The paper ‘What controls chemical variation in granitic magmas?’ by Clemens and Stevens
(2012) summarizes the various models have been developed to explain the observed
heterogeneity within exposed granites. There are a variety of parameters that can control the
chemistry of granite magmas, including: assimilation, magma mixing and mingling, chemical
heterogeneity of the source rocks, progressive partial melting of the source to produce
compositionally distinct magma batches, crystal fractionation and phenocryst unmixing, restite
entrainment, restite unmixing and peritectic assemblage entrainment. This section serves to
highlight some key aspects of the most widely used models of granite formation found within
recent literature.
3.1 Compositional Variation of Granitic Melts
3.1.1 Chemical Heterogeneity in the Source
The geochemical heterogeneity of granites is considered to be primarily controlled by the
source and source related processes (Clemens et al., 2011; Clemens et al., 2009b).
Compositional variation within the source rocks is a key contributor in producing the major
element and isotopic heterogeneities within granitic rocks (e.g., Clemens, 2003; France-
Lanord et al., 1988). The amount of chemical heterogeneity within the source material is
proposed to correlate directly with the amount of variation observed within the granites
(Chappell and White, 2001). For example, the more variable nature in S-type granite character
(particularly in terms of Sr87/Sr86 initial values) over I-type granites, is suggested to result from
more chemically heterogeneous source rocks than those responsible for the formation of I-
type granites (Chappell and White, 2001).
3.1.2 Pulsed Melt Extractions from a Progressively Melted Source
Anatectic melts derived from the incongruent, partial melting reactions of hydrous minerals
within a single source material can be produced in batches. Each melt batch forms as a
consequence of the increasing temperatures associated with partial melting (Clemens and
Stevens, 2012). Melt batch extraction from the source may alter the bulk composition of the
source (e.g., Brown, 2004). This change in source composition, along with increased
temperatures and changes in volatile component behaviours, alters the composition of
successive melt batches (Clemens and Stevens, 2012; Clemens and Wall, 1981; Yakymchuk
Stellenbosch University https://scholar.sun.ac.za

CHAPTER 3: EXPLAINING GRANITE GEOCHEMISTRY
17
et al., 2011). The composition of the melts becomes increasingly mafic and calcic in
composition at higher temperature conditions of melting (Clemens and Stevens, 2012).
As some source material is heterogeneous in composition, i.e. chemically layered, the
successive magma batches formed through the partial melting of these rocks will be similarly
heterogeneous in character (Clemens et al., 2009b). This can largely be attributed to the fact
that the compositional variation within the source material varies on a small-scale. Sequential
melting of the source means that reactant minerals involved in the initial partial melting
reactions may be entirely different phases, or be compositionally distinct to those involved in
subsequent partial melting reactions (Clemens and Stevens, 2012). As melt can be produced
in batches, it may also be emplaced in successive batches to create a pluton (Sawyer, 1994),
such as the Manaslu leucogranitic pluton (Deniel et al., 1987). During ascent, as well as
emplacement, these melt batches can remain both geochemically and spatially isolated, with
only incomplete levels of mingling occurring between different melt batches (e.g., Deniel et al.,
1987; Pressley and Brown, 1999; Searle et al., 2009). The aforementioned may be attributed
to the differing thermophysical and transport properties of the successive melt batches. It is
this incomplete mixing of melt batches that can result in major element and isotopic
heterogeneities, particularly within leucogranitic rocks (Searle et al., 2009 and references
therein).
Both the chemical heterogeneity in the source, as well as pulsed melt extractions from a
progressively melted source can account for the chemical variability of leucocratic granites.
This is supported by evidence from quenched experimental melts (e.g., Montel and Vielzeuf,
1997) and natural melt inclusions within peritectic phases in anatectic granulites (Taylor and
Stevens, 2010) that indicate that granitic melts are leucocratic in composition. However, these
aforementioned processes are unable to satisfactorily explain the formation of granites whose
compositions are more mafic in composition than typical granitic melts. The generation of
these more mafic granites requires one or more of the processes discussed in the ‘Models of
Formation’ section below.
3.2 Models of Formation
3.2.1 Source Inheritance Models
Restite Entrainment Model
The term ‘restite’ according to Chappell and White (1991, pg. 376) refers specifically to “any
solid material in a plutonic or volcanic rock that is residual from partial melting of the source.”
The term ‘restite’ is a blanket-term that includes any of the following minerals and rocks
depending on which piece of literature one reads: major silicate minerals that have remained
Stellenbosch University https://scholar.sun.ac.za

CHAPTER 3: EXPLAINING GRANITE GEOCHEMISTRY
18
unchanged by partial melting processes or that were in excess; accessory minerals such as
zircon, apatite, monazite, allanite and xenotime (amongst others); enclaves of mica-rich rocks
proposed to represent the source; as well as the peritectic mineral assemblage that results
from the melting of hydrous minerals during partial melting (Clemens et al., 2011).
The restite entrainment model works on the premise that the minerals within exposed granites
are primary restite from the source, or are pseudomorphs (secondary restite) of the original
restitic material (Chappell et al., 1987). It was observed that the MgO + FeO content of
exposed granitic rocks is higher than those obtained in experimental melts for crustal
temperatures. It was therefore concluded that in order for this geochemical observation to be
true, granite magmas must contain a significant proportion of entrained restitic material
(Chappell et al., 1987). The restite model was also used to bypass the idea of mineral
nucleation being a requirement to produce porphyritic granite plutons, instead the large crystal
nature of these granites would be a trait directly inherited from the source (Chappell et al.,
1987).
Restite-Unmixing Hypothesis
Upon having studied the Lachlan Fold Belt of south-eastern Australia in 1977, White and
Chappell put forward their ‘restite-unmixing’ hypothesis to explain chemical variation within
granites (White and Chappell, 1977). The model states that at source conditions the restitic
material (unreactive silicate minerals, accessory minerals and peritectic minerals) is in
equilibrium with a low temperature melt (Chappell et al., 1987). Once a critical melt fraction
has been met this restitic material is mobilized along with a melt, and ascends through the
crust in accordance with a diapiric model of ascent (Chappell et al., 1987; Stephens, 2001;
White and Chappell, 1977). The restitic material remains largely unable to separate from the
melt portion during its ascent, due to the viscosity and yield strength of the melt (Chappell et
al., 1987). The aforementioned would suggest that some restite will be preserved within
crystalline granitic rocks. The restite-unmixing hypothesis proposes that the geochemical
composition of granites at the surface is determined by the degree to which the restite portion
separates from the melt (Chappell et al., 1987).
The ‘restite-unmixing’ hypothesis, and the premise upon which it rests, has come under
intense scrutiny in recent years. Clemens and Stevens (2012) discuss the impracticalities of
the model in terms of three major limitations. The first limitation of ‘restite-unmixing’ is that for
it to apply, large proportions of restite would need to be visible within granites at the surface.
Whilst some restitic material (zircon and monazites) are present in exposed granitic rocks, the
other two components of restite (unreactive silicate minerals and peritectic minerals) are not.
In the case of the Lachlan Fold Belt’s S-type granites, it is proposed that the ‘restitic’ enclaves,
Stellenbosch University https://scholar.sun.ac.za

CHAPTER 3: EXPLAINING GRANITE GEOCHEMISTRY
19
as designated by Chappell and White, are in fact mid-crustal xenolithic material (Clemens,
2003; Vernon 2007). At the conditions of the source, minerals, such as biotite, that are found
within granitic enclaves, would be digested during partial melting reactions that are involved
in the production of S-type granite magmas. The presence of biotite in the enclaves therefore
suggests that the enclaves could not have been produced at the conditions of the source
(Clemens, 2003). The second problem with the ‘restite-unmixing’ model is that it relies heavily
on the diapiric ascent model for granite magmas. Diapirism is considered implausible because
if the magma (melt + restitic material) from the source ascended as one mobile body (as the
mechanism implies), a significant amount of granulite-facies restitic material should be
exposed at the surface (Clemens and Mawer, 1992; Clemens and Stevens, 2012). To explain
the lack of restite at the surface, Clemens and Mawer (1992) instead suggest a process of
granite magma ascent through fracture and conduit networks, where the restitic material would
be trapped within the lower levels of the crust (Clemens and Mawer, 1992). The final issue
with the ‘restite-unmixing’ model is that it assumes that the source compositions are directly
reflected by the most mafic granites of a suite. For this to be valid there would need to be
evidence of large-scale andesitic and pelitic plutons, which from field observations are seen
not to exist (Clemens and Stevens, 2012).
In his 2003 paper, Clemens concedes that granites do to a ‘certain degree’ mirror their
sources, and that it is this mirroring that allows for conclusions to be drawn regarding the
distinctly different protoliths and processes involved in formation of both I- and S-type granites.
Ultimately, variation in the I- and S- type protoliths allows for the production of significant
geochemical variation between the two granite types at the surface.
Peritectic Assemblage Entrainment
The latest to garner recognition in the plethora of granite genesis models is peritectic
assemblage entrainment (PAE) (Clemens and Stevens, 2012; Clemens et al., 2011; Stevens
et al., 2007). The model proposes that the geochemical heterogeneity of exposed granites,
and their corresponding geochemical trends result from the differential entrainment of a
distinct mineral assemblage within a hydrous, felsic melt (Clemens et al., 2011; Clemens and
Stevens, 2012). This melt + peritectic assemblage is produced via incongruent melting
reactions involving the breakdown of hydrous mafic minerals, such as biotite and hornblende,
within the source. The peritectic mineral assemblage is dependent on the stoichiometry of the
incongruent melting reaction. The stoichiometry of the incongruent melting reaction in turn
reflects the composition of source and the pressure-temperature conditions of anatexis
(Clemens et al., 2011).
Stellenbosch University https://scholar.sun.ac.za
CHAPTER 3: EXPLAINING GRANITE GEOCHEMISTRY
20
The PAE model was first conceptualised in a study into the S-type granites of the Cape Granite
Suite, South Africa (Stevens et al., 2007). The major element geochemical trends (e.g. A/CNK
versus maficity; Ti versus maficity) within the granites were determined to be a consequence
of the entrainment of peritectic garnet and ilmenite into a leucogranitic melt at the source
(Stevens et al., 2007). Further studies (e.g., Clemens and Stevens, 2012), illustrated that the
same principles could be applied to various types of granitic rocks, such as I-type granites.
These studies concluded that the major and trace element geochemical trends of granites are
likely to be the result of the entrainment of a wider array of peritectic minerals than the limited
(Grt + Ilm ± Opx) assemblage initially proposed by Stevens et al., (2007) (Clemens, 2012). In
the case of I-type granites the protolith is thought to be intermediate in composition
(andesite/dacite) (Castro, 2014; Chappell et al., 1998). The hornblende and biotite within the
intermediate andesitic/dacitic protolith undergoes an incongruent melting reaction as defined
below:
Bt + Hbl + Qtz + Pl1 ⇄ melt + Pl2 + Cpx + Opx + Ilm ± Grt (Clemens et al., 2011)
It is the stoichiometry of the above melting reaction that defines the proportion of minerals in
the peritectic assemblage, i.e. the molar ratios of Pl : Cpx : Opx : Ilm : Grt. This mineral
assemblage is entrained to the ascending melt to form an I-type granitic magma (Clemens
and Stevens, 2012). The peritectic minerals are proposed to be highly mobile and easily
entrained within the melt due to their small crystal size (Stevens et al., 2007). This small crystal
size has been inferred from the fact that the physical processes responsible for the
entrainment of accessory minerals, such as zircon and monazite, are similar, if not the same,
as those responsible for the entrainment of peritectic minerals (Villaros et al., 2009b). As these
accessory minerals are small within metasedimentary rocks, it follows that the entrained
peritectic minerals may be similarly sized at the point of entrainment (Villaros et al., 2009b).
Studies on natural rock samples from the Mkhondo Valley Metamorphic Suite have indicated
the size of entrained garnet crystals to be <1mm in size (Taylor and Stevens, 2010). The size
of the entrained crystals were established by examining the size of garnet crystals in “the
thinnest, cross cutting leucosome veins” (Taylor and Stevens, 2010, pg. 289).
With entrainment of 35 to 40 mol. % of the peritectic assemblage produced by the melting
process producing compositions that are equivalent with the most mafic I-type granite
compositions (Clemens and Stevens, 2012). The exact proportion of peritectic minerals to
melt is controlled by the physical processes within the source that allow for magma
segregation. The most pertinent thing to note about the PAE model though is that it is the
stoichiometry and proportion (relative to melt) of the peritectic mineral assemblage entrained
Stellenbosch University https://scholar.sun.ac.za

CHAPTER 3: EXPLAINING GRANITE GEOCHEMISTRY
21
at the source that is the primary control on granite heterogeneity at the surface (Clemens and
Stevens, 2012; Clemens et al., 2011).
Geochemical trends
From a geochemical standpoint, peritectic assemblage entrainment is the only model to date
that successfully accounts for the geochemical trends of both compatible and incompatible
elements versus maficity that characterise exposed granitic rocks (Clemens and Stevens,
2012). The most significant of these trends is the strong, positive relationship between Ti and
maficity and similar Ti:maficity ratios that can be observed in both I- and S-type granitic rocks
around the globe (Clemens and Stevens, 2012). In S-type granite magmas this trend is
proposed to result from the peritectic mineral assemblage emulating the stoichiometries of the
incongruent, partial melting reaction involving biotite within the source (Clemens et al., 2011;
Stevens et al., 2007). Conversely, in I-type granites the strong, positive correlation of Ti versus
maficity can be ascribed to the entrainment of a distinct peritectic mineral assemblage (Pl +
Opx + Cpx + Ilm ± Grt) (Clemens et al., 2011 and references therein). The Ti versus maficity
relationship occurs irrespective of the type of source material, and is instead a characteristic
produced by the stoichiometries of the peritectic mineral assemblage. This aforementioned
fact, along with the extensive overlap in their Ti versus maficity ratios, is why the formation of
both I- and S-type granites can be effectively ascribed to the PAE model.
I-type granites display unique geochemical trends, when compared to their S-type
counterparts. For example, the melt portion of their magmas is weakly peraluminous, whilst
the granites themselves become increasingly metaluminous at moderate to high maficities
(Clemens et al., 2011). This trend is proposed to be a direct result of the differential
entrainment of a mafic mineral, specifically peritectic clinopyroxene, into a peraluminous melt
derived from the source (Clemens et al., 2011). Clinopyroxene is an essential component of
the I-type peritectic assemblage, as without it the ASI values seen in I-type granite magmas
would be improbable at crustal temperatures (Clemens et al., 2011; Castro et al., 1999).
Unlike I-type granite magmas, the ASI value of S-type granites appears to increase within
increasing maficity (Clemens et al., 2011). According to Stevens et al., (2007) this trend can
be ascribed to the differential entrainment of Grt + Ilm ± Opx into the melt fraction. The positive
linear relationship can be observed in the maficity plots in Chapter 2 (Figure 1 (H)), particularly
in the S-type granites of the Kosciusko Batholith (Australia) and the Castelo Branco Pluton
(Portugal).
Accessory minerals, such as zircon, can be found in both I- and S-type granites. The major
difference between the two is that for the same maficity contents of the rocks, I-type granites
tend to have higher Zr concentrations (Clemens et al., 2011). The difference in Zr
Stellenbosch University https://scholar.sun.ac.za

CHAPTER 3: EXPLAINING GRANITE GEOCHEMISTRY
22
concentrations between the two granitic rock types relates to the lower modal abundance of
inherited zircons in I-type granites, and the highly efficient process of zircon entrainment within
I-type granite magmas (Clemens et al., 2011).
Other accessory minerals such as titanite and allanite are proposed to be co-entrained along
with the peritectic assemblage in I-type granite magmas. These minerals are liberated from
reactant minerals, such as biotite, during incongruent melting. It is noteworthy to mention that
peritectic mineral growth most probably occurs in the sites from which these accessory
minerals were liberated. The efficient liberation of peritectic minerals from the source is key,
as they move both peritectic and accessory phases with them (Villaros et al., 2009a).
In the case of graphed incompatible elements, such as: K, Rb, Sr, Ba and Na, versus maficity
their scatter, which is the highest in the most leucocratic rocks, is a function of the inherited
variability within the source. This variability within the source is imaged in the plutonic rocks
by virtue of the fact that successive magma batches mingle rather than mix (e.g., Pressley
and Brown, 1999). The relationship between these incompatible elements and maficity, as can
be seen in Figure 1 (C, D, J, K) on pages 6 and 7, is one of decreasing scatter with increasing
maficity. This trend occurs due to the fact that these elements are concentrated within the
melt, and are thus diluted by peritectic assemblage entrainment (Clemens et al., 2011).
These elements are expressed in the hydrous melt portion of the magma, and provide
geologists with clues as to the composition of the reactants in the incongruent melting reaction
and the nature of the protolithic material itself (Clemens and Stevens, 2012). Other
incompatible elements, such as Li, Be, B and F, express themselves in minerals such as
tourmaline and beryl within granitic plutons. The most feasible explanation for their formation
is extensive crystal fractionation during emplacement, due to the fact that granitic protoliths
have insufficient quantities for their production to be source related (Clemens and Stevens,
2012).
Fate of Entrained Minerals
According to the PAE model, whilst granite compositions are ultimately a product of their
source, the mineral assemblages and compositions observed at the surface are not a simple
or direct reflection of the source itself (Clemens et al., 2011; Clemens and Stevens, 2012).
Entrained peritectic crystals, although abundant, are small when they are entrained into the
melt. During their ascent these crystals are thought to constantly re-equilibrate with the
surrounding magmatic conditions (Clemens and Stevens, 2012). This is suggested to occur
via a coupled ‘dissolution-precipitation’ mechanism (Clemens et al., 2011; Clemens and
Stevens, 2012; Taylor and Stevens, 2010; Villaros et al., 2009a). Consequently, there is
Stellenbosch University https://scholar.sun.ac.za
CHAPTER 3: EXPLAINING GRANITE GEOCHEMISTRY
23
relatively little textural and compositional evidence of the higher pressure and temperature
peritectic mineral assemblage within exposed granites (Clemens et al., 2011; Clemens and
Stevens, 2012). Where evidence of the peritectic minerals exists they show evidence of partial
re-equilibration within the surrounding magma (Taylor and Stevens, 2010). Taylor and
Stevens’ (2010) observations of garnet re-equilibration with the surrounding magma were
made in segregated magma volumes trapped in source granulites.
In I-type granitic rocks pyroxene minerals are uncommon features. In cases where they are
evident their textural and geochemical nature implies that they have precipitated from the melt.
Evidence of high temperature silicates, such as garnets, within I- and S-type granites,
indicates that these high temperature silicates were stable within the magma at higher
temperatures. As the magma cools upon emplacement, these high temperature phases are
seen to be replaced by hydrous minerals. For example, biotite + quartz intergrowths,
interpreted to be the products of reaction between melt and orthopyroxene in granitic magmas,
are common (Clemens et al., 2011; Clemens and Stevens, 2012; Clemens and Wall., 1988;
Maas et al., 1997; White et al., 1999). In S-type granites various degrees of equilibration are
observed, namely; cordierite and garnet rimmed by biotite, cordierite and garnet
pseudomorphed by biotite, as well as biotite and cordierite being partially replaced by chlorite
and/or muscovite (Maas et al., 1997; Villaros et al., 2009a). Whereas, in S-type volcanic rocks
there is evidence of clinoamphiboles, such as cummingtonite, partially replacing
orthopyroxene (Clemens and Wall, 1988). In I-type granites evidence of partial re-equilibration
appears in the form of zoned plagioclases, along with the pseudomorphic replacement of
orthopyroxene by biotite and quartz intergrowths (Clemens et al., 2011; Clemens and Stevens,
2012; Maas et al., 1997; White et al., 1999). There is a distinct lack of peritectic feldspars in
exposed granitic rocks. The peritectic feldspars are thought to be dissolved into the melt
portion and later precipitated as magmatic feldspars with a new, equilibrated composition.
Evidence of this includes their “euhedral shape, melt inclusions and oscillatory zoning”
(Clemens et al., 2011, pg. 179). In comparison, the ferromagnesian minerals such as garnet
will react with the surrounding melt portion to form hydrous minerals, such as hornblende and
biotite. These hydrous minerals form as a consequence of the aH2O increasing with the
pressure decrease associated with magma ascent and corresponding superheating (Clemens
et al., 2011; Clemens and Stevens, 2012).
Evidence of a dissolution-precipitation mechanism can be observed in the S-type granites of
the Cape Granite Suite (CGS), South Africa. By investigating the evolution of the S-type
granites in the region, Villaros et al. (2009) observed that the garnets are homogeneous
regardless of their host granite’s composition. The geochemical and textural characteristics of
the peritectic garnet (high-pressure) entrained at the source are not seen in those exposed
Stellenbosch University https://scholar.sun.ac.za

CHAPTER 3: EXPLAINING GRANITE GEOCHEMISTRY
24
within the CGS (low-pressure). Villaros et al. (2009) reject the idea that these garnets have
undergone geochemical changes via a diffusion mechanism, due to the short time scales at
which the magmatic events in the region occurred. Calculations conducted by the authors
using Carlson (2006) data shows that the self-diffusion process for an entrained garnet grain
with a radius of 1cm at the conditions of S-type magma formation within the CGS (i.e. 850° C
and 10kb) would take approximately 3.95 x 10⁸ yrs. This figure is significantly longer than the
proposed dissolution mechanism, which is extremely efficient in comparison at around 102 to
103 yrs. The authors have therefore ascribed the garnet homogenisation with the magma to a
coupled dissolution-precipitation process.
3.2.2 Magma-Mixing
Magma mixing between a basaltic and felsic magma is considered by some to be a viable
process (e.g. Zorpi et al., 1989; Chappell, 1996; Vernon, 2007; Karsli et al., 2010) in the
generation of calc-alkaline, I-type granites. Hybridization of mantle-derived and crustal derived
melt in deep crustal hot zones, or M.A.S.H zones has been inferred to control the isotopic and
major element chemistry of granitic rocks (Annen et al., 2006). Underplating of basaltic
magmas within the lower crust is suggested to provide sufficient heat and volatile components
to induce melting of the pre-existing crustal rocks (Annen et al., 2006). The basaltic magmas
are intruded into the lower crust above the magma’s liquidus temperature (Annen et al., 2006).
As heat is lost from the basaltic magma to the surrounding country rocks, the basaltic magma
partially crystallizes (Annen et al., 2006). Conversely, heat transferred to the surrounding
crustal rocks raises the temperatures to hypersolidus levels, and these rocks begin to melt
(Annen et al., 2006). In the case of simple magma mixing between two endmember magmas
thermal equilibrium similarly induces dissolution of crystal components of the felsic magma
(Metcalf et al., 1995). The composition and fraction of the residual melts produced by basalt
crystallization are controlled by temperatures increases associated with continual basaltic
magma injection into the lower crust. Initial melts produced by this process will be rhyolitic in
composition, becoming increasingly dacitic and andesitic in composition with increasing
temperatures (Annen et al., 2006). It is the continually changing compositional and
thermophysical characteristics of these melts that is responsible for the geochemistry of
granites. The successive production of varying melt compositions would suggest that crystals
formed at initial lower temperatures would be out of compositional equilibrium with the later
higher temperature melts, as well as with the more silicic melt compositions derived from
melting of lower crustal rocks. These disequilibrium features are preserved in eruptive felsic
rocks, such as andesitic lavas, in the form of zoned minerals, variable melt compositions, as
well as geochemically distinct populations of individual mineral phases that are not in
equilibrium with one another (Kent, 2013). Conversely, petrological examination of granitic
Stellenbosch University https://scholar.sun.ac.za

CHAPTER 3: EXPLAINING GRANITE GEOCHEMISTRY
25
rocks indicates that they appear not to display mineral compositional or mineral textural
evidence of high temperature mineral phases that would be associated with magma
mixing/hybridization at lower crustal depths.
The cyclical and episodic nature of magmatism within continental arcs has also been proposed
to account for the isotopic and trace element variation between individual plutons/volcanoes,
as well as across entire arcs (Paterson and Ducea, 2015). In each cycle there are episodes
of increased magmatism within a continental arc known as a ‘flare-up’, followed by periods of
waning magma volumes, known as ‘lulls’ (Paterson and Ducea, 2015). Any change in the
structure, tectonics or chemical composition of the lower crust is thought to trigger periods of
increased/decreased magmatism within a continental arc (Paterson and Ducea, 2015). Each
magma batch produced by the episodic melting of the lower crust is unique in both its age and
in its geochemistry. The geochemical variation between magma batches produced in each
cycle may be a result of different magma sources, along with differing depths of the magma
batch’s formation (Kay et al., 2005). The unique pressure and temperature conditions of each
magma batches formation are preserved within the isotopic and “pressure-sensitive trace
elements”, such as Sr, Y and Nb, within plutonic and volcanic rocks (Kay et al., 2005, pg. 67).
Beyond the fluctuations in magma volume, the rate at which magma is added to a continental
arc is also an important factor in understanding magmatic systems. In the case of individual
plutons determination of the magma addition rate (MAR) has indicated that juvenile magmas
are able to recycle older plutonic materials as they ascend through the crust, and are added
to the magma chamber (Paterson and Ducea, 2015 and references therein). It is this recycling
that is responsible for mixing of melt and crystals that can be observed in both plutonic and
volcanic rocks (Paterson and Ducea, 2015 and references therein).
According to a review by Vernon in 2007, there is a distinct lack of restitic components within
the S-type granites of the Lachlan Fold Belt, which coincides with similar findings of Clemens
(2003). However, unlike Clemens, Vernon offers the suggestion that the some of the enclaves
observed within the region are pockets of quenched magma. These pockets result from a
peraluminous magma mixing with a more mafic magma at near source levels. The author
likens these processes observed in the S-type granites, to similar processes which generate
microgranitoid enclaves globally within I-type magmas (Vernon, 2007).
Others ascribe the enclave formation within granites to be a result of the incorporation of
accessory magmas into the host magma. These accessory magmas might have little to no
influence on the composition of the host magma (Clemens, 2003; Clemens et al., 2011;
Clemens et al., 2009a). Magma mixing between crustally-derived melt and more mafic mantle-
derived melt is unlikely. This is evident when looking at the correlation between Ti and maficity,
Stellenbosch University https://scholar.sun.ac.za

CHAPTER 3: EXPLAINING GRANITE GEOCHEMISTRY
26
as well as K and maficity in granitic magmas. Ti has a low solubility within the melt, and is
found to be concentrated within the peritectic assemblage. Conversely, K has a high solubility
within the melt, which accounts for the high-K component seen within the melt portion of the
system (Clemens et al., 2011). Both Ti and K exhibit strong positive and negative correlations
respectively. Mantle-derived melts have Ti concentrations that vary significantly, but not
significantly higher than in many granites. This Ti variation implies that magma mixing
processes between mantle and leucogranitic melts would result in distinctly different granite
compositions, each with its own unique Ti:maficity ratios. Both experimental and field related
data has shown that all granites display similar Ti versus maficity trends, regardless of their
composition, making it unlikely that I-type granites could have developed through magma
mixing processes (Clemens et al., 2011). Isotopic data collated from I-type granites shows
that a mafic magma component is unlikely to have played a significant role in their formation,
except potentially in the case of a “hyper-enriched, metasomatised mantle” (Clemens et al.,
2011, pg. 176). Magma mixing has been argued as impractical to account for the formation of
I-type granites, particularly from a geochemical perspective. As although both the A/CNK and
K/Na ratios of I-type granites align with a magma mixing model, the Ti versus maficity ratio is
incompatible (Castro, 2014). A magma mixing mechanism would also result in both the major
and isotopic geochemical concentrations of the basaltic and felsic end-member magmas
changing in a similar manner (Castro, 2014). This is not the case in real-world scenarios where
extensive “decoupling between major elements contents and radiogenic isotopes” is prevalent
(Castro, 2014, pg. 66).
The aforementioned examples provide a glimpse into the extensive debate surrounding the
feasibility of the magma mixing models to account for granite production within the literature.
However, it is not the aim of this research to argue against the feasibility of this process.
Instead this research can provide valuable insight into the types of kinetic processes that are
responsible for the removal or equilibration of high temperature and pressure phases within
granites that are proposed to be derived from magma mixing process (e.g., Vernon, 2007).
3.2.3 Assimilation
The assimilation model is one in which the incorporation of crustal material (wall-rock or
xenolithic material) is responsible for generating the geochemical and isotopic characteristics
of granitic rocks (Clemens and Stevens, 2012). This variation is suggested to result from the
fact that assimilated material may be entirely geochemically distinct, as well as significantly
older than the magma into which it is assimilating (Annen et al., 2006). In order to melt and
assimilate wall rock, a significant amount of heat needs to be conducted from the ascending,
mantle-derived mafic magma to the surrounding wall rock. These heat losses from the magma
induce crystallization (Nedelec et al., 2015). Experiments on the assimilation of gneissic
Stellenbosch University https://scholar.sun.ac.za

CHAPTER 3: EXPLAINING GRANITE GEOCHEMISTRY
27
material into basaltic liquids conducted by Patiño-Douce (1995) produced magmas that
constituted granitic melt and crystals (Opx, Cpx, Pl ± Grt) (Nedelec et al., 2015). In general,
any mica or amphibole bearing crustal component that is assimilated into a magma at
temperature ranges of 850 - 900°C will undergo dehydration reactions to produce Opx + Cpx
+ Ca-rich Pl + Oxides ± Grt, and a hydrous melt (Beard et al., 2005). This mineral assemblage
correlates to the ‘peritectic’ mineral assemblage utilized within this research. Consequently,
direct parallels can be drawn between the compositional and textural ‘fates’ of minerals
generated through dehydration reactions associated with peritectic mineral entrainment, and
those resulting from assimilation processes.
Similarly to magma mixing/hybridization processes there are arguments against assimilation
processes being primary contributors to granite geochemical heterogeneity. The assimilation
model is seen by many to be unviable for a variety of reasons. Firstly, although the isotopic
data can reproduce trends observed in granitic rocks it is unable to do so satisfactorily for the
major elements (Clemens, 2012). Secondly, the energy required to melt the assimilated
material would exceed the available energy of the system. If sufficient energy were available,
the magma would become so crystal saturated that it would become stagnant (Glazner, 2007).
Finally, the distinct lack of restitic enclaves within the vast majority of exposed granites would
strongly suggest there is no material being assimilated, as one would expect small remnants
of the wall-rock material to be preserved (Clemens and Stevens, 2012). Clemens and Stevens
(2012) suggest that wall-rock assimilation is a viable process on a small, localized scale, and
cannot be a primary factor contributing to the heterogeneity of an entire granitic pluton.
3.2.4 Fractional Crystallization
Crystal fractionation is another widely accepted model relating to granite genesis.
Fundamentally it involves the partial or complete removal, or isolation, of crystals from a
magma. As these minerals are removed or isolated from the rest of the melt portion they are
unable to re-equilibrate with the progressively changing pressure and temperature conditions
of the surrounding granite magma (Clemens and Stevens, 2012). Fractional crystallization of
mafic magmas can produce residual liquids that are largely granitic in their composition. The
amount of residual granitic liquid produced via this process is insufficient to account for the
widespread, global abundance of granites, and on the whole this process is proposed to
account for <10% of granite production worldwide (Best, 1982).
Rejection of crystal fractionation as a viable primary genetic model for granites rests on two
key factors. The first being the fact that pulses of magma are responsible for pluton
development, rather than the intrusion of one single, pluton sized magma batch (e.g., Glazner
et al., 2004; Petford et al., 2000). Between each magma pulse sufficient time may lapse to
Stellenbosch University https://scholar.sun.ac.za

CHAPTER 3: EXPLAINING GRANITE GEOCHEMISTRY
28
allow for each magma layer to partially solidify (Clemens and Stevens, 2012). This implies
that if crystal fractionation were to occur it could only take place on a small-scale, and not
chamber wide (e.g., Reid et al., 1993). The second criticism of the model is similar to that of
the ‘restite-unmixing’ model. Essentially, the crystal fractionation of biotite or hornblende at
depth would be unable to produce the strong, positive Ti vs maficity trends observed within all
granitic rocks. However, the crystal fractionation process would produce similarly tight K vs
maficity trends that are not observed within granitic suites (Clemens and Stevens, 2012).
3.3 Concluding Remarks
Irrespective of the processes by which granite magmas attain their compositions, it appears
clear that typical granite magmas exist as mixtures of melt and crystals prior to their intrusion
into the sites of pluton assembly. There is little to no evidence of the entrained residuum within
exposed granitoid rocks (Clemens et al., 2011; Clemens and Stevens, 2012; Clemens and
Wall, 1988; Vernon et al., 2009). According to the literature this is a consequence of a rapid
and efficient process of ‘dissolution-precipitation’, which re-equilibrates minerals with the
surrounding magmatic conditions during both ascent and emplacement (e.g., Villaros et al.,
2009a). This study has chosen to investigate the fate of a peritectic mineral assemblage (Pl +
Opx + Cpx + Ilm ± Grt) that, according to the Clemens et al., (2011), might be involved in the
formation of a mafic I-type granodiorite. The peritectic assemblage entrainment (PAE) model
has been used over other potential petrogenetic processes as it defines the entrained
residuum with clarity. Thus, the experimental design that follows matches the concept of
peritectic assemblage entrainment in detail. In addition, when all the aforementioned evidence
relating to granitic magma petrogenesis is considered, the PAE model appears to be the most
suitable petrogenetic process to produce I-type granites and their unique geochemical
characteristics.
Stellenbosch University https://scholar.sun.ac.za

CHAPTER 4: EXPERIMENTAL DESIGN
29
Chapter 4: Experimental Design
This chapter outlines in detail the analytical techniques and experimental procedures used
throughout this research. ‘Analytical Techniques’ gives the reader a comprehensive
breakdown of the equipment and standards employed during analysis of both the starting
materials and final run products. The ‘Phase Equilibrium Modelling’ subsection of this chapter
allows the reader insight into the foundation and thought-process involved in undertaking this
research. ‘Experimental Methodology’ contains a step-by-step breakdown of various
experimental techniques ranging from the production of a synthetic starting material to the
creation of gold capsules. This section also discusses the technical ins-and-outs of the
experimental apparatus used in this research. The reader will note that, where relevant,
justification of the methods and equipment used within this research has been provided.
To develop the narrative of I-type granite genesis we need to look at its three major
landscapes. The first landscape is one of tangibility. In this landscape, real-world observations
of exposed I-type granites allow for deductive reasoning. Whilst this approach is highly
valuable, its reliance on ‘top-down’ logic is particularly problematic where I-type granites are
concerned. Certain granitic plutons lack physical evidence of source related material, which
means the use of top-down logic to draw conclusions about the genetic history of these rocks
is subject to strong limitations. The second landscape is one in which experimental techniques
are utilized to provide windows into various stages of formation from the source to
emplacement. These techniques allow for the use of inductive reasoning. The issue with
employing experimental techniques is that they limit the ability to study pertinent magmatic
processes, such as fractional melting and magma segregation. These limitations result
because the experiments are closed systems, which can only be altered by controlled changes
in the temperature and pressure conditions to which they are subjected. The third landscape
is a thermodynamic approach, which involves phase equilibrium modelling of various
compositions over a range of pertinent pressure-temperature conditions. This approached is
borrowed from metamorphic studies of partially melted rocks. To date this technique has not
been used widely within igneous studies, although it has the potential to significantly advance
understanding of igneous processes within felsic magmas. This study has chosen to focus on
the latter two landscapes.
Stellenbosch University https://scholar.sun.ac.za

CHAPTER 4: EXPERIMENTAL DESIGN
30
4.1 Analytical Techniques
A variety of analytical techniques have been employed during this research. These various
analytical methods are outlined in the subsections that follow.
X-ray Fluorescence
PANanalytical X-Ray Fluorescence analysis was conducted on the major element chemistry
of the synthetic starting gel. This analysis was conducted both before and after the addition of
synthesized fayalite, kaolinite and TiO2 to the gel. The XRF contains a 3kWatt Rh X-ray tube
fitting and both NIST® and SARM® standards were used during the element analysis.
X-ray Diffraction
The composition of the fayalite utilized in the experiments was determined using a Bruker D8
X-ray Powder Diffractometer (XRD) with a Cu sealed tube. The XRD results for fayalite were
then compared to XRD patterns within the literature. From these comparisons it was
determined that the synthesized fayalite was suitable to use in the experiments.
Sample Preparation
The starting bulk composition, as well as the experimental run product samples were prepared
according to the following steps. The relevant material to be analysed was placed on a rough
thin-section slide and covered with liquid epoxy. In the case of the experimental run products
the gold capsule was broken open using scissors and the run product was removed using
tweezers. The thin section slide was then left to dry and harden overnight. The thin-section
slide was then placed into a thin-section weight. The epoxy was then ground down under water
using a Jean Wirtz TG200 grinder with a 15µm grinding pad until the experimental material
within the epoxy was exposed and flat. The thin-section slide was then polished using a
Struers Rotopol-35 on 9µm, 3µm and 1µm polishing pads with the relevant polishing fluid.
Scanning Electron Microscopy
Thin-section slides containing the relevant peritectic assemblage/experimental run products
were analysed using the Zeiss® EVO MA 15 Scanning Electron Microscope (SEM) fitted with
an Oxford Instrument® Energy Dispersive X-Ray Spectrometer attachment. Standard settings
outlined in the SEM manual provided to users were utilized during each analysis. These
settings include; carbon coating of samples to 15µm, a working distance of 8.5mm, a Faraday
Cup reading of between -19nA and -20nA, beam current of 100µm and an accelerating voltage
of 20kV. The SEM runs using INCA software; and the Energy-dispersive X-ray spectrometry
option was utilized to analyse the major element chemistry of the samples. The results of the
analyses are detailed in the tables (Table 7, pg. 48). The natural standards used for each
Stellenbosch University https://scholar.sun.ac.za

CHAPTER 4: EXPERIMENTAL DESIGN
31
mineral can be found within the Appendix under Zeiss® EVO MA 15 Scanning Electron
Microscope Mineral Standards.
High resolution backscattered electron images of the starting bulk composition were also taken
using the SEM, which required the standard settings of the machine to be adjusted such that
the working distance was reduced to between 6.0 and 7.5mm.
Analysis of melt within the run products required the sample to be cooled down to -180°C on
a Gatan cryogenic stage using liquid nitrogen. Liquid nitrogen was added intermittently in order
to ensure the stage temperature was regulated. Unlike standard SEM analysis a Faraday cup
cannot be utilized during melt analysis, which means that the beam current cannot be
checked. To curb this issue and to ensure beam stability, volatile free phases, such as quartz
and plagioclase, were analysed intermittently to ensure the accuracy of the melt results. Using
a cryogenic stage also reduced count losses of alkalis, in particular sodium and potassium,
that can arise through quantitative electron microprobe analysis (e.g., Moyen and Stevens,
2006; Nielsen and Sigurdsson, 1981).
Phase Equilibrium Modelling
Equilibrium assemblages were modelled using THERIAK-DOMINO Software (de Capitani and
Petrakakis, 2010). Pseudosections 1 and 2 were calculated using THERIAK-DOMINO
software developed by de Capitani and Petrakakis in 2010. The database used was compiled
by Douglas Tinkham, and is based upon the original database developed by Holland and
Powell in 1998. The following solution models from the database were utilized; PLC1 (Holland
and Powell, 2003), GT07W2 (White et al., 2007), BI05 (White et al., 2005), ILM05 (White et
al., 2000), OPX (White et al., 2002), CAMP11 (Diener and Powell, 2012), CPX11 (Diener and
Powell, 2012), LIQtc2 (White et al., 2007). These models allow for a range of phases including;
plagioclase, garnet, biotite, ilmenite, orthopyroxene, clinoamphibole, clinopyroxene, quartz,
rutile, sphene and melt to be plotted. The reader should note that the plagioclase model of
Holland and Powell (2003) encompasses the three feldspar endmembers; KAlSi3O8 -
NaAlSi3O8 - CaAlSi3O8.The phase equilibrium models were edited and labelled in Adobe
Illustrator® CS4. The results of the modelling can be found in the section that follows below.
4.2 Phase Equilibrium Modelling – A Rationale of Experimental Techniques
Pseudosection models are invaluable tools that aid in the understanding of how phase
assemblages and compositions alter over a range of pressure and temperature conditions
within a defined composition. They allow for a variety of important data such as; equilibrium
assemblages, mineral modes, isopleths of phase compositional parameters, and the location
of the solidus, to be calculated and graphically represented. The combination of this collective
Stellenbosch University https://scholar.sun.ac.za

CHAPTER 4: EXPERIMENTAL DESIGN
32
data provides the foundation on which to establish appropriate pressure and temperature
conditions for experimentation. Reviews on the agreement between previous experimental
studies on granulite facies rocks (e.g. Tropper et al., 2005) and Theriak-Domino modelling
outputs have shown the two methods to be in good agreement with one another ( e.g., Tropper
et al., 2015). Although discrepancies, such as the biotite stability and melt proportion, are
commonly evident between the different methods (Tropper et al., 2015).
Despite the multitude of benefits pseudosections can provide, they are not without their
limitations. Discrepancies can, and do, exist between what mineral assemblages and
compositions a phase equilibrium model predicts versus what is observed in the field or
through experimentation. There are several issues surrounding phase equilibrium modelling.
One of the most prominent is the gap in current knowledge surrounding certain thermodynamic
properties of minerals and melts (White et al., 2011). This means that the input data, such as
the thermodynamic datasets and mineral and melt activity models within the system,
particularly in relation to the activity-compositional relationships, are not well defined (White et
al., 2011). The quality of the user defined data can also be responsible for generating
inexplicable or inaccurate modelling outputs. In some cases the solution models within the
software may be unsuitable for the specific bulk composition to be modelled (e.g. ultramafic
rocks) or they may contain general inaccuracies (de Capitani and Petrakakis, 2010; White et
al., 2011). For example, the latest amphibole and clinopyroxene models (Diener and Powell,
2012) have been utilized to develop the phase equilibrium models (Figure 4, pg. 34; Figure 5,
pg. 35) that follow below. In spite of the significant improvements made over the previous
versions, the model still contains some prominent issues. The issue most relevant to this
research is the fact that the models have been calibrated specifically for greenschist,
blueschist, amphibolite and ecologite facies metamorphic conditions (Diener and Powell,
2012) whilst this research focuses on granulite facies conditions. At granulite facies conditions
element substitutions involving K and Ti have not been accounted for by the models (Diener
and Powell, 2012). This is a significant issue as it indicates that the pseudosection models are
a substantial simplification over natural systems. Thermodynamic modelling software
packages, such as Theriak Domino, are also unable to provide information on the rates of
reactions and reaction pathways. Instead this information can be ascertained through analysis
of experimental run products. It is clear, from all of the aforementioned, that modelling software
does not account for all the variables at play within a real-world system, but instead provides
the users with relevant approximations (de Capitani and Petrakakis, 2010).
Pseudosection 1 (Figure 4, pg.34) illustrates the influence of pressure and temperature
variations on an andesitic source composition (composition taken from Clemens et al., 2011,
pg. 180). This andesitic composition is intended to represent a hypothetical I-type granite
Stellenbosch University https://scholar.sun.ac.za

CHAPTER 4: EXPERIMENTAL DESIGN
33
source originating within the lower continental crust (Clemens et al., 2011; Barbarin, 1999;
Scheepers, 1995; Roberts and Clemens, 1993; Hine et al., 1978). The intention in developing
Pseudosection 1 (Figure 4, overleaf) was to quell any doubt regarding the feasibility of
clinopyroxene being a source related component. From the phase equilibrium model (Figure
4, overleaf) it can be seen that for the source pressure and temperature conditions (approx.
9kbar and 850°C) clinopyroxene is a stable phase. The stability of clinopyroxene within the
source is important, as according to the peritectic assemblage entrainment model, its
entrainment is essential in generating the distinct geochemical characteristics of I-type
granites. The formation of this mineral assemblage is a consequence of the fluid-absent,
incongruent melting of biotite and hornblende within the source material. Other significant
peritectic minerals, namely plagioclase and ilmenite, are also evident at the proposed
pressure-temperature conditions of the source. Based upon the hypothetical source
composition below garnet does not form part of the peritectic assemblage at the relevant
pressure and temperature conditions of the source. According to the literature, the inclusion
of garnet within the peritectic assemblage is largely controlled by the composition of the source
material, specifically its Mg#, as well as the pressure conditions of incongruent melting within
the source (Villaros et al., 2009a and references therein). Although supported by the literature,
Pseudosection 1 provides the reader with tangible insight into the rationale behind including
these phases within the ‘peritectic’ mineral assemblage utilized within this research.
Stellenbosch University https://scholar.sun.ac.za

CHAPTER 4: EXPERIMENTAL DESIGN
34
LEGEND
I-type granite source PT region (approximate)
Melt Isopleths (vol. %)
1 Pl + Grt + Bt + Cpx + LIQ + Qtz + Rt
2 Pl + Grt + Bt + Cam + Cpx + LIQ + Qtz + Rt
3 Pl + Grt + Bt + Ilm + Opx + Cpx + LIQ + Qtz
4 (2)Pl + Grt + Ilm + Opx + Cpx + LIQ + Qtz
5 Pl + Bt + Ilm + (2)Cam + Cpx + H2O + Qtz
6 Pl + Bt + Ilm + Cam + Cpx + H2O + Qtz
Figure 4 - Pseudosection 1 Phase equilibrium model of an andesite (taken from Clemens et al., 2011, pg. 180) intended to represent the source composition of I-type granites (as proposed in Clemens et al., 2011; Barbarin, 1999; Scheepers, 1995; Roberts and Clemens, 1993; Hine et al., 1978). The mineral-melt assemblage (Pl + Ilm + Opx + Cpx + LIQ + Qtz) at the proposed pressure-temperature conditions of the source (dashed circle) are predicted to result from the fluid-absent, incongruent melting of both biotite and hornblende within the source material (e.g., Clemens et al., 2011).
Stellenbosch University https://scholar.sun.ac.za

CHAPTER 4: EXPERIMENTAL DESIGN
35
This research is predominantly focused on the ‘fate’ of entrained peritectic minerals in high-
level granites at various stages of isobaric cooling. As a result, granulite facies conditions (1
- 11kbar; 600 - 1000˚C) were deemed apt to develop a phase equilibrium model that reflects
the entire granitic system from the proposed pressure and temperature conditions of the
source to those corresponding to its final emplacement. Pseudosection 2 illustrates the various
mineral assemblages obtained when the starting bulk composition is ‘exposed’ to lower-
granulite facies conditions.
Figure 5 - Pseudosection 2 Phase equilibrium model displaying the range of mineral assemblages produced when an average I-type granite composition is exposed to granulite facies conditions. This average I-type granite composition is the one utilized
within this study as the starting bulk composition.
Stellenbosch University https://scholar.sun.ac.za

CHAPTER 4: EXPERIMENTAL DESIGN
36
Issues with Clinopyroxene Modelling
Pseudosection 2 (Figure 5, pg. 35) predicts clinopyroxene to be a stable phase across the
subsolidus pressure-temperature range. The unlikely coexistence of Pl, Qtz, Cpx and H2O in
this region, would indicate issues with the modelling technique across these pressures and
temperatures. This overestimation of clinopyroxene stability may be ascribed to issues with
the amphibole model; i.e. that substitutions involving K and Ti have not been accounted for by
the model at granulite facies conditions (Diener and Powell, 2012). In natural granitic rocks it
is likely that the Ca component within the entrained clinopyroxene would have facilitated the
growth of apatite, which would be impossible to produce from the starting bulk composition
used to create the phase equilibrium model above.
At hypersolidus conditions further issues appear to be apparent with the clinopyroxene model,
specifically in its ability to constrain the clinopyroxene volume percentages at lower
temperatures (<760°C). Examination of the modelling output indicates that the volume
percentages of clinopyroxene are seen to fluctuate dramatically (in some cases across a tenth
of a degree) at these low temperatures and across the entire pressure range (1 – 11kbar).
This is the only mineral out of the modelled mineral assemblage that appears to fluctuate in
its predicted volume to this extent. The aforementioned has made constraining the volume
LEGEND
Cold-Seal Pressure Vessel Pressure-Temperature Upper Limits
Melt Isopleths (vol. %)
Orthopyroxene Isopleths (vol. %)
Hypothetical Ascent and Cooling Paths
H2O – Melt Saturation Band
I-type granite source PT region (approximate)
1 Pl + Bt + Cpx + LIQ + H2O + Qtz + Spn
2 Pl + Bt + Cpx + LIQ + Qtz + Spn
3 Pl + Ilm + Opx + Cpx + LIQ + Qtz + Rt
4 Pl + Bt + Ilm + Cpx + LIQ + H2O + Qtz
5 Pl + Bt + Ilm + Cam + Cpx + LIQ + Qtz
6 Pl + Bt + Ilm + (2)Cam + Cpx + LIQ + Qtz
7 Pl + Bt + Ilm + Opx + Cam + Cpx + LIQ + Qtz
8 Pl + Bt + Ilm + Opx + Cam + Cpx + LIQ
9 Pl + Ilm + Opx + Cam + Cpx + LIQ
10 Pl + Ilm + Opx + Cpx + LIQ + H2O
Stellenbosch University https://scholar.sun.ac.za

CHAPTER 4: EXPERIMENTAL DESIGN
37
percent isopleths of clinopyroxene nigh on impossible, both manually and through software
outputs. This accounts for the noticeable absence of clinopyroxene volume percent isopleths
within Figure 5 (pg. 35).
Hypersolidus Conditions
It should be noted that across the wide range of pressures (1-11kbar) and temperatures (600-
1000°C) of the phase equilibrium model there is no evidence of a liquidus. This corresponds
to the literature that proposes I-type granitic magmas of intermediate to mafic compositions
consist of both melt and crystals (restitic/peritectic) at even the highest temperatures (1000°C)
of crustal anatexis (Clemens et al., 2011; Clemens and Stevens, 2012; Stevens et al.,
2007; Villaros et al., 2009; White and Chappell, 1977). At the proposed conditions of partial
melting of the source the mineral-melt assemblage of this I-type granite composition is the
same as in Pseudosection 1 (pg. 34) for the suggested andesitic source material (barring rutile
and ilmenite). This implies that andesite compositions, such as the one in Pseudosection 1
(pg. 34) are suitable source materials to generate I-type granites of intermediate to mafic
composition.
Hypothetical Ascent Path
The ascent path represents the ascent path of the I-type granitic magma from the hypothetical
source to higher levels within the continental crust. The dashed line begins at source
conditions (~ 9kbar; 850°C), in which melt segregation from the source and the entrainment
of peritectic minerals takes place. It is generally suggested that magma ascent is an adiabatic
process, i.e. one in which thermal energy is not gained or lost during decompression
(Rutherford, 2008). However, heat transfers can result from losses to the surrounding wall
rock during ascent, as well as through the formation of vesicles (gas expansion). Although the
magma is also able to undergo heating as a consequence of latent heat being released during
crystallization (Rutherford, 2008). Unlike the cooling path the ascent path has a steep gradient.
The fact that the path is sloped indicates that with the pressure decrease associated with
magma ascent there is a corresponding temperature decrease (e.g., Stevens et al., 2007).
This drop in temperature is minimal (approx. 50°C) as the rate of ascent is thought to be rapid
(Stevens et al., 2007). This rapid ascent rate means that the granitic magma has minimal time
to interact with the surrounding wall rock during ascent, and is geochemically isolated from its
surroundings (Clemens, 2003).
Hypothetical Isobaric Cooling Path
This path forms the basis for this research. A portion of this range was investigated within this
research, specifically over a temperature range of 720 - 770°C and at a pressure condition of
~2kbar. The mineral assemblages vary considerably along this cooling path, making this a
Stellenbosch University https://scholar.sun.ac.za

CHAPTER 4: EXPERIMENTAL DESIGN
38
compelling area to research. This path describes the mineralogical changes that occur during
granite emplacement within higher levels of the crust (~10km depth). The most significant
mineralogical changes observed along the path (as indicated by Pseudosection 2, pg. 35) is
the formation of biotite and clinoamphibole at lower temperatures. Biotite is the predominant
ferromagnesian mineral at these lower temperature conditions.
Experimental Constraints
Experimental constraints on this research relate largely to the limitations of the machinery
used. For example, experiments had to be conducted below the pressure-temperature limits
of the cold-seal pressure vessels (blue line on Pseudosection 2, pg.35) in order to prevent
damage to the machinery. This, combined with the fact that the experiments needed to be
conducted at pressure and temperature conditions above the zone of H2O-melt saturation
(green-shaded area), has meant that only a small temperature and pressure range could be
investigated in this research.
4.3 Experimental Methodology
Synthetic Starting Material
The main purpose of this study is to shed light on the ‘fate’ of entrained peritectic minerals
within a granitic magma at upper crustal pressure and temperature conditions. To achieve
this by experimentation a synthetic starting material was used. This starting material, along
with a hypothetical peritectic mineral assemblage, was synthesized to be representative of the
melt portion within a natural granitic system. The anhydrous composition of the melt was
obtained from Sen and Dunn (1994). Granitic melts generated from the fluid-absent, partial
melting of biotite and hornblende in both quartzofeldspathic and intermediate source rocks
have H2O contents ranging from 3.0 to 4.7 wt. % at 10kbar (Clemens and Vielzeuf, 1987).
Consequently, the initial melt composition was recalculated to include 4.49 wt. % water.
A synthetic oxide mixture was prepared according to the method drafted in Hamilton and
Henderson, 1968. However, for the purposes of this research various alterations to the method
were necessary. Unlike in Hamilton and Henderson’s method kaolinite and synthesised
fayalite were added to the oxide mixture upon its completion. The fayalite encompassed the
total FeO required to produce the melt fraction. The rationale behind adding fayalite was to
avoid issues with iron oxidation that can occur when other reagents, such as Fe3+ powder or
Fe metal sponge, are added to an oxide mixture. The addition of kaolinite meant human errors
associated with manually adding liquid H2O into the experimental capsules using a syringe
could be avoided entirely. The kaolinite provided the total H2O and Al2O3 components within
the starting material. As it is hygroscopic in nature, care was taken to ensure that the kaolinite
Stellenbosch University https://scholar.sun.ac.za

CHAPTER 4: EXPERIMENTAL DESIGN
39
was stored within a drying cupboard at 110°C prior to its inclusion in the starting material. The
proportions of fayalite and kaolinite added to the starting material were determined through
stoichiometric calculations.
The fayalite used within the experiments was synthesised by combining SiO2, Fe metal and
Fe2O3 in the correct molar proportions. This mixture was then pressed into pellets (~0.5cm
diameter) using a hydraulic press. Oxyacetylene welding was conducted on the base of a
glass tube. The pellets were then placed into the tube. The tube was flushed with argon gas,
and then the tube was melted closed under vacuum. A vacuum test was then conducted on
the tube to determine if there were any leakages. This was done by submerging the tube in
water within a Schlenk flask under vacuum. Once it was established that the tube was airtight;
it was placed in a furnace at ~900°C for 3 days. The resulting fayalite powder was then
removed from the tube and analysed using X-Ray Diffraction. The powder was then ground
down to a fine powder (<50µm) using an agate pestle and mortar.
Both the fayalite and kaolinite were added in the correct molar proportions to the oxide mixture
upon its completion. The mixture comprised of a number of oxides, specifically SiO2, TiO2,
Al2O3, MgO, CaO, Na2O and K2O. The exact composition of the oxide mixture is outlined in
Table 1 below.
Table 1 - Synthetic Silicate Melt Composition
SiO2 TiO2 Al2O3 Fe2O3 FeO MnO MgO CaO Na2O K2O H2O Sum
72.35 0.11 12.89 0.00 0.97 0.00 0.09 1.00 3.57 4.55 4.49 100.00
The final result produces a white powder. The powder was wet-batch milled for 25 minutes
under acetone in a Fritsch Planetary Mill to ensure a fineness of <50µm. Once this process
was complete the powder was left to dry at room temperature, before later storage at 110°C
in a drying cupboard.
Peritectic Mineral Assemblage
The melting reaction involved in the production of I-type granitic magmas is as follows:
Bt + Hbl + Qtz + Pl1 ⇄ melt + Pl2 + Cpx + Opx + Ilm ± Grt (Clemens and Stevens, 2012).
From this melting reaction it can be determined that the peritectic assemblage comprises of;
plagioclase, clinopyroxene, orthopyroxene, ilmenite and garnet.
The aforementioned minerals were collected from Limpopo granulite samples provided by
Gautier Nicoli. Each of the rock samples were crushed into grains ranging in size from 2-4mm
using a geological hammer. The plagioclase grains were then individually separated using
Stellenbosch University https://scholar.sun.ac.za
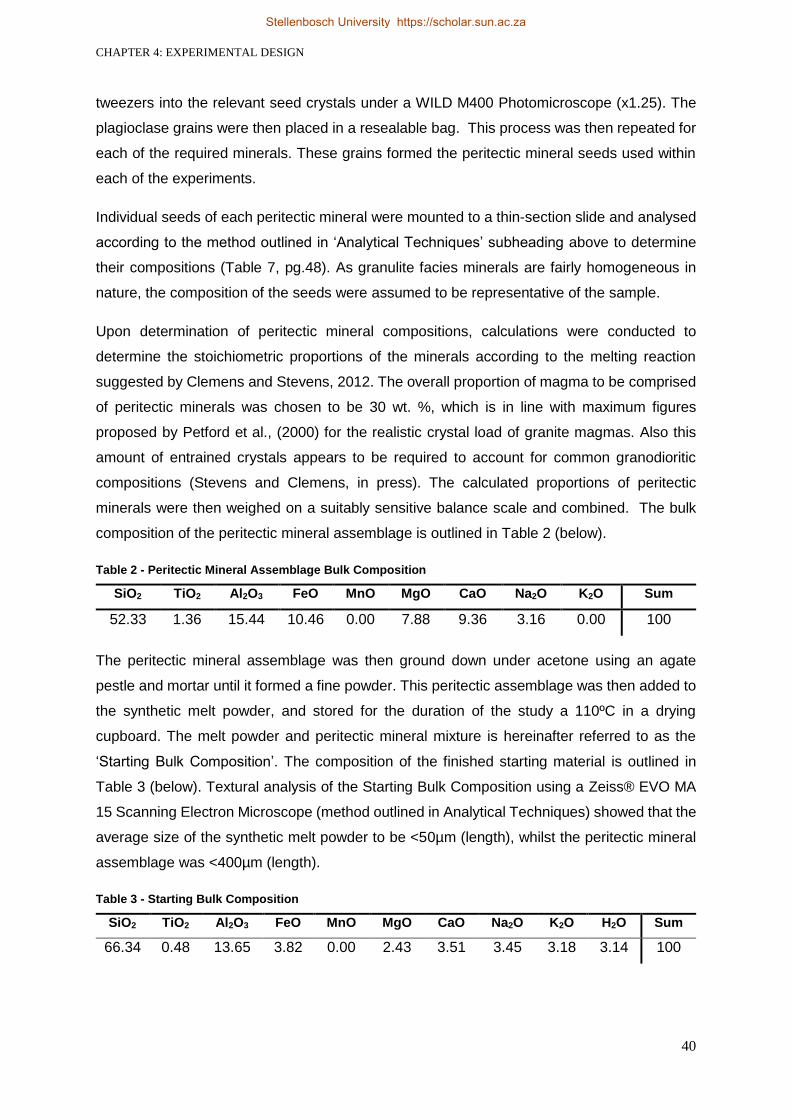
CHAPTER 4: EXPERIMENTAL DESIGN
40
tweezers into the relevant seed crystals under a WILD M400 Photomicroscope (x1.25). The
plagioclase grains were then placed in a resealable bag. This process was then repeated for
each of the required minerals. These grains formed the peritectic mineral seeds used within
each of the experiments.
Individual seeds of each peritectic mineral were mounted to a thin-section slide and analysed
according to the method outlined in ‘Analytical Techniques’ subheading above to determine
their compositions (Table 7, pg.48). As granulite facies minerals are fairly homogeneous in
nature, the composition of the seeds were assumed to be representative of the sample.
Upon determination of peritectic mineral compositions, calculations were conducted to
determine the stoichiometric proportions of the minerals according to the melting reaction
suggested by Clemens and Stevens, 2012. The overall proportion of magma to be comprised
of peritectic minerals was chosen to be 30 wt. %, which is in line with maximum figures
proposed by Petford et al., (2000) for the realistic crystal load of granite magmas. Also this
amount of entrained crystals appears to be required to account for common granodioritic
compositions (Stevens and Clemens, in press). The calculated proportions of peritectic
minerals were then weighed on a suitably sensitive balance scale and combined. The bulk
composition of the peritectic mineral assemblage is outlined in Table 2 (below).
Table 2 - Peritectic Mineral Assemblage Bulk Composition
SiO2 TiO2 Al2O3 FeO MnO MgO CaO Na2O K2O Sum
52.33 1.36 15.44 10.46 0.00 7.88 9.36 3.16 0.00 100
The peritectic mineral assemblage was then ground down under acetone using an agate
pestle and mortar until it formed a fine powder. This peritectic assemblage was then added to
the synthetic melt powder, and stored for the duration of the study a 110ºC in a drying
cupboard. The melt powder and peritectic mineral mixture is hereinafter referred to as the
‘Starting Bulk Composition’. The composition of the finished starting material is outlined in
Table 3 (below). Textural analysis of the Starting Bulk Composition using a Zeiss® EVO MA
15 Scanning Electron Microscope (method outlined in Analytical Techniques) showed that the
average size of the synthetic melt powder to be <50µm (length), whilst the peritectic mineral
assemblage was <400µm (length).
Table 3 - Starting Bulk Composition
SiO2 TiO2 Al2O3 FeO MnO MgO CaO Na2O K2O H2O Sum
66.34 0.48 13.65 3.82 0.00 2.43 3.51 3.45 3.18 3.14 100
Stellenbosch University https://scholar.sun.ac.za
CHAPTER 4: EXPERIMENTAL DESIGN
41
Capsules
The capsules utilised within the experiments were created by fashioning gold sheets into
cylindrical tubes. The gold sheets were approximately 2mm in thickness. Gold was chosen as
the capsule medium as it is almost inert, easy to mould into cylinders and it has a low H2
diffusivity (Ratajeski and Sisson, 1999). However, one of the most important reasons gold was
used is that in regards to silicate samples gold absorbs minimal Fe (Ratajeski and Sisson,
1999). The base of the cylindrical tube was crimped using pliers to a depth of 2mm. An arc
welder with a graphite electrode (set at 70A) was then used to seal the end. This method
created a ‘toothpaste-tube’ style well in which the materials relevant to experimentation could
sit. The sealed end was then examined under a WILD M400 Photomicroscope (x1.25) to
confirm that no holes were present within the seal.
The starting bulk composition was then added to the ‘toothpaste-tube’ like capsule. A gap
approximately 3 mm deep was left to allow for sufficient space for the top of the capsule to be
welded. The top of the cylindrical tube was welded closed in the same manner as the base.
The diameter and length of each of the capsules was approximately 10mm by 5mm. The entire
procedure was then repeated for each experiment.
Experimental Apparatus
A cold seal pressure vessel was used to expose the gold capsule (containing the synthetic gel
and peritectic minerals) to approximate granulite facies conditions (700 - 800°C and ~2kbar)
during experimentation. A Marshall Furnace (Series 1100) was utilized as it has a maximum
temperature of 1200°C. These temperatures are generated by a series of heavy gauge nickel-
chrome wires coiled around a ceramic tube. This tube sits in a mullite muffle that acts as an
insulator and helps regulate and maintain a uniform temperature across the furnace. The
machine allows for a maximum voltage output of 110V. The system utilizes a Haskel air driven
double acting pump, which generates the water pressure within the vessel. The air pressure
within the system is monitored by a Bundenberg Standard Test gauge (lb/in2). The confining
water pressure within the cold seal pressure vessel is monitored using a HEISE Pressure
gauge, with a range of between 0-50 000 PSI. A digital Temperature Controller measured the
temperature at this point during experiments using a K -type thermocouple.
Before experiments could be conducted a 35cm long K-type thermocouple wire was marked
in 1cm increments and placed cm-by-cm inside the furnace during a test run. This test run was
run at a constant temperature of 300°C, and was not conducted under pressure. By measuring
the temperature at each cm interval the hottest part or ‘hot spot’ of the furnace was found to
be at a depth of 18cm. The portion of the Inconel vessel containing the gold capsule sat at this
depth (18cm) during each experiment to ensure consistency.
Stellenbosch University https://scholar.sun.ac.za

CHAPTER 4: EXPERIMENTAL DESIGN
42
Experimental Procedure
A calibration experiment was conducted to determine the temperature gradient between the
external and internal portion of the Inconel vessel. During the calibration experiment no gold
capsule was placed within the vessel. In order to measure the internal temperature of the
Inconel vessel a 40cm K-type thermocouple was wired through the entire apparatus. Care
was taken to ensure that the tip of this K-type thermocouple was located at the same point as
a gold capsule would have been during a routine experimental setup (~18cm depth).
The calibration experiment required a setup whereby a K-type thermocouple needed to be
placed through and silver soldered to a steel cone. The steel cone acted as a seal to prevent
water leakages and ensured the pressure within the Inconel vessel remained constant during
the calibration experiment. Once soldered, the steel cone and thermocouple were then placed
through a steel T-piece attachment. The T-piece attachment was then screwed into the base
of the experimental platform (underneath a hole in the platform), allowing the thermocouple to
be exposed above the experimental platform. The cold seal pressure components, including
the Inconel vessel, were then placed over the thermocouple and tightened with a wrench
(Figure 7, overleaf).
Figure 6 - Photograph of the Experimental Machinery
Stellenbosch University https://scholar.sun.ac.za

CHAPTER 4: EXPERIMENTAL DESIGN
43
Inconel 713 Vessel
Filler Rod (Steel)
Cone Seal
Experimental Platform
Gold Capsule Location
Thermocouple Well
Figure 7 - Schematic of the Standard Cold-Seal Pressure Vessel Set-up
Stellenbosch University https://scholar.sun.ac.za

CHAPTER 4: EXPERIMENTAL DESIGN
44
An initial calibration experiment was conducted where the Inconel vessel was placed over the
thermocouple without a steel filler rod inside it. A 35cm K-type thermocouple was placed into
the external thermocouple well, located at the top of the Inconel vessel. The furnace was then
placed over the vessel, coming to rest just above the ‘cone seal’, which forms the cold seal
portion of the apparatus. The pressure and temperature conditions of this initial calibration
experiment were 1 kbar and 700-780°C (tested in 20°C intervals). The results of this initial
calibration experiment are shown below.
Table 4 - Calibration Experiment Results (Test 1)
It is evident from the table above that there is a significant discrepancy between the external
and internal thermocouple readings (average = 17.4°C). It was initially thought that the
absence of a filler rod allowed for the redistribution of heat between the cooler base and the
hotter upper portion of the Inconel vessel. It was thought that the constant convection of water
around the inside of the vessel was causing this problem, and that a filler rod would reduce
the heat loss associated with this convection. As a result a second calibration experiment was
conducted to confirm and validate the accuracy of the initial calibration experiment’s results.
In this second calibration test a filler rod was used inside the Inconel vessel. The cylindrical
steel filler rod needed to be filed down to create a flat side that would allow for the 40 cm K-
type thermocouple to fit alongside it within the Inconel vessel (Figure 8, overleaf) The rod was
filed down using a steel file. The base of the rod was also filed down (Figure 9, pg.46) to
prevent the thermocouple from being crushed when the Inconel vessel was attached to the
rest of the experimental setup. Instead this shape would mean that the thermocouple would
bend minimally, but still be able to be pushed up the side of the filler rod. This step was
considered to be appropriate, as the combined space taken up by the thermocouple and the
filed steel rod is equivalent to the space taken up by an unfiled steel filler rod during a standard
experiment. The results of this second calibration experiment are shown overleaf.
Furnace Control T (°C) Internal T (°C) P (kbar) External T (°C) Difference (°C)
725 681 1.00 701 20
735 704 1.00 721 17
756 724 1.00 741 17
775 744 1.00 761 17
793 765 1.00 781 16
Stellenbosch University https://scholar.sun.ac.za

CHAPTER 4: EXPERIMENTAL DESIGN
45
Table 5 - Calibration Experiment Results (Test 2)
From the results of the second calibration experiment it was determined that the temperature
difference between the external and internal temperature of the Inconel vessel of a cold seal
pressure differs on average by ~17°C. It was also determined that the filler rod had no effect
on the redistribution of heat within the vessel by convection processes. Temperature
adjustments were made in future experiments to accommodate the temperature discrepancies
of the internal and external parts of Inconel vessel. The reader should also note that relevant
higher temperature experiments were unable to be conducted due to the pressure-
temperature limitations of the cold seal-pressure vessel.
Furnace Control T (°C) Internal T (°C) P (kbar) External T (°C) Difference (°C)
725 680 1.00 700 20
734 703 1.00 721 18
748 724 1.00 741 17
770 744 1.00 743 17
790 764 1.00 780 16
Filler Rod (Steel)
K-type Thermocouple Inconel vessel
Figure 8 - Cross-section of Inconel vessel (Calibration Experiment – Test 2)
Stellenbosch University https://scholar.sun.ac.za

CHAPTER 4: EXPERIMENTAL DESIGN
46
Standard experiments were conducted in a similar manner to the calibration experiments. In
the standard experiments the gold capsules containing the starting bulk composition were
used. These gold capsules were held in place by an unfiled steel filler rod within the Inconel
vessel. No internal thermocouple was used during the standard experimental set-up, instead
the temperature was monitored by an external 35cm K-type thermocouple that sat in the
thermocouple well at the top of the Inconel vessel. Temperature and pressure readings were
recorded daily during the 10 day period of experimentation. These temperature readings were
then later adjusted by 17°C due to temperature discrepancies within the set-up. Upon
completion each experiment was quenched. During quenching solidus temperatures were
reached in under a minute. The furnace was lifted from around the Inconel vessel. The Inconel
vessel was then further cooled using compressed air and water to bring the vessel down to
60°C, allowing for the gold capsule to be removed from the Inconel vessel. The gold capsule
was weighed before and after experimentation to ensure that there were no leaks in the
capsule during the experimental run. The gold capsules were cut open using scissors and the
contents were carefully removed using tweezers and placed into labelled plastic vials for later
analysis.
Figure 9 - Side profile of Inconel vessel base (Calibration Experiment – Test 2)
Inconel Vessel
Filler Rod (Steel)
K-type thermocouple
Stellenbosch University https://scholar.sun.ac.za

CHAPTER 5: RESULTS
47
Chapter 5: Results
The results section is subdivided into three main subsections. The subsection below (5.1) presents the experimental mineral and melt
compositions in comprehensive tables. The section thereafter (Textures in the Experimental Run Products, pg. 61) shows BSE images taken
using the Zeiss® SEM show the mineral textures produced by experimentation. Finally, the ‘Mineral and Textural Descriptions’ (pg. 67) section
provides the reader with a detailed discussion of the compositional and textural features of the experimental run products.
Table 6 - Experimental PT Conditions and Mineral Assemblages
Experiment P
(kbar) Dev.
T (°C)
Dev. Experimental Mineral Assemblages
1 1.90 0.0 733 1.0 Pl + Ilm + Cpx + Bt + LIQ + Qtz
2 1.90 0.0 763 2.0 Pl + Ilm + Grt + Bt + Opx + Cpx + LIQ + Qtz
3 1.90 0.0 723 2.0 Pl + Bt + Grt + Opx + Cam + Cpx + LIQ + H2O + Qtz
4 1.40 0.0 743 1.0 Pl + Ilm + Cpx + Grt + Cam + Bt + LIQ + H2O + Qtz
5 1.40 0.0 730 1.0 Pl + Grt + Ilm + Cpx + Cam + Bt + LIQ + H2O + Qtz
*Metastable phases are indicated in red.
Stellenbosch University https://scholar.sun.ac.za
Stellenbosch University https://scholar.sun.ac.za

CHAPTER 5: RESULTS
48
5.1 Mineral and Melt Compositions
Table 7 - Peritectic Assemblage Mineral Compositions
Grt Pl Opx Cpx Ilm
SiO2 37.95 59.05 51.86 52.66 0.00 TiO2 0.00 0.00 0.00 0.00 50.10 Al2O3 21.91 25.54 3.97 2.55 0.00 Cr2O3 0.00 0.00 0.00 0.88 0.00
Fe2O3 0.92 0.00 1.06 0.00 4.66
FeO 30.13 0.00 20.06 7.84 44.24
MnO 0.54 0.00 0.00 0.00 0.99
MgO 6.21 0.00 22.20 18.14 0.37
CaO 2.64 7.21 0.00 17.64 0.00 Na2O 0.00 7.41 0.00 0.00 0.00
K2O 0.00 0.29 0.00 0.00 0.00
Total 100.29 99.50 99.16 99.70 100.34
Si 2.97 2.65 1.94 1.94 0.00
Ti 0.00 0.00 0.00 0.00 0.95
Al 2.02 1.35 0.17 0.11 0.00 Cr 0.00 0.00 0.00 0.03 0.00
Fe3+ 0.05 0.00 0.03 0.00 0.09
Fe2+ 1.97 0.00 0.63 0.24 0.94
Mn 0.04 0.00 0.00 0.00 0.02
Mg 0.72 0.00 1.24 0.99 0.01 Ca 0.22 0.35 0.00 0.69 0.00
Na 0.00 0.64 0.00 0.00 0.00
K 0.00 0.02 0.00 0.00 0.00
Sum 8.00 5.01 4.00 4.00 2.00
Mg# 26.28 0.00 65.26 80.49 0.96
XAna - 34.39 - - -
XAbb - 63.96 - - -
XOrc - 1.65 - - -
Stellenbosch University https://scholar.sun.ac.za
Stellenbosch University https://scholar.sun.ac.za

CHAPTER 5: RESULTS
49
XWod - - 0.00 - -
XEne - - 66.36 - -
XFsf - - 33.64 - -
XAegg - - - 0.00 -
XJdh - - - 0.00 -
XDii - - - 100.00 -
XAlmj 67.36 - - - -
XPrpk 24.09 - - - -
XGrsl 7.36 - - - -
XSpsm 1.19 - - - -
aXAn = (Ca/(Ca + Na + K)) * 100 b
XAb = (Na/(Ca + Na + K)) * 100 cXOr = (K/(Ca + Na + K)) * 100 dXWo = (Ca/Ca + Mg + FeT) * 100 eXEn = (Mg/Ca + Mg + FeT) * 100 fXFs = (FeT/Ca + Mg + FeT) * 100 gXAeg = (Fe3+ *(Fe3+ + (Na-Fe3+) + Ca)) * 100 hXJd = ((Na-Fe3+)/(Fe3+ + ( Na-Fe3+) + Ca)) * 100 iXDi = (Ca/(Fe3+ + (Na-Fe3+) + Ca)) * 100 jXAlm = (FeT/(Ca + Mg + Mn + Fe)) * 100 kXPrp = (Mg/(Ca + Mg + Mn + FeT)) * 100 lXGrs = (Ca/(Ca + Mg + Mn + FeT)) * 100 mXSps =(Mn/(Ca + Mg + Mn + FeT)) * 100 Fe3+ calculated using Droop (1987) Mg# = 100 * (Mg/(Mg + Fe2+ + Fe3+))
Stellenbosch University https://scholar.sun.ac.za
Stellenbosch University https://scholar.sun.ac.za

CHAPTER 5: RESULTS
50
Table 8 - Experiment 1 Average Mineral Compositions
Pressure 1.90kbar
Temperature 733°C
Duration 10 days
Melt Pl Cpx Ilm
Core Rim
n= 15 σ n= 7 σ n=6 σ n=7 σ n=7 σ
SiO2 69.45 1.2 58.91 0.4 52.36 0.2 51.99 0.9 0.07 0.0 TiO2 0.00 0.0 0.00 0.0 0.05 0.0 0.35 0.1 50.08 0.5 Al2O3 12.27 0.3 25.53 0.2 2.55 0.1 1.84 0.2 0.00 0.0 Cr2O3 0.00 0.0 0.00 0.0 1.10 0.0 0.54 0.3 0.00 0.0 Fe2O3 0.00 0.0 0.00 0.0 0.00 0.0 1.45 0.0 7.39 0.0 FeO 0.60 0.1 0.05 0.0 5.64 0.2 9.26 0.5 39.30 0.0 MnO 0.00 0.0 0.00 0.0 0.00 0.0 0.69 0.1 2.57 0.1 MgO 0.00 0.0 0.00 0.0 15.59 0.2 11.59 0.3 1.81 0.1 CaO 0.54 0.0 7.53 0.4 22.41 0.3 21.87 0.4 0.00 0.0 Na2O 2.57 0.3 6.98 0.4 0.06 0.0 0.73 0.1 0.00 0.0 K2O 4.53 0.2 0.48 0.2 0.00 0.0 0.15 0.0 0.00 0.0
Total 89.96 1.1 99.48 0.4 99.76 0.6 100.46 0.7 101.22 0.5
Si - - 2.65 - 1.94 - 1.95 - 0.00 - Ti - - 0.00 - 0.00 - 0.01 - 0.93 - Al - - 1.35 - 0.11 - 0.08 - 0.00 - Cr - - 0.00 - 0.03 - 0.02 - 0.00 - Fe3+ - - 0.00 - 0.00 - 0.04 - 0.14 - Fe2+ - - 0.00 - 0.17 - 0.29 - 0.81 - Mn - - 0.00 - 0.00 - 0.02 - 0.07 - Mg - - 0.00 - 0.86 - 0.65 - 0.05 - Ca - - 0.36 - 0.89 - 0.88 - 0.00 - Na - - 0.61 - 0.00 - 0.05 - 0.00 - K - - 0.03 - 0.00 - 0.01 - 0.00 -
Sum - - 5.00 - 4.00 - 4.00 - 2.00 -
Mg# - - 0.00 - 83.13 - 66.18 - 5.00 -
Stellenbosch University https://scholar.sun.ac.za
Stellenbosch University https://scholar.sun.ac.za

CHAPTER 5: RESULTS
51
XAna - - 36.32 - - - - - - -
XAbb - - 60.92 - - - - - - -
XOrc - - 2.76 - - - - - - -
XWoa - - - - - - - - - -
XEnb - - - - - - - - - -
XFsc - - - - - - - - - -
XAegd - - - - 0.00 - 0.00 - - -
XJd e - - - - 0.48 - 5.70 - - -
XDif - - - - 99.52 - 94.30 - - -
XAlmj - - - - - - - - - -
XPrpk - - - - - - - - - -
XGrsl - - - - - - - - - -
XSpsm - - - - - - - - - -
aXAn = (Ca/(Ca + Na + K)) * 100 b
XAb = (Na/(Ca + Na + K)) * 100 cXOr = (K/(Ca + Na + K)) * 100 dXWo = (Ca/Ca + Mg + FeT) * 100 eXEn = (Mg/Ca + Mg + FeT) * 100 fXFs = (FeT/Ca + Mg + FeT) * 100 gXAeg = (Fe3+ *(Fe3+ + (Na-Fe3+) + Ca)) * 100 hXJd = (Na-Fe3+)/(Fe3+ + ( Na-Fe3+) + Ca) * 100 iXDi = (Ca/(Fe3+ + (Na-Fe3+) + Ca)) * 100 jXAlm = (FeT/(Ca + Mg + Mn + FeT)) * 100 kXPrp = (Mg/(Ca + Mg + Mn + FeT)) * 100 lXGrs = (Ca/(Ca + Mg + Mn + FeT)) * 100 mXSps =(Mn/(Ca + Mg + Mn + FeT)) * 100 Fe3+ calculated using Droop (1987) Mg# = 100 * (Mg/(Mg + Fe2+ + Fe3+))
Stellenbosch University https://scholar.sun.ac.za
Stellenbosch University https://scholar.sun.ac.za

CHAPTER 5: RESULTS
52
Table 9 - Experiment 2 Average Mineral Compositions
Pressure 1.90 kbar Temperature 763°C Duration 10 days
Melt Grt Pl Opx Cpx Ilm
n=21 Σ n=5 σ n=4 σ n=3 σ n=6 σ n=5 σ
SiO2 71.24 0.9 38.86 0.2 56.58 3.9 54.30 0.2 52.23 0.2 0.07 0.0 TiO2 0.00 0.0 0.00 0.0 0.04 0.1 0.00 0.0 0.26 0.0 50.08 1.2 Al2O3 11.26 0.2 21.96 0.2 27.39 2.3 1.79 0.0 2.48 0.1 0.00 0.0 Cr2O3 0.00 0.0 0.22 0.1 0.07 0.1 0.39 0.0 1.78 0.1 0.00 0.0 Fe2O3 0.00 0.0 0.70 0.0 0.00 0.0 1.51 0.0 0.00 0.0 8.89 0.0 FeO 0.60 0.1 26.85 0.2 0.31 0.2 12.39 0.4 6.71 0.5 37.95 1.1 MnO 0.00 0.0 0.00 0.0 0.00 0.0 0.54 0.1 0.00 0.0 2.57 0.1 MgO 0.00 0.0 8.30 0.0 0.07 0.1 28.09 0.4 16.96 0.7 1.81 0.2 CaO 0.69 0.1 3.52 0.1 10.08 2.2 0.88 0.0 19.45 1.0 0.00 0.0 Na2O 2.03 0.1 0.00 0.0 4.59 1.4 0.00 0.0 0.26 0.1 0.00 0.0 K2O 3.96 0.1 0.00 0.0 0.75 0.5 0.00 0.0 0.00 0.0 0.00 0.0
Total 89.78 1.2 100.41 0.4 99.87 0.4 99.89 0.4 100.13 0.3 101.37 0.2
Si - - 2.99 - 2.73 - 1.95 - 1.92 - 0.00 - Ti - - 0.00 - 0.00 - 0.00 - 0.01 - 0.91 - Al - - 1.99 - 1.56 - 0.07 - 0.11 - 0.00 - Cr - - 0.01 - 0.00 - 0.01 - 0.05 - 0.00 - Fe3+ - - 0.04 - 0.00 - 0.04 - 0.00 - 0.18 - Fe2+ - - 1.73 - 0.01 - 0.37 - 0.21 - 0.84 - Mn - - 0.00 - 0.00 - 0.02 - 0.00 - 0.06 - Mg - - 0.95 - 0.01 - 1.50 - 0.93 - 0.02 - Ca - - 0.29 - 0.52 - 0.03 - 0.77 - 0.00 - Na - - 0.00 - 0.09 - 0.00 - 0.02 - 0.00 -
K - - 0.00 - 0.07 - 0.00 - 0.00 - 0.00 -
Sum - - 8.00 - 5.00 - 4.00 - 4.00 - 2.00 -
Mg# - - 34.99 - 0.00 - 78.45 - 81.84 - 1.92 -
XAna - - - - 52.58 - - - - - - -
Stellenbosch University https://scholar.sun.ac.za
Stellenbosch University https://scholar.sun.ac.za
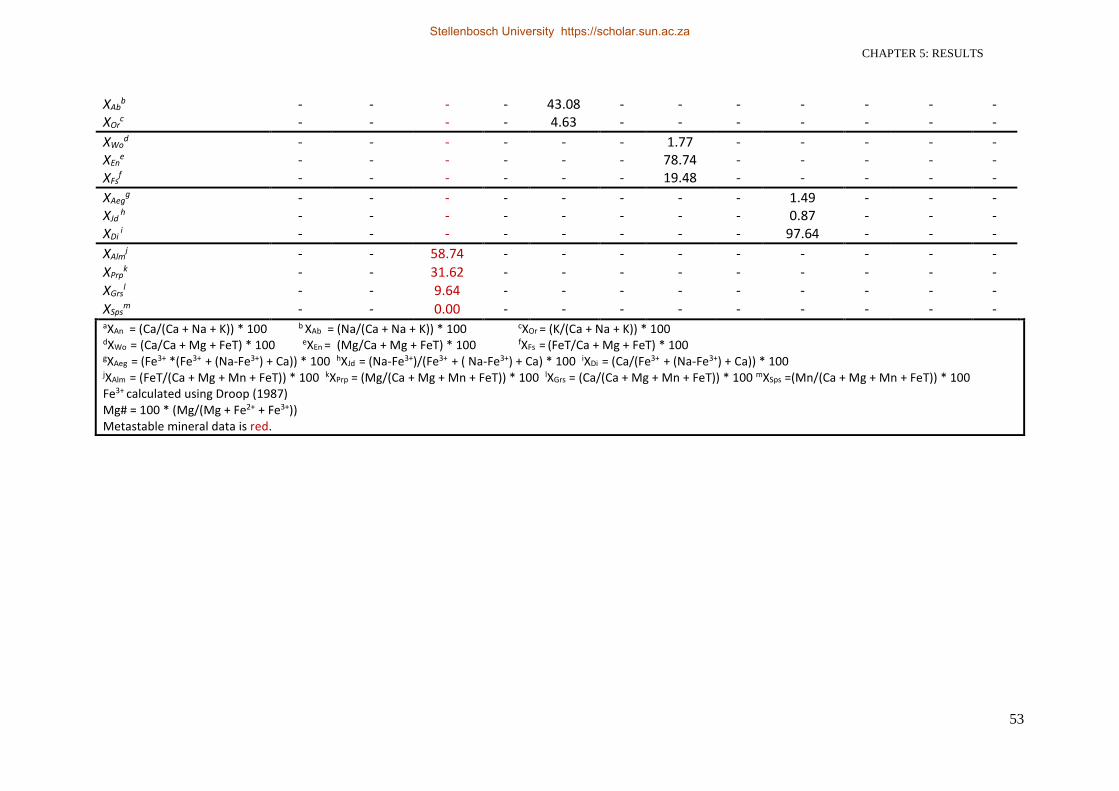
CHAPTER 5: RESULTS
53
XAbb - - - - 43.08 - - - - - - -
XOrc - - - - 4.63 - - - - - - -
XWod - - - - - - 1.77 - - - - -
XEne - - - - - - 78.74 - - - - -
XFsf - - - - - - 19.48 - - - - -
XAegg - - - - - - - - 1.49 - - -
XJd h - - - - - - - - 0.87 - - -
XDi i - - - - - - - - 97.64 - - -
XAlmj - - 58.74 - - - - - - - - -
XPrpk - - 31.62 - - - - - - - - -
XGrsl - - 9.64 - - - - - - - - -
XSpsm - - 0.00 - - - - - - - - -
aXAn = (Ca/(Ca + Na + K)) * 100 b
XAb = (Na/(Ca + Na + K)) * 100 cXOr = (K/(Ca + Na + K)) * 100 dXWo = (Ca/Ca + Mg + FeT) * 100 eXEn = (Mg/Ca + Mg + FeT) * 100 fXFs = (FeT/Ca + Mg + FeT) * 100 gXAeg = (Fe3+ *(Fe3+ + (Na-Fe3+) + Ca)) * 100 hXJd = (Na-Fe3+)/(Fe3+ + ( Na-Fe3+) + Ca) * 100 iXDi = (Ca/(Fe3+ + (Na-Fe3+) + Ca)) * 100 jXAlm = (FeT/(Ca + Mg + Mn + FeT)) * 100 kXPrp = (Mg/(Ca + Mg + Mn + FeT)) * 100 lXGrs = (Ca/(Ca + Mg + Mn + FeT)) * 100 mXSps =(Mn/(Ca + Mg + Mn + FeT)) * 100 Fe3+ calculated using Droop (1987) Mg# = 100 * (Mg/(Mg + Fe2+ + Fe3+)) Metastable mineral data is red.
Stellenbosch University https://scholar.sun.ac.za
Stellenbosch University https://scholar.sun.ac.za

CHAPTER 5: RESULTS
54
Table 10 - Experiment 3 Average Mineral Compositions
Pressure 1.90 kbar Temperature 723°C Duration 10 days
Melt Pl Cpx Opx Grt
n=10 σ n= 6 σ n= 6 σ n= 4 σ n= 6 σ
SiO2 71.61 1.1 59.84 0.2 52.74 0.5 52.06 0.2 38.95 0.2 TiO2 0.00 0.0 0.00 0.0 0.36 0.0 0.00 0.0 0.00 0.0 Al2O3 12.23 0.8 25.38 0.2 2.45 0.3 4.15 0.1 22.00 0.2 Cr2O3 0.00 0.0 0.00 0.0 0.64 0.3 0.00 0.0 0.00 0.0 Fe2O3 0.00 0.0 0.00 0.0 2.31 0.0 0.19 0.0 1.29 0.0 FeO 0.52 0.1 0.00 0.0 3.95 0.3 21.11 0.1 25.46 0.1 MnO 0.00 0.0 0.00 0.0 0.00 0.0 0.00 0.0 0.48 0.1 MgO 0.00 0.0 0.00 0.0 14.70 0.3 22.86 0.1 8.42 0.1 CaO 0.85 0.3 7.43 0.0 22.36 0.3 0.30 0.0 4.40 0.1 Na2O 2.51 0.4 7.28 0.1 0.99 0.5 0.00 0.0 0.00 0.0 K2O 3.75 0.3 0.46 0.0 0.00 0.0 0.00 0.0 0.00 0.0
Total 91.46 0.6 100.39 0.2 100.49 0.5 100.68 0.3 100.99 0.4
Si - - 2.66 - 1.93 - 1.91 - 2.97 - Ti - - 0.00 - 0.01 - 0.00 - 0.00 - Al - - 1.33 - 0.11 - 0.18 - 1.98 - Cr - - 0.00 - 0.01 - 0.00 - 0.00 - Fe3+ - - 0.00 - 0.06 - 0.01 - 0.07 - Fe2+ - - 0.00 - 0.12 - 0.65 - 1.63 - Mn - - 0.00 - 0.00 - 0.00 - 0.03 - Mg - - 0.00 - 0.80 - 1.25 - 0.96 - Ca - - 0.35 - 0.88 - 0.01 - 0.36 - Na - - 0.63 - 0.07 - 0.00 - 0.00 -
K - - 0.03 - 0.00 - 0.00 - 0.00 -
Sum - - 5.00 - 4.00 - 4.00 - 8.00 -
Mg# - - 0.00 - 81.32 - 65.68 - 36.09 -
XAna - - 35.13 - - - - - - -
Stellenbosch University https://scholar.sun.ac.za
Stellenbosch University https://scholar.sun.ac.za

CHAPTER 5: RESULTS
55
XAbb - - 62.28 - - - - - - -
XOrc - - 2.59 - - - - - - -
XWod - - - - - - 0.62 - - -
XEne - - - - - - 65.47 - - -
XFsf - - - - - - 33.92 - - -
XAegg - - - - 0.01 - - - - -
XJd h - - - - 7.40 - - - - -
XDi i - - - - 92.58 - - - - -
XAlmj - - - - - - - - 55.75 -
XPrpk - - - - - - - - 31.43 -
XGrsl - - - - - - - - 11.80 -
XSpsm - - - - - - - - 1.02 -
aXAn = (Ca/(Ca + Na + K)) * 100 b
XAb = (Na/(Ca + Na + K)) * 100 cXOr = (K/(Ca + Na + K)) * 100 dXWo = (Ca/Ca + Mg + FeT) * 100 eXEn = (Mg/Ca + Mg + FeT) * 100 fXFs = (FeT/Ca + Mg + FeT) * 100 gXAeg = (Fe3+ *(Fe3+ + (Na-Fe3+) + Ca)) * 100 hXJd = (Na-Fe3+)/(Fe3+ + ( Na-Fe3+) + Ca) * 100 iXDi = (Ca/(Fe3+ + (Na-Fe3+) + Ca)) * 100 jXAlm = (FeT/(Ca + Mg + Mn + FeT)) * 100 kXPrp = (Mg/(Ca + Mg + Mn + FeT)) * 100 lXGrs = (Ca/(Ca + Mg + Mn + FeT)) * 100 mXSps =(Mn/(Ca + Mg + Mn + FeT)) * 100 Fe3+ calculated using Droop (1987) Mg# = 100 * (Mg/(Mg + Fe2+ + Fe3+)) Metastable mineral data is red.
Stellenbosch University https://scholar.sun.ac.za
Stellenbosch University https://scholar.sun.ac.za

CHAPTER 5: RESULTS
56
Table 11 - Experiment 4 Average Mineral Compositions
Pressure Temperature Duration
1.40 kbar 743°C 10 days
Melt Grt Ilm Pl Cpx (1)
Cpx (2)
n= 14 Σ n= 12 σ n= 3 σ n= 7 σ n= 8 σ n= 7 σ
SiO2 71.15 0.8 38.14 0.3 6.40 0.7 59.98 0.8 52.77 0.6 52.37 0.4 TiO2 0.00 0.0 0.00 0.0 23.23 0.7 0.00 0.0 0.32 0.0 0.33 0.0 Al2O3 11.33 0.2 21.71 0.2 1.46 0.1 25.34 0.1 2.34 0.2 2.90 0.3 Cr2O3 0.00 0.0 0.00 0.0 0.00 0.0 0.00 0.0 0.92 0.1 1.13 0.1 Fe2O3 0.00 0.0 0.68 0.0 44.78 0.0 0.00 0.0 0.71 0.0 0.00 0.0 FeO 0.51 0.1 30.36 0.3 25.79 0.4 0.00 0.0 9.05 1.7 5.51 0.3 MnO 0.00 0.0 0.43 0.1 0.00 0.0 0.00 0.0 0.47 0.0 0.00 0.0 MgO 0.00 0.0 6.48 0.1 1.10 0.1 0.00 0.0 20.77 2.2 15.68 0.4 CaO 0.69 0.1 2.55 0.1 0.00 0.0 7.34 0.2 13.14 3.7 22.07 0.8 Na2O 1.81 0.3 0.00 0.0 0.00 0.0 7.23 0.2 0.00 0.0 0.00 0.0 K2O 4.14 0.1 0.00 0.0 0.26 0.0 0.32 0.0 0.00 0.0 0.00 0.0
Total 89.63 0.9 100.34 0.7 103.03 0.5 100.21 0.6 100.49 0.5 99.98 0.7
Si - - 2.98 - 0.15 - 2.67 - 1.92 - 1.93 - Ti - - 0.00 - 0.42 - 0.00 - 0.01 - 0.01 - Al - - 2.00 - 0.04 - 1.33 - 0.10 - 0.13 - Cr - - 0.00 - 0.00 - 0.00 - 0.02 - 0.02 - Fe3+ - - 0.04 - 0.81 - 0.00 - 0.02 - 0.00 - Fe2+ - - 1.98 - 0.52 - 0.00 - 0.28 - 0.17 - Mn - - 0.03 - 0.00 - 0.00 - 0.01 - 0.00 - Mg - - 0.75 - 0.04 - 0.00 - 1.13 - 0.86 - Ca - - 0.21 - 0.00 - 0.35 - 0.51 - 0.87 - Na - - 0.00 - 0.00 - 0.62 - 0.00 - 0.00 -
K - - 0.00 - 0.01 - 0.02 - 0.00 - 0.00 -
Sum - - 8.00 - 2.00 - 4.99 - 4.00 - 3.99 -
Mg# - - 27.15 - 2.89 - 0.00 - 79.25 - 83.54 -
Stellenbosch University https://scholar.sun.ac.za
Stellenbosch University https://scholar.sun.ac.za
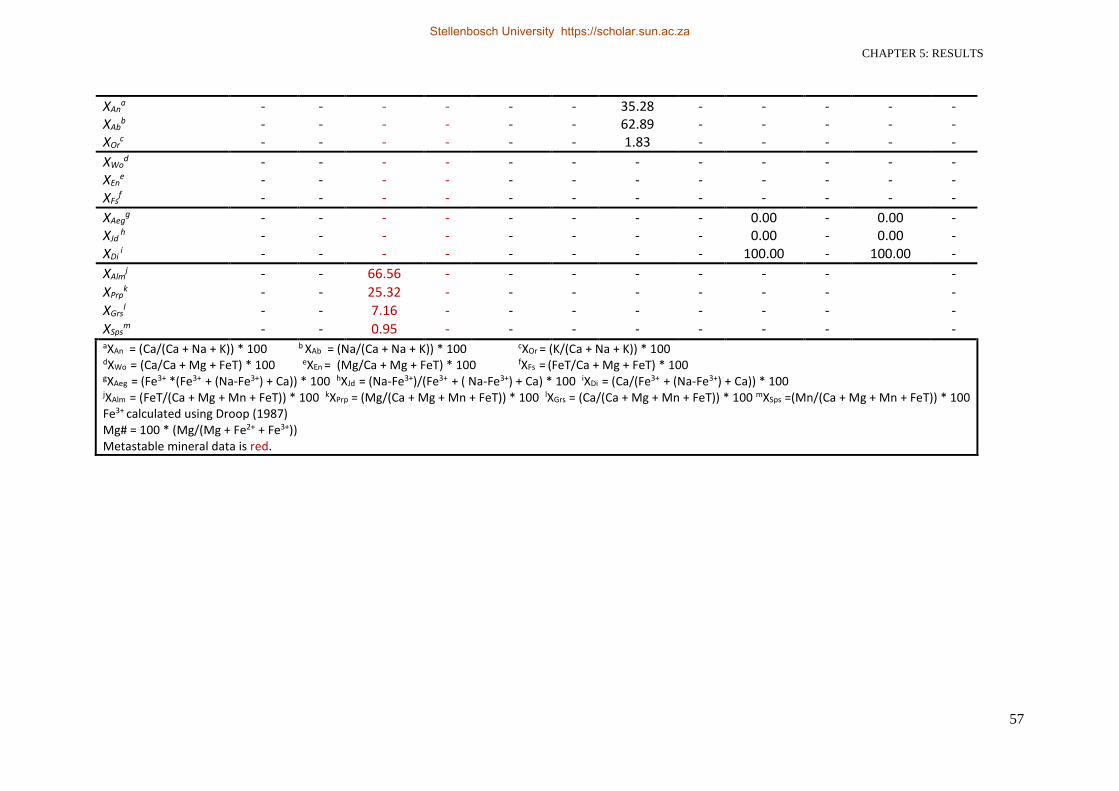
CHAPTER 5: RESULTS
57
XAna - - - - - - 35.28 - - - - -
XAbb - - - - - - 62.89 - - - - -
XOrc - - - - - - 1.83 - - - - -
XWod - - - - - - - - - - - -
XEne - - - - - - - - - - - -
XFsf - - - - - - - - - - - -
XAegg - - - - - - - - 0.00 - 0.00 -
XJd h - - - - - - - - 0.00 - 0.00 -
XDi i - - - - - - - - 100.00 - 100.00 -
XAlmj - - 66.56 - - - - - - - -
XPrpk - - 25.32 - - - - - - - -
XGrsl - - 7.16 - - - - - - - -
XSpsm - - 0.95 - - - - - - - -
aXAn = (Ca/(Ca + Na + K)) * 100 b
XAb = (Na/(Ca + Na + K)) * 100 cXOr = (K/(Ca + Na + K)) * 100 dXWo = (Ca/Ca + Mg + FeT) * 100 eXEn = (Mg/Ca + Mg + FeT) * 100 fXFs = (FeT/Ca + Mg + FeT) * 100 gXAeg = (Fe3+ *(Fe3+ + (Na-Fe3+) + Ca)) * 100 hXJd = (Na-Fe3+)/(Fe3+ + ( Na-Fe3+) + Ca) * 100 iXDi = (Ca/(Fe3+ + (Na-Fe3+) + Ca)) * 100 jXAlm = (FeT/(Ca + Mg + Mn + FeT)) * 100 kXPrp = (Mg/(Ca + Mg + Mn + FeT)) * 100 lXGrs = (Ca/(Ca + Mg + Mn + FeT)) * 100 mXSps =(Mn/(Ca + Mg + Mn + FeT)) * 100 Fe3+ calculated using Droop (1987) Mg# = 100 * (Mg/(Mg + Fe2+ + Fe3+)) Metastable mineral data is red.
Stellenbosch University https://scholar.sun.ac.za
Stellenbosch University https://scholar.sun.ac.za

CHAPTER 5: RESULTS
58
Table 12 - Experiment 5 Average Mineral Compositions
Pressure 1.40 kbar Temperature 730°C Duration 10 days
Melt Grt Ilm Pl Cpx
n= 19 σ n= 11 σ n= 6 σ n= 5 σ n= 6 σ
SiO2 70.04 0.7 38.43 0.3 0.60 0.0 59.16 0.2 52.50 0.3 TiO2 0.00 0.0 0.00 0.0 48.82 0.6 0.00 0.0 0.32 0.0 Al2O3 11.07 0.3 21.63 0.2 0.00 0.0 25.89 0.2 2.46 0.1 Cr2O3 0.00 0.0 0.00 0.0 0.00 0.0 0.00 0.0 0.67 0.1 Fe2O3 0.00 0.0 1.39 0.0 8.95 0.0 0.00 0.0 0.00 0.0 FeO 0.61 0.1 26.83 0.2 38.86 0.7 0.00 0.0 6.99 1.0 MnO 0.00 0.0 0.40 0.1 1.88 0.1 0.00 0.0 0.53 0.0 MgO 0.00 0.0 7.43 0.2 2.17 0.1 0.00 0.0 17.14 1.1 CaO 0.58 0.1 4.26 0.1 0.00 0.0 7.26 0.1 19.50 2.2 Na2O 2.55 0.4 0.00 0.0 0.00 0.0 7.10 0.1 0.00 0.0 K2O 4.73 0.2 0.00 0.0 0.00 0.0 0.39 0.0 0.00 0.0
Total 89.58 1.3 100.38 0.7 101.27 0.4 99.81 0.3 100.12 0.4
Si - - 2.97 - 0.01 - 2.64 - 1.93 - Ti - - 0.00 - 0.90 - 0.00 - 0.01 - Al - - 1.97 - 0.00 - 1.36 - 0.11 - Cr - - 0.00 - 0.00 - 0.00 - 0.01 - Fe3+ - - 0.08 - 0.17 - 0.00 - 0.00 - Fe2+ - - 1.74 - 0.80 - 0.00 - 0.21 - Mn - - 0.03 - 0.04 - 0.00 - 0.02 - Mg - - 0.86 - 0.08 - 0.00 - 0.94 - Ca - - 0.35 - 0.00 - 0.35 - 0.77 - Na - - 0.00 - 0.00 - 0.62 - 0.00 -
K - - 0.00 - 0.00 - 0.02 - 0.00 -
Sum - - 8.00 - 2.00 - 4.99 - 4.00 -
Mg# - - 32.05 - 7.61 - 0.00 - 81.38 -
Stellenbosch University https://scholar.sun.ac.za
Stellenbosch University https://scholar.sun.ac.za

CHAPTER 5: RESULTS
59
XAna - - - - - - 35.29 - - -
XAbb - - - - - - 62.45 - - -
XOrc - - - - - - 2.26 - - -
XWod - - - - - - - - - -
XEne - - - - - - - - - -
XFsf - - - - - - - - - -
XAegg - - - - - - - - 0.00 -
XJd h - - - - - - - - 0.00 -
XDi i - - - - - - - - 100.00 -
XAlmj - - 59.51 - - - - - - -
XPrpk - - 28.07 - - - - - - -
XGrsl - - 11.57 - - - - - - -
XSpsm - - 0.86 - - - - - - -
aXAn = (Ca/(Ca + Na + K)) * 100 b
XAb = (Na/(Ca + Na + K)) * 100 cXOr = (K/(Ca + Na + K)) * 100 dXWo = (Ca/Ca + Mg + FeT) * 100 eXEn = (Mg/Ca + Mg + FeT) * 100 fXFs = (FeT/Ca + Mg + FeT) * 100 gXAeg = (Fe3+ *(Fe3+ + (Na-Fe3+) + Ca)) * 100 hXJd = (Na-Fe3+)/(Fe3+ + ( Na-Fe3+) + Ca) * 100 iXDi = (Ca/(Fe3+ + (Na-Fe3+) + Ca)) * 100 jXAlm = (FeT/(Ca + Mg + Mn + FeT)) * 100 kXPrp = (Mg/(Ca + Mg + Mn + FeT)) * 100 lXGrs = (Ca/(Ca + Mg + Mn + FeT)) * 100 mXSps =(Mn/(Ca + Mg + Mn + FeT)) * 100 Fe3+ calculated using Droop (1987) Mg# = 100 * (Mg/(Mg + Fe2+ + Fe3+)) Metastable mineral data is red.
Stellenbosch University https://scholar.sun.ac.za
Stellenbosch University https://scholar.sun.ac.za

CHAPTER 5: RESULTS
60
Table 13 - Experimental Melt Average Compositions
Experiment Starting Melt 1 2 3 4 5
Pressure (kbar) - 1.90 1.90 1.90 1.40 1.40 Temperature (°C) - 733 763 723 743 730
σ n=15 σ n=21 n=10 σ n=14 σ n=19 σ
SiO2 75.74 - 77.20 1.2 79.35 0.9 78.30 1.0 79.38 0.8 78.19 0.7 TiO2 0.12 - 0.00 0.0 0.00 0.0 0.00 0.0 0.00 0.0 0.00 0.0 Al2O3 13.49 - 13.64 0.3 12.54 0.2 13.37 0.8 12.64 0.2 12.36 0.3 Cr2O3 0.00 - 0.00 0.0 0.00 0.0 0.00 0.0 0.00 0.0 0.00 0.0 Fe2O3 0.00 - 0.00 0.0 0.00 0.0 0.00 0.0 0.00 0.0 0.00 0.0 FeO 1.02 - 0.67 0.1 0.67 0.1 0.57 0.1 0.57 0.1 0.68 0.1 MnO 0.00 - 0.00 0.0 0.00 0.0 0.00 0.0 0.00 0.0 0.00 0.0 MgO 0.09 - 0.00 0.0 0.00 0.0 0.00 0.0 0.00 0.0 0.00 0.0 CaO 1.05 - 0.60 0.0 0.77 0.1 0.93 0.3 0.77 0.1 0.65 0.1 Na2O 3.74 - 2.86 0.3 2.26 0.1 2.74 0.4 2.02 0.3 2.85 0.4 K2O 4.76 - 5.04 0.2 4.41 0.1 4.10 0.3 4.62 0.1 5.28 0.2
Total 100 - 100 1.0 100 1.2 100 0.6 100 0.9 100 1.3
Mg#a 0.00 - 0.00 - 0.00 - 0.00 - 0.00 - 0.00 -
Na2O/CaO 3.56 - 4.76 - 2.94 - 2.95 - 2.62 - 4.40 -
K2O/Na2O 1.27 - 1.76 - 1.95 - 1.49 - 2.29 - 1.85 -
Ferrob 1.23 - 0.60 - 0.60 - 0.52 - 0.51 - 0.61 -
A/NKc 1.59 - 1.73 - 1.87 - 1.95 - 1.90 - 1.52 -
A/CNKd 1.41 - 1.61 - 1.69 - 1.72 - 1.71 - 1.41 - aMg# = 100 * (MgO/(MgO + FeOT)) bFerro= TiO2 + FeO + MgO + MnO cA/NK = Al2O3/(Na2O + K2O) dA/CNK = Al2O3/(CaO + Na2O + K2O)
Stellenbosch University https://scholar.sun.ac.za
Stellenbosch University https://scholar.sun.ac.za

CHAPTER 5: RESULTS
61
5.2 Textures in the Experimental Run Products
The following few pages illustrate the mineral textures that can be observed within the
experimental run products. The minerals range in size (length) from ~2 - 400µm in all the
experiments. The most noteworthy textures are the reaction rims of biotite that surround
metastable garnet and metastable orthopyroxene, and the reaction rims of clinoamphibole
around clinopyroxene. These reaction rims vary in size (~2 - 10µm) between differing
experimental pressure and temperature conditions. Plagioclase displays evidence of melt and
fluid inclusions, suggesting that the initial ‘peritectic’ plagioclase has dissolved and a new
plagioclase phase has precipitated from the melts during the experimental runs.
Clinopyroxene is the only mineral to demonstrate clear evidence of normal compositional
zonation, which appears to indicate a coupled dissolution-precipitation mechanism is at work.
All the experimental melts appear to contain vesicles. The vesicles are evidence of air trapped
within the experimental capsule that contains components, such as N2(g), that are insoluble
within the melt phase. In some cases these vesicles are shown to contain quenched hydrous
crystals, which suggests that an H2O-rich fluid existed within the system as a separate phase.
Stellenbosch University https://scholar.sun.ac.za

CHAPTER 5: RESULTS
62
Experiment 1 - 1.90kbar; 733°C
Figure 10 - BSE SEM Images Experiment 1
(1.90kbar; 733°C)
Image A: Overview image of the capsule contents
that were analysed under the SEM. The images
shows the melt portion of the system to be
significantly larger than the crystal portion. Only a
few vesicles are present within the melt, and are
likely a consequence of trapped N2(g) within the
capsule. Image B: aggregates of fine, interlocking
biotite laths, surrounded by smaller euhedral
plagioclase grains. Annealing of plagioclase
grains appears to have occurred to produce larger, subhedral plagioclase crystals. Image C: anhedral
orthopyroxene crystal has reacted with the surrounding melt portion to produce a reaction rim of small,
amorphous, biotite crystals. The lighter areas within the biotite reaction rim represent areas of Fe
enrichment. Image D: zoned clinopyroxene, with the darker portion representing the initial ‘peritectic’ seed
composition and the lighter portion representing new clinopyroxene growth. The rim of new clinopyroxene
growth has a considerably lower Mg# than the core. This image also clearly shows the homogeneous
nature of the surrounding melt portion. Image E: large (~50µm length), euhedral plagioclase grain
containing melt/gas inclusions (<1µm).
A. B.
C. D.
Cpx seed New Cpx
growth
Melt
Pl
Pl
Melt Bt
Opx
Fe-rich
Bt Bt
Pl
Melt
Pl
E.
Stellenbosch University https://scholar.sun.ac.za

CHAPTER 5: RESULTS
63
Experiment 2 - 1.90kbar; 763°C
Figure 11 - BSE SEM Images Experiment 2 (1.90kbar; 763°C)
Image A: Overview image of the experimental run product, showing the reader the size and spatial
relationships of the larger crystals, particularly clinopyroxene and quartz. Image B: clinopyroxene showing
strong one directional cleavage. Rounded, magmatic quartz crystal also evident. The small area of biotite
within the image likely indicates the complete replacement of either peritectic garnet/orthopyroxene. Image
C: vesicles containing quenched, plagioclase crystals. Quench crystals were too small to analyse
accurately under the SEM. Image D: reaction of metastable garnet with the surrounding melt to produce a
reaction rim of a hydrous phase, specifically biotite. This experiment appears to contain a significantly
larger crystal component compared to Experiment 1. The gold visible in Image A is a fragment of the
capsule and is not a constituent of the experimental run product. The melt in this experiment is
homogeneous, containing interspersed, sub- to anhedral plagioclase grains (<10µm).
A. B.
C. D.
Cpx
Qtz
Cpx
Grt
Cpx Bt
Bt
Melt
Cpx
Qtz
Bt
Melt
Gold
Stellenbosch University https://scholar.sun.ac.za

CHAPTER 5: RESULTS
64
Experiment 3 - 1.90kbar; 723°C
Figure 12 - BSE SEM Images Experiment 3 (1.90kbar; 723°C)
Image A: Overview image of the entire run product. From this image it clear to see that compared to the
previous two experiments there is a significantly higher proportion of vesicles. This, along with the high
quantity of plagioclase crystals within the melt, can be attributed to the temperature of the experiment lying
on the H2O-melt saturation boundary (as predicted by phase equilibrium modelling). Images B and C:
garnet and orthopyroxene have reacted with the surrounding melt portion to form biotite. Image D shows
a subhedral plagioclase grain exhibiting exsolution textures.
A. B.
C. D.
Bt reaction rim
Opx
Grt
Fe-rich bands
Cpx
Pl
Stellenbosch University https://scholar.sun.ac.za

CHAPTER 5: RESULTS
65
Experiment 4 - 1.40kbar; 743°C
Figure 13 - BSE SEM Images Experiment 4 (1.40kbar; 743°C)
Image A: Overview of experimental run product. Large number of vesicles containing quenched crystals
visible due to experimental conditions lying within the H2O-melt saturation band. Image B: extensive
fracturing of garnet seed resulting in thick (~10µm wide) biotite rims containing Fe-rich bands along
fracture planes. Image C: a zoomed in view of the reaction of clinopyroxene to clinoamphibole along the
mineral-melt reaction interface. Image D: large (~80µm), anhedral plagioclase crystal containing triangular
shaped etch pits. The plagioclase crystal is surrounded by a crystal rich melt that predominantly contains
anhedral plagioclase crystals (<1µm). Vesicles containing hydrous quench crystals, as well as
vesicles/voids containing N2(g) are present.
A. B.
C. D.
Grt
Qtz
Melt
Bt rims
Fe-rich bands
Cpx
Vesicles
Grt
Cpx
Melt
Melt
Cam Pl Cpx
Pl
Pl
Melt
Stellenbosch University https://scholar.sun.ac.za
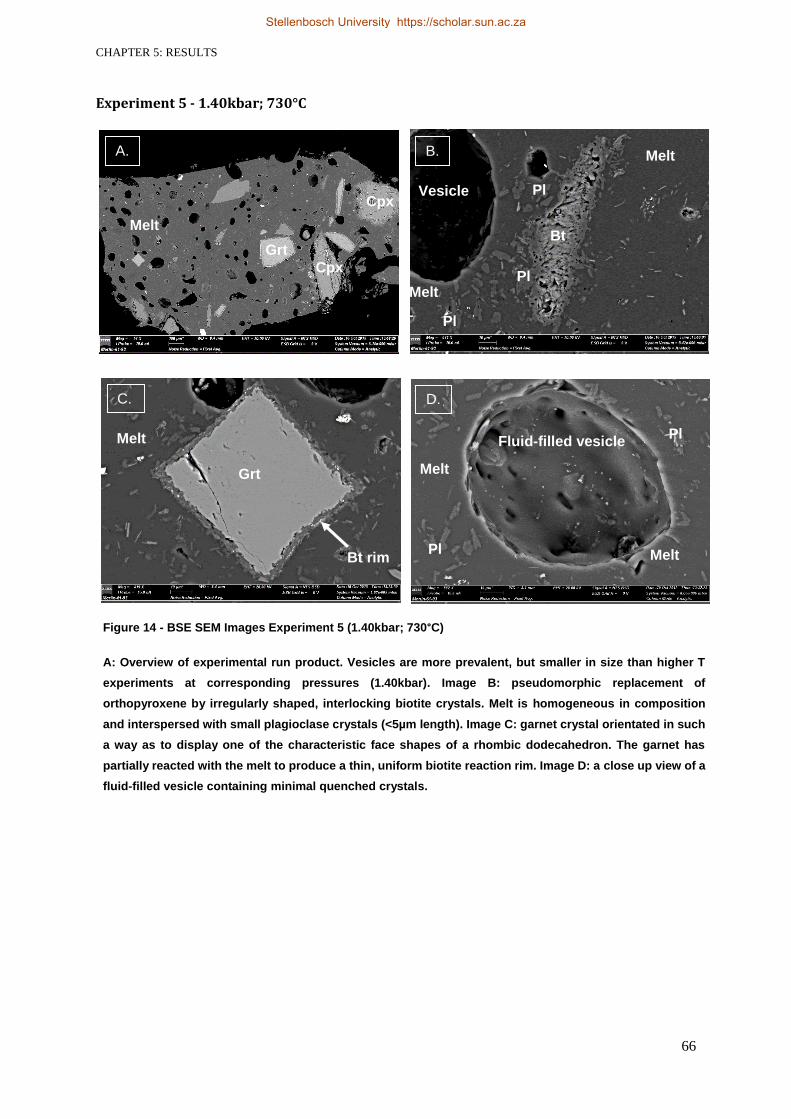
CHAPTER 5: RESULTS
66
Experiment 5 - 1.40kbar; 730°C
Figure 14 - BSE SEM Images Experiment 5 (1.40kbar; 730°C)
A: Overview of experimental run product. Vesicles are more prevalent, but smaller in size than higher T
experiments at corresponding pressures (1.40kbar). Image B: pseudomorphic replacement of
orthopyroxene by irregularly shaped, interlocking biotite crystals. Melt is homogeneous in composition
and interspersed with small plagioclase crystals (<5µm length). Image C: garnet crystal orientated in such
a way as to display one of the characteristic face shapes of a rhombic dodecahedron. The garnet has
partially reacted with the melt to produce a thin, uniform biotite reaction rim. Image D: a close up view of a
fluid-filled vesicle containing minimal quenched crystals.
A. B.
C. D.
Grt
Melt
Bt rim Pl
Melt
Fluid-filled vesicle Pl
Melt
Bt
Pl
Pl
Melt
Melt
Pl
Vesicle
Grt
Melt
Cpx
Cpx
Stellenbosch University https://scholar.sun.ac.za

CHAPTER 5: RESULTS
67
5.3 Mineral and Textural Descriptions
The following section provides the reader with a detailed description of the experimental
mineral compositions and textures. The five experiments have been first divided according to
the pressure conditions at which they were run. Thereafter, each mineral description has been
further subdivided according to the temperature conditions of its relevant experiment.
Higher Pressure Experiments (1.90kbar)
Plagioclase
763°C: The plagioclase crystals can be found along the edge of the run product. Their grain
shape is indistinguishable, creating the appearance of a homogeneous, thin line running along
the majority of the capsule. It also is present as minute, anhedral fragments that are scattered
within the melt. These mineral fragments are generally <5µm. A few grains exist that are
around 10µm in length, and upon closer examination these crystals appear to show exsolution
textures. Geochemical analysis indicates the composition of the plagioclase within the
experiment to be An52.4Ab43.0Or4.6, which differs dramatically from the initial plagioclase
composition used in the starting powder. The initial plagioclase composition used in the
starting powder have a definite albitic composition, with a mole percentage of Ab64. This large
discrepancy in composition may be a result of rapid dissolution-precipitation mechanisms that
are responsible for the equilibration of plagioclase to the surrounding experimental pressure
and temperature conditions. The experimental plagioclase can be described as having an
intermediate composition lying between labradorite (An60) and andesine (An40) in the
plagioclase series.
733°C: Plagioclase crystals are of particular interest in this experiment as they appear as two
distinct textural varieties. The first type appears as small, euhedral crystals (<5µm) that form
a ‘dense’ ring around the entire run product (i.e. inner surface of gold capsule). These
particular crystals overlap and interlock with each other, appearing very tightly packed.
Equally small ilmenite fragments are present in amongst these plagioclase grains. The second
textural variety of plagioclase crystals are significantly larger (~30µm) than those appearing
on the inner surface of the gold capsule. These larger crystals tend to be isolated with regards
to other minerals, and are instead completely surrounded by melt. They are also partially
corroded, containing dark, circler spots of gas or melt inclusions. Both textural varieties are
compositionally similar within minimal variation in apfu value, with the maximum deviation
being ±0.08 apfu for Na. All of the plagioclase within the experiment appears to have an albitic
composition, with a general mole percent formula of Ab60.9An36.3Or2.8.
Stellenbosch University https://scholar.sun.ac.za

CHAPTER 5: RESULTS
68
723°C: The plagioclase within Experiment 3 (1.90kabr and 723°C) is albitic in composition,
specifically Ab62.3An35.1Or2.6 (mol. %). When comparing the general plagioclase formula to the
original plagioclase composition in the starting powder there is minimal variation in
composition (maximum deviation 0.02 apfu). There is a large, anhedral plagioclase grain of
approximately 200µm within the experimental run product (Figure 12 (D), pg. 64). This larger
grain is isolated from the other minerals, and is instead surrounded by melt. The experimental
melt is interspersed with very small plagioclase grains that are anhedral and less than 10µm
in size.
Garnet
763°C: Although not predicted at the pressure-temperature conditions of Experiment 2
(1.90kbar and 763°C), garnet is present within the run product. There is only one garnet crystal
visible within the run product. The grain is a subhedral lath, and it is considerably smaller than
the majority of other minerals (30µm in length). The garnet grain is surrounded by melt with a
relatively high concentration of plagioclase fragments. The garnet is in close proximity to a
clinopyroxene crystal. The garnet is surrounded by a uniform reaction front (~5µm). This
reaction front is comprised largely of indistinct biotite crystals.
The composition of the garnet is important as it may provide clues as to why garnet persists
at the low pressure conditions of experimentation. By looking at its mole percent formula it is
clear to see that the garnet (Alm58.7Prp31.6Grs9.6Sps0.0) is compositionally similar to the original
garnet composition in the starting powder (Alm67.4Prp24.1Grs7.4Sps1.1). However, the Mg# of
this experimental garnet is 34.99, which is higher than the 26.28 of the initial garnet
composition in the starting powder.
733°C: Not evident within the run product.
723°C: Although not predicted for the pressure-temperature conditions of Experiment 3 (1.90
kbar and 723°C) garnet persists at these conditions. The garnet is in disequilibrium with the
pressure, temperature and compositional conditions of the experiment, which is evident from
the reaction rim surrounding all the garnet grains. The garnet within this experiment has a mol.
% formula of Alm55.8Prp31.4Grs11.8Sps1.0. This garnet is varies only slightly from the original
garnet composition in the starting powder, which has a mol. % formula of
Alm67.3Prp24.1Grs7.4Sps1.2. Examination of the mol. % formula shows there is a significant mol.
% difference between the initial garnet composition and the experimental garnet in respects
to almandine (±11.5%).
The garnet grains within the run product appear tabular shaped, and are largely surrounded
by the melt portion of the run product and a large number of vesicles. The largest garnet is
Stellenbosch University https://scholar.sun.ac.za

CHAPTER 5: RESULTS
69
around 220µm in length (Figure 12 (C), pg. 64). It has a large reaction rim that extends mainly
across one of its surfaces. This reaction rim has a biotite-like composition, and contains
smaller reaction rims that run parallel to the grain boundary that appear to have a high Mn
content. The smaller reaction rims vary significantly in length (<10 - 40µm). The exact
composition of these small reaction rims is unknown as they are too narrow to get an accurate
analysis, particularly when surrounded by the indistinct biotite-like material.
Orthopyroxene
763°C: Orthopyroxene is present in vast quantities, and along with its clinopyroxene
counterpart forms the coarsest-grained minerals within the run product. The orthopyroxene
crystals are around 250µm long. They are appear as large, tabular crystals. Spatially the
grains appear isolated from other minerals, and are surrounded solely by vesicle-rich melt.
The mole percent formula for the orthopyroxene in Experiment 2 is Wo1.8 En78.7 Fs19.5. Although
wollastonite is not a pyroxene mineral, due to its formula (CaSiO3) it has been used to illustrate
a theoretical calcium endmember. The initial orthopyroxene compositions have a Mg# of 65.3,
whilst the experimental orthopyroxene has a significantly higher Mg# at 78.5.
733°C: Not evident within the run product.
723°C: The orthopyroxene within Experiment 3 has a mol. % formula of Wo0.6En65.5Fs33.9. The
formula is mid-way between the enstatite-ferrosilite mineral series, and thus the mineral can
be classified as hypersthene. The orthopyroxene in the run product differs from the initial
peritectic orthopyroxene very minimally, with a Mg# number of 65.7 compared to the original
orthopyroxene’s 65.3. The orthopyroxene can be observed to be reacting, with the reaction
being preserved in the run product as can be seen in the SEM images (Figure 12 (B), pg. 64).
The reaction taking place between the orthopyroxene and melt is producing a rim of biotite-
like material.
The orthopyroxenes are found across the run product, and are significantly smaller in size
than the other minerals present within the experiment (approximately 10 µm diameter). Their
size is due to the fact that they have almost fully reacted with the surrounding melt to produce
a biotite-like material. The biotite rims are very intricate and fine-grained. Their composition
as determined by SEM analysis was inaccurate as the surface of the reaction rim is not
smooth, as well as the fact that the grains are too small to get an accurate and precise reading.
Clinopyroxene
763°C: The clinopyroxene crystals present within the experiment are sub- to euhedral in
shape. The crystals appear to be surrounded entirely by melt and intergrain boundaries are
Stellenbosch University https://scholar.sun.ac.za

CHAPTER 5: RESULTS
70
visible between some of the clinopyroxene and ilmenite crystals. The grains are variable in
size ranging from 40µm to 200µm.The clinopyroxene crystals appear to be clustered, with the
larger crystals being centrally located within the capsule. The smaller variety of clinopyroxene
appear as anhedral fragments close to the edge of the capsule, and like their larger
counterparts show no preferred orientation. No zonation within any of the crystals is evident
either visually or through quantitative analysis.
Its mole percent formula indicates Aeg1.5Jd0.9Di97.6. There are only slight differences between
the original peritectic clinopyroxene, with the experimental clinopyroxene having a higher Mg#
of 81.8 compared to the original clinopyroxenes’ 80.5. The greatest deviation in apfu relates
to the Fe2+ content which varies by 0.16 apfu. The Ca apfu value is 0.1 higher in the peritectic
clinopyroxene than in the experimental equivalent.
733°C: Clinopyroxene exists as a stable phase within Experiment 1 (1.90kbar and 733°C).
The crystals appear randomly distributed, and are well dispersed across the entire run product.
The crystals vary dramatically in size, ranging from ~20 to 100µm. Despite their size all of the
experimental clinopyroxenes show evidence of reaction rims of clinoamphibole. Some of the
larger grains (~ 100µm) exhibit one directional cleavage. The smaller grains exhibit the most
extensive amount of new mineral growth. This new growth was determined through SEM
analysis to be similar in composition to the original clinopyroxene compositions. However,
some variation between the two is clearly evident. Visually the original clinopyroxene
composition (core) appears to be dark grey, whilst the new growth (rim) appears significantly
lighter in colour, which infers a higher Fe content. The most notable compositional variation
between the two is the Mg content of the rim (0.65 apfu) when compared to the core (0.86
apfu). Another interesting discrepancy between the two compositions relates to the Fe content.
The Cpx rim, unlike the core, contains Fe3+ and, on average, shows an increase of 0.12 apfu
for Fe2+. (Fe3+ content has been estimated using Droop (1987)). The mineral formula
calculated for the clinopyroxene cores indicates that it is a diopside, with the mole percent
formula of Aeg0.0Jd0.5Di99.5 and a Mg# of 83.1. Whilst the mineral nature of the clinopyroxene
rim changes slightly with a decreased Mg# of 66.18, and a composition of Jd5.7Di94.3.
723°C: The clinopyroxene within the experimental run product has a composition of Jd7.4Di92.6.
The grains appear to be lath-shaped, and show strong one directional cleavage. The
clinopyroxene appears to be reacting to form fine, needles of clinoamphibole along its crystal
edge. The clinopyroxenes vary in size from around 50 to 60µm. They appear to be generally
surrounded by melt, but also share mineral boundaries with rounded quartz crystals and
garnet reaction rims (biotite-like material).
Stellenbosch University https://scholar.sun.ac.za

CHAPTER 5: RESULTS
71
Ilmenite
763°C: The ilmenite crystals range in size from 10 – 100µm, and are typically subhedral in
character. They are randomly dispersed in clusters, and are surrounded by melt. Occasionally
the crystals share mineral boundaries with clinopyroxene grains. Only a few ilmenite crystals
are visible within the run product.
The ilmenite in the run product has a general formula of (Fe2+0.8 Fe3+
0.2 Mn0.1)Ti0.9O3, which
when compared to the original ilmenite composition has a greater number of Fe3+ atoms per
formula unit (+0.1 apfu). The minor inclusion of Mn into the mineral structure places the mineral
composition towards the ilmenite end of the ilmenite (FeTiO3) – pyrophanite (MnTiO3) series.
Despite all these aforementioned differences the Ti component of the minerals remains
unchanged. The Mg# for the experimental ilmenite is higher at 1.92, when compared to the
0.96 Mg# of the initial ilmenite composition.
733°C: Within the run product the ilmenite crystals appear to be anhedral. Their size varies
from 10 -35µm, and they appear evenly distributed along the outskirts of the run product.
Visual examination of the ilmenite crystals would indicate little or no change textural change
from the original composition within the starting material. However, quantitative analysis
illustrates quite significant increases within the Fe3+, Mn and Mg contents of the final run
product when compared to the starting composition. The Fe3+ content increased from 0.09 to
2.1 apfu, whilst the Mn and Mg contents increase by 0.08 and 0.09 apfu respectively. The
overall general mineral formula is (Fe2+0.9Fe3+
0.1 Mn0.1 Mg0.1)Ti0.9O3. The Mg# increases at this
lower temperature of this experiment, moving from the 1.92 seen at 763°C to 5.00.
723°C: Not evident within the run product.
Quartz
763°C: Quartz is present in large quantities within the run product. It occurs in two areas in
particular (Figure 11 (A and B), pg. 62). The boundary of the smaller (40 µm) crystal is indistinct
and Fe rich areas exist in and around the crystal. The larger quartz crystal of 100µm is
surrounded by melt. The presence of quartz in the run product implies that the starting bulk
composition is oversaturated with respects to silica allowing for quartz (a mineral not part of
the initial mineral assemblage) to be readily produced.
733°C: Quartz is visible in one area of the run product, in which it appears as a large (40µm)
rounded crystal within the melt portion of the run product. It is easily distinguishable from the
melt due to the variation in its colour (darker) when compared to the melt portion.
Stellenbosch University https://scholar.sun.ac.za

CHAPTER 5: RESULTS
72
723°C: The quartz crystals are large (~30 - 100µm) and are well distributed across the entire
run product. Mineral grain boundaries exist between the quartz crystals and a variety of
minerals, such as orthopyroxene, clinopyroxene and garnet.
Biotite
Biotite appears to be present across all three of the higher pressure experimental run products.
It appears as two textural varieties, firstly as a component within the reaction rims of
metastable orthopyroxene and garnet, and secondly as a pseudomorph of these minerals.
However, the biotite crystals in both cases were too small/narrow to analyse without
contamination of the adjacent crystals and/or quenched melt. Consequently, compositional
data of biotite has been excluded as a phase within the ‘Mineral and Melt Compositions’
section, as well as from the textural description that follows. Although the excitation volume of
the electron beam was too large to analyse the biotite compositions accurately, it still allowed
for the identification of the mineral phase within the run products.
763°C: The biotite within Experiment 2 occurs as a result of a metastable garnet phase
reacting with the surrounding melt portion. It forms a reaction rim in which the individual
crystals are so small in size that they are indistinguishable from one another. Certain areas
within the reaction rim appear to be more Fe2+ rich with the variation being as extreme as 1.0
apfu. However, due to their small crystal size, analysis of the mineral’s composition was
inaccurate due to contamination of the results by surrounding crystals and quenched melt.
733°C: The biotite within the experiment appears as fine, needle like crystals and is nucleated
within one area of the capsule. The needle-like crystals are contained within a large lath
shaped cavity and an adjacent, smaller, oval cavity. The cavities are surrounded by small,
euhedral plagioclase crystals. The uneven surface created by the needle structures within the
cavity has meant that quantitative analysis of the biotite was inaccurate.
723°C: In Experiment 3 biotite occurs as a reaction rim surrounding both reacting garnet and
orthopyroxene minerals. In both cases the crystal size is less than 2µm, making analysis both
difficult and largely inaccurate due to surrounding minerals and quenched melt contaminating
the results. Spatially, the biotite is surrounded by melt and occurs near to both quartz and
clinopyroxene crystals. In some areas of the run product biotite is present as small plates,
showing preferred orientation, which have likely developed from the complete breakdown of
orthopyroxene through mineral-melt reactions. The size of the reaction rim around the garnet
and orthopyroxene grains may be indicative of which mineral reacts quicker with the
surrounding melt portion. If this is the case, orthopyroxene reacts much faster than garnet at
the pressure-temperature conditions of experimentation.
Stellenbosch University https://scholar.sun.ac.za

CHAPTER 5: RESULTS
73
Clinoamphibole
In a similar manner to the biotite analysis the clinoamphibole needles were too small/narrow
to accurately constrain their composition using SEM techniques. This accounts for the lack
of compositional data in both the ‘Mineral Composition’ tables and the textural descriptions
below.
763°C: Not evident within the run product.
733°C: Not evident within the run product.
723°C: Clinoamphibole appears along the edge of the clinopyroxene prisms within this
experiment. Clinopyroxene appears to have reacted with the melt portion to produce thin
(~1µm width), needle-like crystals of clinoamphibole. These crystals appear to show preferred
orientation, particularly closer to the clinopyroxene crystal boundary. The alignment of these
crystals appears to mimic the cleavage planes of the reacting clinopyroxene crystals.
Melt
763°C: The melt appears relatively homogeneous, with large quantities of vapour bubbles
existing within it. Due to the large number of vesicles within this higher temperature run product
the vapour bubbles are likely comprised two different gases. The first are nitrogen bubbles,
which results from air being trapped within the gold capsule during preparation. This trapped
nitrogen is an unavoidable consequence of the experimental procedure. The second variety
is trapped aqueous fluid. This experimental melt contained the highest SiO2 contents (79.35
wt. %) within the higher pressure experiments (1.90kbar). The melt also had a relatively low
Na2O/CaO ratio (2.94) compared to the original starting melt’s 3.56. Vesicles are randomly
distributed across the run product, with some containing euhedral, quench crystals.
733°C: The melt appears homogeneous, which has been verified through quantitative analysis
(maximum σ = 1.05).The melt also contains a small number of dark, voids which most probably
indicates the presence of insoluble N2(g) within the melt. The experimental melt compositions
do not vary significantly over the temperature bracket of 40°C. However, there are marginal
differences. The 733°C experiment contains the highest wt. % K2O (5.04), highest wt. % Na2O
(2.86) and highest wt. % Al2O3 (13.64). This may be largely due to the low proportion of
plagioclase and biotite minerals in the run product. This mid-temperature experiment also has
the lowest wt. % CaO, which can be ascribed to the fact that there is large proportion of
clinopyroxene mineral in relation to the other minerals.
723°C: The temperature of experimentation lies within the H2O-melt saturation band, which
accounts for the matrix being made up of plagioclase crystals and interstitial melt within the
Stellenbosch University https://scholar.sun.ac.za

CHAPTER 5: RESULTS
74
run product. The angular nature of the smaller, interstitial melt pools results from the
development of plagioclase crystal faces. The large amount of biotite within the experiment
may also be a limiting factor accounting for the lower FeO content within the melt portion (0.57
wt. % compared to the 0.67 wt. % in higher temperature experiments) and the lower K2O wt.
% of 4.10. This low temperature experiment contains the highest CaO value at 0.93 wt. %.
Lower Pressure Experiments (1.40kbar)
Plagioclase
743°C: Plagioclase crystals within the experiments appear in three major textural varieties.
The first variety are present as fine, anhedral crystals that are both abundant and evenly
distributed throughout the melt. These crystals vary in both their size and shape, but are
generally <5µm in length. These fragments were too small to accurately analyse without
contamination of the results by surrounding crystals and quenched melt. The second variety
appears to be recrystallized plagioclases. The length of these crystals ranges between 45-
55µm. They are homogeneous, subhedral to anhedral crystals that appear to have trapped
melt/fluid components during their crystallization. The final plagioclase textural type appear to
be large (163µm x 164µm) crystals, which have formed from the fracturing of a larger
‘peritectic’ plagioclase crystal. These minerals show no compositional or textural evidence that
would indicate they had reacted with the surrounding melt during experimentation. In general
the plagioclase crystals in this experiment all showed similar compositions to the initial
plagioclase compositions in the starting powder. The overall mole percent formula of the
experimental plagioclases is An35.3Ab62.9Or1.8, compared to the initial plagioclases’
composition of An34.4Ab63.9Or1.7.
730°C: The plagioclase crystals were randomly dispersed throughout the experimental run
product. The crystals are small, with the largest crystal being <15µm in length that appears as
a subhedral lath. The majority of the crystals appear as fragments that are less than <5µm in
diameter. All the crystals had appear to be sub- to anhedral in shape. The general mole
percent formula of the plagioclase in this mid-temperature experiment is An35.3Ab62.5Or2.2. The
newly formed plagioclase is sodic in composition, and is therefore similar in composition to
the initial plagioclase composition. The experimental plagioclase also has a negligibly lower
overall albitic component (Ab62.5) than the ‘peritectic’ plagioclase composition (Ab63.9).
Garnet
743°C: Unlike in higher pressure experiments the garnet crystals within this experiment
appear to be nucleated within one portion of the run product (Figure 13 (B), pg. 65). The
configuration and overall size of the garnet crystals suggests that they all formed from one
Stellenbosch University https://scholar.sun.ac.za

CHAPTER 5: RESULTS
75
original garnet crystal that has been fractured. The garnet fragments vary in size and shape
(sub- to anhedral). The fragments are linked by a biotite rim that runs between and around the
fragments. The entire garnet – biotite ‘network’ is 403µm x 222µm in size. The garnets within
this experiment appear to have a significantly higher almandine component of XAlm = 0.66,
when compared to those seen in the higher temperature experiments (XAlm of 0.55 – 0.58).
However, its composition appears similar to the initial garnet composition in the starting
powder (XAlm = 0.67).
730°C: The garnets within this experiment appear as both subhedral and euhedral crystal
shapes (some as perfect squares, (Figure 10Figure 14 (C), pg. 66). There are only a few
garnet crystals present and they are randomly dispersed throughout the run product and are
surrounded by melt. Despite their shape the garnets all appear to have a thin (approximately
2 - 3µm), even rim of non-ideal biotite along their crystal faces. Quantitative examination of
the garnets show them to have a mole percent formula of Alm59.5Prp28.0Grs11.6Sps0.9. This
composition has a higher pyrope, grossular and spessartine component than the original
garnet composition in the starting powder (Alm67.4Prp24.1Grs7.3Sps1.2).
Orthopyroxene
743°C: None evident within the run product.
730°C: None evident within the run product.
Clinopyroxene
743°C: The clinopyroxene within this experiment exists in two compositional varieties. The
most noticeable differences between the two types is within the apfu values for Ca, Mg and
Fe2+. The clinopyroxenes with the lower Fe2+ and Mg apfu values are associated with the
precipitation of fine, needles of clinoamphibole along their rim. The clinoamphibole rims are
non-uniform, with some crystals only showing evidence of clinoamphibole formation along one
crystal edge. The formation of clinoamphibole is also associated with the development of
euhedral plagioclase crystals that are ~2µm wide. Despite the differences both clinopyroxene
minerals are classified as diopsides. Texturally both sets of minerals are large (106µm x
74µm), crystal laths that display one directional cleavage along their surfaces.
730°C: The clinopyroxene, like the higher temperature experiment (743°C) at corresponding
pressures, also has a rim of fine, intermingling clinoamphibole crystals that is approximately
5µm in width. The rim is not uniform in size. The clinopyroxene is anhedral, and appears
homogeneous in composition both visually and through quantitative analysis. Its overall mole
percent formula indicates that it is diopside, which is exactly the same variety as the initial
clinopyroxene composition in the starting powder.
Stellenbosch University https://scholar.sun.ac.za

CHAPTER 5: RESULTS
76
Ilmenite
743°C: Ilmenite is visible as small (<1µm), globular crystals. A small amount of Si is present
in the analyses, which can be attributed to the contamination of the results by surrounding
crystals/quenched melt. Both the texture and composition of the experimental ilmenites differs
from the initial ilmenite composition in the starting powder. Compositionally the experimental
ilmenite is seen to have a higher Mg# of 2.86, whilst the initial ilmenite compositions have an
Mg# of 0.96. Texturally the experimental ilmenite is significantly smaller than those first
introduced into the starting composition.
730°C: The ilmenite appears as anhedral crystals, with very few crystals visible within the run
product. The crystals are approximately 5 – 10µm in diameter, and are mainly isolated within
the melt. The mineral formula is almost ideal, differing from the original ilmenite composition
by ±0.1 apfu Fe2+, Fe3+ and Ti.
Quartz
743°C: The majority of the quartz appears to be nucleated into one large pool that exists in
close proximity to the garnet-biotite network mentioned above, as well as melt and anhedral
vesicles. The crystal is large (453µm x 194µm) and subhedral in nature. There are a few
rounded quartz crystals that are smaller ~15µm x 15µm in size which are predominantly
surrounded by melt.
730°C: Rounded crystals of quartz are present. Unlike in experiments at higher pressure
(1.90kbar) the majority of the crystals appear elongated rather than circular in shape. The
different morphologies observed within and between experiments is dependent on whether
the crystal face being examined is the prismatic or pyramidal face of an alpha quartz prism.
The quartz crystals are isolated from most of the more mafic mineral crystals, instead all are
surrounded by plagioclase masses. The crystals range in diameter from 50 - 150µm.
Biotite
As mentioned in the biotite section within the higher pressure (1.90kbar) experiments the
analysis of biotite within the experiments appears to be marred by its small crystal size. The
fact that the analysis appeared to be inaccurate is likely due to issues with the electron beam
within the SEM being too large to analyse the small crystals, rather than the analysis indicating
the presence of biotite crystals with non-stoichiometric compositions.
743°C: Biotite forms reaction rims around the garnet minerals within the experiments. The
biotite rim surrounding garnet is large, with a width of ~ 15.4µm at its widest point.
Compositionally, the biotite rim around garnet appears to be Al-rich and Mg-poor. The
Stellenbosch University https://scholar.sun.ac.za

CHAPTER 5: RESULTS
77
characteristic Fe-rich bands along the fracture planes of garnet crystals are also evident within
this experiment.
730°C: Garnet has a reaction rim of biotite. The biotite in this experiment appears
homogeneous, with the exception of fine Fe-rich bands that run parallel to the crystal
boundary. In this experiment there are also isolated masses of biotite plates that show
preferred orientation. These masses look subhedral in shape, with some masses appearing
to be more tabular in shape than others. These are most likely pseudomorphic replacements
of orthopyroxene by biotite within the experiment.
Clinoamphibole
Clinoamphibole was identified within both of the lower pressure experiments, but its analysis
was inaccurate as the results contained components of surrounding minerals and quenched
melt.
743°C: Clinoamphibole within this experiment appears similar to the clinoamphibole observed
in Experiment 3 at higher pressure (1.90kbar). Fine, needle like crystals of clinoamphibole
minerals appear to be the product of reactions between the clinopyroxene and melt (Figure
13 (C), pg. 65). This clinoamphibole reaction rim is surrounded by small (~2µm), euhedral
plagioclase crystals. The presence of plagioclase is indicative of water being drawn out of the
surrounding melt by mineral-melt reactions, which promotes crystallization.
730°C: The clinoamphibole surrounding the clinopyroxene appears as needle shaped crystals
that show no preferred orientation, and instead form a mesh like structure. These crystals are
<5µm in length and width. Unlike the biotite reaction rims around garnet the clinoamphibole
reaction rim surrounding clinopyroxene is less well-defined.
Melt
743°C: The melt portion is homogeneous in both appearance and composition. As in the
higher pressure experiments the melt is leucocratic in nature. The most significant difference
between the melts of the higher and lower pressure experiments is the higher K2O/Na2O ratio
of 2.29 compared to the 1.76 ratio seen in a similar temperature experiment (733°C) at
1.90kbar. The melt is vesicle-rich, containing vesicles as large as ~80µm in diameter. The
vesicles are likely fluid (H2O) saturated, as some contain hydrous, quenched crystals.
730°C: The melt is both similar in composition and appearance to the 743°C experiment
discussed above. However, slight variations in composition are evident. Overall the
experimental melt has the lowest A/NK and A/CNK ratios out of all the experimental melts
within this research at 1.52 and 1.41 respectively.
Stellenbosch University https://scholar.sun.ac.za

CHAPTER 6: DISCUSSION AND INTERPRETATION
78
Chapter 6: Discussion and Interpretation
6.1 Non-Equilibrium Studies
Examination of natural rock systems on a macroscopic scale can appear to show equilibrium
features. However, analysis of these rocks on a microscopic level is likely to display evidence
of grain-scale disequilibrium, such as coronas and reaction rims (Gill, 2015). The experimental
findings of this research exhibit both equilibrium and disequilibrium features. The experimental
run products provide a window into the degree of equilibration at various magmatic pressure
and temperature conditions within an average I-type granite composition.
From the findings of this experimental research it is clear to see that the experimental minerals
within the run products are both texturally and compositionally distinct from the initial
‘peritectic’ minerals added to the starting bulk composition. These mineralogical changes are
evidence of the system moving in the direction of equilibrium, by attempting to reduce its Gibbs
free energy (Giddings, 1991; Zhu and Anderson, 2002). The types of mineral reaction
processes that are seen to be at work within the magma are largely dependent on the stability
of the phases within the magma, as well as whether the individual ‘peritectic’ mineral phases
are in equilibrium with the surrounding magma composition. Similarly, the pressure and
temperature conditions of the surrounding magma is seen to control the types of reaction
processes, and ultimately the manner in which equilibrium is approached within individual
mineral phases.
Although the system appears to be moving in the direction of equilibrium, and can largely be
considered ‘equilibrium data’ (Luth, 1976), there is evidence of localized disequilibrium
features within the experimental run products. The presence of kinetically persistent
experimental garnet well below the pressure and temperature conditions in which it is
predicted to be stable by phase equilibrium modelling is a prominent disequilibrium feature
within the experimental results. Although the garnet composition is seen to change, potentially
through dissolution-precipitation mechanisms, and later reactions with the melt phase, it is
clear from the low pressure and temperature conditions of experimentation that these garnets
are preserved at near subsolidus conditions. The overriding implication of these findings is the
potential preservation of these disequilibrium features within the crystalline granitic rocks
(Carmichael et al., 1974). In the case of undifferentiated I-type granites, high pressure
minerals, such as garnets, are uncommon features (Clemens et al., 2011). However, where
garnets are present in granites they commonly appear to have reaction rims of biotite (e.g.,
Villaros et al., 2009a), as can also be seen in the experimental run products.
Stellenbosch University https://scholar.sun.ac.za
CHAPTER 6: DISCUSSION AND INTERPRETATION
79
This research is a study into the ‘fate’ of a mineral assemblage that may reasonably represent
an entrained ‘peritectic’ mineral assemblage within an I-type granitic magma. The research
assumed instantaneous emplacement of the magma at different, relatively low magmatic
temperatures (~720-770°C) and pressures (~2kbar). These pressure temperature conditions
were then steadily maintained over the 10 day experimental run-time. These ‘peritectic’
phases generally appear to be out of equilibrium with the composition, pressure and
temperature of the experimental magma. The subsections that follow examine the processes
by which these non-equilibrium ‘peritectic’ mineral phases are observed to either approach or
attain equilibrium within the experimental run products. Further discussions relating the
predicted stabilities of minerals and equilibrium nature of the ‘peritectic’ minerals as
determined by the phase equilibrium modelling are also outlined in the sections that follow.
Stellenbosch University https://scholar.sun.ac.za
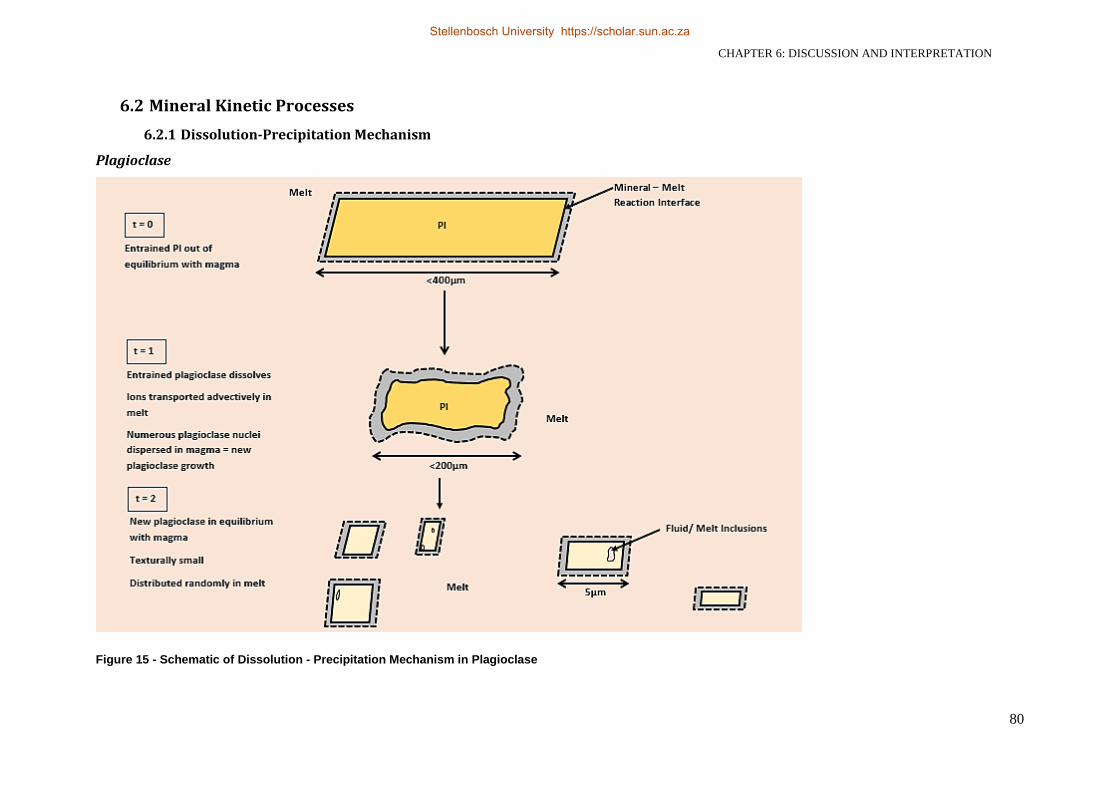
CHAPTER 6: DISCUSSION AND INTERPRETATION
80
6.2 Mineral Kinetic Processes
6.2.1 Dissolution-Precipitation Mechanism
Plagioclase
Figure 15 - Schematic of Dissolution - Precipitation Mechanism in Plagioclase
Stellenbosch University https://scholar.sun.ac.za
Stellenbosch University https://scholar.sun.ac.za

CHAPTER 6: DISCUSSION AND INTERPRETATION
81
As predicted by phase equilibrium modelling, experimental plagioclase is evident and stable
in all of the experimental run products. The experimental plagioclase crystals show evidence
of textural and compositional equilibration with the surrounding magma within 10 days, and
across all temperature and pressure conditions of experimentation. Due to the apparent fast-
nature of the equilibration it is proposed that these features are a consequence of a rapid and
efficient dissolution-precipitation mechanism as illustrated in Figure 15 (pg.80). Figure 16
(above) indicates the pressure and temperature regions in which the ‘peritectic’ plagioclase is
Figure 16 - Plagioclase Hypersolidus Stability Fields for an Average I-type Granitic Magma Composition. The orange shaded regions indicate where plagioclase is predicted to be stable by the phase equilibrium modelling, but is compositionally different to the initial ‘peritectic’ plagioclase seed placed within the experimental starting bulk composition. These PT regions correspond to where a coupled dissolution-precipitation mechanism is proposed to be the dominant reaction process responsible for the re-equilibration of plagioclase to the PT conditions of the surrounding magma in both natural and experimental systems. The red shaded areas show where the predicted and ‘peritectic’ plagioclase compositions used in the starting material are compositionally similar (±2.0 mol. % albite). Within these regions the plagioclase will not react, as it is in compositional equilibrium with the surrounding magma.
Stellenbosch University https://scholar.sun.ac.za
CHAPTER 6: DISCUSSION AND INTERPRETATION
82
predicted to be stable, and either out of compositional equilibrium (orange shaded region) or
in compositional equilibrium (red shaded region) with the surrounding I-type granitic magma
composition.
Initially the ‘peritectic’ plagioclase compositions within the experimental bulk starting
composition were metastable, but were out of compositional equilibrium with the surrounding
magma. In an attempt to reduce the free energy of the system, and ultimately achieve
equilibrium, the plagioclase crystals reacted spontaneously with the surrounding melt. As a
result of their compositional disequilibrium within the magma, the ‘peritectic’ plagioclase
crystals dissolved within the melt according to a coupled dissolution-precipitation mechanism.
During the dissolution stages Na, Ca, Al, Si from the plagioclase crystals are transferred
across a narrow, mineral-melt reaction interface into the surrounding melt. These liberated
components from the ‘peritectic’ plagioclase crystals are mobilized via advection within the
melt substrate. The transported components within the melt substrate bond with each other
and components of the silicate melt to form nuclei upon which a new, equilibrium plagioclase
phase can grow. These nuclei form within the melt at sites of compositional fluctuations or
impurities (Vernon, 2004). In the experiments small plagioclase crystals (<2µm long) appear
to have nucleated and grown along the reaction rims of biotite that surround the experimental
garnets and orthopyroxenes. In this case, plagioclase growth can largely be ascribed to the
depletion of H2O within the surrounding melt resulting from biotite growth at the expense of
H2O. Previous experimental studies have indicated that for a wide variety of starting
compositions (granites, granodiorites, dacites and rhyolites) the growth rate of plagioclase is
on average between 10-7 to 10-9 cm/s depending on the temperature and pressure conditions
(Agostini et al., 2013 and references therein).
Both textural and compositional evidence exists, which indicates that the initial ‘peritectic’
plagioclase has dissolved and re-precipitated with a composition better equilibrated with the
experimental conditions. The most compelling textural evidence to support this hypothesis is
the presence of primary melt inclusions along the edges of the newly formed plagioclase
crystals, particularly in the higher pressure experiments (e.g., 1.90kbar, 733°C). These
inclusions are proposed to be the result of: rapid growth of the plagioclase crystals, minor melt
compositional changes, and the deposition of foreign particles along the crystal surface
(Samson et al., 2003). Lower pressure experiments (1.40kbar) show plagioclase crystals with
etch pits along their surfaces. These etch pits are proposed to be suitable to entrap free fluid
phases on the surface of the crystals (Samson et al., 2003).
From a compositional perspective at each pressure and temperature condition of
experimentation the experimental plagioclase appears homogeneous, exhibiting no chemical
Stellenbosch University https://scholar.sun.ac.za

CHAPTER 6: DISCUSSION AND INTERPRETATION
83
or structural zonation. However, the experimental plagioclase varies in its composition
dramatically between experiments with different temperature conditions. The most noteworthy
compositional change is the increasingly sodic nature of the plagioclases with decreasing
temperatures. The initial ‘peritectic’ plagioclase composition was XAb = 0.64, whilst at the
highest temperature experiment (763°C; 1.90kbar) the albitic component of the newly
precipitated plagioclases was considerably lower at 43.08 mol. %. This value increases at
lower experimental temperatures, with the highest albite content (62.28 mol. %) at 723°C. It is
significant to note that the lowest temperature plagioclases retained a similar composition to
that of the initial ‘peritectic’ plagioclase crystals, with a difference of only ± 1.68 mol. %. The
change in plagioclase composition across different pressure and temperature conditions of
experimentation is evidence that the dissolution-precipitation mechanism brings the initial
‘peritectic’ plagioclase minerals into compositional equilibrium with the surrounding magma.
Newly formed plagioclase crystals in the higher temperature experiments (763-733°C;
1.90kbar) are small (<5µm length) and exhibit high levels of dispersion within the melt. The
aforementioned may be ascribed to the low entropy of fusion of plagioclase when compared
to the mafic minerals, such as garnet and pyroxene. Despite the fact that the plagioclase
crystals appear spatially isolated from one another, their compositions remain homogeneous
throughout the experiments. This geochemical homogeneity is probably due to the fact that
the experimental melt in which the plagioclase is both dissolved and precipitated is similarly
homogeneous in composition.
All the aforementioned compositional and textural features indicate that the experimental
plagioclase has undergone highly efficient recycling to the lower temperature conditions of the
surrounding melt, at pressure and temperature ranges appropriate to granitic magma
emplacement in the upper crust. From the experimental findings, the mechanism of
dissolution-precipitation is inferred to be rapid, occurring within the 10-day time frame of the
experimental runs. Further discussions relating to the dissolution and growth rates of the
experimental plagioclases are outlined in the ‘Dissolution Rates’ subsection (pg.86).
Clinopyroxene
In a similar manner to the ‘peritectic’ plagioclase, the ‘peritectic’ clinopyroxene added to the
starting bulk composition is out of compositional equilibrium with the surrounding magma.
Figure 17 (pg.85) illustrates the pressure and temperature conditions for which clinopyroxene
is predicted to be stable within the I-type granitic magma, and where the ‘peritectic’
clinopyroxene differs in composition from the predicted clinopyroxene phase. It is proposed
that across these pressure-temperature ranges the experimental clinopyroxenes have
undergone a localized, coupled dissolution-precipitation mechanism that has allowed for the
Stellenbosch University https://scholar.sun.ac.za

CHAPTER 6: DISCUSSION AND INTERPRETATION
84
precipitation of a new clinopyroxene phase along the ‘peritectic’ clinopyroxene surface.
Textural and compositional evidence of this mechanism is observed in the form of simple
compositional zonation, which can be seen in the mid-temperature, higher pressure
experiment (733°C at 1.90kbar). In this experiment the clinopyroxene core is compositionally
equivalent to the initial ‘peritectic’ clinopyroxene used in the starting powder. In contrast the
clinopyroxene rim differs quite significantly with an XDi of 0.94 and a XJd of 0.06. This zonation
pattern is evidence of a localized, coupled dissolution-precipitation mechanism that has
facilitated the partial equilibration of the ‘peritectic’ clinopyroxene crystal. Unlike the
dissolution-precipitation mechanism responsible for plagioclase equilibration that involves
mass transfer within the melt phase, new clinopyroxene growth occurs along the surface of
the dissolving ‘peritectic’ clinopyroxene crystal. The growth of the new clinopyroxene phase
is facilitated by the transfer of ions between the melt and ‘peritectic’ clinopyroxene across a
nanoscale mineral-melt reaction interface (Ruiz-Agudo et al., 2014). Consequently, this
reaction interface can have thermodynamic and physical properties; such as composition,
viscosity and solute adsorption, that differ vastly from the bulk melt composition (Ruiz-Agudo
et al., 2014). Precipitation along the ‘peritectic’ clinopyroxene crystal cores is triggered by the
supersaturation of the new clinopyroxene phase within the reaction interface (Ruiz-Agudo et
al., 2014).
Although Figure 17 (overleaf) suggests that clinopyroxene will undergo a dissolution-
precipitation mechanism across all of the investigated pressures and temperatures, it is clear
from the experimental findings that this is not always the case. At temperatures of 743°C and
730°C at 1.40kbar, and at 723°C at 1.90kbar the ‘peritectic’ clinopyroxene has a narrow
reaction rim of clinoamphibole. It should be noted that, at the lower experimental pressure of
1.40kbar, clinoamphibole is predicted by the phase equilibrium modelling to be a stable phase.
Interestingly, the composition of the ‘peritectic’ clinopyroxene remains unchanged within the
1.40kbar experiments, which indicates that a dissolution-precipitation mechanism is not at
work within these minerals. The experiments in which a reaction rim of clinoamphibole is
observed around the ’peritectic’ clinopyroxene are the only experiments predicted by the
modelling software to have an aqueous fluid phase. Further examination of these experimental
run products seems to show vesicles that contain quench, hydrous crystals, which indicates
agreement between the modelled and experimental findings. The reaction below illustrates a
potential reaction between clinopyroxene and the melt portion to produce clinoamphibole.
Diopside + Melt Components (Anorthite + Water) ⇌ Hornblende + Quartz + Ca-enriched melt
Stellenbosch University https://scholar.sun.ac.za

CHAPTER 6: DISCUSSION AND INTERPRETATION
85
The reaction rims of clinoamphibole around clinopyroxene are significantly narrower than the
biotite reaction rims surrounding both orthopyroxene and garnet at corresponding pressure
and temperature conditions. This suggests that the reaction involving clinopyroxene and melt
is significantly slower than the reactions involving orthopyroxene and melt, and garnet and
melt. This may be a consequence of the low anorthite component in the melt, compared to the
K-feldspar component that is a major reactant in the formation of biotite.
Figure 17 - Clinopyroxene Hypersolidus Stability Fields for an Average I-type Granitic Magma Composition. Clinopyroxene is predicted to be stable across the entire hyperdsolidus region (orange shaded regions). The composition of the ‘peritectic’ clinopyroxene mineral used within this research is out of compositional equilibrium with the surrounding magma across all hypersolidus conditions in which clinopyroxene is predicted to be a stable phase. The ‘peritectic’ clinopyroxene has a considerably higher diopside component (> 92 mol. %) compared to the predicted clinopyroxene composition, which in some cases is predicted to only contain 45 mol. % diopside. In a similar manner to ‘peritectic’ plagioclase, the ‘peritectic’ clinopyroxene is proposed to undergo a coupled dissolution—precipitation mechanism at the investigated pressurs and temperatures of this research. However, low temperature, fluid saturated experiments appear to show clinopyroxene reacting with melt to produce a hydrous phase, i.e. clinoamphibole.
Stellenbosch University https://scholar.sun.ac.za

CHAPTER 6: DISCUSSION AND INTERPRETATION
86
Dissolution Rates
In a multicomponent system the rate of reactions are regulated by the nucleation and growth
of new, more thermodynamically stable phases (Koga, 1999). There are several factors that
limit the growth of these stable phases, such as impeded ion transport through the melt
substrate, or the potentially slow rate of atomic bonding at the surface of the newly precipitated
phase (Koga, 1999). Previous experimental studies on the Sierra Nevada granites and
granodiorites determined the equilibration rate of feldspars with granitic and granodioritic
compositions exposed to similar pressure (2kbar) and temperature (725°C) conditions as this
study, to be incredibly slow, requiring an experimental run time of 4 to 6 months to equilibrate
fully (Piwinskii, 1968).
Unlike the previous experimental study mentioned above, the localized equilibration of granitic
components within the experiments conducted in this research is inferred to be rapid. The
most noteworthy evidence of this is the equilibration of ‘peritectic’ plagioclase to the P-T-X
conditions of the surrounding magma by an efficient, coupled, dissolution-precipitation
mechanism. The dissolution and precipitation stages of this mechanism are controlled by
different rate limiting factors. The dissolution stage of this mechanism is rate-controlled by the
slowest diffusing components in the surrounding melt portion, typically Si (Lo Cascio et al.,
2008) and Al in the case of plagioclase. Conversely, the rate of precipitation of new phases is
controlled by the “fastest major diffusing component in a crystal” (Lo Cascio et al., 2008). The
dissolution-precipitation mechanism is a simultaneous process (e.g., Putnis, 2002; Villlaros et
al., 2009). In fluid (H2O) -saturated experiments the dissolution of plagioclase is proposed to
be more efficient as H2O is able to act as a carrier of relevant ions, such as Na+ and Ca2+, or
in the case of K-feldspar, K+. H2O also influences the degree to which feldspathic material is
able to grow and develop within a magma. In the case of continuous decompression
experiments a sufficiently high H2O content at initial pressure temperatures encourages crystal
growth over nucleation (Arzilli and Carroll, 2013). Fluid (H2O) – saturated systems also favour
dissolution-precipitation over solid-state diffusion processes (Putnis, 2009).
In this research the duration of each experiment was 10 days, and in that time the experimental
plagioclase no longer texturally or compositionally resembled the higher pressure and
temperature ‘peritectic’ plagioclases. It is therefore presumed that the dissolution-precipitation
mechanism responsible for the formation of a new plagioclase composition occurs in under
10 days, particularly as no intermediary steps, such as mineral breakdown or zonation, are
observed within the experimental plagioclases. As a 10-day experimental run time was
maintained throughout the five experiments, the exact point in time at which plagioclase
equilibrated with the melt could not be determined.
Stellenbosch University https://scholar.sun.ac.za

CHAPTER 6: DISCUSSION AND INTERPRETATION
87
Figure 18 (below) illustrates a theoretical dissolution rate for plagioclase crystals of varying
lengths. The first point on the plagioclase line represents the length of initial ‘peritectic’
plagioclase (0.04cm) which was a constituent of the bulk starting composition of the
experiments. Previous experimental studies conducted at 1bar and 1kbar and >1000°C
indicate a minimum dissolution rate for plagioclase in the order of 10-7 cm/s for basaltic melts
(Agostini et al., 2013; Donaldson, 1985). There is a lack of dissolution data for plagioclase
within granitic systems at appropriate pressure and temperature conditions that correspond
with this research. However, experimental studies on various starting materials (granites,
granodiorites, rhyolites and dacites) determined the plagioclase growth rate to also be in the
order of 10-7 cm/s at similar pressure and temperatures to this research (Agostini et al., 2013
and references therein). It is unlikely that the ‘peritectic’ plagioclase is able to dissolve entirely
within the melt phase, therefore the rate limiting step appears to be the crystallization of the
new plagioclase phase. Consequently, 1 x 10⁻⁷cm/s was deemed an appropriate
approximation for plagioclase dissolution within the experiments. This growth rate is linear, as
opposed to volumetric. 4.62 days was calculated to be the length of time for dissolution to
occur in plagioclase mineral of 0.04cm (length).
From the graph below it can be determined that a plagioclase crystal of size 1cm would take
approximately 116 days to dissolve in an emplaced I-type magma (~720-770°C; 2kbar).
Figure 18 - Theoretical Dissolution Rates for ‘Peritectic’ Plagioclase
Calculations were also conducted to determine the minimum dissolution rate in g/hr for the
initial ‘peritectic’ plagioclase materials over a time period of 10 days. This was calculated by
determining the mass of plagioclase (g) that was placed within each experimental capsule.
0
0.2
0.4
0.6
0.8
1
1.2
1.4
1.6
1.8
2
2.2
5 14 23 32 42 51 60 69 79 88 97 106 116 125 134 143 152 162 171 180 189 199 208 217 226 236
Cry
stal
Siz
e (c
m)
Days
Theoretical Plagioclase Dissolution Rates
Stellenbosch University https://scholar.sun.ac.za

CHAPTER 6: DISCUSSION AND INTERPRETATION
88
These masses were then averaged (9.42 x 10⁻⁴ g), and divided by the hypothetical dissolution
time (4.62 days) for plagioclase in the experiments. The average minimum dissolution rate
was determined to be 8.49 x 10⁻⁶ g/hr, assuming a constant dissolution rate.
Stellenbosch University https://scholar.sun.ac.za

CHAPTER 6: DISCUSSION AND INTERPRETATION
89
6.2.2 Mineral-Melt Reactions
Garnet - Biotite
Figure 19 - Schematic of Reaction between Garnet and Melt to Produce Biotite
Stellenbosch University https://scholar.sun.ac.za
Stellenbosch University https://scholar.sun.ac.za

CHAPTER 6: DISCUSSION AND INTERPRETATION
90
As this research focuses only on pressure-temperature conditions appropriate to magma
emplacement at upper crustal levels, it is plausible that during the magma’s ascent garnet
would have reacted out of the surrounding magma. Figure 20 (pg.92) shows the various
pressure and temperature regions of garnet stability within an average I-type granitic magma
composition. It is evident from the figure that the ‘peritectic’ garnet used within this research
is unstable with respects to the surrounding magma for much of the relevant hypersolidus
pressure and temperature conditions. Narrow regions exists between 700 and 900°C and
between ~9 and 11kbar, in which the ‘peritectic’ garnet would be a stable phase. However,
the ‘peritectic’ garnets are compositionally dissimilar to the garnet compositions predicted for
these pressure-temperature ranges by the phase equilibrium modelling (orange shaded
regions). In this region it is proposed that ‘peritectic’ garnet would react with the surrounding
melt portion according to a dissolution-precipitation mechanism. Consequently, at these
pressure-temperature conditions the ‘peritectic’ garnets would behave in a similar manner to
those found within the garnets of the Cape Granite Suite (CGS), South Africa. The garnets of
the CGS were suggested to have undergone an extremely fast, coupled, dissolution-
precipitation mechanism that caused the entrained garnet crystals to partially equilibrate to
the lower pressure and temperature conditions of the surrounding S-type granitic magma.
Textural evidence of this partial equilibration was observed as chemically zoned garnet
crystals, with Mn-rich rims and Mn-poor cores (Villaros et al., 2009a).
As garnet stability appears to be highly pressure dependent, the reaction processes at the
pressure-temperature conditions of the source are different to those during magma ascent, as
well as those during final magma emplacement at higher crustal levels. At the investigated
pressure and temperature conditions the experimental garnets appear homogeneous in
composition, and all appear to have reaction rims of biotite. In the experimental run products,
biotite armours the garnets, preventing the reaction from running to completion, and ultimately
preserving garnet crystals at near subsolidus pressure and temperature conditions. I-type
granites are typically devoid of high pressure and temperature minerals, such as garnet
(Clemens et al., 2011). However, where garnet exists in these rocks it is characteristically
surrounded by biotite (e.g., Maas et al., 1997; Villaros et al., 2009a). The results of the
experiments, phase equilibrium modelling (Figure 20, pg. 92), as well as analysis of natural S-
type granites shows them to be in good agreement with one another. Figure 20 (pg. 92)
indicates that at the pressure-temperature conditions of this research garnet is unstable, and
consequently is unable to react according to a dissolution-precipitation mechanism. Instead,
within these pressure-temperature regions (blue shaded region) it is proposed that the
insoluble components of the ‘peritectic’ garnet, namely Fe, Mg, Ca, will be taken up by hydrous
minerals, such as biotite and clinoamphiboles (tremolite/hornblende) during mineral-melt
Stellenbosch University https://scholar.sun.ac.za

CHAPTER 6: DISCUSSION AND INTERPRETATION
91
reactions. Whilst at corresponding pressures, and higher temperatures (green shaded region)
the insoluble components resulting from the ‘peritectic’ garnet breakdown will be taken up by
anhydrous phases, such as; clinopyroxene, orthopyroxene and plagioclase. Consequently,
the types of garnet breakdown reactions and the minerals into which insoluble components of
the garnets partition is strongly controlled by the pressure and temperature conditions of the
surrounding magma.
The experimental garnets, although compositionally homogeneous, no longer resemble the
initial ‘peritectic’ garnets that were seeded into the experimental starting material either
texturally or compositionally. Minor changes to the original ‘peritectic’ garnet composition are
evident. There is an overall decrease in the almandine component (58.7 to 55.75 mol. %),
which relates to the ±0.1 apfu variation in the Fe2+ component of the garnets across the
different high pressure experiments. It is possible that the compositional changes to garnet
are the results of an efficient, coupled, dissolution-precipitation mechanism. If this is the case
it can be inferred that the dissolution-precipitation mechanism is faster than the transport of
K2O through the melt, as K2O is an essential component in the production of the biotite reaction
rims. However, there is a lack of textural evidence, such as chemical zonation or melt
inclusions, within the experimental garnets to support this suggestion. The lack of textural
evidence appears to argue for diffusion-related processes between the ‘peritectic’ garnet
composition and the newly precipitated biotite being responsible for the change in garnet
geochemistry at the low pressures and temperatures of the experiments. Further evidence
supporting this model is the fact that the Fe component of the melt remains steady over all
experiments ranging only from 0.5 to 0.6 wt. %. It can, therefore, be inferred that the Fe is
partitioned into the biotite rather than the melt portion. Calculations to determine the
hypothetical FeO + MgO value within the experimental melts assuming the complete
dissolution of garnet were carried out. The findings of the calculations indicate FeO + MgO
values in the range of 1.34 to 5.04 across the four experiments in which garnet is evident.
These hypothetical values are significantly higher than the FeO + MgO values for the
experimental melts which range from 0.57 to 0.68. Textural evidence of the Fe enrichment of
biotite includes the existence of Fe-rich bands within the newly precipitated biotite phase
(Figure 19, pg.89).
Stellenbosch University https://scholar.sun.ac.za

CHAPTER 6: DISCUSSION AND INTERPRETATION
92
Figure 20 - Garnet Hypersolidus Stability Fields for an Average I-type Granitic Magma Composition. The orange shaded regions are where garnet is stable, but is out of compositional equilibrium with the magma. The green shaded regions indicate where the ‘peritecitc’ garnet is unstable within the magma. At these PT ranges it is proposed that insoluble components (Fe, Mg, Ca) of the garnet will be taken up by anhydrous minerals, such as clinopyroxene, orthopyroxene and plagioclase. The blue shaded area indicates where garnet is similarly unstable, however it is suggested at these PT ranges the insoluble components of the garnet will be taken up by hydrous phases, such as biotite and clinoamphiboles. Across the blue shaded regions, i.e. where garnet is both unstable and out of compositional equilibrium with the magma, garnet will react with the surrounding melt to produce hydrous minerals.
Stellenbosch University https://scholar.sun.ac.za

CHAPTER 6: DISCUSSION AND INTERPRETATION
93
Figure 19 (pg. 89) illustrates the reactions between the experimental garnet and surrounding
melt portion at the investigated pressure and temperatures. The image illustrates the two
possible outcomes of the mineral-melt reaction process as observed through experimentation.
These two outcomes are discussed in detail below.
Porosity and Fluid Migration
Process 1 as illustrated in Figure 19 (pg. 89) shows the outcome of reactions involving the
‘peritectic’ garnet and the melt phase that has allowed for the precipitation of biotite upon the
dissolving ‘peritectic’ garnet crystal. It is important to note that phase equilibrium modelling
predicts that biotite is stable across all pressure-temperature conditions of experimentation,
suggesting that the newly precipitated biotite is likely to be in equilibrium with the surrounding
magma.
Garnet appears only to be evident in Experiments 2 (1.90kbar and 763°C) to 5 (1.40kbar and
730°C). The lack of garnet in Experiment 1 is probably due to the fact that the analysed section
plane was devoid of garnets. The dissolution of garnet appears to be driven by the interaction
of the garnet minerals with the surrounding melt through a nanoscale mineral-melt reaction
interface (Ruiz-Agudo et al., 2014). The interfacial melt enables the transport of ions (Fe, Mg,
Al and Si) both to and from the garnet crystal surface and the surrounding melt. In the case of
fluid-saturated conditions this is proposed to be more efficient, as melts with a higher dissolved
O-H component have lower viscosities, which results in higher diffusion rates. During this
process the interfacial melt becomes supersaturated with respects to a stable product phase,
in this case biotite. This supersaturation allows for the biotite to both nucleate and precipitate
along the garnet crystal surface (Ruiz-Agudo et al., 2014). The growth of this new phase is
therefore interface-controlled (Hammer, 2008). It should be noted that the reaction interface
exists parallel to the surface of the garnet crystal, thus producing pseudomorphic replacement
of garnet by biotite. The reaction involving garnet and the leucocratic melt is outlined below:
Garnet + Melt Components (K-feldspar + Water) ⇌ Biotite + Quartz + Al enriched melt
From the experimental results it is clear that the Al component of the surrounding melt remains
relatively stable (σ = 0.50 wt. %) across the variable temperatures and pressures of
experimentation. However, further examination of the biotite shows an increased Al
component within its structure, with the Al apfu ranging from 1.60 to 3.59. It is proposed that
the Al enrichment observed within the biotite crystals is actually evidence of a trapped Al
enriched melt. This enriched melt remains isolated away from the bulk melt composition due
to the armouring effects of the newly precipitated biotite phase. This conclusion has been
drawn as the biotite crystals are small (<2µm), and anhedral in some cases which means that
Stellenbosch University https://scholar.sun.ac.za

CHAPTER 6: DISCUSSION AND INTERPRETATION
94
the uncharacteristically high Al apfu values within the biotite are a consequence of
contamination from the high-Al interfacial melt during SEM analysis. Overall the growth of a
stable, biotite phase along the experimental garnet surfaces has no effect on the overall bulk
melt compositions within the experiments. This may be attributed to the fact that the overall
volume of biotite formed within the experiments is relatively small in comparison to the volume
of melt.
Although relatively rapid a process, the reaction of the metastable garnet with the melt portion
is unable to run to completion during the 10 day experimental run, and consequently garnet is
preserved at near-solidus temperatures. The incomplete reaction of garnet can be attributed
to two main factors. The first is that the relatively low temperature conditions of the
experiments are probably inadequate to allow for a sufficiently fast reaction rate. Secondly,
the armouring of garnet by biotite may inhibit the interaction between the garnet and the melt
portion. Porosity within the precipitated biotite is essential to allow for reaction between the
garnets and melt phases of the system. The amount of porosity is a consequence of the
relative proportion of parent to product minerals, as well as their relative solubilities in the
interfacial melt (Putnis, 2014; Putnis, 2009; Ruiz-Agudo et al., 2014). If the pore network with
the biotite remained open it is plausible that the reaction would have run to completion in spite
of the low temperatures of experimentation.
Fracturing
Process 2 (Figure 19, pg. 89) shows the result of stress on the garnet crystal resulting from
molar volume differences between the parent mineral (garnet) and the product mineral
(biotite). In this case the molar volume of the product, biotite, exceeds that of the parent,
garnet, causing the development and propagation of internal fractures within the garnet
structure. These fractures result in the formation of small, anhedral garnet fragments. Textural
evidence of the stress is observed in the form of biotite growth between the garnet fragments,
as well as the development of Fe-rich bands along the fracture planes. The fracturing of the
garnet could also be a result of the crushing and milling processes used to prepare the starting
bulk composition.
Orthopyroxene - Biotite
Pyroxenes are rare in exposed I-type granites, but they play an integral role in generating their
chemical compositions (Clemens et al., 2011). The ‘peritectic’ orthopyroxene has a similar fate
to that of ‘peritectic’ garnet, in that it is dissolved by interaction with the melt and a stable,
hydrous phase is precipitated along its surface. Similar reactions involving the ‘peritectic’
orthopyroxene and melt components are observed in the experiments. The balanced reaction
(Clemens and Wall, 1988) is outlined overleaf:
Stellenbosch University https://scholar.sun.ac.za

CHAPTER 6: DISCUSSION AND INTERPRETATION
95
Orthopyroxene + Melt Components (K-feldspar + Water) ⇌ Biotite + Quartz
6(Mg, Fe)SiO3 + 2KAlSi3O8 + H2O ⇌ K2(Fe, Mg)6Si6Al2O20(OH)4 + 6SiO2
Unlike the experimental garnet, the experimental orthopyroxene completely breaks down and
is replaced by biotite in fluid-saturated experiments, at near subsolidus temperatures. The
various temperature conditions of the 1.90kbar experiments provide a window into this
process. At higher temperatures (763°C) there is an abundance of large orthopyroxene
crystals surrounded by narrow rims of biotite (<5µm diameter), whilst in the low-temperature
experiments (723°C) the biotite rims are larger at ~10µm width, and the orthopyroxene
appears to be almost completely dissolved (<5µm diameter). At this low temperature there are
also subhedral masses of biotite plates that appear to be pseudomorphs of the original
orthopyroxene crystals. In the higher (743°C) temperature experiment conducted at 1.40kbar
orthopyroxene is absent, despite it being predicted over these conditions by the modelling
software. These orthopyroxene crystals appear to have completely reacted with the melt to
form biotite in a similar manner to those in the higher-pressure experiments (1.90kbar). The
small size and complete breakdown of some of the experimental orthopyroxene crystals at
low temperatures and pressures supports findings in natural rocks that indicate that
orthopyroxenes are rare in I-type granites.
Examination of the stability of ‘peritectic’ orthopyroxene compositions within the phase
equilibrium modelling indicates that at the investigated pressures and temperatures two
reaction processes should be evident. In Experiments 1 (733°C and 1.90kbar), 3 (723°C and
1.90kbar) and 5 (730°C and 1.40kbar) the ‘peritectic’ orthopyroxene is suggested to be
unstable, and consequently reacts with the melt phase to form hydrous minerals, such as
biotite or clinoamphibole (tremolite/hornblende). Further discrepancies between the inferred
reaction processes of the phase equilibrium modelling and those observed within the
experiments can be observed across both the higher and lower experimental pressure
conditions. In Experiment 2 (763°C at 1.90kbar) and Experiment 4 (743°C at 1.40kbar) the
‘peritectic’ orthopyroxene is stable, but differs in composition from the orthopyroxene
composition predicted by phase equilibrium modelling. At these pressures it is therefore
inferred that the dominant reaction process should be dissolution-precipitation. However,
examination of the experimental run products indicates that at these pressure and temperature
conditions orthopyroxene undergoes reactions with the surrounding melt to precipitate a biotite
phase along its surface, and consequently can be considered to be an unstable phase within
the magma.
Orthopyroxene reaction to clinoamphibole in natural granitic systems is common (e.g.,
Clemens and Wall, 1988), although in the case of this research it appears that the reaction of
Stellenbosch University https://scholar.sun.ac.za

CHAPTER 6: DISCUSSION AND INTERPRETATION
96
orthopyroxene to biotite is favoured over clinoamphibole production. The reaction below
illustrates a potential reaction involving orthopyroxene and melt components to produce
clinoamphibole within the experimental system.
Orthopyroxene + Melt Components (Anorthite + Quartz + Water) ⇌ Clinoamphibole + Al enriched melt
The above reaction, although plausible, appears not to occur within the experimental run
products. The reason for this may be due to the fact that the anorthitic component within the
melt is too low to facilitate the production of clinoamphibole from orthopyroxene as in the
above reaction, whilst the K-feldspar component of the melt is sufficiently high to allow for the
reactions between orthopyroxene and melt to produce biotite.
The disconnect between the stability of orthopyroxene as predicted by the phase equilibrium
modelling in Figure 21 (overleaf), and as seen in the experimental results is of particular
interest. Previous examination of minerals such as garnet, plagioclase and clinopyroxene
have shown good agreement between the findings of the two techniques. However, in the
case of orthopyroxene it is plausible that the phase equilibrium modelling software
overestimates the stability of this mineral phase within the magma. Why this overestimation of
orthopyroxene occurs is more difficult to constrain. The fact that biotite appears to be stable
at temperatures and pressures above its predicted stability zone (Experiment 2, 763°C and
1.90kbar), suggests that the modelling software has underestimated the stability of biotite as
well. This underestimation of biotite within the modelling may be ascribed to the manner in
which the biotite model (BI05, White et al., 2005) that was utilized to create the phase
equilibrium model, handles the Ti component within the biotite phase. How Ti is handled within
the model exerts a strong control on the pressure and temperature stability of phases within
the phase equilibrium models (White et al., 2007). As there is a complex interplay between
the various mineral models used to develop the phase equilibrium diagram it is likely that the
over- and underestimation of these two minerals are interlinked, and that this can account for
the deviation between the phase equilibrium modelling and experimental results.
Stellenbosch University https://scholar.sun.ac.za

CHAPTER 6: DISCUSSION AND INTERPRETATION
97
Figure 21 -Orthopyroxene Hypersolidus Stability Fields for an Average I-type Granitic Magma Composition The red shaded region indicates where orthopyroxene is a stable phase, and where the ‘peritectic’ orthopyroxene is similar in composition (XEn = ±0.02) to the predicted orthopyroxene composition. The orange shaded regions display where orthopyroxene is predicted to be a stable phase, but where the ‘peritectic’ orthopyroxene has a composition significantly different to that of the predicted orthopyoxene. The blue shaded pressure-temperature regions indicate where orthopyroxene is unstable, and out of compositional equilibrium with the surrounding magma. Across these pressure-temperature ranges the ‘peritectic’ orthopyroxene is proposed to react with the surrounding melt to form hydrous minerals, biotite or hornblende, in a similar manner to the ‘peritectic’garnet.
Stellenbosch University https://scholar.sun.ac.za

CHAPTER 6: DISCUSSION AND INTERPRETATION
98
6.3 Melt Compositions
0
0.2
0.4
0.6
0.8
1
1.2
1.4
0 0.02 0.04 0.06 0.08
Si
Fe + Mg
0
0.05
0.1
0.15
0.2
0.25
0.3
0.35
0 0.02 0.04 0.06 0.08
Al
Fe + Mg
0
0.02
0.04
0.06
0.08
0.1
0.12
0.14
0.16
0 0.02 0.04 0.06 0.08
K
Fe + Mg
LEGEND
Experiment 1 (1.90kbar; 733°C)
Experiment 2 (1.90kbar; 763°C)
Experiment 3 (1.90kbar; 723°C)
Experiment 4 (1.40kbar; 743°C)
Experiment 5 (1.40kbar; 730°C)
Melts (Literature)
0
0.002
0.004
0.006
0.008
0.01
0 0.02 0.04 0.06 0.08
Ti
Fe + Mg
0
0.01
0.02
0.03
0.04
0.05
0.06
0.07
0.08
0 0.02 0.04 0.06 0.08
Ca
Fe + Mg
0
0.02
0.04
0.06
0.08
0.1
0.12
0.14
0.16
0 0.02 0.04 0.06 0.08
Na
Fe + Mg
00.20.40.60.8
11.21.41.61.8
2
0 0.02 0.04 0.06 0.08
A/C
NK
Fe + Mg
Figure 22 - Bivariate Plots of Melt Major Element Compositions
*Melt values are normalized anhydrous.
Stellenbosch University https://scholar.sun.ac.za
CHAPTER 6: DISCUSSION AND INTERPRETATION
99
Figure 22 (pg. 98) shows plots of various elements (moles of element per 100g of rock) against
maficity (atomic Fe + Mg per 100g of rock) for the experimental melts, along with
compositionally similar melts from the literature. The compositions of the experimental melts
are relatively consistent and appears to be largely independent of pressure or temperature.
This is evident from the clustered nature of the experimental data presented above. The
similarity in the melt compositions suggests that they are largely unaffected by the
mineralogical changes to the system that result from multiple, concurrent mineral reactions
involving garnet and melt, orthopyroxene and melt, clinopyroxene and melt, and plagioclase
and melt.
The compositions of the melts from the literature are strongly peraluminous. They have been
generated experimentally by the partial melting of metagreywackes, biotite gneisses and
pelites. These compositions were taken from Gardien et al., 1995; Montel and Vielzeuf, 1997;
Patiño-Douce and Beard, 1996 and Stevens et al., 2007. Examination of the graphs and melt
analyses show that the melt produced in this research is strongly peraluminous. Examination
of the Ti versus maficity graph (Figure 22, pg. 98) shows the experimental melts to have no Ti
within their compositions. This correlates well with the findings of Clemens et al., (2011) that
suggest that the Ti component of an I-type granite magma is concentrated within the peritectic
mineral assemblage. Conversely, Clemens et al., (2011) suggest that the K component of the
magma is largely present within the melt portion. However, the experimental melt
compositions seem to have a low K2O component (4.10 to 5.28 wt. % range) when contrasted
against other oxides, such as Al2O3. Steps were taken to reduce the effects of Na and K
counting losses during melt analysis on the SEM, in particular the use of liquid nitrogen to
freeze the sample at approximately -180°C. The Al composition of the melt remains relatively
stable across the investigated pressure and temperature range.
Further analysis of the graphs in Figure 22 (pg. 98) shows the experimental melts to be slightly
more leucocratic than the melts taken from the literature. This can be attributed to the different
protolithic material used to generate the melts, the low temperature of experimentation, as
well as the fact that a significant proportion of the Fe and Mg component within the
experimental run products remains within garnet and orthopyroxene minerals that are
metastable at the investigated pressures and temperatures of experimentation. The
leucocratic nature of these experimental melts is consistent with previous experimental
findings by Montel and Vielzeuf, 1997; Stevens et al., 2007; Taylor and Stevens, 2010, that
suggest that granitic melts are significantly more leucocratic than average I-type granite
compositions. In a similar manner to the findings of Villaros et al., (2009) the melts produced
in this research never contain sufficient FeO + MgO to completely digest the entrained
ferromagnesian phases, such as garnet. This is one proposal that can potentially account for
Stellenbosch University https://scholar.sun.ac.za

CHAPTER 6: DISCUSSION AND INTERPRETATION
100
the persistence of garnets at the low pressure and temperatures of experimentation. This
research demonstrates experimentally, as well as with phase equilibrium modelling, that to
recreate a bulk composition aligned with an average to mafic granite composition a leucocratic
melt must co-exist with some entrained residuum of mafic composition throughout its
magmatic history. And it is the entrainment of this more mafic mineral assemblage that
facilitates the formation of AFM mineral components within the granitic melt.
Stellenbosch University https://scholar.sun.ac.za

CHAPTER 6: DISCUSSION AND INTERPRETATION
101
6.4 Phase Equilibrium Modelling vs. Experimental Findings
Theoretical models allow insight into what occurs in a particular geological system if
equilibrium is obtained over a range of pressure and temperature conditions. Drawing
comparisons between the modelling and experimental techniques is instrumental in
understanding the degree to which an experimental run has deviated from the ‘ideal’ scenario.
The experiments conducted in this research are in a non-equilibrium state upon their
completion, with disequilibrium features preserved at near-solidus conditions. Anderson
(2002, pg. 180) states that it is possible that “no real system ever reaches equilibrium by the
criteria applied to modelled systems.” The experiments in this research are closed-systems,
and therefore cannot replicate certain aspects of natural systems (e.g. external fluid
interactions) that can further shift the system away from to towards equilibrium. This fact
makes assessing the equilibrium state of experiments in terms of modelling more practicable.
The subsections that follow examine the similarities and differences between modelling and
experimental results in terms of mineral assemblages, proportions and compositions.
Stellenbosch University https://scholar.sun.ac.za

CHAPTER 6: DISCUSSION AND INTERPRETATION
102
Modelled vs. Experimental Mineral Assemblages
LEGEND
H2O – Melt Saturation Band
1 Pl + Bt + Ilm + Cam + Cpx + LIQ + H2O + Qtz
2 Pl + Bt + Ilm + (2)Cam + Cpx + LIQ + H2O + Qtz
3 Pl + Bt + Ilm + (2)Cam + Cpx + LIQ + Qtz
4 Pl + Bt + Ilm + Opx + Cam + Cpx + LIQ + Qtz
5 Pl + Bt + Ilm + Opx + Cpx + LIQ + H2O + Qtz
6 Pl + Bt + Ilm + Opx + Cam + Cpx + LIQ + H2O + Qtz
7 Pl + Bt + Ilm + Opx + Cam + Cpx + LIQ + H2O
8 (2)Pl + Bt + Ilm + Opx + Cpx + H2O + Qtz
9 Pl + Ilm + Opx + Cpx + LIQ + H2O + Qtz
Figure 23 - Modelled vs. Experimental Mineral Assemblages
Pl
Ilm
Grt
Bt
CamOpx
Cpx
LIQ
Qtz
H2O
Stellenbosch University https://scholar.sun.ac.za

CHAPTER 6: DISCUSSION AND INTERPRETATION
103
Figure 23 (pg.102) provides the reader with a visual comparison between the mineral
assemblages predicted by the phase equilibrium modelling and those produced by
experimentation. In the diagram, phases such as metastable orthopyroxene and metastable
garnet have not been included in order to draw more appropriate comparisons between the
mineral assemblages produced by the two different approaches. However, the exclusion of
these phases from the diagram will mean there is a small mismatch between the modelled
bulk composition and the effective bulk composition that applies to the experiments.
Examination of Figure 23 (pg. 102) shows that for an average I-type granitic composition
exposed to relatively low temperatures and pressure conditions pseudosection modelling is
an appropriate tool to predict experimental outcomes. In particular, phases such as Pl, Cpx,
and LIQ appear to be both predicted for by the phase equilibrium modelling, as well as evident
within the experimental run products across the range of investigated pressures and
temperatures. This would suggest that in regards to the aforementioned phases the phase
equilibrium modelling and experimental results are in good agreement. The complication
arises when one considers the metastable phases in the experimental run products that are
not accounted for by the modelling.
The table below provides a further breakdown of the mineral assemblages predicted for by
phase equilibrium modelling and those produced through experimentation. Unlike Figure 23
(pg. 102) the table below accounts for the metastable phases within the experimental mineral
assemblages. The metastable phases are denoted in red.
Table 14 - Mineral Assemblage Summary
Experiment P
(kbar) T
(°C) Predicted Assemblage Experimental Assemblage
1 1.90 733 Pl + Bt + Ilm + (2)Cam + Cpx + LIQ +
Qtz Pl + Bt + Ilm + Cpx + LIQ + Qtz
2 1.90 763 Pl + Ilm + Opx + Cam + Cpx + LIQ Pl + Ilm + Grt + Bt + Ilm + Opx + Cpx +
LIQ + Qtz
3 1.90 723 Pl + Bt + Ilm + Cpx + H2O + LIQ + Qtz Pl + Bt + Grt + Opx + Cpx + Cam + LIQ
+ H2O + Qtz
4 1.40 743 Pl + Bt + Ilm + Opx + Cam + Cpx + LIQ
+ H2O Pl + Ilm + Cpx + Grt + Bt + Cam + LIQ +
H2O + Qtz
5 1.40 730 Pl + Bt + Ilm + Cpx + LIQ + H2O + Qtz Pl + Grt + Ilm + Cpx + Bt + Cam + LIQ +
H2O + Qtz
*Metastable phases are indicated in red.
The differences between the phase equilibrium modelling and the experimental outputs can
be attributed to the presence of metastable phases, such as garnet and orthopyroxene. This
occurs because the modelling is unable to account for the kinetics, i.e. the reaction rates and
reaction pathways, of minerals that have been introduced into a system with which they are
out of compositional equilibrium. As the ‘peritectic’ garnet is out of compositional equilibrium
Stellenbosch University https://scholar.sun.ac.za

CHAPTER 6: DISCUSSION AND INTERPRETATION
104
with the surrounding magma at the investigated pressures and temperatures it reacts to
produce biotite. The aforementioned accounts for why biotite is evident in Experiment 2
(1.90kbar; 763°C), which was conducted at pressures and temperatures outside its predicted
stability field. The lack of clinoamphibole within Experiment 1 (1.90kbar; 733°C) and
Experiment 2 (1.90kbar; 733°C) may relate to the low anorthite melt component, as well as
the fact that these experiments lack a free fluid (H2O) phase. Similarly, orthopyroxene reacts
with the surrounding melt to form biotite. At the pressure and temperature condition of
Experiment 4 (1.40kbar and 743°C), orthopyroxene is predicted to be stable, although it
appears to be absent in the experimental run products (Table 14, pg.103). This may relate to
the compositional difference between the predicted and ‘peritectic’ orthopyroxene used within
the starting bulk composition, or it may be attributable to issues with the modelling that
overestimates the stability of orthopyroxene (as discussed previously in the ‘Orthopyroxene -
Biotite’ subsection, pg. 94-97).
Mineral Proportions
Table 15 (overleaf) compares the volume percentage between the minerals predicted by
phase equilibrium modelling and those produced by experimentation. The volume percentage
of the experimental minerals was determined using Microsoft Excel Solver Add-In. The most
apparent inconsistency between the modelled and experimental data is the presence of
metastable garnet and orthopyroxene, along with the absence of clinoamphibole within some
of the higher pressure and temperature (1.90kbar; 763°C and 733°C) experimental
assemblages. The persistence of garnet and orthopyroxene to pressure-temperature
conditions outside their stability field has been discussed in the ‘Mineral-Melt Reactions’
section (pg. 89).
Stellenbosch University https://scholar.sun.ac.za

CHAPTER 6: DISCUSSION AND INTERPRETATION
105
Table 15 - Predicted vs. Experimental Mineral Volume Percentages
Exp. P
(kbar) T
(°C) Predicted Assemblage Experimental Assemblage
SSR Values
1 1.90 733 25.3Pl + 6.0Bt + 0.4Ilm +
4.3(2)Cam + 2.1Cpx + 56.9LIQ + 5.0Qtz
29.6Pl + 1.2Ilm + 4.5Cpx + 14.6Bt + 32.7LIQ + 17.5Qtz
0.76
2 1.90 763 21.2Pl + 0.5Ilm + 5.2Opx + 0.7Cam + 3.0Cpx + 69.4LIQ
11.8Pl + 0.0Grt + 18.2Bt + 1.5Ilm + 0.2Opx + 6.8Cpx +
55.4LIQ + 6.0Qtz 1.99
3 1.90 723 29.4Pl + 10.9Bt + 0.4Ilm + 3.4Cpx + H2O + 43.6LIQ +
12.3Qtz
14.3Pl + 6.7Bt + 7.5Grt + 0.0Opx + 7.1Cpx + 0.0Cam +
63.5LIQ + H2O + 1.0Qtz 1.24
4 1.40 743 24.5Pl + 0.8Bt + 0.5Ilm +
4.0Opx + 3.5Cam + 1.8Cpx + 64.9LIQ + H2O
19.3Pl + 0.8Ilm + 0.0Grt + 8.4Bt + 10.6Cam + 7.0Cpx + 42.0LIQ
+ H2O + 11.9Qtz 1.15
5 1.40 730 32.6Pl + 11.2Bt + 0.4Ilm + 3.4Cpx + 38.0LIQ + H2O +
14.4Qtz
13.9Pl + 18.1Bt + 0.0Grt + 1.1Ilm + 6.8Cpx + 50.1LIQ +
H2O + 1.0Cam + 9.1Qtz 0.43
*Metastable phases are indicated in red. *Experimental assemblage proportions calculated using Excel Solver Add-in. *SSR values show minimized deviation between the predicted and experimental mineral proportions.
Hornblende is the dominant clinoamphibole mineral of I-type granitic rocks (Clemens et al.,
2011), and has a general mineral formula of Ca2(Mg,Fe,Al)5(Al, Si)8O22(OH)2. The low modal
proportion of clinoamphibole in the experimental run products is likely to be a consequence of
high Al, Fe and Mg minerals, specifically garnet, orthopyroxene and biotite, being present in
considerably greater proportions than predicted for by the modelling software. It is possible
that had the experimental assemblage been exposed to pressure-temperature conditions
aligned with magma ascent, the digestion of garnet and orthopyroxene through mineral-melt
reactions would have run to completion, thus allowing for greater proportions of
clinoamphibole to be produced. The lack of clinoamphibole produced in Experiment 1 (733°C
and 1.90kbar) and Experiment 2 (763°C and 1.90kbar) will have minimal effect on the
equilibrium nature of the experimental magma, as only a small percentage of clinoamphibole
was predicted at the pressure-temperature conditions of experimentation (max. predicted vol.
% = 4.3 % in Experiment 1).
In the case of Experiment 3 (1.90kbar; 723°C) the Excel solver determined that 0%
orthopyroxene existed in the experimental run product. Analysis of the run product of the same
experiment shows minor quantities of metastable orthopyroxene. In general the quantities of
orthopyroxene are lower in the experiments than anticipated. The greatest deviation from the
predicted proportion can be seen in Experiment 2 at 0.2 vol. %, instead of the predicted 5.2
vol. %. Conversely, clinopyroxene exists in significantly higher quantities than predicted. At
1.90kbar the phase equilibrium modelling predicts ranges of 2.1 to 3.4 vol. % for
clinopyroxene, whilst the experimental proportion is significantly higher, ranging between 4.5
Stellenbosch University https://scholar.sun.ac.za
CHAPTER 6: DISCUSSION AND INTERPRETATION
106
to 7.1 vol. %. Similar discrepancies can be seen in the 1.40kbar experiments which predict
ranges of 1.8 to 3.4 vol. % clinopyroxene, whilst the experimental proportions range between
6.8 to 7.0 vol. % clinopyroxene.
The proportion of plagioclase predicted and the volume produced through experimentation
appears similar at 1.90kbar and 733°C. However, the proportion of plagioclase in the high and
low temperature experiments run at 1.90kbar differ dramatically (± 15.1 vol. %). In the case of
the lowest-temperature experiment (723°C) the phase equilibrium modelling placed the
pressure-temperature conditions of the experiment within the H2O-melt saturation band. The
high volumes of silicate melt within this experiment would inhibit the formation of a large
portion of plagioclase at these pressure-temperature conditions, as it is Si, Al and Na rich. In
much the same way, the availability of Si in the melt is considered to vary narrowly (±2.18 wt.
% SiO2) with the growth of newly precipitated minerals, such as biotite, and across varying
experimental temperature conditions. If insufficient Si is available within the melt the proportion
of magmatic quartz that is precipitated will be limited. This is evident in Experiment 3 (1.90kbar
and 723°C) where 12.3 vol. % quartz was predicted, but only 1.0 vol. % was present in the
experimental run product.
Comparisons between the volume percent melt in the model versus the experiments indicate
that the values are relatively consistent. The greatest variation between the two is seen in
Experiment 1 (1.90kbar and 723°C) and Experiment 4 (1.40kbar and 730°C) with the predicted
volume percentage of melt being 22.9 to 24.2 vol. % lower than the experimental results.
The SSR Values within Table 15 (pg.105) indicate the minimized deviation between the
predicted and experimental mineral proportions. As these values are low (<1.99) it suggests
that there is a strong level of agreement between the predicted mineral proportions and the
proportions of minerals produced within the experimental run products. It is suggested that
without the presence of metastable phases, such as orthopyroxene and garnet in the
experiments, these SSR values would be even lower.
Mineral Compositions
Table 16 (pg.109) and Table 17 (pg.110) illustrate the compositional differences between the
predicted and experimental minerals for each experiment. The tables show both the mineral
formulae and the mol. % values (where applicable) of the predicted and experimental mineral
assemblages to allow for comparisons to be drawn between the two. It is essential to note that
as modelling software represents an ‘ideal’ scenario it cannot account for mineral impurities
and heterogeneities that may exist within the experimental mineral phases (Anderson, 2002).
Stellenbosch University https://scholar.sun.ac.za

CHAPTER 6: DISCUSSION AND INTERPRETATION
107
These mineral impurities and heterogeneities can, in part, account for the minor discrepancies
between the predicted and experimental compositions.
There are a few major deviations between the experimental results and phase equilibrium
modelling outputs. The most significant is the presence metastable garnet and orthopyroxene
in some of the experimental assemblages. Another discrepancy is fact that the analysis of
experimental biotite and clinoamphibole were contaminated by surrounding crystals and/or
quenched melt. Where biotite crystals were large enough to analyse, the needle-like network
of the crystals meant the surface was not flat enough to obtain an accurate analysis. Thus
these mineral compositions have been excluded from Table 16 (pg. 109) and Table 17 (pg.
110). There is also a considerable difference in the mol. % formula of the clinopyroxenes
(diopside) predicted for the 1.90kbar experiments and those in the experiments themselves.
The experimental clinopyroxenes have XDi values greater than 0.92, compared to the 0.46 to
0.62 predicted for by the modelling software at corresponding temperatures and pressures. At
the approximate conditions of the source (~9kbar and 850°C) the phase equilibrium modelling
predicts a clinopyroxene composition of 61.49 mol. % diopside. Therefore the discrepancy
between the two values is likely ascribed to the fact that an ideal diopside was used as the
‘peritectic’ clinopyroxene phase within the starting bulk composition of the experiments. This
is the case for all of the ‘peritectic’ phases seeded into the starting bulk composition, and its
effects are widespread. As described by White et al., (2011), differences between modelled
mineral compositions and those in experiments can account for the differences in the mineral
proportions and assemblages produced by the two techniques. This is suggested to be
because experiments are closed systems, and thus “mass balance requirements” must be
maintained within the set experimental bulk composition (White et al., 2011, pg. 244).
At first glance the mol. % formula of the experimental orthopyroxene is considered to differ
significantly from the predicted data. This is due to the Theriak-Domino modelling software
accounting for a theoretically ‘ordered’ orthopyroxene known as ‘Fm’, which the software
automatically includes in the mol. % breakdown of the orthopyroxene mineral composition.
By not taking this ‘Fm’ component into account the normalized enstatite component is still
significantly lower (50.0 to 58.4) than the corresponding enstatite mol. % of the experimental
orthopyroxenes (65.5 to 78.8).
Concluding Remarks
The mineral assemblages, proportions and compositions of the modelled and experimental
datasets have been shown to be similar. The correlation between the two research media
would strongly suggest that modelling in the case of I-type granites is an appropriate method
to formulate, as well as interpret experiments. However, it appears that caution must be
Stellenbosch University https://scholar.sun.ac.za

CHAPTER 6: DISCUSSION AND INTERPRETATION
108
exercised in drawing parallels between the experimental and modelled findings, particularly in
the use of biotite and amphibole solution models. It appears that for an average I-type granite
composition subjected to low pressures (~2kbar) and temperatures (~720 - 770°C) these
models significantly misjudge the stability of mineral phases, such as clinopyroxene, biotite
and orthopyroxene. Where the compositions and proportions of minerals differ between the
two methods it can largely be attributed to the presence of metastable garnet and
orthopyroxene in the experimental run products. The felsic minerals appear to be the most in
keeping with the modelled equilibrium data in terms of composition and proportions, whereas
minerals with a higher ferromagnesian component, such as orthopyroxene, differ substantially.
Textural and compositional evidence both through the analysis of the experimental run
products and phase equilibrium modelling would argue for grain-scale disequilibrium in the I-
type granitic magma of this research.
Stellenbosch University https://scholar.sun.ac.za

CHAPTER 6: DISCUSSION AND INTERPRETATION
109
Table 16 - Predicted vs. Experimental Mineral Compositions (1.90kbar)
Higher Pressure Isobaric Cooling Path (1.90kbar)
Experiment 1 - 733°C Experiment 2 - 763°C Experiment 3 - 723°C
Predicted Experimental Predicted Experimental Predicted Experimental
Pl NaAlSi2.5O8
XAb= 0.57
Na0.6Ca0.4Al1.4Si2.7O8
XAb= 0.61 Pl
NaAlSi2.5O8
XAb= 0.52
Na0.4Ca0.5Al1.5Si2.6O8
XAb= 0.43 Pl
NaAlSi2.6O8
XAb= 0.61
Na0.6Al1.3Si2.7O8
XAb= 0.62
Ilm FeTiO3 Fe2+0.9Fe3+
0.1Mn0.1Mg0.1Ti0.9O3 Ilm FeTiO3 Fe2+0.8Fe3+
0.2Mn0.1Ti0.9O3 Ilm FeTiO3 -
Opx - - Opx FeMgSi2.0O6
XEn= 0.58
Mg1.5Fe0.4Si1.6O6
XEn= 0.78 Opx -
Mg1.3Fe0.7Si1.9O6
XEn= 0.65
Cpx CaMgSi2.0O6
XDi= 0.49
Ca0.9Mg0.9Fe0.2Si1.9O6
XDi= 1.00
Cpx CaMgSi2.0O6
XDi= 0.62
Ca0.8Mg0.9Fe0.4Si2.0O6
XDi= 0.98 Cpx
CaMgSi2.0O6
XDi= 0.46
Ca0.9Mg0.8Si1.9O6
XDi= 0.92
Grt - - Grt - Al2.0Fe1.7MgSi3.0O12 Grt - Al2.0Fe1.6MgSi3.0O12
Bt KFeMg2AlSi3.0O10(OH)2 *** Bt - *** Bt KFeMg2AlSi3.0O10 ***
Cam Ca2Mg5Si7.9O22 - Cam Ca2Mg5Si7.9O22 - Cam - ***
*** Mineral phases have been identified using SEM analysis, although the exact compositions of these phases are unknown. Small crystal sizes has meant analysis of these phases are contaminated by surrounding minerals and/or quenched melt.
Stellenbosch University https://scholar.sun.ac.za
Stellenbosch University https://scholar.sun.ac.za

CHAPTER 6: DISCUSSION AND INTERPRETATION
110
Table 17 - Predicted vs. Experimental Mineral Compositions (1.40kbar)
Lower Pressure Isobaric Cooling Path (1.40kbar)
Experiment 4 - 743°C Experiment 5 - 730°C
Predicted Experimental Predicted Experimental
Pl (Na0.5Ca0.4)AlSi2.6O8
XAb= 0.55
(Na0.6Ca0.4)Al1.3Si2.7O8
XAb= 0.63 Pl
NaAlSi2.7O8
XAb= 0.62
Na0.6Ca0.4Al1.4Si2.6O8
XAb= 0.62
Ilm FeTiO3 Fe2+0.5Fe3+
0.8Ti0.4O3 Ilm FeTiO3 Fe2+0.8Fe3+
0.2Mn0.1Ti0.9O3
Opx FeMgSi2.0O6
XEn= 0.50 - Opx - -
Cpx CaMgSi2.0O6
XDi= 0.56
Ca0.5Mg1.1Fe2+0.3Si1.9O6/
Ca0.9Mg0.9Fe2+0.2Si1.9O6
XDi= 1.00
Cpx CaMgSi2.0O6
XDi= 0.46
CaMgSi2.0O6
XDi= 1.00
Grt - Al3.0Fe2.0Mg0.8Si3.0O12 Grt - Al2.0Fe1.7Mg0.9Si3.0O12
Bt FeMg2AlSi3.0O10 *** Bt FeMg2AlSi3.0O10 ***
Cam Ca2Mg5Si7.9O22 *** Cam - ***
*** Mineral phases have been identified using SEM analysis, although the exact compositions of these phases are unknown. Small crystal sizes has meant analysis of these phases are contaminated by surrounding minerals and/or quenched melt.
Stellenbosch University https://scholar.sun.ac.za
Stellenbosch University https://scholar.sun.ac.za

CHAPTER 6: DISCUSSION AND INTERPRETATION
111
6.5 Implications for Natural Systems
The findings of this research have important implications for the ‘fates’ of entrained high
pressure and temperature mineral phases within granitic magmas in general. The following
discussion relates the experimental results to; the ‘fate’ of entrained crystals in granitic
magmas, the compositional and textural features of granitic rocks, the ascent and
emplacement mechanisms of felsic magmas, and the implications for volcanic magmas.
Fate of Entrained Minerals
The fate of entrained ‘peritectic’ minerals, as observed within this research, has far-reaching
consequences that extend beyond both the peritectic assemblage entrainment model and
plutonic rocks. Formational models such as fractional crystallization, magma mixing, peritectic
entrainment and restite entrainment are all based on the principle of a crystal-rich magma
ascending through the crust. The findings of this research suggest that irrespective of the
process responsible for the formation of granite magmas, the entrained crystal load is able to
equilibrate rapidly and effectively during magma ascent and final emplacement at upper
crustal levels. The lack of observable compositional and textural evidence of peritectic material
is a common feature of granitic rocks, and is hypothesized to result from the fact that the
crystals, although abundant within granitic magmas, are small when they are entrained
(Clemens and Stevens, 2012). These peritectic crystals are thought to re-equilibrate to the
pressure, temperature and compositional conditions of the surrounding magma during the
magma’s ascent (Clemens and Stevens, 2012). This research has shown this to be true at the
low pressure and temperature ranges appropriate to granitic magma emplacement within the
higher crust.
The most prominent evidence of mineral re-equilibration in the experimental results is the
textural and compositional disappearance of the originally entrained ‘peritectic’ phases.
‘Peritectic’ phases re-equilibrate either partially or fully, in the experiments according to two
key reaction processes, a coupled dissolution-precipitation mechanism, and mineral-melt
reactions. Which of the two processes is responsible for changing both the compositional and
textural features of the ‘peritectic’ phases is largely dependent on the stability and equilibrium
characteristics of the mineral phases in the surrounding magma. Minerals that are stable, but
out of compositional equilibrium with the surrounding magma will react according to a coupled
dissolution-precipitation mechanism. Unstable phases react with the melt by mineral-melt
reactions to produce reaction rims of more stable, hydrous phases, such as biotite and
clinoamphibole. These mineral-melt reactions are ‘sluggish’ in comparison to the dissolution-
precipitation mechanism, and their slower rates allow for the persistence of high-pressure and
-temperature phases, such as garnet and orthopyroxene, to near-solidus conditions (~ 730°C
Stellenbosch University https://scholar.sun.ac.za

CHAPTER 6: DISCUSSION AND INTERPRETATION
112
at 1.40kbar; ~720°C at 1.90kbar). Although these phases may be present in crystalline granitic
rocks, they bear no compositional or textural resemblance to the originally entrained ‘peritectic’
phases, due to their continual re-equilibration to the surrounding magmatic conditions. This
supports petrographic findings in both I- and S-type granitic rocks that show them to be
typically devoid of entrained residuum, early magmatic phases, and peritectic phases
(Clemens et al., 2011). However, where these phases are evident within natural granitic rocks,
they appear to be armoured by reaction rims of minerals, such as biotite and quartz (e.g.,
Villaros et al., 2009a).
Discrepancies between this experimental study and phase equilibrium modelling can be
attributed to two main factors. The first is that the starting bulk composition was never exposed
to the higher-pressure conditions of magma ascent. Points along a hypothetical magma ascent
path were not recreated experimentally, as this was beyond the scope of the study. The cold-
seal pressure vessel was also unable to attain geologically relevant pressure and temperature
conditions to recreate various points along an isothermal decompression adiabat. Instead, the
experimental results were generated assuming instantaneous ascent mechanisms, and are
each appropriate only to pressure and temperature conditions of granitic magma
emplacement within the upper crust. It is proposed that had the ‘peritectic’ mineral phases
been exposed to the higher-pressure conditions associated with granite magma ascent they
would have been completely replaced by hydrous phases by mineral-melt reactions.
The second discrepancy between the two techniques relates to the fact the natural minerals
used to develop the synthetic ‘peritectic’ mineral assemblage, were compositionally different
to those predicted by the modelling software at conditions of the source (~10kbar and 850°C),
as well as at conditions of initial emplacement (~2kbar and 800°C). However, the fact that the
experimental results appear to correlate well with natural findings in granitic rocks, particularly
in terms of re-equilibration and new mineral growth, suggests that entrained phases or early-
formed magmatic phases are also out of compositional equilibrium with their surrounding
magma at some point within the magmatic history. Consequently, these minerals are
constantly re-equilibrated, either through dissolution-precipitation mechanisms or through
mineral-melt reactions, to the conditions of the surrounding magma throughout its ascent and
emplacement.
Magma Ascent and Emplacement
Unlike models involving diapiric methods of vertical magma transport, ascent through dykes
and shear zones has been shown to be both a viable and fast process (~0.01 m/s for a dyke
of 3-13 m width) (Clemens, 2012). The emplacement of granitic magmas involves a shift flow
from a vertical to a horizontal plane (Petford et al., 2000). According to recent literature it is
Stellenbosch University https://scholar.sun.ac.za

CHAPTER 6: DISCUSSION AND INTERPRETATION
113
not feasible to suggest that magma ascends and is emplaced in a solitary event, due to the
fact that there is insufficient space available in the upper crust to accommodate the massive
influx of magma (Petford et al., 2000). Instead it is proposed that plutons are built up in
successive magma pulses that can ascend from the source to emplacement levels in a matter
of weeks or months (Clemens, 2012). These pulses of magma are suggested to account for
the small- to large- scale chemical heterogeneities observed within many granites. In the field
I-type granites typically display petrographic evidence of being emplaced in pulses of magma,
as discussed above. They appear as fine-grained dykes, and within these dyke structures
crystal masses form according to gravity and flow driven processes (Clemens et al., 2011).
It is proposed that if continuous decompression experiments (at rates corresponding to
Clemens (2012)) were conducted on the starting bulk composition of this research they would
produce well equilibrated run products. The assumption is based on the observed rapid
equilibration of minerals, such as plagioclase, in under 10 days at low pressure and
temperature ranges, e.g. 1.40kbar; 730°C. The findings of this research would therefore
suggest a fast ascension rate (weeks to months timescale), is unlikely to inhibit the partial or
full equilibration of entrained residuum or early magmatic phases within a granitic magma. The
findings of this research appear to support fast ascent rates being feasible to aid in the
production of both the textural and geochemical characteristics of granitic rocks, in particular
their distinct lack of compositional and textural evidence of high-temperature and -pressure
source, and near-source, mineral components.
Mineral Textures
Beyond the mode of ascent the idea that a granite body’s geochemical and textural features,
such as large crystal sizes, are a product of long residency times and slow cooling rates has
been shown by the experimental research to be unnecessary. In a period of 10 days
feldspathic, and some ferromagnesian components, of the experimental magma were able to
fully dissolve and precipitate as/more equilibrated phases. Newly precipitated minerals, such
as biotite, plagioclase and magmatic quartz, displayed rapid growth rates across variable, low
temperatures (~720 - 770°C) and pressures (~2kbar). Similar experiments by Swanson (1977)
on the nucleation and growth rates of minerals in the simple KAlSi3O8 -NaAlSi3O8- CaAlSi3O8
system showed the average crystal growth rates in a synthetic granite/granodiorite
composition exposed to 400- 900°C at 8kbar to be in the range of 3 mm per day to 1 mm per
year depending on H2O contents and the degree of undercooling. Emplaced magmas do not
require long residency times or slow cooling rates within the magma chamber to produce the
distinct compositional, or typical textural features of granitic rocks.
Stellenbosch University https://scholar.sun.ac.za

CHAPTER 6: DISCUSSION AND INTERPRETATION
114
Implications for Volcanic Magmas
Finally, the concepts mentioned above have implications for the development of volcanic
rocks, such as dacites and rhyolites, as well. The geochemistry of these volcanic magmas,
the mode and pressure-temperature conditions of their formation, as well as the mechanisms
of their ascent are considered to be similar to those of granitic rocks (Clemens, 2012 and
references therein). Thus it is likely that volcanic magmas exist as a combination of crystals
and melt throughout their magmatic history in much the same way as granitic magmas. The
similarities between the formation and ascent of granitic and volcanic magmas, suggests that
the entrained crystals within volcanic magmas can attain equilibrium at a similarly fast rate to
mineral phases within ascending granitic magmas. The proposed rapid equilibration of the
entrained minerals and early magmatic phases during the volcanic magma’s ascent through
the crust, along with the rapid cooling rate of the magma upon its eruption at the surface,
supports the lack of compositional and textural evidence of this entrained residuum within
these rocks (Clemens et al., 2011). However, volcanic and plutonic rocks differ significantly in
their texture. The aphanitic textures of volcanic rocks, along with the evidence of mineral
disequilibrium features, such as sieve textures and resorption features within plagioclases
(e.g., Hosseini et al., 2014), are a consequence of rapid decompression associated with
eruption (Nelson and Montana, 1992). Consequently, the ‘fate’ of minerals in volcanic
magmas can largely be ascribed to the conditions and rates of eruption.
Stellenbosch University https://scholar.sun.ac.za

CHAPTER 7: CONCLUSION AND RECOMMENDATIONS
115
Chapter 7: Conclusions and Recommendations
7.1 Conclusions
The generation of average to mafic granite compositions can been ascribed to the entrainment
of mafic minerals in a leucogranitic melt (Clemens et al., 2011). Phase equilibrium modelling,
combined with the experimental findings of this research have validated this premise,
particularly in terms of the formation of an average I-type granodioritic composition.
Experimental results have indicated that even at the low pressure (~2kbar) and temperature
conditions (>700ºC) appropriate to magma emplacement within the upper crust, a granitic
magma will have the capacity to either partially or fully equilibrate any crystal component that
is out of compositional equilibrium with the surrounding magma. This will hold true for any
petrogenetic process that is responsible for the formation of crystal-rich granitic magmas, such
as; peritectic phase entrainment, magma mixing at depth, fractional crystallization at depth,
assimilation and restite entrainment.
The ‘fate’ of minerals in an I-type granite magma intruded at a pressure below 2kbar has been
shown to be primarily controlled by two main reactions processes; coupled dissolution-
precipitation mechanism, and mineral-melt reactions. The type of reaction processes
experienced by each mineral phase is largely controlled by three factors. The first relates to
the stability of the mineral phase in the magma. The second relates to whether the mineral is
in compositional equilibrium with the surrounding magma. Finally, the type of reaction is also
strongly dependent on the pressure and temperature conditions of the surrounding magma.
Both reaction mechanisms drive the entrained ‘peritectic’ mineral phases in the direction of
compositional and textural equilibrium at low magmatic temperatures.
The findings of this research suggest that it would be incorrect to assume that mineral phases
in granitic rocks directly reflect the compositions or textures of the same mineral phases
entrained at or near source levels. Granites, in this regard, do not appear to image their
sources. Instead, the compositional and textural ‘fates’ of entrained and early magmatic
mineral phases are a result of complex interrelationships between pressure, temperature,
mineral stability and the degree of compositional equilibrium of the mineral phases in a granitic
magma.
7.2 Summary of Contributions
Experimentally verified the types of reaction processes responsible for the partial/full
equilibration of entrained mineral phases within I-type granite magmas.
Stellenbosch University https://scholar.sun.ac.za

CHAPTER 7: CONCLUSION AND RECOMMENDATIONS
116
Established a relative time frame for dissolution-precipitation mechanisms in I-type
granite magmas, particularly in the case of plagioclase.
Demonstrated that originally entrained high pressure and temperature minerals are
texturally and compositionally distinct from mineral phases observed at low pressures
(~2kbar) and temperatures (~700-770°C).
Determined the key similarities and differences, in terms of an average I-type granitic
magma composition, between the equilibrium (phase equilibrium modelling) and
disequilibrium scenarios (experimental and real-world examples).
7.3 Future Research
Further research into the ‘fates’ of entrained minerals in granitic magmas is essential. A
number of key aspects relating to granitic magmas have not been included here due to time
constraints and the pressure-temperature limitations of the experimental apparatus. One point
of departure would be to look at varying the time scale of the experiments to determine the
exact point at which fast-equilibrating minerals, such as plagioclase, begin to succumb to
dissolution-precipitation mechanisms. Another relevant approach would be to run experiments
at constant pressure, but to decrease the temperature conditions incrementally throughout the
experimental run time. This would provide a more ‘realistic’ approach to determine the
compositional and textural changes to ‘peritectic’ mineral phases in a progressively cooling
magma. Finally, further experimental research into the ‘fates’ of peritectic minerals in an I-type
magma during its ascent would be valuable, as the findings would either corroborate or
challenge the findings of this research.
Stellenbosch University https://scholar.sun.ac.za

REFERENCES
117
References
Agostini, C., Fortunati, A., Arzilli, F., Landi, P. and Carroll,
M. (2013). Kinetics of crystal evolution as a probe
to magmatism at Stromboli (Aeolian Archipelago,
Italy). Geochimica et Cosmochimica Acta, 110,
pp.135-151.
Almeida, M., Macambira, M. and Oliveira, E. (2007).
Geochemistry and zircon geochronology of the I-
type high-K calc-alkaline and S-type granitoid rocks
from southeastern Roraima, Brazil: Orosirian
collisional magmatism evidence (1.97–1.96Ga) in
central portion of Guyana Shield. Precambrian
Research, 155(1-2), pp.69-97.
Anderson, G.M. (2002) Stable and metastable
equilibrium: The third constraint. The Geochemical
Society, Special Publications. (7), pp. 181-187.
Annen, C., Blundy, J and Sparks, R., (2006). The genesis
of intermediate and silicic magmas in deep crustal
hot zones. Journal of Petrology. 47 (3), pp. 505-539.
Antunes, I., Neiva, A., Silva, M. and Corfu, F. (2008).
Geochemistry of S-type granitic rocks from the
reversely zoned Castelo Branco pluton (central
Portugal). Lithos, 103(3-4), pp.445-465.
Arzilli, F. and Carroll, M. (2013). Crystallization kinetics
of alkali feldspars in cooling and decompression-
induced crystallization experiments in trachytic
melt. Contributions to Mineralogy and Petrology,
166(4), pp.1011-1027.
Athari, S., Sepahi, A. and Moazzen, M. (2007). Petrology
of leucocratic granitoids in the northwest of Iran
with emphasis on leucocratic I-type granites from
SW Saqqez. Neues Jahrbuch für Mineralogie -
Abhandlungen, 184(2), pp.169-179.
Barbarin, B. (1999). A review of the relationships between
granitoid types, their origins and their geodynamic
environments. Lithos. 46 (3). pp. 605--626.
Beard, J., Ragland, P. and Crawford, M. (2005). Reactive
bulk assimilation: A model for crust-mantle mixing
in silicic magmas. Geol, 33(8), p.681.
Best, M. (1982). Igneous and metamorphic petrology. San
Francisco: Freeman.
Broska, I. (2003). REE accessory minerals in the felsic
silicic rocks of the west-carpathians:their
distribution, composition and stability. Acta
Mineralogica-Petrographica. [Abstract]
Brown, M. (2004). The mechanism of melt extraction
from lower continental crust of orogens.
Transactions of the Royal Society of Edinburgh:
Earth Sciences, 95(1-2).
Brown, M. (2013). Granite: From genesis to emplacement.
Geological Society of America Bulletin.
Carlson, W. (2006). Rates of Fe, Mg, Mn, and Ca diffusion
in garnet. American Mineralogist, 91(1), pp.1-11.
Carmichael, I., Turner, F. and Verhoogen, J. (1974).
Igneous petrology. New York: McGraw-Hill.
Castro, A. (2014). The off-crust origin of granite
batholiths. Geoscience Frontiers, 5(1), pp.63-75.
Castro, A. Patino Douce, A.E. Corretge, L.G. de la Rosa,
J.D. El-Biad, M. El-Hmidi, H. (1999). Origin of
peraluminous granites and granodiorites, Iberian
massif, Spain: an experimental test of granite
petrogenesis. Contributions to Mineralogy and
Petrology.135, pp. 255-276.
Chappell, B. (1996). Magma Mixing and the Production
of Compositional Variation within Granite Suites:
Evidence from the Granites of Southeastern
Australia. Journal of Petrology, 37(3), pp.449-470.
Chappell, B. (1999). Aluminium saturation in I-and S-type
granites and the characterization of fractionated
haplogranites. Lithos, 46 (3), pp. 535--551.
Chappell, B., Bryant, C., Wyborn, D., White, A. and
Williams, I. (1998). High-and Low-Temperature I-
type Granites. Resource Geology, 48 (4), pp. 225--
Stellenbosch University https://scholar.sun.ac.za

REFERENCES
118
235.
Chappell, B. and White, A. (2001). Two contrasting
granite types: 25 years later. Australian Journal of
Earth Sciences, 48(4), pp.489-499.
Chappell, B. and White, A. (1974). Two contrasting
granite types. Pacific Geology, 8, pp.173 -174.
Chappell, B., White, A. and Wyborn, D. (1987). The
Importance of Residual Source Material (Restite)
in Granite Petrogenesis. Journal of Petrology,
28(6), pp.1111-1138. [Abstract]
Clarke, D. (1981). The Mineralogy of Peraluminous
Granites: A Review. Canadian Mineralogist, (19),
pp. 3-17.
Clemens, J. (2012). Granitic magmatism, from source to
emplacement: a personal view. Applied Earth
Science, 121(3), pp.107-136.
Clemens, J. (2003). S-type granitic magmas—
petrogenetic issues, models and evidence. Earth-
Science Reviews, 61(1-2), pp.1-18.
Clemens, J., Darbyshire, D. and Flinders, J. (2009a).
Sources of post-orogenic calcalkaline magmas:
The Arrochar and Garabal Hill–Glen Fyne
complexes, Scotland. Lithos, 112(3-4), pp.524-
542.
Clemens, J., Helps, P. and Stevens, G. (2009b). Chemical
structure in granitic magmas – a signal from the
source?. Earth and Environmental Science
Transactions of the Royal Society of Edinburgh,
100(1-2), pp.159-172.
Clemens, J. and Mawer, C. (1992). Granitic magma
transport by fracture propagation. Tectonophysics,
204(3-4), pp.339-360.
Clemens, J. and Stevens, G. (2012). What controls
chemical variation in granitic magmas?. Lithos,
134 pp. 317--329.
Clemens, J., Stevens, G. and Farina, F. (2011). The
enigmatic sources of I-type granites: the peritectic
connexion. Lithos, 126 (3), pp. 174--181.
Clemens, J. and Vielzeuf, D. (1987). Constraints on
melting and magma production in the crust. Earth
and Planetary Science Letters, 86(2-4), pp.287-
306.
Clemens, J. and Wall, V. (1981). Origin and
crystallization of some peraluminous (S-type)
granitic magmas. The Canadian Mineralogist, 19
(1), pp. 111—131.
Clemens, J. and Wall, V. (1988). Controls on the
mineralogy of S-type volcanic and plutonic rocks.
Lithos, 21(1), pp.53-66.
de Capitani, C. and Petrakakis, K. (2010). The
computation of equilibrium assemblage diagrams
with Theriak/Domino software. American
Mineralogist, 95(7), pp.1006-1016.
Diener, J. and Powell, R. (2011). Revised activity-
composition models for clinopyroxene and
amphibole. Journal of Metamorphic Geology,
30(2), pp.131-142.
Donaldson, C. (1985). The Rates of Dissolution of
Olivine, Plagioclase, and Quartz in a Basalt Melt.
Mineralogical Magazine, 49(354), pp.683-693.
Droop, G. (1987). A General Equation for Estimating
Fe3+ Concentrations in Ferromagnesian Silicates
and Oxides from Microprobe Analyses, Using
Stoichiometric Criteria. Mineralogical Magazine,
51(361), pp.431-435.
Finger, F. and Steyrer, H. (1990). I-type granitoids as
indicators of a late Paleozoic convergent ocean-
continent margin along the southern flank of the
central European Variscan orogen. Geology. 18
(12). pp. 1207--1210.
Franke, W. (1989). Variscan plate tectonics in Central
Europe—current ideas and open questions.
Tectonophysics, 169(4), pp.221-228.
Gardien, V., Thompson, A., Grujic, D. and Ulmer, P.
(1995). Experimental melting of biotite +
plagioclase + quartz ± muscovite assemblages and
implications for crustal melting. Journal of
Stellenbosch University https://scholar.sun.ac.za

REFERENCES
119
Geophysical Research., 100(B8), pp.15581 –
15591.
Giddings, J. (1991). Unified separation science. New
York: Wiley.
Gill, R. (2015). Chemical Fundamentals of Geology and
Environmental Geosciences. 3rd ed. Sussex: Wiley
Blackwell, pp.43-44.
Glazner, A. (2007). Thermal limitations on incorporation
of wall rock into magma. Geol, 35(4), p.319.
[Abstract].
Glazner, A., Bartley, J., Coleman, D., Gray, W. and
Taylor, R. (2004). Are plutons assembled over
millions of years by amalgamation from small
magma chambers?. GSA Today, 14(4), pp.4 --11.
Hammer, J. (2008). Experimental Studies of the Kinetics
and Energetics of Magma Crystallization. Reviews
in Mineralogy and Geochemistry, 69(1), pp.9-59.
Harris, C., Faure, K., Diamond, R. E. and Scheepers, R.
(1997). Oxygen and hydrogen isotope
geochemistry of S-and I-type granitoids: the Cape
Granite suite, South Africa. Chemical geology, 143
(1), pp. 95--114.
Hine, R., Williams, I., Chappell, B. and White, A. (1978).
Contrasts between I-and S-type of the Kosciusko
Batholith. Journal of the Geological Society of
Australia. 25 (3-4), pp. 219--234.
Holland, T. and Powell, R. (2003). Activity composition
relations for phases in petrological calculations: an
asymmetric multicomponent formulation.
Contributions to Mineralogy and Petrology,
145(4), pp.492-501.
Hosseini, E., Ardalan, A., Emami, M. and Razavi, M.
(2014). Mineral Chemistry and Thermobarometry
of the Volcanic Rocks in Torud, Iran. OJG, 04(09),
pp.425-435.
Karsli, O., Dokuz, A., Uysal, İ., Aydin, F., Chen, B.,
Kandemir, R. and Wijbrans, J. (2010). Relative
contributions of crust and mantle to generation of
Campanian high-K calc-alkaline I-type granitoids
in a subduction setting, with special reference to the
Harşit Pluton, Eastern Turkey. Contributions to
Mineralogy and Petrology, 160(4), pp.467-487.
Kay, S., Godoy, E. and Jurtz, A. (2005). Episodic arc
migration, crustal thickening, subduction erosion,
and magmatism in the south-central Andes. GSA
Bulletin. 117(1/2), pp. 67-88.
Kemp, A., Hawkesworth, C., Foster, G., Paterson, B.,
Woodhead, J., Hergt, J., Gray, C. and Whitehouse,
M. (2007). Magmatic and crustal differentiation
history of granitic rocks from Hf-O isotopes in
zircon. Science, 315 (5814), pp. 980--983.
Koga, K. (2000). Kinetic Processes of Mantle Minerals.
Ph.D. Massachusetts Institute of Technology.
Lo Cascio, M., Liang, Y., Shimizu, N. and Hess, P. (2008).
An experimental study of the grain-scale processes
of peridotite melting: implications for major and
trace element distribution during equilibrium and
disequilibrium melting. Contributions to
Mineralogy and Petrology, 156(1), pp.87-102.
Maas, R., Nicholls, I. and Legg, C. (1997). Igneous and
Metamorphic Enclaves in the S-type Deddick
Granodiorite, Lachlan Fold Belt, SE Australia:
Petrographic, Geochemical and Nd-Sr Isotopic
Evidence for Crustal Melting and Magma Mixing.
Journal of Petrology, 38(7), pp.815-841.
McLeod, C., Davidson, J., Nowell, G. and de Silva, S.
(2012). Disequilibrium melting during crustal
anatexis and implications for modeling open
magmatic systems. Geology, 40(5), pp.435-438.
McCulloch, M. T. and Chappell, B. W. (1982). Nd
isotopic characteristics of S-and I-type granites.
Earth and Planetary Science Letters, 58 (1), pp. 51-
-64.
McDonough, W. and Sun, S. (1995). The composition of
the Earth. Chemical Geology, 120(3-4), pp.223-
253.
Metcalf, R., Smith, E., Walker, J., Reed, R. and Gonzales,
Stellenbosch University https://scholar.sun.ac.za

REFERENCES
120
D. (1995). Isotopic Disequilibrium among
Commingled Hybrid Magmas: Evidence for a
Two-Stage Magma Mixing-Commingling Process
in the Mt. Perkins Pluton, Arizona. The Journal of
Geology, 103(5), pp.509-527.
Montel, J. and Vielzeuf, D. (1997). Partial melting of
metagreywackes, Part II. Compositions of minerals
and melts. Contributions to Mineralogy and
Petrology, 128(2-3), pp.176-196.
Moyen, J. and Stevens, G. (2006). Experimental
constraints on TTG petrogenesis: implications for
Archean geodynamics. Archean geodynamics and
environments. pp.149-175.
Nedelec, A., Bouchez, J. and Bowden, P. (2015).
Granites. Oxford University Press. New York.
Neilsen, C. and Sigurdsson, H. (1981). Quantitative
methods for electron microprobe analysis of
sodium in natural and synthetic glasses. American
Mineralogist. 77, pp. 1242 – 1249.
Nelson, S. and Montana, A. (1992). Sieve-textured
plagioclase in volcanic rocks produced by rapid
decompression. American Mineralogist. 77, pp.
1242 – 1249.
O’Neil, J. and Chappell, B. (1977). Oxygen and hydrogen
isotope relations in the Berridale batholith. Journal
of the Geological Society. 133 (6). pp. 559--571.
Paterson, S., and Ducea, M. (2015). Arc magmatic
tempos: gathering the evidence. Elements, 11(2),
pp.91-98.
Patiño-Douce, A. and Beard, J. (1996). Effects of P, f (O2)
and Mg/Fe Ratio on Dehydration Melting of Model
Metagreywackes. J Petrology, 37(5), pp.999-1024.
Pearce, J. (1996). Sources and settings of grantic rocks.
Episodes. 19 (4). pp. 120 -125.
Pearce, J., Harris, N. and Tindle, A. (1984). Trace Element
Discrimination Diagrams for the Tectonic
Interpretation of Granitic Rocks. Journal of
Petrology, 25(4), pp.956-983.
Petford, N., Cruden, A.R, McCaffrey, K.J.W and
Vigneresse, J.L. (2000) Granite magma formation,
transport and emplacement in the Earth’s crust.
Nature, 408 (6813), pp. 669-673.
Piwinskii, A. (1968). Experimental Studies of Igneous
Rock Series Central Sierra Nevada Batholith,
California. The Journal of Geology, 76(5), pp.548-
570.
Putnis, A. (2014). Why Mineral Interfaces Matter.
Science, 343(6178), pp.1441-1442.
Putnis, A. (2009). Mineral Replacement Reactions.
Reviews in Mineralogy and Geochemistry, 70(1),
pp.87-124.
Putnis, A. (2002). Mineral replacement reactions: from
macroscopic observations to microscopic
mechanisms. Mineralogical Magazine, 66(5),
pp.689-708.
Ratajeski, K. and Sisson, T.W. (1999) Loss of iron to gold
capsules in rock melting experiments. American
Mineralogist. 84, pp. 1521--1527.
Reid, Jr., J., Murray, D., Hermes, O. and Steig, E. (1993).
Fractional crystallization in granites of the Sierra
Nevada: How important is it?. Geol, 21(7), pp. 587
-- 590.
Roberts, M. P. and Clemens, J. D. (1993). Origin of high-
potassium, talc-alkaline, I-type granitoids.
Geology, 21 (9), pp. 825--828.
Rudnick, R. (1992). Restites, Eu anomalies and the lower
continental crust. Geochimica et Cosmochimica
Acta, 56(3), pp.963-970.
Ruiz-Agudo, E., Putnis, C. and Putnis, A. (2014). Coupled
dissolution and precipitation at mineral–fluid
interfaces. Chemical Geology, 383, pp.132-146.
Rutherford, M. (2008). Magma Ascent Rates. Reviews in
Mineralogy and Geochemistry, 69(1), pp.241-271.
Samson, I., Anderson, A. and Marshall, D. (2003). Fluid
inclusions. Ottawa, Ont., Canada: Mineralogical
Association of Canada.
Stellenbosch University https://scholar.sun.ac.za

REFERENCES
121
Scheepers, R. (1995). Geology, geochemistry and
petrogenesis of Late Precambrian S-, I- and A-type
granitoids in the Saldania belt, Western Cape
Province, South Africa. Journal of African Earth
Sciences. 21 (1). pp. 35—58.
Scheepers, R. and Poujal, M. (2002). U-Pb zircon age of
Cape Granite Suite ignimbrites: chracteristics of
the last phases of the Saldanian magmatism. South
African Journal of Geology. 105 (2). pp. 163—178.
Sen, C. and Dunn, T. (1994). Dehydration melting of a
basaltic composition amphibolite at 1.5 and 2.0
GPa: implications for the origin of adakites. Contr.
Mineral. and Petrol., 117(4), pp.394-409.
Soesoo, A. (2000). Fractional crystallization of mantle-
derived melts as a mechanism for some I-type
granite petrogenesis: an example from Lachlan
Fold Belt, Australia. Journal of the Geological
Society, 157(1), pp.135-149.
Stephens, W. (2001). Polycrystalline amphibole
aggregates (clots) in granites as potential I‐type
restite: An ion microprobe study of rare‐earth
distributions. Australian Journal of Earth Sciences,
48(4), pp.591-601.
Stevens, G. and Clemens, J. (in press). The ‘DNA’ of
granite magmas. Unpublished. pp. 1--13
Stevens, G., Villaros, A. and Moyen, J. (2007). Selective
peritectic garnet entrainment as the origin of
geochemical diversity in S-type granites. Geology,
35 (1), pp. 9--12.
Swanson, S. (1977). Relation of nucleation and crystal
growth rate to the development of granitic textures.
American Mineralogist. 62, pp. 966 -978.
Taylor, J. and Stevens, G. (2010). Selective entrainment
of peritectic garnet into S-type granitic magmas:
evidence from Archaean mid-crustal
anatectites. Lithos, 120(3), pp.277--292.
Thompson, A. and Connolly, J. (1995). Melting of the
continental crust: Some thermal and petrological
constraints on anatexis in continental collision
zones and other tectonic settings. J. Geophys. Res.,
100(B8), p.15565.
Tropper, P. and Hauzenberger, C. (2015). How well do
pseudosection calculations reproduce simple
experiments using natural rocks: an example from
high-P high-T granulites of the Bohemian Massif.
Austrian Journal of Earth Sciences, 108(1),
pp.123-138.
Tropper, P., Konzett, J. and Finger, F. (2005).
Experimental constraints on the formation of high-
P/high-T granulites in the Southern Bohemian
Massif. European Journal of Mineralogy, 17(2),
pp.343-356.
Vernon, R. (2004). A practical guide to rock
microstructure. Cambridge, UK: Cambridge
University Press.
Vernon, R. H. (2007). Problems in identifying restite in S-
type granites of southeastern Australia, with
speculations on sources of magma and enclaves.
The Canadian Mineralogist, 45 (1), pp. 147--178.
Villaseca, C., Bellido, F., Pérez-Soba, C. and Billström,
K. (2009). Multiple crustal sources for post-
tectonic I-type granites in the Hercynian Iberian
Belt. Mineralogy and Petrology, 96(3-4), pp.197-
211.
Villaros, A., Stevens, G. and Buick, I. S. (2009a).
Tracking S-type granite from source to
emplacement: clues from garnet in the Cape
Granite Suite. Lithos, 112 (3), pp. 217--235.
Villaros, A., Stevens, G., Moyen, F., Buick, I. S. (2009b).
The trace element compositions of S-type granites:
evidence for disequilibrium melting and accessory
phase entrainment in the source. Contributions to
Mineral Petrology, 158 (4), pp. 543--561.
White, A. and Chappell, B. (1977). Ultrametamorphism
and granitoid genesis. Tectonophysics, 43(1-2), pp.
7-22.
White, A., Chappell, B. and Wyborn, D. (1999).
Application of the Restite Model to the Deddick
Stellenbosch University https://scholar.sun.ac.za

REFERENCES
122
Granodiorite and its Enclaves --a Reinterpretation
of the Observations and Data of Maas et al. (1997).
Journal of Petrology, 40(3), pp.413-421.
White, R., Pomroy, N. and Powell, R. (2005). An in situ
metatexite-diatexite transition in upper amphibolite
facies rocks from Broken Hill, Australia. Journal
of Metamorphic Geology, 23(7), pp.579-602.
White, R., Powell, R. and Clarke, G. (2002). The
interpretation of reaction textures in Fe-rich
metapelitic granulites of the Musgrave Block,
central Australia: constraints from mineral
equilibria calculations in the system K2O-FeO-
MgO-Al2O3-SiO2-H2O-TiO2-Fe2O3. Journal of
Metamorphic Geology, 20(1), pp.41-55.
White, R., Powell, R. and Holland, T. (2007). Progress
relating to calculation of partial melting equilibria
for metapelites. Journal of Metamorphic Geology,
25(5), pp.511-527.
White, R., Powell, R., Holland, T., and Worley, B. (2000).
The effect of TiO2 and Fe2O3 on metapelitic
assemblages at greenschist and amphibolite facies
conditions: mineral equilibria calculations in the
system K2O-FeO-MgO-Al2O3-SiO2-H2O-TiO2-
Fe2O3. Journal of Metamorphic Geology, 18(5),
pp.497-511.
White, R., Stevens, G. and Johnson, T. (2011). Is the
Crucible Reproducible? Reconciling Melting
Experiments with Thermodynamic Calculations.
Elements, 7(4), pp.241-246.
Whitney, J. (1988). The origin of granite: The role and
source of water in the evolution of granitic
magmas. Geological Society of America Bulletin,
100(12), pp.1886-1897.
Whitney, D. and Evans, B. (2010). Abbreviations for
names of rock-forming minerals. American
Mineralogist, 95(1), pp. 185-187.
Yakymchuk, C., Horhonen, F., and Brown, M. (2011).
Decompression melting in tectonics: Where’s the
melt? Mineralogical Magazine, 75(3), pp. 2200.
Zhu, C. and Anderson, G. (2002). Environmental
applications of geochemical modeling. Cambridge:
Cambridge University Press.
Zorpi, M., Coulon, C., Orsini, J. and Cocirta, C. (1989).
Magma mingling, zoning and emplacement in calc-
alkaline granitoid plutons. Tectonophysics, 157(4),
pp.315-329.
Stellenbosch University https://scholar.sun.ac.za

APPENDIX
123
Appendix
Zeiss® EVO MA 15 Scanning Electron Microscope Mineral Standards
Garnet STANDARD MINERAL FORMULA
SiO2 Pyrope Garnet Mg3Al2Si3O12 TiO2 Biotite K(Mg,Fe)3AlSi3O10(OH)2 Al2O3 Pyrope Garnet Mg3Al2Si3O12 FeO Ilmenite FeTiO3
MnO Ilmenite FeTiO3
MgO Pyrope Garnet Mg3Al2Si3O12
CaO Diopside CaMgSi2O6
Na2O Anorthite 65 CaAl2Si2O8
K2O Biotite K(Mg,Fe)3AlSi3O10(OH)2
Plagioclase STANDARD MINERAL FORMULA
SiO2 Albite/Sanidine NaAlSi3O8/ KAlSi3O8 TiO2 Biotite/Ilmenite K(Mg,Fe)3AlSi3O10(OH)2/ FeTiO3 Al2O3 Anorthite 65 CaAl2Si2O8 FeO Ilmenite FeTiO3
MgO Pyrope Garnet Mg3Al2Si3O12
CaO Anorthite 65/Diopside CaAl2Si2O8/ CaMgSi2O6 Na2O Albite NaAlSi3O8
K2O Sanidine KAlSi3O8
Pyroxene STANDARD MINERAL FORMULA
SiO2 Sanidine KAlSi3O8 TiO2 Kaersutite NaCa2(Mg3Ti4+Al)Si6Al2O22(OH)2 Al2O3 Spodumene LiAlSi2O6 FeO Almandine Garnet Fe3Al2Si3O12
MnO Almandine Garnet Fe3Al2Si3O12
MgO Diopside/Olivine CaMgSi2O6/
CaO Diopside CaMgSi2O6
Na2O Jadeite NaAlSi2O6
K2O Sanidine KAlSi3O8
Stellenbosch University https://scholar.sun.ac.za

APPENDIX
124
Biotite STANDARD MINERAL FORMULA
SiO2 Pyrope Garnet Mg3Al2Si3O12 TiO2 Biotite K(Mg,Fe)3AlSi3O10(OH)2 Al2O3 Pyrope Garnet Mg3Al2Si3O12 FeO Almandine Garnet Fe3Al2Si3O12
MgO Pyrope Garnet Mg3Al2Si3O12
CaO Anorthite 65 CaAl2Si2O8
Na2O Anorthite 65 CaAl2Si2O8 K2O Biotite K(Mg,Fe)3AlSi3O10(OH)2
Ilmenite STANDARD MINERAL FORMULA
SiO2 Pyrope Garnet Mg3Al2Si3O12 TiO2 Ilmenite FeTiO3 Al2O3 Pyrope Garnet Mg3Al2Si3O12 FeO Ilmenite FeTiO3 MnO Ilmenite FeTiO3
MgO Pyrope Garnet Mg3Al2Si3O12
Quartz STANDARD MINERAL FORMULA
SiO2 Quartz SiO2
Melt STANDARD MINERAL FORMULA
SiO2 Quartz SiO2 TiO2 Biotite K(Mg,Fe)3AlSi3O10(OH)2 Al2O3 Anorthite 65 CaAl2Si2O8 FeO Biotite K(Mg,Fe)3AlSi3O10(OH)2 MnO Biotite K(Mg,Fe)3AlSi3O10(OH)2 MgO Anorthite 65 CaAl2Si2O8 CaO Anorthite 65 CaAl2Si2O8 Na2O Albite NaAlSi3O8 K2O Sanidine KAlSi3O8
*Reference materials (qtz/plg) were analysed intermittently throughout the melt analysis to test beam stability and ensure accurate melt results
Stellenbosch University https://scholar.sun.ac.za


