An Experimental and Numerical Study of Injector … SAE Index/Reitz SAE Document… · Reprinted...
16
400 Commonwealth Drive, Warrendale, PA 15096-0001 U.S.A. Tel: (724) 776-4841 Fax: (724) 776-5760 Web: www.sae.org SAE TECHNICAL PAPER SERIES 2003-01-0705 An Experimental and Numerical Study of Injector Behavior for HSDI Diesel Engines Essam M. EL-Hannouny, Taewon W. Lee, Patrick V. Farrell and Rolf D. Reitz Engine Research Center, University of Wisconsin-Madison Reprinted From: New Diesel Engines & Fuel Injection (SP-1739) 2003 SAE World Congress Detroit, Michigan March 3-6, 2003
Transcript of An Experimental and Numerical Study of Injector … SAE Index/Reitz SAE Document… · Reprinted...

400 Commonwealth Drive, Warrendale, PA 15096-0001 U.S.A. Tel: (724) 776-4841 Fax: (724) 776-5760 Web: www.sae.org
SAE TECHNICALPAPER SERIES 2003-01-0705
An Experimental and Numerical Study ofInjector Behavior for HSDI Diesel Engines
Essam M. EL-Hannouny, Taewon W. Lee, Patrick V. Farrell and Rolf D. Reitz
Engine Research Center, University of Wisconsin-Madison
Reprinted From: New Diesel Engines & Fuel Injection(SP-1739)
2003 SAE World CongressDetroit, Michigan
March 3-6, 2003

All rights reserved. No part of this publication may be reproduced, stored in a retrieval system, ortransmitted, in any form or by any means, electronic, mechanical, photocopying, recording, or otherwise,without the prior written permission of SAE.
For permission and licensing requests contact:
SAE Permissions400 Commonwealth DriveWarrendale, PA 15096-0001-USAEmail: [email protected]: 724-772-4028Tel: 724-772-4891
For multiple print copies contact:
SAE Customer ServiceTel: 877-606-7323 (inside USA and Canada)Tel: 724-776-4970 (outside USA)Fax: 724-776-1615Email: [email protected]
ISSN 0148-7191Copyright © 2003 SAE International
Positions and opinions advanced in this paper are those of the author(s) and not necessarily those of SAE.The author is solely responsible for the content of the paper. A process is available by which discussionswill be printed with the paper if it is published in SAE Transactions.
Persons wishing to submit papers to be considered for presentation or publication by SAE should send themanuscript or a 300 word abstract of a proposed manuscript to: Secretary, Engineering Meetings Board, SAE.
Printed in USA

ABSTRACT
An experimental and numerical characterization has been conducted for high-pressure hydraulically actuated fuel injection systems. One single and one double-guided multi-hole Valve-Covered-Orifice (VCO) type injector was used with a Common Rail (CR) injection system, and two mini-sac injectors for Hydraulic electronic Unit Injection system (HEUI) were used with different orifice diameters. The purpose of the study was to explore the effects of the injection system and the operating conditions on the engine emissions for a direct injection small bore diesel engine. The diesel spray was injected into a pressurized chamber with optical access at ambient temperature. The gas density inside the chamber was representative of the density in a High Speed Direct Injection (HSDI) diesel engine at the time of injection. The experimental spray parameters included: injection pressure, injection duration, nozzle type, and nozzle diameter. Images of the transient sprays were obtained with a high-speed digital camera. From these images, spray tip penetration and cone angles were obtained directly. Moreover, spray droplet sizes averaged over the entire spray (SMD) were derived from the images using the Light Extinction Method (LEM). Engine tests were conducted on an instrumented single cylinder small bore diesel engine. Data were taken at 1757 RPM, and 45 % load. Engine emissions results include nitrogen oxide (NOx) emissions and particulate emissions. The KIVA code and engine emissions measurements were used to correlate the spray characteristics and the engine emissions, NOx and soot. The results emphasize the correlation between spray behavior and engine emissions. INTRODUCTION
Direct Injection (DI) diesel engines generally offer an improvement in efficiency over indirect injection (IDI) systems, so this type of injection seems to be favored among high-speed diesel engine manufacturers. Increasingly stringent emissions regulations (unburned hydrocarbons (HC), nitrogen oxides (NOx), carbon monoxide (CO) and particulate as well as fuel economy
demands means that diesel engines will have to incorporate new fueling technology to achieve these goals. In order to increase engine efficiency and reduce emissions, great attention has been focused on improving fuel atomization. Raising fuel injection pressure has been found to be effective in promoting fuel/air mixing. Experimental results show that fuel economy and exhaust emissions were improved significantly by using a high injection pressure [1]. The mixture formation between fuel spray and air is a governing process of combustion in the DI diesel engine, which affects the subsequent ignition characteristics, combustion rate, and exhaust emissions. The combustion process is greatly dependent on the fuel injection parameters. Therefore, precise control over the fuel injection and thus the spray formation is essential in controlling the combustion process. One soot reduction strategy is to use high injection pressures with small hole nozzles. It is thought that the reductions seen through the use of this strategy are due to increased mixing via enhanced spray penetration and more air entrainment. During the ignition delay period, some of the fuel is evaporated and mixes with the air. Because it is mixed before combustion starts, this premixed fuel/air mixture’s combustion rate is controlled by fast chemical rates rather than by slower diffusion/mixing rates. When the rapid combustion of this premixed zone occurs, the temperature of the fuel/air mixture rises rapidly, causing the formation of radical species that react to form NOx [2]. Therefore, the increased mixing that was desirable for particulate reduction will cause higher NOx if it is present during the ignition delay period. The purpose of the study was to explore the effects of hole size, injection pressure, and injection system on the engine emissions of a direct injection small bore diesel engine. EXPERIMENTAL SETUP AND DIAGNOSTICS FUEL INJECTION SYSTEMS: To study the characteristics of transient diesel sprays injected from a multi-hole nozzle with high pressure, two different experimental fuel injection systems were designed and constructed. The first one is the Common Rail (CR)
2003-01-0705
An Experimental and Numerical Study of Injector Behavior for HSDI Diesel Engines
Essam M. EL-Hannouny, Taewon W. Lee, Patrick V. Farrell and Rolf D. Reitz Engine Research Center, University of Wisconsin-Madison
Copyright © 2003 SAE International

system, which has the capability of producing single and multiple injections. The second is the Hydraulic electronic Unit Injection (HEUI) system, which produces a single injection. Both systems can control the injection pressure independent of engine load and speed, and each has flexible injection timing. The details of these two systems will be discussed below. CR System – This system contained three major sub-systems: a fuel pumping system, an injector and an electronic control system. Various examples showing recent increasing interest in common rail injection systems may be found in [3]. Common rail injection system, Exhaust Gas Recirculation (EGR), and a small nozzle hole diameter have yielded the greatest potential for reaching future emission limits and lowering fuel consumption and noise levels [4]. The CR injectors were VCO type HEUI System – This system contained four main components: the injector, high-pressure oil system, a fuel system and the injector control panel. The HEUI was developed essentially for a heavy-duty diesel engine [4]. The high-pressure oil system provides high-pressure oil to the manifold for the injection energy. This system looks like the common rail except the oil is being pressurized instead of the fuel. The HEUI uses a hydraulic pressure intensifier system in the injector with 7:1 pressure ratio to generate the fuel injection pressure. The HEUI injectors used in the experiments were minisac type with different nozzle diameters. Figure 1 and Table 1 illustrate the two types and the test matrix for the experiments respectively.
Figure 1. Nozzle configurations for tested injectors [2]. Table 1 Summary of nozzle geometry and test conditions
Injector type Minisac VCO Guide type Single Dual, Single Injection system HEUI CR Injection angle (o) 145 130 Number of holes 6 6 Hole diameter (mm)
0.158, 0.165
0.160, 0.174
Convention (name) HEUI158 HEUI165
CR160 CR174
Injection pressure (MPa)
33 to 160 33 to 130
Injection duration Varied Varied Ambient density (kg/m3)
18 18
Spray diagnostics: An optical setup is arranged to visualize the injecting spray for both injection systems. Figure 2 shows a schematic arrangement of the optical
system, which consists of a laser light source, lenses and mirrors, a see-through spray chamber, and a high-speed camera. The laser source was a pulsed copper-vapor laser with 510.6 nm (green) and 578.2 nm (yellow) wavelengths. The duration of each laser pulse is 10-40 ns and the average energy per pulse is 2 mJ. The available range of pulse frequencies is 8-14 kHz using the internal trigger mode. The lenses and mirrors are arranged to fit a space limitation and to achieve the requirements of an incident light extinction principle. The yellow light is dumped using a band-pass filter to get a monochromatic beam. A gray step-tablet made of 11 neutral density filters is used for calibration of the image pixel values. The pinhole after the spray chamber is positioned at the focal point of the focusing lens to block the scattered light from a spray and allow only un-scattered light to the camera. Also, the pinhole excludes stray light and noise coming from different parts of the optical system. The spray chamber provides an environment with high gas pressure and high gas density at room temperature. The injector is mounted on one end with a 65o inclined angle for the common rail, which allows one of the spray plumes from a 130o injection angle nozzle to be perpendicular to the light beam path. Different end plates were designed to fit different injectors with different injection angles. The high-speed digital camera used in this study was a Kodak (Model 4540) digital high-speed motion analyzer. A speed of 4500 frames/sec was used to get digital images containing 256x256 pixels and 8 bits of gray level.
Figure 2 Schematic diagram for the spray diagnostics IMAGE ANALYSIS – The macroscopic structure of the spray such as spray tip penetration, cone angle, and overall shape, can be determined directly from the TIFF images obtained with the digital camera. The microscopic structure, such as droplet mean diameter, of the spray must be calculated or estimated. The gray level of a pixel is proportional to the transmitted light intensity in the TIFF images; this information can then be used to estimate the overall spray Sauter Mean Diameter (SMD). The method used to estimate the overall spray SMD, a light extinction method (LEM), has been developed and used to investigate diesel sprays by several researchers [6,7]. Basic assumptions employed include: an axisymmetric spray pattern, a fixed, known spray droplet size distribution function, spherical
VC
Minisac

droplets, constant index of refraction, no multiple scattering when light passes through the spray field, and no light absorbed by the spray droplets. More detail of the implementation of the calculation routine is given by [6]. A computer program was developed to aid in the image analysis process. This program provides a repeatable method of analysis, which eliminates some of the inherent errors associated with determining penetration and cone angles “by hand”. It also provides a good interface for using the LEM to determine overall average spray SMD.
The engine used for the emissions part of this study was a single-cylinder representation of a 2.4L five-cylinder engine. The engine runs were acquired under single injection and 0% EGR conditions. Engine specifications are shown in Table 2. The engine results were used to validate the simulation code, KIVA; then KIVA was used to investigate the effect of the spray characteristics on the engine emissions.
Table 2 Engine specifications
Engine Type Single cylinder diesel • Direct injection • Four valves • Ricardo Hydra block
Bore x Stroke 82.0 x 90.4 mm. Compression Ratio 18.79:1 Displacement 477 cm3. Squish Clearance Volume 26.84 cm3
Piston Type Reentrant bowl Intake Ports 1 high swirl, 1 tumble Intake Valve Opening 10oBTDC Intake Valve Closing 38o ABDC Exhaust Valve Opening 38o BBDC Exhaust Valve Closing 8.5o ATDC
The KIVA-3V code was used in this study with improvements in the spray, ignition, combustion and emission models. The computational mesh used in this simulation is shown in Fig 3. For computational efficiency, a 60o sector of combustion chamber is modeled due to the six-fold symmetry of the six –holes injector nozzle.
Figure 3 Computational mesh for the HSDI engine at –2 ADTC
A Kelvin-Helmholtz and Rayleigh-Taylor (KH-RT) model is used to model spray breakup. It is assumed that only KH instabilities are responsible for liquid core breakup, where the acceleration effects are thought to be negligible due to the close proximity of the droplets [8]. Beyond the breakup length, both aerodynamics and RT acceleration instabilities form the droplets. The model that predicts the fastest onset of instability dominates and results in the breakup event. The spray model also considers the effects of drop distortion on the drag coefficient of the drop. The drop’s drag coefficient is allowed to change dynamically, depending on the conditions surrounding the drop, between a sphere where there is no distortion and a disc where the distortion is maximum. Details of this model are described by Rutland et al. [9]. To model diesel engine ignition delay, a multi-step kinetics model known as the Shell model is used. In the Shell model, [10], eight generic reactions are used to represent important precursor species in hydrocarbon auto-ignition chemical kinetics. The principle of this model is that degenerate branching plays an important role in determining the cool flame and two stage ignition phenomena that are observed during hydrocarbon auto-ignition. A chain propagation cycle is formulated to describe the history of the branching agent together with an initiation and two termination reactions [11]. Finally, diesel spray combustion is modeled with a characteristic-time model, which is explained in detail by Kong at al. The soot formation is computed with the model of Hiroyasu and Kadota [12] and soot oxidation is determined with the Nagle and Strickland-Constable model [13]. In addition, NOx is modeled with the extended Zel’dovich mechanism [14].
RESULTS AND DISCUSSION
SPRAY CHARACTERISTICS Effect of injection pressure Figure 4 shows the effect of injection pressure on measured spray characteristics at a chamber density 18 kg/m3 and constant mass delivery of 34 mm3/st for CR160 nozzle. Figure 4a suggests that higher injection pressure results in a longer spray tip penetration length due to high momentum, which causes the jet to penetrate further in the chamber. The effect of the injection pressure gets smaller at higher pressures. The typical 95% confidence levels for each case are shown to show the shot to shot variation of three replicates. Figure 4b illustrates the effect of the injection pressure on the spray cone angle. The variations of cone angle throughout the spray event are not surprising due to the transient nature of the diesel spray and the gas entrainment during injection. Large spray angles at early times are often observed which could be due the spray non-uniformity at low needle lift, Fig. 4b. Figure 4c

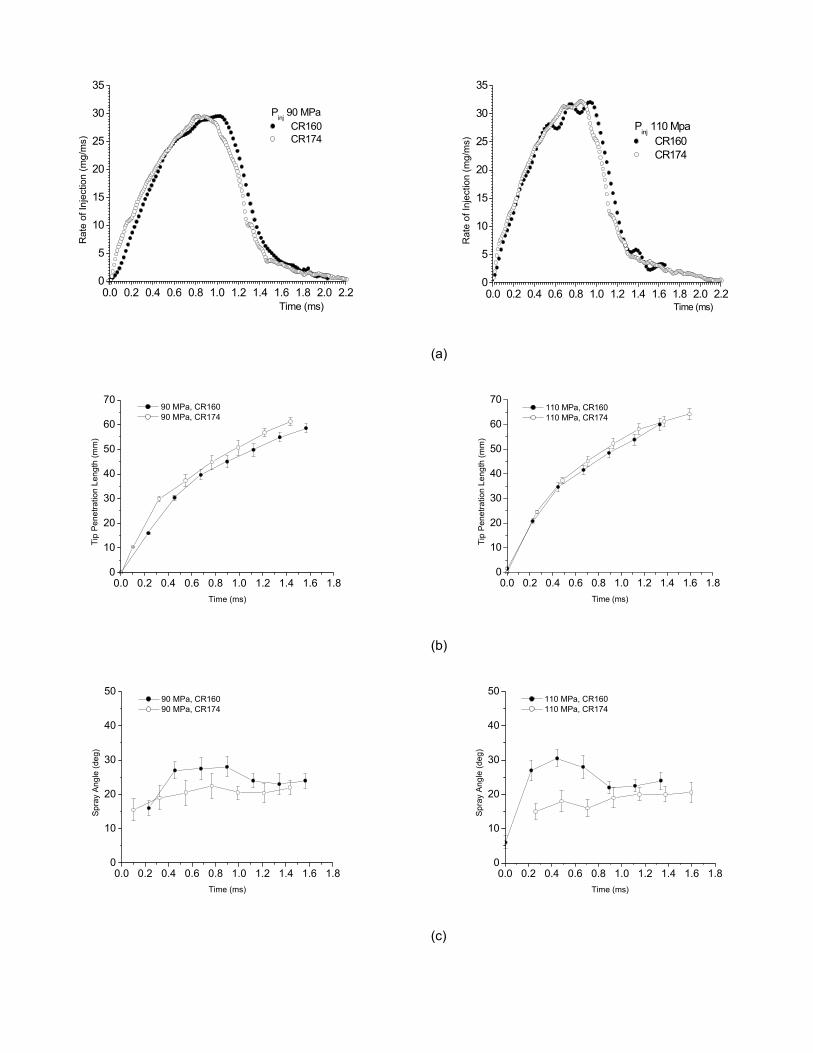
shows the effect of the injection pressure on the ROI (rate of injection) for the CR160 injector. It is shown that at constant mass delivery the solenoid has to cut the duration short to keep the same total mass injected. Figure 4d shows the time history of the overall SMD for the CR160 nozzle. By increasing the injection pressure, the SMD decreases. According to breakup theory, higher injection pressure provides more energy and higher momentum due to the higher injection velocity, which results in smaller droplet sizes. However, the SMD trend shows that the change of droplet sizes becomes smaller as the injection pressure increases. Effect of nozzle size Figure 5a shows a comparison of the rate of injection at the same mass delivery at 90 and 110 MPa for the CR160 and CR174 injectors. It is apparent from this figure that a bigger hole delivers more fuel in the early part of the injection and then closed faster to keep same the mass injected. From the results of Fig. 5 the smaller hole size nozzle has a shorter spray tip penetration, a wider spray angle, and a smaller overall average SMD. The smaller sizes of particles hold less momentum even though they were injected at the same pressure and as a result these droplets penetrate less into the air. The two injectors have different nozzle sizes and different overall cone angles as shown in Table 3. These effects cannot be separated, given the injectors available. However, Su [15] investigated the effect of cone angle at 25% load for different shape inlet nozzles with the same nozzle diameter and two different cone angles (125o and 145o). Su reported that the cone angle has a small effect on the tip penetration, spray angle and SMD. The effect of the nozzle size on the spray parameters, in this study, is likely to override the effect of the cone angle at 45% load as shown in Fig. 5.
0.0 0.2 0.4 0.6 0.8 1.0 1.2 1.4 1.6 1.80
10
20
30
40
50
60
70
80 CR160
33 MPa 70 MPa 90 MPa 95 MPa 105 MPa 110 MPa
Tip
Pene
tratio
n Le
ngth
(mm
)
Time (ms)
(a)
-0.2 0.0 0.2 0.4 0.6 0.8 1.0 1.2 1.4 1.6 1.80
10
20
30
40
50
60 CR160 33 MPa 70 MPa 90 MPa 95 MPa 105 MPa 110 MPa
Spra
y An
gle
(deg
)
Time (ms)
(b)
0.0 0.2 0.4 0.6 0.8 1.0 1.2 1.4 1.6 1.8 2.0 2.2 2.4 2.6 2.8 3.0
0
5
10
15
20
25
30
35
Rat
e of
Inje
ctio
n (m
g/m
s)
Time (ms)
ROI_CR160 33 Mpa 70 90 95 105 110
(c)
-0.2 0.0 0.2 0.4 0.6 0.8 1.0 1.2 1.4 1.6 1.80
10
20
30
40
50
60
70
80 CR160
33 MPa 70 MPa 90 MPa 95 MPa 105 MPa 110 MPa
SMD
(µm
)
Time (ms)
(d)
Figure 4 Effect of injection pressure on the spray characteristics for CR160 (a) penetration, (b) spray
angle, (c) Rate of injection and (d) SMD (at 34mm3/st delivery and 18 kg/m3)
0.0 0.2 0.4 0.6 0.8 1.0 1.2 1.4 1.6 1.8 2.0 2.20
5
10
15
20
25
30
35R
ate
of In
ject
ion
(mg/
ms)
Time (ms)
Pinj 90 MPa CR160 CR174
0.0 0.2 0.4 0.6 0.8 1.0 1.2 1.4 1.6 1.80
10
20
30
40
50
60
70 90 MPa, CR160 90 MPa, CR174
Tip
Pene
tratio
n Le
ngth
(mm
)
Time (ms)
0.0 0.2 0.4 0.6 0.8 1.0 1.2 1.4 1.6 1.80
10
20
30
40
50 90 MPa, CR160 90 MPa, CR174
Spra
y An
gle
(deg
)
Time (ms)
0.0 0.2 0.4 0.6 0.8 1.0 1.2 1.4 1.6 1.8 2.0 2.20
5
10
15
20
25
30
35
Pinj 110 Mpa CR160 CR174
Rat
e of
Inje
ctio
n (m
g/m
s)
Time (ms)
(a)
0.0 0.2 0.4 0.6 0.8 1.0 1.2 1.4 1.6 1.80
10
20
30
40
50
60
70 110 MPa, CR160 110 MPa, CR174
Tip
Pene
tratio
n Le
ngth
(mm
)
Time (ms)
(b)
0.0 0.2 0.4 0.6 0.8 1.0 1.2 1.4 1.6 1.80
10
20
30
40
50 110 MPa, CR160 110 MPa, CR174
Spra
y An
gle
(deg
)
Time (ms)
(c)

0.0 0.2 0.4 0.6 0.8 1.0 1.2 1.4 1.6 1.80
10
20
30
40
50 90 MPa, CR160 90 MPa, CR174
SMD
(µm
)
Time (ms)
0.0 0.2 0.4 0.6 0.8 1.0 1.2 1.4 1.6 1.80
10
20
30
40
50 110 MPa, CR160 110 MPa, CR174
SMD
(µm
)
Time (ms)
(d)
Figure 5 Effect of nozzle size on the spray characteristics for CR160 and CR174 at 90 and 110 MPa injection pressures (a) Rate of injection (b) penetration, (c) spray angle, and (d) SMD (at 34mm3/st delivery and 18 kg/m3)
(90 MPa)
0.0 0.2 0.4 0.6 0.8 1.0 1.2 1.4 1.6 1.8 2.00
5
10
15
20
25
30
35 90 MPa, CR160 90 MPa, HEUI158
Rate
of i
njec
tion
(mg/
ms)
Time (ms)
0.0 0.2 0.4 0.6 0.8 1.0 1.2 1.4 1.6 1.80
10
20
30
40
50
60
70 90 MPa, CR160 90 MPa, HEUI158
Tip
Pene
tratio
n Le
ngth
(mm
)
Time (ms)
(110 MPa)
0.0 0.2 0.4 0.6 0.8 1.0 1.2 1.4 1.6 1.8 2.00
5
10
15
20
25
30
35 110 MPa, CR160 110 MPa, HEUI158
Rate
of I
njec
tion
(mg/
ms)
Time (ms)
(a)
0.0 0.2 0.4 0.6 0.8 1.0 1.2 1.4 1.6 1.80
10
20
30
40
50
60
70 110 MPa, CR160 110 MPa, HEUI158
Tip
Pene
tratio
n Le
ngth
(mm
)
Time (ms)
(b)
(90 MPa)
0.0 0.2 0.4 0.6 0.8 1.0 1.2 1.4 1.6 1.80
10
20
30
40
50 90 MPa, CR160 90 MPa, HEUI158
Spra
y An
gle
(deg
)
Time (ms)
0.0 0.2 0.4 0.6 0.8 1.0 1.2 1.4 1.6 1.80
10
20
30
40
50 90 MPa, CR160 90 MPa, HEUI158
SMD
(µM
)
Time (ms)
(110MPa)
0.0 0.2 0.4 0.6 0.8 1.0 1.2 1.4 1.6 1.80
10
20
30
40
50 110 MPa, CR160 110 MPa, HEUI158
Spra
y An
gle
(deg
)
Time (ms)
(c)
0.0 0.2 0.4 0.6 0.8 1.0 1.2 1.4 1.6 1.80
10
20
30
40
50 110 MPa, CR160 110 MPa, HEUI158
SMD
(µM
)
Time (ms)
(d)
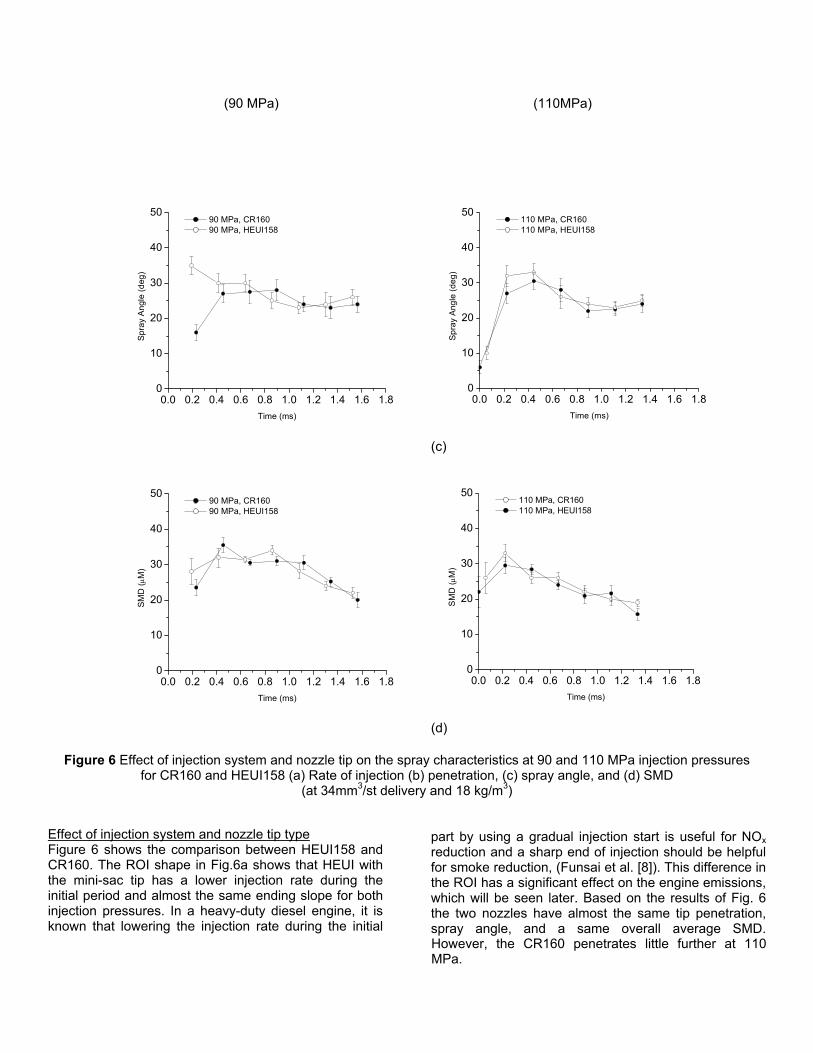
Figure 6 Effect of injection system and nozzle tip on the spray characteristics at 90 and 110 MPa injection pressures for CR160 and HEUI158 (a) Rate of injection (b) penetration, (c) spray angle, and (d) SMD
(at 34mm3/st delivery and 18 kg/m3)
Effect of injection system and nozzle tip type Figure 6 shows the comparison between HEUI158 and CR160. The ROI shape in Fig.6a shows that HEUI with the mini-sac tip has a lower injection rate during the initial period and almost the same ending slope for both injection pressures. In a heavy-duty diesel engine, it is known that lowering the injection rate during the initial
part by using a gradual injection start is useful for NOx reduction and a sharp end of injection should be helpful for smoke reduction, (Funsai et al. [8]). This difference in the ROI has a significant effect on the engine emissions, which will be seen later. Based on the results of Fig. 6 the two nozzles have almost the same tip penetration, spray angle, and a same overall average SMD. However, the CR160 penetrates little further at 110 MPa.

MULTIDIMENSIONAL MODELING Since we were not able to experimentally test all the injectors on one engine, a CFD code (KIVA-3v) was validated first with the engine data of the CR160 injector and then used to predict the engine emissions for the rest of the injectors. Figure 7 shows the comparison of simulated and experimental cylinder pressure at –7.5 degree ATDC injection timing for the CR160 nozzle at 110 MPa injection pressure case.
Pinj 110 MPa
0
10
20
30
40
50
60
70
80
90
100
-50 -30 -10 10 30 50CA degree (ATDC)
P (b
ar)
0
0.05
0.1
0.15
0.2
0.25
0.3
AH
RR
(Nor
mal
ized
)
P_ KIVA
P_measured
AHRR_KIVA
AHRR_measured
Figure 7 Measured and predicted in-cylinder pressure and AHRR for the CR160 Fiat engine baseline case at
110 MPa injection pressures With all sub-model constants fixed for all injectors at all different injection pressures, the pressure, heat release rate and engine emissions were predicted for all four injectors under test. Figure 7 represents a sample of the in-cylinder pressure and heat release rate for the CR160 injector at 110 MPa injection pressure. The measured data were taken at 45 % load and 0% EGR for the single cylinder engine. Overall, the computed pressures are in good agreement with the measured data. In particular, the simulations correctly model the time of auto-ignition and the peak pressures in most of the cases [17]. The heat release curve seen in this figure shows a strong early peak in the experimental data, but less so in the KIVA prediction. This, to some extent, may be due to the calculation method for the experimental heat release. In KIVA, the amount of heat release is easily calculated through the reaction equations. Experimentally, heat release cannot be measured directly. Rather, it is measured indirectly; from the pressure curve. Figure 8 shows a comparison between the predicted cylinder soot and NOx production history and measured values for the CR160 engine baseline case at different injection pressures. Considering the fact that only one set of constants was used for all injection pressures, a noticeable difference between the measured values and the predicted is only seen in the 70 MPa case where the
model over-predicts the soot by 50.5% and under-predicts the NOx by 12.5%. Figure 8 shows that in the present engine a significant portion (more than 80%) of the NOx is produced after peak pressure, and that the premixed burning could, at most, produce 20 % of the NOx produced at peak pressure. The close agreement between experimental and numerical NOx shows that the extended Zel’dovich kinetics have been able to reproduce the experimental NOx histories remarkably well. Figure 8 also illustrates soot formation in the early part of combustion and the soot oxidation in the second part of the combustion. The largest peak in soot production is just at the start of diffusion burning (~ 12 degree ATDC) for most of the cases when the spray is cut off from its air supply and surrounded by very hot products from the premixed burn. However, the high temperature and subsequent mixing with air cause the soot to rapidly oxidize, as shown. Figure 9 shows a comparison between the measured and calculated NOx-soot trade off for the CR160 injector at different injection pressures. Comparing the two graphs, measured and the predicted, it is noticeable that simulations predict correctly the trend of the trade off. The model agrees reasonably well with the measured NOx values but it under-predicts the soot in most cases, as was seen in Fig. 8. The soot models are based on a simple combustion system with single component fuel. However, in-cylinder soot formation and oxidation processes are very complex and the net soot emission is the result of the competition between these two processes. Therefore, it is difficult to predict the absolute values of the soot in a complex situation like diesel engine. Present soot models may be expected primarily to show the trend. Although the injection timing is constant for the 90, 95 and 105 MPa cases, (see Table 3) NOx increases due to increasing the boost as well as the injection pressure. Lower boost pressure (1.10 bar) in the 110 MPa case can explain lower NOx although it also has advanced injection timing (-7.5ATDC). It is also noted that increasing the injection pressure by ~5 % (from 90 to 95 MPa) at the same injection timing increased the NOx level by ~24%. Increasing the injection pressure by ~ 28% (from 70 to 90 MPa) with retarding injection timing –5.5o ATDC produced ~25% higher NOx. This shows the great effect of the injection timing on NOx production level. Table 3 Operating conditions for CR160 and CR174 injectors
Run 1 2 3 4 5
Pinj (MPa) 70 90 95 105 110
SOI (ATDC) -7.5 -5.5 -5.5 -5.5 -7.5
Boost pressure, (bar)
1.24 1.17 1.24 1.40 1.10

Pinj 70 MPa
0
5
10
15
20
25
30
35
0 10 20 30 40 50 60 70 80 90 100CA degree (ATDC)
No x/s
oot (
g/kg
f)
Nox_exp
soot_exp
NO x
soot
(a)
Pinj 90 MPa
0
5
10
15
20
25
30
35
0 10 20 30 40 50 60 70 80 90 100CA degree (ATDC)
No x/s
oot (
g/kg
f)
Nox_expsoot_exp
NO x
soot
(b)
Pinj 95 MPa
0
5
10
15
20
25
30
35
0 10 20 30 40 50 60 70 80 90 100CA degree (ATDC)
No x/s
oot (
g/kg
f)
Nox_expsoot_exp
NO x
soot
(c)
Pinj 105 MPa
0
5
10
15
20
25
30
35
0 10 20 30 40 50 60 70 80 90 100CA degree (ATDC)
No x/s
oot (
g/kg
f)Nox_expsoot_exp
NO x
soot
(d)
Pinj 110 MPa
0
5
10
15
20
25
30
35
0 10 20 30 40 50 60 70 80 90 100CA degree (ATDC)
No x/s
oot (
g/kg
f)
Nox_expsoot_exp
NO x
soot
(e)
Figure 8 Predicted cylinder soot and NOx production history and measured values for the CR160 Fiat engine (baseline case) at different injection pressures.

105
95
110
90
70 MPa
1101059590
70 MPa
0
1
2
3
4
5
6
7
8
10 15 20 25 30 35
NOx (g/kgf)
Soot
(g/k
gf)
measured
predicted
Figure 9 NOx -soot trade off for CR160 Fiat engine
baseline case at different injection pressures.
Figure 10 shows a comparison between the predicted NOx-soot trade off for the CR160 and CR174. From this figure, the NOx level for CR174 is lower than the CR160 case and the soot level is higher for the injection pressure ranges. The reason for such behavior is related to the spray structure of the nozzle as well as to the droplet size which is function of the nozzle diameter. The CR174 injector has slightly larger droplet sizes due to a bigger nozzle diameter as shown in Fig. 5. Moreover the CR174 injector has a smaller spray angle as shown in Table 4 for the entire range. The image frame right after the End Of Injection (EOI) was selected as the basis spray frame for evaluating a characteristics spray angle for Table 4. The spray angles measured from the digital images were used as an input in KIVA simulations. Bigger spray angles and smaller SMD for The CR160 injector enhance the mixing process inside the combustion chamber which leads to higher NOx level and lower soot as shown in Fig. 10.
70 MPa
9095 105
110
70 MPa
90
95
110
105
0
1
2
3
4
5
6
7
8
10 15 20 25 30 35Nox (g/kgf)
Soot
(g/k
g f)
KIVA_CR160
KIVA_CR174
Figure 10 NOx -Soot trade off for both CR160 and CR174 at different injection pressures
Table 4 Spray angle, boost and injection timing values
for the CR160 and the CR174 Spray angle
(deg) from the spray
measurements
Pinj (Mpa)
Boost pressure (bar)
Injection timing (ATDC)
CR160
CR174
70 1.24 -7.5 26 23 90 1.17 -5.5 24 20 95 1.24 -5.5 22 16 105 1.40 -5.5 20.5 17.5 110 1.10 -7.5 22.5 18.5
CORRELATION BETWEEN SPRAY CHARACTERISTICS AND EMISSIONS Effect of injection pressure Figure 11 shows the results of predicted engine emissions versus injection pressure for the CR160 injector at 45% engine load condition and 0% EGR using a single injection strategy. Points at 90 and 95 MPa have the same injection timing and less than 6% change in the boost pressure, (see Table 4). For these two points as shown in Fig. 11, increasing the injection pressure by ~6 % (from 90 to 95) the NOx emissions level increases by 24 % while the soot level decreases by ~11%. Increasing both the injection pressure by ~10% (from 95 to 105 MPa) and the boost by ~ 13% NOx increases more (~34%) and soot decreases (~12%) as was expected. The spray angle also decreases by ~ 6%. By increasing the injection pressure the atomization of the spray will be enhanced which will lead to higher temperatures inside the chamber causing higher NOx and, in the meantime, air utilization will improve causing the soot to be reduced as a trade off. It is well known that EGR and retarding the injection timing reduce the NOx level for a diesel engine. The advanced injection timing as well as the smaller spray angle, (see Table 4) may explain the slight increase of the predicted NOx emission when the injection pressure increases from 70 to 90 MPa (28 % increase), (see Fig. 11). Going from 95 to 105 MPa at the same injection timing, both higher injection pressure and higher boost overcome the effect of the smaller spray angle on Nox and soot missions.

CR160 Injector
-5.5
-7.5 (ATDC)
-5.5-5.5
15
17
19
21
23
25
27
29
31
33
70 75 80 85 90 95 100 105Pinj (MPa)
NO
x (g/
kgf)
0
1
2
3
4
5
Soot
(g/k
g f)
NOxsoot
Figure 11 Predicted engine emissions for CR160 injector
Figure 12 depicts the results of the spray characteristics versus injection pressures for CR160 injector under the simulation of 45% load condition. As shown in Fig 12, the overall average SMD for the entire spray decreases as injection pressure increases. This is consistent with the idea that higher injection pressure results in higher injection velocity which produces a higher droplet relative velocity and higher Weber number. Although the injection pressure has a slight effect on the spray angle as illustrated in Fig. 12, the spray cone angle has a relatively small effect on the mixing process and consequently on the NOx level. Furthermore, higher injection pressure gives a larger exit velocity and higher injection momentum; hence this results in a longer spray tip penetration length (Lp). Figure 13 shows the results of overall SMD versus engine emissions. The graph shows that the sprays that produce a smaller droplet size produced higher NOx but lower soot.
CR160 injector
0
10
20
30
40
50
60
65 70 75 80 85 90 95 100 105 110
Injection Pressure (MPa)
SMD
( µm
)/Lp (
mm
)
15
17
19
21
23
25
27
29
31
33
Spra
y A
ngle
(deg
)
penetrationSMDspray angle
Figure 12 Effect of injection pressure on spray characteristics for CR160 nozzle under 45 % load.
CR160 Injector
10
15
20
25
30
35
20 22 24 26 28 30 32 34 36
SMD (µm)
NO x (
g/kg
f)
2
2.2
2.4
2.6
2.8
3
3.2
3.4
3.6
3.8
4
Soot
(g/k
gf)
NOx
Soot
Figure 13 Effect of overall SMD on emissions for CR160 nozzle under 45 % load.
Effect of hole size and spray angle To investigate the effects of nozzle size on spray characteristics and emissions, two predicted sets of NOx and soot distributions for the CR160 and CR174 injectors are presented in Fig. 14. These graphs demonstrate that the smaller nozzle (160µm) has higher predicted NOx and a lower predicted soot level than CR174 at all pressures ranges. However, these two injectors also have different spray angles as shown in Table 4. These spray angles were measured from the spray characteristics for the two injectors as discussed before. An artificial KIVA simulation run was made for the CR174 injector at 90 MPa injection pressure using the spray angle of the CR160 injector and keeping all other variables (injection rate shape and nozzle diameter, 174µm) the same. By doing this run, the effect of the spray angle and nozzle diameter could be isolated. The predicted engine emissions for this run are superimposed on Fig. 14 with the results of CR160 and CR174 injectors with their original measured spray angles. Looking at 90 MPa injection pressure in Fig. 14, it appears both the spray angle and nozzle diameter have contributed to the engine emission level difference between the CR160 nozzle and CR174. The difference between the square point (the artificial KIVA run) on the graph and the open circles represents the spray angle effect (from 20o to 24o) on the emissions while the difference between the square point (the artificial KIVA run) and the closed circle shows the nozzle size effect (from 174µm to 160µm). Figure 14 reveals that in changing the nozzle diameter by 9% from 174 µm to 160 µm at the same injection timing and same load, NOx is increased by 53% and soot is reduced by 26% at 90 MPa injection pressure. However, Fig.14 also shows that increasing the spray angle by 20% leads to 16% higher NOx. and about 8% lower soot. According to jet theory, for the same injection rate a smaller nozzle gives a leaner fuel/air mixture

locally in the space domain along the fuel jet axis. High injection pressure gives rapid mixing and a leaner mixture in the time domain. Both these effects will enhance the rate of fuel/air mixing and subsequently suppress the formation of soot. However, a high mixing rate results in a high global heat release rate with high peak combustion temperatures, producing high NOx.
10
15
20
25
30
35
70 75 80 85 90 95 100 105 110Pinj (MPa)
NO
x (g/
kgf)
KIVA_CR174
KIVA_CR160
KIVA_CR174using CR160 cone
2
2.5
3
3.5
4
4.5
5
5.5
6
70 75 80 85 90 95 100 105 110Pinj (MPa)
Soot
(g/k
gf)
KIVA_CR174
KIVA_CR160
KIVA_ CR174 usingCR160 cone angle
Figure 14 Effect of hole size and spray cone angle on
the engine emissions Effect of injection rate shape from HUEI and CR on the predicted emissions Two injection systems (HEUI and CR) were used to acquire the spray characteristics and only the CR was used to perform the engine experiments. Since it is not possible experimentally to isolate the effect of rate shape from injector design, a numerical run was performed to explore the effect of the rate of injection on the engine emission. Figure 15 illustrates the predicted in-cylinder pressure and AHRR for the CR160 nozzle for the two different ROI’s and Fig. 16 represents the predicted cylinder soot and NOx production history. Figure 15 shows that the ROI shape has a significant effect on the premixed burn phase. However, the premixed burn phase produces a small amount of NOx compared to the mixing combustion phase.
Pinj 90 MPa
0
10
20
30
40
50
60
70
80
90
100
-50 -40 -30 -20 -10 0 10 20 30 40 50CA degree (ATDC)
P (b
ar)
0
0.05
0.1
0.15
0.2
0.25
0.3
Nor
mal
ized
AH
RR
CR160_ROI
HEUI158_ROI
Figure 15 Predicted in-cylinder pressure and AHRR for CR160 nozzle using two different ROI
Pinj 90 MPa
0
5
10
15
20
25
30
35
0 10 20 30 40 50 60 70 80 90 100CA degree (ATDC)
No x/s
oot (
g/kg
f)
CR160
HEUI158
NO x
soot
Figure 16 Predicted cylinder soot and NOx production
history for CR160 nozzle using two different ROI Figure 16 shows that using the HEUI rate of injection reduces the amount NOx ~ 6% and interestingly reduces the soot also by ~ 18%. The reason for higher NOx for the CR system is the faster injection start compared to HEUI, (see Fig. 6a). The reason for higher soot for the CR system may be due to lower injection rate at the last part of the rate of injection profile, as shown in Fig. 6a. It is known in heavy-duty diesel engines that reduced injection rate during the initial period by using a gradual injection start is helpful for NOx reduction. Furthermore, a sharp end of injection should be useful for smoke reduction, (see [16]). This seems to be true also for the present small bore diesel engine. Figure 17 summarizes the effect of the major variables on the engine emissions at 90 MPa injection pressure. This graph shows that increasing the injection pressure by ~6% increases the NOx level by ~24% and reduces the soot level by ~11%, while increasing the nozzle size by only ~9% decreases the NOx by ~53% and increases the soot by ~26%. Figure 17 also suggests that

increasing the spray angle by ~20% increases the NOx level by ~16% and decreases the soot by 8%. Switching from the CR system to the HEUI injection system both NOx and soot decrease by ~6% and 18% respectively.
Figure 17 Effect of the major variables on the NOx and soot at 90 MPa injection pressure
CONCLUSION
Characterization of high injection pressure diesel sprays for HSDI engines was performed based on high-speed photography and light extinction techniques. The effects of injection pressure, nozzle size and injection system on spray characteristics were investigated. The relationship between the spray characteristics and combustion emissions were also presented. The results of this study are summarized as follows:
• Higher injection pressure produced smaller SMD values, longer spray tip penetration and had small effect on the spray angle.
• At 45 % load and under the range of nozzle sizes as well as cone angles investigated, the effect of nozzle size on the spray characteristics was larger than the effect of nozzle cone angle. In other words the dominant variables that influence the droplet size are injection pressure and nozzle size.
• Considering the complex nature of the diesel combustion processes, the KIVA code was capable of modeling such processes reasonably well. The extended Zel’dovich mechanism was able to reproduce the experimental NOx histories remarkably well. Given the complex nature of the soot formation-oxidation process, the soot model in KIVA was able to predict the soot trends.
• The predicted results suggested that at 45% load and 90 MPa injection pressure, increasing the spray angle by 20 % caused the NOx concentrations to increase by ~ 16% while decreasing the nozzle diameter by 9%, the NOx concentrations showed a ~ 53 % increase.
• The CR and HEUI fuel systems provide flexible control for the injection parameters for the present small diesel engine but brought the technical challenge of optimizing the additional variables.
• Like in a heavy-duty diesel engine, at 45% load and 0% EGR, increasing the injection pressure reduced particulate and increased the NOx level from the HSDI diesel engine.
ACKNOWLEDGMENTS
This work was supported at the University of Wisconsin-Madison by the Army Research Office under Grant No. DAAH04-94-G-0328, and by funding from the US Army TACOM as part of the DUAP Program. Thanks are also due to Caterpillar and the helpful advice of Dr. Song-Charng Kong, D. Wickman and Y. Yi are appreciated.
REFERENCES
1. Hiroyasu, H. and Arai, M., “Structure of Fuel Sprays in Diesel Engines, “ SAE Paper No. 900475 (1990).
2. “Future Diesel Engines”, Society of Automotive Engineers SP-1287, 1997
3. Schommers, J., Duvinage, F., Stotz, M., Peters, A., Ellwanger, S., Koyanagi, K. and Gildein, H., “Potential of Common Rail Injection System for Passenger Car DI Diesel Engines”, SAE Paper No. 2000-01-0944, 2000
4. Glassey, S., Stockner, A. and Flinn, M., “HEUI-A New Direction for Diesel Engine Fuel Systems”, SAE Paper No. 930270, 1993.
5. Borman, G. L. and Ragland, K. w. ”Combustion Engineering”, McGraw-Hill,1998.
-60
-50
-40
-30
-20
-10
0
10
20
30
NO
x Pro
duct
ion
(%) CR HEUI
I.P. 6%
θ 20%
dn 9% -60
-50
-40
-30
-20
-10
0
10
20
30
NO
x Pro
duct
ion
(%) CR HEUI
I.P. 6%
θ 20%
dn 9%
CR HEUICR HEUI
I.P. 6% I.P. 6%
θ 20% θ 20%
dn 9%
-60
-50
-40
-30
-20
-10
0
10
20
30
Soot
Con
cent
ratio
n (%
)

8. Senecal, p.k. “Development of a Methodology for
Internal Combustion Engine Design Using Multi-Dimenstional Modeling with Validation through Experiments , PhD Thesis, UW 2000.
9. Rutland, C.J., Eckhause, J., Hampson, G., Hessel,R., Kong, S., Patterson, M., Pierpont, D., Sweetland, P., Tow, T., and Reitz, R.D. ” Toward Predictive Modeling of Diesel Engine Intake Flow, Combustion, and Emissions ,SAE 941897, 1994.
10. Halstead, M., Kirsch, L. and Quinn, C.” The auto-ignition of hydrocarbon fuels at high temperatures and pressures-Fitting of a mathematical Model”, combustion and flame”, 1977.
11. Kong, S.C. Han, Z. and Reitz, R.D. “The development and application of a diesel ignition and combustion model for multidimensional engine simulation, SAE 950278, 1995.
12. Hiroyasu, H. and Kadota, T. “Models for Combustion and Formation of nitric Oxide and Soot in DI Diesel Engine”, SAE760129, 1976
13. Nagle, J and Strickland-Constable, R.F., “Oxidation of Carbon between 1000 and 2000o C”, Proc. Of Fifth Carbon Conf, 1962.
14. Bowman, C.T., “Kinetics of Pollutant Formation and Destruction in Combustion”, Prog. Energy Combust.. Sci., 1975.
15. Su, T. F., “An Experimental Studay of High Injection pressure Diesel Sprays”, PhD Thesis, UW 1995.
16. Funai, K, Yamaguchi, T. and Itoh, S. “Injection rate shaping technology with common rail fuel system (ECD-U2)”, SAE 960107, 1996.
17. El-Hannouny E.M., “Spray Characteristics and Engine Emissions from Hydraulically Actuated High Pressure Injection Systems for Use in an HSDI Diesel Engine “
7. Su, T.F., Chang, C.T., Reitz, R.D., Farrell, P.v., Pierpont, A.D. and Tow, T.C. “Effects of Injection Pressure and Nozzle Geometry on Spray SMD an D.I. Emissions”, SAE Paper No.952360, 1995.
6. El-Beshbeeshy, M., Hodges, J., and Corradini, M., “Image Analysis of Diesel Engine”, SAE Paper No.921628, 1992.