1 Net Worth over $2.3 billion Copyright ACDC Leadership 2015.

An Executive Order Worth $100 Billion: The Impact of an Immigration Ban’s Announcement on Fortune 500 Firms’ Valuation Dany Bahar Prithwiraj Choudhury Britta Glennon
Working Paper 21-055
Working Paper 21-055
Copyright © 2020 by Dany Bahar, Prithwiraj Choudhury, and Britta Glennon.
Working papers are in draft form. This working paper is distributed for purposes of comment and discussion only. It may not be reproduced without permission of the copyright holder. Copies of working papers are available from the author.
Funding for this research was provided in part by Harvard Business School.
An Executive Order Worth $100 Billion: The Impact of an Immigration Ban’s Announcement on Fortune 500 Firms’ Valuation
Dany Bahar The Brookings Institution
Prithwiraj Choudhury Harvard Business School
Britta Glennon University of Pennsylvania

An Executive Order worth $100 billion:
The impact of an immigration ban’s
announcement on Fortune 500 firms’ valuation∗
Dany Bahar Prithwiraj Choudhury Britta GlennonThe Brookings Institution, Harvard Business School The Wharton School UPenn,
Harvard CID, IZA and CESifo and NBER
October 16, 2020
Abstract
On June 22, 2020, President Trump issued an Executive Order (EO)that suspended new work visas, barring nearly 200,000 foreign workers andtheir dependents from entering the United States and preventing Amer-ican companies from hiring skilled immigrants using H-1B or L1 visas.Exploiting this shock, and using event study methodology analyzing thecumulative average abnormal returns (CAARs) of Fortune 500 companiesfollowing this order, we find that the EO statistically and economicallysignificantly caused negative CAARs of up to 0.45%, the equivalent ofover 100 billion of US dollars of losses, based on the firms’ valuation be-fore the event. Our results are particularly pronounced for firms that hadmaintained or increased their reliance on skilled immigrant workers overthe prior years.
Keywords: immigration, visa, foreign workers, Fortune 500JEL Classification Numbers: G14, G38, J61
∗The authors are thankful to Jan Bena for insightful comments. The authors also thankPatrick Clapp and Sean Joffe for excellent research assistance. All errors are our own.
1

1 Introduction
On June 22, 2020 an Executive Order (EO) was issued by the President of theUnited States, Donald J. Trump, restricting the entry of individuals seekingto enter the country on a non-immigrant work visa.1 According to estimates,this EO barred entrance of about 200,000 foreign workers and their dependents(Chishti et al., 2020). Unlike immigrant visas, which grant individuals per-manent residency in the U.S. and are primarily granted for purposes of familyreunification, non-immigrant visas are primarily granted in response to demandfrom firms and are both employment-based and temporary.2 3 Of direct rele-vance to the Fortune 500 companies that we focus on in this paper is the EO’sban of new H-1B and L1 visas, both of which are used by American companiesto hire or transfer high-skilled immigrants.4 Kerr et al. (2015) document thatalmost all beneficiaries of the H-1B visa have a college degree and typicallyabout half of the temporary foreign workers have completed a graduate degree.Many also work in information technology and STEM, which accounted for over70 percent of all successful visa applications in the 2012 fiscal year.
In this paper, we study the immediate economic impact of this EO on thelargest U.S. firms by estimating the cumulative average abnormal stock returnsfor Fortune 500 firms in response to the policy announcement. We find that theJune 22 shock eroded the market valuation of the 471 companies in our sampleby an estimated 100 billion of US dollars.
We arrive at these conclusions by estimating the cumulative average abnor-mal returns of Fortune 500 companies following the EO, based on the eventstudy methodology, a workhorse method introduced by Fama et al. (1969) andused extensively in the economics and finance literature (Binder, 1985; Schoarand Zuo, 2016). Our baseline results show that in the days that followed the
1Source: https://www.whitehouse.gov/presidential-actions/proclamation-suspending-entry-aliens-present-risk-u-s-labor-market-following-coronavirus-outbreak/
2Among other visa categories, non-immigrant visas included visas related to"specialty occupations in fields requiring highly specialized knowledge" (H-1Bvisas), intra-company transfers (L visas), and exchange visitors (J visas).Source:https://travel.state.gov/content/travel/en/us-visas/visa-information-resources/all-visa-categories.html
3Leiden and Neal (1990) summarize how the U.S. Immigration Act of 1990 created threecategories of visas, focused on three priorities: family-reunification, employment and diversity.The same act created quotas for family-reunification visas and for employment. The 1990 Actalso created the H1-B visa category.
4The L1 visa allows American companies with global operations to temporarily transferforeign managers and employees to their American offices
2

EO, the firms in our sample –known to rely extensively on immigrant labor–lost about 0.45% of their value based on abnormal stock returns. We furtherfind that this negative shock was common on firms regardless of their economicactivity and was much stronger for firms that have maintained or increasedtheir reliance on foreign workers during the years prior to the EO (as measuredby each firm’s Labor Condition Application requests which proxies demand forH1B visas).
In reporting this finding, this paper contributes with additional novel evi-dence to the ongoing debate surrounding immigration policy focused on attract-ing skilled temporary workers.
A number of empirical papers in the existing literature find that skilled im-migration improves firm outcomes such as total factor productivity (Mitaritonnaet al., 2017), production expansion (Olney, 2013), innovation (Kerr and Lincoln,2010; Choudhury and Kim, 2019; Beerli et al., 2018), FDI (Foley and Kerr,2013), and profits (Mayda et al., 2020).5 Other studies such as Doran et al.(2020) present more conservative evidence on the value of temporary workerprograms, more specifically the H1B visa program, to U.S. firms. Doran et al.(2020) document that for U.S. firms, winning marginal H1B visas through theH1B lottery has insignificant effects on productivity and innovation outcomes,such as firms’ patenting and use of the research and experimentation tax credit.However, Doran et al. (2020) do present some evidence that securing additionalH1B visas lead to higher firm profitability.
Our study contributes to this active debate surrounding whether or not,and to what extent, skilled work visas create value for firms, by examining theshort-run impacts of skilled immigration restrictions on firms’ stock market val-uations. Our results support the hypothesis, first posited by Kerr and Lincoln(2010), that restrictions on skilled visas represent a supply shock to U.S. firms.While there may be longer run adjustments –such as offshoring, documentedby Glennon (2020)– that U.S. firms can make when their access to skilled la-bor supply is abruptly constrained, one would also expect a short-run negativeimpact prior to any such adjustments, which is precisely what we documenthere. Furthermore, while the prior literature is focused on studying the effects
5Several studies also document a positive relation between immigration and productivityand/or innovation outcomes in the context of geographies and local labor markets. Thesestudies include Saxenian (2002); Hunt and Gauthier-Loiselle (2010); Kahn and MacGarvie(2016); Miguelez and Temgoua (2020); Bahar et al. (2019, 2020). Kerr et al. (2016) providean excellent summary of this literature.
3
of the H-1B visa policy on firm outcomes in equilibrium, we complement theprior literature by studying the effects of how a policy shock to the H-1B visaprogram affects market valuation of U.S. firms in the immediate term.
Our paper first describes the data and the empirical strategy, after which wedetail the results. Finally, in the last section, we offer some concluding remarks.6
2 Data and Empirical Strategy
We estimate the impact of President Trump’s EO restricting worker’s visas onthe value of Fortune 500 firms by identifying changes in their cumulative averageabnormal returns (CAARs), using stock market data.
Our data come from two primary sources: (1) Thomson Reuters Datastreamand (2) Department of Labor (DOL) Labor Condition Application (LCA) re-quests.7 The former provides information on daily stock returns for all firms inour sample as well as the daily returns for the Standard and Poor’s 500 Index(S&P500), which we use as a market index proxy, between January 2019 andJuly 2020. The latter is a proxy for firm demand for H-1B visas between 2015and 2019.8 We also obtain market capitalization data from S&P Capital IQ andemployment data from Compustat. Our final sample consists of 471 firms, theuniverse of all Fortune 500 companies in any year between 2010 to 2015 thatare publicly traded (and hence for which stock market data is available).9
We employ the event study methodology, a workhorse method introduced by(Fama et al., 1969) and used extensively in the economics and finance literatures(Binder, 1985; Schoar and Zuo, 2016). We measure the impact of the June 2020EO on the stock return of the companies in our sample in the following way.
6Our paper is accompanied by an Online Appendix where we report additional informationas well as results for several robustness tests.
7We use predated LCA applications following the literature to identify those visas thatare subject to the H-1B cap. In other words, we infer whether a given LCA application isfor a cap-subject H-1B visa by looking at the date of the LCA application. We assume thatany LCA filed between January and April with a work start date 5-6 months in the futurerepresents demand for a cap-subject H-1B visa for the following fiscal year.
8The H-1B application process is a two-stage process. Before a firm can file a petition withUS Customs and Immigration Services (USCIS), they must file an LCA with the DOL. Thereis no limit â beyond cost â on the number of LCAs that a firm can file, so demand is measuredindependent of whether an H-1B is ultimately issued or not.
9In Online Appendix Section A we provide the full list of the 471 companies in our finalsample with their corresponding one-digit NAICS industry code and their market capitaliza-tion at close of June 19, 2020, the business day before the EO was announced.
4

First, we estimate a market model to measure the expected return of each oneof the companies during the event window. Following (?) we first estimate foreach company i:
Ri,t = αi + βiRm,t + εi,t (1)
where Ri,t is the daily stock return of company i (for each trading day t) andRm,t represents the market’s daily return, which in our baseline estimations isproxied by the Standard and Poor’s 500 Index.10
For each company in our sample, we estimate the market model for alltrading days of 2019.11. That model then forms our expectations as to how thecompany stock should behave with respect to the market during the event weexplore in 2020. With this, we then estimate the daily abnormal return (AR)as:
ARi,t = Ri,t − α̂i − β̂iRm,t (2)
where ARi,t is the estimated abnormal return computed as a residual usingthe estimators for each firm i of α and β from specification (1). Followingthe literature, we average the abnormal returns over different windows aroundthe event dates, which correspond to the cumulative average abnormal returns(CAARs) for each company. Following (Schoar and Zuo, 2016), our baselineestimation is based on averaging the cumulative abnormal results for the 3-daywindow [-1, +1] and the 5-day window [-1,+3] surrounding the events. In otherwords, we compute CAARs as:
CAARi =1
T − t
t=T∑t=−1
ARi,t (3)
where T is 1 or 3 in our baseline estimations.We chose asymmetric windows to avoid confounding our results with unex-
pected market volatility due to the ongoing global COVID-19 pandemic and notthe immigration announcements themselves. However, it is important to notethat our results are robust to using symmetric windows (as is typical in some
10Our results are robust to using Barclay’s Fortune 500 index as a market proxy, too.11There is no widely agreed upon estimation period in the literature. We follow (Schoar
and Zuo, 2016) and use all of 2019, the year before the event we analyze, as the estimationperiod, but our results are also robust to including the first few months of 2020 as part of ourestimation period.
5

of the literature) and, as we show below, robust for longer windows includingmore post-event days.
We proceed to test whether the firms in our sample experienced a significantdeviation from what we would expect from those stocks given the market be-havior and the stocks’ relationship to the market. We do this, first, by simplyestablishing whether we can or cannot reject the hypothesis that the samplemean of CAARs –which we refer to as µ– is statistically different from zero.Second, we also compare between-CAARs averages for sub-samples of firms,based on their dependence on the immigrant workforce (similar to the t-testsperformed by Schoar and Zuo (2016)).
3 Results
We first examine the CAARs sample mean µ for the days that followed theannouncement affecting non-immigrant visas. Table 1 summarizes this exercise.Columns 1 and 2 report the CAARs sample mean (µ) using a 3-day window(from t = −1 to t = 1) while columns 3 and 4 use a 5-day window (from t = −1
to t = 3). Columns 1 and 3 present the simple average while Columns 2 and 4present the within-sector average, where sector is defined as the firms’ reported1-digit NAICS industry code. We do this to make sure our results are not biasedby the behavior of a particular sector. When including sector fixed effects, oursample drops to 468 because we lack sector data for three firms.
[Table 1 about here.]
The CAARs response to the EO restricting non-immigrant work visas is neg-ative, statistically significant, and remains strikingly similar at 0.45% for bothwindows. In other words, in the days following the June 22, 2020 announce-ment banning work visas, Fortune 500 firms lost on average nearly 0.5% of theirvalue. The results are also robust –and strikingly similar– when controlling forindustry fixed effects.
According to market capitalization figures for the 471 companies in our sam-ple, the total value of the companies at the end of June 19, 2020 –the businessday before the policy announcement was made– was about 22.68 trillion dollars.Thus, the 0.45% negative effect we estimate represents a loss of about 100.14billion dollars for the economy as a whole.
We also find that this result remains consistent even when we expand theestimation to longer windows that incorporate more post-event days, as shown
6

in Figure 4, which plots µ , with t = −1 as the start day of the window butwith a varying end day, from t = 1 to t = 10. The figure shows the negativeeffect of the EO, which specifically affected the ability of firms to hire foreignworkers, remained steady for 10 days after the announcement.
[Figure 1 about here.]
Heterogeneous Effects
In this section, we examine which firms and sectors were especially negativelyimpacted by the EO.
First, we explore whether the effect we find is more or less prevalent acrossthe different sectors of the economy. Thus we repeat the exercise of estimatingµ this time by sectors of the economy according to the 1-digit NAICS code re-ported by every firm. In particular we look at the four sectors where most of thefirms are concentrated: Mining, Utilities and Construction (MUC), Manufac-turing (MNFTR), Commerce (COM), and Financial, Information Technologyand Real Estate (FIRE). Results are presented in Table 2.
[Table 2 about here.]
The results show negative values for µ across all sectors, but the negativeestimates are especially large for the Financial, Information Technology andReal Estate (FIRE) sector, followed by the Mining, Utilities and Construction(MUC) sector. However, all in all, our results suggest that the EO negativelyimpacted the valuation of all firms in our sample, regardless of industry.
Another component we exploit is the reliance on the immigrant workforceof these firms. We would expect that firms with non-decreasing reliance onhiring foreign workers would be most impacted by an unexpected restriction ontheir ability to hire said workers. We therefore look for differential effects forsub-samples of firms based on their known reliance on foreign workers.
To explore this, we divide the sample in two sub-samples based on the growthof LCA applications over the past three years. For our baseline estimation weuse the Compound Average Growth Rate as our baseline growth measure asfollows:
CAGRi,t→T =
LCAi,T
empi,T
LCAi,t
empi,t
1T−t
− 1 (4)
7

In our baseline results T is 2019 and t is 2016, LCA is the predated LaborCondition Applications for firm i in each year, and emp is the total number ofemployees of firm i in each year.12
Based on the distribution of CAGR for the 471 firms we create two sub-samples based on their 3-year growth rate during 2016 to 2019: negative growthand zero or positive growth, which corresponds to dividing the sample aboveand below the median of the growth distribution.13
Essentially, we split the sample by whether firms had negative vs steady/positivegrowth in LCA applications. We name these two sub-samples L and H for lowand high values of the distribution of growth, respectively.
We then proceed, in similar fashion as Schoar and Zuo (2016), to comparingµL and µH (e.g., that is, the sub-sample means of the CAARs) by computing∆ = µH − µL. Table 3 presents the results for these estimations using thewindow [-1,1] and [-1,3] to compute CAARs in Columns 1 and 2 and Columns3 and 4, respectively. As with Table 1, the even columns present results usingwithin-sector variation, only.14
[Table 3 about here.]
Table 3 shows that the 295 firms in our sample with zero or positive LCAgrowth during 2016-2019 (as a share of their employees) experienced a 0.2 to0.3 percent larger drop in their valuation following the June EO than the 176firms that had reduced their dependence on LCAs. Considering that the dropin the valuation of firms with negative LCA growth was around 0.3 percent (as
12Our results are robust to computing growth rate in different manners, including usingnominal value of LCAs (e.g., not normalized by the number of employees) as shown in OnlineAppendix C.
13As can be seen in Figure B in Online Appendix B, the distribution of CAGR for the firmsin our sample behaves similarly to a normal distribution with two particular values standingout: -1 (e.g., 100% negative growth rate) for firms that went from having any positive valueof LCA in 2016 to none in 2019, and 0 for firms that experienced no growth in LCAs (as ashare of employees) between those two years, which is a significant share of all firms. OnlineAppendix B also shows that our main results are unchanged if we use other moments of thegrowth distribution to define the sub-samples.
14 These results were obtained by estimating the following specification:
CAAR[−1,T ]i = µ+ ∆Hi + ηs + ui (5)
where Hi is a binary variable indicating whether firm i belongs to sub-sample H. Accordingly,µL = µ and µH = µ+ ∆. T is a post-event day marking the upper limit of the window usedto compute the CAARs that serve as dependent variable. ηs represent sector (the first digitof the NAICS code) fixed effects.
8

shown by µL in Table 3), this implies that firms in the zero or positive LCAgrowth sub-sample were hit almost twice as hard by the announcement.
In fact, as Figure 4 indicates, we find that the notable difference in the sub-samples CAAR means between the two groups, µH and µL, was sustained forat least 10 days after the policy announcement was made, and the difference ∆
remains statistically different from zero for longer windows as well. Thus, thenegative shock in these companies’ valuation was not reversed for at least twoweeks after the announcement.15
[Figure 2 about here.]
4 Conclusions
In this paper we employ the event study methodology to estimate how an Ex-ecutive Order restricting the entry of temporary foreign workers to the U.S.negatively affected the valuation of 471 publicly traded Fortune 500 firms. Tothe best of our knowledge, this paper provides the first set of results on whether,and to what extent, markets value shocks to employment based immigration pol-icy in the very short term. We do not view the results reported in this paper asreflecting equilibrium conditions. Over the medium to long term, it is conceiv-able that firms respond to this shock by engaging in the process of allocatingresources across geographies (Glennon, 2020). While there may be such long-runadjustments that firms can make when access to skilled labor supply is abruptlyconstrained, we document that there is a significant short-run negative impact.In this particular instance, the June 22 2020 immigration ban plausibly erodedvaluation to the tune of 100 billion dollars for the firms in our sample. Theseresults not only contribute to the broader academic debate surrounding whetheror not, and to what extent, skilled work visas create value for firms, but theyalso inform the current ongoing policy discussions surrounding H-1B visas inparticular.16
15Online Appendix Section D extends this analysis and replicates the estimation for alltrading days between January 1st and June 15th of 2020. We find no evidence of our resultbeing driven by idiosyncratic factors given that the estimates of ∆ are statistically insignificantin nearly 93% of the trading days in period. The few exceptions, we argue, can be explainedby the economic context of the particular days.
16In July 2020, the US Chamber of Commerce sued the Trump Administration, challengingthe June 22 EO. In an Amicus Brief submitted on August 10, 2020, companies such as Face-book, Netflix, Adobe, Reddit, GitHub, Paypal, and Amazon argued that the "indiscriminate
9

References
Bahar, Dany, Prithwiraj Choudhury, and Hillel Rapoport. “Migrant inventorsand the technological advantage of nations.” Research Policy 103947.
Bahar, Dany, Andreas Hauptmann, Cem Ozguzel, and Hillel Rapoport. “Migra-tion and Post-Conflict Reconstruction : The Effect of Returning Refugees onExport Performance in the Former Yugoslavia.” IZA Discussion Paper Series, 12412.
Beerli, A., J. Ruffner, M. Siegenthaler, and G. Peri. “Immigrants and firmsâoutcomes: Evidence from France.” NBER Working Paper .
Binder, John J. “Measuring the effects of regulation with stock price data.” TheRAND Journal of Economics 167–183.
Chishti, Muzaffar, Sarah Pierce, and Kira Olsen-Medina. “Impending USCISFurloughs Will Contribute to a Historic Drop in U.S. Immigration Levels.”Technical report, Migration Policy Institute, 2020.
Choudhury, Prithwiraj, and Do Yoon Kim. “The ethnic migrant inventor ef-fect: Codification and recombination of knowledge across borders.” StrategicManagement Journal 40, 2: (2019) 203–229.
Doran, Kirk, Alexander Gelber, and Adam Isen. “The effects of high-skilledimmigration policy on firms: Evidence from H-1B visa lotteries.” Technicalreport, Working Paper, 2020.
Fama, Eugene F, Lawrence Fisher, Michael C Jensen, and Richard Roll. “Theadjustment of stock prices to new information.” International economic review10, 1: (1969) 1–21.
Foley, C Fritz, and William R Kerr. “Ethnic innovation and US multinationalfirm activity.” Management Science 59, 7: (2013) 1529–1544.
Glennon, Britta. “How do restrictions on high-skilled immigration affect off-shoring? Evidence from the H-1B program.” NBER Working Paper .
suspension of these crucial non-immigrant visas programs does not further the interests of theUnited States" (Source: https://www.theverge.com/2020/8/10/21362198/trump-immigrant-worker-ban-tech-companies-economy). On October 1, 2020, a federal judge ruled that Pres-ident Trump had overstepped his authority in banning the visas, a ruling that was quicklyfollowed with further tightening of H-1B visa rules on October 6th.
10

Hunt, Jennifer, and Marjolaine Gauthier-Loiselle. “How much does immigrationboost innovation?” American Economic Journal: Macroeconomics 2, 2:(2010) 31–56.
Kahn, Shulamit, and Megan J MacGarvie. “How important is US location forresearch in science?” Review of Economics and Statistics 98, 2: (2016)397–414.
Kerr, Sari Pekkala, William Kerr, Çağlar Özden, and Christopher Parsons.“Global talent flows.” Journal of Economic Perspectives 30, 4: (2016) 83–106.
Kerr, Sari Pekkala, William R Kerr, and William F Lincoln. “Skilled immigra-tion and the employment structures of US firms.” Journal of Labor Economics33, S1: (2015) S147–S186.
Kerr, William R, and William F Lincoln. “The supply side of innovation: H-1Bvisa reforms and US ethnic invention.” Journal of Labor Economics 28, 3:(2010) 473–508.
Leiden, Warren R, and David L Neal. “Highlights of the US Immigration Actof 1990.”, 1990.
Mayda, AM, F Ortega, G Peri, KY Shih, and C Sparber. “Coping with H-1BShortages: Firm Performance and Mitigation Strategies.” NBER WorkingPaper .
Miguelez, Ernest, and Claudia Noumedem Temgoua. “Inventor migration andknowledge flows: A two-way communication channel?” Research Policy 49,9: (2020) 103,914.
Mitaritonna, Cristina, Gianluca Orefice, and Giovanni Peri. “Immigrants andfirms’ outcomes: Evidence from France.” European Economic Review 96:(2017) 62 – 82.
Olney, William. “Immigration and firm expansion.” Journal of Regional Science.
Saxenian, AnnaLee. “Silicon Valleyâs new immigrant high-growth en-trepreneurs.” Economic development quarterly 16, 1: (2002) 20–31.
Schoar, Antoinette, and Luo Zuo. “Does the Market Value CEO Styles?” Amer-ican Economic Review 106, 5: (2016) 262–66.
11

Figure 1: Sample Mean CAARs (µ)
−.0
06
−.0
04
−.0
02
0S
am
ple
Me
an
CA
AR
1 2 3 4 5 6 7 8 9 10Post−event days
This figure plots the sample mean CAARs (µ) for the June 2020 event varying the end-dayof the window used to compute such CAARs in the horizontal axis: 1 represents the samplemean CAAR for window [-1,1], 2 for [-1,2], 3 for [-1,3] and so on until [-1,10]. Whiskersrepresent 95% confidence intervals using robust standard errors.
12

Figure 2: Event Study for Sub-Samples of LCA Growth Rates
−.0
06
−.0
04
−.0
02
0S
am
ple
Me
an
CA
AR
1 2 3 4 5 6 7 8 9 10Post−event days
µL
µH
∆
This figure plots using bars the sub-samples mean CAARs (µL and µH) varying the end-dayof the window used to compute such CAARs in the horizontal axis: 1 represents the samplemean CAAR for window [-1,1], 2 for [-1,2], 3 for [-1,3] and so on until [-1,10]. The markerspresent the difference ∆ = µH − µL with whiskers representing 95% confidence intervalsusing robust standard errors.
13

Table 1: Event Study Immigration Policy AnnouncementDependent Variable: CAARs
(1) (2) (3) (4)[-1,1] [-1,1] [-1,3] [-1,3]
µ -0.0044 -0.0045 -0.0043 -0.0044(0.001)*** (0.001)*** (0.000)*** (0.000)***
N 471 468 471 468R sq 0.000 0.033 0.000 0.030Sector FE N Y N Y
The table reports CAARs sample means (µ) for days surrounding the an-nouncement restricting non-immigrant work visas. Columns 1 and 2 are basedon CAARs computed for the window [-1,1] and Columns 3 and 4 for the win-dow [-1,3]. Columns 1 and 3 report the sample mean, while Columns 2 and4 report the within-sector sample mean, where sector is defined as the firms’reported 1-digit NAICS industry code. Robust standard errors are presentedin parentheses.∗p < 0.10,∗∗ p < 0.05,∗∗∗ p < 0.01
14

Table 2: Event Study by Economic Sector
Dependent Variable: CAARs(1) (2) (3) (4)
MUC MNFTR COM FIREµ -0.0069 -0.0035 -0.0022 -0.0055
(0.001)*** (0.001)*** (0.001)* (0.001)***
N 58 164 95 127Adj R2 0.00 0.00 0.00 0.00
The table reports CAARs sample means (µ) for days surrounding June2020 announcement restricting non-immigrant work visas. Each columnpresents result for a different sector. MUC: Mining, Utilities and Con-struction; MNFTR: Manufacturing; COM: Commerce; FIRE: Finan-cial, Information Technology and Real Estate. All columns are basedon CAARs computed for the window of days [-1,1]. Robust standarderrors are presented in parenthesis.∗p < 0.10,∗∗ p < 0.05,∗∗∗ p < 0.01
15

Table 3: Event Study for Sub-Samples of LCA Growth Rates
Dependent Variable: CAARs(1) (2) (3) (4)[-1,1] [-1,1] [-1,3] [-1,3]
∆ -0.0030 -0.0024 -0.0019 -0.0017(0.001)*** (0.001)* (0.001)* (0.001)*
NL 176 176 176 176µL -0.003 -0.003 -0.003 -0.003NH 295 295 295 295µH -0.006 -0.005 -0.005 -0.005Sector FE N Y N Y
The table reports ∆, the difference between sub-sample means ofCAARs for firms with negative (L) and zero or positive (H) growthrate of LCA applications. The sub-sample means (µ) and number offirms (N) belonging to each sample L and H are also reported in eachcolumn. Columns 1 and 2 are based on CAARs computed for the win-dow of days [-1,1] and Columns 3 and 4 for the window [-1,3]. Resultsin Columns 1 and 3 are based on simple sub-sample means, whilein Columns 2 and 4 are based on within-sector sub-sample means,whereas sector is defined as the firms’ reported 1-digit NAICS indus-try code. Robust standard errors are presented in parenthesis.∗p < 0.10,∗∗ p < 0.05,∗∗∗ p < 0.01
16
Online Appendix for
An Executive Order worth $100 billion:
The impact of an immigration ban’s
announcement on Fortune 500 firms’ valuationDany Bahar, Prithwiraj Choudhury, Britta Glennon
October 16, 2020
A Sample Details
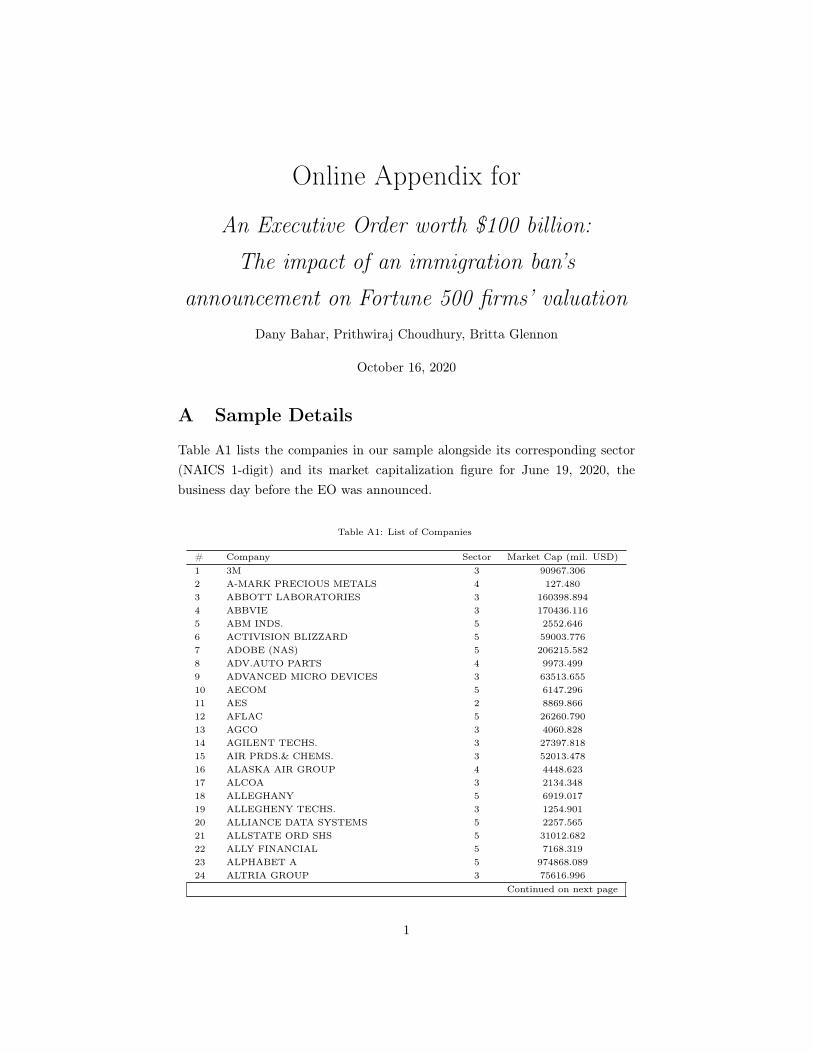
Table A1 lists the companies in our sample alongside its corresponding sector(NAICS 1-digit) and its market capitalization figure for June 19, 2020, thebusiness day before the EO was announced.
Table A1: List of Companies
# Company Sector Market Cap (mil. USD)1 3M 3 90967.3062 A-MARK PRECIOUS METALS 4 127.4803 ABBOTT LABORATORIES 3 160398.8944 ABBVIE 3 170436.1165 ABM INDS. 5 2552.6466 ACTIVISION BLIZZARD 5 59003.7767 ADOBE (NAS) 5 206215.5828 ADV.AUTO PARTS 4 9973.4999 ADVANCED MICRO DEVICES 3 63513.65510 AECOM 5 6147.29611 AES 2 8869.86612 AFLAC 5 26260.79013 AGCO 3 4060.82814 AGILENT TECHS. 3 27397.81815 AIR PRDS.& CHEMS. 3 52013.47816 ALASKA AIR GROUP 4 4448.62317 ALCOA 3 2134.34818 ALLEGHANY 5 6919.01719 ALLEGHENY TECHS. 3 1254.90120 ALLIANCE DATA SYSTEMS 5 2257.56521 ALLSTATE ORD SHS 5 31012.68222 ALLY FINANCIAL 5 7168.31923 ALPHABET A 5 974868.08924 ALTRIA GROUP 3 75616.996
Continued on next page
1

Table A1 – continued from previous page# Company Sector Market Cap (mil. USD)25 AMAZON.COM 4 1334230.87326 AMER.AXLE & MNFG. 3 834.57627 AMER.ELEC.PWR. 2 39502.93228 AMEREN 2 17232.99429 AMERICAN AIRLINES GROUP 4 6766.31230 AMERICAN EXPRESS 5 81253.82331 AMERICAN FINL.GP.OHIO 5 5689.67232 AMERICAN INTL.GP. 5 27397.65633 AMERICAN TOWER 5 117742.19034 AMERIPRISE FINL. 5 18148.73135 AMERISOURCEBERGEN 4 20777.59336 AMGEN 3 140414.65437 AMPHENOL ’A’ 3 28710.63138 ANDERSONS 4 459.39439 ANTHEM 5 67171.29240 APACHE 2 5276.41641 APPLE 3 1515803.63642 APPLIED MATS. 3 55859.41343 ARAMARK 7 5979.41844 ARCHER DANIELS MIDLAND 3 22353.16745 ARROW ELECTRONICS 4 5210.95746 ARTHUR J GALLAGHER 5 17964.69447 ASBURY AUTOMOTIVE GP. 4 1446.35048 ASCENA RETAIL GROUP 4 20.30749 ASHLAND GLOBAL HDG. 3 4156.35350 ASSURANT 5 6339.84151 AT&T 5 215958.75052 ATMOS ENERGY 2 12196.90453 AUTOLIV n.a 5509.61854 AUTOMATIC DATA PROC. 5 64036.38255 AUTONATION 4 3315.91956 AUTOZONE 4 26410.11157 AVERY DENNISON 3 9544.10158 AVIS BUDGET GROUP 5 1779.23859 AVNET 4 2658.75460 BAKER HUGHES A 2 10146.48961 BALL 3 23041.80562 BANK OF AMERICA 5 219059.17663 BANK OF NEW YORK MELLON 5 34735.92264 BAXTER INTL. 3 42991.57365 BECTON DICKINSON 3 70282.47166 BED BATH & BEYOND 4 1221.17767 BERKSHIRE HATHAWAY ’A’ 9 438125.49568 BERRY GLOBAL GROUP 3 5865.77569 BEST BUY 4 20974.69470 BIG LOTS 4 1309.53371 BIOGEN 3 44223.80972 BLACKSTONE GROUP A 5 40065.41073 BOEING 3 105540.12674 BOOKING HOLDINGS 5 66590.90875 BOOZ ALLEN HAMILTN.HLDG. 5 11006.08176 BORGWARNER 3 7096.920
Continued on next page
2

Table A1 – continued from previous page# Company Sector Market Cap (mil. USD)77 BOSTON SCIENTIFIC 3 52137.09578 BRISTOL MYERS SQUIBB 3 127638.32979 BRUNSWICK 3 4754.03780 BUILDERS FIRSTSOURCE 3 2516.46281 BURLINGTON STORES 4 13518.48282 CAESARS ENTERTAINMENT 7 8399.92683 CALUMET SPY.PRDS.PTNS. 3 211.26384 CAMPBELL SOUP 3 14848.36085 CAPITAL ONE FINL. 5 30992.95786 CARDINAL HEALTH 4 15711.78987 CARMAX 4 14952.33388 CASEY’S GENERAL STORES 4 5728.75989 CATERPILLAR 3 68986.36390 CBRE GROUP CLASS A 5 15305.34591 CDW 4 16644.10192 CELANESE 3 10252.81093 CENTENE 5 37191.69194 CENTERPOINT EN. 2 9690.07895 CENTURYLINK 5 11139.64796 CH ROBINSON WWD. 4 10465.92697 CHARLES SCHWAB 5 47209.43298 CHARTER COMMS.CL.A 5 110799.56999 CHEMOURS 3 2599.579100 CHEVRON 3 169204.275101 CHUBB 5 57751.155102 CIGNA 5 70622.960103 CINCINNATI FINL. 5 10157.833104 CINTAS 8 28110.203105 CISCO SYSTEMS 3 191354.464106 CIT GROUP 5 2237.843107 CITIGROUP 5 110169.280108 CITIZENS FINANCIAL GROUP 5 10814.793109 CLEVELAND CLIFFS 2 2232.216110 CLOROX 3 27408.236111 CMS ENERGY 2 16580.096112 CNX RESOURCES 2 1835.045113 COCA COLA 3 197650.900114 COGNIZANT TECH.SLTN.’A’ 5 29277.816115 COLGATE-PALM. 3 62834.927116 COMCAST A 5 178458.563117 COMMERCIAL MTLS. 3 2416.956118 COMMUNITY HEALTH SYSTEMS 6 360.872119 CONAGRA BRANDS 3 16341.410120 CONDUENT 5 527.896121 CONOCOPHILLIPS 2 46864.980122 CONSOLIDATED EDISON 2 23868.250123 CONSTELLATION BRANDS ’A’ 3 34725.404124 CORE MARK HOLDING 4 1116.331125 CORELOGIC n.a 3945.952126 CORNING 3 20317.311127 COSTCO WHOLESALE 4 132412.961128 COTY CL.A 3 3601.810
Continued on next page
3

Table A1 – continued from previous page# Company Sector Market Cap (mil. USD)129 CROWN HDG. 3 8710.211130 CSX 4 52044.026131 CUMMINS 3 25694.893132 CVR ENERGY 3 2242.838133 CVS HEALTH 4 84294.288134 D R HORTON 2 20379.930135 DANAHER 3 122279.176136 DARDEN RESTAURANTS 7 9126.615137 DAVITA 6 9689.648138 DCP MIDSTREAM UNIT 2 2693.706139 DEERE 3 48452.416140 DELEK US HOLDINGS 3 1396.834141 DELL TECHNOLOGIES C 3 36240.741142 DELTA AIR LINES 4 18744.661143 DEVON ENERGY 2 4952.697144 DICK’S SPORTING GOODS 4 3524.223145 DILLARDS ’A’ 4 611.879146 DISCOVER FINANCIAL SVS. 5 16457.541147 DISCOVERY SERIES A 5 14271.622148 DISH NETWORK ’A’ 5 18581.514149 DOLLAR GENERAL 4 47520.047150 DOLLAR TREE 4 21066.237151 DOMINION ENERGY 2 68583.592152 DOMTAR 3 1253.956153 DOVER 3 13660.571154 DTE ENERGY 2 19985.409155 DUKE ENERGY 2 60338.742156 DUPONT DE NEMOURS 3 38597.736157 DXC TECHNOLOGY 5 3915.390158 EASTMAN CHEMICAL 3 9439.762159 EATON n.a 35736.000160 EBAY 5 33932.354161 ECOLAB 3 56834.363162 EDISON INTL. 2 21036.222163 EL PASO ELEC. 4 2717.239164 ELI LILLY 3 144977.685165 EMCOR GROUP 2 3401.016166 EMERSON ELECTRIC 3 37031.519167 ENERGY TRANSFER (NYS) UNITS 4 21473.637168 ENTERGY 2 18919.306169 ENTERPRISE PRDS.PTNS.LP. 4 41748.785170 EOG RES. 2 30441.003171 ESTEE LAUDER COS.’A’ 3 68507.739172 EVERSOURCE ENERGY 2 28393.530173 EXELON 2 36569.527174 EXPEDIA GROUP 5 11569.052175 EXPEDITOR INTL.OF WASH. 4 12240.646176 EXXON MOBIL 3 194413.153177 FEDEX 4 35955.807178 FIDELITY NAT.FINANCIAL 5 9439.516179 FIRST AMER.FINL. 5 5617.851180 FIRSTENERGY 2 21117.559
Continued on next page
4
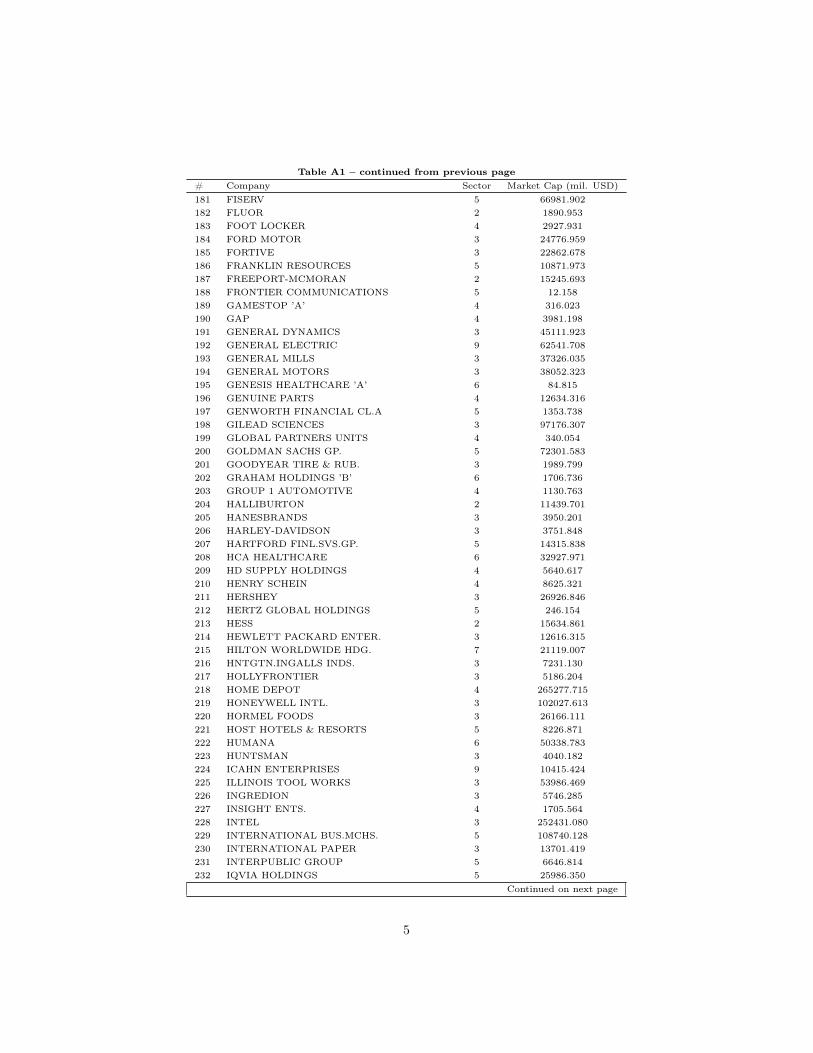
Table A1 – continued from previous page# Company Sector Market Cap (mil. USD)181 FISERV 5 66981.902182 FLUOR 2 1890.953183 FOOT LOCKER 4 2927.931184 FORD MOTOR 3 24776.959185 FORTIVE 3 22862.678186 FRANKLIN RESOURCES 5 10871.973187 FREEPORT-MCMORAN 2 15245.693188 FRONTIER COMMUNICATIONS 5 12.158189 GAMESTOP ’A’ 4 316.023190 GAP 4 3981.198191 GENERAL DYNAMICS 3 45111.923192 GENERAL ELECTRIC 9 62541.708193 GENERAL MILLS 3 37326.035194 GENERAL MOTORS 3 38052.323195 GENESIS HEALTHCARE ’A’ 6 84.815196 GENUINE PARTS 4 12634.316197 GENWORTH FINANCIAL CL.A 5 1353.738198 GILEAD SCIENCES 3 97176.307199 GLOBAL PARTNERS UNITS 4 340.054200 GOLDMAN SACHS GP. 5 72301.583201 GOODYEAR TIRE & RUB. 3 1989.799202 GRAHAM HOLDINGS ’B’ 6 1706.736203 GROUP 1 AUTOMOTIVE 4 1130.763204 HALLIBURTON 2 11439.701205 HANESBRANDS 3 3950.201206 HARLEY-DAVIDSON 3 3751.848207 HARTFORD FINL.SVS.GP. 5 14315.838208 HCA HEALTHCARE 6 32927.971209 HD SUPPLY HOLDINGS 4 5640.617210 HENRY SCHEIN 4 8625.321211 HERSHEY 3 26926.846212 HERTZ GLOBAL HOLDINGS 5 246.154213 HESS 2 15634.861214 HEWLETT PACKARD ENTER. 3 12616.315215 HILTON WORLDWIDE HDG. 7 21119.007216 HNTGTN.INGALLS INDS. 3 7231.130217 HOLLYFRONTIER 3 5186.204218 HOME DEPOT 4 265277.715219 HONEYWELL INTL. 3 102027.613220 HORMEL FOODS 3 26166.111221 HOST HOTELS & RESORTS 5 8226.871222 HUMANA 6 50338.783223 HUNTSMAN 3 4040.182224 ICAHN ENTERPRISES 9 10415.424225 ILLINOIS TOOL WORKS 3 53986.469226 INGREDION 3 5746.285227 INSIGHT ENTS. 4 1705.564228 INTEL 3 252431.080229 INTERNATIONAL BUS.MCHS. 5 108740.128230 INTERNATIONAL PAPER 3 13701.419231 INTERPUBLIC GROUP 5 6646.814232 IQVIA HOLDINGS 5 25986.350
Continued on next page
5

Table A1 – continued from previous page# Company Sector Market Cap (mil. USD)233 ITT 3 4758.582234 J M SMUCKER 3 12423.864235 JABIL 3 5050.541236 JACOBS ENGR. 2 11134.186237 JEFFERIES FINANCIAL GROUP 5 4084.129238 JETBLUE AIRWAYS 4 3074.665239 JOHNSON & JOHNSON 3 378933.732240 JOHNSON CONTROLS INTL. 3 25529.356241 JONES LANG LASALLE 5 5389.715242 JP MORGAN CHASE & CO. 5 297983.048243 KBR 2 3467.776244 KELLOGG 3 23226.174245 KELLY SERVICES ’A’ 5 593.984246 KEURIG DR PEPPER 3 40399.317247 KEYCORP 5 13021.665248 KIMBERLY-CLARK 3 49025.163249 KINDER MORGAN 4 35098.280250 KKR AND 5 17764.819251 KOHL’S 4 3509.644252 KROGER 4 25082.720253 L3HARRIS TECHNOLOGIES 3 39340.211254 LABORATORY CORP.OF AM. HDG. 6 15780.420255 LAM RESEARCH 3 45762.393256 LEAR 3 6658.268257 LEGG MASON 5 4416.299258 LEGGETT&PLATT 3 4486.829259 LEIDOS HOLDINGS 5 13735.632260 LENNAR ’A’ 2 18224.049261 LIBERTY GLOBAL CL.A 5 13860.496262 LINCOLN NATIONAL 5 7651.688263 LITHIA MOTORS ’A’ 4 3241.714264 LIVE NATION ENTM. 7 9835.382265 LKQ 4 7881.890266 LOCKHEED MARTIN 3 104378.024267 LOEWS 5 9774.080268 LOWE’S COMPANIES 4 101042.021269 M&T BANK 5 14244.680270 MACY’S 4 2130.532271 MAGELLAN HEALTH 5 1746.334272 MANITOWOC 3 386.150273 MANPOWERGROUP 5 4011.259274 MARATHON OIL 2 5026.387275 MARATHON PETROLEUM 3 24833.464276 MARKEL 5 12821.506277 MARRIOTT INTL.’A’ 7 29079.272278 MARSH & MCLENNAN 5 52423.787279 MASCO 3 12789.498280 MASTEC 2 3221.662281 MASTERCARD 5 297609.012282 MATTEL 3 3416.948283 MCDONALDS 7 138717.841284 MCKESSON 4 25403.514
Continued on next page
6

Table A1 – continued from previous page# Company Sector Market Cap (mil. USD)285 MDU RESOURCES GROUP 2 4247.062286 MEDTRONIC 3 125961.378287 MERCK & COMPANY 3 196627.483288 MERITOR 3 1437.324289 METLIFE 5 33871.211290 MGM RESORTS INTL. 7 8981.494291 MICHAELS COMPANIES 4 1007.805292 MICRON TECHNOLOGY 3 56532.415293 MICROSOFT 5 1479908.364294 MOHAWK INDUSTRIES 3 6625.137295 MOLINA HEALTHCARE 5 10641.200296 MOLSON COORS BEVERAGE COMPANY B 3 8290.381297 MONDELEZ INTERNATIONAL CL.A 3 75027.511298 MORGAN STANLEY 5 73945.554299 MOSAIC 3 0.000300 MOTOROLA SOLUTIONS 3 23618.952301 MRC GLOBAL 4 477.212302 MURPHY OIL 2 2322.023303 MYLAN 3 8353.867304 NATIONAL OILWELL VARCO 3 4557.738305 NAVISTAR INTL. 3 2722.441306 NCR 5 2277.396307 NETAPP 3 9777.663308 NEWELL BRANDS (XSC) 3 6730.467309 NEWMONT 2 45683.116310 NEWS ’A’ 5 6985.376311 NEXTERA ENERGY 2 118549.697312 NGL ENERGY PARTNERS 4 685.066313 NIKE ’B’ 3 148941.227314 NISOURCE 2 8792.904315 NOBLE ENERGY 2 4796.987316 NORFOLK SOUTHERN 4 43617.059317 NORTHERN TRUST 5 17197.581318 NORTHROP GRUMMAN 3 52121.276319 NORTONLIFELOCK 5 12257.688320 NRG ENERGY 2 8318.487321 NUCOR 3 12858.453322 O I GLASS 3 1360.605323 O REILLY AUTOMOTIVE 4 31336.582324 OCCIDENTAL PTL. 2 17739.358325 OLD REPUBLIC INTL. 5 4925.509326 OLIN 3 2033.123327 OMNICOM GROUP 5 11427.706328 ON SEMICONDUCTOR 3 7950.301329 ONEOK 2 15478.539330 ORACLE 5 171554.970331 OSHKOSH 3 5001.155332 OWENS & MINOR 4 462.477333 OWENS CORNING 3 5935.582334 PACCAR 3 25915.688335 PACKAGING CORP.OF AM. 3 9369.897336 PARKER-HANNIFIN 3 23456.094
Continued on next page
7
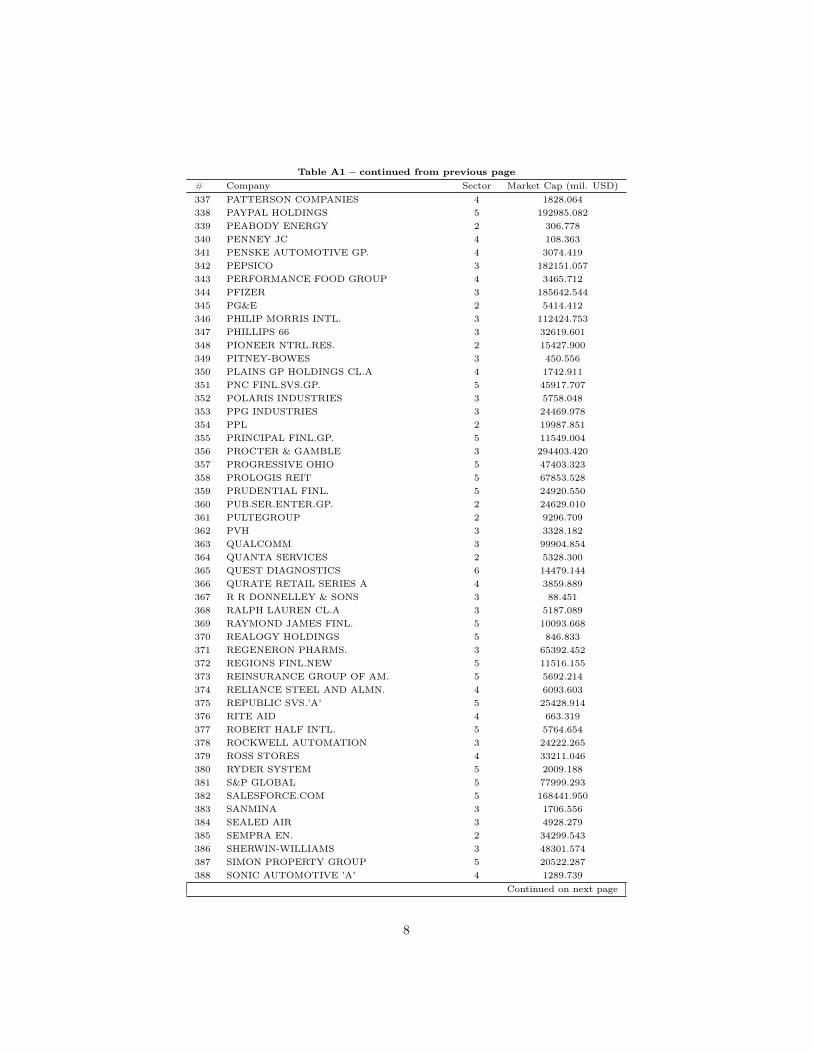
Table A1 – continued from previous page# Company Sector Market Cap (mil. USD)337 PATTERSON COMPANIES 4 1828.064338 PAYPAL HOLDINGS 5 192985.082339 PEABODY ENERGY 2 306.778340 PENNEY JC 4 108.363341 PENSKE AUTOMOTIVE GP. 4 3074.419342 PEPSICO 3 182151.057343 PERFORMANCE FOOD GROUP 4 3465.712344 PFIZER 3 185642.544345 PG&E 2 5414.412346 PHILIP MORRIS INTL. 3 112424.753347 PHILLIPS 66 3 32619.601348 PIONEER NTRL.RES. 2 15427.900349 PITNEY-BOWES 3 450.556350 PLAINS GP HOLDINGS CL.A 4 1742.911351 PNC FINL.SVS.GP. 5 45917.707352 POLARIS INDUSTRIES 3 5758.048353 PPG INDUSTRIES 3 24469.978354 PPL 2 19987.851355 PRINCIPAL FINL.GP. 5 11549.004356 PROCTER & GAMBLE 3 294403.420357 PROGRESSIVE OHIO 5 47403.323358 PROLOGIS REIT 5 67853.528359 PRUDENTIAL FINL. 5 24920.550360 PUB.SER.ENTER.GP. 2 24629.010361 PULTEGROUP 2 9296.709362 PVH 3 3328.182363 QUALCOMM 3 99904.854364 QUANTA SERVICES 2 5328.300365 QUEST DIAGNOSTICS 6 14479.144366 QURATE RETAIL SERIES A 4 3859.889367 R R DONNELLEY & SONS 3 88.451368 RALPH LAUREN CL.A 3 5187.089369 RAYMOND JAMES FINL. 5 10093.668370 REALOGY HOLDINGS 5 846.833371 REGENERON PHARMS. 3 65392.452372 REGIONS FINL.NEW 5 11516.155373 REINSURANCE GROUP OF AM. 5 5692.214374 RELIANCE STEEL AND ALMN. 4 6093.603375 REPUBLIC SVS.’A’ 5 25428.914376 RITE AID 4 663.319377 ROBERT HALF INTL. 5 5764.654378 ROCKWELL AUTOMATION 3 24222.265379 ROSS STORES 4 33211.046380 RYDER SYSTEM 5 2009.188381 S&P GLOBAL 5 77999.293382 SALESFORCE.COM 5 168441.950383 SANMINA 3 1706.556384 SEALED AIR 3 4928.279385 SEMPRA EN. 2 34299.543386 SHERWIN-WILLIAMS 3 48301.574387 SIMON PROPERTY GROUP 5 20522.287388 SONIC AUTOMOTIVE ’A’ 4 1289.739
Continued on next page
8

Table A1 – continued from previous page# Company Sector Market Cap (mil. USD)389 SOUTHERN 2 56609.786390 SOUTHWEST AIRLINES 4 20363.270391 SPARTANNASH 4 643.326392 SPECTRUM BRANDS HOLDINGS 3 1944.422393 SPIRIT AEROSYSTEMS CL.A 3 2866.564394 STANLEY BLACK & DECKER 3 20640.700395 STARBUCKS 7 88089.820396 STATE STREET 5 23017.948397 STEEL DYNAMICS 3 5714.724398 STRYKER 3 70237.067399 SYNCHRONY FINANCIAL 5 13874.735400 SYNNEX 4 5240.252401 SYSCO 4 27543.351402 T-MOBILE US 5 0.000403 TARGA RESOURCES 4 4804.525404 TARGET 4 60281.866405 TEGNA 5 2395.090406 TELEPHONE & DATA SYS. 5 2285.837407 TENET HEALTHCARE 6 2151.897408 TENNECO A 3 636.195409 TEREX 3 1368.570410 TESLA 3 185537.939411 TEXAS INSTRUMENTS 3 114616.036412 TEXTRON 3 7850.076413 THERMO FISHER SCIENTIFIC 3 139311.103414 THOR INDUSTRIES 3 6254.571415 TIMKEN 3 3313.420416 TJX 4 63056.250417 TOLL BROTHERS 2 4003.796418 TRACTOR SUPPLY 4 14762.497419 TRAVELCENTERS OF AM. 4 185.425420 TRAVELERS COS. 5 29470.545421 TRUIST FINANCIAL 3 53009.405422 TUTOR PERINI 2 615.348423 TWENTY FIRST CENTURY FOX A 5 0.000424 TYSON FOODS ’A’ 3 23032.319425 UGI 2 6702.038426 ULTA BEAUTY 4 11948.782427 UNION PACIFIC 4 113897.648428 UNISYS 5 732.971429 UNITED AIRLINES HOLDINGS 4 10699.521430 UNITED NATURAL FOODS 4 901.788431 UNITED PARCEL SER.’B’ 4 92916.765432 UNITED RENTALS 5 11204.417433 UNITED STATES STEEL 3 1381.748434 UNITEDHEALTH GROUP 5 276206.046435 UNIVAR SOLUTIONS 4 2854.426436 UNIVERSAL HEALTH SVS.’B’ 6 8212.763437 UNUM GROUP 5 3352.369438 US BANCORP 5 58549.457439 US FOODS HOLDING 4 4229.420440 V F 3 24655.215
Continued on next page
9

Table A1 – continued from previous page# Company Sector Market Cap (mil. USD)441 VALERO ENERGY 3 25750.243442 VERITIV 4 263.072443 VERIZON COMMUNICATIONS 5 232389.822444 VIACOMCBS B 5 14705.204445 VISA ’A’ 5 409197.461446 VISTEON 3 2029.002447 VISTRA 2 9688.510448 VOYA FINANCIAL 5 5867.918449 W R BERKLEY 5 10483.968450 WALGREENS BOOTS ALLIANCE 4 38711.727451 WALMART 4 339409.621452 WALT DISNEY 5 206546.602453 WASTE MANAGEMENT 5 42949.487454 WEC ENERGY GROUP 2 27780.319455 WELLS FARGO & CO 5 113159.932456 WESCO INTL. 4 1575.683457 WESTERN DIGITAL 3 13303.729458 WESTERN UNION 5 8879.653459 WESTROCK 3 7342.102460 WEYERHAEUSER 3 16938.875461 WHIRLPOOL 3 7900.304462 WILLIAMS-SONOMA 4 6659.279463 WORLD FUEL SVS. 4 1673.489464 WW GRAINGER 4 16201.319465 WYNDHAM DESTINATIONS 5 2568.517466 XCEL ENERGY 2 33616.184467 XEROX HOLDINGS 3 3472.972468 XPO LOGISTICS 5 7215.386469 YRC WORLDWIDE 4 66.119470 YUM! BRANDS 7 26565.022471 ZIMMER BIOMET HDG. 3 26102.563
10

B Growth Distribution
Figure B presents the distribution of the 2016-2019 LCA growth computed asspecified in Equation (4). As can be seen, growth distributes normally, withhigh frequency for values -1 and 0 (e.g., firms that went from some to noneLCAs between 2016 and 2019, and firms that experienced no growth whatsoever,respectively).
[Figure B1 about here.]
While the median of the distribution corresponds to the value 0 of the dis-tribution, the mean is -.036, and the 25th and 75th percentiles are -0.011 and 0,respectively. Table B1 shows that our results are robust to using the mean aswell as the 25th and 75th percentile as the value defining the two sub-samples.17
[Table B1 about here.]
17In fact, since the median and the 75th percentile both correspond to zero, the results forthe 75th percentile are the same as in the baseline specification.
11

Figure B1: CAARs by Growth Foreign Workers Hiring
01
23
4D
en
sity
−1 0 1 2CAGR3_LCAemp_pd
This figure plots the distribution of the 2016-2019 LCA growth computed as specified inEquation (4).
12

Table B1: Event Study for Sub-Samples of LCA Growth RatesDependent Variable: CAARs
(1) (2) (3) (4) (5) (6)25 25 mean mean 75 75
∆ -0.0032 -0.0026 -0.0032 -0.0027 -0.0030 -0.0024(0.001)*** (0.001)** (0.001)*** (0.001)* (0.001)*** (0.001)*
NL 172 172 164 164 176 176µL -0.002 -0.003 -0.002 -0.003 -0.003 -0.003NH 299 299 307 307 295 295µH -0.006 -0.005 -0.006 -0.005 -0.006 -0.005Sector FE N Y N Y N Y
The table reports ∆, the difference between sub-sample means of CAARs for firms with lower (L) andhigher (H) growth rate of LCA applications based on different moments of the growth distribution:Columns 1 and 2 use the 25th percentile (-0.011), Columns 3 and 4 use the mean (-0.036), and Columns5 and 6 use the 75th percentile (0). Sub-sample means (µ) and number of firms (N) belonging to eachsample L and H are also reported in each column. All columns are based on CAARs computed for thewindow of days [-1,1]. Results in odd columns are based on simple sub-sample means, while in evencolumns are based on within-sector sub-sample means, whereas sector is defined as the firms’ reported1-digit NAICS industry code. Robust standard errors are presented in parenthesis. Robust standarderrors are presented in parenthesis.∗p < 0.10,∗∗ p < 0.05,∗∗∗ p < 0.01
13

C Robustness for Different Growth Measures
Our results are robust to using all sort of different lengths and measures tocompute growth when it comes to measuring trends in reliance on foreign work-ers. In particular, we find our results to be robust when computing growthas CAGR or total growth for 1, 2 or 3 prior to 2019 and when using the to-tal (nominal) number of LCAs as opposed to share of all employees (thus, ourgrowth measure is indeed capturing changes in LCAs and not only on firm em-ployment). A summary of all these results are provided in Tables C1, C2, andC3 for windows [-1,1], [-1,3] and [-1,5], respectively. They all use the median ofthe corresponding growth rate to define the sub-samples.
[Table C1 about here.]
[Table C2 about here.]
[Table C3 about here.]
14

Table C1: Event Study by CAGR Foreign Workers Hiring, Window [-1,1])Growth Rate NH µH NL µL ∆2016-2019 CAGR LCA (share of emp) 140 -0.003 331 -0.005 -.00297***2016-2019 CAGR LCA (total) 140 -0.003 331 -0.005 -.0026***2016-2019 Tot. Growth LCA (share of emp) 140 -0.003 331 -0.005 -.00297***2016-2019 Tot. Growth LCA (total) 140 -0.003 331 -0.005 -.0026***2017-2019 CAGR LCA (share of emp) 140 -0.003 331 -0.005 -.00297***2017-2019 CAGR LCA (total) 140 -0.003 331 -0.005 -.002*2017-2019 Tot. Growth LCA (share of emp) 140 -0.003 331 -0.005 -.00297***2017-2019 Tot. Growth LCA (total) 140 -0.003 331 -0.005 -.002*2018-2019 Growth LCA (share of emp) 140 -0.003 331 -0.005 -.00338***2018-2019 Growth LCA (total) 140 -0.003 331 -0.005 -.00296***
The replicates the results of Table 3 using different ways to compute growth rates for LCAs to computesub-sample means µH and µL as well as the difference between them ∆. All estimations are based onCAARs computed over the window [-1,1]. Stars denote statistical significance based on robust standarderrors and p-values according to: *p <0.10, ââp <0.05, âââp <0.0
15
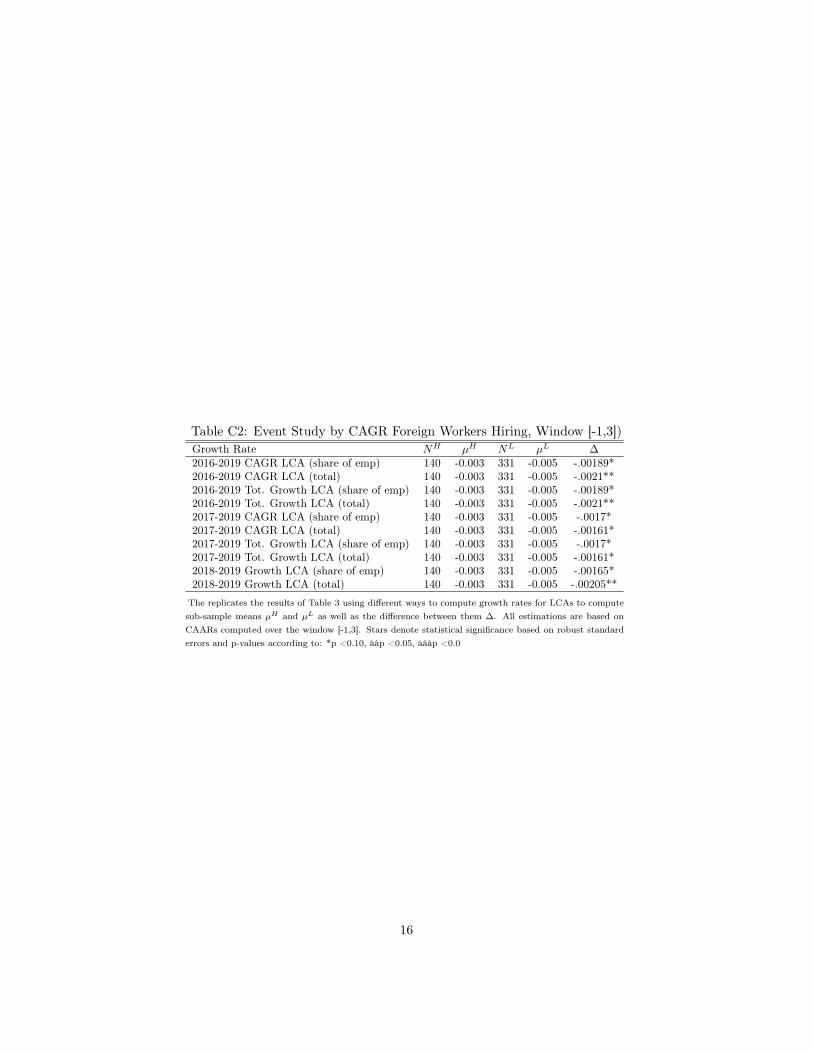
Table C2: Event Study by CAGR Foreign Workers Hiring, Window [-1,3])Growth Rate NH µH NL µL ∆2016-2019 CAGR LCA (share of emp) 140 -0.003 331 -0.005 -.00189*2016-2019 CAGR LCA (total) 140 -0.003 331 -0.005 -.0021**2016-2019 Tot. Growth LCA (share of emp) 140 -0.003 331 -0.005 -.00189*2016-2019 Tot. Growth LCA (total) 140 -0.003 331 -0.005 -.0021**2017-2019 CAGR LCA (share of emp) 140 -0.003 331 -0.005 -.0017*2017-2019 CAGR LCA (total) 140 -0.003 331 -0.005 -.00161*2017-2019 Tot. Growth LCA (share of emp) 140 -0.003 331 -0.005 -.0017*2017-2019 Tot. Growth LCA (total) 140 -0.003 331 -0.005 -.00161*2018-2019 Growth LCA (share of emp) 140 -0.003 331 -0.005 -.00165*2018-2019 Growth LCA (total) 140 -0.003 331 -0.005 -.00205**
The replicates the results of Table 3 using different ways to compute growth rates for LCAs to computesub-sample means µH and µL as well as the difference between them ∆. All estimations are based onCAARs computed over the window [-1,3]. Stars denote statistical significance based on robust standarderrors and p-values according to: *p <0.10, ââp <0.05, âââp <0.0
16

Table C3: Event Study by CAGR Foreign Workers Hiring, Window [-1,5])Growth Rate NH µH NL µL ∆2016-2019 CAGR LCA (share of emp) 140 0.001 331 -0.001 -.00171**2016-2019 CAGR LCA (total) 140 0.001 331 -0.001 -.00205**2016-2019 Tot. Growth LCA (share of emp) 140 0.001 331 -0.001 -.00171**2016-2019 Tot. Growth LCA (total) 140 0.001 331 -0.001 -.00205**2017-2019 CAGR LCA (share of emp) 140 0.001 331 -0.001 -.00122017-2019 CAGR LCA (total) 140 0.001 331 -0.001 -.00155*2017-2019 Tot. Growth LCA (share of emp) 140 0.001 331 -0.001 -.00122017-2019 Tot. Growth LCA (total) 140 0.001 331 -0.001 -.00155*2018-2019 Growth LCA (share of emp) 140 0.001 331 -0.001 -.001472018-2019 Growth LCA (total) 140 0.001 331 -0.001 -.00219**
The replicates the results of Table 3 using different ways to compute growth rates for LCAs to computesub-sample means µH and µL as well as the difference between them ∆. All estimations are based onCAARs computed over the window [-1,5]. Stars denote statistical significance based on robust standarderrors and p-values according to: *p <0.10, ââp <0.05, âââp <0.0
17

D Event studies for prior dates in 2020
An additional conservative test we perform is to make sure our estimates areindeed related to the context under consideration (the June 22 EO). In order todo so, we repeat the exercise of estimating the statistical difference in CAARsbetween firms with high vs. low CAGR in LCAs, referred to as ∆, for everytrading day between January 1st to June 15th of 2020, a week before the event.A summary of our results are presented in Figure D. Note that the figure alsoincludes the estimator for the EO of June 22 –the same result reported in themain body of the paper– for comparison purposes, using a diamond-shapedmarker.
The figure shows that for nearly 93% of the 114 trading days between Jan-uary 1st to June 15th of 2020, the estimates of ∆ are statistically insignificant.There are three exceptions. The first one is April 21 and 22, when there wasanother announcement by President Trump restricting immigration mostly inthe form of family reunification and other immigrant visas, which might as wellhave affected the firms in our sample. The second and third exceptions are May26 and 27, as well as June 4 and 6, with positive point estimates for ∆. In thosedates, however, the market experienced unusually large movements and there-fore more volatility is expected. Thus, this exercise reinforces our belief thatour main findings do reflect a market reaction to the EO under consideration,and not any idiosyncratic process that would be more frequent in the data.
[Figure D1 about here.]
18

Figure D1: Event studies for dates between January and June 2020
−.1
−.0
50
.05
.1∆
01jan2020 01feb2020 01mar2020 01apr2020 01may2020 01jun2020 01jul2020
June 22 2020 All Dates (Jan−Jun 2020)
This figure plots the results of the estimation of ∆ (as specified in footnote 14) using over100 dates, all business days between January 1st to June 15th of 2020, using a 3-day (-1to +1) window, each day represented by a round marker. The diamond-shaped markerrepresents the baseline result of the EO of June 22 reported in the main body of the paper,for comparison purposes. Whiskers represent 95% confidence intervals using robust standarderrors.
19