An Examination Of The Relationship Between Marzano's ...
156
University of Central Florida University of Central Florida STARS STARS Electronic Theses and Dissertations, 2004-2019 2013 An Examination Of The Relationship Between Marzano's Causal An Examination Of The Relationship Between Marzano's Causal Teacher Evaluation Model And Student Achievement At Nine High Teacher Evaluation Model And Student Achievement At Nine High Schools In A Large Suburban School District In Central Florida Schools In A Large Suburban School District In Central Florida Dana Jacobson University of Central Florida Part of the Educational Leadership Commons Find similar works at: https://stars.library.ucf.edu/etd University of Central Florida Libraries http://library.ucf.edu This Doctoral Dissertation (Open Access) is brought to you for free and open access by STARS. It has been accepted for inclusion in Electronic Theses and Dissertations, 2004-2019 by an authorized administrator of STARS. For more information, please contact [email protected]. STARS Citation STARS Citation Jacobson, Dana, "An Examination Of The Relationship Between Marzano's Causal Teacher Evaluation Model And Student Achievement At Nine High Schools In A Large Suburban School District In Central Florida" (2013). Electronic Theses and Dissertations, 2004-2019. 2643. https://stars.library.ucf.edu/etd/2643
Transcript of An Examination Of The Relationship Between Marzano's ...

University of Central Florida University of Central Florida
STARS STARS
Electronic Theses and Dissertations, 2004-2019
2013
An Examination Of The Relationship Between Marzano's Causal An Examination Of The Relationship Between Marzano's Causal
Teacher Evaluation Model And Student Achievement At Nine High Teacher Evaluation Model And Student Achievement At Nine High
Schools In A Large Suburban School District In Central Florida Schools In A Large Suburban School District In Central Florida
Dana Jacobson University of Central Florida
Part of the Educational Leadership Commons
Find similar works at: https://stars.library.ucf.edu/etd
University of Central Florida Libraries http://library.ucf.edu
This Doctoral Dissertation (Open Access) is brought to you for free and open access by STARS. It has been accepted
for inclusion in Electronic Theses and Dissertations, 2004-2019 by an authorized administrator of STARS. For more
information, please contact [email protected].
STARS Citation STARS Citation Jacobson, Dana, "An Examination Of The Relationship Between Marzano's Causal Teacher Evaluation Model And Student Achievement At Nine High Schools In A Large Suburban School District In Central Florida" (2013). Electronic Theses and Dissertations, 2004-2019. 2643. https://stars.library.ucf.edu/etd/2643

AN EXAMINATION OF THE RELATIONSHIP
BETWEEN MARZANO‟S CAUSAL TEACHER EVALUATION MODEL
AND STUDENT ACHIEVEMENT AT NINE HIGH SCHOOLS
IN A LARGE SUBURBAN SCHOOL DISTRICT
IN CENTRAL FLORIDA
by
DANA KAYE JACOBSON
B.A. University of Florida, 2001
M.Ed. Stetson University, 2006
A dissertation submitted in fulfillment of the requirements
for the Degree of Doctor of Education
in the School of Teaching, Learning, & Leadership
in the College of Education and Human Performance
at the University of Central Florida
Orlando, FL
Summer Term
2013
Major Professor: Kenneth Murray

ii
© 2013 Dana Kaye Jacobson

iii
ABSTRACT
This study focused on the relationship between student achievement and teacher
evaluation during the first year of implementation of the Marzano Causal Teacher
Evaluation model in a large suburban school district in Central Florida. The population
included high school level teachers and students. Teacher evaluation and performance
data were collected and analyzed for relationships using Spearman Rho and Chi-Square
Analysis. Variables reviewed included: (a) Marzano‟s Causal Teacher Evaluation Model
iObservation© protocol, (b) categorized teacher years of experience, (c) student growth
scores based on a teacher‟s student success on statewide assessments as calculated using
VAM or an administered pre- and posttest, (d) school reported teacher demographics on
school improvement plans and (e) historical 9th
- and 10th
-grade student achievement data
on FCAT 2.0 Reading and 9th
- grade student achievement data on the Algebra 1 End-of-
Course (EOC) Examinations.

iv
I dedicate this dissertation to my Family and Friends.
To my Family: Jim, my soul mate, with you everything is possible and love
knows no end; Lilianna, you are the most beautiful gift from Heaven and I am thankful
for the joy you bring to my world everyday; Mom and Dad, you have been an island,
through every storm and rainbow, every year is a “good” year because I share it with you;
Jake and Kris, you are so far away, but you are always near in heart; Ok and Rich, I
sometimes wonder what adventure you are on, but I know that no matter where you are
or what time of day, you are only a text message, phone, or plane ride away; Rick and
Dianne, Wow! Where would I begin…1991? Every minute you told me I could and
never let me second guess myself, there isn‟t enough space…; Amber, my God Daughter,
you are a smart, creative and lovely young woman now. I hope you take the world and
own it! Chris and Kristen Bella, baby?; Nick and Kristen Kaye, “Omigah”; Omar and
Grace, NY is cold, but is perfect for you two—visit soon; Eric, you‟ve shown me that we
can fly the plane when it‟s being built in the air, “Thanks Genius”; Amy, I feel like we‟re
related now and it makes me smile; Ellen, thank you for keeping me focused on my
learning and not working out of my car; Robert, Jessie, Rene, Ashley, Juan and Marc
“Yeahhh!”, and George, you‟ve helped keep me young after all of these years of
schooling…Good Work! You get an honorary degree in my book.
To my Friends: Secondary Literacy Coaches, and my special “PEEPS”-Amy,
Janet, Rob, and Nicole, we‟ve built a special bond that I know will last a lifetime. Thank
you to all my family and friends for being in my life and helping me see everything I
have been capable of accomplishing. For all of you, I am eternally grateful.

v
ACKNOWLEDGMENTS
I would like to say thank you to my committee members: Dr. Kenneth Murray,
Dissertation Advisor; Dr. Barbara Murray, Member; Dr. Walt Doherty, Member; and Dr.
Haiyan Bai, Member for their guidance and support. Thank you also to Dr. Mary Ann
Lynn, Editor; Dr. Elayne Reiss, Statistics Advisor; and Ms. Terry Sypolt, Research
Librarian for their input and time with this process.
Thank you to the School District of Osceola County, Florida for assisting with
determining a focus for study and supporting the process in the district: Mrs. Melba
Luciano, Superintendent; Mrs. Pamela Tapley, Assistant Superintendent; Mr. Mark
Munas, Assistant Superintendent; Ms. Virginia Costa, Director of Student Success &
Instructional Improvement; Mr. Art Tweedie, Program Specialist for Research and
Evaluation.
I would also extend my gratitude to my GHS family: Mr. Larry Meadows, Dr.
Leigh Anne Cooley, Mr. Brad Liville, Ms. Georgette Paul-Zin, Mr. Rolando Casado, Mr.
Eric Saltsman, and the Reading and Language Arts Departments (Abby, Amanda,
Barbara, Bill, Christine, Dory, Edwina, Elizabeth, Elsa, Felicidad, Gail, Ginnee, Heidi,
Ileana, Kay, Laila, Lamar, Luiz, Maggie, Mayra, Michelle Gi., Michelle Gl., Nilda,
Paula, Paulette, Rebecca, and Shirley) for their unending support and patience.
Thank you to all who have taken this journey before me and those that will come
after. This certainly could not have been completed without the support and friendships
I‟ve gained by being part of the Executive Educational Leadership Ed.D. Cohort 1 at
UCF from 2010-2013. “We Did Do This!”

vi
TABLE OF CONTENTS
LIST OF FIGURES ........................................................................................................... ix
LIST OF TABLES ...............................................................................................................x
LIST OF ABBREVIATIONS ........................................................................................... xii
CHAPTER 1 THE PROBLEM AND ITS CLARIFYING COMPONENTS .....................1 Introduction ..............................................................................................................1
Statement of the Problem .........................................................................................1 Purpose of the Study ................................................................................................2 Significance of the Study .........................................................................................3
Definition of Terms..................................................................................................3 Research Questions and Hypotheses .......................................................................7
Theoretical and Conceptual Framework ..................................................................8 Research Design.....................................................................................................10 Procedures ..............................................................................................................12
Limitations .............................................................................................................13 Delimitations ..........................................................................................................13
Organization of the Study ......................................................................................14
CHAPTER 2 REVIEW OF THE LITERATURE ............................................................16
Introduction ............................................................................................................16 Reform Efforts .......................................................................................................16
A Nation at Risk.........................................................................................18 Common Core Standards and Student Assessment ...................................21
Legislative Efforts ..................................................................................................25
Elementary and Secondary Education Act (ESEA) ...................................25 No Child Left Behind (NCLB) ..................................................................26 American Recovery and Reinvestment Act (ARRA) ................................27 Teacher Tenure and Reduction in Force ....................................................32
Educational Policies ...............................................................................................36 Performance Evaluations and Systems ..................................................................44
The Evaluation of Teacher Performance ...................................................44
Changes in Teacher Performance Evaluation Systems ..............................48 Florida‟s Model Evaluation Systems .........................................................50 The Impact of Teachers on Student Achievement .....................................56
Summary ................................................................................................................60
CHAPTER 3 METHODOLOGY .....................................................................................62 Introduction ............................................................................................................62 Purpose of the Study ..............................................................................................62
Research Questions and Hypotheses .....................................................................62

vii
Population ..............................................................................................................64 Instrumentation ......................................................................................................72
Instructional Practice Score .......................................................................72 Student Growth Score ................................................................................73
Teachers‟ Years of Experience ..................................................................75 The Final Teacher Evaluation Score ..........................................................77 Reading FCAT 2.0 .....................................................................................77 Algebra 1 End-of-Course (EOC) Examination ..........................................78
Data Collection ......................................................................................................79
Data Analysis .........................................................................................................81 Summary ................................................................................................................82
CHAPTER 4 PRESENTATION AND ANALYSIS OF DATA ......................................84
Introduction ............................................................................................................84 Descriptive Statistics ..............................................................................................84 Testing the Research Questions and Hypotheses...................................................90
Research Question 1 ..................................................................................90 Research Question 2 ..................................................................................92
Research Question 3 ..................................................................................95 Research Question 4 ..................................................................................98
Additional Analysis .............................................................................................101
Summary ..............................................................................................................102
CHAPTER 5 SUMMARY, DISCUSSION, AND CONCLUSIONS .............................103
Introduction ..........................................................................................................103 Purpose of the Study ............................................................................................103
Summary of the Study .........................................................................................103 Research Question 1 ................................................................................105
Research Question 2 ................................................................................105 Research Question 3 ................................................................................106
Research Question 4 ................................................................................106 Implications for Practice ......................................................................................107 Recommendations for Further Research ..............................................................109 Conclusion ...........................................................................................................110
APPENDIX A APPROVALS TO CONDUCT RESEARCH ......................................112
APPENDIX B FLORIDA OUTLINE OF TEACHER EVALUATION MODELS ....116
APPENDIX C MARZANO TEACHER EVALUATION LEARNING MAP ............118
APPENDIX D REQUEST AND PERMISSION TO USE MARZANO MODEL ......121
APPENDIX E SAMPLE STUDENT LEARNING GROWTH VALUE
COMPUTATION ............................................................................................................124

viii
APPENDIX F INSTRUCTIONAL STAFF RATINGS BY SCHOOL ........................126
LIST OF REFERENCES .................................................................................................132

ix
LIST OF FIGURES
Figure 1. Teachers‟ years of experience by category ...................................................... 89
Figure 2. Scatterplot of Grade 9 Florida Comprehensive Assessment Test (FCAT) 2.0
Reading and instructional practice mean scores ............................................................... 91
Figure 3. Scatterplot of Grade 10 Florida Comprehensive Assessment Test (FCAT) 2.0
Reading and instructional practice mean scores ............................................................... 94
Figure 4. Scatterplot of Grade 9 Algebra 1 End-of-Course (EOC) mean scores and
instructional practice scores .............................................................................................. 97
Figure 5. All Schools: Teachers' effectiveness for instructional practice and student
growth. ............................................................................................................................ 127
Figure 6. School A: Teachers' effectiveness for Instructional Practice and Student
Growth ............................................................................................................................ 127
Figure 7 School B: Teachers' effectiveness for instructional practice and student growth
......................................................................................................................................... 128
Figure 8. School C: Teachers' effectiveness for instructional practice and student growth
......................................................................................................................................... 128
Figure 9. School D: Teachers' effectiveness for instructional practice and student growth
......................................................................................................................................... 129
Figure 10. School E: Teachers' effectiveness for instructional practice and student
growth ............................................................................................................................. 129
Figure 11. School F: Teachers' effectiveness for instructional practice and student
growth ............................................................................................................................. 130
Figure 12. School G: Teachers' effectiveness for instructional practice and student
growth ............................................................................................................................. 130
Figure 13. School H: Teachers' effectiveness for instructional practice and student
growth ............................................................................................................................. 131
Figure 14. School I: Teachers' effectiveness for instructional practice and student
growth. ............................................................................................................................ 131

x
LIST OF TABLES
Table 1 Literature Review Sources: Reform Efforts Related to Teacher Evaluation and
Student Achievement ......................................................................................................... 24
Table 2 Literature Review Sources: Legislation Related to Teacher Evaluation and
Student Achievement ......................................................................................................... 36
Table 3 Literature Review Sources: Educational Policies Related to Teacher
Evaluation and Student Achievement................................................................................ 59
Table 4 Student Demographics for Florida Comprehensive Assessment Test (FCAT) 2.0
Grade 9 Reading (N = 4,021) ........................................................................................... 66
Table 5 Student Demographics for Florida Comprehensive Assessment Test (FCAT) 2.0
Grade 10 Reading (N = 3,572) ......................................................................................... 67
Table 6 Student Demographics for Grade 9 Algebra 1 End-of-Course (EOC)
Examinations (N = 2,305) ................................................................................................ 68
Table 7 Teacher Demographics: All High Schools (N = 896) ...................................... 70
Table 8 Student Growth Score Calculations for Classroom Teachers in Content Areas
Not Assessed on Statewide Assessments ........................................................................... 74
Table 9 Categories: Teachers' Years of Experience ...................................................... 75
Table 10 Schedule of Administrator Observations for Teachers by Categories ............ 76
Table 11 Florida Comprehensive Assessment Tests (FCAT) 2.0 Reading Developmental
Scale Scores (178-302) ..................................................................................................... 78
Table 12 Algebra 1 End-of-Course Assessment Scale Scores (325-475) ....................... 79
Table 13 Student Mean Developmental Scale Scores for Florida Comprehensive
Assessment Test (FCAT) 2.0 Grade 9 Reading by Ethnicity, Gender, ESE, and ELL ...... 85
Table 14 Student Mean Developmental Scale Score for Florida Comprehensive
Assessment Test (FCAT) 2.0 Grade 10 Reading by Ethnicity, Gender, ESE, and ELL .... 86
Table 15 Student Mean Developmental Scale Score for Algebra 1 End-of-Course (EOC)
Examination Grade 9 by Ethnicity, Gender, ESE, and ELL ............................................. 87
Table 16 Teacher Demographics Across the Nine High Schools in the Study ............... 88
Table 17 Individual Teacher Student Growth Score and Instructional Practice ........... 88

xi
Table 18 Spearman's Rho Analysis for Instructional Practice and Grade 9 Florida
Comprehensive Assessment Test (FCAT) 2.0 Reading Mean Scores ............................... 92
Table 19 Spearman's Rho Analysis for Instructional Practice and Grade 10 Florida
Comprehensive Assessment Test (FCAT) 2.0 Reading Mean Scores ............................... 95
Table 20 Spearman's Rho Analysis for Instructional Practice and Grade 9 Algebra 1
End-of-Course (EOC) Examination Mean Scores ............................................................ 98
Table 21 Chi-Square Analysis for Instructional Practice and Teachers by Category (N
= 955) ............................................................................................................................. 100
Table 22 Chi-Square Analysis for Instructional Practice and Student Growth (N = 954)
......................................................................................................................................... 101
xii
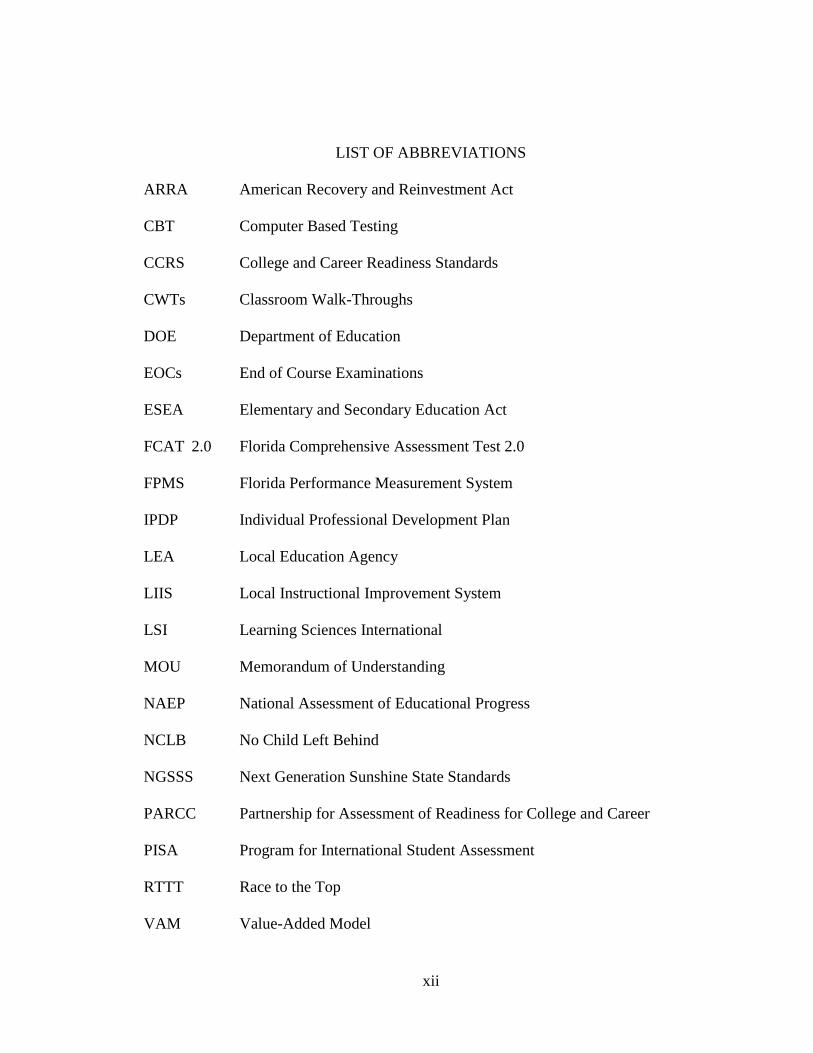
LIST OF ABBREVIATIONS
ARRA American Recovery and Reinvestment Act
CBT Computer Based Testing
CCRS College and Career Readiness Standards
CWTs Classroom Walk-Throughs
DOE Department of Education
EOCs End of Course Examinations
ESEA Elementary and Secondary Education Act
FCAT 2.0 Florida Comprehensive Assessment Test 2.0
FPMS Florida Performance Measurement System
IPDP Individual Professional Development Plan
LEA Local Education Agency
LIIS Local Instructional Improvement System
LSI Learning Sciences International
MOU Memorandum of Understanding
NAEP National Assessment of Educational Progress
NCLB No Child Left Behind
NGSSS Next Generation Sunshine State Standards
PARCC Partnership for Assessment of Readiness for College and Career
PISA Program for International Student Assessment
RTTT Race to the Top
VAM Value-Added Model

1
CHAPTER 1
THE PROBLEM AND ITS CLARIFYING COMPONENTS
Introduction
Educational researchers have been looking at defining the relationships between
teacher effectiveness and student achievement for the past five decades. Unfortunately,
even with extensive research, little has been found to solidify the relationship between
student achievement and teacher effectiveness (Jackson & Lunenburg, 2010).
Further, legislative initiatives at the national and state levels have become the
guiding foundation for changes to the systems of teacher evaluation and accountability
for student achievement (U.S. Department of Education, 2009; Education Personnel,
Florida, SB736, 2011a). Due to these changes during the 2011-2012 academic year,
Florida school districts implemented new teacher evaluation models as required by
legislation. The school district, under examination in this research chose to use the
Marzano Causal Teacher Evaluation Model as the primary system to evaluate teachers.
With limited information about the implementation of this model, the school district and
the researcher agreed to investigate the relationships between the Marzano Causal
Teacher Evaluation model and student achievement at the high school level during the
first year of implementation within the school district.
Statement of the Problem
At the time of the study, there was limited research on the implementation phase
of new teacher evaluation models required by recent legislation as they related to student

2
achievement within Florida school districts. This study was aimed at providing further
understanding of the foundational changes to the system of teacher evaluation.
At the high school level, there has been a lack of consistency in teacher use of
strategies and practices across varying content areas (Phillips, 2010). This has made it
difficult to decipher which teacher characteristics are important when predicting how a
student will perform on standardized tests (Phillips, 2010; Strong, Ward, & Grant, 2011).
Teacher performance is multidimensional and includes how a teacher plans learning
activities, communicates and provides productive feedback to students, and maintains a
positive classroom environment (Florida Rule 6A-5.065 (2), 2012). Due to this,
specialized knowledge does not automatically translate to effective classroom
performance, and it is necessary to assess not only what teachers know but what they can
do in their classrooms (Hinchey, 2010).
Purpose of the Study
The purpose of this study was to examine the initial year of implementation of the
Marzano Causal Teacher Evaluation Model tool as it related to student achievement in a
large suburban school district in Central Florida. The researcher collected data from the
2011-2012 academic year to help understand to what extent, if any, there was a
relationship between teacher performance as measured by this model, teachers‟ years of
experience and student achievement. Data used in this study included high school level
teacher evaluation and performance data collected by administrators through (a)
Marzano‟s Causal Teacher Evaluation Model iObservation© protocol, (b) categorized

3
teacher years of experience, (c) student growth score based on a teacher‟s student
success on statewide assessments as calculated using VAM or an administered pre- and
posttest, (d) school reported teacher demographics on school improvement plans and (e)
historical 9th
- and 10th
-grade student achievement data on FCAT 2.0 Reading and 9th
-
grade student achievement data on Algebra 1 End-of-Course Examinations.
Significance of the Study
Understanding the preliminary implementation of a new model for teacher
evaluation was important. Although this study was specific to the nine high schools and
students within the district reviewed and may not be generalized to a different population,
it did identify trends in teacher effectiveness ratings as they relate to student achievement.
Information gleaned from this study may contribute to the identification of trends and
norms related to teacher performance and administrative observations of teachers. It may
further shed light on the process of implementing a new system of teacher evaluation in a
large suburban school district.
Definition of Terms
The following definitions are applicable to understanding the context of this
study.
Brick and Mortar Schools. School buildings that are tangible, “having physical
building and facilities,” (para. 1) to provide learning to students through direct contact
(Dictionary.com, 2012).
4
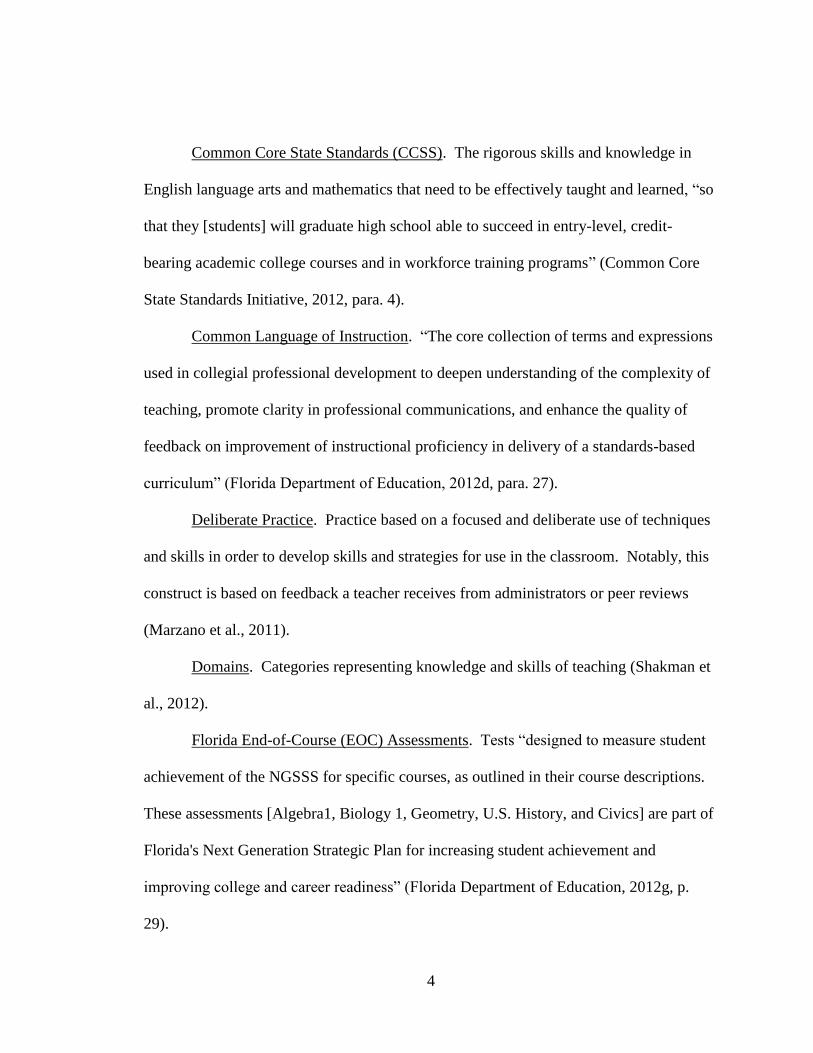
Common Core State Standards (CCSS). The rigorous skills and knowledge in
English language arts and mathematics that need to be effectively taught and learned, “so
that they [students] will graduate high school able to succeed in entry-level, credit-
bearing academic college courses and in workforce training programs” (Common Core
State Standards Initiative, 2012, para. 4).
Common Language of Instruction. “The core collection of terms and expressions
used in collegial professional development to deepen understanding of the complexity of
teaching, promote clarity in professional communications, and enhance the quality of
feedback on improvement of instructional proficiency in delivery of a standards-based
curriculum” (Florida Department of Education, 2012d, para. 27).
Deliberate Practice. Practice based on a focused and deliberate use of techniques
and skills in order to develop skills and strategies for use in the classroom. Notably, this
construct is based on feedback a teacher receives from administrators or peer reviews
(Marzano et al., 2011).
Domains. Categories representing knowledge and skills of teaching (Shakman et
al., 2012).
Florida End-of-Course (EOC) Assessments. Tests “designed to measure student
achievement of the NGSSS for specific courses, as outlined in their course descriptions.
These assessments [Algebra1, Biology 1, Geometry, U.S. History, and Civics] are part of
Florida's Next Generation Strategic Plan for increasing student achievement and
improving college and career readiness” (Florida Department of Education, 2012g, p.
29).

5
The Florida Comprehensive Assessment Test® 2.0 (FCAT 2.0). A test which
measures student achievement in the reading standards in the NGSSS. (Florida
Department of Education, 2012h).
Halo Effect. “An effect whereby the perception of positive qualities in one thing
or part gives rise to the perception of similar qualities in related things or in the whole”
(The American Heritage Dictionary, 2009, para.1).
Individual Professional Development Plan. A plan that is required by Florida
Statute for all instructional employees. “During the 2011-2012 school year, this plan was
used for calculating the student growth component of the summative evaluation for
eligible instructional employees” (School District of Osceola County [SDOC], 2012b).
Instructional Practice Score. A score reported for an individual teacher in the
iObservation© system. Scores are derived from formal, informal, and walkthrough
observations and prior to entering student growth data (Learning Sciences International
[LSI], 2011). For the purpose of this study, school score was defined as the mean of the
teacher performance score on Marzano‟s Teacher Evaluation Model.
iObservation© Protocol. A protocol used by administrators during teacher
observations using the Marzano Causal Teacher Evaluation Model (School District of
Osceola County, 2011).
Marzano Causal Teacher Evaluation Model. A model based on meta-analytic
studies (Marzano, 2007). It is considered a growth model for teacher improvement and
one of the models suggested for use in Florida school districts by the State of Florida
(Florida Department of Education, 2012e). Using this model, when a teacher is observed,

6
administrators note a level of teacher performance as innovative, applying, developing,
beginning, or not using (LSI, 2011).
Next Generation Sunshine State Standards (NGSSS). The “content knowledge
and skills that K-12 Florida public school students are expected to learn in language arts,
mathematics, science, social studies, visual and performing arts, physical education,
health, and foreign languages,” (Florida Department of Education, 2012e, p. 25).
Race to the Top (RTTT). A competitive federal grant program established by
President Barack Obama to support educational reforms in the United States that include
accountability for students and teachers (U.S. Department of Education, 2009).
Teacher Effectiveness. The “extent to which teacher practice is aligned with
research on effective teaching” based on assessments of teachers‟ use of strategies and
principles of teaching that affect student achievement (Craig et al., 2005, p. 8). This term
was used synonymously with teacher performance.
Teacher Performance. Behaviors of teachers that have been determined, by
research and theory, to be linked to student achievement (Henemann & Milanowski,
2004). This term was used synonymously with teacher effectiveness.
Value-added Measure (Assessment). An assessment that is based on statistical
measures used in conjunction with administrative observations of teachers to determine
the level of teacher influence as indicated by student achievement results (Corcoran,
2010). In this study, this term was used synonymously with “value-added assessment.”

7
Research Questions and Hypotheses
The following four research questions and corresponding null hypotheses were
used to guide this study.
1. To what extent, if any, is there a relationship between 9th
-grade high school mean
student developmental scale scores on FCAT 2.0 Reading and the school-wide
mean instructional practice score of teacher performance as measured by
Marzano's Causal Teacher Evaluation at nine high schools in a large suburban
school district?
H01. There is no statistically significant relationship between 9th
-grade high school
mean student developmental scale scores on FCAT 2.0 Reading and the school-
wide mean instructional practice score of teacher performance as measured by
Marzano's Causal Teacher Evaluation at nine high schools in a large suburban
school district?
2. To what extent, if any, is there a relationship between 10th
-grade high school
mean student developmental scale scores on FCAT 2.0 Reading and the school-
wide mean instructional practice score of teacher performance as measured by
Marzano's Causal Teacher Evaluation at nine high schools in a large suburban
school district?
H02. There is no statistically significant relationship between 10th
-grade high
school mean student developmental scale scores on FCAT 2.0 Reading and the
school-wide mean instructional practice score of teacher performance as

8
measured by Marzano's Causal Teacher Evaluation at nine high schools in a large
suburban school district?
3. To what extent, if any, is there a relationship between 9th
-grade high school mean
student developmental scale scores on End-of-Course Algebra 1 assessments and
the school-wide mean instructional practice score of teacher performance as
measured by Marzano's Causal Teacher Evaluation at nine high schools in a large
suburban school district?
H03. There is no statistically significant relationship between 9th
-grade high
school mean student developmental scale scores on End-of-Course Algebra 1
assessments and the school-wide mean instructional practice score of teacher
performance as measured by Marzano's Causal Teacher Evaluation at nine high
schools in a large suburban school district?
4. Which of the variables, Student Growth Score or Teacher Years of Experience,
has the strongest relationship with a teacher‟s instructional practice score?
H04. Neither student growth score nor teacher years of experience has a
relationship with a teacher‟s instructional practice score.
Theoretical and Conceptual Framework
The framework for this study was based on systems theory and the use of
assessment and indicators to determine performance (Owens, 2004). With the many
changes to the teacher evaluation system that have occurred at the national, state, and
local levels over the years, identifying system changes and patterns has been relevant and
9
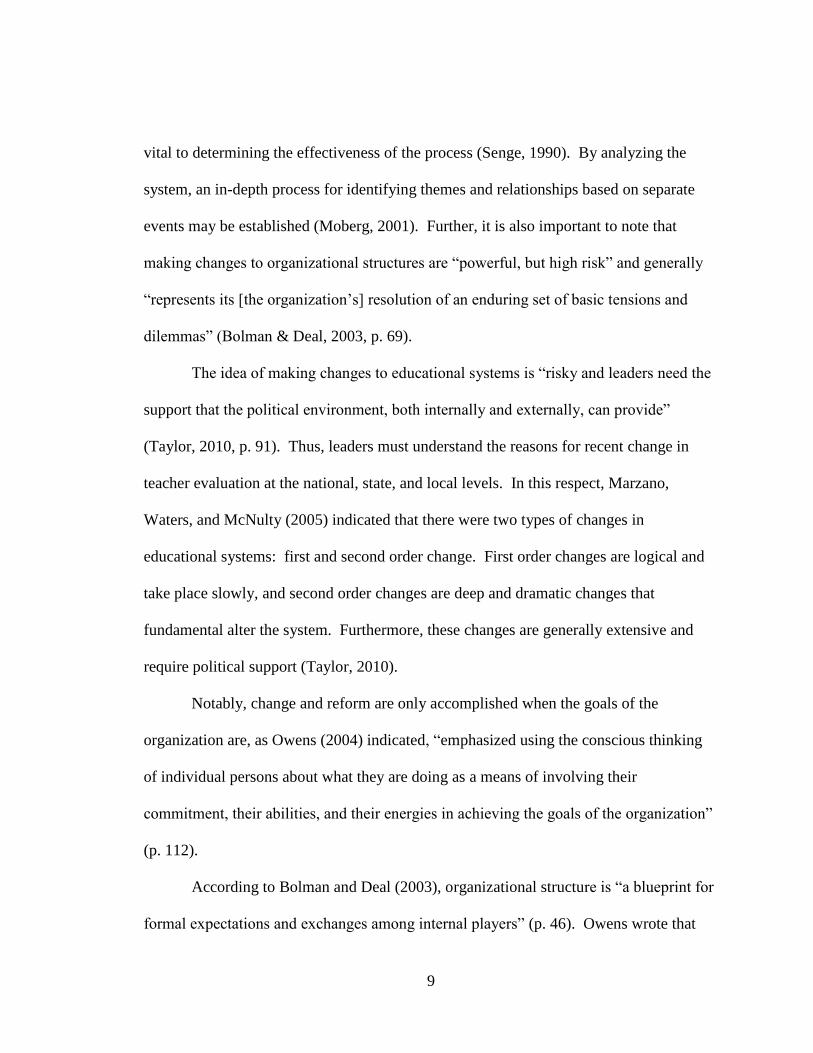
vital to determining the effectiveness of the process (Senge, 1990). By analyzing the
system, an in-depth process for identifying themes and relationships based on separate
events may be established (Moberg, 2001). Further, it is also important to note that
making changes to organizational structures are “powerful, but high risk” and generally
“represents its [the organization‟s] resolution of an enduring set of basic tensions and
dilemmas” (Bolman & Deal, 2003, p. 69).
The idea of making changes to educational systems is “risky and leaders need the
support that the political environment, both internally and externally, can provide”
(Taylor, 2010, p. 91). Thus, leaders must understand the reasons for recent change in
teacher evaluation at the national, state, and local levels. In this respect, Marzano,
Waters, and McNulty (2005) indicated that there were two types of changes in
educational systems: first and second order change. First order changes are logical and
take place slowly, and second order changes are deep and dramatic changes that
fundamental alter the system. Furthermore, these changes are generally extensive and
require political support (Taylor, 2010).
Notably, change and reform are only accomplished when the goals of the
organization are, as Owens (2004) indicated, “emphasized using the conscious thinking
of individual persons about what they are doing as a means of involving their
commitment, their abilities, and their energies in achieving the goals of the organization”
(p. 112).
According to Bolman and Deal (2003), organizational structure is “a blueprint for
formal expectations and exchanges among internal players” (p. 46). Owens wrote that

10
according to classical organizational theorists such as Weber, Fayol, and Taylor, internal
hierarchies and issues of task management must be acknowledged and adjusted based on
“the needs of large and complex enterprises that perform services for large numbers of
clients” (Owens, 2004, p. 86). Open model systems, as outlined in conceptual terms by
Owens (2004), explained that school social systems were formed through organizational
and individual behaviors which have a direct or indirect relationship with one another
toward a specific goal or goals.
In this vein, Senge (1990) discussed systems thinking:
Systems thinking required the disciplines of building shared vision, mental
models, team learning, and personal mastery to realize its potential. Building
shared vision fosters a commitment to the long term. Mental models focus on the
openness needed to unearth shortcomings in our present ways of seeing the world.
Team learning develops the skills of groups of people to look for the larger
picture beyond individual perspectives. And personal mastery fosters the
personal motivation to continually learn how our actions affect our world (p. 12).
Research Design
A quantitative methodology and non-experimental design were chosen for this
study because the researcher was investigating the relationship between two or more
variables. These variables included, but were not limited to: (a) student growth scores
received from VAM calculated student growth on state assessment (e.g., FCAT 2.0
Reading and Algebra 1 EOC) or student growth calculated scores based on a pre- and

11
posttest by a teacher through the Individual Profession Development Plan (IPDP), (b)
categorized teacher years of experience, (c) school level mean instructional practice
scores of teachers as assessed on the Marzano Causal Teacher Evaluation Model by
administrators, (d) student achievement data from 9th
-and 10th
-grade students who took
the FCAT 2.0 Reading assessment, and (e) 9th
-grade students who took the Algebra 1
EOCs during the academic year 2011-2012. School level instructional practice scores
and student achievement data were tested for relationships using a Spearman Rho. A
Chi-Square analysis was conducted using teacher level Student Growth Scores and
Teacher Years of Experience as independent variables, and the mean instructional
practice scores of teachers served as the dependent variable.
This study relied solely on (a) teachers‟ years of experience, (b) teachers‟ student
growth score, (c) the mean instructional practice score gathered from the school district‟s
Department of Professional Development; (d) student FCAT 2.0 Reading (Florida
Department of Education, 2012f) and EOC Algebra 1 data from the Florida Department
of Education (Florida Department of Education, 2012b). The student data for Research
Questions 1-3 were delimited to that which was obtained for 9th
- and 10th
-grade students
who took the FCAT 2.0 Reading assessment and 9th
-grade students who took the Algebra
1 EOC examinations during the academic year 2011-2012. For Research Question 4,
student data included all students in Grades 9-12 associated with a teacher based on
student growth calculation as obtained from the district.

12
Procedures
On June 1, 2012, the researcher requested the initial approval of the Director of
the Department of Research Accountability and Evaluation in the School District of
Osceola County to conduct the research. This request also sought to establish a time to
present the proposal and request access to school level teacher instructional practice score
data and non-identifiable student achievement data. On June 8, 2011, the researcher
requested further approval of the two Assistant Superintendents of Elementary and
Secondary Curriculum and Instruction in Osceola County, Florida to conduct the
research.
Having received initial approval of the target school district, the researcher
presented the research proposal to the University of Central Florida‟s Educational
Leadership faculty on July 18, 2012. The approved proposal was then submitted to the
University of Central Florida Institutional Review Board for consideration and was
approved on September 6, 2012. Approval documents are contained in Appendix A.
Subsequently, on October 8, 2012, the researcher requested school level teacher
data including: (a) years of experience,(b) student growth score, (c) instructional practice
score, and (d) final evaluation scores from the Osceola County School District‟s
Department of Professional Development. Data requested were related to school level
teacher instructional practice mean scores, as measured on the Marzano Causal Teacher
Evaluation Model iObservation© Protocol by school based administrators at each of the
nine Osceola high schools that were the focus of this research. At the same time, the
researcher requested 9th
- and 10th
-grade student achievement data on FCAT 2.0 Reading

13
and 9th
-grade student achievement data on end-of-course examinations in Algebra 1 from
the school district‟s Department of Research and Accountability. The department
provided the student data and provided a website address for accessing Reading FCAT
2.0 data and Algebra 1 EOC demographic data and any additional data needed (Florida
Department of Education, 2012 b & g). Mathematical manipulation of data was needed
to calculate demographic data used in this study.
Limitations
This study was limited to the accuracy of the level of teacher years of experience,
student growth score, and instructional practice score data provided by the school
district‟s Department of Professional Development and the delineated 9th
- and 10
th-grade
student data retrieved from the Florida Department of Education for Research Questions
1-3 (Florida Department of Education, 2012 b & g).
Delimitations
1. This study was delimited to a large suburban school district in Central Florida
which had 10 high schools. The school district‟s Secondary Virtual School,
which provided learning to students through a virtual environment, was
excluded from the study.
2. This study was based on quantitative data. Though identified in the literature
review, extraneous or qualitative variables, e.g., perception, that might
influence either the teacher and/or student results, were not considered.

14
3. Data examined were delimited to 2011-2012 level of teacher experience,
student growth score, and instructional practice scores received from the
school district‟s Department of Professional Development. Due to contractual
issues related to accessing individual teacher VAM score data, teachers‟ final
evaluation scores were not reviewed and were only redacted by individual
teacher. Only school wide data were subjected to analysis.
4. This study examined school district and school level FCAT 2.0 Reading
(Florida Department of Education, 2012f) and EOC Algebra 1 data from the
Florida Department of Education (Florida Department of Education, 2012b).
For Research Questions 1-2, the student data were delimited to 9th
- and 10th
-
grade students who took the FCAT 2.0 Reading assessment. For Research
Question 3, the student data was delimited to 9th
- grade students who took
EOC examinations in Algebra 1 during the academic year 2011-2012.
Organization of the Study
This dissertation has been organized in five chapters. Chapter 1 is an introduction
to the study and included the background of the study, a statement of the problem, the
purpose of the study, the significance of the study, definition of terms, the theoretical
framework, the research questions and their related hypotheses, the limitations and
delimitations of the study, and the overall organization of the study. Chapter 2 provides a
review of literature and research relevant to the problem. Chapter 3 contains information
related to the methodology that was used to conduct the study. Included are: an

15
introduction to the methodology, information related to the selection of participants, the
instrumentation, data collection, data analysis, and a summary. Chapter 4 provides the
results of the analysis of the data and Chapter 5 presents a summary and discussion of the
findings as well as implications for practice, and recommendation for further research.

16
CHAPTER 2
REVIEW OF THE LITERATURE
Introduction
This chapter has been organized to present a review of relevant research and
literature related to teacher evaluation and the improvement of student achievement.
Reviewed are (a) reform efforts, (b) legislation, (c) educational policies, and (d)
performance evaluations and systems aimed at outlining the systems and methods by
which teachers are evaluated. This chapter contains a synthesis of the literature reviewed
of studies, influences, and practices in the United States to reform the manner in which
teacher effectiveness has been measured and evaluated. Research related to student
academic achievement and the effects of national and state initiatives to enhance student
achievement and measure teacher effectiveness are also presented in this chapter as part
of the four main topics in the chapter. The discussion in this chapter focuses on political
as well as scholarly perspectives of utilizing teacher evaluation to drive student
achievement.
Reform Efforts
In 2010, President Obama stated,
Every child in America deserves a world-class education. . . Today, more than
ever, a world-class education is a prerequisite for success. . . . A world-class
education is also a moral imperative--the key to securing a more equal, fair, and
just society. We will not remain true to our highest ideals unless we do a far

17
better job of educating each one of our sons and daughters. We will not be able to
keep the American promise of equal opportunity if we fail to provide a world-
class education to every child. (U.S. Department of Education, 2010, p. 1).
To provide a world-class education to every child in America, one of the
dominant national topics raised in the early 21st century was related to whether or not
teachers and the American public school system were able to produce educated citizens
who will stabilize and grow the U. S. economy to compete in a global market (Dillon,
2010). In order to meet the expectation to compete globally, Americans must overhaul
the processes and expectations used in providing education, assessing student learning
and teacher performance (U.S. Department of Education, 2009).
Just as President Obama‟s message was one of global proportion, researchers
have also emphasized the need for educational reform and the consequences of a lagging
American public education system on a world-wide scale (Wallace & Steptoe, 2006;
Zakaria, 2011). With extensive and well publicized discussions of the relationship
between teacher evaluation and student achievement on Internet and social media
sources, Americans have gained access to the varying views and perspectives on how to
improve the American educational system (Berry & Herrington, 2011). These
perspectives and views have come from diverse individuals ranging from politicians,
economists, philanthropists, and corporate moguls to researchers and scholars. Some
individuals have called for swift action from federal, state, and local governments to
establish value-added measures of teacher performance in public schools that reward or
remove teachers based on student achievement (Miller & Warren, 2011). At the same

18
time, other individuals have argued that although reform is needed, many changes
proposed to the system of teacher evaluation based on student achievement are
contentious and unpredictable (Dietel, 2011). In this regard, Corcoran (2010) noted that
“at worst, narrow interest in individual results may undermine this process” of reform (p.
15).
A Nation at Risk
Reform efforts focused on individual results were prevalent in the early 1980s
when the National Commission on Excellence in Education issued a report to then-
Secretary of Education, Terrel Bell, entitled A Nation at Risk. This report called for
extensive reform efforts to improve the nation‟s educational systems (National
Commission on Excellence in Education, 1983). The report was the first of its kind,
outlining how “the educational foundations of our society are presently being eroded by a
rising tide of mediocrity that threatens our very future as a Nation and a people,”
(National Commission on Excellence in Education, 1983, p. 5). The report focused
largely on teenagers in high school due to the impact this group of citizens has on the
future of America and its economic success on a global scale. The report further cited a
decline in American students‟ national and international test scores, increases in illiteracy
and the effects of average academic performance (Lunenberg & Ornstein, 2000).
During this same time period, and because of the economic needs of the country,
the President‟s Educational Summit with Governors promoted an increase in the federal
government‟s involvement with America‟s education system and the establishment of

19
standards for students (Fitzpatrick, Sanders, & Worthen, 2011). Since that time,
American educational success has been measured internationally (Miller & Warren,
2011), and American students have demonstrated limited success on international and
national assessments such as Program for International Student Assessment (PISA) and
the National Assessment of Educational Progress (NAEP) (National Council on Teacher
Quality [NCTQ], 2010; Robelen, 2011). This, in turn, has led to the assertion that
education is faltering in the United States and that citizens will have limited access to
jobs, extended learning opportunities or even military duty due to a lack of technological,
scientific, or mathematical literacy skills needed to be successful in the 21st century (Aud
et al., 2012; Ogawa & Collom, 2000).
Hanushek (2009) has focused on teacher effectiveness as a major source of the
problem and has observed that the rewards of changing teacher evaluation practices
outweigh the risks. Hanushek has indicated that the primary issue that needed to be
addressed was the removal of teachers who are ineffective because “allowing ineffective
teachers to remain in the classroom is dragging down the nation” (p. 177). In order to
facilitate the removal of “ineffective” teachers, Hanushek further suggested that a
“deselection” or elimination process of the lowest performing teachers would raise the
United States‟ ability to compete in global markets (2009).
President Obama has chosen to address reform, in part, by the creation of Race to
the Top (RTTT), a $4.3 billion dollar educational grant program funded under the
American Recovery and Reinvestment Act (ARRA) (Ravitch, 2010). This grant, seen as
a method to meet budgetary shortfall, prompted several states to apply for the grant

20
funding with the understanding that specific conditions would be met with respect to
education reform (Resnick, 2009). The priority, outlined as the “absolute priority” in the
Executive Summary of the RTTT Program, was that in order for states to receive funds
under the grant program, they must be “taking a systematic approach to education
reform” (U.S. Department of Education, 2009, p. 4). Reform areas outlined included
student standards and assessments; data systems; teacher recruiting, induction, retention,
and rewards; and methods for improving low achieving schools (U.S. Department of
Education, 2010).
While it is impossible to know whether the system drives the culture or the culture
the system, the result has been fairly clear--evaluation systems fail to differentiate
performance among teachers (Weisberg, Sexton, Mulhern, & Keeling, 2009). As a result,
teacher effectiveness has been largely ignored. “Excellent teachers cannot be recognized
or rewarded, chronically low-performing teachers languish, and the wide majority of
teachers performing at moderate levels do not get the differentiated support and
development they need to improve as professionals” (Weisberg et al., 2009, p. 6).
States seeking RTTT grants were required to develop “rigorous, transparent, and
fair evaluation systems for teachers and principals,” (U.S. Department of Education,
2009, p. 9). To meet initial RTTT eligibility requirements, states were rated on their
ability to create, implement, and sustain the stated objectives outlined in their
applications (Duncan, 2010a). States had the opportunity to apply for funding in two
phases. However, in Phase 1, only Delaware and Tennessee received funding for reform
initiatives (Duncan, 2010b). In Phase 2, the school districts of the District of Columbia,

21
Florida, Georgia, Hawaii, Maryland, Massachusetts, New York, North Carolina, Ohio,
and Rhode Island were successful with their grant applications and received funding
(Duncan, 2010a).
State applications were awarded points and funding based on a state‟s
involvement in developing and adopting common core standards (U.S. Department of
Education, 2010b). Also, states that maintained association with a consortium of states in
order to build common standards for K-12 students were rewarded. If such states focused
on college and career readiness by the time students graduated from high school, they
received additional points toward their application (U.S. Department of Education,
2010b). In the case of RTTT Phase 1 and 2 award recipients, all were associated with a
consortium of states aimed at establishing common core state standards and student
assessment aligned with the expectations of RTTT (Partnership for Assessment of
Readiness for College and Careers [PAARC], 2012; Smarter Balanced, 2012). Through a
systematic approach to reform in these areas, it was expected that states would improve
the country‟s international standing as an educationally high performing country with
respect to teacher effectiveness and student achievement based on standards (Peterson,
Hanushek, Woessmann, & Riddell, 2010).
Common Core Standards and Student Assessment
More than 40 states have opted to become part of a multi-state consortium and
have adopted common core standards in response to RTTT initiatives to create common
core standards and assessments to determine student success in meeting those standards

22
on a national level (Common Core State Standards Initiative, 2012; Dietel, 2011). At the
time of the present study, there were two consortiums of states, the Smarter Balanced
Assessment Consortium (SBAC) and Partnership for the Assessment of Readiness for
College and Careers (PARCC) (Dietel, 2011).
Resnick (2009) asserted that although states are working with other states to adopt
common standards and assessments and the process will bring about positive changes in
what is expected for students to learn, questions should be raised regarding the use of
student test scores to evaluate teachers. In contrast, however, it was expected under
RTTT that by aligning student assessments to common core College and Career
Readiness Standards (CCRS), data would be produced that would be sufficiently valid
and reliable to identify student achievement and thus determine the value-added or
effectiveness of schools, principals, and teachers for evaluation purposes (Dietel, 2011).
Researchers have contended that there are inconsistencies with instructional
reform initiatives due to differing perspectives on how and to what end the information
gained from multiple monitoring tools to determine effectiveness should be used (Stumbo
& McWalters, 2010). It has also been unclear as to how value-added measures will be
used to improve an individual teacher, school, or school district (Suppovitz & Weathers,
2004). Despite inconsistencies and different perspectives on how to utilize value-added
measures, the federal government has called for states and school districts to develop and
implement teacher evaluation systems based on student achievement and other factors
(U.S. Department of Education, 2010).

23
The Organisation for Economic Co-operation and Development (OECD) (2009)
warned that studies of teacher evaluation cannot be separated from the social issues a
country faces and that, “Societal, school system, and school-level factors all influence the
design of teacher evaluation policies,” (OECD, p. 4). In this respect, McNeil and
Coppola (1996) asserted that in order to understand the effects of policy on practice, one
must ask what “complex and unanticipated interactions were set in motion beyond the
policy intent” (p. 40).
Rebore (2011) observed, in regard to improving the American education system,
that teachers are critical stakeholders to successful reform. They can either contribute to
the effectiveness of the business and instructional functions in schools or they can hinder
improvements. Sanders & Horn (1994), in discussing student achievement, determined
that a system must be put in place to evaluate the effect of individual teachers on student
achievement since the most important factor in student academic growth is the teacher
and his or her effectiveness. With this in mind, and given that nearly 80% of a school
district‟s resources are devoted to personnel (Rebore, 2011), instructional staff evaluation
is an essential area of concern for school officials.
Table 1 presents the literature review sources for reform efforts related to teacher
evaluation and student achievement. Authors/researchers and their topics of interest are
displayed chronologically beginning in 1983 and continuing up to the time of the present
study.

24
Table 1
Literature Review Sources: Reform Efforts Related to Teacher Evaluation and Student
Achievement
Year Author(s) Topic
1983 National Commission on Excellence in
Education
National reform needs
2000 Lunenberg, F. C., & Ornstein, A. C. National reform
2001 Moberg, D. Changes to systems
2002 Ballou, D. Accountability for student learning
2005 Marzano R., Waters, T., & McNulty, B. Changes to systems
2006 Merrett, F. Hawthorne effect and changes to
systems
2006 Wallace, C., & Steptoe, S. U.S. educational proficiency
2007 Rivkin, S. Value-added models
2009 Hanushek, E. A. Removal of teachers
2009 U.S. Department of Education Race to the top grant
2010 Corcoran, S. P. Value-added measures and teacher
effect
2010 Dillon, S. Teacher evaluation
2010 Jackson, S. A., & Lunenburg, F. C. Performance indicators and student
achievement
2010 Ladner, M. & Burke, L. M. Student achievement gaps
2010 Ravitch, D. U.S. reform initiatives
2010 Taylor, R. T. Changes to systems
2010 U.S. Department of Education Reform plans
2011 Dietel, R. Student performance assessment and
teacher evaluation
2011 Galley, L. A. Value-added models
2011 Robelen, E. W. U.S. educational proficiency
2011 Zakaria, F. American education and international
standing
2012 National School Board Association Teacher effectiveness

25
Legislative Efforts
Although education was not established as a right or a responsibility of the federal
government under the U.S. Constitution (Alexander & Alexander, 2012), there have been
numerous federal and legislative initiatives focused on education, e.g., teacher evaluation.
Though the National School Boards Association (NSBA) (2012) has advocated for a
limited role by the federal government, it has supported federal assistance for states and
school districts in the areas of teacher recruitment, retention, and professional
development efforts by providing targeted incentives and fewer federal restrictions. To
this end, major legislation has been passed over the years which included the Elementary
and Secondary Education Act (ESEA) of 1965 and its reauthorizations, i.e., the No Child
Left Behind Act (NCLB) of 2001 and the American Recovery and Reinvestment Act
(ARRA) of 2009 (Fitzpatrick et al., 2011).
Elementary and Secondary Education Act (ESEA)
In 1965, the Eighty-first United States Congress, under the presidency of Lyndon
B. Johnson, enacted the Elementary and Secondary Education Act (ESEA). The primary
purpose of this legislation was to “strengthen and improve educational quality and
educational opportunities in the Nation‟s elementary and secondary schools” (ESEA,
1965, § 1). This improvement was to include accessibility of resources and financial
support from the federal government to states in order to ensure that educational program
needs for children from low-income families would be met (ESEA, § 1).

26
Title Six, § 604 of the Elementary and Secondary Education Act also indicated
that the United States federal government was prohibited from exercising “. . . any
direction, supervision, or control over the curriculum, program of instruction,
administration, or personnel of any educational institution or school system. . . .” (ESEA,
§ 1). Given the supposed limited scope of the federal government, Berry and Herrington
(2011) expressed concerns with the implementation of competitive federal grant
programs for states which outlined specific expectations with respect to reform and the
direction of states to implement legislative changes to each of the areas noted as having
been outside the scope of federal interest.
Since 1965, the ESEA has undergone several reauthorizations (Fitzpatrick et al.,
2011). In each instance, in order for states to receive federal funds to meet the
requirements of the reauthorization, reform to explicit state accountability measures
related to student achievement and teacher quality were required (NCLB, 2001). These
requirements were rooted in the nation‟s economics and its need to compete globally as
outlined in A Nation at Risk (National Commission on Excellence in Education, 1983).
No Child Left Behind (NCLB)
As one of several Congressional reauthorizations of the ESEA, No Child Left
Behind (NCLB) is best known for its expectations related to student academic
performance. With this legislation, states were expected to have increased accountability
and were required to create assessments of student learning in order to identify student
progress each year (NCLB, 2001). States were given until 2014 to improve student

27
academic success and have all students “on grade level” based on student assessments
(Berry & Herrington, 2011). It was expected that the data received from these
assessments would indicate where there were gaps in academic achievement for
disadvantaged students based on race, gender, and socioeconomic status (NCLB, 2001).
At the same time, states would improve or face monetary sanctions (NCLB, 2001).
Federal stipulations for any funds received from the federal government under the
NCLB reauthorization were specifically meant to accomplish two stated purposes:
(1): increase student academic achievement through strategies such as improving
teacher and principal quality and increasing the number of highly qualified
teachers in the classroom and highly qualified principals and assistant principals
in schools; and (2) hold local educational agencies and schools accountable
[through adequate yearly progress] for improvements in student academic
achievement (NCLB, 2001, § 2101).
Current trends have shown, however, that states have had difficulty in meeting the
requirements of NCLB. Recent legislation allows for waivers if states are aligned with
RTTT which was a result of the American Recovery and Reinvestment Act (ARRA)
(U.S. Department of Education, 2010).
American Recovery and Reinvestment Act (ARRA)
Accountability was the premise for the inclusion of education fiscal responsibility
through reform in the American Recovery and Reinvestment Act (ARRA) of 2009. With
this Act, the government under President Obama has worked at “making supplemental

28
appropriations for job preservation and creation, infrastructure investment, energy
efficiency and science, assistance to the unemployed, and State and local fiscal
stabilization. . . ” (ARRA, 2009, § 1). Although there were federal grant monies that
could be applied for by states for education, there was also an expectation that legislation
would restore state support for education (ARRA, 2009, § 1).
The reauthorization of the Elementary and Secondary Education Act of 1965,
known as a Blueprint for Reform, outlined the educational reforms made in response to
the ARRA. The blueprint reported on four areas in education that were significantly
impacted since the authorization of ARRA. These changes included:
(1) Improving teacher and principal effectiveness to ensure that every classroom
has a great teacher and every school has a great leader;
(2) Providing information to families to help them evaluate and improve their
children‟s schools, and to educators to help them improve their students‟ learning;
(3) Implementing college- and career-ready standards and developing improved
assessments aligned with those standards; and
(4) Improving student learning and achievement in America‟s lowest-performing
schools by providing intensive support and effective interventions (U.S.
Department of Education, 2010, p. 3).
Prior to Florida‟s receiving RTTT grant funding, the state was looking for a new
framework for teacher evaluation (Ashburn, 2001). However, the receipt of funding and
the need to adhere to the RTTT expectations, initiated the reforms which resulted in
legislation.

29
In a press release for the State, Copa (2011) of the Florida Department of
Education noted the elements of the new system of teacher evaluation. These elements
meant to serve as the comprehensive reform called for under the RTTT grant included
sections that took into account: (a) performance of students, (b) instructional practice or
instructional leadership, and (c) professional and job responsibilities (Copa, 2011).
Florida, as a recipient of an unprecedented $700 million through the RTTT grant
program was one of the states at the forefront of educational debates related to
performance appraisals of education professionals (Duncan, 2010a). With the funding
received from the federal grant, the state agreed to implement the expected reforms to
include a high stakes value-added measure to the observational evaluations of education
professionals (Education Personnel, 2011a). In 2011, the Florida Legislature passed
Senate Bill 736, also known as the Student Success Act, and Governor Rick Scott signed
it into law (Education Personnel, Florida, 2011b).
Since receiving the RTTT grant, economics and the utilization of grant funding
have dominated educational legislative changes being made in Florida. Once the state
received RTTT funding, it established an application process for the 67 school districts in
the state to create a Local Instructional Improvement System (LIIS). This system
established processes for school districts to apply for funding based on the elements
previously noted and targeted by the federal RTTT program (Haithcock, 2011). School
districts and other Local Education Agencies (LEAs) were encouraged to submit local
level plans for reform online and were required to sign a Memorandum of Understanding
(MOU) for approval by the State (Florida Office of the Commissioner of Education,

30
2009). Applications from school districts needed to be comprehensive and address the
changes already made to Florida Statute 1012.34-Assessment Procedures and Criteria
through Senate Bill 736 (Florida Office of the Commissioner of Education, 2009).
In the Agency Legislative Bill Analysis of S736, the bill that changed the statute
on teacher evaluation, the bill‟s sponsor, Senator Wise, outlined how amendments to the
Statute would align with Florida‟s Educator Accomplished Practices (FEAPs); link
teacher performance to three years of student data as appropriate through Florida‟s
approved VAM model; differentiate ratings of teachers to: highly effective, effective,
needs improvement, and unsatisfactory; allow school districts to use peer reviews;
include multiple data sources and parent input; and eliminate tenure (Education
Personnel, 2011a). Furthermore, these changes would allow school districts to identify
and compensate “effective and highly effective teachers and administrators. . . .” or
release teachers if proper measures were taken to improve the teacher‟s ability to teach
(SB 736, 2011, § B).
The General Counsel‟s Office Review indicated that the evaluation of personnel
based on student growth could be a potential source of an equal protection challenge on
the grounds that the relationship between student growth and teacher effectiveness was
tenuous because many factors can affect student learning (Education Personnel, 2011a).
The Counsel‟s Office Review also observed that individuals who were not in the
classroom, but were being evaluated on student achievement could raise challenges
(Education Personnel, 2011a). However, it was noted that these challenges would be
31
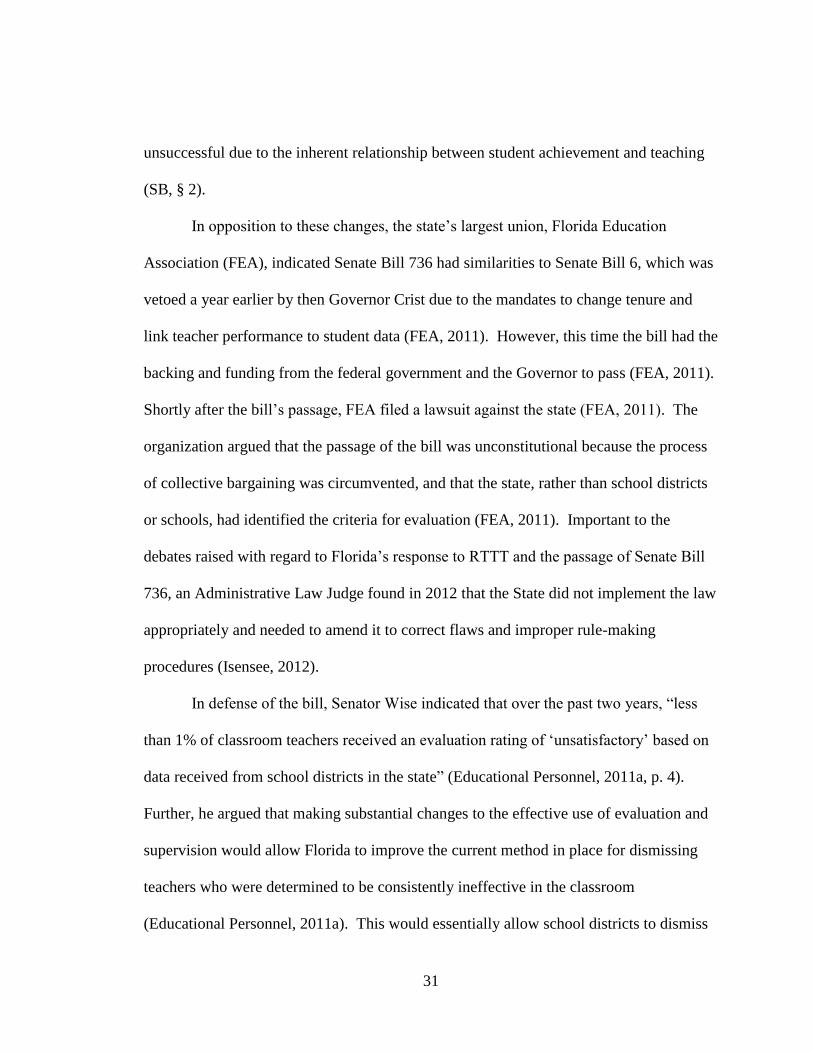
unsuccessful due to the inherent relationship between student achievement and teaching
(SB, § 2).
In opposition to these changes, the state‟s largest union, Florida Education
Association (FEA), indicated Senate Bill 736 had similarities to Senate Bill 6, which was
vetoed a year earlier by then Governor Crist due to the mandates to change tenure and
link teacher performance to student data (FEA, 2011). However, this time the bill had the
backing and funding from the federal government and the Governor to pass (FEA, 2011).
Shortly after the bill‟s passage, FEA filed a lawsuit against the state (FEA, 2011). The
organization argued that the passage of the bill was unconstitutional because the process
of collective bargaining was circumvented, and that the state, rather than school districts
or schools, had identified the criteria for evaluation (FEA, 2011). Important to the
debates raised with regard to Florida‟s response to RTTT and the passage of Senate Bill
736, an Administrative Law Judge found in 2012 that the State did not implement the law
appropriately and needed to amend it to correct flaws and improper rule-making
procedures (Isensee, 2012).
In defense of the bill, Senator Wise indicated that over the past two years, “less
than 1% of classroom teachers received an evaluation rating of „unsatisfactory‟ based on
data received from school districts in the state” (Educational Personnel, 2011a, p. 4).
Further, he argued that making substantial changes to the effective use of evaluation and
supervision would allow Florida to improve the current method in place for dismissing
teachers who were determined to be consistently ineffective in the classroom
(Educational Personnel, 2011a). This would essentially allow school districts to dismiss

32
teachers even though they had obtained tenure. It would also eliminate the need to utilize
the U. S. Office of Personnel Management and the regulations of Reduction in Force
(RIF) when and if the need were to arise (OPM, 2011). Tenure and teacher dismissal
issues need to be considered due to the federal allocation of RTTT and the expectations
of the grant that tenure would be eliminated and evaluation systems would be tied to
student learning (NCTQ, 2010).
Teacher Tenure and Reduction in Force
States receiving grant funding must be willing to remove “ineffective tenured and
untenured teachers and principals after they have had ample opportunities to improve,
and that such decisions [as noted earlier] are made using rigorous standards and
streamlined, transparent, and fair procedures” (U.S. Department of Education, 2009, p.
9).
In understanding the purpose in imposing new requirements on state and school
district teacher evaluation systems, it is important to note that principals have historically
had to exert control through “subtle and indirect” means (Owens, 2004, p. 162). This is
due to collective bargaining and union contractual agreements that provide them with
limited control over teacher behaviors in a loosely coupled system (Owens, 2004).
According to Hanushek (2009), although principals know which teachers are low
performing, due to tenure and collective bargaining, they invariably do not or are unable
to remove teachers who are harming student learning.

33
Coleman, Schroth, Molinaro, & Green (2005) strongly encouraged state
legislatures and school districts to make professional expectations for teachers more
rigorous and improve the procedures in place for terminating tenured teachers who do not
perform without completely eliminating the tenure process. Kwalwasser (2011) furthered
this sentiment by indicating that, “in school districts that have organized themselves to
promote high-octane learning, teachers were motivated even with tenure in place, and the
system had its own way of encouraging poor performers to leave” (p. 39).
In contrast, some political reformers and corporate constituents have proposed the
use of business-like evaluation methods along with monetary bonuses for teachers based
on student achievement (Ogawa & Collom, 2000). Coleman, et al. (2005) , noted that
issues of tenure are secondary to the improvements schools must make to the processes of
teacher evaluation and supervision in order to limit the number of ineffective teachers in
the nation‟s schools. Hinchey (2010) observed that because it is a statutory requirement
to have a system in place, it is necessary to identify positive and negative teaching
practices and document findings. This will affect change in who remains in the
profession.
With respect to tenure in the education profession, prior to SB 736, when an
agency needed to make the decision to terminate employees or reduce its work force, the
determination of who stayed and who went was initially based on the concept of last in-
first out (Rebore, 2011). Desander (2000) discussed the changes that would be needed if
last in-first out principles were abandoned. At the time of the present study, due to
changes to Florida Statutes regarding tenure, school districts have been faced with the
34
need to work through procedural and substantive due process issues. Desander had
advised that the difficulties could be limited by embedding procedural and substantive
due process into evaluation systems. Philosophically, “If procedural due process is the
heart of evaluation systems, then substantive due process considerations must be its soul”
(Desander, 2000, p. 310).
Desander (2000) put forth procedural due processes for teacher evaluations based
on the earlier work of Frase (1993) and Tucker and Kindred (1997). She posited that
procedural due process, as a general rule, should include:
(1) compliance with statutes and collective bargaining agreements;
(2) notice;
(3) documentation;
(4) assistance for improvement;
(5) reasonable time for improvement;
(6) evaluation summaries;
(7) fair hearing; and,
(8) trained evaluators (Desander, 2000, p. 309).
Further, substantive due processes in teacher evaluations should include:
(1) compliance with statutes and collective bargaining agreements;
(2) advanced notice of criteria;
(3) job-related criteria;
(4) broad job descriptions;
(5) clear and concise rating scales/standards; and,

35
(6) advanced warning performance deficiencies (Desander, 2000, p. 310).
The inclusion of procedural and substantive due processes should serve as
“preventative measures of fairness. . . to avoid potential teacher objections and gain
teacher support” (Matula, 2011, p. 99) To accomplish this, expectations and succinct
standards make the system equitable and fair without unknown criteria (Desander, 2000).
At the same time, there are arguments that the educational system would be better
served by eliminating tenure and high paid, ineffective teachers in order to find new
teachers (Hanushek, 2009). However, as previously noted, issues related to tenure and
collective bargaining make this difficult to accomplish. Weisberg et al. (2009) found that
although changes have been made to teacher evaluation systems, there is an indifference
or “widget effect” (p. 6) at the institution level regarding differences in teacher
performance. These researchers concluded that an evaluation system only strengthens the
indifference that may be found among employees if there is poor implementation of the
observation processes by administrators who may not have the proper training (Weisberg
et al., 2009).
Table 2 presents the literature review sources for legislative initiatives related to
teacher evaluation and student achievement. Authors/researchers and their topics of
interest are displayed chronologically beginning in 1965 and continuing up to the time of
the present study.

36
Table 2
Literature Review Sources: Legislation Related to Teacher Evaluation and Student
Achievement
Year Author(s) Topic
1965 Elementary and Secondary Education Act Education reform and financing
1993 Frase, L. E. Teacher evaluation and the law
1997 Tucker, P. D. & Kindred, K. Teacher evaluation and the law
2000 Desander, M. K. Teacher evaluation and due process
2009 American Recovery and Reinvestment Act U.S. funding and support
2010 National Council on Teacher Quality Florida reform in policy
2010 U.S. Department of Education Reform plans through legislation
2011 Berry, K., & Herrington, C. D. No Child Left Behind
2011 Education Personnel, Florida Senate Bill 736 (Student Success Act)
2011 Matula, J. J. Due process
2012 Florida Rule 6A-5.065 (2) Principles of effective educators
Educational Policies
Improvement of the educational process is dependent on the academic
achievement of students. With this in mind, there are five basic assumptions related to an
effective school environment: (a) teachers are teaching, (b) the school is an environment
for learning, (c) improvements are aimed at meeting the needs of all students, (d)
teachers‟ attitudes and behaviors set the tone, and (e) there is an acceptance of
responsibility for the success or failure of students (Owens, 2004).
These assumptions are the standards by which states must implement a value-
added measure based on student achievement under RTTT for a portion of a teacher‟s
evaluation (Corcoran, 2010). A value-added measure, as it was being used at the time of
the present study, was a multi-dimensional statistical method developed in Tennessee by

37
Sanders in an effort to gauge the growth of individual students over a year‟s time and in
turn improve the instructional methods of teachers (Ravitch, 2010). Since its inception,
the concept of value-added has been the subject of debate. Ballou (2002) warned that
value-added measures are difficult to understand and are not an answer to accountability
in education. Ballou believed this was due to the variability and uncertainty of the
measures. Merrett (2006) noted that despite efforts to account for variables in a given
situation, there were confounding issues that arise which may not have an explanation.
This was mentioned by the American Institutes for Research (2011b), Florida‟s approved
VAM research group, who indicated that “because data [FCAT] have not yet been used
for high-stakes decisions [teacher evaluation], they [VAM models] are not perfect” (p. 4).
Ravitch (2010) also recognized problems with VAM. She wrote that many educational
experiences cannot be measured by testing and that test scores should not be the only way
to assess quality because the greatest variable in the process of teacher performance
appraisals is whether or not a student will improve academically.
In a three-year experimental study conducted by the National Center on
Performance Incentives at Vanderbilt University in conjunction with the RAND
Corporation, researchers evaluated the use of performance bonuses to improve teaching
and ultimately student test scores on Tennessee‟s standardized tests in math (Springer et
al., 2010). The researchers indicated that, “Outcomes themselves are subject to
manipulation, with the consequence that measured gains on standardized tests may not be
valid indicators of how much students learned” (p. 7).

38
Any attempt to understand the process of value-added assessment, as noted by
Corcoran (2010), must include clarification of specific concepts and challenges. These
concepts relate to what exactly is being measured, the measurement tool‟s validity and
reliability, the specific traits that relate to educator effectiveness, the specific students that
teachers are being evaluated on, and whether there is variability in the value-added
process (Corcoran, 2010).
The changes made to legislation at federal and state levels have only fueled the
debate surrounding policy changes that propose the use of value-added measures of
student achievement to determine teacher effectiveness (Galley, 2011). The drive to
include value-added measures in teacher evaluation has been based on the need to
improve the current system of educator performance appraisals (Galley, 2011, p. 4).
Although most researchers agree that changes are needed in the current system, questions
regarding the variability, reliability, and validity of the student assessment scores being
used to determine, in part, teacher effectiveness must be still be asked (Resnick, 2009).
There are some researchers who have contended that value-added measures used
for educator appraisals have built in mechanisms to avoid misrepresentation of
performance (Sanders & Horn, 1994). Still other researchers have indicated that no
matter how much variability a system of analysis or research attempts to account for,
there is still potential for error (Merrett, 2006). This is due in part to the uncertainty of
controlling factors and the loss of reliability when calculating a margin of error and the
specific contribution of individual teachers (Ravitch, 2010). Further, with such high
stakes, concern has been raised as to the reliability and validity of tests given to students

39
and the potential for unethical practices toward which educators and schools may lean in
order to keep their positions and funding (Battaglieri & Chatterji, 2010).
Therefore, ratings are subject to bias through leniency, resulting in consistently
positive ratings (Alliger & Williams, 1989). The reliability and validity of teacher
evaluations as evaluative judgments are subjective and may lead to the “halo effect”
(Remmers, 1934). In the halo effect, evaluation ratings can be biased due to “a
systematic under- or overestimation of the quality of a performance” (Bechger, Maris, &
Hsiao, 2010, p. 609) based on an evaluee‟s former ratings or the general impressions
made during an observation. These impressions or perceptions allow for varying
understandings of a situation and may distort how well a teacher is performing in the eyes
of the observer (Gordon, 1999). Further, Strong, Gargani, and Hacifazlioğlu (2012)
noted that there are cognitive processes related to perception that inhibit an individual
from making correct observations due to the amount of information that is being dealt
with at a given time. This can lead to a misrepresentation of abilities and effectiveness
especially if there are limited opportunities to demonstrate proficiency (Bechger et al.,
2010).
Conversely, Sanders & Horn (1994) expressed their belief that despite these types
of issues, reliability, validity, confounding variables and those related to student
demographics and classroom makeup do not predict or change student achievement in a
manner that is equal with teacher effect. At the same time, Corcoran (2010) believed that
individual teachers were not the single most important factor for student achievement but
that they were merely contributing members along with administrators, other teachers,

40
curriculum specialists, coaches, and counselors to a team of professionals who work to
promote student achievement. This idea was highlighted by Bandura (2000) who
indicated that although individuals inherently evaluate success on a personal level, “there
is no emergent entity that operates independently of the beliefs and actions of the
individuals who make up a social system” (p. 76). Furthermore, in a New York Times,
article, Dillon (2010) questioned the use of value-added assessments to determine
effectiveness, stressing the difficulty in assessing an individual teacher‟s effect on student
test scores because students might possibly have several teachers who influence their
learning in a year‟s time.
Owens (2004), in addressing open organizations, wrote that educational systems
are open organizations that function with diversity. He believed that the attempt to
pinpoint teacher influence was in direct contrast to the theories indicating that the
primary focus in education was on the “dynamic interaction of people with varying
psychological make-ups” (Owens, 2004, p. 125). Ravitch (2010) saw human relations
and the collaboration of stakeholders as the foundation in the development of human
capital. Given this, according to Owens, there is an expectation that human resources
will have a higher value over time. Additionally, because of the supposed decline in
academic success on an international level, job security for teachers has become limited,
and commitments to employees have been hindered by economics (Bolman & Deal,
2003).
In the early 20th century, job security was based on adherence to the principles of
the scientific method espoused by Frederick Taylor (Marzano et al., 2011). These
41
principles indicated that efficiency comes from the use of “rigid discipline on the job,
concentration on the tasks to be performed with minimal interpersonal contacts between
workers, and strict application of incentive pay systems” (Owens, p. 83).
Despite a declining economy, many corporate and organizational entities operate
in a manner that requires that “pay should reflect value-added” (Bolman & Deal, 2003, p.
138). In keeping with this philosophy, the Obama administration has indicated that new
systems of teacher and principal evaluation are meant to “support ambitious efforts to
recruit, place, reward, retain, and promote effective teachers and principals and enhance
the profession of teaching” (U.S. Department of Education, 2010, p. 4). Still, a study
conducted through the National Center on Performance Incentives indicated that the
implementation of a value-added system of assessment that utilized “merit pay” to reward
teachers for student test score growth did not work to improve educator effectiveness
(Springer et al., 2010). It is also unclear how to determine the appropriateness of offering
bonuses to teachers with the highest student gains when there are some teachers who
teach highly motivated and accomplished students that show limited gains in comparison
to other students (Dillon, 2010).
In consideration of this idea, Goldhaber and Hansen (2010) concluded that the
stability of teacher influence is not consistent enough to determine effectiveness.
Theoretically, this concept is comparable to the Heisenberg “Uncertainty Principle” as
found in research related to quantum physics which indicated that an object or
individual‟s position and movement or growth cannot be determined exactly through any
measure as there are uncertainties that result from events (Hilgevoord & Uffink, 2001).
42
The principle also indicated that there is a limited understanding of what is perceived in
the world due to unpredictability which is inherent in every process or relationship
(Hilgevoord & Uffink, 2001). Soar and Soar‟s 1975 findings hold true in the 21st
century. One of the primary issues surrounding teacher evaluations based on assessment
has been and continues to be that students have unpredictable and varying motivations,
achievement levels, and interests that impact their learning. In this regard, Corcoran
(2010) aptly stated, “value-added assessments. . . are at best a crude indicator of the
contribution that teachers make to their students‟ academic outcomes” (p. 28). Ravich
(2011) elaborated: “Overemphasis on test scores to the exclusion of other important
goals of education may actually undermine the love of learning and the desire to acquire
knowledge, both necessary ingredients of [student] intrinsic motivation” (p. 229).
In 2010, the National Council on Teacher Quality reported that Florida had a “C”
average in the areas related to teacher policy. The report also indicated that although the
state had become more successful in enlarging the teacher selection pool, it was only
average in its ability to: (a) prepare new teachers; (b) identify and retain effective
teachers; and (c) exit ineffective teachers. The Council indicated that the two issues
topping the list for critical attention were: teacher tenure tied to teacher effectiveness and
the dismissal of teachers who were identified as ineffective outside of the need to release
teachers under RIF‟s regulations (NCTQ, 2010).
Highlighted in Florida Senate Bill 736 § 12 was the clause that allowed
administrators to bypass union collective bargaining if a teacher receives an
“unsatisfactory” rating for two consecutive years. With these changes, it is possible that

43
teachers may decide to “deselect” themselves from the profession of teaching (Hanushek,
2011). Also, there may be tenured teachers who will decline possible salary increases
through value-added assessments and performance pay in favor of the expected safety of
tenure even if their students show academic growth or mastery of basic skills and
standards (Matula, 2011).
Although tenure and the termination of teachers are contentious issues, sometimes
school districts must downsize due to economic constraints. In doing so, school districts
must comply with Reduction-In-Force (RIF) federal regulations, provided by the U.S.
Office of Personnel Management (OPM) and outlined in section 12 of the Veterans'
Preference Act of 1944 and other statutes (OPM, 2011). There are four basic retention
components that an agency (in this case a school district) must provide for in the case of a
reduction in force. These components include: tenure of employment, i.e., type of
appointment; Veterans' preference; total creditable federal civilian and uniformed service;
and performance ratings (OPM, 2011). Also, according to federal law, employees
receive or lose retention service credit under the RIF regulations for performance based
assessment upon the average of their last three annual performance ratings of record
received during the four-year period prior to the date of the RIF. The proper use and
administration of evaluations is the one variable that could identify professional needs of
employees and eliminate the need for the use of the regulations when and if a reduction in
force is necessary (OPM, 2011).
Hinchey (2010) proclaimed that the driving force for eliminating the issues
related to tenure and reduction in force is a teacher evaluation system that is rigorous,

44
streamlined, transparent, and fair. Further, reform and improvements are only made when
there is a school-wide focus on student data to drive instruction. An additional component
to improve instruction and the growth of teachers is to have collaborative professional
development by and for teachers and administrators to determine professional areas
needing to be changed (Kwalwasser, 2011).
Performance Evaluations and Systems
The Evaluation of Teacher Performance
There are two types of evaluations, formative and summative, which provide
information to stakeholders in an evaluation process (Fitzpatrick et al., 2011). In the case
of teacher evaluations, formative assessment is comprised of a series of frequent
diagnostic evaluations used to support a teacher‟s growth in the profession (Fitzpatrick et
al., 2011). These evaluations included classroom walkthroughs, lesson plan reviews,
conferences, and artifacts of teaching aimed at improving the skills of the teacher
(Hollifield, 2012). In contrast, summative assessments, the standard of evaluation pre
Senate Bill 736, are judgmental, infrequent evaluations used to make high stake decisions
about the effectiveness of a teacher‟s overall practice (Fitzpatrick et al., 2011).
In order to bring success to Florida‟s educational systems, Florida Administrative
Code Rule 6A-5.030 Instructional Personnel and School Administrator Evaluation
Systems indicated that “Evaluation systems are to be designed and implemented to
support continuous improvement of student learning growth by improving the quality of

45
instructional, administrative, and supervisory services in the public schools in the state”
(Stewart, 2012, p. 1). This system must also include additions or changes to the research
framework of the evaluation, to the inclusion of formative and summative assessments,
scoring, rubrics, processes for observation or feedback, and notification to employees
(Stewart, 2012).
In discussing performance evaluation, Rebore (2011) stated that the rationale for
performance evaluation was to measure a selected employee‟s performance against
criteria established in the job description (Rebore, 2011). Moreover, performance
evaluations are used to determine if an employee is meeting the needs and objectives of
the school district as outlined in their job description (Rebore, 2011). At the same time,
an evaluation allows for reflection on performance and if need be an opportunity for
administrators to assist the employee in making adjustments to their performance or to
begin the termination process (Young & Castetter, 2004).
Although an outcome of an evaluation may be termination or a change in an
employee‟s duties, a performance evaluation is meant to be seen as a positive process that
also promotes growth, identifies professional needs, and determines if an employee
should be promoted to positions that require specific skills that the employee may have
demonstrated (Rebore, 2011). With proper evaluation processes, conversations between
the employee and an administrator can determine the success of the employee in meeting
the goals of the school and the school district (Young & Castetter, 2004).
For the most part, “95% of all employees perform well [at least within the
parameters of the system] and only 5% of the workers cause significant problems in the
46
workplace” (Rasch, 2004, p. 408). Thus, it can be assumed that most teachers are doing
what is expected of them; they are teaching. This is significant because it is in direct
contrast to the rhetoric related to the mediocre performance of teachers offered by
Hanushek in 2010.
Improvement to the educational process is predicated upon the academic
achievement of students. Thus, as researchers have shown that teachers have the greatest
effect on students‟ academic growth, a system must be put in place to evaluate the effect
of individual teachers on student achievement (Sanders & Horn, 1994). Henneman and
Milanowski (2004) have considered aspects of such a system and have recognized that
appraisals of a teacher‟s performance should include: evaluation, feedback and/or
coaching, goal setting, and remediation or termination depending on the attainment of
goals. In this process, administrators can improve the quality of their relationships with
employees by maintaining professionalism, listening, being considerate, and
communicating objectives on a continual basis (Office of Human Resources, 2004).
Additionally, there should be standards in place by which to assess an employee and
goals and expectations about what should be accomplished or changed.
Because specialized knowledge does not automatically translate to effective
classroom performance, it is necessary to assess not only what a student knows and is
able to do, but what a teacher knows and can do (Marzano et al., 2011). Milanowski,
Prince, & Koppich (2007) noted that in order to determine teacher performance
appropriately, three measurements were needed to determine if competencies were being

47
met by a teacher: (a) formal observations; (b) teaching artifacts; and (c) classroom-
walkthroughs.
Danielson (2010) emphasized that contemporary teacher evaluation systems
should be engaging and focused on what is important--teaching and learning. As a matter
of practice, instructional elements such as how well a teacher plans learning activities,
maintains a positive classroom environment, communicates with students, and provides
productive feedback are necessary conversations between teachers and administrators to
promote teacher growth and student achievement (Danielson, 2010; Marzano, 2007).
Feedback should also be provided in evaluations by including activities outside the
classroom such as advising student groups, taking part in committees and other school-
wide work, and communicating with parents (Hinchey, 2010).
Scriven (1981) listed six factors that must be considered when observing
classrooms. These include: (a) change in teaching practice due to visit, (b) unreliable
samples, (c) personal bias, (d) observers who do not think like students, (e) style
preferences of the evaluator, and (f) time in making visits (p. 61). Numerous researchers
have added to the discussion of classroom observations and how to make them
meaningful (Beers, 2004; Keesor, 2005; Peterson, 2004).
In order to alleviate any changes to the dynamics of the class during an
observation, Peterson (2004) suggested that the observer become part of the class. In
Carolyn Keesor‟s (2005) experimental work on how the visibility of the administrator
affects student behavior, there were several positive outcomes that occurred due to an
administrator being in the classroom. Among these were, improved teacher performance,

48
communication, and collaboration beyond typical performance appraisals. Beers (2004)
identified a classroom walk-through (CWT) process with a checklist that specifically
targeted student behaviors in the classroom, not the teachers. In having a checklist of
how students were behaving by “wandering, watching, working, learning” (Beers, 2004,
p. 30) in class, a principal was able to give teachers feedback by which to recognize how
“to identify the pattern [in the classroom] and see whether that was the best way for the
lesson to be organized” (Beers, 2004, p. 33). On the same topic, Peterson (2004) advised
that, “[a] thorough checklist of behaviors, competencies, or duties is of little use in
inexpert hands” (p. 61). Similarly, there is little value to performance evaluation by those
who base an evaluation of performance unconsciously on impressions (Bechger et al.,
2010). Ginsberg & Murphy (2002) indicated that CWTs were meant to provide support
and that “frequent, brief, unscheduled walk-throughs can foster a school culture of
collaborative learning and dialogue” (p. 34).
Changes in Teacher Performance Evaluation Systems
The systems that have emerged in the first decade of the 21st century are different
from the systems adopted prior to the passage of Senate Bill 736 where the primary
appraisal processes were basic rating systems (Ashburn, 2001). The Florida Performance
Measurement System (FPMS) aligned to student performance standards was the system
used prior to Marzano‟s model (Ashburn, 2001). These systems were antiquated and
used without real definition, interpretation, or impact (Mahar & Strobert, 2010). In a

49
Memorandum to Florida District School Superintendents, the Director of the Florida
Department of Education‟s Division of Professional Educators indicated that:
Though some Florida school districts use the FPMS program as part of their state-
approved performance appraisal system, the FPMS program alone does not satisfy
statutory requirements for school district performance appraisal systems.
Therefore, the Department is transferring the administration of this program to the
school district level, enabling local systems to use the program if appropriate
(Ashburn, 2001, para. 1).
What this memorandum revealed was that the checklist, ranking, and rating
system associated with FPMS was neither completely aligned to the Florida Statutes nor
effective in appraising teacher performance.
Current evaluation models encompass a common language of instruction as well
as checklists (rank and rating systems) and walk-through elements. Furthermore, they
include elements not observable in a classroom related to professional and collaborative
activities, planning, and reflection (Danielson, 2010; Marzano, 2007).
Rebore (2011) discussed the complexities associated with performance
evaluation. Though school districts must consider performance evaluations of employees
as positive and aimed at improving teachers, personnel must also be cognizant of the
expectations that the evaluation process provides a fundamental tool in assessing if a
teacher should be retained and the pay that the employee should receive (Rebore, 2011).
Goe, Holdheide, & Miller (2011) cited primary elements that school districts
needed to address as they began the process of policy reform with respect to the

50
performance evaluations of teachers. They were: (a) procedures, (b) evaluation
instruments, (c) method for conducting evaluations, and (d) the legal issues that may arise
in the process.
Florida’s Model Evaluation Systems
In Florida, the state model of teacher evaluation is Marzano‟s Causal Teacher
Evaluation Model. However, although this model was considered as the approved model
by the State of Florida, school districts in the state had the option of adopting, modifying,
or developing their own models as long as the developed plan was based on current
research and the Florida Educator Accomplished Practices (FEAPs) (Florida Department
of Education, 2012e).
The FEAPs are core standards for educators as indicated through Florida State
Rule 6A-5.065. These standards are based upon three foundational principles:
1. The educator sets high expectations for students.
2. The educator has a comprehensive understanding of the subject being taught.
3. The educator exemplifies the standards of the profession. (Florida Rule 6A-
5.065 (1), 2012, p. 1).
Additionally, these principles should be applied through use of specific standard
practices that “promote a common language and statewide understanding of the
expectations for the quality of instruction and professional responsibility” (Florida Rule
6A-5.065 (2), 2012, p. 1). These quality instructional practices have been organized
using the following five categories: (a) instructional design and lesson planning, (b) the

51
learning environment, (c) instructional delivery and facilitation; (d) assessment, and
although not instructionally oriented (e) professional responsibility and ethical conduct.
According to the Florida Department of Education (2012e), 31 school districts in
Florida have selected to use the state adopted Marzano Model, 14 school districts have
selected the Danielson Framework for Teacher Evaluation, 14 school districts have
elected to use Educational Management Consulting Services (EMCS), and 12 school
districts chose to create hybrid or self-created systems (See Appendix B).
Of particular interest in this study is the Marzano Causal Teacher Evaluation
Model as it was this system that was implemented during the 2011-2012 school year in
the target school district and was the focus of this research. However, in order to
understand the elements found in the Marzano Model, it is important to first review the
other models for similarities and differences (a) Danielson‟s Framework for Teacher
Evaluation, (b) Educational Management Consulting Services, and (c) Hybrid or self-
created systems.
Danielson Framework for Teacher Evaluation
The Danielson Framework for Teacher Evaluation is the model most similar to
the Marzano Model through the inclusion of “observation and evaluation instruments,
crosswalks that identify alignment with the core standards and expectations, rubrics that
illustrate criteria for proficiency levels, performance ratings, and illustrative scoring and
weighting methods that conform to the requirements of state statutes and rules” (Florida
Department of Education, 2012e). Also, there were similarities between the Marzano

52
Model and Danielson Framework with respect to domain structures and expectations
(Marzano et al., 2011).
The difference between Danielson‟s model and Marzano‟s model lies in the use of
“causal” in the Marzano Causal Teacher Evaluation Model (Marzano et al., 2011). The
inclusion of the term, causal, implies that there are specific strategies and teacher
behaviors that have a direct relationship with student achievement (Marzano et al., 2011).
With respect to this, Danielson‟s framework provided examples of proficiency without
indicating specific classroom strategies (Danielson, 2011).
Educational Management Consultant Services (EMCS)
The Educational Management Consultant Services (EMCS) evaluation system
was made up of dimensions which include: “Planning/Preparation, Classroom
Management, Assessment Evaluation, Direct Instruction, Technology, Collaboration,
Professional Learning, and Professional Responsibilities” (Educational Management
Consultant Services (EMCS, 2011, p. 133). The system also provided correlation
information to Marzano‟s Model and Danielson‟s Framework. The primary focus and
difference in this system was the creation of job descriptions with measurable criteria
which were meant to lead to an outline of specific growth and development for the
employee (Educational Management Consultant Services (EMCS), 2011).

53
Hybrid or Self-created Evaluation Systems
In a hybrid or self-created evaluation system, such as found in Brevard County,
components were based on the FEAPs and included dimensions which are similar to the
domains found in Marzano‟s and Danielson‟s Models. These included: “Instructional
Design and Lesson Planning, learning environment, instructional delivery and
facilitation, assessment, professional responsibility and ethical conduct, relationship with
students, relationships with parents and community” (Brevard County Public Schools,
2011, p.16). However, a self-created model did not include specific classroom strategies,
as found in Marzano, but identified specific behaviors that indicated success in the
dimension through the use of rubrics (Brevard County Public Schools, 2011).
Marzano Causal Teacher Evaluation System
One of the primary elements of the Marzano Model is the use of a common
language of instruction among teachers and administrators. A common language is
meant to serve as a springboard for discussions which shape a teacher‟s “understanding
of the complexity of teaching, promote clarity in professional communications, and
enhance the quality of feedback on improvement of instructional proficiency in delivery
of a standards-based curriculum” (Florida Department of Education, 2012d, p. 5). It is
also expected that based on conversations about teaching, teachers will engage in
deliberate practice or focused implementation of teaching strategies and techniques
(Marzano et al., 2011).

54
The Marzano model, displayed in Appendix C, consists of four domain
categories: (a) classroom strategies, (b) preparing and planning, (c) reflecting on
teaching, and (d) collegiality and professionalism (Marzano, 2011). The domains are
described in the following paragraphs with specific attention to Domain 1 (Marzano et
al., 2011).
As the primary domain of the model, Domain 1 contains two-thirds of the 60
elements used to evaluate teachers (Marzano et al., 2011). The 41 classroom strategy
elements in Domain one were researched through experimental studies and determined to
affect student achievement (Haystead & Marzano (2009). There are superordinate and
subcategories within Domain 1. Superordinate categories are the learning goals and
subcategories are the design questions. Superordinate categories are the lesson segments:
routine, content, and enacted on the spot (Marzano et al., 2011). There are also 10 design
questions which are included from Marzano‟s Art and Science of Teaching (2007), nine
of which have been embedded in the lesson segments of Domain 1 (Marzano, 2009).
These design questions are meant to serve as reminders for teachers to outline specific
classroom strategies and behaviors so as to focus on and build deliberate practice
(Marzano et al., 2011).
The implementation of this model in the State of Florida is being accomplished in
phases. In Phase 1, which occurred in 2011-2012, school districts implementing the
Marzano Causal Teacher Evaluation were expected to familiarize teachers and
administrators with the system. Teachers were required to select and focus on only one

55
or two elements of Domain 1 for the purpose of evaluation by administrators (Learning
Sciences International, 2011).
Although teachers only focused on one or two elements for purposes of
observation in 2011-2012, having a model with 60 elements was daunting for some
teachers. Postal‟s (2012) comments in The Orlando Sentinel raised questions regarding
the quick implementation, the limited understanding of the model by teachers and how
administrators could effectively assess teacher performance using a system they were still
learning themselves. Baeder (2012), in his blog on edweek.org, indicated concern over
the marketing of the Marzano system, the limited research on its implementation, and the
determination that effective teaching is based primarily on strategies and behaviors.
Despite these issues and teacher frustration with learning the new system, the majority of
comments indicated that the model is comprehensive and has merit in identifying best
practices to promote student learning in the profession of teaching (Postal, 2012).
There have been questions surrounding the reliability and validity in determining
quality of teaching and use of a growth-based teacher evaluation model such as
Marzano‟s. Still, the model is expected, along with value-added assessments of
education professionals, to serve as a starting point for using observable data of teaching
practice to assess teachers in the classroom as well as identify trends over extended
periods of time (Rivkin, 2007).
56
The Impact of Teachers on Student Achievement
It is because teachers have been expected to have the greatest effect on student
achievement (Marzano et al., 2011) that interest is evaluating performance and ensuring
high quality teachers in classrooms has gained such widespread attention. This concept
has been highlighted in several studies and by President Barack Obama who indicated
that,
We know that from the moment students enter a school, the most important factor
in their success is not the color of their skin or the income of their parents--it is
the teacher standing at the front of the classroom (U.S. Department of Education,
2010, p. 1).
Teachers influence student academic success by serving as the primary taskmasters who
focus lessons, adhere to schedules, offer student feedback that is task specific, and model
appropriate behaviors (Squires, 1980).
At the same time, it has been argued that there have been numerous variables that
may not be accounted for in teacher evaluations. Given the numerous performance
assessment methods used to evaluate teachers across school districts, states, and the
country, it has been difficult to determine teacher effect on student achievement (Ravitch,
2010). As early as 1977, Caldwell called for attention to teacher behaviors. He posited
that, “teacher behaviors can be defined and measured in terms of observable teacher
behaviors” (Caldwell, 1977, p. 3), and that these observable behaviors impacted student
perceptions of the learning environment and ultimately affected their achievement.

57
Similarly, in a review of performance indicators, accountability ratings, and
student achievement, Jackson and Lunenberg (2010) indicated that “teacher behaviors, as
well as specific teaching principles and methods, make a difference with regard to student
achievement” (p. 39). Jackson and Lunenberg‟s research identified student perceptions
of academic achievement by racial subgroups. Students attested to teacher influence on
their performance and willingness to meet or exceed standards. Positive teacher
behaviors were identified by students who enjoyed teachers using varying assessment
tools, offering feedback and opportunities to revise work, being knowledgeable about
content, and holding high expectations. However, limited consistency at high schools
across content areas has made it difficult to determine precisely which teacher
characteristics are important when predicting increases in student performance on
standardized tests (Phillips, 2010).
Research findings reported by Jimmieson, Hannam, & Yeo (2010) showed that
teachers were an important factor in how students perceived their educational
environment and how well they performed. Students who participated in the research
indicated that teachers contributed to their success through modeling positive attitudes
towards content and study, establishing positive values for education and showing their
commitment to continued learning and academic achievement. Also, according to
research referenced by Rakoczy, Klieme, Bürgermeister, and Harks (2008), effective
teachers have good relationships with students and respond to students‟ needs. Though
numerous researchers have indicated that teachers have the greatest effect on student
achievement (Kane, Taylor, Tyler, & Wooten, 2011), academic success is a student

58
construct which has many levels and is made up of the varied skills, attitudes and
behaviors students possess.
Researchers such as Strong et al. (2011) have also discussed the differences in
effective and less effective teachers. The differences were found in how teachers handle
classroom management and their personal qualities, not instruction (Strong et al., 2011).
In contrast, however, Haystead and Marzano (2009) identified teacher behaviors that
support teacher effectiveness and student achievement. These behaviors were primarily
focused on classroom practices. The strategies that produced the greatest effect based on
meta-analytic studies were setting goals and objectives and tracking student progress in
the content (Haystead & Marzano, 2009). Jackson and Lunenberg (2010) supported
Haystead and Marzano‟s findings, adding giving students praise, reinforcing student
effort, questioning, summarizing, and note taking to the list of effective strategies.
However, they added that “regardless of whether or not teachers teach to standards, these
classroom practices work well” (Jackson & Lunenberg, 2010, p. 40). Ravich (2010)
reminded researchers continuing to seek out specific behaviors and indicators of teacher
performance, that there is “no silver bullet, no magic feather, no panacea that will
miraculously improve student achievement” (p. 229).
Table 3 presents the sources used in reviewing the literature on educational
policies related to teacher evaluation and student achievement. Authors/researchers and
their topics of interest are displayed chronologically beginning in 1934 and continuing up
to the time of the present study.

59
Table 3
Literature Review Sources: Educational Policies Related to Teacher Evaluation and
Student Achievement
Year Author(s) Topic
1934 Remmers, H. H. Halo effect and teacher evaluations
1989 Alliger, G. M., & Williams, K. J. Halo effect
1999 Gordon, J. Perceptions in evaluations
2000 Bandura, A. Collective efficacy
2000 Ogawa, R. T., & Collom, E. Performance indicators
2002 Brown, J. Teacher training
2002 Feeley, T. H. Halo effect
2004 Heneman, H. G., & Milanowski, A. T. Teacher competencies
2004 Rasch, L. Performance appraisals
2004 Young, I. P., & Castetter, W. B. Human resources in education
2005 Craig, J., Butler, A., Cairo, L., Wood, C.,
Gilchrist, C., Holloway, J.
.
Case study high performing schools
2007 Marzano, R. Teacher effectiveness
2007 Milanowski, A., Prince, C., & Koppich, J. Education compensation
2009 Haystead, M. W., Marzano, R. J. Meta-analytic studies on instructional
strategies
2009 National Comprehensive Center for
Teacher Quality
Teacher effectiveness policy
2010 Bechger, T., Maris, G., & Hsiao, Y. P. Halo effect
2010 Danielson, C. Teacher evaluation processes
2010 Hinchey, P. H. Teacher assessment and policy changes
2010 Stumbo, C., & McWalters, P. Challenges to teacher evaluation processes
2011b American Institutes for Research Teacher evaluation models review
2011 Brevard County Public Schools Teacher evaluation model
2011 Danielson, C. Teacher evaluation framework
2011 Educational Management Consultant
Services (EMCS)
Teacher evaluation model
2011 Kane, T. J., Taylor, E. S., Tyler, J. H., &
Wooten, A. L.
Teacher practice and student achievement
2012 Florida Department of Education Evaluation alignment
2012 Hollifield Clark, S. The Marzano evaluation model
2012 Shakman, K., Riordan, J., Sanchez, M.T.,
DeMeo, C. K., Fournier, R., & Brett, J.
Teacher evaluation systems
2012 Strong, M., Gargani, J., Hacifazlioğlu, Ö. Evaluator cognitive processes and perceptions

60
Summary
This chapter was organized to provide a review of the literature and research
related to reform efforts aimed at changing the systems and methods by which teachers
are evaluated in secondary schools. Literature and research related to: (a) reform efforts,
(b) legislation, (c) educational policies, and (d) performance evaluations and systems
were reviewed in order to outline the historical and conceptual issues that surround
current teacher evaluation reforms and impact student achievement in the United States.
Specific attention was devoted to the changes that have taken place in Florida in the first
decade of the 21st century.
Since the 1960s, researchers, politicians, scholars, and economists have
highlighted the need for reform to the educational system in the United States in order to
improve teacher quality and student achievement and compete in a global economy in the
21st century (National Commission on Excellence in Education, 1983; NSEA, 1965;
NCLB, 2002; U.S. Department of Education, 2010). Because students in the United
States have fallen short in their performance on international and national tests, the
federal government has created mandates and provided incentives through competitive
grants such as RTTT to foster higher achievement by the nation‟s students (Miller &
Warren, 2011). In turn, states such as Florida have enacted legislation requiring school
districts to change their systems of evaluating teachers to include the use of student
assessment test data and value added measures to determine teacher effectiveness
(Florida Senate Bill 736, 2011).

61
The use of value-added measures associated with student achievement data to
determine teacher effectiveness has been the focal point for rhetoric and debate
surrounding educational reform (Springer et al., 2010). The inclusion of student
achievement data in the teacher evaluation process has led researchers and scholars to
raise questions regarding the purpose and motives of policy changes to the system of
teacher evaluation. These questions have led to debates and controversy regarding issues
such as the halo effect, value-added assessments, tenure, teacher effect, and student
achievement (Feeley, 2002). Although researchers have indicated that teachers influence
student performance, there continues to be disagreement over the extent of the effect and
the specific methods used to produce improved academic success of students (Jackson &
Lunenberg, 2010).

62
CHAPTER 3
METHODOLOGY
Introduction
This chapter describes the methodology and procedures employed in analyzing
the data collected to answer the research questions which guided this study. Included is a
restatement of the purpose of the study and the research questions and hypotheses. The
population, sources of data, and methods and procedures used to collect and analyze the
data are described in detail.
Purpose of the Study
The purpose of this study was to examine the initial year of implementation of the
Marzano Causal Teacher Evaluation Model tool as it is related to student achievement in
a large suburban school district in Central Florida. The aim of the study was to examine
the relationship, if any, between teacher evaluation and student achievement.
Research Questions and Hypotheses
The following four research questions and corresponding null hypotheses were
used to guide this study.
1. To what extent, if any, is there a relationship between 9th
-grade high school mean
student developmental scale scores on FCAT 2.0 Reading and the school-wide
mean instructional practice score of teacher performance as measured by
Marzano's Causal Teacher Evaluation at nine high schools in a large suburban
school district?

63
H01. There is no statistically significant relationship between 9th
-grade high
school mean student developmental scale scores on FCAT 2.0 Reading and
the school-wide mean instructional practice score of teacher performance as
measured by Marzano's Causal Teacher Evaluation at nine high schools in a
large suburban school district?
2. To what extent, if any, is there a relationship between 10th
-grade high school
mean student developmental scale scores on FCAT 2.0 Reading and the
school-wide mean instructional practice score of teacher performance as
measured by Marzano's Causal Teacher Evaluation at nine high schools in a
large suburban school district?
H02. There is no statistically significant relationship between 10th
-grade high
school mean student developmental scale scores on FCAT 2.0 Reading and
the school-wide mean instructional practice score of teacher performance as
measured by Marzano's Causal Teacher Evaluation at nine high schools in a
large suburban school district?
3. To what extent, if any, is there a relationship between 9th
-grade high school
mean student developmental scale scores on End-of-Course Algebra 1
assessments and the school-wide mean instructional practice score of teacher
performance as measured by Marzano's Causal Teacher Evaluation at nine
high schools in a large suburban school district?
H03. There is no statistically significant relationship between 9th
-grade high
school mean student developmental scale scores on End-of-Course Algebra 1

64
assessments and the school-wide mean instructional practice score of teacher
performance as measured by Marzano's Causal Teacher Evaluation at nine
high schools in a large suburban school district?
4. Which of the variables, student growth score or teacher years of experience
are most influential in predicting a teacher‟s instructional practice score?
H04. Neither student growth score nor teacher years of experience has a
relationship with a teacher‟s instructional practice score.
Population
The population for the research was 9th
and 10th
grade students and all teachers
assigned to teach at one of nine high schools in a large suburban school district in Central
Florida. The school district examined in this study had ten high schools at the time of the
study. However, one high school was a virtual school and did not meet the requirements
of a brick and mortar school. Therefore, the virtual school was excluded from the
population, and data for it were not analyzed in this study.
According to the Florida Department of Education statistics (2012f), the school
district‟s 9th
grade student demographics for the Reading FCAT 2.0 during the 2011-2012
academic year were as follows: total population of students 4,021; White Non-Hispanic
1,076 (26.8%); Black or African American Non-Hispanic 479 (11.9%); Hispanic/Latino
2,230 (55.5%); Asian 107 (2.7%); American Indian/Alaskan Native 28 (0.7%); Native
Hawaiian or Other Pacific Islander 3 (0.1%); Multiracial 72 (1.8%); and Unknown
Race/Ethnicity 4 (0.1%). There were 1,991 (49.5%) females, 2,028 males (50.4%), and
65
two students whose gender was unknown. There were 424 (10.7%) students who
received Exceptional Student Education (ESE) services due to a disability; and 426
(10.6%) who were English Language Learners (ELL). Table 4 presents the ninth grade
student demographic data for the Reading FCAT 2.0 during the 2011-2012 academic year
in the district being reviewed in this study.

66
Table 4
Student Demographics for Florida Comprehensive Assessment Test (FCAT) 2.0 Grade 9
Reading (N = 4,021)
Students
Descriptors f Percentage
Race/Ethnicity
White, Non-Hispanic 1,098 27.3
Black or African American, Non-Hispanic 479 11.9
Hispanic/Latino 2,230 55.5
Asian 107 2.7
American Indian or Alaska Native 28 0.7
Native Hawaiian or Other Pacific Islander 3 0.1
Multiracial 72 1.8
Unknown Race/Ethnicity 4 0.1
Gender
Female 1,991 49.5
Male 2,028 50.4
Unknown 2 -
Subgroups
Exceptional Student Education (ESE) 429 10.7
English Language Learner (ELL) 426 10.6
The school district‟s 10th
-grade student demographics for the Reading FCAT 2.0
during the 2011-2012 academic year were as follows: total population of students 3,572;
White Non-Hispanic 995 (27.9%); Black Non-Hispanic 424 (11.9%); Hispanic/Latino
1,938 (54.3%); Asian 103 (3%); American Indian/Alaskan Native 14 (0.4%); Native
Hawaiian or Other Pacific Islander (7) (0.2%); and Multiracial 91 (2.5%). There were
1,776 (49.7%) females and 1,796 males (50.3%). There were 343 (9.6%) students who
received exceptional student education (ESE) services due to a disability; and 362
(10.1%) who were English Language Learners (ELL). Table 5 presents the 10th-grade

67
student demographic data for the Reading FCAT 2.0 during the 2011-2012 academic year
in the school district that was reviewed in this study.
Table 5
Student Demographics for Florida Comprehensive Assessment Test (FCAT) 2.0 Grade 10
Reading (N = 3,572)
Students
Descriptors f Percentage
Race/Ethnicity
White, Non-Hispanic 995 27.9
Black or African American, Non-Hispanic 424 11.9
Hispanic/Latino 1,938 54.3
Asian 103 2.9
American Indian or Alaska Native 14 0.4
Native Hawaiian or Other Pacific Islander 7 0.2
Multiracial 91 2.5
Gender
Female 1,776 49.7
Male 1,796 50.3
Special Services
Exceptional Student Education (ESE) 343 9.6
English Language Learner (ELL) 362 10.1
According to the Florida Department of Education statistics (2012b), the school
district‟s ninth-grade demographics for the Algebra 1 End-of-Course (EOC)
Examinations during the 2011-2012 academic year were as follows: total population of
students 2,305; White Non-Hispanic 488 (21.2%); Black or African American Non-
Hispanic 311 (13.5%); Hispanic/Latino 1,405 (61.0%); Asian 42 (1.8%); American
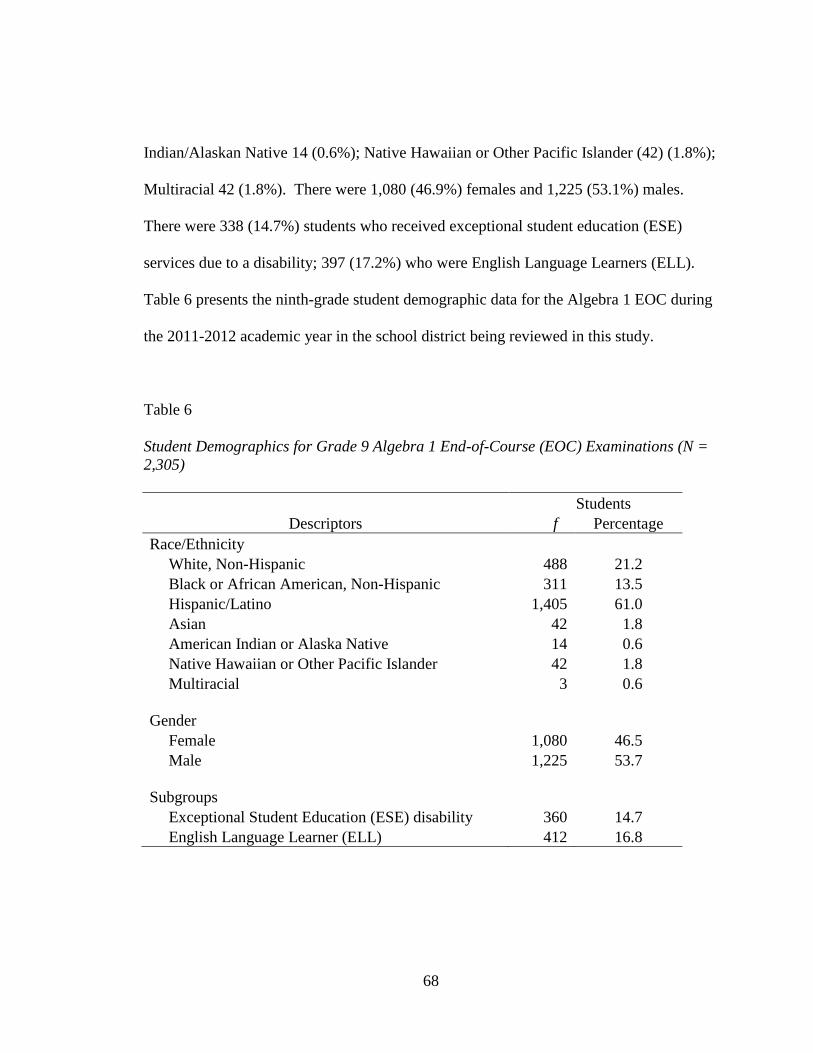
68
Indian/Alaskan Native 14 (0.6%); Native Hawaiian or Other Pacific Islander (42) (1.8%);
Multiracial 42 (1.8%). There were 1,080 (46.9%) females and 1,225 (53.1%) males.
There were 338 (14.7%) students who received exceptional student education (ESE)
services due to a disability; 397 (17.2%) who were English Language Learners (ELL).
Table 6 presents the ninth-grade student demographic data for the Algebra 1 EOC during
the 2011-2012 academic year in the school district being reviewed in this study.
Table 6
Student Demographics for Grade 9 Algebra 1 End-of-Course (EOC) Examinations (N =
2,305)
Students
Descriptors f Percentage
Race/Ethnicity
White, Non-Hispanic 488 21.2
Black or African American, Non-Hispanic 311 13.5
Hispanic/Latino 1,405 61.0
Asian 42 1.8
American Indian or Alaska Native 14 0.6
Native Hawaiian or Other Pacific Islander 42 1.8
Multiracial 3 0.6
Gender
Female 1,080 46.5
Male 1,225 53.7
Subgroups
Exceptional Student Education (ESE) disability 360 14.7
English Language Learner (ELL) 412 16.8

69
The student participants in this study were drawn from nine high schools in
Grades 9 and 10 within the school district who took the FCAT 2.0 Reading and Algebra 1
EOC examinations during the 2011-2012 academic year. Students were selected by
virtue of participation in testing on FCAT 2.0 and Algebra 1 End-of-Course
examinations.
The teacher participants in this study were drawn from all teachers assigned to
teach Grades 9-12 at one of the nine high schools within the school district for the 2011-
2012 academic year that were included in the study. The school district‟s high school
teacher demographics were derived using school improvement plans for the 2011-2012
academic year obtained from the Florida Department of Education Bureau of School
Improvement website. Table 7 contains information as to the total number of
instructional staff (896) and years of experience as follows: (a) less than one year, 46
(5.13%); (b) 1-5 years of experience, 260 (29.02%); (c) 6-14 years of experience, 351
(39.17%); and (d) 15+ years of experience, 229 (25.56%). Teachers‟ education and
professional development included: advanced degrees, 376 (41.96%); highly qualified
teachers, 858 (95.76%); reading endorsed teachers, 89 (9.93%); National Board Certified
Teachers, 34 (3.79%); ESOL endorsed teachers, 319 (35.60%).

70
Table 7
Teacher Demographics: All High Schools (N = 896)
Teachers
Descriptor f Percentage
Years of Experience
Less than 1 year 46 5.13
1-5 years 260 29.02
6-14 years 351 39.17
15+ years 229 25.56
Education/Professional Development
Advanced degrees 376 41.96
Highly qualified 858 95.76
Reading endorsed 89 9.93
National Board Certified 34 3.79
English Speakers of Other Languages
(ESOL) endorsed 319 35.60
Note. Data were obtained from school improvement plans for the nine high schools
Data collected from the school district‟s Office of Professional Development were
redacted due to contractual issues. The data were collected from (a) the teacher
Individual Professional Development Protocol and (b) the Marzano Causal Teacher
Evaluation Model iObservation© protocol tool. Permission for use of the Marzano Model
is contained in Appendix D. Data indicated the following information: teacher level
student growth score, as calculated through VAM or the Individual Professional
Development Plan (IPDP); teacher instructional practice score; and teacher final
evaluation score, based on the calculation of both student growth score and instructional
practice score.

71
During the 2011-2012 academic year, teachers were evaluated using the Marzano
Teacher Evaluation Model and student growth scores. A teacher‟s summative evaluation
was based on 50% of students‟ FCAT scores or a mutually agreed upon evaluation
measure (SDOC, 2011). Within the school district in this study, the use of a separate
measure (IPDP pre- posttests) was required to be selected by a teacher who did not teach
a state-assessed subject and accounted for 30% of the student growth score. This allowed
a classroom teacher to only count 20% of FCAT based calculated VAM scores into the
final evaluation score for student achievement. The other 50% of the evaluation was
based on all formative observation scores received throughout the school year by
observing administrators (SDOC, 2011).
According to the School District of Osceola County [SDOC] & Osceola County
Education Association [OCEA] Teacher Contract (2011),
The Teacher Evaluation System (TES) will be made up of two components in
school year 2011-2012 for teachers in FCAT grades and subject areas, the score
on the Marzano Evaluation Model and the score on the State of Florida‟s value
added tables of student learning growth or a mutually agreed upon evaluation
measure. Each teacher will receive an overall rating of Highly Effective,
Effective, Needs Improvement (referred to as Developing in the case of teachers
in their first three years of employment), or Unsatisfactory based upon the total
number of points accrued on the two measures (p. 70).

72
Instrumentation
The instrument that was used to collect the school-wide mean teacher
instructional practice score was the Marzano Causal Teacher Evaluation Model Protocol
through iObservation©. Under this model, when a teacher is observed, administrators
note a level of teacher performance as innovative, applying, developing, beginning, or not
using (Learning Sciences International, 2011). At the time of the present study, there was
limited information regarding the validity and reliability of the instrument outside of the
research based studies (experimental, control, and correlation) conducted through the
Marzano Research Laboratory (Marzano, 2011). The Marzano Laboratory provided a
document to the school district outlining the research and validation studies on the model
(Marzano, 2011), and research continues to be conducted.
Instructional Practice Score
The instructional practice score is a mean total evaluation score comprised of the
scores received from an administrator‟s observations. The data points a teacher received
were calculated on a 5 point scale (4 = Innovating, 3 = Applying, 2 = Developing, 1 =
Beginning, and 0 = Not Using). The mean score was then categorized using a 4-point
scale as required by the Florida Department of Education and Senate Bill 736 (LSI,
2011). The Florida Department of Education scale for instructional practice scores is: 4
= Highly Effective, 3 = Effective, 2 = Needs Improvement or Developing (for beginning
teachers), 1 = Unsatisfactory (LSI, 2011). All data points were assigned based on a
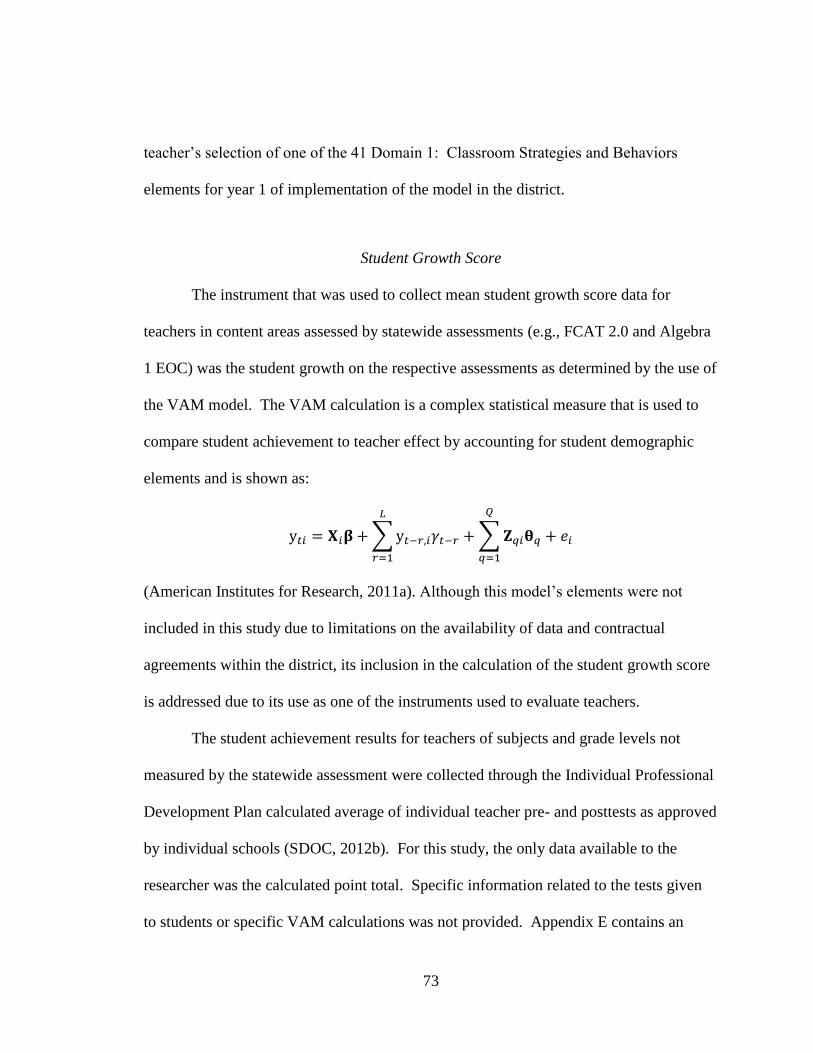
73
teacher‟s selection of one of the 41 Domain 1: Classroom Strategies and Behaviors
elements for year 1 of implementation of the model in the district.
Student Growth Score
The instrument that was used to collect mean student growth score data for
teachers in content areas assessed by statewide assessments (e.g., FCAT 2.0 and Algebra
1 EOC) was the student growth on the respective assessments as determined by the use of
the VAM model. The VAM calculation is a complex statistical measure that is used to
compare student achievement to teacher effect by accounting for student demographic
elements and is shown as:
(American Institutes for Research, 2011a). Although this model‟s elements were not
included in this study due to limitations on the availability of data and contractual
agreements within the district, its inclusion in the calculation of the student growth score
is addressed due to its use as one of the instruments used to evaluate teachers.
The student achievement results for teachers of subjects and grade levels not
measured by the statewide assessment were collected through the Individual Professional
Development Plan calculated average of individual teacher pre- and posttests as approved
by individual schools (SDOC, 2012b). For this study, the only data available to the
researcher was the calculated point total. Specific information related to the tests given
to students or specific VAM calculations was not provided. Appendix E contains an

74
example of the IPDP student growth score calculation form used by teachers not assigned
to grade levels and content areas to calculate student growth scores. Once scores were
entered into the IPDP system by teachers, they were subject to administrator review. A
point total was calculated based on the percentages shown in Table 8.
Table 8
Student Growth Score Calculations for Classroom Teachers in Content Areas Not
Assessed on Statewide Assessments
Points Rationale
4 points 51% to 100% increase in student scores (e.g., greater than one-half of
the classroom teacher‟s students)
3 points
26%-50% increase in student scores (e.g., greater than one-quarter of
the classroom teacher‟s students)
2 points
11% to 25% increase in student scores (e.g., greater than one-tenth of
the classroom teacher‟s students)
1 point 1% to 10% increase in student scores (e.g., greater than none of the
classroom teacher‟s students)
0 points 0% increase in student scores (e.g., none of the classroom teacher‟s
students)
Note. Source of Data was School District of Osceola County (SDOC, 2012b, p. 11).
Threats to the calculation of the Student Growth Score were (a) the validity, (b)
reliability, and (c) the rigor of the instrumentation used to calculate and measure student
growth (SDOC, 2012b; Shadish & Cook, 2002).
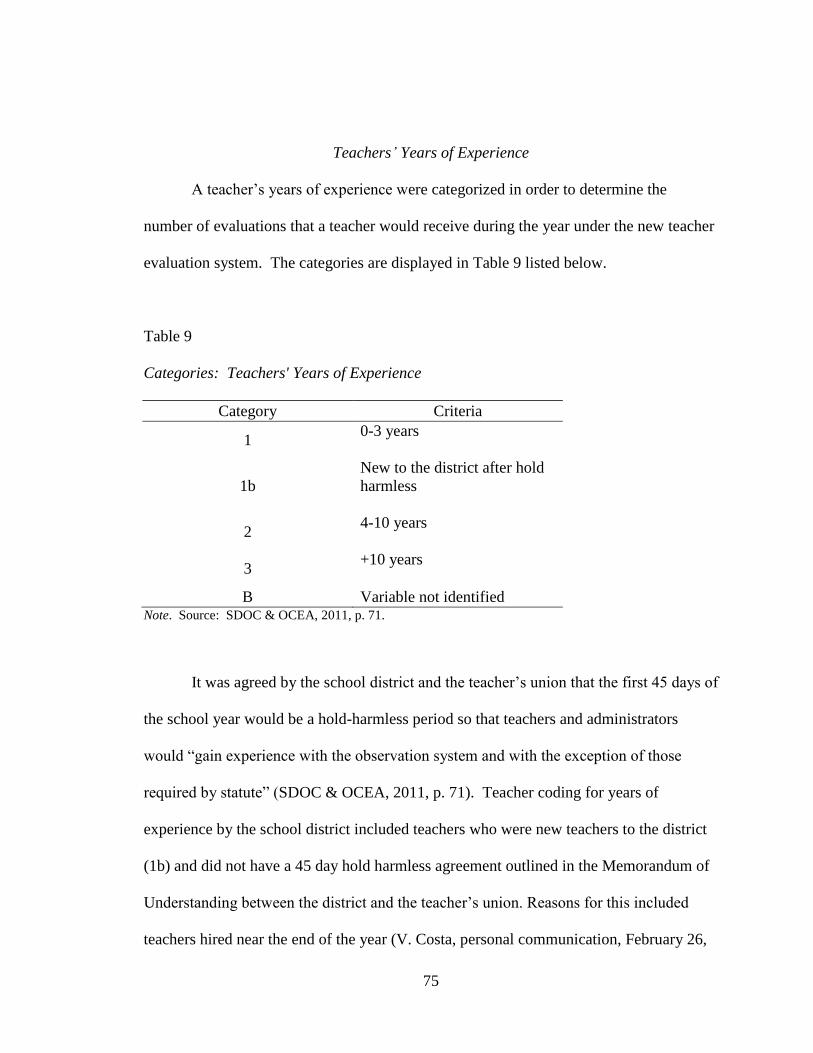
75
Teachers’ Years of Experience
A teacher‟s years of experience were categorized in order to determine the
number of evaluations that a teacher would receive during the year under the new teacher
evaluation system. The categories are displayed in Table 9 listed below.
Table 9
Categories: Teachers' Years of Experience
Category Criteria
1 0-3 years
1b
New to the district after hold
harmless
2 4-10 years
3 +10 years
B Variable not identified Note. Source: SDOC & OCEA, 2011, p. 71.
It was agreed by the school district and the teacher‟s union that the first 45 days of
the school year would be a hold-harmless period so that teachers and administrators
would “gain experience with the observation system and with the exception of those
required by statute” (SDOC & OCEA, 2011, p. 71). Teacher coding for years of
experience by the school district included teachers who were new teachers to the district
(1b) and did not have a 45 day hold harmless agreement outlined in the Memorandum of
Understanding between the district and the teacher‟s union. Reasons for this included
teachers hired near the end of the year (V. Costa, personal communication, February 26,

76
2013). The “B” coding was not an identified variable in the Teacher Contract or
Memorandum of Understanding. Based on the categories, or years of experience, as
outlined in the Teacher Contract and Memorandum of Understanding, administrators
were provided with a schedule for administering teacher observations. Table 10 outlines
the schedule for providing observations to teachers based on years of experience.
Table 10
Schedule of Administrator Observations for Teachers by Categories
Teacher Categories (Years of Experience)
Observations I (0-3) Struggling II (4 or more) III (10 or more)
Formal 2 2 1 1
Additional
Option,
See Below
Additional
Option,
See Below
Additional
Option,
See Below
Informal
(Announced or
Unannounced
2 2 1 1
Additional
Option,
See Below
Additional
Option,
See Below
Additional
Option,
See Below
Note. Category I and struggling teachers may benefit from additional classroom visits. The recommended
observation schedule suggests—
4 announced Formal observations for Category I, 5-9 for Struggling Teachers, 2 for Category II,
and 1-2 for Category III;
5 announced or unannounced Informal Observations for Category I, 5-9 for Struggling Teachers,
2 for Category II, and 1-2 for Category III;
Twice monthly Classroom Walkthroughs for Category I and Struggling Teachers, Monthly for
Categories II and III. Source: SDOC & OCEA, p. 71
Note. Source: SDOC & OCEA, p. 71.

77
The Final Teacher Evaluation Score
The final teacher evaluation score in the data set provided by the district
represented an average between the student growth score, the Marzano Evaluation
System summative instructional practice score, and either Reading, Mathematics, or
Combined Reading and Mathematics VAM scores. Given the variability of VAM scores
for individual teachers and the limitations of the availability of data to the researcher due
to contractual agreements, the final evaluation score could not be used in this study.
Reading FCAT 2.0
The Reading FCAT 2.0 was the instrument used to determine student
achievement in reading. During the 2011-2012 academic year, the test was administered
to ninth-grade students through a paper and pencil format. The test was administered to
10th
-grade students through an online format. According to the Florida Department of
Education (2012c), the test items were reviewed during test development by content
specialists for quality and appropriateness. Furthermore, educators and Florida citizens
met to review the validity of specific test items to measure Reading NGSSS benchmarks.
Additionally, reviews were made for bias and sensitivity of test items. The State of
Florida field tested the Reading FCAT 2.0 to determine the reliability of the test prior to
student testing.
Student achievement on the FCAT 2.0 Reading is based on scale scores. In order
for a student to pass the examination, a scale score must be met. Students who entered

78
ninth grade in 2010-2011 needed to score at least 245 or higher on the 10th grade FCAT
2.0 Reading in order to be considered proficient and meet the graduation requirement
(Florida Department of Education, 2012h). Table 11 outlines the specific scale scores
needed to be considered proficient on the FCAT 2.0 Reading examination.
Table 11
Florida Comprehensive Assessment Tests (FCAT) 2.0 Reading Developmental Scale
Scores (178-302)
Levels of FCAT 2.0 Reading Scale Scores
Grade Level 1 Level 2 Level 3 Level 4 Level 5
9 178-221 222-239 240-252 253-267 268-302
10 188-227 228-244 245-255 256-270 271-302
Note. Source: Florida Department of Education, 2012h, p. 6.
Algebra 1 End-of-Course (EOC) Examination
The Algebra 1 EOC was the instrument used to determine student achievement in
Algebra 1. During the 2011-2012 academic year, the test was administered to 9th
-grade
students through an online format. According to the Florida Department of Education
(2012a), the test items were reviewed during test development by content specialists for
quality and appropriateness. Further, educators and Florida citizens met to review the
validity of specific test items to measure Algebra 1 NGSSS benchmarks. Additionally,
reviews were made for bias and sensitivity of test items. The State of Florida field tested
the Algebra 1 EOC to determine the reliability of the test prior to student testing. Student
achievement on the Algebra 1 EOC is based on scale scores. In order for a student to

79
pass the examination, a scale score must be met. Students who took the Algebra 1 EOC
assessment and entered 9th grade in 2011-2012 needed to score at least 399 or higher on
the assessment in order to be considered proficient and earn course credit in Algebra 1
(Florida Department of Education, 2012g). Table 12 outlines the specific scale scores
needed to be considered proficient on the Algebra 1 examination.
Table 12
Algebra 1 End-of-Course Assessment Scale Scores (325-475)
Levels of Algebra 1End-of-Course Assessment Scale Scores
Grade Level 1 Level 2 Level 3 Level 4 Level 5
9 325-374 375-398 399-424 425-436 437-475 Note. Source: Florida Department of Education, 2012g, p. 9.
Data Collection
Data for the nine schools were obtained from the Florida Department of
Education and the School Improvement websites. School level student demographic and
performance data on FCAT 2.0 Reading and the Algebra 1 End-of-Course Assessment
were found on the Florida Department of Education website on the World Wide Web:
https://app1.fldoe.org/FCATDemographics and http://app1.fldoe.org/FEocDemographics,
respectively.
Teacher demographic data were obtained through the Florida Department of
Education Bureau of School Improvement website on the World Wide Web:
http://flbsi.org/index.htm. Teacher performance data were collected from the school
district‟s Office of Professional Development and contained redacted individual and

80
school level mean data. The researcher collected redacted individual and school level
mean teacher performance data due to contractual issues related to using employee
identifiable information without extensive oversight that would extend beyond the scope
of this study.
The data characterized information for each of the schools in the study as to
student and teacher populations for the 2011-2012 academic year. The following data
were collected and used in the study:
Student growth scores as calculated according to the school district‟s Individual
Professional Development Plan (IPDP) protocol tool during the academic year
2011-2012 for each teacher at the nine high schools in the school district.
Categorized teacher years of experience as determined under the school district‟s
Memorandum of Understanding and Teacher Contract for 2011-2012 for each
teacher at the nine high schools in the school district.
Redacted individual teacher and mean school level instructional practice scores as
measured on the Marzano Causal Teacher Evaluation tool during the academic
year 2011-2012 for each teacher at the nine high schools in the school district.
School level teacher demographic data (including but not limited to: number of
years teaching, degree level, endorsements and certifications).
9th
-grade student mean developmental scale scores as identified on FCAT 2.0
Reading assessment and EOCs in Algebra 1 during the academic year 2011-2012
at each of the nine high schools.
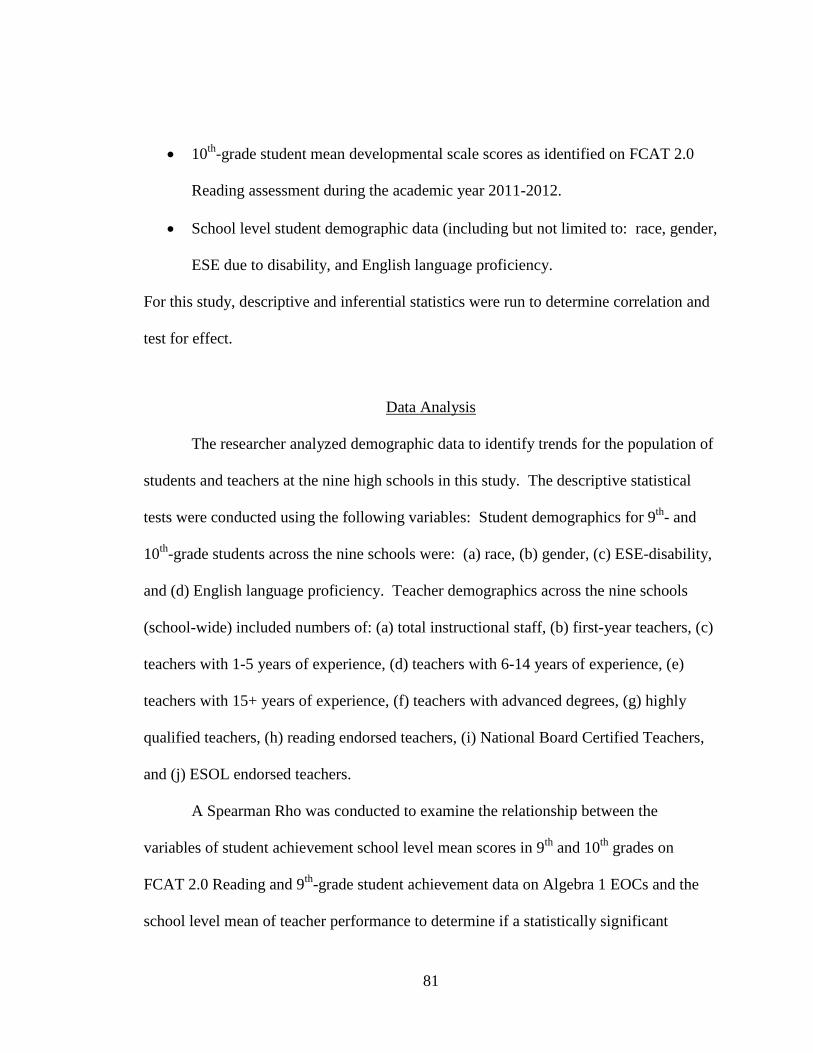
81
10th
-grade student mean developmental scale scores as identified on FCAT 2.0
Reading assessment during the academic year 2011-2012.
School level student demographic data (including but not limited to: race, gender,
ESE due to disability, and English language proficiency.
For this study, descriptive and inferential statistics were run to determine correlation and
test for effect.
Data Analysis
The researcher analyzed demographic data to identify trends for the population of
students and teachers at the nine high schools in this study. The descriptive statistical
tests were conducted using the following variables: Student demographics for 9th
- and
10th
-grade students across the nine schools were: (a) race, (b) gender, (c) ESE-disability,
and (d) English language proficiency. Teacher demographics across the nine schools
(school-wide) included numbers of: (a) total instructional staff, (b) first-year teachers, (c)
teachers with 1-5 years of experience, (d) teachers with 6-14 years of experience, (e)
teachers with 15+ years of experience, (f) teachers with advanced degrees, (g) highly
qualified teachers, (h) reading endorsed teachers, (i) National Board Certified Teachers,
and (j) ESOL endorsed teachers.
A Spearman Rho was conducted to examine the relationship between the
variables of student achievement school level mean scores in 9th
and 10th
grades on
FCAT 2.0 Reading and 9th
-grade student achievement data on Algebra 1 EOCs and the
school level mean of teacher performance to determine if a statistically significant

82
relationship existed. The following specific tests were conducted: (a) scatter plots to
graphically determine direction and strength of the relationship being tested, and (b) a
Spearman Rho correlation between student achievement level and teacher instructional
practice score. The researcher chose to run a Spearman Rho for Research Questions 1
through 3 due to the ordinal nature of the data, the limitations of the sample size, and the
exploration of relationships in the study.
The researcher also conducted a Chi-Square analysis on the teacher data received
from the school district‟s Department of Professional Development to answer Research
Question 4 in order to identify whether student growth or teacher years of experience
were related to instructional practice scores. The variables reviewed through this analysis
were the following: (1) student growth score, (2) teacher years of experience, and (3)
instructional practice scores.
Summary
The methodology and procedures used to conduct the study have been described
in Chapter 3. Specifically described were the statistical procedures used to correlate
student mean developmental scale scores on the FCAT 2.0 Reading and Algebra 1 End-
of-Course Assessments and school-wide teacher instructional practices scores among
nine high schools in a large suburban school district in Central Florida. Additionally, a
Chi-Square analysis was conducted to identify if a teacher‟s student growth scores or
years of experience were related to the instructional practice score received during the

83
2011-2012 academic year. Chapter 4 includes a summary of the data analysis and the
presentation of results for the study.

84
CHAPTER 4
PRESENTATION AND ANALYSIS OF DATA
Introduction
The purpose of this study was to examine the initial year of implementation of the
Marzano Causal Teacher Evaluation Model tool as it related to student achievement in a
large suburban school district in Central Florida. This chapter is a presentation and
analysis of the data used to answer the research questions and hypotheses in this study.
Included is a summary of the data analysis and presentation of results.
Descriptive Statistics
Descriptive statistics for 9th
- and 10th
-grade students who took the FCAT 2.0
Reading assessment are summarized in Tables 13 and 14 respectively. These tables
report the mean developmental scale scores and standard deviations for FCAT 2.0
Reading student achievement by demographic characteristic for students in all of the
schools identified in this study. However, “no data are reported when fewer than 10
students were tested or when all students are in the same score category” (Florida
Department of Education, 2012f, endnote).

85
Table 13
Student Mean Developmental Scale Scores for Florida Comprehensive Assessment Test
(FCAT) 2.0 Grade 9 Reading by Ethnicity, Gender, ESE, and ELL
Descriptor N
Mean
Developmental
Scale Score
Standard
Deviation
Total Students 4,021 238
Race/Ethnicity
White, Non-Hispanic 1,098 244 4.56
Black or African American, Non Hispanic 479 235 1.81
Hispanic/Latino 2,230 245 1.96
Asian 107 245 4.67
American Indian or Alaska Native 28 * *
Native Hawaiian or Other Pacific Islander 3 * *
Multiracial 72 237 0.71
Unknown 4 * *
Gender
Female 1,991 239 0.63
Male 2,028 238 0.00
Unknown 2 * *
Subgroups
Exceptional Student Education (ESE) 429 217 15.15
English Language Learner (ELL 426 213 17.98 Note. * = suppressed data.

86
Table 14
Student Mean Developmental Scale Score for Florida Comprehensive Assessment Test
(FCAT) 2.0 Grade 10 Reading by Ethnicity, Gender, ESE, and ELL
Descriptor N
Mean
Developmental
Scale Score
Standard
Deviation
Total Students 3,572 244
Race/Ethnicity
White, Non-Hispanic 995 250 4.32
Black or African American, Non Hispanic 424 240 3.07
Hispanic/Latino 1,938 241 2.20
Asian 103 245 0.55
American Indian or Alaska Native 14 * *
Native Hawaiian or Other Pacific Islander 7 * *
Multiracial 91 249 3.52
Gender
Female 1,776 244 0.00
Male 1,796 244 0.00
Subgroups
Exceptional Student Education (ESE) 343 223 15.11
English Language Learner (ELL 362 220 17.36 Note. * = suppressed data.
Descriptive statistics for 9th
-grade students who took the Algebra 1 EOC
assessment are summarized in Table 15. This table reports the mean developmental scale
scores and standard deviations for Algebra 1 EOC student achievement by demographic
characteristic for students in all of the schools identified in this study. However, “to
provide meaningful results and to protect the privacy of individual students, data are
reported only when the total number of students in a group is at least 10 and when the
performance of individuals is not disclosed. An asterisk (*) appears when data are
suppressed” (Florida Department of Education, 2012b, endnote).

87
Table 15
Student Mean Developmental Scale Score for Algebra 1 End-of-Course (EOC)
Examination Grade 9 by Ethnicity, Gender, ESE, and ELL
Descriptor N
Mean
Developmental
Scale Score
Standard
Deviation
Total Students 2,305 394
Race/Ethnicity
White, Non-Hispanic 488 390 2.51
Black or African American, Non Hispanic 311 382 8.04
Hispanic/Latino 1,405 393 0.72
Asian 42 * *
American Indian or Alaska Native 14 * *
Native Hawaiian or Other Pacific Islander 3 * *
Multiracial 42 392 1.27
Gender
Female 1,080 394 0.17
Male 1,225 394 0.02
Subgroups
Exceptional Student Education (ESE) 338 371 16.12
English Language Learner (ELL 397 375 12.99 Note. * = suppression of data.
The teacher population addressed in Research Questions 1 through 3 is described
in Table 16. These data were extracted from school improvement plans which were self-
reported by schools. The table reports the rounded mean number of teachers in the
demographic categories listed across the nine schools in the study.
The data for the teacher population (n = 954) used in Research Question 4 was
received from the school district‟s Department of Professional Development. Descriptive
statistics for these data are summarized in Table 17. The Student Growth Score ( =
3.50) was slightly higher than the instructional practice score ( = 3.21). As shown in
Figure 1, the number of teachers in Category II (4-9 years) was the highest (n = 337).

88
Teachers listed as Category 1b (0-3 years without hold harmless agreement) (n = 249)
followed. The least number of teachers were found in Category B (unknown variable).
Table 16
Teacher Demographics Across the Nine High Schools in the Study
Descriptor n Mean
Standard
Deviation
Total Instructional Staff 9 100 37.93
Years of Experience
Less than 1 year 9 5 5.01
1-5 years 9 29 15.29
6-14 years 9 39 16.31
15+ years 9 25 11.24
Education/Professional Development
Advanced degrees 9 42 20.89
Highly qualified 9 95 38.33
Reading endorsed 9 10 5.44
National Board Certified 9 4 1.99
ESOL Endorsed 9 35 20.45
Note: was rounded; Valid n (listwise) = 9.
Table 17
Individual Teacher Student Growth Score and Instructional Practice
Variables n Mean
Standard
Deviation
Student Growth Score 960 3.50 .485
Instructional Practice Score 955 3.21 .521
Valid n (listwise) 954

89
Figure 1. Teachers‟ years of experience by category

90
Testing the Research Questions and Hypotheses
Research Question 1
To what extent, if any, is there a relationship between 9th
-grade high school mean
student developmental scale score on FCAT 2.0 Reading and the school-wide mean
instructional practice score of teacher performance as measured by Marzano's Causal
Teacher Evaluation at nine high schools in a large suburban school district?
H01. There is no statistically significant relationship between 9th
-grade high school
mean student developmental scale scores on FCAT 2.0 Reading and the school-
wide mean instructional practice score of teacher performance as measured by
Marzano's Causal Teacher Evaluation at nine high schools in a large suburban
school district?
A scatter plot was run to graphically determine direction and strength of the
relationship between variables. Then, a Spearman‟s rho, non-parametric, correlation
procedure was run to assess the relationship between 9th
-grade high school mean student
developmental scale scores on FCAT 2.0 Reading and the school-wide mean
instructional practice score of teacher performance as measured by Marzano's Causal
Teacher Evaluation. The Spearman‟s rho revealed that there was no statistically
significant relationship between the mean 9th
-grade student developmental scale score on
FCAT 2.0 Reading and the school-wide mean instructional practice score of teacher
performance as measured by Marzano's Causal Teacher Evaluation (rs[9] = .433, p <
.005). Therefore, the researcher failed to reject the null hypothesis. The effect size of

91
this relationship was moderate (Cohen, 1988). Squaring the correlation coefficient
indicated that 9% of the common variance in the mean 9th
-grade student developmental
scale scores on FCAT 2.0 Reading was shared by the school-wide mean instructional
practice score (Slate & Rojas-LeBouef, 2011a). Likewise, 9% of the common variance
in the school-wide mean instructional practice score was explained by the mean 9th
-
grade student developmental scale scores on FCAT 2.0 Reading. Figure 2 and Table 18
display these data.
Figure 2. Scatterplot of Grade 9 Florida Comprehensive Assessment Test (FCAT) 2.0
Reading and instructional practice mean scores

92
Table 18
Spearman's Rho Analysis for Instructional Practice and Grade 9 Florida Comprehensive
Assessment Test (FCAT) 2.0 Reading Mean Scores
Variables
Instructional
Practice Score
Mean
FCAT
Reading
Mean,
Grade 9
Spearman's
Rho
Instructional Practice
Score Mean
Correlation Coefficient 1.000 .300
Sig. (2-tailed) .433
N 9 9
FCAT Reading
Mean, Grade 9
Correlation Coefficient .300 1.000
Sig. (2-tailed) .433 .
N 9 9
Research Question 2
To what extent, if any, is there a relationship between 10th
-grade high school
mean student developmental scale score on FCAT 2.0 Reading and the school-wide mean
instructional practice score of teacher performance as measured by Marzano's Causal
Teacher Evaluation at nine high schools in a large suburban school district?
H02. There is no statistically significant relationship between 10th
-grade high
school mean student developmental scale scores on FCAT 2.0 Reading and the
school-wide mean instructional practice score of teacher performance as
measured by Marzano's Causal Teacher Evaluation at nine high schools in a large
suburban school district?
A scatter plot was run to graphically determine direction and strength of the
relationship between variables. Then, a Spearman‟s rho, non-parametric, correlation
procedure was run to assess the relationship between 10th
-grade high school mean student
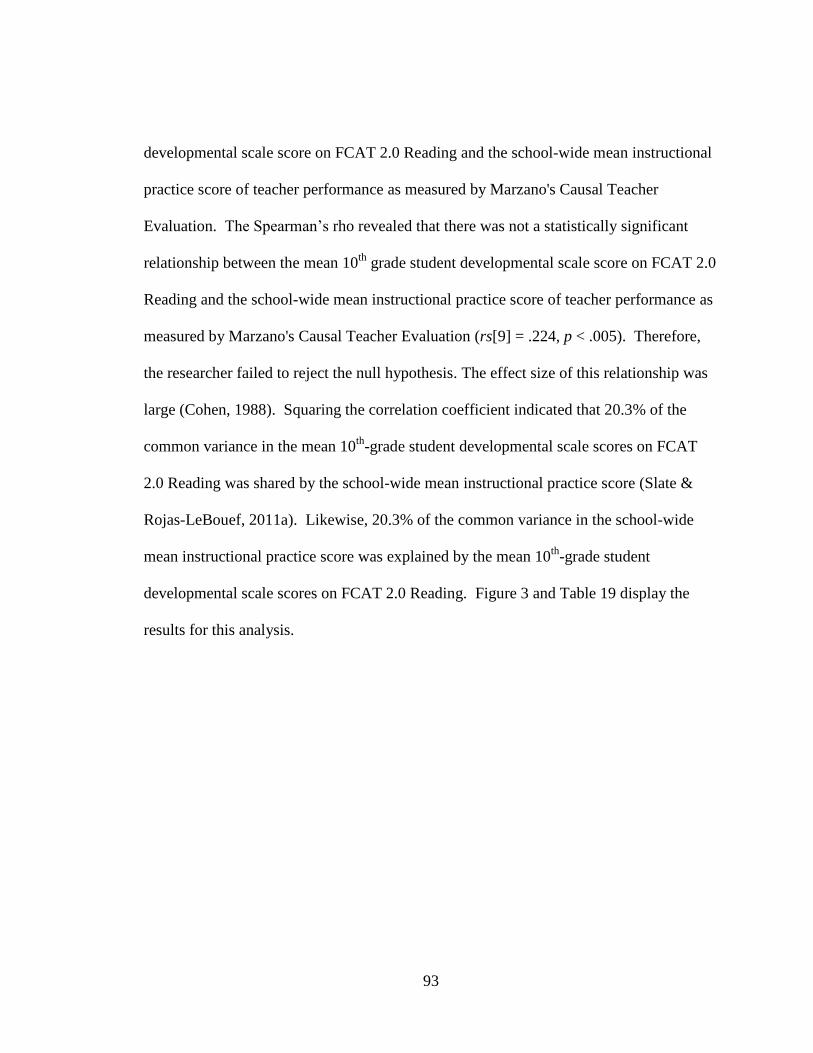
93
developmental scale score on FCAT 2.0 Reading and the school-wide mean instructional
practice score of teacher performance as measured by Marzano's Causal Teacher
Evaluation. The Spearman‟s rho revealed that there was not a statistically significant
relationship between the mean 10th
grade student developmental scale score on FCAT 2.0
Reading and the school-wide mean instructional practice score of teacher performance as
measured by Marzano's Causal Teacher Evaluation (rs[9] = .224, p < .005). Therefore,
the researcher failed to reject the null hypothesis. The effect size of this relationship was
large (Cohen, 1988). Squaring the correlation coefficient indicated that 20.3% of the
common variance in the mean 10th
-grade student developmental scale scores on FCAT
2.0 Reading was shared by the school-wide mean instructional practice score (Slate &
Rojas-LeBouef, 2011a). Likewise, 20.3% of the common variance in the school-wide
mean instructional practice score was explained by the mean 10th
-grade student
developmental scale scores on FCAT 2.0 Reading. Figure 3 and Table 19 display the
results for this analysis.

94
Figure 3. Scatterplot of Grade 10 Florida Comprehensive Assessment Test (FCAT) 2.0
Reading and instructional practice mean scores

95
Table 19
Spearman's Rho Analysis for Instructional Practice and Grade 10 Florida
Comprehensive Assessment Test (FCAT) 2.0 Reading Mean Scores
Variables
Instructional
Practice Score
Mean
FCAT
Reading
Mean,
Grade 10
Spearman's
Rho
Instructional Practice
Score Mean
Correlation
Coefficient
1.000 .450
Sig. (2-tailed) . .224
N 9 9
FCAT Reading Mean,
Grade 10
Correlation
Coefficient
.450 1.000
Sig. (2-tailed) .224
N 9 9
Research Question 3
To what extent, if any, is there a relationship between 9th
-grade high school mean
student developmental scale scores on End-of-Course Algebra 1 assessments and the
school-wide mean instructional practice score of teacher performance as measured by
Marzano's Causal Teacher Evaluation at nine high schools in a large suburban school
district?
H03. There is no statistically significant relationship between 9th
-grade high school
mean student developmental scale scores on End-of-Course Algebra 1
assessments and the school-wide mean instructional practice score of teacher
performance as measured by Marzano's Causal Teacher Evaluation at nine high
schools in a large suburban school district.

96
A scatter plot was run to graphically determine direction and strength of the
relationship between variables. Then, a Spearman‟s rho, non-parametric, correlation
procedure was run to assess the relationship between 9th
-grade high school mean student
developmental scale score on End-of-Course Algebra 1 assessments and the school-wide
mean instructional practice score of teacher performance as measured by Marzano's
Causal Teacher Evaluation. The Spearman‟s rho revealed that there is not a statistically
significant relationship between the mean 9th
-grade student developmental scale score on
the End-of-Course Algebra 1 assessment and the school-wide mean instructional
practice score of teacher performance as measured by Marzano's Causal Teacher
Evaluation (rs[9] = .732, p < .005). Therefore, the researcher failed to reject the null
hypothesis. The effect size of this relationship was small (Cohen, 1988). Squaring the
correlation coefficient indicated that 1.7% of the common variance in the mean 9th
-grade
student developmental scale scores on End-of-Course Algebra 1 assessment was shared
by the school-wide mean instructional practice score (Slate & Rojas-LeBouef, 2011a).
Likewise, 1.7% of the common variance in the school-wide mean instructional practice
score was explained by the mean 9th
-grade student developmental scale scores on the
End-of-Course Algebra 1 assessment. Figure 4 and Table 20 display the results for this
analysis.

97
Figure 4. Scatterplot of Grade 9 Algebra 1 End-of-Course (EOC) mean scores and
instructional practice scores
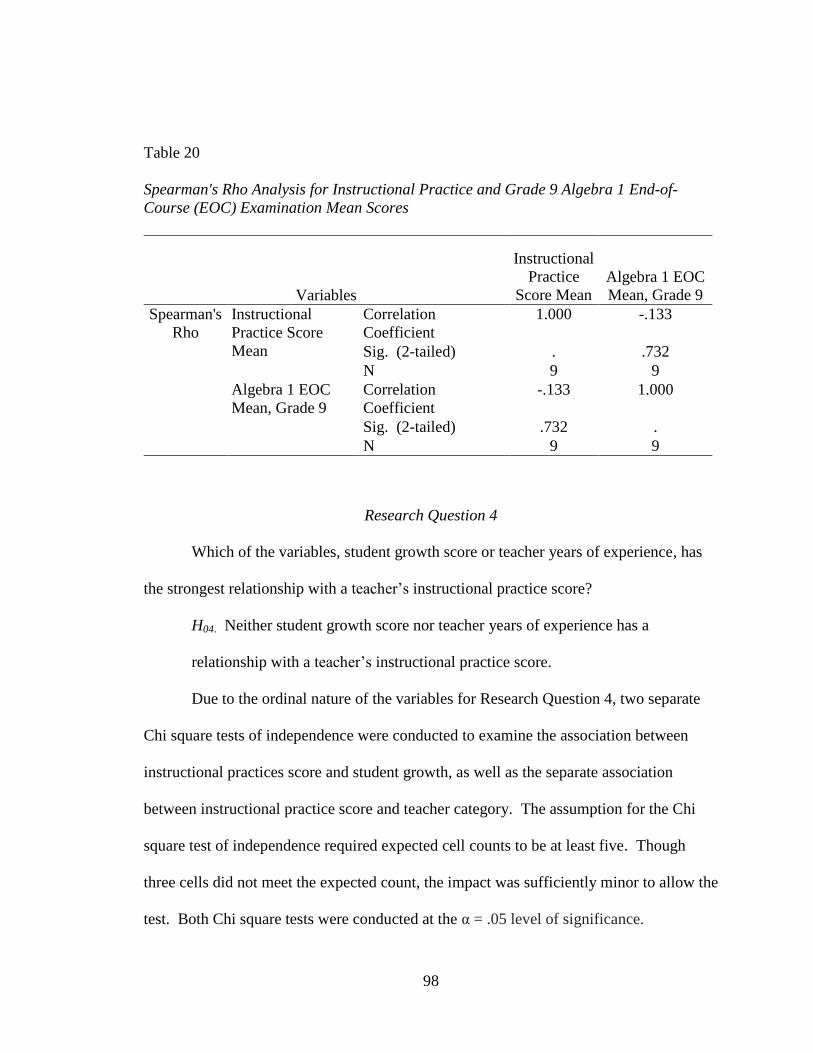
98
Table 20
Spearman's Rho Analysis for Instructional Practice and Grade 9 Algebra 1 End-of-
Course (EOC) Examination Mean Scores
Variables
Instructional
Practice
Score Mean
Algebra 1 EOC
Mean, Grade 9
Spearman's
Rho
Instructional
Practice Score
Mean
Correlation
Coefficient
1.000 -.133
Sig. (2-tailed) . .732
N 9 9
Algebra 1 EOC
Mean, Grade 9
Correlation
Coefficient
-.133 1.000
Sig. (2-tailed) .732 .
N 9 9
Research Question 4
Which of the variables, student growth score or teacher years of experience, has
the strongest relationship with a teacher‟s instructional practice score?
H04. Neither student growth score nor teacher years of experience has a
relationship with a teacher‟s instructional practice score.
Due to the ordinal nature of the variables for Research Question 4, two separate
Chi square tests of independence were conducted to examine the association between
instructional practices score and student growth, as well as the separate association
between instructional practice score and teacher category. The assumption for the Chi
square test of independence required expected cell counts to be at least five. Though
three cells did not meet the expected count, the impact was sufficiently minor to allow the
test. Both Chi square tests were conducted at the α = .05 level of significance.

99
Although the state and district calculate effectiveness on a scale of: (a) highly
effective, (b) effective, (c) needs improvement or developing, and (d) unsatisfactory, the
instructional practices score for the test were collapsed into levels of highly effective,
effective, and below effective. Further, the researcher also collapsed the student growth
score in the same manner. However, teacher categories or years of experience were not
collapsed for this study.
For the first Chi-Square test, there was a significant relationship, χ2(8) = 311.84, p
< .001, between instructional practice and teacher category. Category 1 and category B
indicated greater numbers of below effective instructors than expected and fewer than
expected were in category 2 (SR = 5.6, SR = 5.1, SR = -2.6, respectively). Likewise,
more highly effective instructors were in category 2I and category 3 than expected, and
fewer than expected were in category 1 and 1B (SR = 2.3, SR = 2.4, SR = -3.8, SR = -2.3
respectively). There was a small to moderate effect size as indicated by the Cramer‟s v
statistic (v = .23). Results of the analysis are displayed in Table 21.

100
Table 21
Chi-Square Analysis for Instructional Practice and Teachers by Category (N = 955)
Teacher Category
Instructional Practice Level 1 1B 2 3 B
Highly Effective
Count 10 45 108 81 2
% of Row 4.1 18.3 43.9 32.9 0.8
Standard Residual -3.8 -2.3 2.3 2.4 -0.6
Effective
Count 94 193 223 155 6
% of Row 14.0 28.8 33.2 23.1 0.9
Standard Residual 1.0 1.5 -0.8 -1.0 -0.8
Below Effective
Count 17 9 4 4 4
% of Row 44.7 23.7 10.5 10.5 10.5
Standard Residual 5.6 -0.3 -2.6 -1.8 5.1
Note. χ2 = 103.86, df = 8, p < .01, v = .23.
For the second Chi-Square test, there was a significant relationship, χ2(4) = 12.96,
p = .01, between instructional practice and student growth. A greater than expected
number of teachers with an instructional practice level of below effective yielded
unsatisfactory student growth (SR = 2.1). In terms of practical significance, there was a
small effect size as indicated by the Cramer‟s v statistic (v = .08). The results of this
analysis are located in Table 22.

101
Table 22
Chi-Square Analysis for Instructional Practice and Student Growth (N = 954)
Student Growth
Instructional Practice Level Highly Effective Effective Unsatisfactory
Highly Effective
Count 162 83 0
% of Row 66.1 33.9 0.0
Standard Residual 1.0 -1.1 -1.0
Effective
Count 406 262 3
% of Row 60.5 39.0 0.4
Standard Residual -0.2 0.3 0.1
Below Effective
Count 16 21 1
% of Row 42.1 55.3 2.6
Standard Residual -1.5 1.7 2.1
Note. χ2 = 12.96, df = 4, p = .01, v = .08.
Additional Analysis
Further review of data was conducted to graphically represent school information
as to the percentages of teachers receiving ratings and the percentage of overall student
growth at each school identified in this study. Figures 5 through 15, located in Appendix
F, present the percentages of teachers‟ calculated effectiveness on a scale of: (a) highly
effective, (b) effective, (c) needs improvement or developing, and (d) unsatisfactory for
instructional practice and student growth respectively.

102
Summary
The results of the tests conducted in the study have been outlined in Chapter 4.
Specifically described were the statistical results for the analysis of data to answer
Research Questions 1 through 3. These questions were analyzed using a Spearman Rho
correlation between student developmental mean scale scores on FCAT 2.0 and Algebra
1 EOC examinations and school-wide teacher instructional practices scores between and
among nine high schools in a large suburban school district in Central Florida. Further,
the Chi Square analysis results for Research Question 4 were described in order to
identify if there was a relationship between a teacher‟s student growth scores or years of
experience and the instructional practice score received during the 2011-2012 academic
year. An additional review of data was conducted to graphically present the percentages
of teachers receiving ratings of highly effective, effective, needs improvement,
developing, unsatisfactory in instructional practice and the percentage of overall student
growth at each school identified in this study. Chapter 5 includes a summary of the
study, discussion of findings, implications for practice, and recommendations further
research as found in the results for the study.

103
CHAPTER 5
SUMMARY, DISCUSSION, AND CONCLUSIONS
Introduction
In Chapter 4, a presentation and analysis of the data was provided. This chapter
contains a review of the purpose of the study and a summary and discussion of the
findings for the four research questions that guided the study. Implications for practice
based on the data obtained from this study are offered to contribute to the body of
research and knowledge surrounding teacher evaluation and student achievement.
Recommendations for further research based on the findings will be offered and
conclusions from this study will be presented.
Purpose of the Study
The purpose of this study was to examine the initial year of implementation of the
Marzano Causal Teacher Evaluation Model tool as it related to student achievement in a
large suburban school district in Central Florida. The researcher collected data from the
2011-2012 academic year to help understand to what extent, if any, there was a
relationship between teacher performance as measured by this model, teachers‟ years of
experience and student achievement.
Summary of the Study
At the time of the study, there was limited research on the implementation phase
of new teacher evaluation models required by recent legislation as they related to student
achievement within Florida school districts. Due to the limited sample, the data collected

104
in this research was specifically valid for the nine high schools and students within the
school district reviewed and may not be generalized to a different population. Though
sample sizes of nine were used in the analyses of data for Research Questions 1 through
3, the data contained in the nine samples related to the populations described for the nine
high schools. Research Question 4 contained more viable results due to a large sample
size (n = 954). However, specific information related to the collection and calculation of
the variable student growth score were contentious and require further review.
By identifying trends and changes to the system of teacher evaluation, the
researcher sought to establish patterns, themes and relationships between and among (a) a
teacher‟s instructional practice score, (b) a teacher‟s years of experience, and (c) student
achievement. By analyzing the system, an in-depth process for identifying themes and
relationships based on separate events, as advocated by Moberg (2001), was established.
To this aim, the researcher reviewed related literature and found that elements that make
it difficult to determine teacher effect are: issues such as the halo effect, the instability of
the value-added assessments, tenure, teacher effect, and student achievement (Feeley,
2002).
Data used in this study included high school level teacher evaluation and
performance data collected by administrators through (a) Marzano‟s Causal Teacher
Evaluation Model iObservation© protocol, (b) categorized teacher years of experience, (c)
student growth score based on a teacher‟s student success on statewide assessments as
calculated using VAM or an administered pre- and posttest, (d) school reported teacher
demographics on school improvement plans and (e) historical 9th
- and 10th
-grade student

105
achievement data on FCAT 2.0 Reading and 9th
-grade student achievement data on
Algebra 1 EOC Examinations. Notably, had 10th
-grade student achievement data been
available for the Algebra 1 EOC, analysis would have been conducted and discussed.
Discussion of the Findings
Research Question 1
To what extent, if any, is there a relationship between 9th
-grade high school mean
student developmental scale score on FCAT 2.0 Reading and the school-wide mean
Instructional Practice Score of teacher performance as measured by Marzano's Causal
Teacher Evaluation at nine high schools in a large suburban school district?
The findings for Research Question 1 indicated that there was no statistically
significant relationship between 9th
grade high school mean student developmental scale
scores on FCAT 2.0 Reading and the school-wide mean instructional practice score of
teacher performance as measured by Marzano's Causal Teacher Evaluation at nine high
schools in a large suburban school district. Therefore, the researcher failed to reject the
null hypothesis.
Research Question 2
To what extent, if any, is there a relationship between 10th
-grade high school
mean student developmental scale score on FCAT 2.0 Reading and the school-wide mean
Instructional Practice Score of teacher performance as measured by Marzano's Causal
Teacher Evaluation at nine high schools in a large suburban school district?
As in Research Question 1, the findings for Research Question 2 indicated that
there was no statistically significant relationship between 10th
-grade high school mean
student developmental scale scores on FCAT 2.0 Reading and the school-wide mean

106
instructional practice score of teacher performance as measured by Marzano's Causal
Teacher Evaluation at nine high schools in a large suburban school district. Therefore, the
researcher failed to reject the null hypothesis.
Research Question 3
To what extent, if any, is there a relationship between 9th
-grade high school mean
student developmental scale scores on End-of-Course Algebra 1 assessments and the
school-wide mean Instructional Practice Score of teacher performance as measured by
Marzano's Causal Teacher Evaluation at nine high schools in a large suburban school
district?
As in Research Questions 1 and 2, the findings for Research Question 3 indicated
that there was no statistically significant relationship between 9th
-grade high school mean
student developmental scale scores on End-of-Course Algebra 1 assessments and the
school-wide mean instructional practice score of teacher performance as measured by
Marzano's Causal Teacher Evaluation at nine high schools in a large suburban school
district. Therefore, the researcher failed to reject the null hypothesis.
Research Question 4
Which of the variables, student growth score or teacher years of experience has
the strongest relationship with a teacher‟s instructional practice score?
Unlike the findings in Research Questions 1 through 4, the findings for Research
Question 4 indicated that there was (a) a significant relationship between instructional
practice and teacher category, and (b) a significant relationship between instructional
practice and student growth. Between the variables, the strongest relationship was found
between a teacher‟s instructional practice score and teacher category. The strength of the

107
relationship between instructional practice score and teacher category was greater (v =
.23) than the strength of the relationship between instructional practice and student
growth (v = .08). Therefore, the researcher rejected the null hypothesis that neither
student growth score nor teacher years of experience has a relationship with a teacher‟s
instructional practice score.
The findings suggest that the greater the teacher category or years of experience,
the greater the likelihood that a teacher would receive an effective or highly effective
rating. Likewise, the lower the teacher category or years of experience, the less likely it
would be that a teacher would receive an effective or highly effective.
Additionally, the findings suggest that if the number of teachers who have
demonstrated student growth is greater than the number of highly effective or effective
teachers, teachers may be under evaluated and/or adversely affected. Likewise, if the
number of teachers who have a higher instructional practice score is greater than the
number with higher student growth, teachers may be over evaluated and/or more
positively affected than appropriate.
Implications for Practice
Overall, the data in this study was consistent with the assertion that
“approximately 1% of teachers are considered below effective or unsatisfactory”
(Educational Personnel, 2011a, p. 4). Reasons for the findings could be attributed to
issues discussed in the literature review regarding halo-effect; subjectivity, perceptions
and cognitive capacity of the evaluator; limited understanding of the expectations of the

108
evaluation model by teachers; or comfort level with using a new system to evaluate
teachers by administrators (Ballou, 2002; Bechger et al., 2010; Corcoran 2010; Gordon,
1999, Kwalwasser, 2011; Rebore, 2011; Springer, 2010; Stewart, 2012, Strong, 2012).
However, in-depth research is needed to determine the individual effects of these
concepts on student achievement.
At the time of the present study, changes to the system of teacher evaluation have
been deemed an absolute priority in order to reform the educational systems in America
(U.S. Department of Education, 2009). However, researchers have argued that “narrow
interest in individual results may undermine the process of reform” (Corcoran, 2010, p.
15).
Most notably, the use of the VAM model or pre- and posttests are not consistent
measures by which to make high stakes decisions that can affect a student‟s future or a
person‟s ability to work (Ballou, 2002). To this end, establishing consistent measures of
student growth will help policy makers more appropriately determine teacher effect on
student achievement. The use of VAM in the calculation of teacher evaluation should be
reviewed to determine the extent of its validity and reliability in identifying appropriate
teacher effect.
Additionally, the use of varying measures at the school level to determine student
growth for teachers who teach non-tested courses should be eliminated, and uniform
assessments should be created at the district or state level so that subjectivity and any
potential for misuse are minimalized (Resnick, 2009). Further, districts should review
teacher evaluation outcomes for trends and to determine if the evaluation tool is being

109
used to its fullest potential in order to help teachers improve. To this extent, further
research is needed to determine the individual teacher and student growth within the
formal expectations and exchanges identified within the context of teacher evaluation.
Recommendations for Further Research
The following recommendations for further study based on the findings of this
study include:
1. An expansion of this study with revisions to examine teacher and
administrator perceptions of the process of teacher evaluation in subsequent
years of implementation.
2. An expansion of this study with revisions at the district level to compare all
secondary schools including virtual and charter schools with teacher to student
pairing of data.
3. A study that would include data related to the specific domain elements used
for observation, teacher years of experience, teacher instructional practice
scores, number of observations as well as final evaluation scores which
include VAM.
4. A study that would analyze student achievement at each secondary grade level
(6-12) on summative assessments (FCAT Reading 2.0, Writing, Algebra 1
EOC, Geometry EOC, U.S. History EOC, and Biology EOC) with student to
teacher pairing of data, teacher effectiveness ratings, and number of
observations.

110
5. A study of the specific behaviors and strategies used by teachers at the
classroom level which are expected to improve student achievement.
6. A study focusing on the different teacher evaluation systems and the levels of
teacher effectiveness found throughout the state.
7. A study focusing on the different teacher evaluation systems and the levels of
teacher effectiveness found throughout another state, region or the entire
country.
Conclusion
As was determined in the literature review conducted for this study, educational
researchers and scholars have been continually challenged to define the relationships
between teacher effectiveness and student achievement. Unfortunately, even with
extensive research, and the findings of this study, little has been found to precisely define
the relationship between student achievement and teacher effectiveness (Jackson &
Lunenburg, 2010). Still, with legislative initiatives at the national and state levels as the
guiding foundation for changes to the systems of teacher evaluation and accountability
for student achievement, new evaluation models are being mandated (U.S. Department of
Education, 2009; Education Personnel, Florida, SB736, 2011a).
Understanding the preliminary implementation of a new model for teacher
evaluation was important. Due to limitations and delimitations related to the population
and specific calculations of student growth scores, the data reviewed showed little to no
significance. However, the results did provide direction for continued research on the

111
relationships between student achievement and teacher evaluation. To this aim, it is vital
for school districts to identify trends in teacher effectiveness ratings as they relate to
student achievement, establish consistent measures of student growth and utilize teacher
evaluation models to their fullest potential to ensure that both teachers and students
continue to improve and are able to compete in a global marketplace.

112
APPENDIX A
APPROVALS TO CONDUCT RESEARCH

113

114

115

116
APPENDIX B
FLORIDA OUTLINE OF TEACHER EVALUATION MODELS

117
**Table retrieved from (Florida Department of Education, 2012e).

118
APPENDIX C
MARZANO TEACHER EVALUATION LEARNING MAP

119

120
Note: Reproduced with permission from Marzano Art of Science Teacher Evaluation
Model, Copyright 2011 by Robert J. Marzano. (See also LSI, 2012)

121
APPENDIX D
REQUEST AND PERMISSION TO USE MARZANO MODEL

122

123
From: Phil Warrick <[email protected]>Sun, Jul 08, 2012 6:48:58 AM
Subject: Request Granted
To: Dana Jacobson
Dana
Below I have copied Dr. Marzano's email text granting you permission to use the scales for teacher
feedback.
I'll forward the official letter to you via attachment pdf once I scan it.
Phil
Bob's Reply Below:
Phil
I can automatically give them [Amy Flowers and Dana Jacobson] permission to reproduce and use in any
way that is related to their research the scales for all 60 elements of my model-- please pass that on to
them-- they will have to get permission, though, from lsi to use screenshots from iobservation but I know
that will not be a problem. Thanks
Bob
__________
Dr. Phil Warrick
Associate Vice President
Marzano Research Lab
9000 E. Nichols Ave. Ste. 112
Englewood, CO 80112
512-922-5114

124
APPENDIX E
SAMPLE STUDENT LEARNING GROWTH VALUE COMPUTATION

125
(School District of Osceola County [SDOC], 2012b, p. 7)

126
APPENDIX F
INSTRUCTIONAL STAFF RATINGS BY SCHOOL
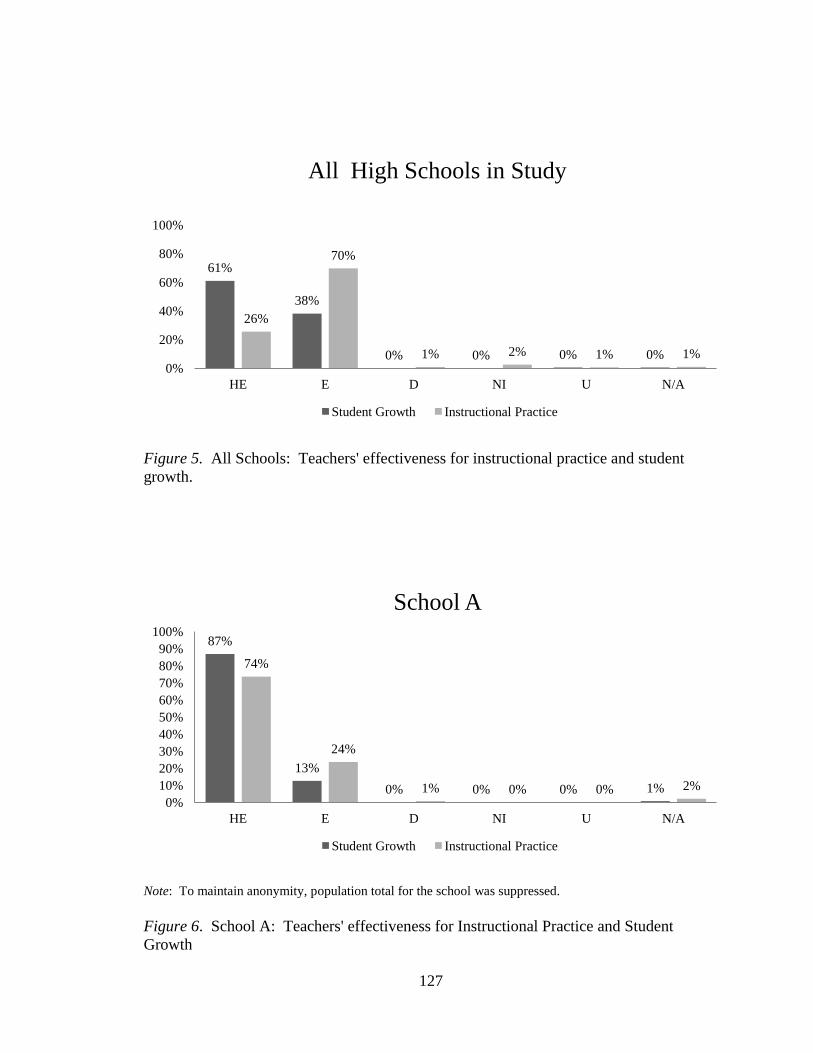
127
Figure 5. All Schools: Teachers' effectiveness for instructional practice and student
growth.
Note: To maintain anonymity, population total for the school was suppressed.
Figure 6. School A: Teachers' effectiveness for Instructional Practice and Student
Growth
61%
38%
0% 0% 0% 0%
26%
70%
1% 2% 1% 1% 0%
20%
40%
60%
80%
100%
HE E D NI U N/A
All High Schools in Study
Student Growth Instructional Practice
87%
13%
0% 0% 0% 1%
74%
24%
1% 0% 0% 2%
0%
10%
20%
30%
40%
50%
60%
70%
80%
90%
100%
HE E D NI U N/A
School A
Student Growth Instructional Practice

128
Note: To maintain anonymity, population total for the school was suppressed.
Figure 7 School B: Teachers' effectiveness for instructional practice and student growth
Note: To maintain anonymity, population total for the school was suppressed.
Figure 8. School C: Teachers' effectiveness for instructional practice and student growth
52% 47%
0% 0% 0% 1%
33%
62%
1% 2% 2% 0% 0%
10%
20%
30%
40%
50%
60%
70%
80%
90%
100%
HE E D NI U N/A
School B
Student Growth Instructional Practice
91%
9% 0% 0% 0% 0%
15%
83%
1% 1% 0% 0% 0%
10%
20%
30%
40%
50%
60%
70%
80%
90%
100%
HE E D NI U N/A
School C
Student Growth Instructional Practice

129
Note: To maintain anonymity, population total for the school was suppressed.
Figure 9. School D: Teachers' effectiveness for instructional practice and student
growth
Note: To maintain anonymity, population total for the school was suppressed.
Figure 10. School E: Teachers' effectiveness for instructional practice and student
growth
51% 48%
0% 0% 0% 1% 7%
88%
1% 1% 0% 3%
0%
10%
20%
30%
40%
50%
60%
70%
80%
90%
100%
HE E D NI U N/A
School D
Student Growth Instructional Practice
74%
25%
0% 0% 1% 0%
15%
80%
2% 3% 0% 0% 0%
10%
20%
30%
40%
50%
60%
70%
80%
90%
100%
HE E D NI U N/A
School E
Student Growth Instructional Practice

130
Note: To maintain anonymity, population total for the school was suppressed.
Figure 11. School F: Teachers' effectiveness for instructional practice and student
growth
Note: To maintain anonymity, population total for the school was suppressed.
Figure 12. School G: Teachers' effectiveness for instructional practice and student
growth
47% 52%
0% 0% 1% 0% 1%
80%
2%
12% 4%
0% 0%
10%
20%
30%
40%
50%
60%
70%
80%
90%
100%
HE E D NI U N/A
School F
Student Growth Instructional Practice
51% 49%
0% 0% 0% 0%
51% 49%
0% 0% 0% 0% 0%
10%
20%
30%
40%
50%
60%
70%
80%
90%
100%
HE E D NI U N/A
School G
Student Growth Instructional Practice

131
Note: To maintain anonymity, population total for the school was suppressed.
Figure 13. School H: Teachers' effectiveness for instructional practice and student
growth
Note: To maintain anonymity, population total for the school was suppressed.
Figure 14. School I: Teachers' effectiveness for instructional practice and student
growth.
26%
74%
0% 0% 1% 0%
22%
75%
1% 1% 0% 1% 0%
10%
20%
30%
40%
50%
60%
70%
80%
90%
100%
HE E D NI U N/A
School H
Student Growth Instructional Practice
73%
25%
0% 0% 3% 0% 5%
95%
0% 0% 0% 0% 0%
10%
20%
30%
40%
50%
60%
70%
80%
90%
100%
HE E D NI U N/A
School I
Student Growth Instructional Practice

132
LIST OF REFERENCES
Alexander, K., & Alexander, M. D. (2012). American public school law (8th
ed.).
Belmont, CA: Wadworth Cengage Learning.
Alliger, G. M., & Williams, K. J. (1989). Confounding among measures of leniency and
halo. Educational and Psychological Measurement 49(1).
American Institutes for Research. (2011a). Florida’s value-added technical assistance
workshop [Power Point Presentation]. Retrieved from
http://www.fldoe.org/committees/pdf/august12tammpres.pdf
American Institutes for Research. (2011b). Value-added model for measuring student
learning gains: General approach and framework for evaluating candidate
models. Retrieved from https://fldoe.org/committees/pdf/sghandout.pdf
American Heritage Dictionary. (2009). Halo effect. American Heritage Dictionary of the
English Language, (4th
ed.) Houghton Mifflin.
American Recovery and Reinvestment Act (ARRA) of 2009, Pub. L No. 1-407,
§2 U.S.C. 661 and 661a (2009). Washington, DC: U.S. Government Printing
Office.
Ashburn, D. C. (2001, February). Memorandum: Florida performance measurement
system (FPMS). Tallahassee, FL: Florida Department of Education
Aud, S., Hussar, W., Johnson, F., Kena, G., Roth, E., Manning, E. . . Zhang, J. (2012).
The condition of education 2012 (NCES 2012-045). National Center For
Education Statistics. Retrieved from http://nces.ed.gov
Ballou, D. Sizing up test scores. Education Next 2(2). Retrieved from
educationnext.org/files/ednext20022_10.pdf
Bandura, A. (2000). Exercise of human agency through collective efficacy. Current
Direction in Psychological Science 9 (3), 75-78.
Battalaglieri, T., & Chatterji, M. (2010, November 30). Campaign to market Florida’s
grab-bag of reforms is an exercise in misused data. East Lansing, MI: Great
Lakes Center for Education Research and Practice. Retrieved from
http://nepc.colorado.edu/newsletter/2010/11/campaign-market-
florida%E2%80%99s-grab-bag-reforms-exercise-misused-data

133
Baeder, J. (2011, June 20). Marzano’s “causal” evaluation system. [Web log post].
Retrieved from
http://blogs.edweek.org/edweek/on_performance/2011/06/marzanos_causal_evalu
ation_system.html?qs=marzano+evaluation
Bechger, T., Maris, G., & Hsiao, Y. P. (2010). Detecting halo effects in performance-
based examinations. Applied Psychological Measurement 34, 607-619.
Beers, B. (2004). Who is learning? Principal Leadership, 4(9), 28-33.
Berry, K., & Herrington, C. D. (2011). States and their struggles with NCLB: Does the
Obama blueprint get it right? Peabody Journal of Education, 86(3), 272-290.
Bolman, L. G., & Deal, T. E. (2003). Reframing organizations: Artistry, choice, and
leadership (3rd
ed.). San Francisco: Jossey-Bass.
Brevard County Public Schools (2011). Brevard public schools instructional personnel
performance appraisal system. Viera, FL: Author
Brown, J. (2002). Training needs assessment: A must for developing an effective
training program. Public Personnel Management, 31(4), 569-578.
Caldwell, R. M. (1977, April). The acquisition of specific teaching behaviors through a
teacher center consortium and the effects of those behaviors on pupil perceptions
of the learning environment. Paper presented at the Annual Meeting of the
American Educational Research Association, New York, NY.
Cohen, J. (1988). Statistical power analysis for the behavioral sciences (2nd ed.).
Hillsdale, NJ: Lawrence Erlbaum.
Coleman, J., Schroth, S. T., Molinaro, L., & Green, M. (2005). Tenure: An important due
process right or a hindrance to change in the schools? Journal of Personnel
Evaluation in Education, 18(3), 219-231.
Common Core State Standards Initiative. (2012). Retrieved from
http://www.corestandards.org/about-the-standards
Copa, J. (2012). Information for the public, the best educators in the world: Great
teachers and principals for Florida’s students. Florida Department of Education.

134
Corcoran, S. P. (2010). Can teachers be evaluated by their students’ test scores? Should
they be? The use of value-added measures of teacher effectiveness in policy and
practice. Education policy for action series: Education challenges facing New
York City. Providence, RI: Annenburg Institute for School Reform, Brown
University.
Craig, J., Butler, A., Cairo, L., Wood, C., Gilchrist, C., Holloway, J. . . . Moats, S. (2005).
A case study of six high-performing schools in Tennessee. Charleston, WV:
Appalachia Educational Laboratory at Edvantia.
Danielson, C. (2010). Evaluations That Help Teachers Learn. Educational Leadership,
68(4), 35-39. Danielson, C. (2011). The framework for teaching evaluation
instrument. Princeton, NJ: The Danielson Group.
Desander, M. K. (2000). Teacher evaluations and merit pay: Legal consideration,
practical concerns. Journal of Personnel Evaluation in Education, 14, 309-312.
Dictionary.com. (2012). Brick and Mortar. Retrieved from
http://dictionary.reference.com/browse/brick-and-mortar
Dietel, R. (2011). Testing to the top: Everything but the kitchen sink? Phi Delta Kappan,
92(8), 32-36.
Dillon, S. (2010, August 31). Formula to grade teachers‟ skill gains acceptance and
critics. The New York Times. Retrieved from http://www.nytimes.com.
Duncan, A. (2010a). Letter to Governors announcing Race to the Top phase 2 grantees.
Washington, DC: U.S. Department of Education.
Duncan, A. (2010b). Overview information; Race to the Top fund assessment program:
Notice inviting applications for new awards for fiscal year 2010. In Federal
Register Vol. 75, No. 68, Notices. Washington, DC: U.S. Department of
Education.
Education Personnel, Florida, SB736 Agency Legislative Bill Analysis, (2011a).
Tallahassee, FL: Florida State Legislature.
Education Personnel, Florida, SB736 Final Bill Analysis, (2011b). Tallahassee, FL:
Florida State Legislature.
Educational Management Consultant Services (EMCS) (2011). The school board of Gulf
County performance appraisal system: Race to the top. Titusville, FL: Author.

135
Elementary and Secondary Education Act (ESEA) of 1965, 20 U.S.C. § 2, 239 Stat. 1100
(1965). Washington, DC: U.S. Government Printing Office.
FEA. (2011). SB 736 Lawsuit filed by FEA. Retrieved from https://www.fea.org
Feeley, T. H. (2002). Comment on halo effects in rating and evaluation research. Human
Communication Research 28(4), 578-586.
Fitzpatrick, J. L., Sanders, J. R., and Worthen, B. R. (2011). Program Evaluation:
Alternative approaches and practical guidelines (4th
ed.) Upper Saddle River, NJ:
Pearson.
Florida Department of Education. (2012a). Algebra 1 EOC assessment test specifications
(Version 2) Retrieved from
http://fcat.fldoe.org/eoc/pdf/FL10_Alg_EOC_ISB_WT_r4g.pdf
Florida Department of Education. (2012b). Algebra 1 EOC student performance report:
Demographic report. Retrieved from http://app1.fldoe.org/FEocDemographics
Florida Department of Education. (2012c). FCAT 2.0 Reading test item specifications:
Grades 9-10. Retrieved from http://fcat.fldoe.org/fcat2/itemspecs.asp
Florida Department of Education (2012d). Florida’s common language of instruction.
Retrieved from www.fldoe.org/profdev/pdf/CommonLanguage.pdf
Florida Department of Education. (2012e). Florida state models of evaluation systems.
Retrieved from https://www.fldoe.org/profdev/fsmes.asp
Florida Department of Education. (2012f). Student FCAT 2.0 performance results:
School reading demographic report. Retrieved from
https://app1.fldoe.org/FCATDemographics
Florida Department of Education. (2012g). Understanding Florida end-of-course
assessment reports. Retrieved from
http://fcat.fldoe.org/eoc/pdf/2012UEOCR12.pdf
Florida Department of Education (2012h). Understanding FCAT 2.0 reports. Retrieved
from. http://fcat.fldoe.org/fcat2/pdf/s12uf2r.pdf
Florida Office of the Commissioner of Education (2009). Request for application (RFA
Entitlement). Tallahassee, FL: Florida Department of Education.
Florida Rule 6A-5.065 (2) (2012). Tallahassee, FL: Florida State Legislature.

136
Florida S. Bill 736 (2011). Tallahassee, FL: Florida State Legislature.
Florida State Board of Education. (2012). Overview of Florida’s new instructional
personnel evaluation system. Tallahassee, FL.
Frase, L.E. (1993). Staying legal and out of trouble. In Frase, L. E. (Ed.), Maximizing
People Power in Schools, (102-127). Newbury Park, CA: Corwin Press.
Galley, L. A. (2011). The research vs. the rhetoric. Education Digest, 77(3), 41-46.
Ginsberg, M. B., & Murphy, D. (2002). How walkthroughs open doors. Educational
Leadership, 59(8), 34-36.
Goe, L., Holdheide, L., & Miller, T. (2012). A practical guide to designing
comprehensive teacher evaluation systems: A tool to assist in the development of
teacher evaluation systems. Washington, DC: National Comprehensive Center for
Teacher Quality.
Goldhaber, D., & Hansen, M. (2010). Assessing the potential for using value-added
estimates of teacher job performance for making tenure decisions (Working Paper
31). Washington, D.C: National Center for Analysis of Longitudinal Data in
Education Research. Calder Urban Institute.
Gordon, J. R. (1999). Organizational Behavior: A Diagnostic Approach. (6th
ed.) Upper
Saddle River, NJ: Prentice Hall.
Haithcock. F. (2011). Race to the Top--Local instructional improvement system minimum
standards. Tallahassee, FL: Florida Department of Education.
Hanushek, E. A. (2009). Teacher deselection. In D. Goldhaber, & J. Hannaway (Eds.).
Creating a new teaching profession (pp.165-180). Washington, DC: Urban
Institute Press.
Haystead, M. W., & Marzano, R. J. (2009). Meta-analytic synthesis of studies conducted
at Marzano Research Laboratory on instructional strategies. Englewood, CO:
Marzano Research Laboratory.
Heneman, H. G., & Milanowski, A. T. (2004). Alignment of human resource practices
and teacher performance competency. Peabody Journal of Education, 79(4), 108-
125.
Hilgevoord, J. & Uffink, J. (2001). The Uncertainty Principle. In E. N. Zalta (Ed.)
The Stanford encyclopedia of philosophy (Summer 2012 ed.) Retrieved from
http://plato.stanford.edu/archives/sum2012/entries/qt-uncertainty

137
Hinchey, P. H. (2010). Getting teacher assessment right: What policymakers can learn
from research. Boulder, CO: National Education Policy Center.
Hollifield C. S. (2012) What are the new teacher evaluations in Florida? Part 3 of 3.
Professional Educators Network of Florida. Retrieved from
http://penfl.affiniscape.com/associations/14247/files/Teacher%20Evaluations%20
Part%203.pdf
Isensee, L. (2012). Judge tosses teacher evaluation rule. The Miami Herald. Retrieved
from http://www.miamiherald.com/2012/08/23/2965554/judge-tosses-teacher-
evaluation.html
Jackson, S. A., & Lunenburg, F. C. (2010). School performance indicators, accountability
ratings and student achievement. American Secondary Education, 39(1), 27-44.
Jimmieson, N. L., Hannam, R. L., & Yeo, G. B. (2010). Teacher organizational
citizenship behaviours and job efficacy: Implications for student quality of school
life. British Journal of Psychology, 101(3), 453-479.
Kane, T. J., Taylor, E. S., Tyler, J. H., & Wooten, A. L. (2011). Identifying effective
classroom practices using student achievement data. Journal of Human
Resources, 46(3), 587-613.
Kessor, C. A. (2005). Administrative visibility and its effect on classroom behavior.
NASSP Bulletin, 89(643), 64-73.
Kwalwasser, H. (January, 2011). Overselling the myth of the bad teacher and tenure.
School Administrator 68(1), 39.
Ladner, M., & Burke, L. M. (2010). Closing the racial achievement gap: Learning from
Florida's reforms. Backgrounder No. 2468. Washington, DC: The Heritage
Foundation.
Learning Sciences International (LSI). (2011a). Florida Department of Education
support for local education agencies: FEAPs crosswalk to Marzano Art and
Science of Teaching. Retrieved from http://www.fldoe.org/profdev/fsmes.asp
Learning Sciences International (LSI). (2011b). Florida model evaluation system:
Calculating the instructional practice score for the annual evaluation [Power
Point Presentation]. Professional development presentation with the School
District of Osceola County, FL.

138
Lunenberg, F. C., & Ornstein, A. C. (2000). Educational administration: Concepts and
practices (3rd
ed.) Belmont, CA: Wadsworth.
Mahar, J., Strobert, B. (2010). The use of 360-degree feedback compared to traditional
evaluative feedback for the professional growth of teachers in K-12 education.
Planning and Changing 41(3/4), 147-160.
Marzano, R. (2007). The art and science of teaching: A comprehensive framework for
effective instruction. Alexandria, VA.: Association for Supervision and
Curriculum Development.
Marzano, R. (April, 2011). Research base and validation studies on the Marzano
evaluation model. Retrieved from http://www.marzanoevaluation.com
Marzano, R., Frontier, T., & Livingston, D. (2011). Effective supervision: Supporting the
art and science of teaching. Alexandria, VA: Association for Supervision and
Curriculum Development.
Marzano R., Waters, T., & McNulty, B. (2005). School leadership that works: From
research to results. Alexandria, VA: Association for Supervision and Curriculum
Development.
Matula, J. J. (2011). Embedding due process measures throughout the evaluation of
teachers. NASSP Bulletin, 95(2), 99-121.
McNeil, L. M., & Coppola, E. M. (2006). Official and unofficial stories: Getting at the
impact of policy on educational practice. In P. B. Elmore (Ed.), Handbook of
complementary methods in education research (pp. 681-699). Mahwah, NJ:
Lawrence Erlbaum.
Merrett, F. (2006). Reflections on the Hawthorne effect. Educational Psychology 26(1),
143-146.
Milanowski, A., Prince, C., & Koppich, J. (2007). Observations of teachers’ classroom
performance. Washington, DC: Center for Educator Compensation Reform.
Miller, D. C., & Warren, L. K. (2011). Comparative indicators of education in the United
States and other G-8 countries: 2011. NCES 2012-007. Washington, DC:
National Center for Education Statistics.
Moberg, D. (2001). Diagnosing system states: Beyond Senge‟s archetypes. Emergence.
3(2), 19-36.

139
National Commission on Excellence in Education. (1983). A nation at risk: The
imperative for educational reform. Washington, DC: U.S. Department of
Education, 1983.
National Council on Teacher Quality [NCTQ] (2010). Blueprint for change in Florida:
State teacher policy yearbook, 2010. National Council on Teacher Quality.
Retrieved from www.nctq.org
National Council on Teacher Quality [NCTQ] (2011). State of the states: Trends and
early lessons on teacher evaluation and effectiveness policies. National Council
on Teacher Quality. Retrieved from www.nctq.org
National School Boards Association (NSBA). (2012). Issue Brief: Teacher and principal
effectiveness. Alexandria, VA: NSBA Office of Advocacy.
No Child Left Behind Act (NCLB) of 2001, 20 U.S.C. § 6301 et seq. (2002).
Washington, DC: U.S. Government Printing Office.
Office of Human Resources. (2004). Conducting effective performance appraisals: Tips
for supervisors. Administrator, 23(1), 3. University of California Berkeley:
Author.
Office of Personnel Management [OPM]. (2011). Summary of reduction in force under
OPM's regulations. Retrieved from http://www.opm.gov/Reduction_In_Force
Ogawa, R. T., & Collom, E. (2000). Using performance indicators to hold schools
accountable: Implicit assumptions and inherent tensions. Peabody Journal of
Education, 75(4), 200-215.
Organization for Economic Co-operation and Development [OECD]. (2009). Teacher
evaluation: A conceptual framework and examples of country practices. OECD
review on evaluation and assessment frameworks for improving school outcomes.
Retrieved from www.oecd.org/dataoecd/16/24/44568106.pdf
Owens, R. G. (2004). Organizational behavior in education: Adaptive leadership and
school reform (8th ed.). New York: Pearson.
Partnership for Assessment of Readiness for College and Careers [PARCC]. (2012).
About PARCC. Retrieved from: parcconline.org/about-parcc.
Peterson, K. (2004). Research on school teacher evaluation. NASSP Bulletin, 88(639), 60-
79.

140
Peterson, P., Hanushek, E. A., Woessmann, L., & Riddell, J. (2010). Student achievement
gains in the U.S. fail to close international achievement gap, but Florida ranks
second in the nation in test-score improvement. Education Next. Retrieved from
http://educationnext.org/student-achievement-gains-in-u-s-fail-to-close-
international-achievement-gap/
Phillips, K. R. (2010). What does “highly qualified” mean for student achievement?
Evaluating the relationships between teacher quality indicators and at-risk
students‟ mathematics and reading achievement gains in first grade. The
Elementary School Journal, 110(4), 464-493.
Postal, L. (2012, July 13). New teacher evaluation plan, Marzano model frustrating to
teachers in its first year, many said. [Web log post]. Retrieved from
http://blogs.orlandosentinel.com/news_education_edblog/2012/07/new-teacher-
evaluation-plan-marzano-model-frustrating-to-teachers-in-its-first-year-many-
said.html
Psychology Writing Center. (2010). Reporting Results of Common Statistical Tests in
APA Format. University of Washington: Author. Retrieved from
http://www.psych.uw.edu/writingcenter/writingguides/pdf/stats.pdf
Rakoczy, K., Klieme, E., Bürgermeister, A., & Harks, B. (2008). The interplay between
student evaluation and instruction: Grading and feedback in mathematics
classrooms. Zeitschrift Für Psychologie/Journal of Psychology, 216(2), 111-124.
Rasch, L. (2004). Employee performance appraisals and the 95/5 rule. Community
College Journal of Research and Practice, 28(5), 407-414.
Ravitch, D. (2010). The death and life of the great American school system: How testing
and choice are undermining education. New York: Basic Books.
Rebore, R. (2011). Human resources administration in education: A management
approach (9th
ed.). Upper Saddle River, NJ: Pearson.
Remmers, H. H. (1934). Reliability and halo effect of high school and college students‟
judgments of their teachers. Journal of Applied Psychology, 18(5) 619-630.
Resnick, M. A. (2009). With ESEA and Race to the Top, bold action on the horizon.
American School Board Journal, 196(10), 7-8.
Rivkin, S. (November, 2007). Value-added analysis and education policy. Center for
analysis of longitudinal data in education research. Brief 1. Retrieved from
http://www.caldercenter.org/

141
Robelen, E. W. (2011). Proficiency eludes U.S. students on science NAEP. Education
Week, 30(19).
Sanders, W. L., & Horn, S. P. (1994). Research findings from the Tennessee value-added
assessment system (TVAAS) database: Implications for educational evaluation
and research. Journal of Personnel Evaluation in Education, 12(3), 247-356.
School District of Osceola County [SDOC]. (2011). Race to the top: Great teachers and
leaders. Kissimmee, FL: Author.
School District of Osceola County [SDOC]. (2012a). EOC geometry grade level roster.
Kissimmee, FL: Author.
School District of Osceola County [SDOC]. (2012b). Procedures for completing the
individual professional development plan (IPDP). (1-12). Kissimmee, FL:
Author.
School District of Osceola County [SDOC] & Osceola County Education Association
[OCEA]. (2011). Teacher contract. Retrieved from
http://www.osceola.k12.fl.us/depts/Personnel/html/subsections/BLT_CONTRAC
T_2011-12_FINAL.pdf. Kissimmee, FL. Authors.
Scriven, M. (1981). Summative teacher evaluation. In J. Millman (Ed.), Handbook of
teacher evaluation. Beverly Hills, CA: Sage.
Senge. P. (1990). The fifth discipline: The art and practice of the learning organization.
New York: Doubleday.
Shadish, W. R. Cook, T. D., & Campbell, D. T. (2002). Experimental and quasi-
experimental designs for generalized causal inference. Boston: Houghton Mifflin.
Shakman, K., Riordan, J., Sanchez, M.T., DeMeo Cook, K., Fournier, R., & Brett, J.
(2012). An examination of performance-based teacher evaluation in five states.
(Issues & Answers Report, REL 2012-No. 129). Washington, DC: U.S.
Department of Education, Institute of Education Sciences, National Center for
Educational Evaluation and Regional Assistance, Regional Educational
Laboratory Northeast and Islands. Retrieved from http://ies.ed.gov/ncee/edlabs.
Slate, J., & Rojas-LeBouef, A. (2011a). Writing Up Nonparametric Spearman
rho Correlation. Retrieved from the Connexions Web site:
http://cnx.org/content/m38053/1.2/
Smarter Balanced. (2012). Member states. Retrieved from:
smarterbalanced.org/about/member-states/.

142
Soar, R. S., & Soar, R. M. (1975). Problems in using pupil outcomes for teacher
evaluation. Washington, DC: National Education Association.
Springer, M.G., Ballou, D., Hamilton, L., Le,V., Lockwood, J.R., McCaffrey, D. . .
Stecher, B. (2010). Teacher pay for performance: Experimental evidence from the
project on incentives in teaching. Nashville, TN: National Center on Performance
Incentives.
Squires, D. A. (1980). Characteristics of effective schools: The importance of school
processes. Washington, DC: National Institute of Education.
Stewart. P. (2012). Florida State Board of Education action item: Amendment to rule
6A-5.030, Instructional personnel and school administrator evaluation systems.
Florida State Board of Education. Tallahassee, FL.
Strong, J.H., Ward, T.J., & Grant, L.W. (2011). What makes good teachers good? A
cross-case analysis of the connection between teacher effectiveness and student
achievement. Journal of Teacher Education 62(4), 339-355.
Strong, M., Gargani, J., & Hacifazlioğlu, Ö. (2011). Do we know a successful teacher
when we see one? Experiments in the identification of effective teachers. Journal
of Teacher Education 62(4), 367-382.
Stumbo, C., & McWalters, P. (2010). Measuring effectiveness: What will it take?
Educational Leadership, 68(4), 10-15.
Supovitz, J. A., & Weathers, J. (2004). Dashboard lights: Monitoring implementation of
district instructional reform strategies. Philadelphia, PA: Consortium for Policy
Research in Education.
Taylor, R. T. (2010). Leading learning: Change student achievement today! Thousand
Oaks, CA: Corwin Press.
Tucker, P.D., & Kindred, K. (1997). Legal Considerations in Designing Teacher
Evaluation Systems. In Stronge, J.H. (Ed.), Evaluating Teaching: A Guide to
Current Thinking and Best Practice. (59-90). Thousand Oaks, CA: Corwin Press
U.S. Department of Education. (November, 2009). Race to the top: Executive summary.
Washington, DC: U.S. Government Printing Office.
U.S. Department of Education. (2010a). A blueprint for reform: The reauthorization of
the Elementary and Secondary Education Act. Washington, DC: U.S. Department
of Education.

143
U.S. Department of Education. (2010b). Race to the top assessment program guidance
and frequently asked questions. Washington, DC: U.S. Department of Education.
Young, I. P., & Castetter, W. B. (2004). The human resource function in educational
administration (8th
ed.). Upper Saddle River, NJ: Pearson.
Wallace, C., Steptoe, S. (December, 2006). How to bring our schools out of the 20th
century. Time. Retrieved from
http://www.time.com/time/magazine/article/0,9171,1568480,00.html
Weisberg, D., Sexton, S., Mulhern, J., & Keeling, D. (2009). The widget effect.
Education Digest, 75(1), 31-35.
Zakaria, F. (November, 2011). When will we learn? Time. Retrieved from
http://www.time.com/time/magazine/article/0,9171,2098577,00.html