
Report on the Quality Assurance of the DHET Examination of ...
69
An Examination of the Quality and Ease of Public Transport in Dublin
An Examination of the Quality and Ease of Use of Public Transport
in Dublin from a Newcomer’s Perspective
James Kinsella and Brian Caulfield Trinity College, Dublin, Ireland
Abstract
This paper examines the opinions of newcomers and visitors to the public transpor-tation system in Dublin. The motivations for this research were twofold. First, tour-ism is very important to the Irish economy and, as such, it is important that visitors to Dublin can use the public transport system. Second, by asking visitors what the think of the public transport system available in comparison to the system they use in their home country, their responses can help planners learn about the areas for improvement in the current system in Dublin. The paper reports the findings of a survey conducted in Dublin asking respondents how they perceived the public trans-port system compared to the system they use in their home country. The results of this show that visitors or newcomers to a city are less concerned with the traditional aspects of public transport service quality and, instead, are more concerned with information and reliability.
Introduction Public transportation for Dublin plays an important role in achieving a sustainable, efficient, attractive tourist destination. Ireland had approximately 8 million over-

Journal of Public Transportation, Vol. 14, No. 1, 2011
70
seas visitors in 2007 (CSO, 2008). Over half of all trips were for holiday purposes. Earnings from these visitors were $6,479m in 2007. Dublin was the most popular region for holiday makers in 2007, with 61 percent of visitors spending at least one night in the region (CSO 2008).
The importance of providing adequate, high quality and attractive transport to newcomers in any city is obvious. It supports the growth of a competitive and sustainable tourism industry, enhancing its contribution to national economic and social goals. According to the Irish Department of Transport, a good public trans-port network introduces Dublin as an attractive holiday destination, providing tourists with access to all of Dublin’s amenities and recreational facilities. In addi-tion, public transportation provides people with mobility and access to employ-ment, community resources, medical care, and recreational opportunities. While many newcomers use public transport in Dublin, there are many who do not use it to its full potential. There are several reasons for this. The conventional factors are time and money (Wardman and Waters 2001). However, there are many more fac-tors. The complex question of how and when newcomers use, or do not use, public transport has not been identified in its entirety.
Thompson et al. (2007) states that tourist satisfaction with public transport has been neglected by transport service providers. The authors (2007) also found that the cost of public transport in Manchester is the main barrier to overseas visitors’ use. The most important attributes of public transport satisfaction, such as punc-tuality and speed, are rated lower on the basis or performance than less important attributes such as cleanliness of vehicles. In the case of overseas visitors’ attitudes toward public transport in Greater Manchester, ticket cost was found to have the greatest gap between importance and performance.
Dziekan (2008) found that knowledge of a new transport system depends on experiences of other cities or hometowns. If one had previously learned how the public transport system in a metropolitan area operates, learning a new (similar structured) system was much easier. When visiting a new city, tourists are over-loaded with new information, and their ability to retain new information on public transport systems may be limited. According to Miller (1956), individuals can store seven plus or minus two items in working memory. Anderson (1995) states that four or five items can be stored in the visual image memory. Therefore, it is impera-tive to ensure that visitors are presented with an attractive, easy-to-use, and highly visible public transport system. The results presented in Dziekan (2008) support

71
An Examination of the Quality and Ease of Public Transport in Dublin
this assumption and also that public transportation lines that are more visible in the urban areas are easier to retrieve from memory.
Bamberg (2006) conducted a study using the theory of planned behavior on indi-viduals that had recently moved to Stuttgart. In the study, participants were given a free public transport pass and personalized travel information. The purpose of this intervention was to encourage newcomers to Stuttgart to use sustainable modes of transport. Bamberg’s findings show that when the right support is provided, attracting a newcomer to a city as a public transport user is easier than breaking the habits of residents. This is due to the situational circumstances. Business trav-elers and tourists often arrive without a car and are not dedicated to a particular transport mode. In addition, newcomers to a city also are forced to think over their mobility options.
The literature has shown that newcomers to a city rely heavily on information when making their public transport decisions. This research focuses on the provi-sion of this information to understand how important providing information is to newcomers in Dublin and how providing the appropriate information can improve the overall transport experience.
Results and Data Collection This section presents the results of the survey undertaken to ascertain what factors impact newcomers’ perceptions of a public transport system. Another objective of this research is to examine the impact that newly-designed maps and timetables would have on the public transport experience for newcomers to Dublin city. The first subsection presents the details of the survey sample; the second subsection presents the results of the importance performance analysis. The third subsection details the respondents’ opinions regarding the ease of use of the public transport system and the fourth subsection compares the public transport system in Dublin to other European public transport systems in terms of ease of use. The final set of results presented examines the respondents’ perceptions of the different public transport maps in use in Dublin.
Data Collection and Sample Characteristics An online survey was sent to a number of non-Irish visiting students to a univer-sity in Dublin. The survey was conducted in February 2009, and respondents were given a week to complete the survey. The entire questionnaire took approximately 10 minutes to complete. The sample required for this study was that of visitors to

Journal of Public Transportation, Vol. 14, No. 1, 2011
72
Dublin City. A random sample of visiting students was used for the sample. The survey resulted in 80 responses. To benchmark the results of the primary survey, 25 Irish respondents were surveyed. A smaller sample of Irish students was randomly selected from the same student population used to select the sample of new-comers. The results of the Irish respondents were compared to the results of the newcomers to ascertain differences in individuals’ opinions of the public transport system.
Table 1 contains the main characteristics of the newcomers and the local respon-dents. The first characteristic presented is gender. The results show that 58 percent of newcomers and 52 percent of local respondents were male. This indicates a relatively balanced gender mix in both groups. The second set of characteristics examines the area the respondent lived in prior to moving to Dublin. The results show that 42 percent of newcomers said they lived in an urban area before moving to Dublin. Of the local respondents, 60 percent said they lived in an urban area and 40 percent said they lived in a suburban area. The final characteristics examined in Table 1 relate to the age of the respondent. The results for bot sections show a relatively similar age profile with the majority of respondents are aged 19-24.
Table 1. Sample Characteristics
Newcomer Respondents
Local Respondents
GenderMale 58% 52%
Female 42% 48%
How would you describe where you live (home country)?
Urban 42% 60%
Suburban 53% 40%
Rural 5% -
Age
Under 18 5% 4%
19-24 47% 50%
25-34 42% 41%
35-44 2% 5%
45 + 5% -

73
An Examination of the Quality and Ease of Public Transport in Dublin
Importance Performance AnalysisTo recognize the differences of opinion regarding public transport between new-comers and the native Dublin public, an Importance Performance Analysis (IPA) was conducted (Bacon 2003). IPA is a technique for prioritizing attributes based on measures of importance and performance and has had numerous applications within the fields of service quality and tourism research. In the field of transpor-tation, operators often assess satisfaction on the basis of customer perceptions about attributes of public transport; however, their importance is less regularly evaluated. In addition, the methodology has not been commonly implemented by the field of transportation research. IPA is a simple tool for understanding cus-tomer satisfaction and prioritizing service quality improvements. In this IPA, mean customer ratings of importance and performance across several attributes were plotted against each other, and the resulting importance-performance space was divided into four quadrants (as shown in Figures 1 and 2). The attributes examined in this study included the following:
Quality of vehicles •
Safety •
Provision of information •
Proximity of stops •
Convenience •
Punctuality •
Waiting times •
Frequency •
Price •
Night services•
The cross-point has been set at the mean importance and mean performance. By examining the points in each quadrant, it is possible to infer which attributes cus-tomers feel should have the highest priorities for improvement (i.e., the “concen-trate here” quadrant) and the lowest priorities for improvement (i.e., the “possible overkill” quadrant) (Bacon 2003).
Thus, this IPA provides a simple graphical representation of how visitors feel about the service. The service provider can then consider the various improvements and create a plan of improvement. The results from the application of IPA of the online questionnaire data from visitors and native Dublin people are shown in Figures 1

Journal of Public Transportation, Vol. 14, No. 1, 2011
74
Figure 1. Importance Performance Chart - Native Dublin
Figure 2. Importance Performance Chart - Newcomers

75
An Examination of the Quality and Ease of Public Transport in Dublin
and 2. Drawing on the findings of the survey of attitudes towards public transport in Dublin, the analysis identifies the attributes of greatest importance and their perceived level of performance. Newcomers believed punctuality, frequency, wait-ing times, and provision of information to be of great importance but rated quality of vehicles and safety less important.
According to the newcomers, the most important attributes of punctuality, fre-quency and waiting times (reliability) and the provision of public transport infor-mation are rated lower on the scale of performance and, consequently, appear in the “concentrate here” quadrant. The least important attributes such as quality of vehicles and safety were rated higher on the scale of performance and appear in the “possible overkill” quadrant. To compare newcomers needs to those of regular users, a small sample of 25 native Dubliners was analysed using the same approach. The native Dublin public also rated punctuality, frequency, and waiting times of great importance. In addition, they rated price and convenience of high impor-tance. On the performance scale, the native Dublin public rated night services and price and as poor.
Measuring Ease of Use The research conducted on the ease of use of public transport has developed several concepts to define and measure ease of use. For the purposes of this paper, it was found that in addition to saving time and money, newcomers want to save effort before (pre-planning) and when using public transport. Straddling (2002) defines three types of effort:
Physical Effort• - the physical activity on a journey.
Cognitive Effort• - effort expended on a journey by means of information gathering and having to process the information for route planning, naviga-tion, and re-orientation.
Affective Effort• - the emotional energy expended on a journey in dealing with uncertainties regarding safety and delays.
In addition, it is known from service research that a product recommended to others tends to be of relatively high quality. Reichheld (2003) suggested using a recommendation question to measure customer satisfaction. For the purposes of this paper, the product is equated to a public transport service.

Journal of Public Transportation, Vol. 14, No. 1, 2011
76
Respondents in the survey were presented with a number of statements and asked if they “strongly agreed,” “agreed,” “no opinion,” “dissagreed,” or “strongly disagreed” with the statements. Each of these statements was given a value from 1 – 5, and a mean score of these values wase estimated for each statement. Higher values were given to those who strongly agreed and lower values to those who disagreed. Therefore, the higher the mean score, the more positive the response to the statement. The results presented in Table 2 show that respondents do not feel it necessary to be alert while traveling on public transport in preparation to disem-bark. Respondents indicated that when they asked for information on the public transport services available, individuals and public transport drivers were helpful with their queries. Interestingly, the option “it takes a lot of mental effort to plan my trip” was shown to have a low mean score, indicating that respondents found trip planning relatively straightforward.
Table 2. Factors That Measure Ease of Use
Mean Score
Standard Deviation
While on the vehicle, I have to continuously re-orientate myself and be ready to get off.
2.4 0.34
It takes a lot of mental effort to plan my trip. 2.5 0.27
The ride is strenuous and puts me in a bad mood. 2.6 0.45
The lack of information deters me from using public transport. 2.7 0.61
If another person has to make this trip, I would recommend them to use this mode.
3.2 0.12
I find public transport drivers helpful when I ask for information. 3.3 0.09
I find individuals helpful when I ask for information. 3.4 0.21
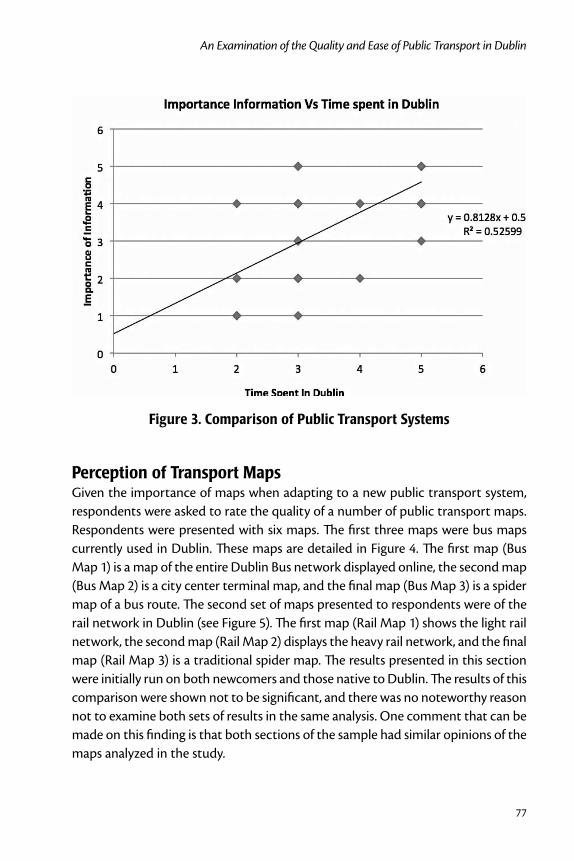
Comparison of Dublin’s Public Transport to Other European CitiesRespondents were asked to rate different aspects of Dublin’s public transport sys-tem in comparison to the respondent’s home town/city. The results are tabulated in Figure 3. Ticket integration performed worst. Maps were the top performer. It should be noted that all the aspects that respondents were asked to rate performed below average, and four out of five aspects did not receive a “very good” rating.
77
An Examination of the Quality and Ease of Public Transport in Dublin
Figure 3. Comparison of Public Transport Systems
Perception of Transport Maps Given the importance of maps when adapting to a new public transport system, respondents were asked to rate the quality of a number of public transport maps. Respondents were presented with six maps. The first three maps were bus maps currently used in Dublin. These maps are detailed in Figure 4. The first map (Bus Map 1) is a map of the entire Dublin Bus network displayed online, the second map (Bus Map 2) is a city center terminal map, and the final map (Bus Map 3) is a spider map of a bus route. The second set of maps presented to respondents were of the rail network in Dublin (see Figure 5). The first map (Rail Map 1) shows the light rail network, the second map (Rail Map 2) displays the heavy rail network, and the final map (Rail Map 3) is a traditional spider map. The results presented in this section were initially run on both newcomers and those native to Dublin. The results of this comparison were shown not to be significant, and there was no noteworthy reason not to examine both sets of results in the same analysis. One comment that can be made on this finding is that both sections of the sample had similar opinions of the maps analyzed in the study.
Journal of Public Transportation, Vol. 14, No. 1, 2011
78
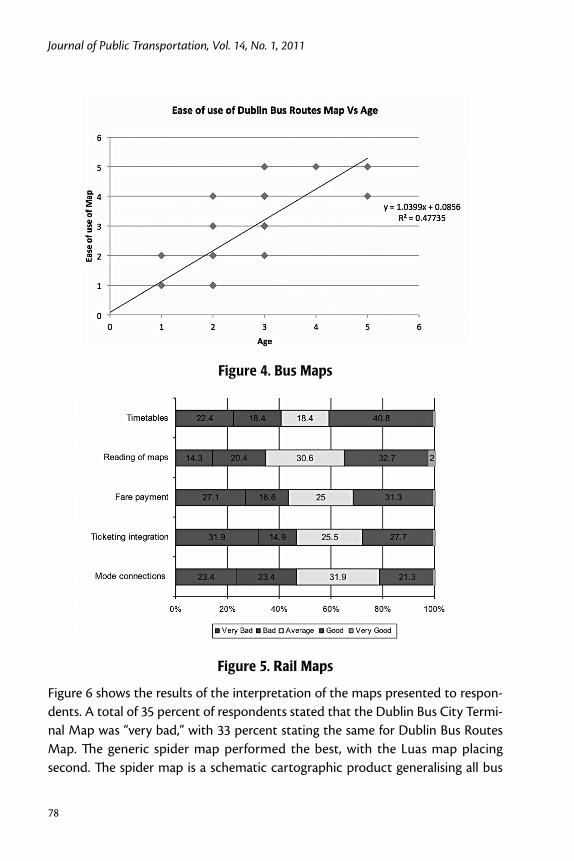
Figure 4. Bus Maps
Figure 5. Rail Maps
Figure 6 shows the results of the interpretation of the maps presented to respon-dents. A total of 35 percent of respondents stated that the Dublin Bus City Termi-nal Map was “very bad,” with 33 percent stating the same for Dublin Bus Routes Map. The generic spider map performed the best, with the Luas map placing second. The spider map is a schematic cartographic product generalising all bus

79
An Examination of the Quality and Ease of Public Transport in Dublin
routes serving a hub. The schematic diagram is based on the design of the world famous London Underground Map. According to Transport for London, the popu-larity of the product has led to the creation of over 900 spider maps spread across the Greater London Area. The color coding of the map makes it easy to distinguish different routes, which allow for quicker orientation. At the moment, Dublin’s Luas (light rail) is fairly a simple network, with just two lines operating, but this system has the potential to become more complex with the introduction of more lines. Based on the results presented in Figure 6, a spider map appears to be the most appropriate format if further lines are to be introduced. The results show that pas-sengers found the current provision of maps in Dublin inadequate, especially the Dublin Bus Routes Map and Dublin Bus City Terminal Map, based upon the results presented in Figure 6.
Figure 6. Perception of the Quality of Public Transport Maps
Discussion and Conclusions This study shows that public transport providers cannot assume that the needs of newcomers to Dublin are the same as the needs of the native Dublin public. Results from this study and other literature illustrate that newcomers place less importance on traditional aspects of public transport such as quality and safety of

Journal of Public Transportation, Vol. 14, No. 1, 2011
80
vehicles and place greater importance on aspects such as the provision of informa-tion and reliability of service.
This study has shown that the majority of newcomers regularly seek public trans-port information before setting out on a journey and during these journeys. The results of the survey questions measuring ease of use of public transport showed that a lack of information deters newcomers from using public transport in Dub-lin.
The respondents showed a general satisfaction with the quality of the maps pro-vided by the service operators, with the exception of Dublin Bus. The spider maps performed better on the ease of use scale.
Newcomer satisfaction with public transport can be improved through a rethink-ing of the way in which information is conveyed to newcomers. For example, the introduction of improved stop design and provision of at-stop information such as real-time displays, the provision of maps, and information regarding other public transport providers would greatly enhance the ease of use of Dublin public trans-port.
References
Anderson, J. R. 1995. Learning And Memory: An Integrated Approach. New York: John Wiley & Son.
Bacon, D. R. 2003. A comparison of approaches to Importance-Performance Analy-sis. International Journal of Market Research 45(1): 55-71.
Bamberg, S. 2006. Is a residential relocation a good opportunity to change people s travel behaviour? Results from a theory-driven intervention study. Environ-ment and Behaviour38(6): 820-840.
Central Statistics Office. 2008. Tourism Trends 2007. The Central Statistics Office.
Dziekan, K. 2008. Ease-of-use in public transportation—A user perspective on information and orientation aspects. Working Paper, Royal Institute of Tech-nology Stockholm.
Miller, G. A. 1956. The magical number seven, plus or minus two: Some limits on our capacity for processing information. Psychological Review 63: 81-97.

81
An Examination of the Quality and Ease of Public Transport in Dublin
Reichheld, F. 2003. The one number you need to grow. Harvard Business Review, December.
Stradling, S. G. 2002. Transport user needs and marketing public transport. Munici-pal Engineer, Proceedings of the Institution of Civil Engineers 151: 23-28.
Thomson, D. J, M. Gylseth, R. McGarry, and C. V. Garcia. 2007. The VVIP System: Encouraging the use of public transport in Edinburgh. Conference on Human Factors in Computing Systems.
Wardman, M., and W. G. Waters. Advances in the valuation of travel time savings. Transportation Research Part E: Logistics and Transportation Review 37(5): 85-90.
About the Authors
Brian Caulfield ([email protected]) is a lecturer in Civil Engineering in the Department of Civil, Structural, and Environmental Engineering in Trinity College Dublin. He has published and has interests in public transport services, stated pref-erence modeling, environmental impacts of transport, and road safety.
James Kinsella ([email protected]) is a graduate in Civil Engineering from Trinity College Dublin.