![[Lovatt H.] Design of a 3-Phase MOSFET Inverter an(BookZa.org)](https://static.fdocuments.in/doc/165x107/577cc4f91a28aba7119ae40f/lovatt-h-design-of-a-3-phase-mosfet-inverter-anbookzaorg.jpg)
[Lovatt H.] Design of a 3-Phase MOSFET Inverter an(BookZa.org)
1
AN EXAMINATION OF PUBLIC ATTITUDES TOWARDS ALCOHOL POLICY
NOVEMBER 2016

2
REFERENCE This report should be referred to as follows:
Buykx P, Li J, Gavens L, Lovatt M, Gomes de Matos E, Holmes J, Hooper L & Meier P (2016) An
examination of public attitudes towards alcohol policy. University of Sheffield and Cancer
Research UK.
AUTHOR INFORMATION
Dr Penny Buykx1 1 Sheffield Alcohol Research Group,
Jessica Li1 ScHARR, University of Sheffield
Dr Lucy Gavens1 2 Institut für Therapieforschung,
Melanie Lovatt1 Munich, Germany
Elena Gomes de Matos2 3 Policy Research Centre for Cancer Prevention,
Dr John Holmes1 Cancer Research UK
Lucie Hooper3
Professor Petra Meier1
ACKNOWLEDGEMENTS We would like to thank the Policy and Information Patient Sounding Board at Cancer Research
UK who took part in developing and testing the survey. The authors are solely responsible for
the content of the report.

3
CANCER RESEARCH UK Cancer Research UK is the world’s largest independent cancer charity dedicated to saving lives
through research. We support research into all aspects of cancer through the work of over
4,000 scientists, doctors and nurses. In 2014/2015, we spent £434 million on research
institutes, hospitals and universities across the UK – including a £41 million contribution we
made to the Frances Crick Institute. We receive no funding from Government for our research.
This research was funded by the Policy Research Centre for Cancer Prevention, Cancer Research
UK.
Cancer Research UK is a registered charity in England and Wales (1089464), Scotland
(SC041666) and the Isle of Man (1103)

4
CONTENTS EXECUTIVE SUMMARY .......................................................................... 5
INTRODUCTION ..................................................................................... 6
AIM ...................................................................................................... 8
METHODS ............................................................................................. 8
RESULTS ................................................................................................ 9
DISCUSSION ........................................................................................ 21
APPENDICES ........................................................................................ 23
REFERENCES ........................................................................................ 31

5
EXECUTIVE SUMMARY
Alcohol consumption is believed to be
responsible for approximately 12,800 cancer
cases annually in the UK (1) and is linked to
seven types of cancer, including two of the
most common, breast and bowel (2, 3). If
current alcohol consumption trends
continued, it will lead to a further 135,000
cancer deaths over the next 20 years and cost
£2bn in cancer costs to the NHS(4).
This is the second report following on from
Buykx et al., 2015 (5) which explored public
knowledge of alcohol as a risk factor for
cancer. This report, based on cross-sectional
survey data of 2100 people representative of
the English adult population, investigates
public support of alcohol policies and the link
to cancer awareness.
KEY FINDINGS
• Non-drinkers were the most
supportive of all policies (>50%
support for alcohol policies).
• Respondents aware of alcohol as a risk
factor for cancer were more
supportive of policies than those that
were not aware of this.
• Alcohol unit labelling for cans and
bottles was the most highly supported
policy (74%).
• Limiting advertising for alcohol on TV
after 9pm was the second most highly
supported policy (67%).
• Prevention-based (i.e screening and
brief interventions) health service
response policies were more
supported than treatment-based
policies (i.e increasing funding for
treatment).
• There was overall support of drink
driving counter measure policies.
POLICY AND PUBLIC HEALTH
IMPLICATIONS
This report indicates current levels of support
for different policy options is likely to be
associated with health knowledge, in
particular awareness that alcohol is a risk
factor for cancer.
Policy support is also linked to how much a
person drinks with those who drink more
alcohol being less likely to be supportive of
alcohol policies than those who drink less.
6
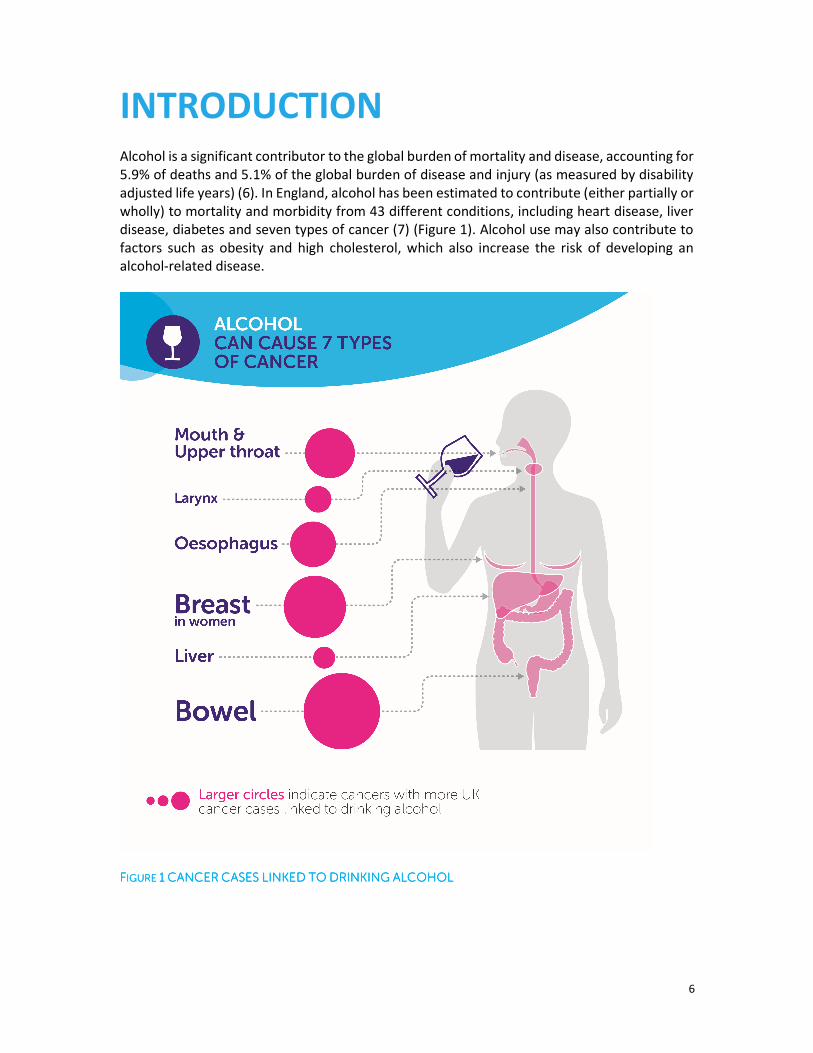
INTRODUCTION Alcohol is a significant contributor to the global burden of mortality and disease, accounting for
5.9% of deaths and 5.1% of the global burden of disease and injury (as measured by disability
adjusted life years) (6). In England, alcohol has been estimated to contribute (either partially or
wholly) to mortality and morbidity from 43 different conditions, including heart disease, liver
disease, diabetes and seven types of cancer (7) (Figure 1). Alcohol use may also contribute to
factors such as obesity and high cholesterol, which also increase the risk of developing an
alcohol-related disease.
FFFFIGURE IGURE IGURE IGURE 1111 CANCERCANCERCANCERCANCER CASESCASESCASESCASES LINKEDLINKEDLINKEDLINKED TOTOTOTO DRINKINGDRINKINGDRINKINGDRINKING ALCOHOLALCOHOLALCOHOLALCOHOL
7
It is estimated that in 2012, 5.5% of cancer cases and 5.8% of cancer deaths were attributable
to alcohol worldwide (3). However, the proportion of cancer attributable to alcohol varies both
according to the cancer type and the amount of alcohol consumed (2). For example, while less
than 10% of breast cancer cases are attributable to alcohol use, the risk of developing this
cancer type among women increases even at low levels of alcohol use (≤12.5 g/day, or the
equivalent of a glass of wine) (3). If current alcohol consumption trends continued, it will lead
to a further 135,000 cancer deaths over the next 20 years and cost £2bn in cancer costs to the
NHS(4).
Public health policy to reduce alcohol consumption at a population level may have a positive
effect in reducing the burden of alcohol-related disease. There is a strong body of evidence for
the relative effectiveness of different alcohol policy options in reducing consumption and
harms: the best evidence is for policies which address pricing and availability (4, 8, 9). Broadly
speaking, there is an inverse relationship between policy effectiveness and popularity, with
higher levels of support for those policies which are considered least effective (10, 11).
However, it is possible that the likelihood a person is in favour of alcohol policies is related to
their perception of the risk of chronic health harms, especially cancer (12).
There are currently several alcohol policy options under consideration in the UK, such as,
Minimum Unit Pricing (MUP) which has been extensively modelled by the University of
Sheffield (4, 7), introducing a ban on below cost selling and extending the pre-existing
‘Responsibility Deal’ with the alcohol industry (13). MUP has been adopted by Scotland
(pending the result of a legal challenge) and is also under active consideration by Wales and
Northern Ireland. A reduction in the legal drink driving limit from 80 mg to 50 mg alcohol per
100 ml blood (14) and increased investment in alcohol treatment services have also been
implemented in Scotland(14).
A key policy focus of the current UK Alcohol Strategy is to “Support individuals to change”,
through strategies intended to help the public in “Understanding the risks” of alcohol (15, p.
21). This arm of the strategy identified the intention to not only review the drinking guidelines
(as mentioned above), but also to improve public health information, potentially by extending
current government healthy lifestyle social marketing campaigns to include alcohol. The
strategy also promotes “Shared responsibility with industry” which included an undertaking by
industry to increase the proportion of products with health labelling to 80% (15, p. 17). There
is currently little evidence for the effectiveness of social marketing or health labelling and
warning messages in reducing alcohol consumption, although intervening variables such as
awareness and intentions may be positively affected (8). However, it can be argued that the
public have a right to information about the products they consume and that action in this area
is therefore an important part of a comprehensive alcohol strategy.
Policies of this type have already been shown elsewhere to be highly acceptable to the public
(10-12, 16), however, it is important to better understand specifically what types of labelling
and health messages appeal to the public, including content of such messages (e.g. nutrition
labelling, drinking guidelines) (17) and their structure (e.g. positively or negatively framed,
specific versus general) (18).

8
AIM The aim of this study was to determine the extent of public support for or opposition to various
alcohol policy options intended to reduce alcohol related harm that are either currently
implemented or those which could realistically be considered in England.
METHODS An online cross-sectional survey was carried out in July 2015. A total sample of 2100 adults
completed the survey. Quota sampling ensured the sample were representative of the English
general population for gender, age, region and education. A sampling weight was applied to
adjust for the under sampling of those without qualifications compared to the general English
population. For full details of methods see Buykx et al., 2015(5) and Appendix 1 for source of
survey questions.
DEMOGRAPHIC INFORMATION
Demographic information was sought regarding respondents’ age, gender, education,
geographical location, and household income. Post code data were used to calculate Index of
Multiple Deprivation (IMD) decile.
ALCOHOL AND TOBACCO USE
Current alcohol use was tested using the 3-item Alcohol Use Disorders Identification Test
(AUDIT C) (19). The AUDIT C is a screening tool used to identify potentially hazardous
drinkers. Each item is scored from 0 to 4 (total score range 0-12), with a score of zero
indicating the person is a current non-drinker, 1-4 indicating lower risk, and 5 or above
indicating increasing risk (20). Respondents were asked to specify their current smoking
status, the time since they had given up (if applicable) and their use of e-cigarettes.
KNOWLEDGE AND RISK PERCEPTIONS
Respondents were asked to indicate which, if any, health conditions they thought could result
from drinking too much alcohol. This question was first asked unprompted (and respondents
asked to complete a free text field) and then asked in relation to seven specific health
conditions. To test respondents’ risk perceptions concerning alcohol use and specific cancer
types, respondents were shown a list of eight different types of cancer and asked whether or
not they thought the risk of developing each type of cancer was increased by drinking alcohol.
For those cancers they believed to be alcohol-related, respondents were asked to indicate the
lowest level of alcohol consumption at which they thought the risk of developing each cancer
started to increase. We included cancers which are not known to have any risk from drinking
alcohol, those which carry a significant risk from light drinking (e.g. breast cancer), and those
which carry a significant risk from heavy drinking (e.g. liver cancer). We developed the
questions following discussions with colleagues and Cancer Research UK and drew on existing
literature to identify significant and non-significant relationships between alcohol and

9
particular types of cancer (2).
ATTITUDES TOWARDS ALCOHOL POLICIES
Respondents’ attitudes to various alcohol policies were assessed by asking them to indicate the
extent to which they would support or oppose each one after the following prompt: “To reduce
the problems associated with excessive alcohol use, to what extent would you support or
oppose each of the following policies…?” Responses could be given on a 5 point scale from
‘strongly support’ to ‘strongly oppose’, with an additional response option for ‘don’t know’.
The policy domains included items on: Pricing and taxation, Availability, Drink driving counter-
measures, Health service responses, Industry responsibility, Labelling, Advertising and
marketing. To reduce the risk of order bias the policies were presented in random order for
each respondent (see Appendix 2). All analyses presented are based on frequencies
recalculated with ‘don’t know’ responses excluded (endorsed by ≤3.1% for all policies).
REGRESSION ANALYSIS OF VARIABLES ASSOCIATED WITH POLICY SUPPORT
As this work replicates previous research examining the relationship between knowledge of
alcohol as a risk factor for cancer and policy support, we replicated the analysis reported in
Buykx et al (12). Logistic regression was used to examine the association between support for
alcohol policies on the one hand and demographic characteristics (sex [male/female], age
[continuous], location [North, Midlands, London/South], education [3 qualification categories],
income [8 groups]); alcohol consumption [AUDIT-C score, continuous]); smoking status (current
regular or occasional smoker/not); and knowledge of alcohol as a cancer risk factor (yes/no) on
the other.
RESULTS DEMOGRAPHICS
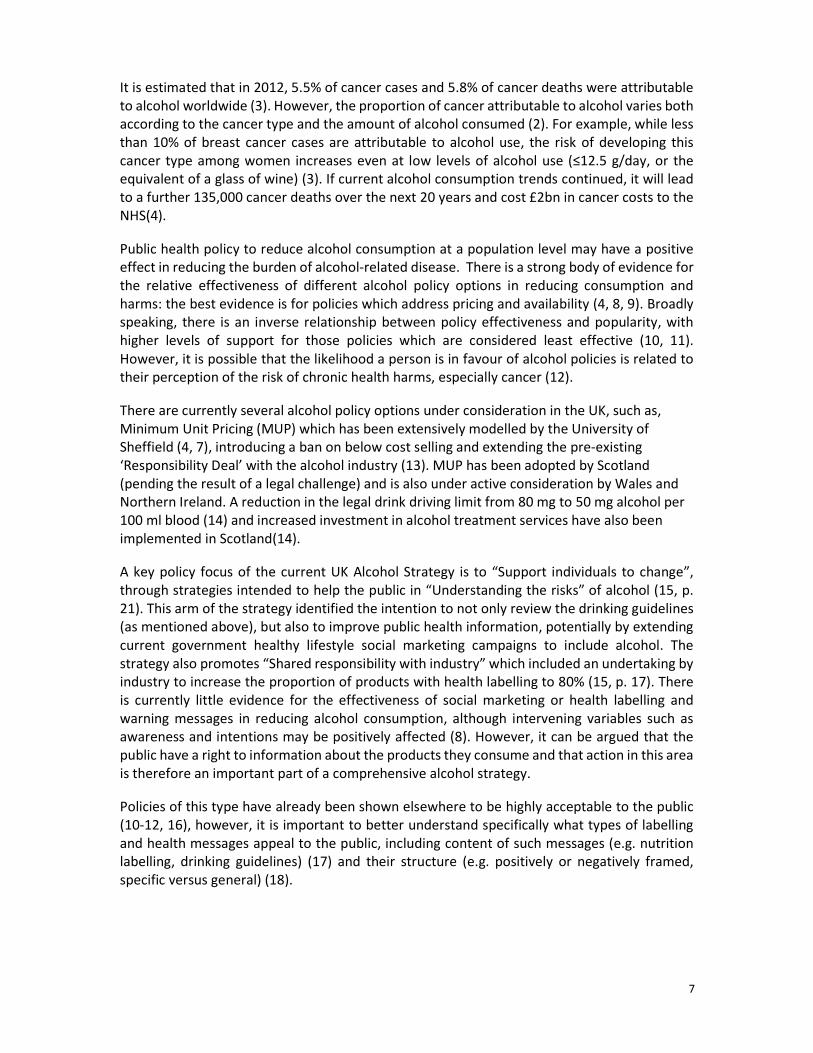
The demographic characteristics of the sample are shown in Table 1; 51% were female and
the mean age of the sample was 47.8 years (range: 18-80, SD=16.62). All estimates presented
in this report are weighted.
10
TABLETABLETABLETABLE 1111 DEMOGRAPHICDEMOGRAPHICDEMOGRAPHICDEMOGRAPHIC CHACHACHACHARACTERISTICSRACTERISTICSRACTERISTICSRACTERISTICS
N=2100
Unweighted
n (%)
Weighted
n (%)
Gender
Male 1021 (48.6) 1030 (49.0)
Female 1079 (51.4) 1070 (51.0)
Age
18-19 63 (3.0) 62 (3.0)
20-29 339 (16.1) 325 (15.5)
30-39 351 (16.7) 332 (15.8)
40-49 394 (18.8) 385 (18.3)
50-59 334 (15.9) 330 (15.7)
60+ 619 (29.5) 667 (31.8)
Region of residence
North 634 (30.2) 643 (30.6)
Midlands 586 (27.9) 586 (27.9)
London/South 880 (41.9) 872 (41.5)
Education
No qualifications/Don’t know 178 (8.5) 315 (15.0)
Below degree level 1238 (59.0) 1155 (55.0)
Degree level or above 684 (32.6) 630 (30.0)
Income (monthly combined household after tax)
Less than £500 84 (4.0) 95 (4.5)
£500-999 210 (10.0) 226 (10.8)
£1000-1499 303 (14.4) 316 (15.1)
£1500-1999 276 (13.1) 272 (12.9)
£2000-2999 425 (20.2) 404 (19.2)
£3000-3999 228 (10.9) 216 (10.3)
£4000-4999 93 (4.4) 89 (4.2)
£5000+ 163 (7.8) 154 (7.4)
I don’t know 112 (5.3) 115 (5.5)
Prefer not to say 206 (9.8) 212 (10.1)
Index of Multiple Deprivation quintile group
Most deprived 461 (22.0) 479 (22.8)
High deprivation 469 (22.3) 474 (22.6)
Average 430 (20.5) 426 (20.3)
Low deprivation 356 (17.0) 350 (16.7)
Least deprived 362 (17.2) 349 (16.6)
Missing* 22 (1.0) 21 (1.0)
* These data had missing IMD scores because the post-code provided (from which IMD score is derived) is new
and not yet included in IMD data

11
ALCOHOL AND TOBACCO USE
• The most common frequency of drinking was 2 or 3 times a week, reported by just
over a quarter of respondents.
• 1 in 5 reported drinking less than once a month
• 12% reported they ‘never drink’ alcohol
• Of drinkers, 42% reported drinking only one or two units on a typical day when
drinking and 1 in 3 reported typically exceeding four units.
• 1 in 3 drinkers reported drinking heavily (>6 units if female, >8units if male) at least
once a month.
TABLETABLETABLETABLE 2222 SELFSELFSELFSELF----REPORTEDREPORTEDREPORTEDREPORTED ALCOHOLALCOHOLALCOHOLALCOHOL USE:USE:USE:USE: AUDITAUDITAUDITAUDIT CCCC
N=2100
Males (%) Females
(%) Total (%)
How often do you have a drink containing alcohol?
Never 9.6 14.1 11.9
Monthly or less 17.9 25.0 21.5
2 to 4 times a month 22.2 24.8 23.5
2 to 3 times a week 29.9 23.9 26.9
4 or more times a week 20.4 12.2 16.2
How many units of alcohol do you drink on a typical day when you are drinking? (if ever
drink)*
1 or 2 33.9 49.6 41.7
3 or 4 25.2 27.5 26.4
5 or 6 18.8 13.3 16.0
7, 8, or 9 11.2 6.0 8.6
10 or more 10.8 3.6 7.2
How often have you had 6 (if female) or 8 (if male) units on a single occasion in the last
year? (if ever drink)*
Never 31.0 39.2 35.1
Less than monthly 31.9 38.2 35.0
Monthly 16.5 11.5 14.1
Weekly 17.0 8.6 12.8
Daily or almost daily 3.6 2.5 3.1
Audit Score (range: 0-12)
0 (Non-drinkers) 9.6 14.1 11.9
1-4 (Lower risk) 40.0 53.5 46.9
5-12 (Increasing risk) 50.4 32.4 41.2
Mean (SD) 4. 8 (3.18) 3.5 (2.72) 4.1 (3.02) *The baseline count ≠ 2100. This is because those who answered ‘Never’ (n=250) to ‘How do o[en do you have
12
a drink containing alcohol?’ were counting as missing for these questions. The sample size for both of these
questions is 1850.
TABLETABLETABLETABLE 3333 SELFSELFSELFSELF----REPORTEDREPORTEDREPORTEDREPORTED SMOKINGSMOKINGSMOKINGSMOKING STATUSSTATUSSTATUSSTATUS
N=2100
Males (%) Females
(%)
Total (%)
Which of the following best describes your smoking status?
I smoke daily 29.2 22.1 25.5
I smoke occasionally 6.7 5.0 5.9
I don’t smoke now but I used to 26.5 23.4 24.9
I’ve tried it a few times, but never smoked
regularly 6.7 8.2 7.5
I’ve never smoked 30.9 41.3 36.2
How often, if at all, do you currently use an electronic cigarette (e-cigarette)?
Not at all 73.2 81.3 77.3
Daily 9.4 7.1 8.2
Less than daily but at least once a week 8.6 4.3 6.4
Less than weekly, but at least once a month 3.0 2.9 3.0
Less than monthly 4.5 4.0 4.2
Don’t know 1.4 0.5 0.9
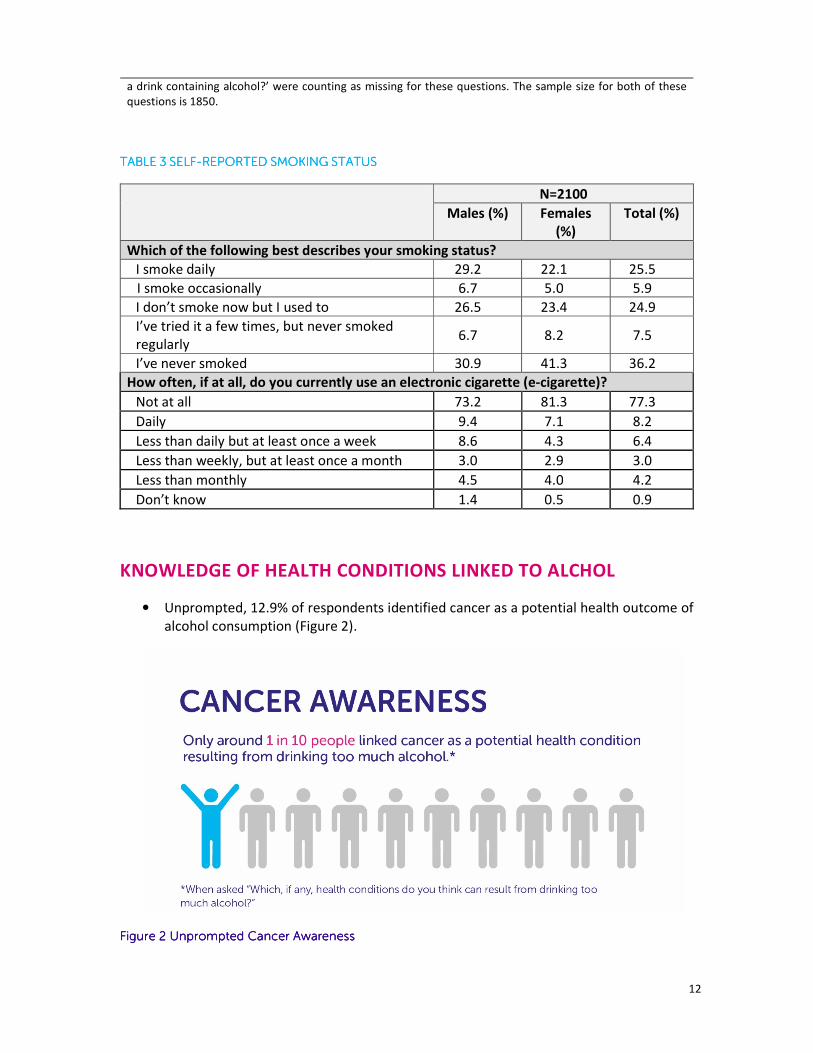
KNOWLEDGE OF HEALTH CONDITIONS LINKED TO ALCHOL
• Unprompted, 12.9% of respondents identified cancer as a potential health outcome of
alcohol consumption (Figure 2).
Figure Figure Figure Figure 2222 Unprompted Cancer AwarenessUnprompted Cancer AwarenessUnprompted Cancer AwarenessUnprompted Cancer Awareness
13
• When prompted, 47% identified cancer as a potential health outcome and almost 1 in
3 (29%) reported not knowing
• Most respondents correctly identified that drinking too much alcohol can result in liver
disease, being overweight or obese, and heart disease (73-95%).
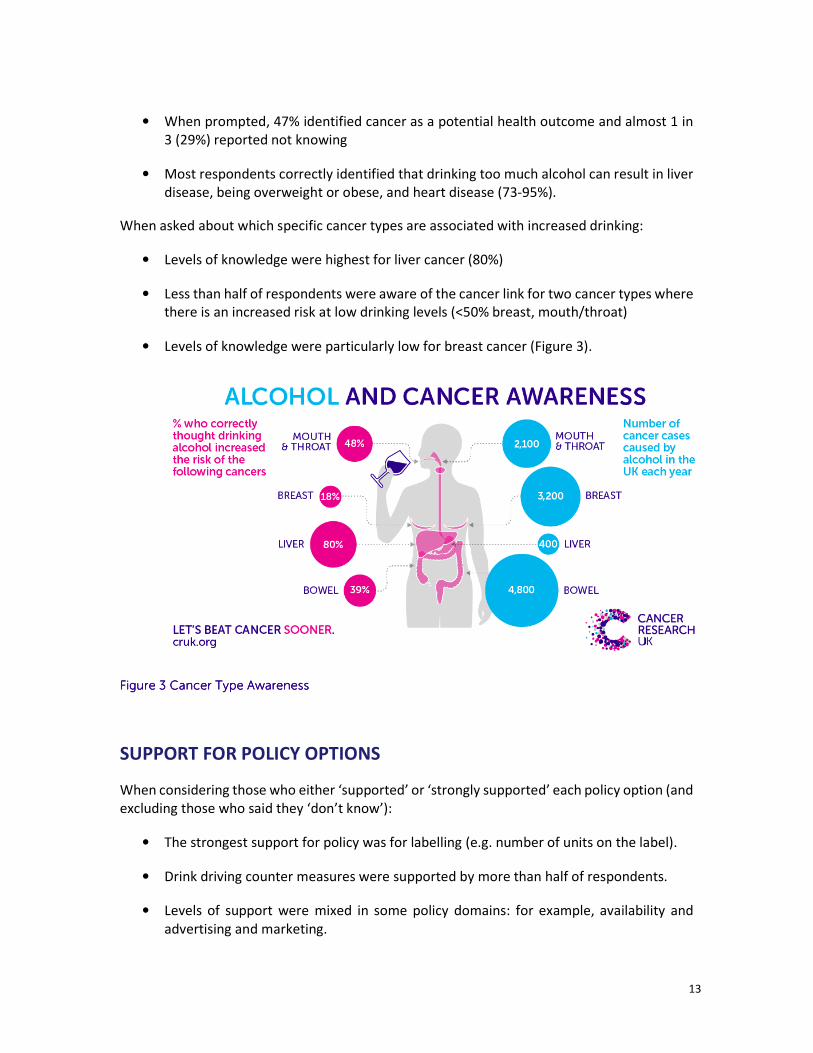
When asked about which specific cancer types are associated with increased drinking:
• Levels of knowledge were highest for liver cancer (80%)
• Less than half of respondents were aware of the cancer link for two cancer types where
there is an increased risk at low drinking levels (<50% breast, mouth/throat)
• Levels of knowledge were particularly low for breast cancer (Figure 3).
Figure Figure Figure Figure 3333 Cancer Type AwarenessCancer Type AwarenessCancer Type AwarenessCancer Type Awareness
SUPPORT FOR POLICY OPTIONS
When considering those who either ‘supported’ or ‘strongly supported’ each policy option (and
excluding those who said they ‘don’t know’):
• The strongest support for policy was for labelling (e.g. number of units on the label).
• Drink driving counter measures were supported by more than half of respondents.
• Levels of support were mixed in some policy domains: for example, availability and
advertising and marketing.
14
• There were low levels of support for policies regarding pricing and restricting the
temporal, spatial, and economic availability of alcohol (see Appendix 2).
The relationship between policy support and self-reported alcohol consumption (as measured
by AUDIT C categories ‘non-drinker’, lower risk’, and ‘increasing risk’) was also examined (Figure
4 to Figure 10).
• The percentage of respondents indicating ‘Support’ or ‘Strongly support’ for each policy
decreased as consumption increased, with the exception increasing funding for alcohol
treatment services).
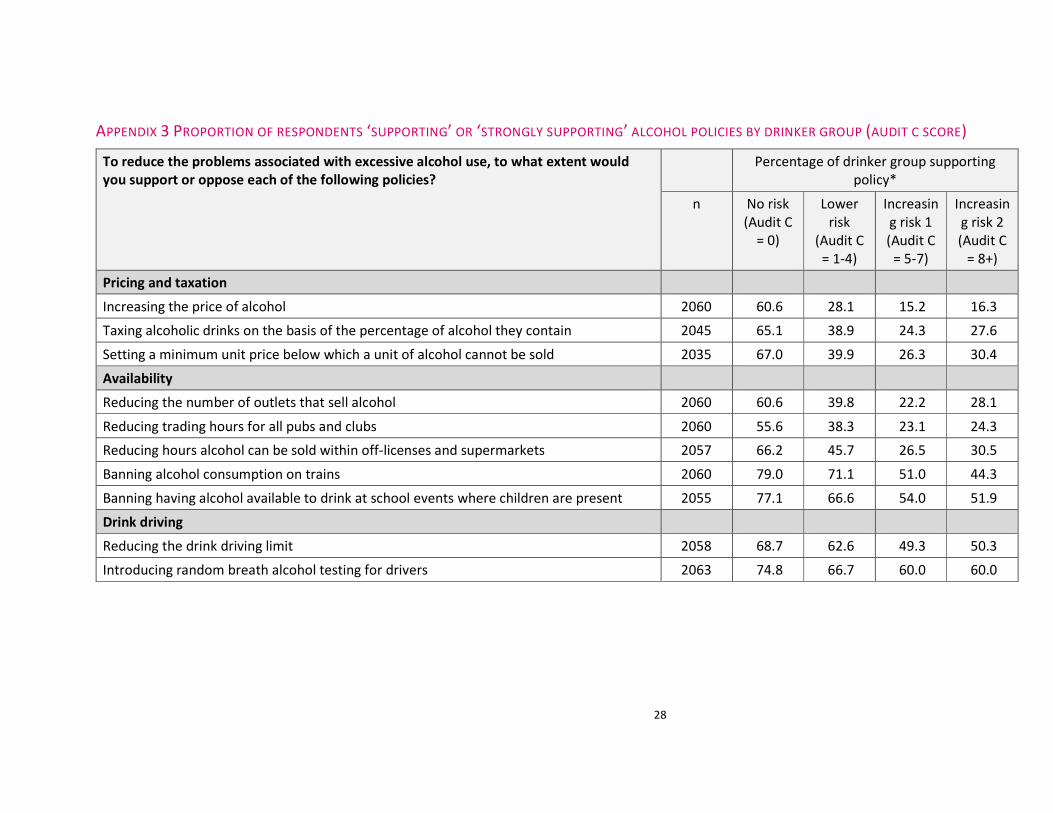
We also examined support for policies by self-reported alcohol consumption with the
‘increasing risk’ drinker group further divided into AUDIT-C score 5-7 and AUDIT-C score 8+ (see
Appendix 3).
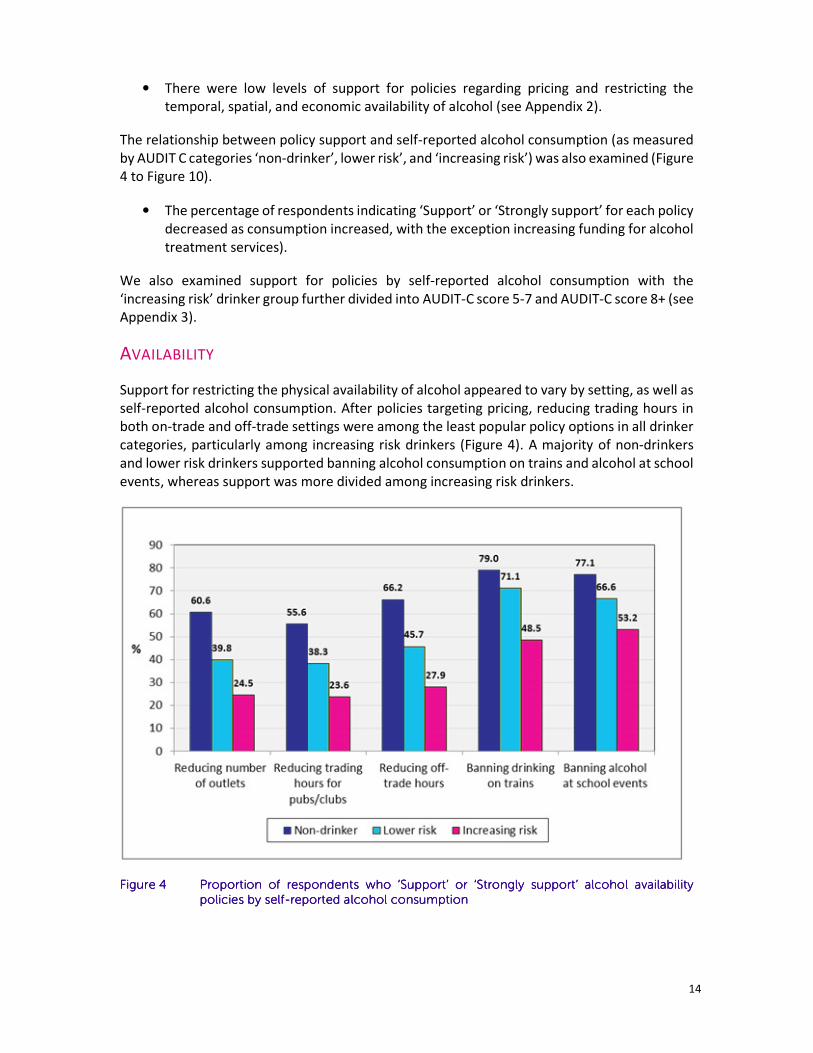
AVAILABILITY
Support for restricting the physical availability of alcohol appeared to vary by setting, as well as
self-reported alcohol consumption. After policies targeting pricing, reducing trading hours in
both on-trade and off-trade settings were among the least popular policy options in all drinker
categories, particularly among increasing risk drinkers (Figure 4). A majority of non-drinkers
and lower risk drinkers supported banning alcohol consumption on trains and alcohol at school
events, whereas support was more divided among increasing risk drinkers.
Figure Figure Figure Figure 4444 Proportion of respondents who ‘Support’ or ‘Strongly support’ alcohol availability Proportion of respondents who ‘Support’ or ‘Strongly support’ alcohol availability Proportion of respondents who ‘Support’ or ‘Strongly support’ alcohol availability Proportion of respondents who ‘Support’ or ‘Strongly support’ alcohol availability
policies by selfpolicies by selfpolicies by selfpolicies by self----reported alcohol consumptionreported alcohol consumptionreported alcohol consumptionreported alcohol consumption

15
DRINK DRIVING COUNTER MEASURES
Most non-drinkers supported reducing the drink driving limit and introducing random breath
alcohol testing for drivers (Figure 5). Lower risk drinkers also supported these policies, however
to a lesser degree. Half of increasing risk drinkers supported reducing the drink driving limit.
Figure Figure Figure Figure 5555 Proportion of Proportion of Proportion of Proportion of respondents who ‘Support’ or ‘Strongly support’ drink driving counter respondents who ‘Support’ or ‘Strongly support’ drink driving counter respondents who ‘Support’ or ‘Strongly support’ drink driving counter respondents who ‘Support’ or ‘Strongly support’ drink driving counter
measure policies by selfmeasure policies by selfmeasure policies by selfmeasure policies by self----reported alcohol consumptionreported alcohol consumptionreported alcohol consumptionreported alcohol consumption
16
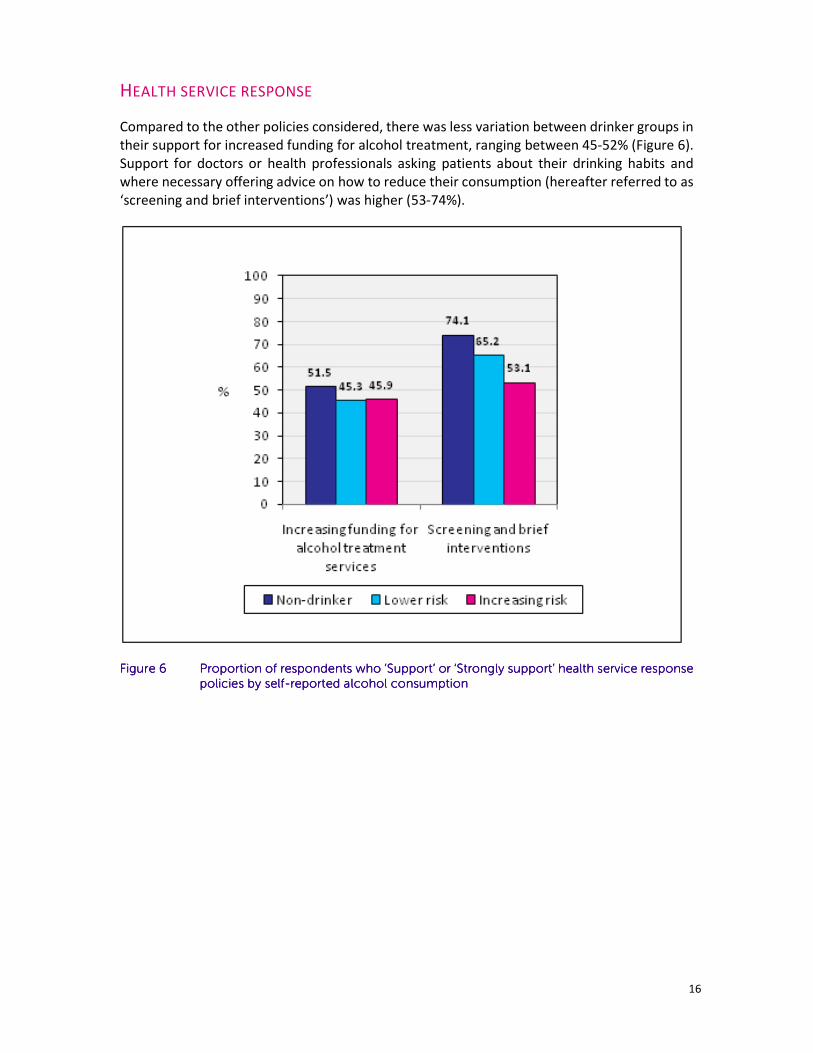
HEALTH SERVICE RESPONSE
Compared to the other policies considered, there was less variation between drinker groups in
their support for increased funding for alcohol treatment, ranging between 45-52% (Figure 6).
Support for doctors or health professionals asking patients about their drinking habits and
where necessary offering advice on how to reduce their consumption (hereafter referred to as
‘screening and brief interventions’) was higher (53-74%).
Figure Figure Figure Figure 6666 Proportion of respondents who ‘Support’ or ‘Strongly support’ health service response Proportion of respondents who ‘Support’ or ‘Strongly support’ health service response Proportion of respondents who ‘Support’ or ‘Strongly support’ health service response Proportion of respondents who ‘Support’ or ‘Strongly support’ health service response
policies by selfpolicies by selfpolicies by selfpolicies by self----reported alcohol consumptionreported alcohol consumptionreported alcohol consumptionreported alcohol consumption
17
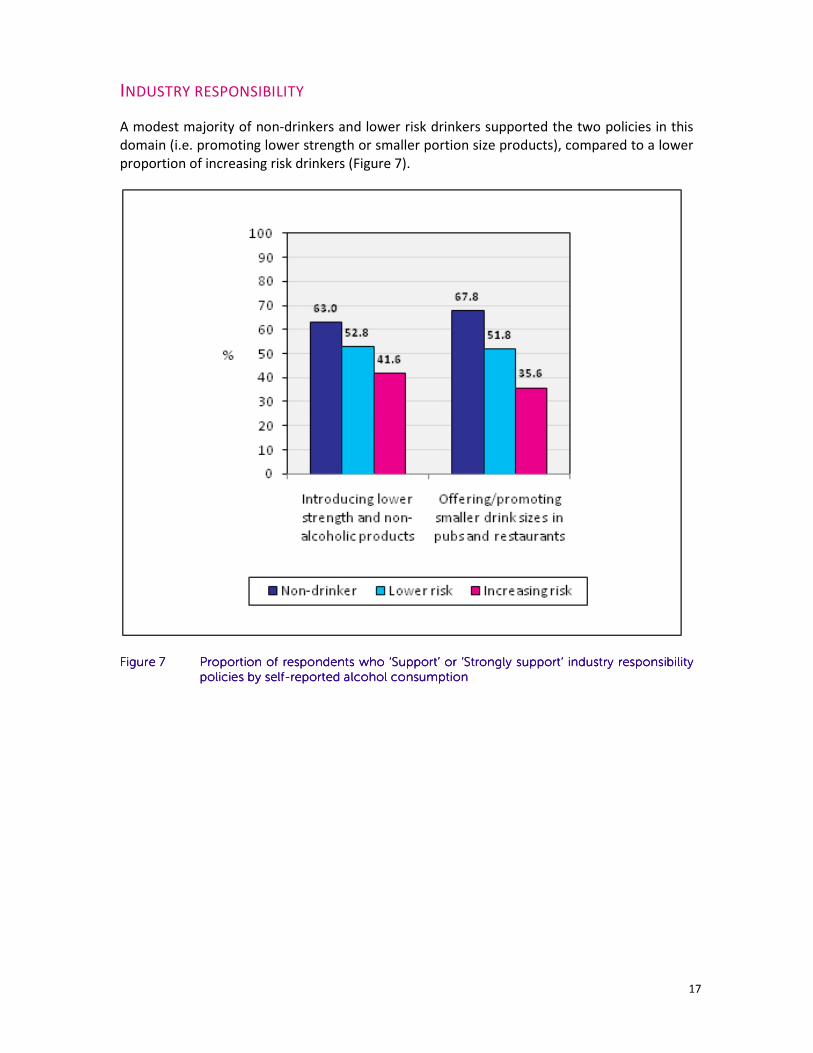
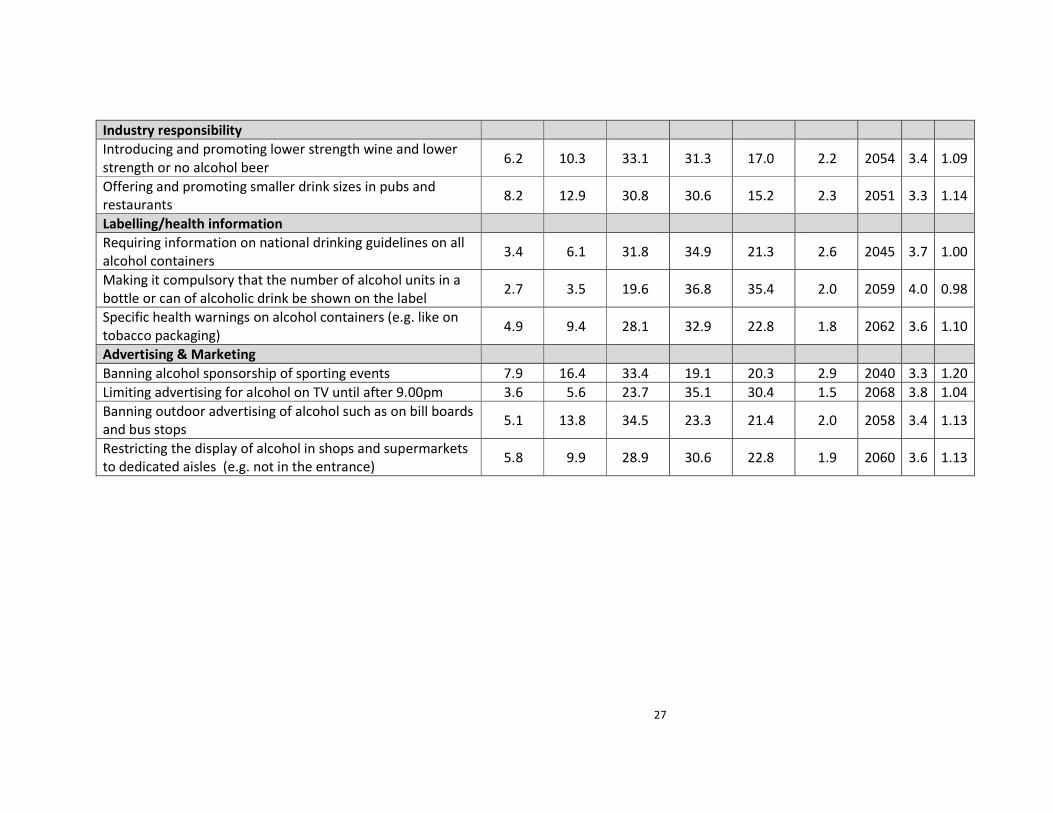
INDUSTRY RESPONSIBILITY
A modest majority of non-drinkers and lower risk drinkers supported the two policies in this
domain (i.e. promoting lower strength or smaller portion size products), compared to a lower
proportion of increasing risk drinkers (Figure 7).
Figure Figure Figure Figure 7777 Proportion of respondents who ‘Support’ or ‘Strongly support’ industry responsibility Proportion of respondents who ‘Support’ or ‘Strongly support’ industry responsibility Proportion of respondents who ‘Support’ or ‘Strongly support’ industry responsibility Proportion of respondents who ‘Support’ or ‘Strongly support’ industry responsibility
policies by selfpolicies by selfpolicies by selfpolicies by self----reported alcohol consumptionreported alcohol consumptionreported alcohol consumptionreported alcohol consumption

18
LABELLING
Support for labelling was high across all drinking groups.
• The mandatory inclusion of the number of units in a bottle or a can being shown on the
label was highly supported by the majority of all drinking groups (68-80%).
• The majority of non-drinkers (70-75%) supported national guidelines and specific health
warnings on alcohol containers, while support was more divided among increasing risk
drinkers (51% and 47% respectively) (Figure 8).
Figure Figure Figure Figure 8888 Proportion of respondents who ‘Support’ or ‘Strongly support’ labelling policies by Proportion of respondents who ‘Support’ or ‘Strongly support’ labelling policies by Proportion of respondents who ‘Support’ or ‘Strongly support’ labelling policies by Proportion of respondents who ‘Support’ or ‘Strongly support’ labelling policies by
selfselfselfself----reported alcohol consumptionreported alcohol consumptionreported alcohol consumptionreported alcohol consumption
19
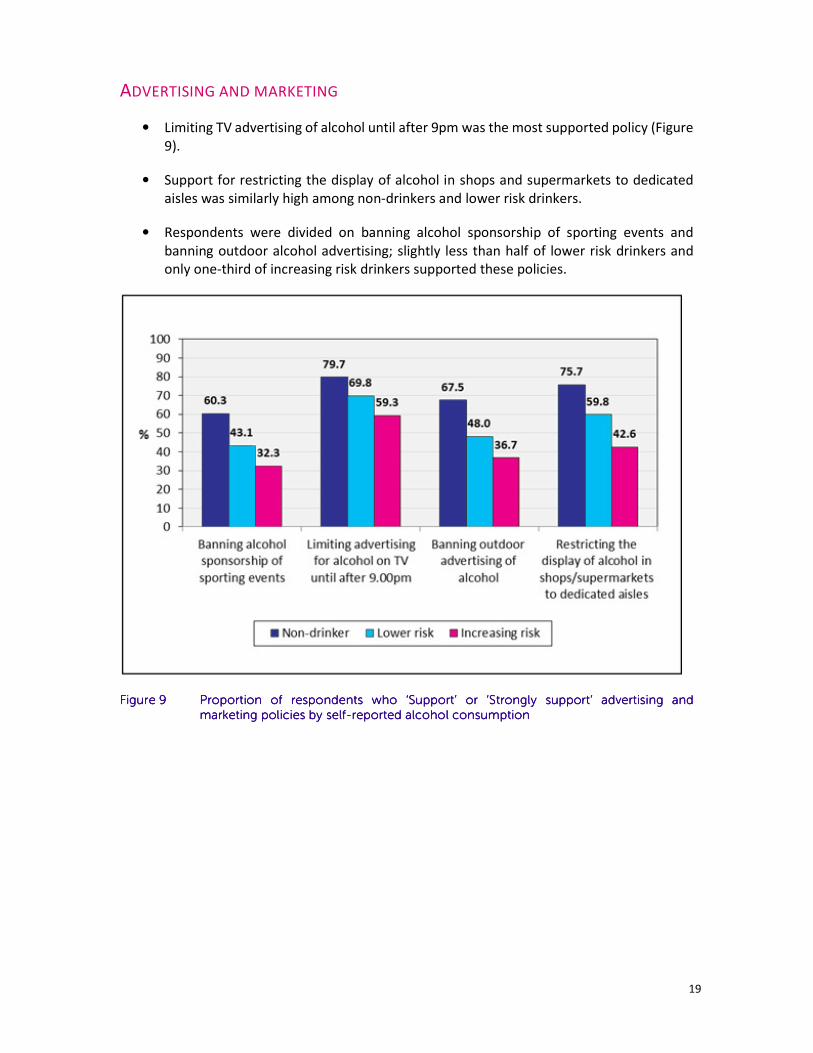
ADVERTISING AND MARKETING
• Limiting TV advertising of alcohol until after 9pm was the most supported policy (Figure
9).
• Support for restricting the display of alcohol in shops and supermarkets to dedicated
aisles was similarly high among non-drinkers and lower risk drinkers.
• Respondents were divided on banning alcohol sponsorship of sporting events and
banning outdoor alcohol advertising; slightly less than half of lower risk drinkers and
only one-third of increasing risk drinkers supported these policies.
Figure Figure Figure Figure 9999 Proportion of respondents who ‘Support’ or ‘Strongly support’ advertising and Proportion of respondents who ‘Support’ or ‘Strongly support’ advertising and Proportion of respondents who ‘Support’ or ‘Strongly support’ advertising and Proportion of respondents who ‘Support’ or ‘Strongly support’ advertising and
marketing policies by selfmarketing policies by selfmarketing policies by selfmarketing policies by self----reported alcohol consumptionreported alcohol consumptionreported alcohol consumptionreported alcohol consumption

20
PRICING
Sixty one percent (60.6%) of non-drinkers were supportive of increasing the price of alcohol
compared to only 15.6% of increasing risk drinkers (Figure 10). Levels of support were slightly
higher across all drinking groups for volumetric taxation and minimum unit pricing, although
still only a minority of lower risk or increasing risk respondents expressed support for either
policy.
Figure Figure Figure Figure 10101010 Proportion of respondents who ‘Support’ or ‘Strongly support’ alcohol pricing policies Proportion of respondents who ‘Support’ or ‘Strongly support’ alcohol pricing policies Proportion of respondents who ‘Support’ or ‘Strongly support’ alcohol pricing policies Proportion of respondents who ‘Support’ or ‘Strongly support’ alcohol pricing policies by by by by
selfselfselfself----reported alcohol consumptionreported alcohol consumptionreported alcohol consumptionreported alcohol consumption
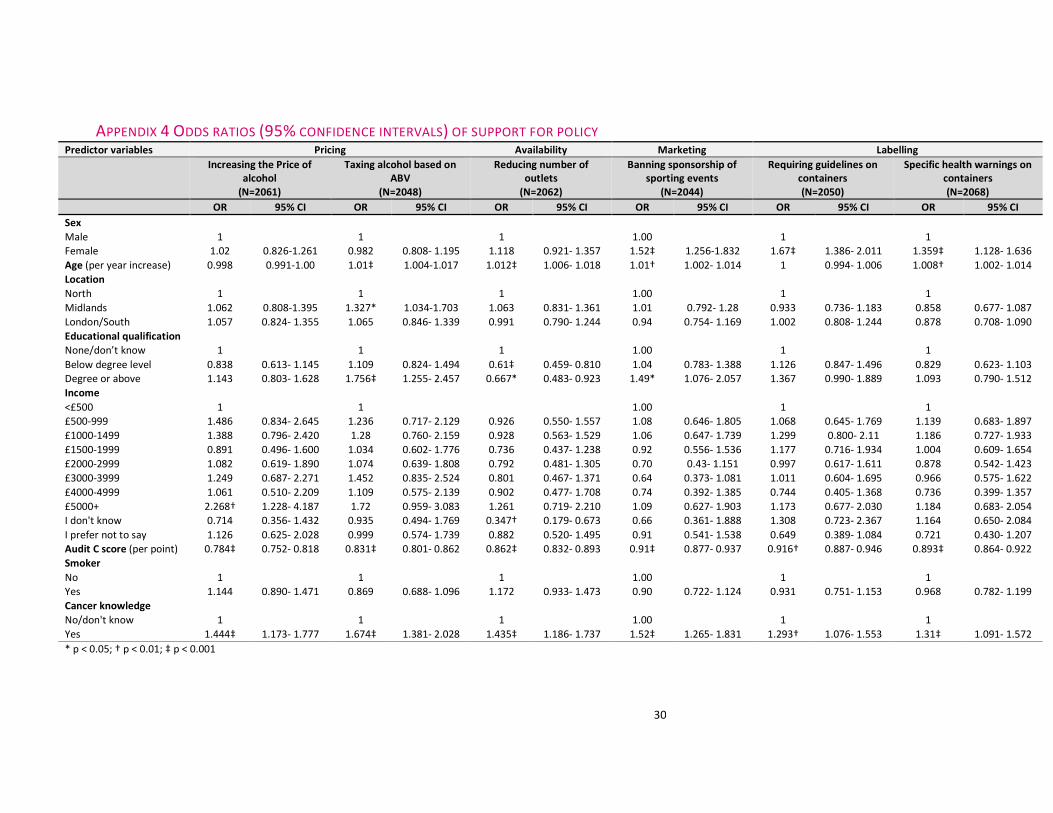
VARIABLES ASSOCIATED WITH POLICY SUPPORT
To replicate Buykx et al., (21) analysis of the relationship between various predictor variables
(demographic characteristics, alcohol consumption as measured by AUDIT-C, smoking status
and knowledge of the link between alcohol and cancer) and support for six alcohol policy
options was undertaken (see Appendix 4).
The two variables most consistently associated with support for policies were:
1. Knowledge of the link between alcohol and cancer (with those aware of the link more
likely to support each policy than those who were not aware)
2. AUDIT-C scores (analysed as a continuous variable with those with increasing scores
significantly less likely to support each policy option).

21
Increasing age was associated with increased likelihood of support for all policies except
increasing the price of alcohol and compulsory drinking guideline information to be included
on alcohol containers. Females were significantly more likely than men to support banning
alcohol sponsorship of sporting events, compulsory drinking guideline information and health
warnings on alcohol containers. Those with the highest level of education were significantly
more likely to support banning alcohol sponsorship of sporting events, but less likely to support
a reduction in the number of alcohol outlets than those without formal educational
qualifications.
DISCUSSION This report indicates current levels of public support for different alcohol related policy options
and has shown that there is an inverse relationship between support for policies and level of
alcohol consumed. Also, those that have greater health knowledge, particularly awareness of
alcohol as a risk factor for cancer are more supportive of alcohol policies explored in this
analysis.
When support for different policies was considered in relation to levels of alcohol consumption
(as measured by AUDIT score); non-drinkers were generally the most supportive (>50% for all
policies) and those drinking at increasing risk levels the least supportive. Again, this is consistent
with previous evidence (10, 11, 22). There are, however, some policy options where the
divergence in opinion between non-drinkers and increasing risk drinkers was particularly
pronounced; for pricing and taxation polices and reduction in the number of outlets, the
difference in the level of support between these groups was more than 35 percentage points.
In contrast, for random breath testing and increasing funding for treatment, the difference
between groups in the proportion supporting the policy was less than 15%.
For the statements which included additional information (i.e. volumetric taxation and
minimum unit pricing), there were marginally higher levels of support. While survey
respondents in this study were not provided with full information about the intended goals of
policy, this finding is relevant to the argument of Tobin et al., 2011(11) that people are more
likely to support policies when their rationale is explained. From our study, it appears even
understanding the basis on which alcohol prices could be set is potentially relevant.
With health sector responses, there was greater support for ‘prevention’ rather than ‘cure’.
That is, there was greater support for screening and brief intervention (the relevant statement
was worded as “Doctors or health professionals ask patients about their drinking habits and,
where necessary, offer advice on how to reduce their alcohol consumption”) in comparison to
increased funding for treatment services, which would ordinarily address the needs of people
with more serious alcohol related problems. This may be the use of the term ‘increased funding’
in the item concerning treatment making this option less appealing to some: previous
qualitative research on this topic (approximately 90 participants in focus groups in England and
Scotland) found some held the view that need for treatment is the responsibility of the
individual and/or a waste of resources (23).
Low levels of support were shown for reducing availability of alcohol in venues that were
licenced and off-licence retail outlets (<41%). However there were higher levels of support
22
(greater than 60%) for banning alcohol consumption in settings which might not be considered
‘traditional’ locations for drinking. We chose to investigate two examples of such settings
where alcohol may be available, but where alcohol use might not necessarily be regarded as a
usual activity in that environment - trains and schools.
There was also a diversity of opinion about the advertising and marketing related policies. To
understand these differences, it would be useful to explore in greater detail what people
consider to be the potential positive and negative consequences of each of the policy options.
For example, it would be interesting to explore whether people distinguish between alcohol
advertising in a specifically timed commercial slot and the showing of alcohol branding as part
of a continuous sports broadcast (e.g. hoarding, billboards, logos on clothing and pitches).
Our replication of the analysis reported by Buykx et al.,(12) of the association between support
for specific alcohol policies and various predictor variables yielded very similar results. In
particular, in this study, we also found knowledge of the link between alcohol and cancer to be
a significant predictor of support for polices in all domains, while higher levels of alcohol
consumption as measured by AUDIT-C were associated with lower levels of policy support. The
analyses undertaken to date include only those policies that were in the study by Buykx et
al.,(12)and did not have the more detailed data on cancer knowledge reported in this study. It
is our intention that future analyses will incorporate these newly available data.
FURTHER WORK
The first Buykx et al., 2015(5) report provided considerable evidence for the need to raise the
public awareness of the links with alcohol and cancer and this report has shown how this could
influence the acceptance of key policy interventions. However there remains considerable
scope to explore relationships between different elements of the data. Further work has been
carried out to explore relationships between different elements of the data, particularly in
examining the association between knowledge of the link between alcohol and cancer and
levels of support for various policy options. In addition to our replication of findings from
previous analysis of Australian data(12), the inclusion of additional variables in this study will
allow us to explore other theoretically relevant predictor variables, such as socioeconomic
status and perceptions of responsibility for alcohol related harm.

23
APPENDICES
APPENDIX 1 SOURCE OF SURVEY QUESTIONS1
Question Source Additional notes
Smoking
5 CCNSW survey , reported in Buykx et al.
(12); Australian National Strategy Drug
Household Survey (NDSHS) (16)
7 Brose et al (24)
Alcohol consumption
8-10 Audit C (19) Used UK version of AUDIT (20)
Support for policy**
Q11 - Question stem NDSHS (16) Stem also used in Buykx et al. 2014(12) (i.e.“To reduce the problems
associated with excessive alcohol use, to what extent would you
support or oppose each of the following policies…?”)
11.1, 11.4, 11.18,
11.14
CCNSW survey , reported in Buykx et al.
(12); NDSHS survey (16)
Q11.1 similar statement used in APISE telephone survey, ‘An
increase in the price of alcohol’
11.2, 11.19 CCNSW survey , reported in Buykx et al.
(12)
11.5, 11.15 NDSHS survey (16) Q11.15 changed from ‘9.30pm’ to ‘9.00pm’ to reflect UK TV
watershed hour
1 Full list of survey questions available on request
24
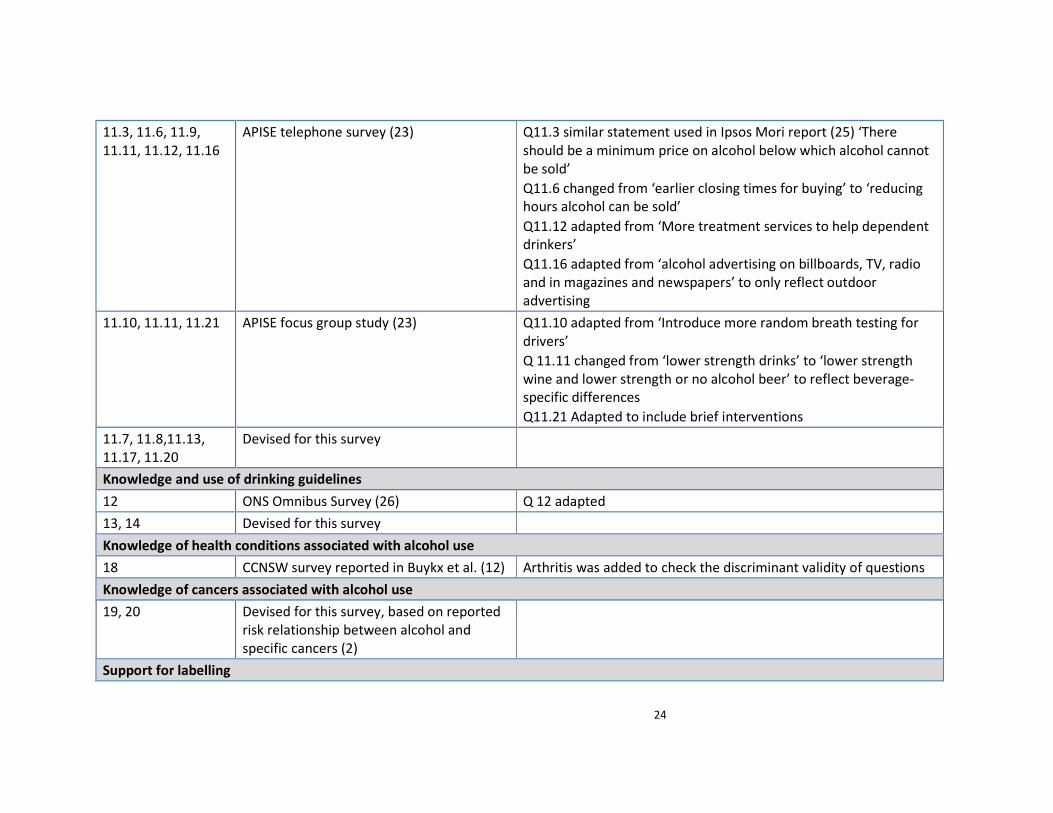
11.3, 11.6, 11.9,
11.11, 11.12, 11.16
APISE telephone survey (23) Q11.3 similar statement used in Ipsos Mori report (25) ‘There
should be a minimum price on alcohol below which alcohol cannot
be sold’
Q11.6 changed from ‘earlier closing times for buying’ to ‘reducing
hours alcohol can be sold’
Q11.12 adapted from ‘More treatment services to help dependent
drinkers’
Q11.16 adapted from ‘alcohol advertising on billboards, TV, radio
and in magazines and newspapers’ to only reflect outdoor
advertising
11.10, 11.11, 11.21 APISE focus group study (23) Q11.10 adapted from ‘Introduce more random breath testing for
drivers’
Q 11.11 changed from ‘lower strength drinks’ to ‘lower strength
wine and lower strength or no alcohol beer’ to reflect beverage-
specific differences
Q11.21 Adapted to include brief interventions
11.7, 11.8,11.13,
11.17, 11.20
Devised for this survey
Knowledge and use of drinking guidelines
12 ONS Omnibus Survey (26) Q 12 adapted
13, 14 Devised for this survey
Knowledge of health conditions associated with alcohol use
18 CCNSW survey reported in Buykx et al. (12) Arthritis was added to check the discriminant validity of questions
Knowledge of cancers associated with alcohol use
19, 20 Devised for this survey, based on reported
risk relationship between alcohol and
specific cancers (2)
Support for labelling
25
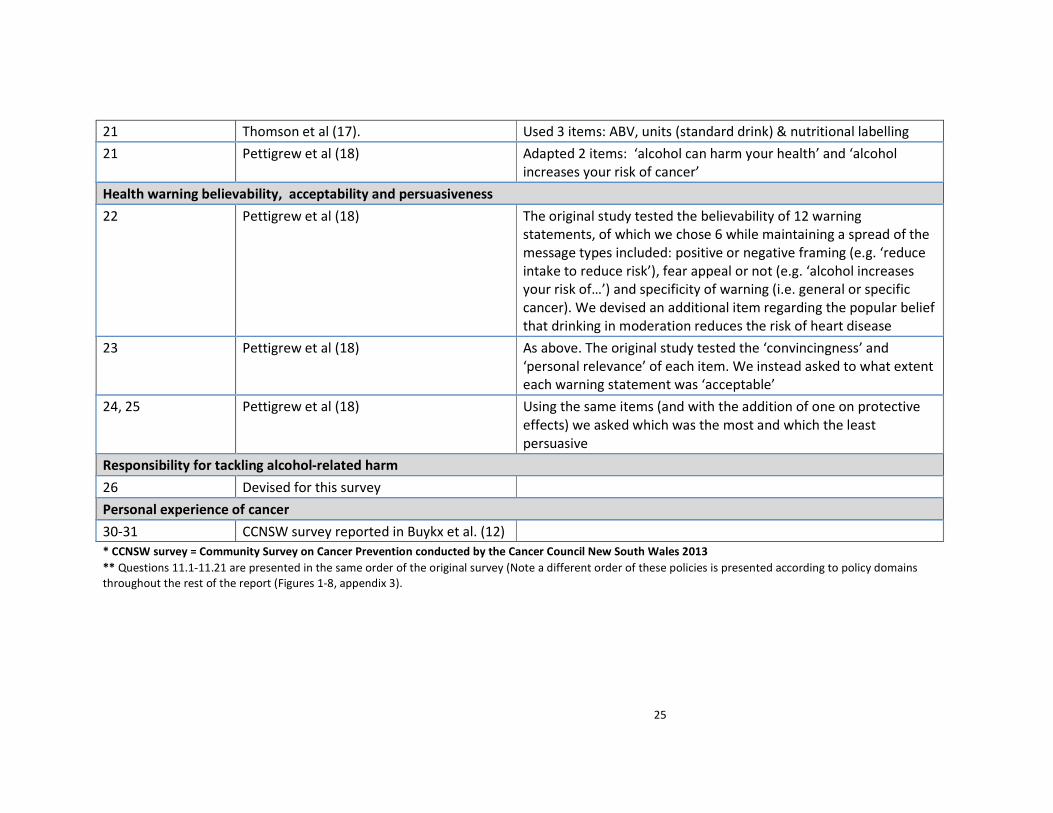
21 Thomson et al (17). Used 3 items: ABV, units (standard drink) & nutritional labelling
21 Pettigrew et al (18) Adapted 2 items: ‘alcohol can harm your health’ and ‘alcohol
increases your risk of cancer’
Health warning believability, acceptability and persuasiveness
22 Pettigrew et al (18) The original study tested the believability of 12 warning
statements, of which we chose 6 while maintaining a spread of the
message types included: positive or negative framing (e.g. ‘reduce
intake to reduce risk’), fear appeal or not (e.g. ‘alcohol increases
your risk of…’) and specificity of warning (i.e. general or specific
cancer). We devised an additional item regarding the popular belief
that drinking in moderation reduces the risk of heart disease
23 Pettigrew et al (18) As above. The original study tested the ‘convincingness’ and
‘personal relevance’ of each item. We instead asked to what extent
each warning statement was ‘acceptable’
24, 25 Pettigrew et al (18) Using the same items (and with the addition of one on protective
effects) we asked which was the most and which the least
persuasive
Responsibility for tackling alcohol-related harm
26 Devised for this survey
Personal experience of cancer
30-31 CCNSW survey reported in Buykx et al. (12)
* CCNSW survey = Community Survey on Cancer Prevention conducted by the Cancer Council New South Wales 2013
** Questions 11.1-11.21 are presented in the same order of the original survey (Note a different order of these policies is presented according to policy domains
throughout the rest of the report (Figures 1-8, appendix 3).

26
APPENDIX 2 PUBLIC SUPPORT OF ALCOHOL POLICIES
To reduce the problems associated with excessive
alcohol use, to what extent would you support or
oppose each of the following policies?
% (n=2100) Mean of valid
responses
Strongly
oppose
Oppose Neither Support Strongly
support
Don’t
Know
N Mean* SD
Pricing and taxation
Increasing the price of alcohol 24.2 23.2 24.5 14.8 11.3 2.0 2059 2.7 1.31
Taxing alcoholic drinks on the basis of the percentage
of alcohol they contain 17.5 19.8 24.7 21.2 14.1 2.6 2045 3.0 1.31
Setting a minimum unit price below which a unit of
alcohol cannot be sold 16.0 17.5 26.6 22.0 14.8 3.1 2034 3.0 1.30
Availability
Reducing the number of outlets that sell alcohol 13.0 21.1 29.0 19.3 15.8 1.9 2061 3.0 1.26
Reducing trading hours for all pubs and clubs 15.6 23.0 26.0 16.9 16.6 1.9 2060 3.0 1.31
Reducing hours alcohol can be sold within off-licenses
and supermarkets 13.5 19.8 24.8 21.3 18.5 2.1 2057 3.1 1.31
Banning alcohol consumption on trains 7.2 9.8 19.7 25.7 35.7 1.9 2061 3.7 1.25
Banning having alcohol available to drink at school
events where children are present 5.7 10.3 20.9 27.1 33.9 2.1 2055 3.8 1.20
Drink driving
Reducing the drink driving limit 11.3 12.3 17.7 24.7 32.0 2.0 2058 3.6 1.36
Introducing random breath alcohol testing for drivers 6.1 9.1 19.3 29.9 33.8 1.8 2062 3.8 1.19
Treatment
Increasing funding for alcohol treatment services 7.6 12.2 32.5 28.0 17.1 2.6 2045 3.4 1.14
Doctors or health professionals ask patients about
their drinking habits and, where necessary, offer
advice on how to reduce their alcohol consumption
(SBIs)
3.6 6.3 28.2 38.4 21.7 1.8 2062 3.7 1.00
27
Industry responsibility
Introducing and promoting lower strength wine and lower
strength or no alcohol beer 6.2 10.3 33.1 31.3 17.0 2.2 2054 3.4 1.09
Offering and promoting smaller drink sizes in pubs and
restaurants 8.2 12.9 30.8 30.6 15.2 2.3 2051 3.3 1.14
Labelling/health information
Requiring information on national drinking guidelines on all
alcohol containers 3.4 6.1 31.8 34.9 21.3 2.6 2045 3.7 1.00
Making it compulsory that the number of alcohol units in a
bottle or can of alcoholic drink be shown on the label 2.7 3.5 19.6 36.8 35.4 2.0 2059 4.0 0.98
Specific health warnings on alcohol containers (e.g. like on
tobacco packaging) 4.9 9.4 28.1 32.9 22.8 1.8 2062 3.6 1.10
Advertising & Marketing
Banning alcohol sponsorship of sporting events 7.9 16.4 33.4 19.1 20.3 2.9 2040 3.3 1.20
Limiting advertising for alcohol on TV until after 9.00pm 3.6 5.6 23.7 35.1 30.4 1.5 2068 3.8 1.04
Banning outdoor advertising of alcohol such as on bill boards
and bus stops 5.1 13.8 34.5 23.3 21.4 2.0 2058 3.4 1.13
Restricting the display of alcohol in shops and supermarkets
to dedicated aisles (e.g. not in the entrance) 5.8 9.9 28.9 30.6 22.8 1.9 2060 3.6 1.13
28
APPENDIX 3 PROPORTION OF RESPONDENTS ‘SUPPORTING’ OR ‘STRONGLY SUPPORTING’ ALCOHOL POLICIES BY DRINKER GROUP (AUDIT C SCORE)
To reduce the problems associated with excessive alcohol use, to what extent would
you support or oppose each of the following policies?
Percentage of drinker group supporting
policy*
n No risk
(Audit C
= 0)
Lower
risk
(Audit C
= 1-4)
Increasin
g risk 1
(Audit C
= 5-7)
Increasin
g risk 2
(Audit C
= 8+)
Pricing and taxation
Increasing the price of alcohol 2060 60.6 28.1 15.2 16.3
Taxing alcoholic drinks on the basis of the percentage of alcohol they contain 2045 65.1 38.9 24.3 27.6
Setting a minimum unit price below which a unit of alcohol cannot be sold 2035 67.0 39.9 26.3 30.4
Availability
Reducing the number of outlets that sell alcohol 2060 60.6 39.8 22.2 28.1
Reducing trading hours for all pubs and clubs 2060 55.6 38.3 23.1 24.3
Reducing hours alcohol can be sold within off-licenses and supermarkets 2057 66.2 45.7 26.5 30.5
Banning alcohol consumption on trains 2060 79.0 71.1 51.0 44.3
Banning having alcohol available to drink at school events where children are present 2055 77.1 66.6 54.0 51.9
Drink driving
Reducing the drink driving limit 2058 68.7 62.6 49.3 50.3
Introducing random breath alcohol testing for drivers 2063 74.8 66.7 60.0 60.0

29
Treatment
Increasing funding for alcohol treatment services 2043 51.5 45.3 47.4 43.6
Doctors or health professionals ask patients about their drinking habits and, where
necessary, offer advice on how to reduce their alcohol consumption (SBIs) 2061 74.1 65.2 55.1 49.8
Industry responsibility
Introducing and promoting lower strength wine and lower strength or no alcohol beer 2053 63.0 52.8 43.4 38.6
Offering and promoting smaller drink sizes in pubs and restaurants 2052 67.8 51.8 37.9 31.9
Labelling/health information
Requiring information on national drinking guidelines on all alcohol containers 2045 70.4 60.5 52.5 48.6
Making it compulsory that the number of alcohol units in a bottle or can of alcoholic drink
be shown on the label 2059 79.3 77.3 71.6 62.0
Specific health warnings on alcohol containers (e.g. like on tobacco packaging) 2062 74.8 60.9 47.6 46.6
Advertising & Marketing
Banning alcohol sponsorship of sporting events 2040 60.3 43.1 32.8 31.7
Limiting advertising for alcohol on TV until after 9.00pm 2069 79.7 69.8 62.0 54.7
Banning outdoor advertising of alcohol such as on bill boards and bus stops 2057 67.5 48.0 37.8 35.2
Restricting the display of alcohol in shops and supermarkets to dedicated aisles (e.g. not
in the entrance) 2060 75.7 59.8 43.0 41.8
* ‘Strongly support’ or ‘Support’ and excluding ‘Don’t know’.
30
APPENDIX 4 ODDS RATIOS (95% CONFIDENCE INTERVALS) OF SUPPORT FOR POLICY Predictor variables Pricing Availability Marketing Labelling
Increasing the Price of
alcohol
(N=2061)
Taxing alcohol based on
ABV
(N=2048)
Reducing number of
outlets
(N=2062)
Banning sponsorship of
sporting events
(N=2044)
Requiring guidelines on
containers
(N=2050)
Specific health warnings on
containers
(N=2068)
OR 95% CI OR 95% CI OR 95% CI OR 95% CI OR 95% CI OR 95% CI
Sex
Male 1 1 1 1.00 1 1
Female 1.02 0.826-1.261 0.982 0.808- 1.195 1.118 0.921- 1.357 1.52‡ 1.256-1.832 1.67‡ 1.386- 2.011 1.359‡ 1.128- 1.636
Age (per year increase) 0.998 0.991-1.00 1.01‡ 1.004-1.017 1.012‡ 1.006- 1.018 1.01† 1.002- 1.014 1 0.994- 1.006 1.008† 1.002- 1.014
Location
North 1 1 1 1.00 1 1
Midlands 1.062 0.808-1.395 1.327* 1.034-1.703 1.063 0.831- 1.361 1.01 0.792- 1.28 0.933 0.736- 1.183 0.858 0.677- 1.087
London/South 1.057 0.824- 1.355 1.065 0.846- 1.339 0.991 0.790- 1.244 0.94 0.754- 1.169 1.002 0.808- 1.244 0.878 0.708- 1.090
Educational qualification
None/don’t know 1 1 1 1.00 1 1
Below degree level 0.838 0.613- 1.145 1.109 0.824- 1.494 0.61‡ 0.459- 0.810 1.04 0.783- 1.388 1.126 0.847- 1.496 0.829 0.623- 1.103
Degree or above 1.143 0.803- 1.628 1.756‡ 1.255- 2.457 0.667* 0.483- 0.923 1.49* 1.076- 2.057 1.367 0.990- 1.889 1.093 0.790- 1.512
Income
<£500 1 1 1.00 1 1
£500-999 1.486 0.834- 2.645 1.236 0.717- 2.129 0.926 0.550- 1.557 1.08 0.646- 1.805 1.068 0.645- 1.769 1.139 0.683- 1.897
£1000-1499 1.388 0.796- 2.420 1.28 0.760- 2.159 0.928 0.563- 1.529 1.06 0.647- 1.739 1.299 0.800- 2.11 1.186 0.727- 1.933
£1500-1999 0.891 0.496- 1.600 1.034 0.602- 1.776 0.736 0.437- 1.238 0.92 0.556- 1.536 1.177 0.716- 1.934 1.004 0.609- 1.654
£2000-2999 1.082 0.619- 1.890 1.074 0.639- 1.808 0.792 0.481- 1.305 0.70 0.43- 1.151 0.997 0.617- 1.611 0.878 0.542- 1.423
£3000-3999 1.249 0.687- 2.271 1.452 0.835- 2.524 0.801 0.467- 1.371 0.64 0.373- 1.081 1.011 0.604- 1.695 0.966 0.575- 1.622
£4000-4999 1.061 0.510- 2.209 1.109 0.575- 2.139 0.902 0.477- 1.708 0.74 0.392- 1.385 0.744 0.405- 1.368 0.736 0.399- 1.357
£5000+ 2.268† 1.228- 4.187 1.72 0.959- 3.083 1.261 0.719- 2.210 1.09 0.627- 1.903 1.173 0.677- 2.030 1.184 0.683- 2.054
I don't know 0.714 0.356- 1.432 0.935 0.494- 1.769 0.347† 0.179- 0.673 0.66 0.361- 1.888 1.308 0.723- 2.367 1.164 0.650- 2.084
I prefer not to say 1.126 0.625- 2.028 0.999 0.574- 1.739 0.882 0.520- 1.495 0.91 0.541- 1.538 0.649 0.389- 1.084 0.721 0.430- 1.207
Audit C score (per point) 0.784‡ 0.752- 0.818 0.831‡ 0.801- 0.862 0.862‡ 0.832- 0.893 0.91‡ 0.877- 0.937 0.916† 0.887- 0.946 0.893‡ 0.864- 0.922
Smoker
No 1 1 1 1.00 1 1
Yes 1.144 0.890- 1.471 0.869 0.688- 1.096 1.172 0.933- 1.473 0.90 0.722- 1.124 0.931 0.751- 1.153 0.968 0.782- 1.199
Cancer knowledge
No/don't know 1 1 1 1.00 1 1
Yes 1.444‡ 1.173- 1.777 1.674‡ 1.381- 2.028 1.435‡ 1.186- 1.737 1.52‡ 1.265- 1.831 1.293† 1.076- 1.553 1.31‡ 1.091- 1.572
* p < 0.05; † p < 0.01; ‡ p < 0.001
31
REFERENCES 1. Parkin DM. 3. Cancers attributable to consumption of alcohol in the UK in 2010. British
Journal of Cancer. 2011;105(Suppl 2):S14-S8.
2. Bagnardi V, Rota M, Botteri E, Tramacere I, Islami F, Fedirko V, et al. Alcohol
consumption and site-specific cancer risk: a comprehensive dose–response meta-analysis.
British Journal of Cancer. 2014.
3. Praud D, Rota M, Rehm J, Shield K, Zatoński W, Hashibe M, et al. Cancer incidence and
mortality attributable to alcohol consumption. International Journal of Cancer. 2015:n/a-n/a.
4. Angus C, Holmes J, Pryce R, Meier P, Brennan A. Alcohol and cancer trends:
Intervention Studies. University of Sheffield and Cancer Research UK, 2016.
5. Buykx P LJ, Gavens L, Lovatt M, Gomes de Matos E, Holmes J, Hooper L & Meier P. An
investigation of public knowledge of the link between alcohol and cancer. University of
Sheffield and Cancer Research UK, 2015.
6. WHO. Global status report on alcohol and health. World Health Organization, 2014
9240692762.
7. Holmes J, Meng Y, Meier PS, Brennan A, Angus C, Campbell-Burton CA, et al. Effects of
minimum unit pricing for alcohol on different income and socioeconomic groups: a modelling
study. Lancet. 2014;383(9929):1655-64.
8. Babor TF, Caetano R, Casswell S, Edwards G, Giesbrecht N, Graham K, et al. Alcohol:
No ordinary commodity. Research and public policy. 2nd ed. Oxford: Oxford University Press;
2010 2010.
9. Health First: an evidence-based alcohol strategy for the UK. 2013.
10. Diepeveen S, Ling T, Suhrcke M, Roland M, Marteau T. Public acceptability of
government intervention to change health-related behaviours: a systematic review and
narrative synthesis. BMC Public Health. 2013;13(1):756.
11. Tobin C, Moodie AR, Livingstone C. A review of public opinion towards alcohol controls
in Australia. BMC Public Health. 2011;11(1):58.
12. Buykx P. GC, Ward B., Kippen R., Chapman K. . Public support for alcohol policies
associated with knowledge of cancer risk. International Journal of Drug Policy. 2014.
13. Gornall J. Under the influence. British Medical Journal. 2014;348(f7646).
14. NHS Health Scotland. Assessing the availability of and need for specialist alcohol
treatment services in Scotland Edinburgh: NHS Scotland; 2014. Available from:
http://news.scotland.gov.uk/News/Lower-drink-drive-limit-12f8.aspx.
15. HM Government. The Government's Alcohol Strategy. London: 2012 2012. Report No.:
Cm 8336.
16. Australian Institute of Health and Welfare. 2010 National Drug Strategy Household
Survey Report. 2011 PHE 145; 323pp.
17. Thomson LM, Vandenberg B, Fitzgerald JF. An exploratory study of drinkers views of
health information and warning labels on alcohol containers. Drug and Alcohol Review.
2012;31:240-7.
18. Pettigrew S, Jogenelis M, Chikritzhs T, Slevin T, Pratt IS, Glance D, et al. Developing
cancer warning statements for alcoholic beverages. BMC Public Health. 2014;14(786):1-10.
19. Bush K, Kivlahan D, McDonnell M, Fihn S, Bradley K. The AUDIT alcohol consumption
questions (AUDIT-C): An effective brief screening test for problem drinking. JAMA Internal
Medicine. 1998;158(16):1789-95.

32
20. Alcohol Learning Centre. Short AUDIT Questionnaire – AUDIT-C 2009 [05.10.15].
Available from:
http://www.alcohollearningcentre.org.uk/alcoholeLearning/learning/IBA/Module3_v3/D/ALC
_Session/256/tab_645.html.
21. Buykx P, Gilligan C, Ward B, Kippen R, Chapman K. Public support for alcohol policies
associated with knowledge of cancer risk. Int J Drug Policy. 2015;26(4):371-9.
22. Australian Institute of Health Welfare. 2010 National drug strategy household survey
report: Australian Institute of Health and Welfare; 2010.
23. Li J, Lovatt, M., Eadie, D., Dobbie, F. Petra, M., Holmes, J., Hastings, G., Anne Marie
MacKintosh. Public attitudes towards alcohol control policies in Scotland and England: Results
from a mixed-methods study. Under review.
24. Brose LS, Hitchman SC, Brown J, West R, McNeill A. Is the use of electronic cigarettes
while smoking associated with smoking cessation attempts, cessation and reduced cigarette
consumption? A survey with a 1-year follow-up. Addiction. 2015;110(7):1160-8.
25. Ipsos MORI. Alcohol: Public Knowledge, Attitudes and Behaviours. Dublin: Health
Research Board, 2012.
26. Office for National Statistics. Opinions Survey Report No. 42 Drinking: adults’
behaviour and knowledge in 2009. 2010.


