An Examination of Pennsylvania Rural County Jails
24
An Examination of Pennsylvania Rural County Jails
Transcript of An Examination of Pennsylvania Rural County Jails
An Examination ofPennsylvania Rural County Jails

This project was sponsored by a grant from the Center for Rural Pennsylvania, a legislative agency of the Pennsylvania General Assembly.
The Center for Rural Pennsylvania is a bipartisan, bicameral legislative agency that serves as a resource for rural policy within the Pennsylvania General Assembly. It was created in 1987 under Act 16, the Ru-ral Revitalization Act, to promote and sustain the vitality of Pennsylvania’s rural and small communities.
Information contained in this report does not necessarily reflect the views of individual board members or the Center for Rural Pennsylvania. For more information, contact the Center for Rural Pennsylvania, 625 Forster St., Room 902, Harrisburg, PA 17120, telephone (717) 787-9555, email: [email protected], www.rural.palegislature.us.
An Examination of Pennsylvania Rural County Jails
By:Gary Zajac, Ph.D. and Lindsay Kowalski, M.A.
Pennsylvania State University
December 2012
Executive Summary
Table of ContentsIntroduction .........................5 Goals and Objectives .........6Methodology .......................6 Results ...............................7Conclusions ......................19 Policy Considerations .......20References .......................21
This study examined the operation of Pennsylvania’s 44 rural county jails.
County jails, in general, face a unique set of challenges, including large numbers of inmates who spend a short time in custody, difficulty in classifying and assessing a short-term inmate population, providing treatment services to inmates who may be in custody for only a short period, and financial issues related to inmate medical costs and strained county budgets.
Pennsylvania county jails, in recent years, have begun to serve as a relief valve for the increasingly strained state prison system. Since 2009, the state system has transferred hundreds of inmates to county jails, as many of these jails have excess capacity.
This research examined trends in rural county jail populations and demographics, jail capacity, capital projects and development (under-taken and planned), budgets, and staffing from 2004 through 2011. This study also documented the types of treatment programs and services being offered at the jails and compared them to what is known about effective offender rehabilita-tion practices. It also explored fiscal and other challenges facing the 44 rural county jails.
The researchers used data collected by the Pennsylvania Department of Corrections (PADOC) as part of its annual obligatory inspections of county jails. The researchers also conducted a survey of county jail wardens/sheriffs to collect informa-tion on planned major capital proj-ects and financial challenges facing the jails.
The research found that the system-wide average annual total rural jail population (2004-2011) was 7,520 inmates per year, which is 22 percent of the total Pennsylvania county jail population in 2009 (that is all 63 county jails combined). The rural county jail population grew by 17 percent from 2004 to 2010.
There was significant variation in the size of rural county jail popula-tions, with the smallest rural jail housing 26 inmates per year, on aver-age, and the largest rural jail housing 421 inmates per year, on average. Thus, the largest rural jail housed more than 10 times the number of inmates as the smallest.
The rural jail population was over-whelmingly young, white, and male.
While some jails had an excess of inmates, on average, the rural county jail system was operating at 84 percent of capacity during the study period. By way of comparison, PADOC operated at 113 percent of capacity.
During the period of June 2009 through December 2010, PADOC transferred 1,507 state inmates to nine rural county jails through contractual agreements to relieve the burden on the state system.
The average cost-per-day, per-inmate in the rural county jail system was $60.41, and ranged from a low of $37.54 to a high of $127.71. By way of comparison, the average
cost-per-day, per-inmate in the state system was $88.23.
Nineteen of the 44 rural county jails (43 percent) reported having undertaken a major capital expan-sion or restoration project during the study period. However, 92 percent of responding jails reported having no new capital projects planned, in spite of 44 percent of responding jails re-porting a major capital project need.
All of the jails reported offering some sort of rehabilitative and re-lated programming during the study period, although two of the most common types of programming were educational/vocational and general psychological counseling, both of which are generally mandated under law or as part of accreditation stan-dards. Drug and alcohol program-ming was also universally offered, although the most common mode for the service was self-help groups, which are not found to be effective, according to the research literature.
There was less evidence of inten-sive programs that address key recid-ivism risk factors, such as programs addressing anti-social attitudes and decision-making skills. Only a minority of jails clearly offered such programs.
Rural county jails also offered a wide variety of programs for which the evidence of effectiveness is un-clear (such as general life skills pro-grams), or where the research clearly indicates no impact on recidivism (such as meditation and art therapy).
In sum, Pennsylvania’s rural coun-ty jails represent a potential source of bed space for the state prison system. While rehabilitative programs are of-fered, county jails could place more focus on programs that have been shown to be effective.
An Examination of Pennsylvania Rural County Jails 5
IntroductionCounty jails are becoming increasingly important to
Pennsylvania’s overall correctional system, in recent years housing inmates from the rapidly growing state prison system. However, data and information about county jails are incomplete and fragmented, and little formal research has been done on services provided by county jails, especially those in rural areas.
In Pennsylvania, as in most states, the 63 county jails operate under policies and procedures promulgated by county government. As of January 30, 2009, 44 rural Pennsylvania counties operated their own jails1, with a total population of 6,995 inmates, representing nearly 21 percent of the 33,580 total county jail inmates in Pennsylvania (PADOC, 2009).
In addition to county government, an overlay of state law and regulations also govern these jails’ reporting re-quirements (37 Pa. Code Ch 952), and the Pennsylvania Department of Corrections (PADOC) conducts inspec-tions of county jails and provides training to county jail staff3. However, Pennsylvania’s 63 county jails still represent separate correctional systems, which present a challenge to comprehensive jail development efforts.
County jails also face a unique set of challenges (Allen et al., 2007). Unlike state prisons, which typi-cally house only sentenced inmates, county jails are responsible for a complex mix of sentenced offenders, presentenced detainees, and others. Detainees can make up half of a jail’s population at any given time (Allen et al., 2007). Due to the large proportion of detainees, the population of county jails is often less predictable and more transient than that of state prisons, posing chal-lenges for proper inmate classification. Moreover, the typical sentenced county jail inmate serves a relatively short time (less than a year), making it difficult to deliver meaningful treatment and educational and other services (Allen et al., 2007). Further, it is often difficult to know what type of services to provide to the presen-tenced detainees, given that some may be released on bail at any moment, and it is difficult to mandate pro-gramming for those who have yet to be convicted since their status as “offenders” has not been established.
Pennsylvania county jail populations are typically smaller than state prison populations. This study found that the January 31, 2011 average in-house rural county jail population in Pennsylvania was 172 inmates. This
is roughly the norm of county jails nationwide, and is a fraction of the size of a typical state prison (Allen et al., 2007). For example, a typical state prison in Penn-sylvania houses between 1,000 and 2,000 inmates, with some prisons housing more than 3,000. Many indi-vidual cell blocks in Pennsylvania state prisons house more inmates than the average rural county jail. Thus, it is difficult for many county jails to support specialized staff positions and treatment services.
However, the populations and capacities of county jails vary. Urban jails, such as those in Allegheny and Philadelphia counties, are often in the same position as large state prison systems – too many inmates and too few beds. In rural jails, however, the opposite may be true. Bennett and Lattin (2009) found that rural jails na-tionwide may have excess bed capacity, which provides an opportunity to “sell” available bed space to other lo-cal jails or state correctional institutions. In Pennsylva-nia, PADOC has been able to use the excess capacity in rural county jails as a relief valve for the rapid growth in the state prison population, while also providing rev-enue to the counties that house state inmates (PADOC, 2008, 2010).
Act 81 of 2008 established new guidance on which sentenced offenders are committed to state prison versus county jails. Previously, the typical pattern was that offenders sentenced to 2 years or less would be committed to a county jail, those sentenced to 5 years or more would go to a state prison, and those with sentences between 2 and 5 years could go to either, a decision typically left to the discretion of the sentenc-ing judge. However, Act 81 requires that, as of No-vember 2011, offenders with sentences of 2 to 5 years be committed to state prison (with some exceptions). It is possible that Act 81 will result in more sentenced offenders being committed to an already stressed state system (Pew Center on the States, 2010). While it is unclear how many inmates might then potentially be housed back in county jails under the state-county transfer mechanism, the policy change reinforces the need for research on county jail populations, capacity, and services.
County jails are complex and under-researched components of the overall correctional system and are often challenging to study due to local control and frag-mented data systems (Allen et al., 2007). Pennsylvania is witnessing an increased use of excess county jail
1. According to the Pennsylvania Department of Corrections, the four rural counties that do not operate their own jails are Cameron, Forest, Fulton and Sullivan.2. For more information about reporting requirements, see http://www.pacode.com/secure/data/037/chapter95/chap95toc.html#95.242.3. For more information about the county jail inspection process, see http://www.portal.state.pa.us/portal/server.pt/community/hide_county_jails/11433.
6 The Center for Rural Pennsylvania
capacity to relieve pressure on the growing state prison population, thus making it important to examine county jail population trends, operations, cost structures, and services.
This project, conducted in 2011, examined Pennsyl-vania’s rural county jails, including population trends and infrastructure, using data from an 8-year study pe-riod, primarily defined as January 2004 through Janu-ary 2011 (as data permitted).
There were two primary research goals. The first was to measure population trends for Pennsylvania’s 44 rural county jails over the study period to: determine the annual population for each rural county jail for each year during the study period; examine how the rural county jail population compares to jail capacity, and how this has changed during the study period; deter-mine the demographic breakdown of the rural county jail population (gender, race, age), including how it has changed; and examine the extent to which rural county jails have been housing offenders from other jurisdic-tions (state, federal, and other counties).
The second goal was to examine jail infrastructure, including physical plant, finances, staffing, and pro-grams, over the study period to: determine the major capital projects4 undertaken at each rural county jail during the study period; identify planned major capital projects at each rural county jail; examine each rural county jail’s perceived major capital project needs; determine the current operating budget for each rural county jail, including how it has changed and how per inmate costs compare to the state prison system; exam-ine each rural county jail’s perceived major financial challenges over the next 5 years; determine the current staffing level (including staffing ratios) for each rural county jail, using the staff categories of corrections of-ficers, treatment staff, jail administration/management, support staff, and other5; and identify treatment/reha-bilitative services/programs (drug treatment, GED, etc.) offered at each rural county jail.
Finally, the researchers offered policy considerations.
This research used the Center for Rural Pennsylva-nia’s definitions of rural and urban counties, which identify 48 of Pennsylvania’s 67 counties as rural6.
The research used existing administrative data and collected original data through a survey to compile a dataset on Pennsylvania’s rural county jails. As pre-viously stated, most states’ county jails are county controlled agencies with data systems that tend to be fragmented and incomplete7. Moreover, there is no comprehensive, national or state-level data source on county jail populations. Several existing administra-tive data sources within Pennsylvania, such as Justice Network (JNET) and PADOC Legacy Data, were either accessible only to law enforcement (JNET8) or too frag-mented to be used (PADOC Legacy Data9). Therefore, the research used data from PADOC’s Office of County Inspection Services (OCIS), the U.S. Department of Justice’s Bureau of Justice Statistics (BJS), and an original, follow-up survey of rural county jails. Table 1 identifies specific data sources for each research question.
PADOC OCIS DataThe PADOC operates the Office of County Inspec-
tion and Services (OCIS), which, among other tasks, conducts an annual survey and physical inspection of county jails. Information collected in this process pertains to summary population data, as well as basic information on staffing, budgets, and related matters10. PADOC OCIS offered three relevant data sources: the General Information Form (GIF); the Supplemental Information Form (SIF); and in-house electronic data files.
The GIF is a paper survey mailed to each jail an-nually, with a relatively high response rate from rural county jails (95-100 percent for 2006-2011). Unfortu-nately, PADOC’s retention of GIFs was limited to 2006 through 2011. Additionally, the GIF contains some questions related to a “snapshot date” in the year coin-cident with when the form is received (e.g., population on January 31, 2011), while other items ask for data
Goals and Objectives
4. For the research, “major capital projects” were considered to be more extensive building or renovation projects, which may include building a new jail, adding a new building within a jail, or other related types of construction activities. They would not include minor repairs or small expansions of an existing unit. 5. The staffing categories were based on those derived by Young et al. (2009). 6. The Center for Rural Pennsylvania defines a county as rural when the number of persons per square mile within the county is less than 284. Counties that have 284 persons or more per square mile are considered urban.7. County jails are run by the state DOC in the following six states: Alaska, Connecticut, Delaware, Hawaii, Rhode Island and Vermont. In all other states, county jails are locally controlled.8. For more information on JNET reporting see http://www.portal.state.pa.us/portal/server.pt?open=512&objID=14682&mode=2&PageID=599922.9. PADOC Legacy Data refer to data the county jails are supposed to report on a daily and monthly basis to the PADOC pursuant to 37 Pa. Code Ch 95. The data, however, have been inconsistently reported by counties over the years. The study could not use the data because some data were missing. 10. For more information on the OCIS see http://www.portal.state.pa.us/portal/server.pt/community/hide_county_jails/11433.
Methodology
An Examination of Pennsylvania Rural County Jails 7
from the previous year (e.g., total annual admissions 2010). Thus, a missing GIF would impact data collec-tion for both the given year and the previous year.
PADOC OCIS also provided the two relevant SIF sections, related to staffing and services/programs. The SIF is a longer inspection form that an OCIS inspec-tor completes during the inspection process. While the PADOC maintained SIF records for 2004-2010, the SIF is only conducted (and available) for a county if the county was not 100 percent compliant with OCIS regu-lations in the previous year. Therefore, if a county was compliant in one year, the SIF for the following year would be unavailable. In no year were there SIF data missing for more than 19 counties (43 percent).
Finally, the PADOC provided its in-house 2004-2011 electronic data files, which augment data available in the GIF. These electronic files were used to run quality assurance checks and fill data gaps where possible.
BJS DataBJS conducts an Annual Survey of Jails, and a Na-
tional Jail Census, and from this data, produces vari-ous reports11. These datasets are accessible through the National Archive of Criminal Justice Data12. The An-nual Survey of Jails was available for a good portion of the relevant study period (2001-2004 and 2006-2009). One limitation of this source, however, is that it uses a representative sample, and does not capture every jail. Therefore, only 15 Pennsylvania rural county jails, or 34 percent, were included each year. The National Jail Census is more comprehensive, reaching all relevant jails, but was only available for 2005. Moreover, both
of these national data collection efforts are dependent upon the willingness of each county jail to respond. Data from these sources were used to run quality assur-ance checks and to fill in data gaps wherever possible.
Primary Survey DataThe researchers conducted a mail survey to cap-
ture supplementary or missing information related to approved/planned capital projects, perceived capital project needs, and perceived financial challenges. The survey also requested respondents to include GIFs that were missing or other documents/records with similar data. This item was unique to jails, based upon which GIFs were missing for that jail13.
The survey was mailed to the 44 wardens/sheriffs14 of each rural county jail. The final response rate was 82 percent (36 jails). There was no pattern to the non-re-spondents in terms of geography or jail characteristics, so the non-responses appeared random. From a meth-odological point of view, random non-response is much less problematic than systematic non-response.
Codebook and DatabaseThe researchers created a codebook and database to
manage and analyze the data. The database included all relevant research items: inmate population and demographic trends, infrastructure and financial issues, staffing and programming statistics. The original study period was to cover a 10-year span of January 2001 through December 2010. However, a combination of data limitations and the availability of some data for 2011 resulted in adjusting the study period. Generally, however, the study period was limited to January 2004 through January 2011.
In general, the results are presented according to overall rural jail system findings, such as for all 44 rural county jails combined and denoted as “system-wide” or “overall,” and average rural county jail findings, denoted as “per jail.” This allows for an understanding of the rural county jail system as a whole, while also creating a profile of a typical rural county jail. As noted in the findings that follow, there is substantial variation
Table 1: Data Sources for Each Research Question
11. For more information on these reports visit http://bjs.ojp.usdoj.gov/index.cfm?ty=tp&tid=1.12. For more information on the NACJD visit http://www.icpsr.umich.edu/NACJD/.13. GIFs were missing for every jail for 2002-2005. GIFs were also missing from Franklin County for 2006 and 2008; Lawrence County for 2009; Montour County for 2010; and Schuylkill County for 2009. GIFs for 2001 were not requested as the 2011 GIFs were available, thus providing the sought-after 10-year study period.14. In most states, jails are run by the sheriff’s office. Pennsylvania jails, however, are typically run by wardens, who are not associated with the sheriff’s office, except for McKean and Potter county jails, which are run by the dually titled warden/sheriff.
Results
8 The Center for Rural Pennsylvania
among county jails, as some house only a few dozen inmates while others house hundreds. Thus, the portrait of a “typical” rural county jail should be understood in light of these variations.
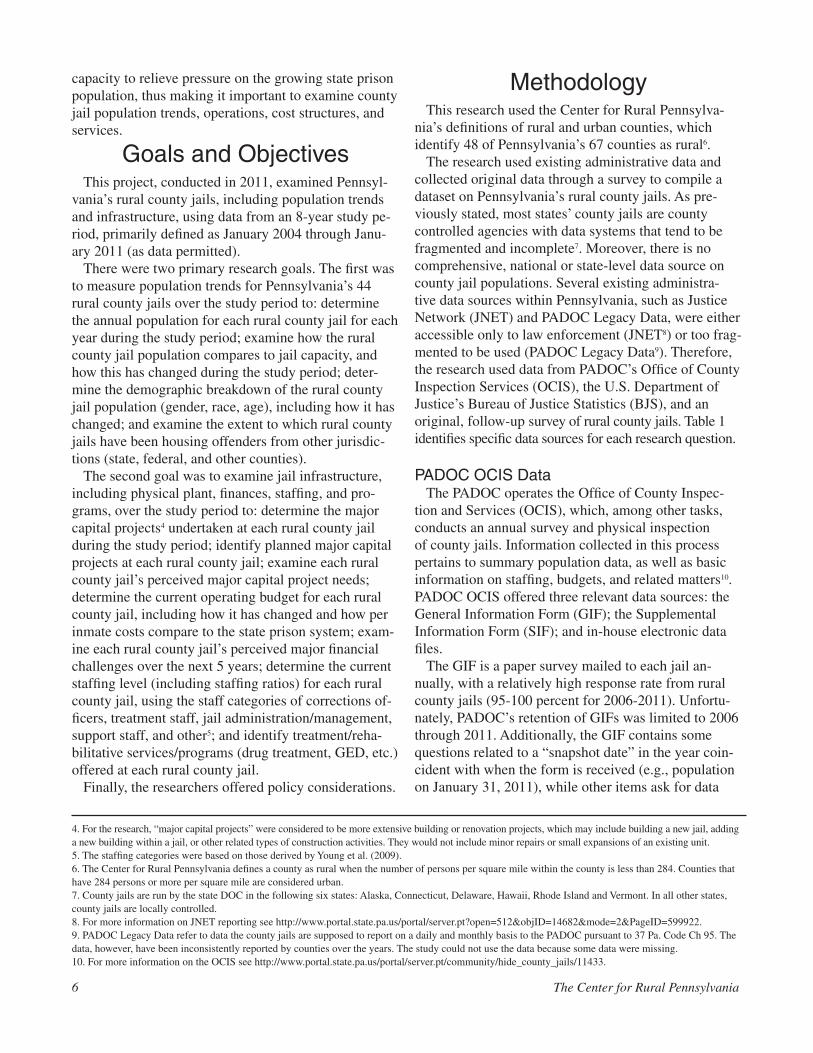
Jail Population The system-wide average annual total rural jail popu-
lation (2004-2011) was 7,520 inmates per year (See Figure 1). This average annual total was 22 percent of the total population for all 63 county jails combined in 2009 (PADOC, 2009). There were a minimum of 6,891 total rural jail inmates in 2004, and a maximum of 8,074 total inmates in 2010. Thus, the rural county jail system grew by 17 percent over the survey period.
The average annual total popula-tion per jail was 171 inmates per year (2004-2010), with a minimum aver-age of 34 inmates per year in Montour County, and a maximum average of 425 inmates per year in Cambria County. Thus, as noted above, there is significant variation in the size of rural county jails, with the largest rural jail being more than 10 times the total size of the smallest.
System-wide, Pennsylvania’s rural county jails averaged 7,105 total in-house inmates15 per year (2004-2011), which is less than one-tenth of 1 percent of Pennsylvania’s average population during the period. Of this
in-house population, there were an average of 3,536 presentenced detainees per year, and an average of 3,739 sentenced inmates per year (2006-2011). In other words, approximately one-half of the overall in-house population was comprised of presentenced detainees.
The average in-house population per jail was 162 inmates per year (2004-2011), with a minimum average of 26 inmates per year in Montour County, and a maximum average of 421 inmates per year in Cambria County. As with the overall proportions, the presentenced detainees represented approximately half of the in-house population. There were an aver-
age of 80 in-house presentenced detainees per jail each year and an average of 85 sentenced inmates per jail each year (2006-2011)16.
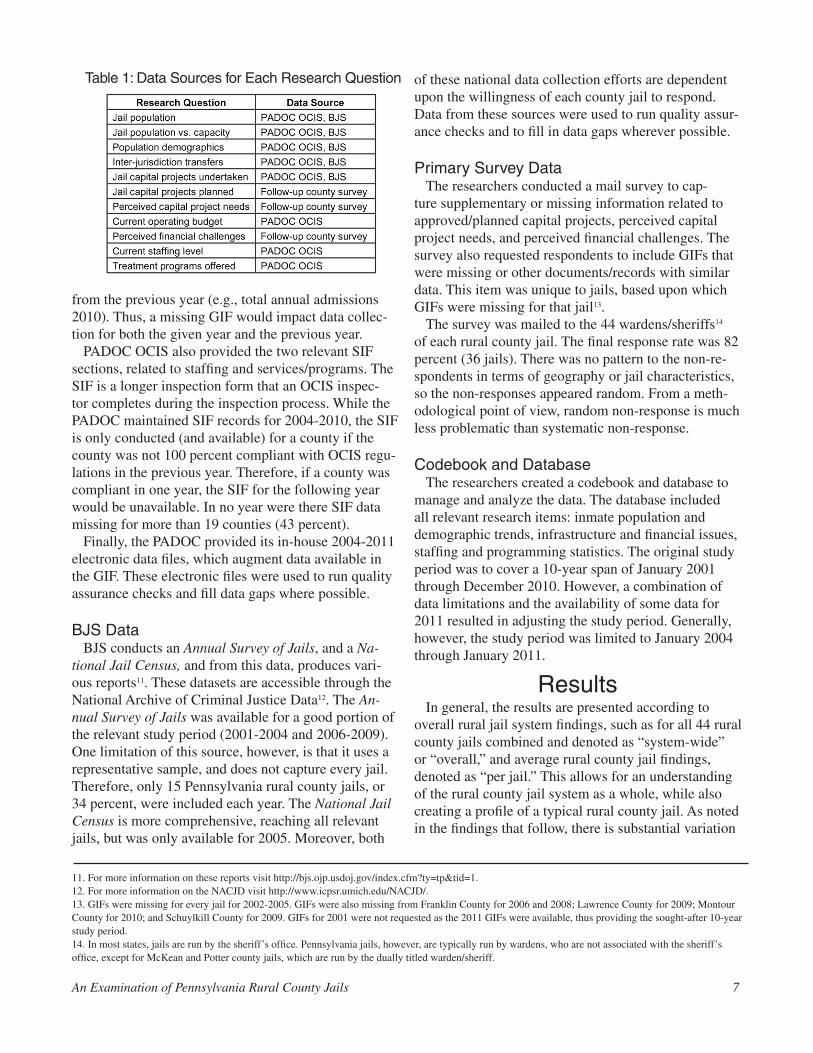
System-wide, Pennsylvania’s rural county jails housed an average of 379 inmates elsewhere per year (2006-2011) (See Table 2). As discussed later in the results, Pennsylvania’s rural county jails received an av-erage of 781 inmates per year (2005-2011) from other jurisdictions (state, federal, other county, etc.). The ru-
Figure 1: Overall Annual Rural Jail Inmate Population (2004-2011)
Source: PADOC, BJS
15. The research defined “in-house inmates” are those who are presently housed in the jail, since at any given time, some inmates may be out of the jail for various reasons, such as on work release or housed in another facility.16. Jails reported total population and in-house population counts for a “snapshot date” (the last business day in January for that year) and calculations are based on these snapshot figures.
Table 2: Average Number of Inmates Housed Elsewhere,by County Jail (2006-2011)
Note: Underline denotes the top five counties in terms of number of inmates housed elsewhere. Source: PADOC.
An Examination of Pennsylvania Rural County Jails 9
ral county jail system, then, receives almost double the number of inmates from other jurisdictions as it houses elsewhere.
Of the 11 jails that had averages greater than the system-wide average for housing inmates elsewhere, 10 were actually below capacity during the study period. This finding is partly explained by the fact that most jails are under capacity.
As may be expected, most of the jails that had high averages for inmates housed elsewhere (seven jails, 64 percent) also had high average costs-per-day, per-inmate. There was no discernible pattern between the age of the institution and whether it was likely to house inmates elsewhere. Thus, costs-per-day may play an im-portant role in how jails shift inmates to other counties.
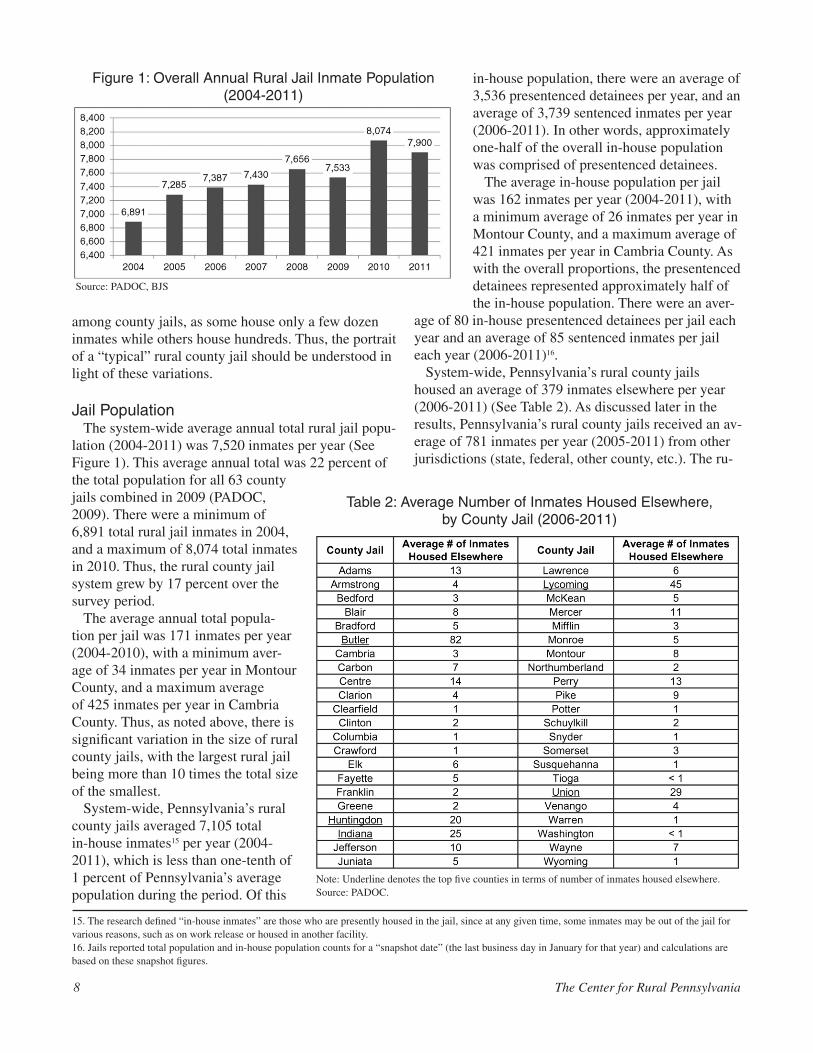
System-wide, the average total admissions for rural jails were 55,979 per year, and average total discharges were 55,563 per year (2005-2010) (See Figure 2). The admission and discharge statistics are indicative of a correctional system characterized by a large and rapid turnover of its inmate population. As discussed earlier, this is not unusual for county jails. By comparison, the state prison system admitted an average of 16,331 inmates and discharged an average of 16,026 inmates during 2005-2009 (PADOC, 2011a).
There was an average of 1,272 admissions and 1,264 discharges per jail during the study period (2005-2010).
Jail Population versus CapacityCapacity refers to the number of avail-
able beds. Percentage of capacity may be calculated as the proportion of available bed space comprised by the in-house inmate population. Where there are more inmates than available beds, a jail is said to be “over capacity.” Despite an increasing overall total population, the capacity of Pennsylvania’s rural jail system has also increased (and, thus, percentage of capacity has decreased). Overall, the rural county jail system averaged 84 percent capacity per year (2005-2010), with a minimum of 78 percent capacity in 2010, and a maximum of 86 percent capac-ity in 2005 and 2006 (See Figure 3). By comparison, the state system operated at 113 percent average capacity during the 2005-2009 time period (PADOC, 2011a).
On average, only three county jails (7 percent) were over capacity during the study period (2005-2010). Of the 41 jails that were below capacity, 25 (61 percent) had low average costs-per-day, per-inmate (defined
as having averages less than the system-wide aver-age) during the study period. There was no discernible pattern between the age of the facility and its capac-ity. Once again, since the vast majority of jails were under capacity (i.e. there is a very small sample of over capacity jails), it is difficult to conduct meaningful analyses of the differences between over- and under-capacity jails.
Per jail, capacity ranged widely, from a minimum of 22 percent average annual capacity in Potter County to a maximum of 121 percent annual average capacity in Indiana County (See Table 3 on Page 10). As previ-ously mentioned, this sort of variation exemplifies the perspective that simply reporting system-wide figures masks important differences between each jail. To ad-dress the question of how jails handle excess capacity, the rated capacity of a correctional institution can be calculated in various ways (Bennett and Lattin, 2009). In general, though, common variables used in most capacity calculations include the number of physically present beds, the size of the cells, the age of the facil-ity, available staff, and programming and other services available. Capacity, then, is more than just the number of beds available. Capacity represents the “ideal” num-ber of inmates that can be managed in a given facility, although in reality, additional inmates can be added by placing additional beds into larger cells or by convert-ing common areas of the jail, such as gyms, auditori-
Figure 2: Overall Rural County Jail Admissionsand Discharges (2005-2010)
Source: PADOC, BJS.
Source: PADOC, BJS.
Figure 3: Overall Rural County JailPercentage of Capacity (2005-2010)

10 The Center for Rural Pennsylvania
ums and even conference rooms, to sleeping areas. Ca-pacity can also be a fluid construct, especially in county jails, which, as noted earlier, can fluctuate in population from day to day. Thus, if there is a spate of arrests on a given day, a jail that is normally under capacity may become temporarily over capacity. Ideally, jails want to be at or near their rated capacity (Bennett and Lat-tin, 2009). A jail severely over capacity runs the risk of inmate disturbances, staff injuries, and even inmate litigation due to poor living conditions. Conversely, a jail that is consistently and significantly under capacity may represent a waste of resources. As shown in Table 3, two of the three over-capacity rural jails (McKean and Schuylkill) are only slightly over their rated capac-ity, with the third (Indiana) being the highest, at 121 percent. Many of the jails under capacity were near the 90 percent range, which does allow for the temporary population spikes that are characteristic of county jails.
Population DemographicsMales represented an average of 88 percent of total
rural county jail inmates per year, and females repre-sented 12 percent of overall inmates per year (2004-2011). System-wide, there were average totals of 6,231
male inmates per year and 889 female inmates per year (2004-2011).
Per jail, there were averages of 142 males and 20 females per year during the study period (2004-2011). This gender breakdown is typical of correctional sys-tems in general, with males constituting the larger share of the inmate population.
During the study period (2004-2011), on average, white inmates represented about 77 percent of all rural county jail inmates per year (See Table 4). It is more difficult to establish whether the racial/ethnic breakdown is typical of correctional systems in general, as the racial composition of a county correctional institution is highly dependent on the racial demographics of the local com-munity. It is not surprising, though, to find a large white population housed in these rural county jails.
Inmates younger than 30 years old represented half of the average total rural county jail inmate population during the study period (2004-2011)17. The system-wide annual averages, and respective percentages, for each age category are presented in Table 5. There is a very small number of inmates under the age of 18. The federal Juvenile Justice and Delinquency Prevention Act (JJDPA) generally requires that juveniles not be held in secure facilities with adults, but in cases where temporary housing may occur, the juveniles are held so as to ensure “sight and sound” separation between adult and juvenile offenders; in other words, there can be no mixing of the two populations. Each state is required to monitor compliance with the JJDPA. In Pennsylvania, the Pennsylvania Commission on Crime and Delin-quency maintains the Secure Detention Monitoring Project to audit and enforce compliance with this act18. In practice, juveniles may periodically end up being detained in county jails (or police lock-ups) until their identities and ages are determined, at which point other housing arrangements are made, such as transfer to a juvenile facility or release to parents. Thus, a small number of inmates under the age of 18 will invariably show up in county jail data sets.
Large propor-tions of the inmate population are in
17. Data were missing for 2005; analyses were based on data from 2004 and 2006-2011.18. For more information about PCCD’s compliance monitoring efforts visit http://www.portal.state.pa.us/portal/server.pt?open=512&objID=5411&&PageID=495426&level=3&css=L3&mode=2.
Table 3: Average Percentage of Capacity,by County Jail (2005-2010)
Note: Underline denotes jails that were over capacity, on average. Source: PADOC, BJS.
Table 4: Average Annual Rural County Jail Population, by
Race/Ethnicity (2004-2011)
*Total greater than 100 percent due to rounding. Source: PADOC, BJS.
An Examination of Pennsylvania Rural County Jails 11
their 20s and 30s, which is typical of correctional systems in general. As with gender, this reflects deeper age-graded patterns of criminal of-fending, which are largely invariant nationally; younger people are more criminally active than older people, which has been well-established in the criminal justice research for decades (Blumstein et al., 1986).
Inter-jurisdiction TransfersSystem-wide, rural county jails
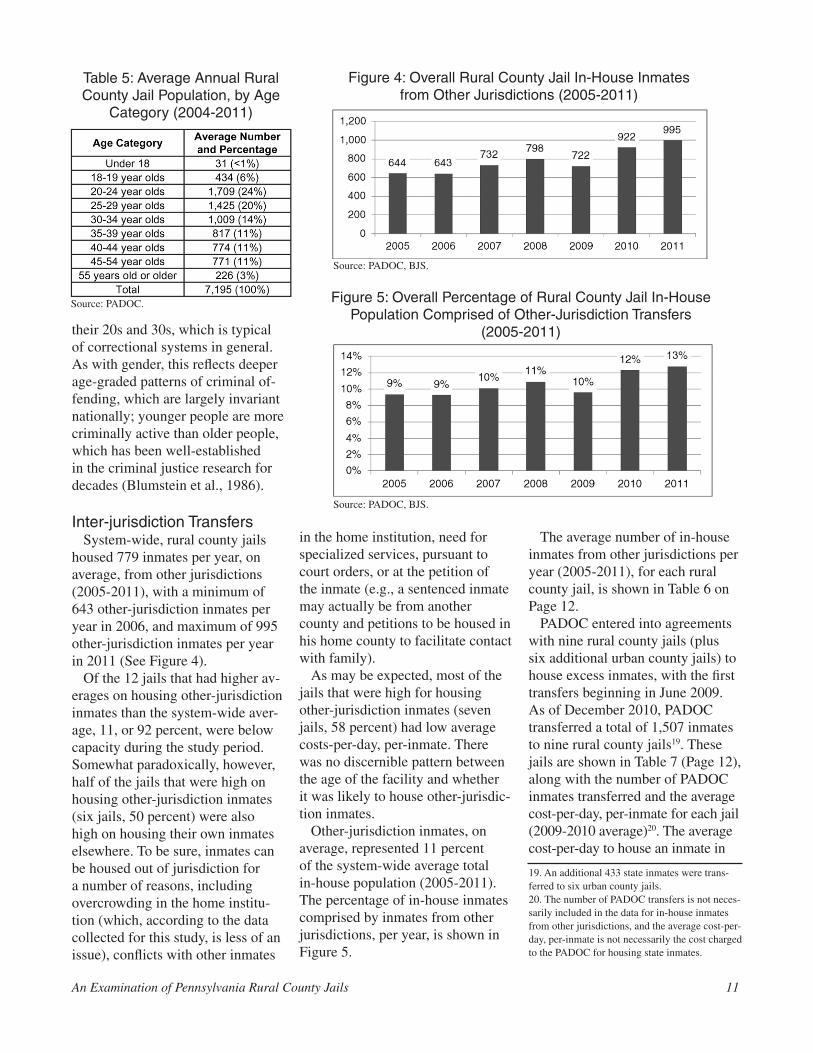
housed 779 inmates per year, on average, from other jurisdictions (2005-2011), with a minimum of 643 other-jurisdiction inmates per year in 2006, and maximum of 995 other-jurisdiction inmates per year in 2011 (See Figure 4).
Of the 12 jails that had higher av-erages on housing other-jurisdiction inmates than the system-wide aver-age, 11, or 92 percent, were below capacity during the study period. Somewhat paradoxically, however, half of the jails that were high on housing other-jurisdiction inmates (six jails, 50 percent) were also high on housing their own inmates elsewhere. To be sure, inmates can be housed out of jurisdiction for a number of reasons, including overcrowding in the home institu-tion (which, according to the data collected for this study, is less of an issue), conflicts with other inmates
in the home institution, need for specialized services, pursuant to court orders, or at the petition of the inmate (e.g., a sentenced inmate may actually be from another county and petitions to be housed in his home county to facilitate contact with family).
As may be expected, most of the jails that were high for housing other-jurisdiction inmates (seven jails, 58 percent) had low average costs-per-day, per-inmate. There was no discernible pattern between the age of the facility and whether it was likely to house other-jurisdic-tion inmates.
Other-jurisdiction inmates, on average, represented 11 percent of the system-wide average total in-house population (2005-2011). The percentage of in-house inmates comprised by inmates from other jurisdictions, per year, is shown in Figure 5.
The average number of in-house inmates from other jurisdictions per year (2005-2011), for each rural county jail, is shown in Table 6 on Page 12.
PADOC entered into agreements with nine rural county jails (plus six additional urban county jails) to house excess inmates, with the first transfers beginning in June 2009. As of December 2010, PADOC transferred a total of 1,507 inmates to nine rural county jails19. These jails are shown in Table 7 (Page 12), along with the number of PADOC inmates transferred and the average cost-per-day, per-inmate for each jail (2009-2010 average)20. The average cost-per-day to house an inmate in
Table 5: Average Annual Rural County Jail Population, by Age
Category (2004-2011)
Source: PADOC.
Figure 4: Overall Rural County Jail In-House Inmatesfrom Other Jurisdictions (2005-2011)
Source: PADOC, BJS.
Figure 5: Overall Percentage of Rural County Jail In-House Population Comprised of Other-Jurisdiction Transfers
(2005-2011)
Source: PADOC, BJS.
19. An additional 433 state inmates were trans-ferred to six urban county jails.20. The number of PADOC transfers is not neces-sarily included in the data for in-house inmates from other jurisdictions, and the average cost-per-day, per-inmate is not necessarily the cost charged to the PADOC for housing state inmates.

12 The Center for Rural Pennsylvania
PADOC was $89.82 in fiscal year 2009-2010 (PADOC, 2011b).
Major Capital Projects UndertakenNineteen jails (43 percent of all rural county jails)
self-reported and described 26 major capital projects undertaken during the study period, including eight new facility constructions and 18 expansions, renovations, or additions (2001-2010).
Of the 19 jails with major capital projects during the study period, 11 (58 percent) were high population
jails, defined as having averages greater than the system-wide average. Most of them (18 jails, 95 percent), however, were below capac-ity. Again, since the majority of jails were under capacity, it is difficult to explore differ-ences between over- and under-capacity jails that undertook major capital projects.
Most of the jails that had major capital projects were not heavily involved in inmate transfers; they were low on both housing their own inmates elsewhere (12 jails, 63 percent), and housing other-jurisdiction inmates (13 jails, 68 percent).
There was no discernible pattern between the age of the facility and major capital proj-ects undertaken.
Planned Capital ProjectsRural county jail wardens were asked to
describe current, approved plans to renovate, expand, or conduct any other major capital projects. Four jails described major capital projects underway or planned, including roof renovation, completion of a geothermal proj-ect, construction of a new work release center,
and expansion of the current intake/booking area. The majority of the 36 survey respondents (33 jails, 92 per-cent) reported no capital projects planned or underway.
Of the four jails with capital projects planned, three were low (defined as having averages below the sys-tem-wide mean) in terms of population (2004-2010), capacity (2005-2010), and housing inmates elsewhere (2006-2011). Two were high for housing other-jurisdic-tion inmates (2005-2011), and three had high average costs-per-day, per-inmate (2004-2010).
Perceived Major Capital Project NeedsRural county jail wardens were asked to describe any
unmet major renovation, expansion, or other project needs. Sixteen wardens (44 percent of the 36 respon-
Table 6: Average Number of In-House Inmates fromOther-Jurisdictions, by County Jail (2005-2011)
Note: Underline denotes the top five counties in terms of the number of other-jurisdic-tion inmates. Source: PADOC, BJS.
Table 7: Total Number of PADOC Inmate Transfers and Average Cost-per-Day, per-Inmate, by
Receiving County (2009-2010)
*Average Cost-Per-Day, Per-Inmate for Lawrence County is from 2007 only (the most recent figure available). Source: PADOC.
Table 8: Number of Respondents Reporting a Major Capital Project Need, by Project Category
Source: Survey (36 respondents).

An Examination of Pennsylvania Rural County Jails 13
dents) self-reported major capital project needs. They are listed by type and number of respondents (note that respondents could select more than one major capital project need) in Table 8.
Many of the comments surrounding the self-identified need for a new or expanded facility related to issues with overcrowding and/or outdated and antiquated fa-cilities. Three respondents noted a need for a new space to house inmates needing special programs or services (e.g., work release, females, restricted housing, men-tally ill). One respondent who cited a need for a new facility specifically said the jail could capitalize on the deficit capacity that would result from such construc-tion by selling excess space to other overcrowded cor-rectional facilities. Other miscellaneous project needs included inmate shower upgrades, new roof, additional recreation yard, and fire damage reparation. The major-ity of the 36 respondents (55 percent) reported no major capital project needs.
Of the 10 jails reporting a major capital project need, most (six jails) were low population jails (2004-2010) (defined as having averages below the system-wide mean). Eight were low on housing their own inmates elsewhere (2006-2011), and all were also low on hous-ing other-jurisdiction inmates (2005-2011).
Likewise, most of the respondents without a ma-
jor capital need were low on both housing their own inmates elsewhere (17 jails) and housing other-jurisdiction inmates (16 jails).
Six of the 10 jails with a major capital project need had high av-erage costs-per-day, per-inmate; and 17 of those without a need had low average costs-per-day, per-inmate. Thus, reporting a need for a major capital project may reflect a desire to reduce the cost-per-day, per-inmate by con-structing more modern and cost efficient facilities.
There also was no discernible pattern between the current age of the facility and major capital project needs.
Current Operating BudgetSystem-wide, the average
total approved budget for the 44 rural county jails combined
was $155,887,586 per year (2005-2011), ranging from a minimum total approved budget of $137,785,816 in 2006, to a maximum total approved budget of $192,428,403 in 201121. The system-wide average total budget spent was $142,554,391 per year (2004-2010), with a minimum total budget spent of $124,531,840 in 2005, and maximum total budget spent of $168,749,381 in 2010. As may be expected, all high-budget jails (16 jails), defined as having averages greater than the system-wide average, were also high-population jails, and most low-budget jails (27 jails) were low-popula-tion jails.
The average annual approved budget per jail was $3,669,166, with a minimum average approved budget of $747,302 per year, and a maximum average ap-proved budget of $9,785,244 per year (2005-2011). The average annual budget spent per jail was $3,400,034, with a minimum average budget spent of $768,338 per year, and a maximum average budget spent of $8,952,459 per year during the study period (2004-2010). These data are provided for each rural county jail in Table 9.
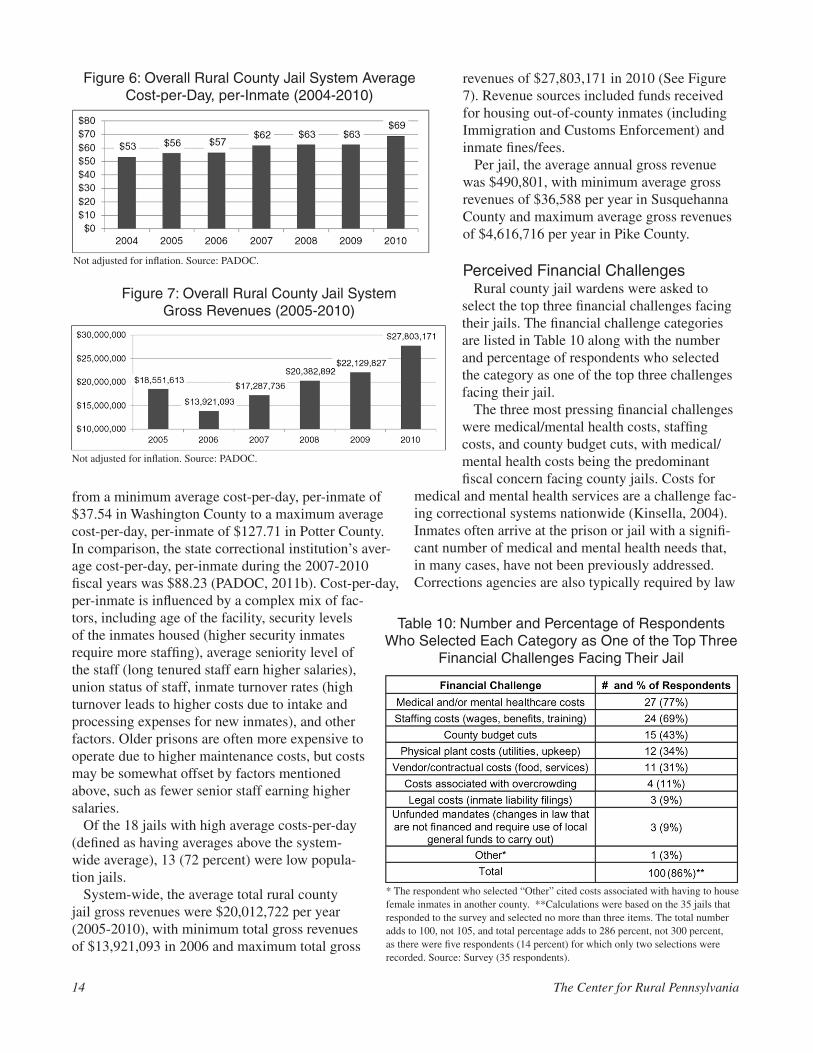
The system-wide average cost-per-day, per-inmate was $60.41 during the study period (2004-2010) (See Figure 6 on Page 14). Each county jail’s costs ranged
21. Throughout the report, financial figures were not adjusted for inflation.
Table 9: Average Annual Approved Budget (2005-2011) andAverage Annual Budget Spent (2005-2010), by County Jail
*Based on 2 years of available data. + Based on 3 years of available data. Not adjusted for inflation. Source: PADOC.
14 The Center for Rural Pennsylvania
from a minimum average cost-per-day, per-inmate of $37.54 in Washington County to a maximum average cost-per-day, per-inmate of $127.71 in Potter County. In comparison, the state correctional institution’s aver-age cost-per-day, per-inmate during the 2007-2010 fiscal years was $88.23 (PADOC, 2011b). Cost-per-day, per-inmate is influenced by a complex mix of fac-tors, including age of the facility, security levels of the inmates housed (higher security inmates require more staffing), average seniority level of the staff (long tenured staff earn higher salaries), union status of staff, inmate turnover rates (high turnover leads to higher costs due to intake and processing expenses for new inmates), and other factors. Older prisons are often more expensive to operate due to higher maintenance costs, but costs may be somewhat offset by factors mentioned above, such as fewer senior staff earning higher salaries.
Of the 18 jails with high average costs-per-day (defined as having averages above the system-wide average), 13 (72 percent) were low popula-tion jails.
System-wide, the average total rural county jail gross revenues were $20,012,722 per year (2005-2010), with minimum total gross revenues of $13,921,093 in 2006 and maximum total gross
revenues of $27,803,171 in 2010 (See Figure 7). Revenue sources included funds received for housing out-of-county inmates (including Immigration and Customs Enforcement) and inmate fines/fees.
Per jail, the average annual gross revenue was $490,801, with minimum average gross revenues of $36,588 per year in Susquehanna County and maximum average gross revenues of $4,616,716 per year in Pike County.
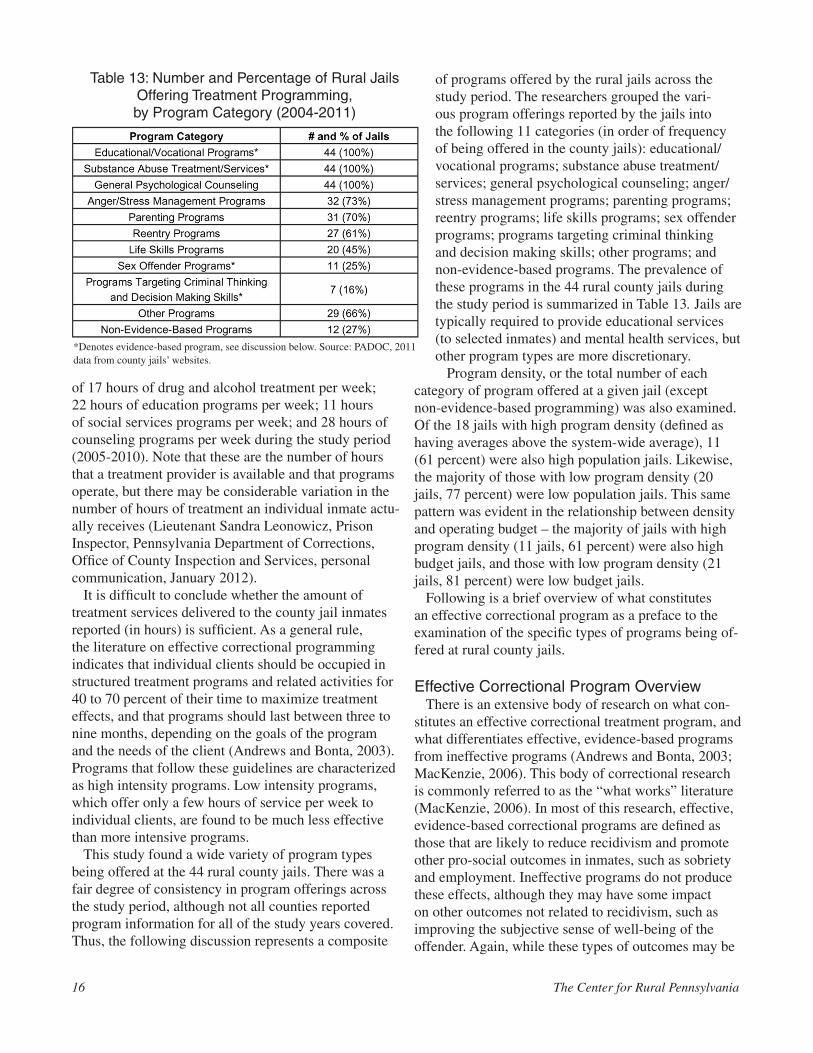
Perceived Financial ChallengesRural county jail wardens were asked to
select the top three financial challenges facing their jails. The financial challenge categories are listed in Table 10 along with the number and percentage of respondents who selected the category as one of the top three challenges facing their jail.
The three most pressing financial challenges were medical/mental health costs, staffing costs, and county budget cuts, with medical/mental health costs being the predominant fiscal concern facing county jails. Costs for
medical and mental health services are a challenge fac-ing correctional systems nationwide (Kinsella, 2004). Inmates often arrive at the prison or jail with a signifi-cant number of medical and mental health needs that, in many cases, have not been previously addressed. Corrections agencies are also typically required by law
Figure 6: Overall Rural County Jail System Average Cost-per-Day, per-Inmate (2004-2010)
Not adjusted for inflation. Source: PADOC.
Figure 7: Overall Rural County Jail SystemGross Revenues (2005-2010)
Not adjusted for inflation. Source: PADOC.
Table 10: Number and Percentage of Respondents Who Selected Each Category as One of the Top Three
Financial Challenges Facing Their Jail
* The respondent who selected “Other” cited costs associated with having to house female inmates in another county. **Calculations were based on the 35 jails that responded to the survey and selected no more than three items. The total number adds to 100, not 105, and total percentage adds to 286 percent, not 300 percent, as there were five respondents (14 percent) for which only two selections were recorded. Source: Survey (35 respondents).

An Examination of Pennsylvania Rural County Jails 15
to provide basic levels of health care to their inmates (Allen et al., 2007). Thus, given the high demand and service mandate, it is not surprising that medical/mental health costs represent a significant financial challenge for the jails in this study.
Current Staffing LevelsThe following staff categories were used for the
research: corrections officers, treatment staff, jail administration/management, support staff, and other. These staffing categories were based on those derived by Young et al. (2009). However, since rural jails used a variety of different staffing categories, the researchers assigned staff to the most com-parable prescribed category.
Table 11 shows the system-wide average total number of staff per year within each staff-ing category during the study period (2005-2011).
As is common to correc-tional systems nationwide, security staff personnel in the rural county jails comprise the bulk of personnel. During the study period (2005-2010), the system-wide average security staff-to-inmate ratio each year was one officer for every 3.2 inmates, and the average total staff-to-inmate ratio was one staff member for every 2.4 inmates22. Each jail’s security staff-to-inmate ratio ranged from a minimum average of one officer for every six
inmates in Schuylkill County to a maximum average of one officer for every one inmate in Potter County. Each jail’s total staff-to-inmate ratio ranged from a minimum average of one staff member for every 4.5 inmates in Schuylkill County to a maximum of one staff member for every 0.6 inmates in Potter County23. Staffing data are shown for each rural county jail in Table 12.
Treatment/Rehabilitative Services/Programs This study collected data on both the level of treat-
ment services being offered, such as hours of service per week, as well as the specific types of programs and services being delivered. The OCIS dataset collected from the PADOC listed specific programs offered at each jail, showing specific program names or at least program types (i.e., drug treatment). While information was not available on important program characteris-tics, such as the qualifications of staff delivering the programs or the number of inmates in each treatment group, the OCIS program dataset did allow for broad benchmarking of these programs against what is known in the research literature about evidence-based correc-tional programs.
System-wide, rural county jails offered an average
Table 11: Average Number of Rural County Jail System Staff, by Staffing Category
(2005-2011)
Source: PADOC.
22. Calculations are based on the average daily in-house inmate population.23. Ratios are provided for informational purposes only. Comparison between institutions based on relative staffing ratios is regarded as an inaccurate prac-tice due to the complexities involved in staffing decisions and jail characteristics (Liebert and Miller, 2003).
Source: PADOC, BJS
Table 12: Average Security Staff-to-Inmate Ratio andTotal Staff-to-Inmate Ratio, by County Jail (2005-2010)
16 The Center for Rural Pennsylvania
of 17 hours of drug and alcohol treatment per week; 22 hours of education programs per week; 11 hours of social services programs per week; and 28 hours of counseling programs per week during the study period (2005-2010). Note that these are the number of hours that a treatment provider is available and that programs operate, but there may be considerable variation in the number of hours of treatment an individual inmate actu-ally receives (Lieutenant Sandra Leonowicz, Prison Inspector, Pennsylvania Department of Corrections, Office of County Inspection and Services, personal communication, January 2012).
It is difficult to conclude whether the amount of treatment services delivered to the county jail inmates reported (in hours) is sufficient. As a general rule, the literature on effective correctional programming indicates that individual clients should be occupied in structured treatment programs and related activities for 40 to 70 percent of their time to maximize treatment effects, and that programs should last between three to nine months, depending on the goals of the program and the needs of the client (Andrews and Bonta, 2003). Programs that follow these guidelines are characterized as high intensity programs. Low intensity programs, which offer only a few hours of service per week to individual clients, are found to be much less effective than more intensive programs.
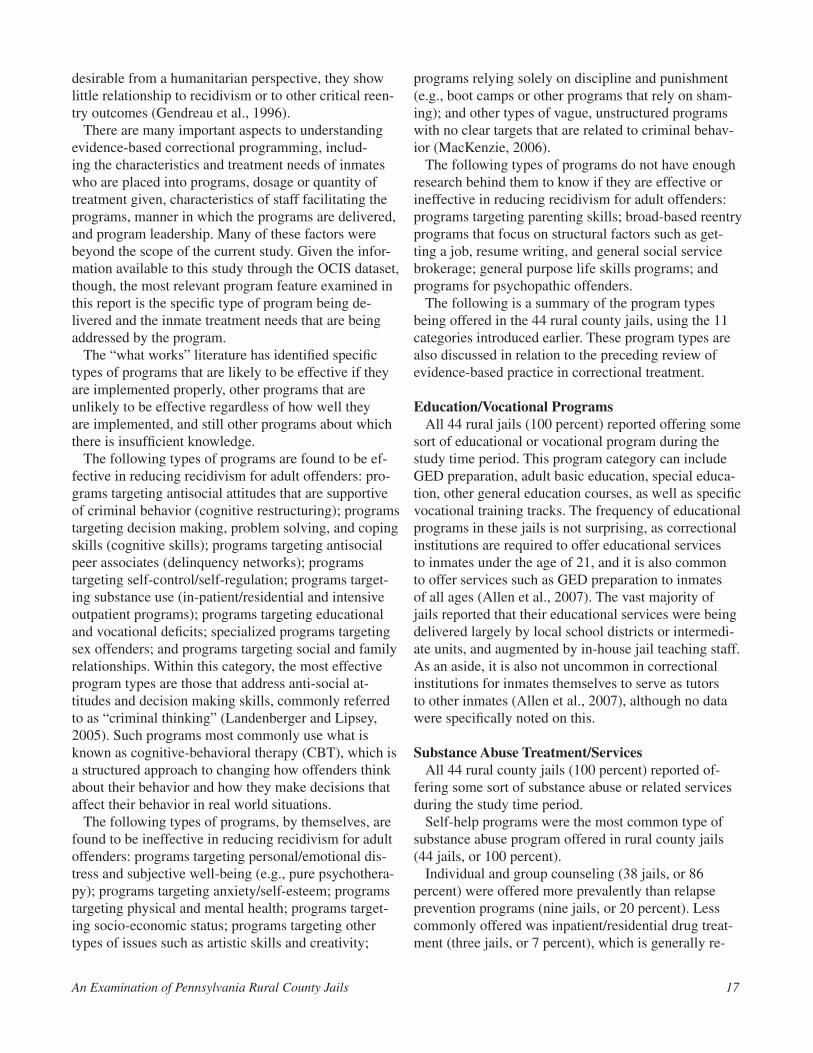
This study found a wide variety of program types being offered at the 44 rural county jails. There was a fair degree of consistency in program offerings across the study period, although not all counties reported program information for all of the study years covered. Thus, the following discussion represents a composite
of programs offered by the rural jails across the study period. The researchers grouped the vari-ous program offerings reported by the jails into the following 11 categories (in order of frequency of being offered in the county jails): educational/vocational programs; substance abuse treatment/services; general psychological counseling; anger/stress management programs; parenting programs; reentry programs; life skills programs; sex offender programs; programs targeting criminal thinking and decision making skills; other programs; and non-evidence-based programs. The prevalence of these programs in the 44 rural county jails during the study period is summarized in Table 13. Jails are typically required to provide educational services (to selected inmates) and mental health services, but other program types are more discretionary.
Program density, or the total number of each category of program offered at a given jail (except non-evidence-based programming) was also examined. Of the 18 jails with high program density (defined as having averages above the system-wide average), 11 (61 percent) were also high population jails. Likewise, the majority of those with low program density (20 jails, 77 percent) were low population jails. This same pattern was evident in the relationship between density and operating budget – the majority of jails with high program density (11 jails, 61 percent) were also high budget jails, and those with low program density (21 jails, 81 percent) were low budget jails.
Following is a brief overview of what constitutes an effective correctional program as a preface to the examination of the specific types of programs being of-fered at rural county jails.
Effective Correctional Program OverviewThere is an extensive body of research on what con-
stitutes an effective correctional treatment program, and what differentiates effective, evidence-based programs from ineffective programs (Andrews and Bonta, 2003; MacKenzie, 2006). This body of correctional research is commonly referred to as the “what works” literature (MacKenzie, 2006). In most of this research, effective, evidence-based correctional programs are defined as those that are likely to reduce recidivism and promote other pro-social outcomes in inmates, such as sobriety and employment. Ineffective programs do not produce these effects, although they may have some impact on other outcomes not related to recidivism, such as improving the subjective sense of well-being of the offender. Again, while these types of outcomes may be
*Denotes evidence-based program, see discussion below. Source: PADOC, 2011 data from county jails’ websites.
Table 13: Number and Percentage of Rural Jails Offering Treatment Programming,by Program Category (2004-2011)
An Examination of Pennsylvania Rural County Jails 17
desirable from a humanitarian perspective, they show little relationship to recidivism or to other critical reen-try outcomes (Gendreau et al., 1996).
There are many important aspects to understanding evidence-based correctional programming, includ-ing the characteristics and treatment needs of inmates who are placed into programs, dosage or quantity of treatment given, characteristics of staff facilitating the programs, manner in which the programs are delivered, and program leadership. Many of these factors were beyond the scope of the current study. Given the infor-mation available to this study through the OCIS dataset, though, the most relevant program feature examined in this report is the specific type of program being de-livered and the inmate treatment needs that are being addressed by the program.
The “what works” literature has identified specific types of programs that are likely to be effective if they are implemented properly, other programs that are unlikely to be effective regardless of how well they are implemented, and still other programs about which there is insufficient knowledge.
The following types of programs are found to be ef-fective in reducing recidivism for adult offenders: pro-grams targeting antisocial attitudes that are supportive of criminal behavior (cognitive restructuring); programs targeting decision making, problem solving, and coping skills (cognitive skills); programs targeting antisocial peer associates (delinquency networks); programs targeting self-control/self-regulation; programs target-ing substance use (in-patient/residential and intensive outpatient programs); programs targeting educational and vocational deficits; specialized programs targeting sex offenders; and programs targeting social and family relationships. Within this category, the most effective program types are those that address anti-social at-titudes and decision making skills, commonly referred to as “criminal thinking” (Landenberger and Lipsey, 2005). Such programs most commonly use what is known as cognitive-behavioral therapy (CBT), which is a structured approach to changing how offenders think about their behavior and how they make decisions that affect their behavior in real world situations.
The following types of programs, by themselves, are found to be ineffective in reducing recidivism for adult offenders: programs targeting personal/emotional dis-tress and subjective well-being (e.g., pure psychothera-py); programs targeting anxiety/self-esteem; programs targeting physical and mental health; programs target-ing socio-economic status; programs targeting other types of issues such as artistic skills and creativity;
programs relying solely on discipline and punishment (e.g., boot camps or other programs that rely on sham-ing); and other types of vague, unstructured programs with no clear targets that are related to criminal behav-ior (MacKenzie, 2006).
The following types of programs do not have enough research behind them to know if they are effective or ineffective in reducing recidivism for adult offenders: programs targeting parenting skills; broad-based reentry programs that focus on structural factors such as get-ting a job, resume writing, and general social service brokerage; general purpose life skills programs; and programs for psychopathic offenders.
The following is a summary of the program types being offered in the 44 rural county jails, using the 11 categories introduced earlier. These program types are also discussed in relation to the preceding review of evidence-based practice in correctional treatment.
Education/Vocational ProgramsAll 44 rural jails (100 percent) reported offering some
sort of educational or vocational program during the study time period. This program category can include GED preparation, adult basic education, special educa-tion, other general education courses, as well as specific vocational training tracks. The frequency of educational programs in these jails is not surprising, as correctional institutions are required to offer educational services to inmates under the age of 21, and it is also common to offer services such as GED preparation to inmates of all ages (Allen et al., 2007). The vast majority of jails reported that their educational services were being delivered largely by local school districts or intermedi-ate units, and augmented by in-house jail teaching staff. As an aside, it is also not uncommon in correctional institutions for inmates themselves to serve as tutors to other inmates (Allen et al., 2007), although no data were specifically noted on this.
Substance Abuse Treatment/ServicesAll 44 rural county jails (100 percent) reported of-
fering some sort of substance abuse or related services during the study time period.
Self-help programs were the most common type of substance abuse program offered in rural county jails (44 jails, or 100 percent).
Individual and group counseling (38 jails, or 86 percent) were offered more prevalently than relapse prevention programs (nine jails, or 20 percent). Less commonly offered was inpatient/residential drug treat-ment (three jails, or 7 percent), which is generally re-
18 The Center for Rural Pennsylvania
garded as the most evidence-based of the various types of substance abuse programs. Given the expense and difficulty of operating (or contracting for) residential substance abuse programs, it is perhaps not surprising that few rural county jails offer such services. Finally, 16 jails (36 percent) reported offering some other type of substance abuse program.
General Psychological Counseling
General psychological counseling was also offered by all 44 rural jails (100 percent) during the study time period. As with educational/vocational programs, this is not a surprising finding. Correctional institutions of all types are generally required by law and/or accredi-tation standards to offer at least basic psychological services to inmates with mental disorders (Allen et al., 2007). The vast majority of jails reported using outside vendors to deliver mental health services, although some jails also reported having in-house mental health professionals. Building an in-house mental health staff can be a challenge for small jails.
Anger/Stress Management Programs
Thirty-two rural jails (73 percent) reported offering some type of anger management program.
Parenting ProgramsThirty-one (70 percent) rural jails offered programs
targeting parenting. Such programs typically focus on providing information on child development and child care, teaching basic parenting skills, and sometimes attempting to build more positive attitudes towards parental responsibilities, although there can often be significant variation in program content from one insti-tution to the other (Loper and Tuerk, 2006).
Reentry Programs
The majority of jails provided reentry programs, with 27 (61 percent) offering some sort of reentry program-ming or services during the study period. There was significant variation in the type of reentry programming offered, with some jails reporting programs directly relating to reentry (and even called by that name), but with many others offering more general programs, such as work release, job skills, and referral to community services, which can be placed into the reentry category.
Life Skills ProgramsLife skills programs were less commonly offered,
with 20 (45 percent) rural jails offering some sort of life skills programming or services. As with general reentry programming, life skills programs can vary widely between institutions, and may sometimes be subsumed under reentry programs. Life skills program-ming can cover a variety of different factors, such as financial management, securing housing, and, for lower functioning inmates, activities of daily living, such as personal hygiene and dress.
Sex Offender ProgramsPrograms specifically targeting sex offenders were
offered by 11 (25 percent) rural jails. Sex offender programs can be some of the most difficult types of programs to operate, requiring specialized staff and dedicated groups. Sex offender treatment is also often a long-term proposition, with some programs running for a year or longer (Losel and Schmucker, 2005).
Programs Targeting Criminal Thinkingand Decision Making Skills
As discussed earlier, programs that target factors such as anti-social attitudes, anti-social peer associates, poor decision making and problem solving skills, and related cognitive factors, are found to be some of the most effective types of offender programming. These types of programs are often referred to as cognitive restructuring/skills building programs, using a specific program approach called cognitive-behavioral therapy, or CBT. CBT can be delivered within the context of a stand-alone program, or basic CBT techniques can also be incorporated into other types of programs, such as substance abuse programs.
Very few of the 44 rural county jails, however, report-ed offering anything that could be identified as address-ing criminal thinking or decision making skills, with only seven (16 percent) rural jails offering some sort of clearly identifiable criminal thinking or CBT program.
Other Programs
Twenty-nine rural jails (66 percent) reported offering other types of programs that could not easily be placed into one of the categories listed above. Examples in-clude women’s programs, veterans’ programs, and vic-tim impact programs. Absent a more detailed evaluation of these programs, the research could not determine if they were evidence-based.
Non-Evidence-Based ProgramsTwelve rural jails (27 percent) reported offering other
types of programs that appeared to fall squarely into the category of non-evidence-based programs. Examples include art therapy, crafts, self-empowerment, self-es-teem, wellness, Teen Challenge, meditation, nutrition, and cultural diversity.
Rural county jails appear poised to act as relief valves to other jurisdictions’ crowding issues. The rural county jail system, overall, received almost double the num-ber of inmates from other jurisdictions as it housed elsewhere during the study period. System-wide, rural county jails averaged 84 percent capacity per year, with 93 percent of jails below capacity during the study period. The majority of jails with higher than aver-age housing of other-jurisdiction inmates were below capacity and had low average costs-per-day, per-inmate. Indeed, the 2010 average cost-per-day, per-inmate in rural county jails ranged from $40 (Northumberland County) to $134.02 (Elk County), with 90 percent24 of rural jails reporting an average cost-per-day, per-inmate lower than the PADOC’s $89.82 (PADOC, 2011b).
The state prison system has been under tremendous population pressure over the past several years. Begin-ning in June 2009, the PADOC entered into agreements with nine rural county jails to house excess inmates and had transferred a total of 1,507 inmates to nine rural jails within 18 months. In addition to sending state in-mates to county jails, the PADOC transferred more than 2,000 inmates to state prisons in Michigan and Virginia as part of its efforts to relieve its population pressures25. Population management is all the more critical in light of the provision of Act 81 of 2008, which resulted in more sentenced offenders being sentenced to state pris-on, as opposed to county jails, and perhaps an increas-ing reliance on county jails housing state transferred inmates. Provided it is properly financed and managed, Pennsylvania’s rural county jail system has the poten-tial to alleviate overcrowding issues demonstrated by other jurisdictions across the state.
While facing population management pressures, and helping to relieve other jurisdictions of overcrowding, 77 percent of jail survey respondents reported medical and/or mental healthcare costs as one of their top fi-nancial challenges. Given that rural county jails inherit
the responsibility of inmate health care when receiv-ing other-jurisdiction transfers, ensuring they have the financial resources to provide the services seems to be a critically important issue. Moreover, if rural county jails are to properly manage the influx of other-jurisdictional transfers, their available staffing comple-ment needs to be appropriately financed. However, 69 percent of survey respondents listed staffing costs, including wages, benefits, and training, as one of the top financial challenges facing their jails.
Another important consideration for inter-jurisdic-tional transfers is the quality of rehabilitative programs and services available within rural county jails. This study found that the 44 rural county jails are indeed of-fering program and treatment services that can be clas-sified as evidence-based. All of the jails reported offer-ing some sort of educational/vocational programming, general psychological counseling, and substance abuse/treatment services. As discussed earlier, educational/vocational deficits and substance abuse are both appro-priate targets for evidence-based treatment, but there is little evidence that general psychological counseling by itself contributes greatly to recidivism risk reduction.
Rural jails reported offering many types of programs whose effects on recidivism are unclear or have not been sufficiently researched. These include parenting programs, anger management, life skills, and broad-based reentry programs. Indeed, a majority of jails reported offering some level of these types of programs (63 percent).
More than one-quarter of the jails (27 percent) reported offering programs that have either shown no effect on recidivism, or are not clearly related to the goal of recidivism reduction. These include programs focusing on nutrition, arts and crafts, meditation, and women’s studies.
This study represents the most comprehensive nar-rative and dataset of issues related to Pennsylvania rural county jails, constituting a solid basis for future research on this topic. Moreover, this study can provide a basis for data-driven state and local prison bed space and program management, as well as budget and capital project-related decisions.
An Examination of Pennsylvania Rural County Jails 19
Conclusions
24. Thirty-seven of the 41 jails that reported 2010 data.25. The inmates housed in Michigan and Virginia were transferred back to Pennsylvania in May 2011 and March 2012, respectively.
20 The Center for Rural Pennsylvania
Given the overcrowding issues faced by local and state institutions, the data derived by this study, espe-cially those related to capacity and costs-per-day, per-inmate for each jail, may be used to inform economical approaches to distributing sentenced offenders between the state and county correctional systems. Other states, most notably California, have used this approach (Vera Institute of Justice, 2010). For example, California is transferring tens of thousands of primarily non-violent inmates from state prisons to county jails in response to extreme and longstanding overcrowding in the state prison system, which has resulted in intervention by the federal courts (Dolan, 2011).
This study also offered an in-depth analysis of the available rural county jail programs, the results of which may be used to inform rural county jails’ deci-sions to augment their current offerings, whether by eliminating or adding certain types of programs. While the jails are offering a wide variety of programs and services, much of this program activity focuses on services that are non-evidence-based, have uncertain effects, or do not use the most effective treatment modalities. To be more effective in reducing recidivism, Pennsylvania’s rural county jails could shift resources towards program types that show the strongest impact on recidivism, most especially programs addressing criminal thinking and decision making skills and using cognitive-behavioral approaches, while devoting less time to non-evidence-based programs.
As noted earlier, while this study documented the presence of various types of programs within the coun-ty jails, a more detailed examination of the quality of programs was beyond the scope of this study. Valuable insight would be gained by an evaluation of program quality in at least some of the jails. Factors that could be examined include the qualifications of program leadership and staff, appropriate placement of inmates into programs that match their needs, fidelity of pro-gram implementation, and the conformity of programs, as delivered, to the principles of effective intervention. Such an evaluation would allow for stronger conclu-sions about the potential for county jail programs to reduce recidivism, and would generate suggestions for program improvements.
Finally, this study has the potential to impact the county jail data management systems. County jail data are often fragmented, incomplete, and unreliable. In Pennsylvania, as in most states, county jails oper-ate under policies and procedures promulgated by the local county government, which, in effect, results in 63 separate correctional systems. Without a stronger network and more comprehensive data collection and management, research and jail development efforts are hindered. This project served to test the adequacy of the Pennsylvania data system specifically, finding that while the relevant data are collected, they are not gener-ally retained beyond a 5-year period. It is difficult to make fully informed decisions about state and county jail population management without robust data sys-tems. Thus, another recommendation is to create better data management practices to include taking deliber-ate steps to preserve the information collected beyond just 5 years. Ideally, this data management would be performed by a single entity so as ensure standardized administration practices.
Policy Considerations
An Examination of Pennsylvania Rural County Jails 21
Allen, Harry E., Edward J. Latessa, Bruce S. Ponder, and Clifford E. Simonsen. (2007) Corrections in America: An Introduction (11th Ed.). Up Saddle River, NJ: Pearson Prentice Hall.
Andrews, D.A. and James Bonta. (2003) The Psychology of Criminal Conduct. Cincinnati, OH: Anderson Publishing. Bennett, David M. and Donna Lattin. (2009) Jail Capacity Planning Guide: A Systems Approach. Washington, D.C.: U.S. Department of Justice, National Institute of Corrections.
Blumstein, Alfred, Jacqueline Cohen, Jeffrey A. Roth, and Christy A. Visher (Eds.). (1986) Criminal Careers and ‘Career Criminals’: Volume II. Washington, D.C.: National Academy Press.
Bucklen, Kristofer B. and Gary Zajac. (2009) “But Some of Them Don’t Come Back (To Prison!): Resource Deprivation and Thinking Errors as Determinants of Parole Success and Failure.” The Prison Journal, 89(3), 239-264.
Dolan, Jack. (2011) “State to Transfer Some Inmates.” Los Angeles Times. Retrieved from http://articles.latimes.com/2011/apr/05/local/la-me-prisoners-20110405. April 5.
Gendreau, Paul, Tracy Little and Claire Goggin. (1996) “A Meta-Analysis of the Predictors of Adult Offender Recidivism: What Works!” Criminology, 34(4), 575-607.
Kaminski, Jennifer W., Linda Anne Valle, Jill H. Filene and Cynthia L. Boyle. (2008) “A Meta-Analytic Review of Components Associated with Parenting Training Effectiveness.” Journal of Abnormal Child Psychology, 36(4), 567-589.
Kinsella, Chad. (2004) Corrections Health Care Costs. Lexington, KY: Council of State Governments. Retrieved from http://www.prisonpolicy.org/scans/csg/Corrections+Health+Care+Costs+1-21-04.pdf.
Landenberger, Nana A. and Mark W. Lipsey. (2005) “The Positive Effects of Cognitive-Behavioral Programs for Offenders: A Meta-Analysis of Factors Associated with Effective Treatment.” Journal of Experimental Criminol-ogy, 1(4), 451-476.
Liebert, D.R. and R. Miller. (2003). Staffing Analysis Workbook for Jails (2nd ed.). Washington, D.C.: U.S. De-partment of Justice, National Institute of Corrections.
Loper, Ann Booker and Elena Hontoria Tuerk. (2006) “Parenting Programs for Incarcerated Parents: Current Re-search and Future Directions.” Criminal Justice Policy Review, 17(4), 407-427.
Losel, Friedrich and Martin Schmucker. (2005) “The Effectiveness of Treatment for Sexual Offenders: A Compre-hensive Meta-Analysis.” Journal of Experimental Criminology, 1(1), 117-146.
MacKenzie, Doris L. (2006) What Works in Corrections. New York, NY: Cambridge University Press.Mills, Jeremy F. and Daryl F. Kroner. (2003) “Anger as a Predictor of Institutional Misconduct and Recidivism in a Sample of Violent Offenders.” Journal of Interpersonal Violence, 18(3), 282-294.
Mitchell, Ojmarrh, David B. Wilson, and Doris L. MacKenzie. (2007) “Does Incarceration-Based Drug Treatment Reduce Recidivism? A Meta-Analytic Synthesis of the Research.” Journal of Experimental Criminology, 3(4), 353-375.
Pennsylvania Department of Corrections (PADOC). (2008) “Pennsylvania Department of Corrections Monthly Population Report As of December 31, 2008.” Retrieved from http://www.portal.state.pa.us/portal/server.pt/docu-ment/1103659/mtpop0812_pdf_%283%29?.
Pennsylvania Department of Corrections. (2009) “County In-House Population County ‘Snapshot’ Date of Janu-ary 30, 2009.” Retrieved from http://www.portal.state.pa.us/portal/server.pt/community/hide_county_jails/11433/snapshot_files/566617.
Pennsylvania Department of Corrections. (2010) “Pennsylvania Department of Corrections Monthly Popula-tion Report as of December 31, 2010.” Retrieved from http://www.portal.state.pa.us/portal/server.pt/docu-ment/1103705/mtpop1012_pdf?qid=93909926&rank=1.
Pennsylvania Department of Corrections. (2011a) “Office of Planning, Research, Statistics and Reentry: Pub-lications/Reports.” Retrieved from: http://www.cor.state.pa.us/portal/server.pt/community/research___statis-tics/10669.
Pennsylvania Department of Corrections. (2011b) “Cost to House Inmates.” Retrieved from http://
References
(References continued on next page)
22 The Center for Rural Pennsylvania
www.portal.state.pa.us/portal/server.pt/community/hide_administration/14789/cost_to_house_inmates?qid=77465271&rank=1.
Pew Center on the States. (2010). Prison Count 2010: State Population Declines for the First Time in 38 Years. Issue Brief. Washington, DC: The Pew Charitable Trusts.
Skarupski, Kimberly A. (2003) Outcomes Evaluation of the Long Distance Dads©Program. Erie, PA: Penn State
Erie: The Behrend College’s Center for Organizational Research and Evaluation (CORE). Report to the Pennsyl-vania Commission on Crime and Delinquency.
Smith, Linda G. (2008) An Outcome Evaluation of the Pennsylvania Department of Corrections’ Community Ori-entation and Reintegration Program. Columbus, OH: International Association of Reentry. Report to the Penn-sylvania Commission on Crime and Delinquency.
Surratt, Hilary L. (2003) “Parenting Attitudes of Drug-Involved Women Inmates.” The Prison Journal, (83)2, 206.Taxman, Faye S., Douglas W. Young, Brian Wiersema, Anne Rhodes, and Suzanne Mitchell. (2007) “The National Criminal Justice Treatment Practices Survey: Multilevel Survey Methods and Procedures.” Journal of Substance Abuse Treatment, 32(3), 225-238.
Vera Institute of Justice. (2010) The Continuing Fiscal Crisis in Corrections: Setting a New Course. New York, NY: Vera Institute of Justice.
Welsh, Wayne N. and Gary Zajac. (2004a) “Building an Effective Research Partnership Between a University and a State Correctional Agency: Assessment of Drug Treatment in Pennsylvania Prisons.” The Prison Journal, 84(2), 143-170.
Welsh, Wayne N. and Gary Zajac. (2004b) “A Census of Prison-Based Drug Treatment Programs: Implications for Programming, Policy and Evaluation.” Crime & Delinquency, 50(1), 108-133.
Wilson, James A. and Robert C. Davis. (2006) “Good Intentions Meet Hard Realities: An Examination of the Project Greenlight Reentry Program.” Criminology & Public Policy, 5(2), 303-338.
Wright, John Paul and Kevin M. Beaver. (2005) “Do Parents Matter in Creating Self- Control in Their Children? A Genetically Informed Test of Gottfredson and Hirshi’s Theory of Low Self-Control.” Criminology, 43(4), 1169-1202.
Young, Jacqueline L., Michael E. Antonio and Lisa M. Wingeard. (2009) “How Staff Attitude and Support for Inmate Treatment and Rehabilitation Differs by Job Category: An Evaluation of Findings from Pennsylvania’s Department of Corrections Employee Training Curriculum ‘Reinforcing Positive Behavior’.” Journal of Criminal Justice, 37(5), 435-441.
References (continued)

The Center for Rural Pennsylvania625 Forster St., Room 902
Harrisburg, PA 17120Phone: (717) 787-9555
Fax: (717) 772-3587www.rural.palegislature.us
1P1212 – 450
ChairmanSenator Gene Yaw
TreasurerSenator John Wozniak
SecretaryDr. Nancy Falvo
Clarion University
Representative Garth D. Everett
Representative Rick Mirabito
Dr. Livingston AlexanderUniversity of Pittsburgh
Dr. Theodore R. AlterPennsylvania State University
Stephen M. BrameGovernor’s Representative
Taylor A. Doebler IIIGovernor’s Representative
Dr. Stephan J. GoetzNortheast Regional Center
for Rural Development
Dr. Karen M. WhitneyClarion University
The Center for Rural PennsylvaniaBoard of Directors