An examination of retirement rate patterns among California pre-K–12 certificated educators

East Tennessee State UniversityDigital Commons @ East
Tennessee State University
Electronic Theses and Dissertations Student Works
5-2009
An Examination of Patterns and Trends ofPrescription Drug Abuse Among Adolescents.Maggie Marie OrenderEast Tennessee State University
Follow this and additional works at: https://dc.etsu.edu/etd
Part of the Social Control, Law, Crime, and Deviance Commons
This Thesis - Open Access is brought to you for free and open access by the Student Works at Digital Commons @ East Tennessee State University. Ithas been accepted for inclusion in Electronic Theses and Dissertations by an authorized administrator of Digital Commons @ East Tennessee StateUniversity. For more information, please contact [email protected].
Recommended CitationOrender, Maggie Marie, "An Examination of Patterns and Trends of Prescription Drug Abuse Among Adolescents." (2009). ElectronicTheses and Dissertations. Paper 1826. https://dc.etsu.edu/etd/1826

An Examination of Patterns and Trends of Prescription Drug Abuse Among Adolescents
_____________________
A thesis
presented to
the faculty of the Department of Criminal Justice and Criminology
East Tennessee State University
In partial fulfillment
of the requirements for the degree
Masters of Arts in Criminal Justice and Criminology
_____________________
by
Maggie Marie Orender
May 2009
_____________________
Larry Miller, Ph.D., Chair
John Whitehead, Ph.D.
Steve Ellwanger, Ph.D.
Keywords: adolescents, prescription drugs, drug abuse

ABSTRACT
An Examination of Patterns and Trends of Prescription Drug Abuse Among Adolescents
by
Maggie Marie Orender
The purpose of this study was to examine prescription drug abuse among the adolescent population
and analyze factors that may contribute to or influence adolescent drug abuse. This study examined
3 waves of a secondary data set from the Substance Abuse and Mental Health Services
Administration (SAMSHA) entitled the National Survey on Drug Use and Health (NSDUH). The
data from these surveys are nationally representative and include data on several types of drug use
and mental health conditions. Results from the current study indicate that there were significant
relationships among age, gender, race, previous alcohol use, school enrollment, general health,
mental health treatment, and the use of prescription drugs in the adolescent populations. Future
research should be conducted to investigate the severity of the impact adolescent prescription drug
abuse will have on society and to investigate possible solutions to this problem.
2
ACKNOWLEDGEMENTS
First and foremost I have to thank my Mom for the endless encouragement and support she
has given me over the years. Your love has given me the strength to pursue my dreams. Thank you
for always believing in me Mom.
I also have to thank the rest of my wonderful family – Dad, Gary, Sammy, and Nana – for
supporting me in your own individual ways. You all hold a very special place in my heart. I want
to thank each and every one of you for inspiring me to be the very best person I can be.
A very special thanks and love to Josh for always believing in me. Thank you for
encouraging me and standing by me through this journey. Your support and patience have meant
the world to me.
This process would not have been nearly as enjoyable without the entertainment and
inspiration of two very special friends, Jaclyn and Vanessa. It has been a wild ride girls and I am
so thankful that we were able to experience this chapter of our lives together.
My deepest thanks and appreciation go to my committee members, Dr. Larry Miller, Dr.
Steven Ellwanger, and Dr. John Whitehead. This project would not have been possible without
your guidance and support. I have enjoyed working with you Dr. Ellwanger. I really appreciate all
the support, guidance, and consideration you have shown me over the past 2 years. Dr. Whitehead,
thank you for all your kindness and encouragement during this program. You have made many of
my days brighter. Last, but definitely not least, I would especially like to thank my thesis
chairperson and friend, Dr. Miller, for enduring countless emails, phone calls, and partial
meltdowns throughout my graduate program.
3

CONTENTS
Page
ABSTRACT .............................................................................................................................. 2
ACKNOWLEGDEMENTS....................................................................................................... 3
LIST OF TABLES .................................................................................................................... 7
Chapter
1. INTRODUCTION.............................................................................................................. 8
Purpose of the Research................................................................................................. 9
Study Design.................................................................................................................. 10
Hypotheses............................................................................................................... 10
Limitations..................................................................................................................... 11
Terminology................................................................................................................... 11
2. LITERATURE REVIEW ................................................................................................. 13
Drug Abuse in the United States................................................................................... 13
Morphine, Heroin, and Cocaine ............................................................................. 13
Federal Anti-Drug Laws.......................................................................................... 14
Marijuana................................................................................................................. 15
Alcohol..................................................................................................................... 16
Drug Enforcement Agencies................................................................................... 17
Drug Related Offenses............................................................................................. 17
Drug Related Arrest Rates....................................................................................... 18
Nonmedical Use of Prescription Drugs......................................................................... 19
Self-Medication.............................................................................................................. 22
Pharm Parties................................................................................................................. 24
Demographic Profile of Drug Abuse............................................................................. 25
4
Summary........................................................................................................................ 28
3. METHODOLOGY ............................................................................................................ 30
Data ............................................................................................................................ 30
Variables......................................................................................................................... 31
Dependent Variables ............................................................................................... 31
Independent Variables............................................................................................. 31
Analysis.......................................................................................................................... 32
Univariate................................................................................................................. 32
Bivariate................................................................................................................... 32
Summary........................................................................................................................ 33
4. ANALYSIS OF DATA ..................................................................................................... 34
Descriptive Characteristics of the Sample .................................................................... 34
Hypothesis 1................................................................................................................... 38
Hypothesis 2................................................................................................................... 40
Hypothesis 3................................................................................................................... 42
Hypothesis 4................................................................................................................... 44
Hypothesis 5................................................................................................................... 45
Hypothesis 6................................................................................................................... 47
Hypothesis 7................................................................................................................... 49
Trends of Prescription Drug Abuse............................................................................... 50
Summary........................................................................................................................ 52
5. SUMMARY, CONCLUSIONS, AND IMPLICATIONS ............................................... 53
Conclusions ................................................................................................................... 54
Implications for Further Research................................................................................. 57
Limitations .............................................................................................................. 57
Recommendations ................................................................................................... 58
REFERENCES .......................................................................................................................... 60
5

VITA ........................................................................................................................................ 64
6

LIST OF TABLES
Table Page
1. Descriptive Characteristics of the Sample............................................................................... 37
2. Chi-Square Test of Independence and Cramer’s V Test of Association for Age................... 39
3. Crosstabulation for Prescription Drug Use and Age (Percentage)......................................... 40
4. Chi-Square Test of Independence and Cramer’s V Test of Association for Race................. 41
5. Crosstabulation for Prescription Drug Use and Race (Percentage)........................................ 42
6. Chi-Square Test of Independence and Phi Test of Association for Gender........................... 43
7. Crosstabulation for Prescription Drug Use and Gender (Percentage).................................... 43
8. Chi-Square Test of Independence and Cramer’s V Test of Association for Health............... 45
9. Crosstabulation for Prescription Drug Use and Health (Percentage)..................................... 45
10. Chi-Square Test of Independence and Phi Test of Association for School Enrollment........ 46
11. Crosstabulation for Prescription Drug Use and School Enrollment (Percentage).................. 47
12. Chi-Square Test of Independence and Phi Test of Association for Prior Alcohol Use......... 48
13. Crosstabulation for Prescription Drug Use and Prior Alcohol Use (Percentage)................... 48
14. Chi-Square Test of Independence and Phi Test of Association for Mental Health
Treatment................................................................................................................................. 49
15. Crosstabulation for Prescription Drug Use and Mental Health Treatment (Percentage)....... 50
16. Crosstabulation of Trends of Prescription Drug Abuse (Percentage)..................................... 52
7

CHAPTER 1
INTRODUCTION
American culture and Western medicine rely heavily on the use of prescription medication.
Prescription rates have increased dramatically over the last decade. Doctors around the country
write hundreds of prescriptions each day to treat a variety of illnesses. According to Boyd,
McCabe, Cranford, and Young (2006a), “Between 1992 and 2002, opioid prescriptions increased
by 222%, benzodiazepines by 49%, and stimulants by 368%” (p. 2473). The mental health
profession has been one to subscribe to this pop-a-pill philosophy and the use of prescription
medication to treat depression, anxiety, and insomnia has increased. Boyd et al. (2006a) suggest
that the prescription rate and the nonmedical use of abusable drugs are positively correlated.
In many medicine cabinets across the country there are bottles of unused pain relievers,
sedatives, tranquilizers, and stimulants. The Partnership for a Drug-Free America (2006) reports,
“More than three in five teens say prescription pain relievers are easy to get from parents’
medicine cabinets” (p. 2). Many of these medicine cabinets are not locked or secured in any way to
prevent such access to these medications.
Literature and research in the field of adolescent prescription drug abuse is very limited.
Adolescent prescription drug abuse is a problem that has just recently emerged. Several years ago,
when drug abuse was mentioned, the assumption was that the drugs being abused were illicit drugs
such as marijuana, cocaine, and heroin. These were, and still are, all drugs that have to be obtained
from the local drug dealer. The new drug trend that has surfaced has taken many by surprise.
Americans are spending more and more money on prescription medications. The pharmaceutical
business is booming. However, because the prescription rate has increased, the risk of abuse of
prescription drugs has also increased. One factor that could explain this abuse could be the drugs’
8
availability. The Partnership Attitude Tracking Survey (2005) reveals reasons adolescents are
abusing prescription medications. These reasons include widespread availability, the idea that the
prescription drugs are safer than street drugs, the ease of obtaining them from the medicine
cabinet, and that there is less shame attached to using prescription drugs (PATS, 2005). Since the
emergence of prescription drug abuse, the focus has been shifted away from illicit street drugs and
onto pharmaceuticals.
Middle school and high school kids are taking prescription drugs and abusing them, and
many do not know what they are putting into their bodies. An even more recent and disturbing
trend to arise is that of the “pharm” party, short for pharmaceuticals. These are parties “where kids
bring prescription drugs – taken from family or friends’ medicine cabinets – mix them together in a
bowl and pop a pill cocktail, sometimes washing it down with alcohol” (Wethal, 2008). This type
of recreational abuse of pharmaceuticals, in many cases, can lead to serious injury and sometimes
even death.
Purpose of the Research
The purpose of this study was to examine prescription drug abuse among adolescents 12 to
17 years of age and analyze factors that may influence adolescent drug abuse. The use of four
specific classes of drugs was examined: sedatives, stimulants, tranquilizers, and pain relievers.
Several variables were tested to determine if they share a relationship with prescription drug use.
These variables include age, race, gender, general health, alcohol use, school enrollment, and
mental health treatment. The analysis of these variables was conducted to determine the
characteristics of an individual who is more likely to abuse prescription drugs. Secondary data
were used to analyze these variables. The data used come from the National Survey on Drug Use
9
and Health, which is a nationally representative survey that is conducted by the Substance Abuse
and Mental Health Services Administration.
Study Design
Three waves of the National Survey on Drug Use and Health survey were analyzed. In
particular, surveys collected in the years 2002, 2004, and 2006 were used. The surveys include
responses from noninstitutionalized U.S. civilians aged 12 and older. For the current study, only
individuals between the ages 12 and 17 were included for analysis. The survey from the year 2002
includes 17,709 respondents, the year 2004 includes 18,294 respondents, and the year 2006
includes 18,314 respondents. The survey includes information on the prevalence and correlates of
illicit drug abuse and nonmedical use of prescription drugs. This study examines the nonmedical
use of prescription drugs and does not investigate illicit drug use among adolescents.
Hypotheses
Several hypotheses will be tested to identify characteristics of individuals who are more
likely to abuse prescription drugs. The specific research hypotheses for this research study are as
follows:
H1: There is a relationship between age and prescription drug abuse.
H2: There is a relationship between race and prescription drug abuse.
H3: There is a relationship between gender and prescription drug abuse.
H4: There is a relationship between overall health and prescription drug abuse.
H5: There is a relationship between school enrollment and prescription drug abuse.
H6: There is a relationship between alcohol use and prescription drug abuse.
H7: There is a relationship between mental health treatment and prescription drug abuse.
10

Limitations
The current study, although nationally representative, is not without limitations. It should
be noted that the aim of this study was to determine if prescription drug abuse and the variables
listed above share a relationship. It was not the goal of this study to identify the reason(s) why
adolescents abuse prescription drugs, but simply to identify who is more likely to abuse
prescription drugs within this specific age group. The data used for this analysis were self-reported
information, so the researcher must rely on the assumption that the information obtained was
accurate and honest. Given that some of the questions on the survey about drug abuse were
sensitive in nature, all responses may not be truthful.
Terminology
The current study focuses on the nonmedical use of prescription drugs by adolescents. For
the purpose of this study adolescents and teenagers are respondents in the 12-17 year age group.
Nonmedical use of prescription drugs “refers to the use of a scheduled psychotherapeutic drug for
which the user has no prescription, or the use of a psychotherapeutic drug for which the user has a
prescription, but in a manner not intended by the prescribing clinician” (McCabe, Cranford, &
Boyd, 2006b, p. 281). A “pharm” party, or pharmaceutical party, is a gathering where individuals,
typically adolescent individuals, trade prescription drugs with one another for the purposes of
achieving an altered state of consciousness. These parties have become very popular with
teenagers. Typically, the individuals gather at a house and all participants bring any and all
prescription drugs they could obtain from home or friends. Then the drugs are emptied into a bowl
and mixed together and the individuals take a handful from the bowl to ingest. It is common for the
drugs to be taken with alcohol. Most often, the drugs are never properly identified before being
ingested. These parties are sometimes considered safer, by the teenagers, than doing illicit street
11

drugs because the stigma of having to obtain the drugs from a drug dealer is removed. The
prescription drugs are seen as safe because they came from the medicine cabinet (Wethal, 2008).
Prescription drugs, as described in this study, can be sorted into four categories: sedatives,
stimulants, tranquilizers, and analgesics. Sedatives are prescription drugs that cause drowsiness and
dizziness and can induce sleep. Examples of this type of drug include Ambien, Halcion, and
Lunesta. Stimulants are a class of drugs that are similar to methamphetimes. They cause alertness,
awareness, and occasionally a euphoric sensation. Examples of stimulants include diet pills,
Adderall, and Ritalin. Tranquilizers are in a class of psychotherapeutic drugs used to treat anxiety
and other conditions. They may also be referred to as benzodiazepines. These medications can
cause drowsiness and dizziness and give the user a very relaxed feeling. Examples of common
tranquilizers include Xanax, Valium, and Klonopin. Analgesics are a class of drug used to treat
pain. They are also commonly referred to as painkillers. These prescription medications can often
cause drowsiness, dizziness, and euphoric sensations. Examples of commonly abused analgesics
include Lortab, Percocet, and Oxycontin. Many of these drugs produce similar feelings and
sensations; however, the chemical compounds of each drug are unique and produce specific
reactions in the brain. Also, many of these prescription drugs are highly addictive and can be very
dangerous if taken without a doctor’s supervision. All four classes of pharmaceuticals include
drugs that are commonly taken nonmedically and abused to achieve a high or simply for the
feeling and experience they cause (Meadows, 2001).
12
CHAPTER 2
LITERATURE REVIEW
Prescription drug abuse among the adolescent population has increased exponentially in the
past decade. Research on adolescent prescription drug abuse is limited. The problem has just been
uncovered in recent years. Issues surrounding adolescent illicit drug abuse have been researched
extensively, but the research has rarely narrowed to prescription drug abuse. This chapter provides
a brief history of drug abuse in the United States and a review of the previous research surrounding
adolescent drug abuse. It includes information on adolescent illicit and prescription drug abuse.
The chapter is divided into five sections of literature. These sections focus on the history of drug
abuse in the United States, nonmedical use of prescription drugs, self-medication, “pharm” parties,
and findings from previous research. The section of this chapter focused on previous findings is
centered on some of the variables that were examined in the current study, including age, race,
gender, alcohol use, and mental health treatment. Previous research and findings have been
reviewed to provide insight into the problem discussed in the current study.
Drug Abuse in the United States
Drug abuse has plagued the United States, and most other countries, for centuries. Many
drugs that are considered illicit by current standards were originally introduced for medicinal
purposes. “In the 1860s, the American Civil War literally triggered a drug epidemic, resulting in
hundreds of thousands of morphine addicts – 400,000 in the Union Army alone” (Lyman & Potter,
2007, p.40).
Morphine, Heroin, and Cocaine
Morphine, a derivative from opium, was introduced in the early 1800s, and was originally
used in surgeries and as a pain reliever. As doctors and researchers realized that morphine was
13

highly addictive, they turned to another drug to treat the addiction, cocaine. The United States’ first
major cocaine epidemic was seen between the 1880s and the 1920s. “In 1886, Atlanta-born John
Styth Pemberton introduced the soft drink Coca-Cola, which for the next 20 years had a cocaine
base” (p.41). Cocaine was obviously not the cure for morphine addiction but was seen for many
more years as a cure for other medical ailments. This drug, and a few others, were marketed and
sold by leading retailers. “Within one year of the discovery of cocaine, the Parke-Davis Company
was marketing coca and cocaine in 15 different forms, including coca cigarettes, cocaine for
injection, and cocaine for sniffing” (p.42). Parke-Davis, Sears-Roebuck, and many other
companies sold cocaine in kits that often included syringes for easy and convenient injection
(Lyman & Potter, 2007; Moeser, 1994).
Heroin was another drug that became popular for its medicinal use. It was identified as
another treatment for morphine addiction as well as marketed as a sedative and cough suppressant.
The name heroin was actually a trade name given to the drug by Bayer and Company when it
began selling heroin commercially (Inciardi, 2008). The drug heroin was thought to be
nonaddictive and because it was much more potent than morphine, only a small dose of the drug
was needed for desired effect. Heroin overdose is seen in many drug-abusing communities because
of the drug’s potency. Small amounts of the drug can easily hamper respiratory functions and
cause death.
Federal Anti-Drug Laws
The use of morphine, cocaine, and heroin significantly decreased in the early 1900s with
the passage of the Pure Food and Drug Act of 1906 and the Harrison Narcotics Act of 1914. The
Pure Food and Drug Act has been the only federal statute to have an effect on reducing drug
addiction. The Act provided for the creation of the Food and Drug Administration. It also required
14
that certain drugs could only be sold by prescription and that prescription labels had to warn
patients that the drugs could be addictive. The Pure Food and Drug Act was a means of regulating
the distribution of drugs by the manufacturers and physicians. The Harrison Narcotics Act was a
federal law that required special taxes and regulations be placed upon specific drugs. These
regulations also required that any individual or group who produced, imported, or otherwise
distributed these drugs had to register with the U.S. Treasury Department. However, there were
also provisions guiding the manner in which these drugs had to be produced and to whom they
could be distributed. There were provisions limiting the powers of physicians who prescribed the
drugs, requiring that these drugs could only be prescribed for legitimate medical purposes through
the course of profession practice. The drugs could no longer be prescribed to individuals who were
dependent on the drug to provide for their addiction. However, with the passage of this new law
regulating narcotics and cocaine, another nonnarcotic drug emerged, namely marijuana (Inciardi,
2008; Lyman & Potter, 2007).
Marijuana
Cannabis can be traced all the way back to the Chinese in 2000 B.C.E. It did not become
available in the United States until the 1800s. Cannabis is the plant that the drugs hashish and
marijuana are derived from. Cannabis, like the previous drugs, was sold initially for medical
purposes. It was thought to be a cure for illnesses such as depression, hysteria, convulsions, and
many other ailments. Cannabis came in many forms and was extracted from the hemp plant. The
type of cannabis that is seen in society today originally became popular and visible in the 1920s.
Marijuana, in the form of dried leaves that are smoked was identified in Mexico and subsequently
brought to the United States. When it arrived in the US, marijuana was used mostly by minorities
and achieved a stigma of a lower class drug. By the 1930s, states began passing antimarijuana
15

laws. In 1937 the Marijuana Tax Act was passed. This Act designated marijuana as a narcotic,
which placed it under jurisdiction of the Harrison Narcotic Act. Marijuana was then subject to the
same rules and regulations of opium-related substances and cocaine. In society today, marijuana is
still the leading drug abused, possibly due to the ease of production, as well as the prevalence
(Inciardi, 2008; Lyman & Potter, 2007).
Alcohol
Even with the development and discovery of new drugs throughout time, there has been
one intoxicant that has remained constant. The use of alcohol to alter a mental state has been an
activity enjoyed by many for several generations. It is believed that alcohol was first discovered
during the Stone Age. Drinking alcohol has generally been an accepted behavior as long as it is
done in moderation. An increase in the amounts of alcohol consumed was identified in the early
1900s and the atmosphere surrounding the behavior changed. People began to view alcohol, like
morphine, cocaine, and heroin, as an evil substance that destroyed lives. Thus, in 1919, “the
Eighteenth Amendment was passed outlawing the manufacture and sale of alcohol except for
industrial use” (Lyman & Potter, 2007, p. 47). This law marked the beginning of the Prohibition
era. Alcohol, although illegal, would not disappear, and neither would the problems surrounding its
use. The time period during Prohibition soon become known as the Roaring Twenties, with strong
resistance against alcohol prohibition. The use of alcohol and marijuana increased dramatically
during this time, while the use of opium narcotics and cocaine showed a marked decrease. It
became obvious that prohibiting the use of alcohol was not decreasing the use and abuse of alcohol
and in 1933 the Twenty-first Amendment was passed repealing the Eighteenth Amendment
(Inciardi, 2008; Lyman & Potter).
16

Drug Enforcement Agencies
In response to the increase in drug and alcohol use the Federal Bureau of Narcotics was
formed within the Treasury Department. This was the first attempt at providing a specified
department or agency to deal with the drug problem in America. Enforcement of the Harrison Tax
Act and the Marijuana Tax Act were the responsibilities of the Federal Bureau of Narcotics. The
Drug Abuse Control Amendments to the Narcotics Control Act (1956) were passed in 1965.
“These brought the manufacture and distribution of amphetamines and barbiturates under federal
control and imposed criminal penalties for illegally manufacturing these drugs” (Lyman & Potter,
2007, p. 53). These amendments also provided for the creation of the Bureau of Alcohol and Drug
Abuse Control within the Department of Health, Education, and Welfare. In 1968 the two agencies
were combined to form the Bureau of Narcotics and Dangerous Drugs within the Department of
Justice. This was the first time in U.S. history that the Department of Justice was given the
authority to enforce federal drug laws. “In 1973, President Richard Nixon implemented a drug
enforcement reorganization plan that addressed the supply side of drug abuse as well as the
demand component of the problem” (p. 325). The reorganization plan allowed for the conception
of a central federal agency to combat illegal drug trade in the United States, the Drug Enforcement
Administration. The DEA is the only federal law enforcement agency that has one primary concern
and responsibility. “The dominant philosophy of the DEA is to eliminate drugs as close to their
source as possible and to disrupt the drug-trafficking system by identifying, arresting, and
prosecuting traffickers” (p. 326).
Drug Related Offenses
There are several types of offenses that constitute as a drug offense. These various drug
offenses can be seen in state and federal statutes and can hold very different punishments.
17

Depending upon where the violation was documented and who apprehended the violator, either
state or federal charges will be brought against the offender. Although they vary across
jurisdictions, drug laws are specific about what constitutes a violation of a drug law and these
violations can be broken down into three general categories: possession and use, manufacturing,
and distribution. The possession category prohibits individuals from possessing or using an illegal
substance, with the exception requiring a lawful prescription. Manufacturing laws include activities
that are related to the production of an illegal substance, and distribution laws prohibit the sale and
delivery of illegal drugs. There are also other prohibited activities that can be prosecuted as drug
offenses. These activities can include possession of drug paraphernalia, money laundering, and
conspiracy.
Drug Related Arrest Rates
According to the Bureau of Justice Statistics there were roughly 1,841,200 state and local
arrests for drug abuse violations in the United States in 2007. The number has been increasing
exponentially. In the 1980s, there were less than one million arrests for drug abuse violations per
year. Between 1994 and 2003 law enforcement officers made over 1.9 million arrests of juveniles
for drug related violations. Most of the charges against adolescents are for possession or use of an
illegal substance, rather than the manufacturing or distributing drugs. Also, between 1999 and
2003 juvenile arrests involving synthetic narcotics increased by nearly 80% and arrests involving
dangerous nonnarcotics increased by 50%. During the same 5-year period the number of arrests
involving marijuana increased only 5%. Information is limited regarding exactly what types of
narcotics were involved in the arrest, yet it is evident that these types of drugs are becoming more
prevalent with the adolescent population. Another statistic that has been on the rise is the
percentage of drug arrests based on the total number of arrests per year. Drug arrests accounted for
18

7.4% of all arrests reported to the FBI in 1987, and rose to 13% by 2007. Since 1996 marijuana has
been the drug involved in the majority of arrests for drug violations. Again, it could be reasoned
that the ease of production of marijuana contributes to its prevalence. It could also be hypothesized
that because more agencies and departments have been created to combat illegal drug use, the
number of arrests for drug related offenses has also increased (Federal Bureau of Investigation,
2004; U.S. Department of Justice, 2007).
Nonmedical Use of Prescription Drugs
Prescription drug abuse has just recently been recognized as a problem in the United States.
It has received a decent amount of attention from mainstream media; however, research on the
issue has been limited. Only a handful of researchers have investigated the problem thoroughly.
These researchers include Sean McCabe of the Substance Abuse Research Center, and Carol Boyd
of the Addiction Research Center at the University of Michigan. Collectively they have
collaborated on several studies to examine adolescent prescription drug abuse and the motivations
behind the problem.
Prescription drug abuse is typically referred to as the nonmedical use of prescription drugs.
Nonmedical use is defined as the use of prescription drugs in a manner that is inconsistent with the
intentions of the prescribing physician. The most commonly abused prescription drugs are pain
relievers, stimulants, and sedatives. It has been found that prescription drug abuse is second only to
marijuana in the population of illicit drug users (Boyd et al., 2006b).
Nonmedical use of prescription drugs can occur in many different settings and scenarios. If
an individual is legitimately prescribed a medication by a physician, but takes more than the
prescribed dose to achieve an altered state of mind, it would be considered nonmedical use of a
prescription drug. The individual was not taking the drug for the prescribed reason or to treat a
19
particular medical condition. Another example of nonmedical use of prescription drugs would be
seen if a friend or family member took pain medication from the other for a toothache. Relief of a
toothache was probably not the original intended use of the medication as prescribed by the
clinician. “Pharm” parties and self-medication are other forms of nonmedical use of prescription
drugs and these types of prescription drug abuse will be discussed in detail later in this chapter.
Less extreme, more innocent behaviors can also be examples of nonmedical use and can easily
lead to prescription drug abuse. For example, a wife taking her husband’s sedatives to treat a
problem sleeping can quickly and easily lead to addiction and abuse (Boyd et al., 2006a).
There are several theories hypothesizing why this new form of drug abuse has occurred.
The most prominent explanation suggests that the increase in the prescription rate has caused an
increase in abuse of those prescribed medications. The availability of abusable prescription
medications has increased tremendously over the past few years. This increase could be due to a
number of factors, including the increased effectiveness of certain medications to treat particular
ailments, the ease of production of these medications, and the ability to identify symptoms of
conditions that can be treated with medication. Some studies suggest that an increase in the
medical use of prescription medication will ultimately lead to an increase in the abuse of said
medications primarily because of increased availability (CASA, 2007; McCabe et al., 2006a).
Internet pharmacies were introduced in the late 1990s and have become a largely relied
upon resource for obtaining prescription drugs. The National Center on Addiction and Substance
Abuse at Columbia University, lead by Califano, Jr. (2007) conducted a study to examine the
availability of controlled substances at online pharmacies. They found that, as of 2007 there were
581 websites online offering schedule II through schedule V controlled substances. “Eighty-four
percent of sites offering controlled prescription drugs do not require that the patient provide a
20

prescription from his or her doctor” (p. i). Some of the websites offer patient consultations so that a
diagnosis can be given and an online doctor then writes a prescription. This is just one example of
ways to avoid regulations requiring a valid prescription. Essentially all that is needed to obtain
prescription drugs online is Internet access and a valid credit card number. There are virtually no
measures in place to restrict access to these online pharmacies to children under the age of 18. One
of the weak measures found to control access was the requirement to enter an age before being
granted access to the website. Entering a false age can easily circumvent this restriction. These
Internet pharmacies are just another way on increasing prescription drug availability as well as
allure (CASA, 2007).
If the explanation citing the increasing prescription rate is accepted, how is the increase in
the prescription rate explained? Pharmaceutical companies rely on marketing strategies to promote
and sell their product. These strategies employed by pharmaceutical companies, as with any other
type of company, provide a considerable amount of influence on society. They help shape societal
beliefs and values. The increases in the prescription rate may possibly be attributed to these
strategies. America’s pill-popping society has come to rely on medicinal solutions to almost any
physical or mental complaint. There are only a few common conditions that are not treated with
medication. In fact, “ninety-one percent of Americans have taken prescription drugs and more than
half (54 percent) taken them regularly” (CASA, 2005, p. 12). Marketing strategies to promote
specific medications for relief of particular conditions or symptoms shape the way society views
prescription drugs. Television commercials, magazine advertisements, billboards, and even some
forms of public transportation aid in promoting this new medicinal culture. These ads give the
appearance that taking prescription medication is a perfectly normal behavior and all of the
medications are perfectly safe, when in many cases they are not safe or effective.
21

Regardless of the theory chosen to explain this social problem, the fact remains that
prescription drugs are being distributed at a higher rate than in previous years. According to a
study conducted by the National Center on Addiction and Substance Abuse at Columbia
University (2005), “in 2002, more than three billion prescriptions were filled for over 500,000
different drugs; 234 million for controlled prescription drugs” (p. 26). This study also found that
between 1992 and 2002 the “number of prescriptions filled for controlled drugs climbed 154.3
percent…” (p. 23). The New York Times (2008) also reported that in a ten-year period, between
1997 and 2007, “the number of prescriptions filled had increased 72 percent…” (Saul, 2008). The
findings from these studies are more than sufficient evidence to conclude that the number of
prescriptions written and filled each year is rising and more prescription drugs are becoming
widely available (CASA, 2005).
Self-Medication
An article in the New York Times (2005) provides some insight into a newer form of
nonmedical use of prescription drugs referred to as self-medication. The new trend seen in
Manhattan, NY is that of trading prescription drugs. This has been done for years, but the
difference in this situation is that the prescription drugs are traded to treat medical conditions, not
to get high. One of the individuals involved in this practice is quoted in the article saying, “I
acquire quite a few medications and then dispense them to my friends as needed. I usually know
what I’m talking about” (Harmon, 2005). Her attitude about illegally dispensing prescription
medication is nonchalant and she defends this by saying, “It’s not like we’re passing out
Oxycontin, crushing it up and snorting it…I don’t think it’s unethical when I have the medication
that someone clearly needs to make them feel better to give them a pill or two” (Harmon, 2005).
22
Experts in the field of drug abuse are perplexed about this new form of drug abuse and about the
acceptance it has gained.
This explanation of prescription drug abuse has drawn some attention from some
researchers. The concept of self-medication refers to the behavior of treating a mental health
condition with prescription drugs without the supervision of a proper physician. This theory was
originally identified to explain the rate of which drug abuse and mental health disorders occurred
together. “One prominent explanation for the high rates of co-occurrence is that individuals use
psychoactive substances to ‘self-medicate’ painful or disturbing psychiatric symptoms” (Harris &
Edlund, 2005, p.118). At the core of this theory is the view that individuals who are self-
medicating mental health disorders believe that their symptoms are treatable and knowingly take
drugs to alleviate them. Other theories have also been formulated hypothesizing that the use of
psychoactive substances can lead to mental health disorders later in life. Either way, the use of
prescription drugs and the occurrence of mental health disorders seem to have some connection to
one another (Boyd et al., 2006b)
Harris and Edlund (2005) conducted a study to test for the existence of behavior that is
consistent with self-medication. They examined “the relationships between drug and alcohol use
and perceptions of unmet need for mental health care and use of mental health care” (p.118). In the
study, they analyzed two waves of data from the National Survey on Drug Use and Health. The
analysis indicated that individuals who reported mental health problems were more likely to use
drugs. It was also found that the rate of use increased with the severity of their reported mental
health issues. Individuals who were identified as having an unmet need for mental health services
were also seen to have rates of illicit drug use, excluding marijuana, higher than that of the general
population. Marijuana did not appear to share any relationship with mental health care or the lack
23
thereof. Heavy alcohol use did not appear to share a relationship with the perception of an unmet
need of mental health services, but was found to decrease with mental health care use. “The
positive relationship between unmet need and illicit drug use and the negative relationship between
mental health care use and heavy alcohol use among those without substance dependency is
consistent with the behavior predicted under the self-medication hypothesis and suggests that
mental health treatment may prevent the development of substance-use disorders” (p.132).
Pharm Parties
“Pharm” parties have become the new trend with teenagers. The name is derived from the
word pharmaceutical. Teenagers organize these parties and each individual attending is expected to
bring prescription drugs from home. Once at the party, the kids drop all the pills into a bowl and
each person either receives a baggie full of drugs or takes a handful of pills from a bowl. Many
times these pills are followed with alcohol. The manner in which these drugs are distributed at
pharm parties is very similar to the manner in which a hostess at a cocktail party serves snacks and
drinks. Drug counselors across the nation are hearing more and more about these pill-popping
parties and the trend is disturbing (Friedman, 2006; Leinwand, 2006).
The adolescent population has actually gone as far as to create jargon related to these
parties. The bowls of pills are often referred to as trail mix, the act of digging through the pills to
find specific ones is termed grazing, and going through medicine cabinets to find prescription
drugs is referred to as pharming. Some prescription drugs typically found at these parties can
include Vicodin, OxyContin, Adderall, Ritalin, Xanax, Valium, Prozac, Ambien, and Lunesta.
These drugs are some of the most common pharmaceuticals prescribed daily to patients, so they
can easily be found in many homes across the country. Some teenagers who are abusing
prescription drugs like those found at these parties are even turning to the Internet to share
24

“recipes” with each other. These “recipes” are different combination of prescription drugs that will
produce a desired effect or high (CASA, 2007).
Pharm parties are a fairly new trend among juvenile drug abusers and very little
information is available regarding this new form of adolescent entertainment. Pharm parties have
just recently been on the rise and many people are not even aware that they exist. Many people are
aware of “farm” parties, which are generally parties held in someone’s barn out on farmland on the
weekend and the primary activity was drinking alcohol. This can cause a serious problem,
particularly when children say they are going to a “pharm” party, but all that is heard is that they
are going to a “farm” party. The two are very distinct and can result in drastically different
consequences.
Demographic Profile of Drug Abuse
Several studies have identified the demographic characteristics of drug users, gathering
information on variables such as age, race, gender, income, and education. This demographic
profile can vary across the research, given that drug abuse is an ever-changing social problem.
Drug users can come in all shapes and sizes and can be surprising at times. Of the studies
conducted to examine prescription drug abuse, many of the results are consistent with one another
and provide a relatively similar portrayal of the prescription drug abuser.
A study conducted by the National Center on Addiction and Substance Abuse at Columbia
University in 2005 reports several demographic variables for illicit drug use, including prescription
drug abuse. This report suggests that the rate of prescription drug abuse is growing at a much faster
pace for adolescents than adults. It was also reported that adolescents who reported using
prescription drugs nonmedically were five times more likely to have reported previous alcohol use.
This study also states that adults who abuse only prescription drugs are more likely to be women,
25

late 30s, higher education, higher income, and married, as opposed to individuals who abuse
several drugs (CASA, 2005).
A few studies have been conducted that have focused primarily on adolescent prescription
drug abuse. Boyd, McCabe, and Teter (2006b) conducted a study to examine the nonmedical use
of prescription pain medications among public school students. They found significant gender
differences in the medical and nonmedical use of prescription pain relievers. Girls were more
likely to have used prescription pain relievers in their lifetime. Racial differences were not found to
be significant between Whites and African-Americans. It was also found that individuals who used
pain relievers nonmedically were five times more likely to have report past alcohol use and eight
times more likely to have reported the use of several other drugs. This research also suggested that
self-medication could play a role in the nonmedical use of some widely prescribed medications. It
was also found that the “two leading sources for nonmedical pain medication were family and
friends” (p. 43).
A study similar to Boyd et al.’s (2006b) research was conducted by McCabe, Boyd, and
Teter (2005) to examine the nonmedical use of prescription pain relievers. McCabe et al. (2005)
analyzed data from the Monitoring the Future Study to identify correlates of pain reliever use in
high school seniors. This study used a nationally representative sample and focused primarily on
the use of two opioid pain relievers, OxyContin and Vicodin. Several demographic differences
were found among the adolescent drug abusers. It was found that males were more likely to report
illicit use of Vicodin and OxyContin than females. “White students were over four times more
likely than African-American students to report illicit use of Vicodin” (p. 227). It was also found
that illicit Vicodin users were more likely to report previous alcohol use, particularly within the
26

previous month. In addition, heavy binge drinking shared a relationship with illicit use of Vicodin
and OxyContin.
McCabe, Boyd, and Teter (2006a) also investigated the nonmedical use of prescription
medication among a sample of undergraduate students on a college campus. The analysis found
that undergraduate men were more likely than women to report nonmedical use of sedatives,
stimulants, analgesics, and tranquilizers. Racial differences were also identified. White and
Hispanic students were more likely to report abuse of prescription medication than African-
American and Asian students. This study found that four out of five prescription drug users also
reported excessive alcohol use as well. In addition, this research confirmed national findings
regarding the rise of prescription drug abuse. On the college campus in this study prescription
drugs were the second most common abused substance, following marijuana. The findings of this
study are consistent with previous research on demographic characteristics of prescription drug
abusers.
Saylor et al. (2007) conducted a study similar to the previous research. They conducted a
study to examine the use of legally obtainable products for the purpose of “getting high”, including
nonmedical use of prescription medications. The analyses were conducted on information obtained
from fifth, sixth, and seventh grade students in four Alaskan communities. Results from this
research indicate that 8% of respondents reported using prescription medications nonmedically in
their lifetime. However, this particular study did not find any statistically significant demographic
differences in the use of any illicit substances.
McCabe, Cranford, and Boyd (2006b) conducted a study to further address the relationship
between past alcohol use and prescription drug abuse among adolescents. They investigated the
relationship between previous alcohol use and the nonmedical use of prescription drugs among
27

individuals 18 years or older. This study found that individuals between the ages 18 and 24 had
higher rates of alcohol use and nonmedical use of prescription drugs. Racial differences were also
apparent in this study, suggesting that African-Americans had a lower risk of prescription drug
abuse and Native Americans had a very high risk for nonmedical use of prescription drugs.
There is limited research on the phenomenon identified as self-medication among
adolescents. Hansell and White (1991) conducted a study to examine the relationship between
adolescent drug use and psychological distress. They tested to determine whether drug use is
brought on by symptoms of psychological distress or if the drug use causes mental health
symptoms. The results of this research suggest that the theory of self-medication is false and that
the symptoms of mental health issues follow drug abuse. There was no evidence supporting the
hypothesis stating that psychological distress can prompt drug use among adolescents. The results
of this study are limited however, and can only be applied to the study population.
Summary
Drug abuse is not a new phenomenon. Previous literature suggests that drug abuse dates
back to prehistoric times yet has evolved over centuries. There have been several drug trends and
patterns of abuse, from morphine and heroin to cocaine and marijuana. Yet, the new trend facing
the United States is the nonmedical use and abuse of prescription drugs. This type of drug abuse is
not centralized around one specific group of individuals or among a particular social status.
Prescription drug abuse can be seen in societies and social crowds everywhere. The troubling
development lies with a recent emphasis on adolescent prescription drug abuse.
It has been unclear as to the nature and the severity of the problem of adolescent drug
abuse. There are several studies investigating illicit and illegal drug use among adolescents, yet
there is limited research examining prescription drug abuse among juveniles. The research that has
28

been conducted has provided somewhat of a demographic profile of the teenage prescription drug
abuser. These profiles have varied with the different types of prescription drugs used, but seem to
be fairly consistent. Many drug users have reported using other prescription or illicit drugs in their
lifetime and also typically report previous alcohol use. When examining the use of prescription
pain relievers the profile of the drug abuser suggests that they will be white males. An examination
of all prescription drugs used reveals a similar profile. It is difficult to identify any one of these
profiles revealed in previous research as the accurate portrayal because drug abuse transforms so
frequently and drastically over time.
29
CHAPTER 3
METHODOLOGY
The purpose of this study was to examine trends of prescription drug abuse among the U.S.
adolescent population. Several factors were analyzed to determine if they shared a relationship
with adolescent prescription drug abuse including age, race, gender, general health, alcohol use,
school enrollment, and mental health treatment. It was predicted that all of these variables would
share a relationship with prescription drug abuse. The direction of these relationships was not
predicted in this research. The following section describes the data used for the study, the variables
used to test the hypotheses and the analyses conducted for this research.
Data
The data used in the current research were obtained from the Inter-university Consortium
for Political and Social Research (ICPSR), which was available on the University of Michigan’s
website. The data were collected by the Office of Applied Studies within the Substance Abuse and
Mental Health Services Administration. The survey used to collect these data was the National
Survey on Drug Use and Health. This survey has been conducted periodically since 1971. It is a
nationally representative sample of all noninstitutionalized U.S. civilians aged 12 or older. The
survey used a computer-assisted interviewing (CAI) method for the collection of data. This survey
is cross-sectional and uses a self-reporting method of collection. It employs a 50-state design using
a multistage area probability sample for each of the 50 states and the District of Columbia.
Respondents of the survey are given an incentive payment of $30.
Three waves of the survey were used for analysis in this study. Specifically, the years 2002,
2004, and 2006 were used in this research. For the current research, only individuals between the
ages 12 and 17 were included for analysis. After selecting cases of individuals who were within the
30

age range, the sample size for the year 2002 was 17,709, the year 2004 was 18,294, and the year
2006 was 18,314. Bivariate analyses were conducted on the 2006 wave of the survey to identify
relationships between the dependent and independent variables and to determine the strength of
those relationships. The data from the surveys in 2002, 2004, and 2006 were compared to identify
trends and patterns of adolescent prescription drug abuse over the six-year period.
Variables
Dependent Variables
The current study investigated the relationships between certain variables and adolescent
prescription drug abuse. The use of four prescription drugs was used as dependent variables in this
research. All of the dependent variables were measured at the nominal level and included the use
of analgesic drugs (1=yes and 91=no); use of tranquilizers (1=yes and 91=no); use of stimulants
(1=yes and 91=no); use of sedatives (1=yes and 91=no). For the purpose of this study, all of these
variables were recoded into new variables (1=yes and 2=no).
Independent Variables
There were seven independent variables analyzed in this study. Age, race, gender, general
health, alcohol use, school enrollment, and mental health treatment were used in analysis with the
use of prescription drugs. The first three variables were of a demographic nature. The first
independent variable, age, was defined by the respondents’ birth date entry (1=respondent is 12
years old; 2=respondent is 13 years old; 3=respondent is 14 years old; 4=respondent is 15 years
old; 5=respondent is 16 years old; 6=respondent is 17 years old). The second variable in this study
was race. This variable was measured at the nominal level and was coded 1=Non-Hispanic White,
2=Non-Hispanic Black/African American, 3=Non-Hispanic Native American, 4=Non-Hispanic
Pacific Islander, 5=Non-Hispanic Asian, 6=Non-Hispanic more than one race, 7=Hispanic. Race
31

was recoded for the analyses with 1=White, 2=Black, 3=Hispanic, and 4=Other. Third, the variable
gender was measured at the nominal level and coded as 1=male and 2=female.
The respondent’s overall health was measured at the ordinal level and coded as
1=excellent, 2=very good, 3=good, 4=fair, and 5=poor. School enrollment was measured
nominally to determine if the respondent was currently attending or currently enrolled in a school
and the variable was coded with 1=yes and 2=no. Alcohol use was also measured nominally to
identify if the respondent has ever had a drink of any type of alcohol and the variable was coded
with 1=yes and 2=no. Finally, mental health treatment was measured nominally to determine if the
respondent had ever received mental health treatment or counseling for conditions not caused by
alcohol or drugs and the variable was coded as 1=yes and 2=no.
Analysis
Univariate
Univariate analyses were conducted to summarize the sizable amount of data included in
this study. Frequency distributions and descriptive statistics were generated for all of the
independent variables. This technique allowed the researcher to present the frequency of each
response in a concise manner. Percentages were also displayed in the tables to provide a clearer
picture of the way variable attributes were distributed.
Bivariate
Bivariate analyses were also conducted on the independent variables for each dependent
variable to determine if significant relationships existed between the variables. The Chi-square
analyses allowed the researcher to form conclusions about the national population of adolescents
including those who use prescription drugs and those who do not. The Chi-square analyses
determined whether the relationships between the independent and dependent variables were
32

statistically significant. Two measures of association were used to determine the strength of the
relationship, if it existed. These two statistics were Cramer’s V and Phi. These tests provided
results indicating the strength and magnitude of the relationship. Crosstabulations were also
generated to determine the direction of the relationship between the independent and dependent
variables.
Summary
The present study was done in an effort to add to the existing literature on adolescent
prescription drug abuse. The analyses were conducted to identify possible characteristics of
individuals who were more likely to use prescription drugs, such as age, gender, race, school
enrollment, health, alcohol use, and mental health treatment. A limited number of previous studies
have addressed a few of these variables in relation to prescription drug abuse.
33

CHAPTER 4
ANALYSIS OF DATA
The purpose of this study was to examine patterns and trends of prescription drug abuse
among adolescents and to identify characteristics of individuals who were more likely to use
prescription drugs. The relationship between prescription drug abuse and age, gender, race, health,
school enrollment, previous alcohol use, and mental health treatment was investigated. It was
predicted that all of these variables would share a significant relationship with the use of
prescription drugs among adolescents.
This chapter provides the results of the statistical analyses conducted in this study. Data
from the National Survey on Drug Use and Health from the year 2006 was used to test the
hypotheses in this study. Bivariate analyses were conducted to determine if any relationships
existed between the dependent and independent variables. Given that all variables used for this
study were measured at the nominal and ordinal level, crosstabulations and Chi-square tests were
used to identify significant relationships. An alpha level of .05 was selected for the current study.
As a result, in order for a significant relationship to exist the critical value of the Chi-square test
must be equal to or greater than the critical region defined by the .05 alpha level.
There are eight tables provided in this chapter. The first table displays the univariate
statistics, which contain demographic characteristics of the sample. The remaining seven tables
provide the results of the bivariate statistics conducted in this study.
Descriptive Characteristics of the Sample
Table 1 contains a descriptive summary of the data used for analysis. The descriptive
statistics were presented for the independent variables in the sample and include age, race, gender,
health, school enrollment, previous alcohol use, and mental health treatment. Only respondents that
34
were between 12 and 17 years of age were included for analysis. In the 2002 wave of the survey
there were 17,709 respondents that were between 12 and 17 years of age, with the highest
percentage being 14 years of age (17.6%). There were seven categories of race; Non-Hispanic
White (66.3%), Non-Hispanic Black (13.6%), Non-Hispanic Native American (1.1%), Non-
Hispanic Pacific Islander (0.5%), Non-Hispanic Asian (2.5%), Non-Hispanic Mixed Race (2.2%),
and Hispanic (13.8%). Of the respondents males and females were almost equally divided, with
51% males and 49% females. The most common response given for overall health was very good
(41.1%) and 1,670 individuals reported having been treated for mental health issues. There were
17,439 individuals that were enrolled in school at the time of the survey and only 1.5% reported
that they were not enrolled in some form of school. Previous alcohol use was almost equally
distributed with 43.6% reporting prior alcohol use and 56.4% reporting no alcohol use.
There were 18,294 respondents that were between 12 and 17 years of age included in the
2004 wave of the survey. Of the respondents, 17.4% reported being 13 years of age. Similar to the
2002 sample, the racial composition of the sample is comparable to the diversity seen in society
with the majority of respondents being Non-Hispanic White (63.9%); Hispanic (14.3%); and, Non-
Hispanic Black (13.5%). Males and females had a distribution identical to the previous sample
with 51% males and 49% females. Most individuals in this wave of the survey also reported their
overall health as very good (7,645) and 10.5% received mental health treatment. Of the
respondents in this sample, 98.3% were enrolled in school, leaving only 1.7% of individuals not
enrolled at the time of the survey. With regard to previous alcohol use, this sample was also
approximately evenly distributed with 42.9% of individuals reporting prior alcohol use and 57.1%
stating that they had never used alcohol. The results of this wave of the survey are very similar to
the results in the 2002 survey.
35
In the 2006 wave of the survey there were 18,314 respondents between the ages of 12 and
17. This sample included more respondents that were 15 years of age (17.4%). With respect to
race, the majority of individuals were Non-Hispanic White (60.7%); Hispanic (16.7%); and, Non-
Hispanic Black (14.2%). Gender distribution was also similar to the previous two samples, with
51.1% of respondents male and 48.9% of respondents female. The majority of individuals in this
wave of the survey reported their overall health as Very Good (42.3%) and 1800 respondents
reported receiving mental health treatment in the past. Nearly all of the respondents reported being
enrolled in school at the time of the survey, with only 1.4% of respondents not enrolled in school.
Of the respondents in this survey, 41.7% had previously used alcohol while 58.3% stated they had
not used alcohol. The results from the 2006 wave of the survey are fairly consistent with results
from the 2002 and 2004 surveys with respect to differences and similarities among the independent
variables.
The demographic characteristics for all three waves of the survey were nearly identical.
The samples included an almost equal amount of individuals from both genders. It also included
individuals evenly distributed across the six age categories. This seems to reflect the diversity and
distribution of individuals within society.
36
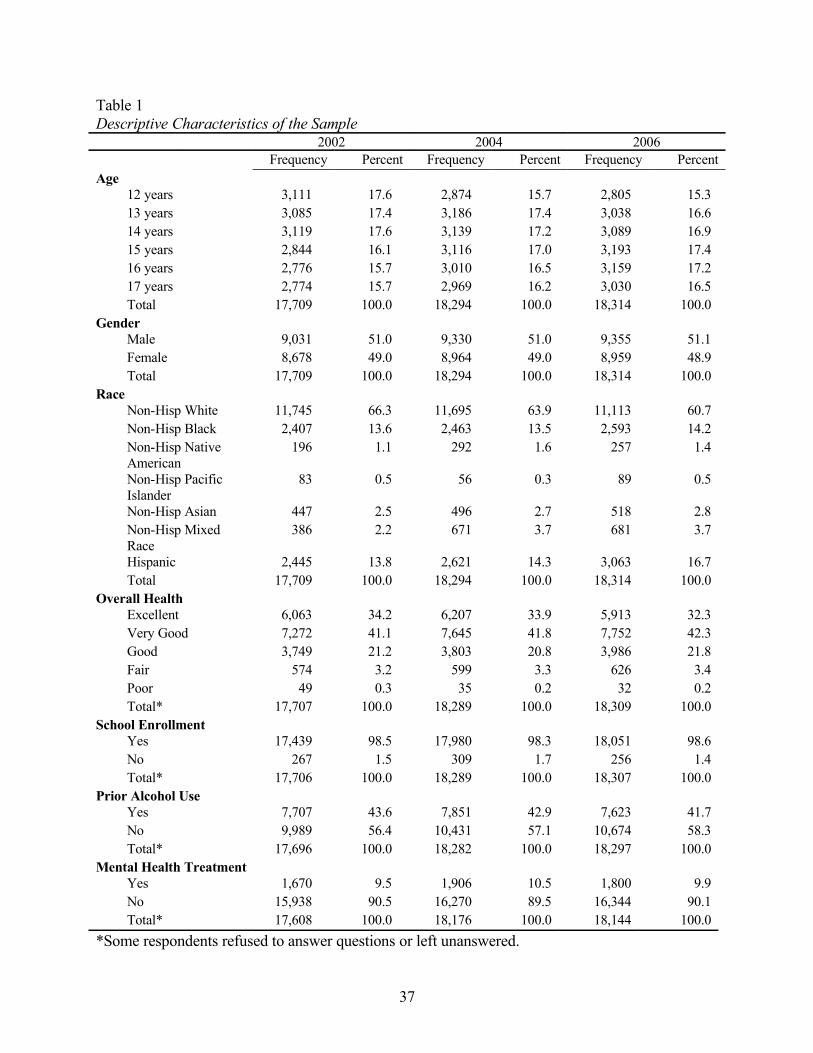
Table 1Descriptive Characteristics of the Sample
2002 2004 2006Frequency Percent Frequency Percent Frequency Percent
Age12 years 3,111 17.6 2,874 15.7 2,805 15.313 years 3,085 17.4 3,186 17.4 3,038 16.614 years 3,119 17.6 3,139 17.2 3,089 16.915 years 2,844 16.1 3,116 17.0 3,193 17.416 years 2,776 15.7 3,010 16.5 3,159 17.217 years 2,774 15.7 2,969 16.2 3,030 16.5Total 17,709 100.0 18,294 100.0 18,314 100.0
GenderMale 9,031 51.0 9,330 51.0 9,355 51.1Female 8,678 49.0 8,964 49.0 8,959 48.9Total 17,709 100.0 18,294 100.0 18,314 100.0
RaceNon-Hisp White 11,745 66.3 11,695 63.9 11,113 60.7Non-Hisp Black 2,407 13.6 2,463 13.5 2,593 14.2Non-Hisp Native American
196 1.1 292 1.6 257 1.4
Non-Hisp Pacific Islander
83 0.5 56 0.3 89 0.5
Non-Hisp Asian 447 2.5 496 2.7 518 2.8Non-Hisp Mixed Race
386 2.2 671 3.7 681 3.7
Hispanic 2,445 13.8 2,621 14.3 3,063 16.7Total 17,709 100.0 18,294 100.0 18,314 100.0
Overall HealthExcellent 6,063 34.2 6,207 33.9 5,913 32.3Very Good 7,272 41.1 7,645 41.8 7,752 42.3Good 3,749 21.2 3,803 20.8 3,986 21.8Fair 574 3.2 599 3.3 626 3.4Poor 49 0.3 35 0.2 32 0.2Total* 17,707 100.0 18,289 100.0 18,309 100.0
School EnrollmentYes 17,439 98.5 17,980 98.3 18,051 98.6No 267 1.5 309 1.7 256 1.4Total* 17,706 100.0 18,289 100.0 18,307 100.0
Prior Alcohol UseYes 7,707 43.6 7,851 42.9 7,623 41.7No 9,989 56.4 10,431 57.1 10,674 58.3Total* 17,696 100.0 18,282 100.0 18,297 100.0
Mental Health TreatmentYes 1,670 9.5 1,906 10.5 1,800 9.9No 15,938 90.5 16,270 89.5 16,344 90.1Total* 17,608 100.0 18,176 100.0 18,144 100.0
*Some respondents refused to answer questions or left unanswered.
37

Hypothesis 1
The first hypothesis was tested to determine whether an individual’s age shared a
relationship with the use of prescription drugs. Table 2 presents the results from the chi-square
analysis of age and prescription drug use. Based on these results, the null hypothesis of no
relationship is rejected. The chi-square analyses revealed significant associations between age and
all four dependent variables; pain relievers (x2 = 480.10, p = .000), stimulants (x2 = 219.60, p = .
000), sedatives (x2 = 302.00, p = .000), and tranquilizers (x2= 15.354, p = .009). The degrees of
freedom for all four tests were 5. With the exception of tranquilizers, use of prescription drugs was
more likely among respondents 17 years of age. Crosstabulations indicate that individuals 16 years
of age were the most likely to use prescription tranquilizers. In this sample, younger individuals
were least likely to use any of the four prescription drugs. Crosstabulations for all four dependent
variables also suggested a positive relationship between age and prescription drug abuse, with the
use of all prescription drugs increasing as age increased (Table 3).
Another test was conducted to determine the strength of the relationship between age and
the use of prescription drugs since the Chi-square test was significant at the .05 alpha level. In
order to determine the strength of that relationship the Cramer’s V statistic was generated for each
Chi-square test (Table 2). A moderate association was observed with analgesics and tranquilizers,
and a moderately weak relationship was revealed with stimulants and sedatives. The association
was the strongest for pain relievers (Cramer’s V = .162) and the weakest for tranquilizers
(Cramer’s V = .029).
Cohen (1988) suggested that an effect size should always be reported to determine the
strength or magnitude of any relationship that was found statistically significant because many
statistics, including chi-square, can be influenced by sample size. For the purpose of the current
38
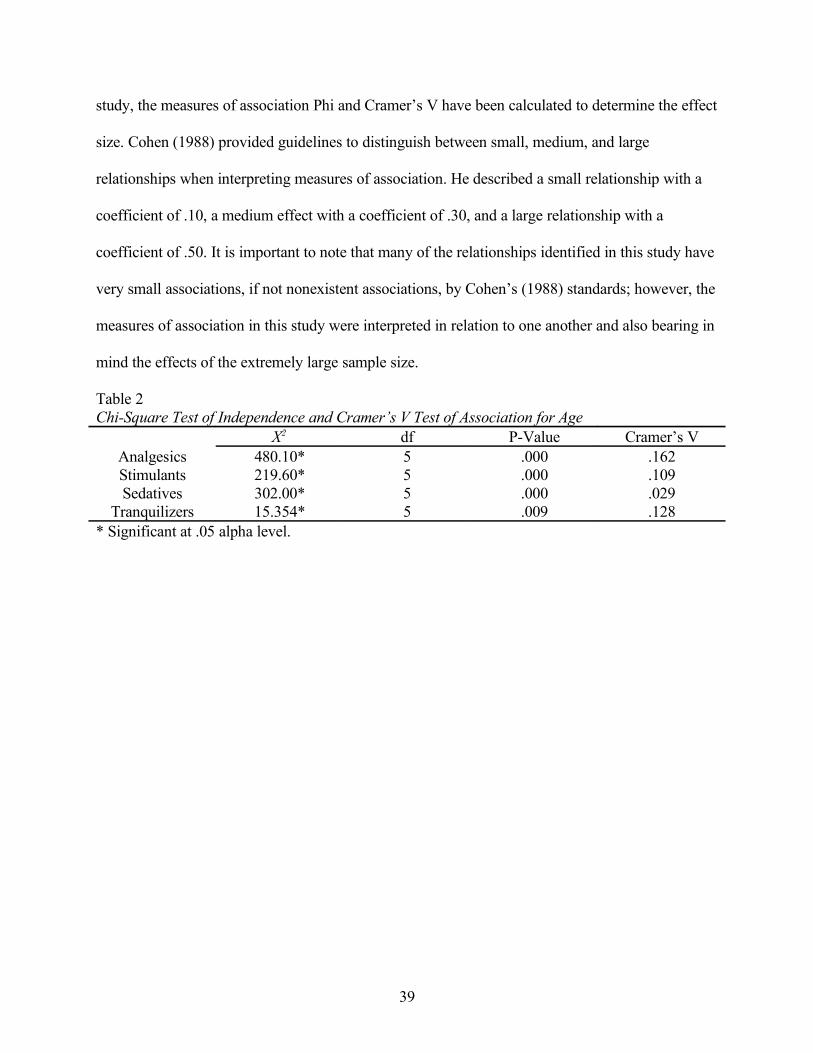
study, the measures of association Phi and Cramer’s V have been calculated to determine the effect
size. Cohen (1988) provided guidelines to distinguish between small, medium, and large
relationships when interpreting measures of association. He described a small relationship with a
coefficient of .10, a medium effect with a coefficient of .30, and a large relationship with a
coefficient of .50. It is important to note that many of the relationships identified in this study have
very small associations, if not nonexistent associations, by Cohen’s (1988) standards; however, the
measures of association in this study were interpreted in relation to one another and also bearing in
mind the effects of the extremely large sample size.
Table 2Chi-Square Test of Independence and Cramer’s V Test of Association for Age
X2 df P-Value Cramer’s VAnalgesics 480.10* 5 .000 .162Stimulants 219.60* 5 .000 .109Sedatives 302.00* 5 .000 .029
Tranquilizers 15.354* 5 .009 .128* Significant at .05 alpha level.
39

Table 3Crosstabulation for Prescription Drug Use and Age (Percentage)
Age in Years12 13 14 15 16 17
Pain Reliever UseYes 4.6 5.1 7.7 11.7 15.2 17.9No 95.4 94.9 92.3 88.3 84.8 82.1Total 100.0 100.0 100.0 100.0 100.0 100.0
Stimulant UseYes 1.2 1.2 2.1 3.9 5.3 6.4No 98.8 98.8 97.9 96.1 94.7 93.6Total 100.0 100.0 100.0 100.0 100.0 100.0
Sedative UseYes 0.5 0.6 0.9 1.1 1.2 1.1No 99.5 99.4 99.1 98.9 98.8 98.9Total 100.0 100.0 100.0 100.0 100.0 100.0
Tranquilizer UseYes 0.6 0.6 1.2 3.3 4.4 6.2No 99.4 99.6 98.8 96.7 95.6 93.8Total 100.0 100.0 100.0 100.0 100.0 100.0
Hypothesis 2
Table 4 displays results from the second hypothesis, which tested for a relationship
between race and prescription drug abuse among adolescents. Originally the race variable was
coded into seven categories (Table 1); however when a Chi-square analysis was performed on the
variable there were several cells that had expected counts less than 5. To remedy this problem, the
variable was recoded and the categories were collapsed into 4 categories including White, Black,
Hispanic, and Other. A Chi-square test of independence was conducted on the new recoded race
variable to determine if a relationship existed between the independent and dependent variable.
The Chi-square test of independence indicated a significant relationship between race and
prescription drug abuse, with the exception of sedatives. The null hypothesis of no relationship was
rejected for pain relievers, stimulants, and tranquilizers, but could not be rejected for the use of
sedatives. The relationships seen in the Chi-square analyses between race and the use of pain
relievers (x2= 15.938, p = .001), tranquilizers (x2= 58.819, p = .000), and stimulants (x2= 49.112, p
40
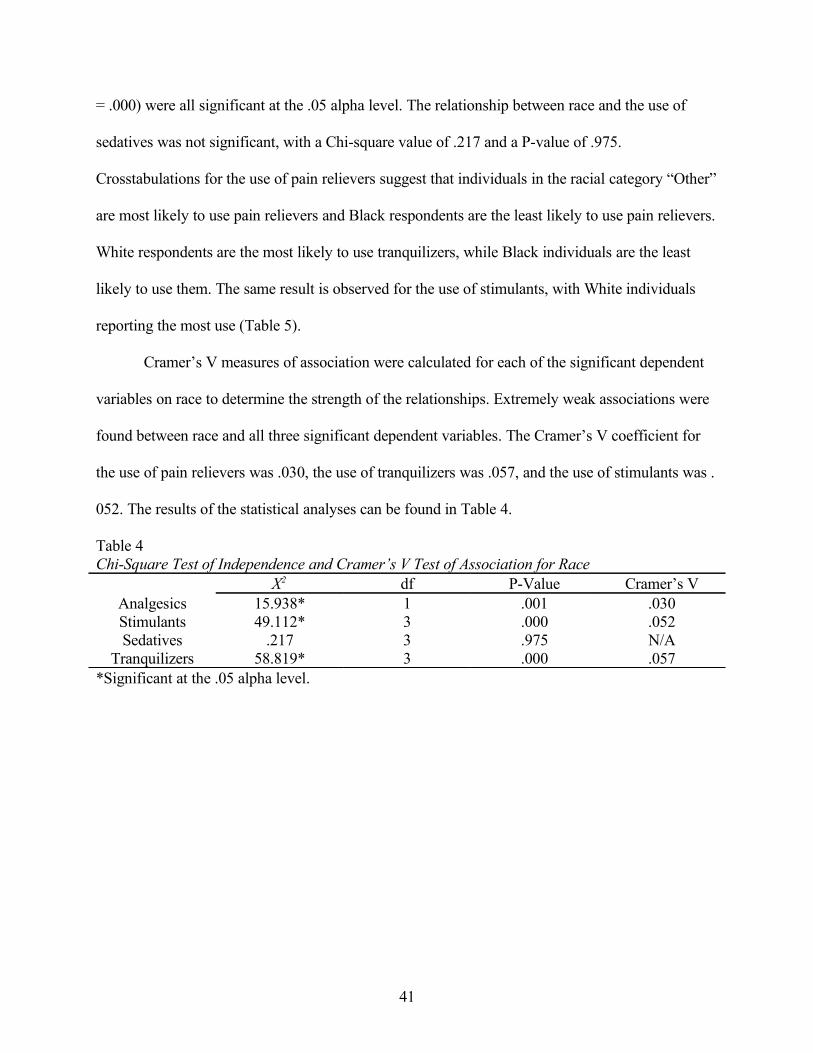
= .000) were all significant at the .05 alpha level. The relationship between race and the use of
sedatives was not significant, with a Chi-square value of .217 and a P-value of .975.
Crosstabulations for the use of pain relievers suggest that individuals in the racial category “Other”
are most likely to use pain relievers and Black respondents are the least likely to use pain relievers.
White respondents are the most likely to use tranquilizers, while Black individuals are the least
likely to use them. The same result is observed for the use of stimulants, with White individuals
reporting the most use (Table 5).
Cramer’s V measures of association were calculated for each of the significant dependent
variables on race to determine the strength of the relationships. Extremely weak associations were
found between race and all three significant dependent variables. The Cramer’s V coefficient for
the use of pain relievers was .030, the use of tranquilizers was .057, and the use of stimulants was .
052. The results of the statistical analyses can be found in Table 4.
Table 4Chi-Square Test of Independence and Cramer’s V Test of Association for Race
X2 df P-Value Cramer’s VAnalgesics 15.938* 1 .001 .030Stimulants 49.112* 3 .000 .052Sedatives .217 3 .975 N/A
Tranquilizers 58.819* 3 .000 .057*Significant at the .05 alpha level.
41
Table 5Crosstabulation for Prescription Drug Use and Race (Percentage)
RaceWhite Black Hispanic Other
Pain Reliever UseYes 10.8 8.6 9.9 12.1No 89.2 91.4 90.1 87.9Total 100.0 100.0 100.0 100.0
Stimulant UseYes 4.0 1.5 2.6 3.6No 96.0 98.5 97.4 96.4Total 100.0 100.0 100.0 100.0
Sedative UseYes 0.9 0.8 0.9 1.0No 99.1 99.2 99.1 99.0Total 100.0 100.0 100.0 100.0
Tranquilizer UseYes 3.4 0.8 2.2 2.8No 96.6 99.2 97.8 97.2Total 100.0 100.0 100.0 100.0
Hypothesis 3
The third hypothesis in this study tested for a relationship between gender and prescription
drug abuse among adolescents. The null hypothesis of no relationship between gender and
prescription drug abuse is rejected with the exception of the use of pain relievers. The chi-square
test of independence indicated that there was a significant relationship between gender and use of
tranquilizers (x2=9.374, p = .002), sedatives (x2= 6.430, p= .011), and stimulants (x2= 19.223, p = .
000). However a significant relationship did not exist between pain relievers (x2= 3.230, p = .072)
at the .05 alpha level. The crosstabulations for the three significant tests reveal that females are
more likely than males to use tranquilizers, sedatives, and stimulants. The crosstabulation table for
pain relievers indicates that the use of pain relievers is almost equally distributed among males and
females (Table 7).
The Phi statistic was generated to determine the strength of the significant relationships
between gender and the use of tranquilizers, sedatives, and stimulants. All three tests revealed
42

negative relationships, which indicated that females were more likely to use the prescription drugs
than males. However, it must be noted that the strength of the associations between gender and use
of stimulants (Phi = .032), sedatives (Phi = .019), and tranquilizers (Phi = .023) were all extremely
weak associations. The results for the Chi-square analyses and the measures of association are
displayed in Table 6.
Table 6 Chi-square Test of Independence and Phi Test of Association for Gender
X2 df P-Value PhiAnalgesics 3.230 1 .072 N/AStimulants 19.223* 1 .000 .032Sedatives 6.430* 1 .011 .019
Tranquilizers 9.374* 1 .002 .023* Significant at the .05 alpha level.
Table 7Crosstabulation for Prescription Drug Use and Gender (Percentage)
GenderMales Females
Pain Reliever UseYes 10.1 10.9No 89.9 89.1Total 100.0 100.0
Stimulant UseYes 2.8 4.0No 97.2 96.0Total 100.0 100.0
Sedative UseYes 0.7 1.1No 99.3 98.9Total 100.0 100.0
Tranquilizer UseYes 2.4 3.1No 97.6 96.9Total 100.0 100.0
43

Hypothesis 4
Table 8 displays the results from the Chi-square analyses for the hypothesis stating that an
individual’s overall health will share a relationship with prescription drug abuse. The Chi-square
test of independence for the four dependent variables indicated that one cell (10%) in each test had
expected counts less than 5. For this reason, the Pearson Chi-square analyses must be interpreted
with caution. The Chi-square tests were significant for pain relievers (x2= 132.50, p = .000),
stimulants (x2= 144.00, p = .000), sedatives (x2= 36.157, p = .000), and tranquilizers (x2= 95.503, p
= .000). Because the data used for these analyses included such a large sample size, the significant
results could be interpreted as a trend. However, with these results we can cautiously reject the null
hypothesis of no relationship between health and prescription drug abuse. The crosstabulations for
all four dependent variables suggest that individuals with poor health are more likely to use
prescription drugs than individuals in excellent health (Table 9).
In order to determine the strength of the relationships seen in the Chi-square analyses, the
Cramer’s V statistics was calculated. Weak associations were observed among all four dependent
variables with health. The largest association was seen between health and stimulant use with a
Cramer’s V statistic of .089, and the weakest between health and sedative use with a Cramer’s V
statistics of .044. However, as previously noted, these results should be interpreted with caution.
44

Table 8Chi-square Test of Independence and Cramer’s V Test of Association for Health
X2 df P-Value Cramer’s VAnalgesics 132.50a* 4 .000 .085Stimulants 144.00a* 4 .000 .089Sedatives 36.157a* 4 .000 .044
Tranquilizers 95.503a* 4 .000 .072a 1 cell (10%) had expected counts less than 5. *Significant at the .05 alpha level.
Table 9Crosstabulation for Prescription Drug Use and Health (Percentage)
Overall HealthExcellent Very Good Good Fair Poor
Pain Reliever UseYes 7.6 10.3 13.9 16.9 21.9No 92.4 89.7 86.1 83.1 78.1Total 100.0 100.0 100.0 100.0 100.0
Stimulant UseYes 1.8 3.3 5.2 8.0 15.6No 98.2 96.7 94.8 92.0 84.4Total 100.0 100.0 100.0 100.0 100.0
Sedative UseYes 0.5 0.9 1.3 2.1 6.2No 99.5 99.1 98.7 97.9 93.8Total 100.0 100.0 100.0 100.0 100.0
Tranquilizer UseYes 1.6 2.6 4.4 6.1 6.2No 98.4 97.4 95.6 93.9 93.8Total 100.0 100.0 100.0 100.0 100.0
Hypothesis 5
The Chi-square test of independence seen in Table 10 presents results from the analyses to
test the hypothesis stating that there is a relationship between school enrollment and prescription
drug abuse among adolescents. The null hypothesis of no relationship between school enrollment
and prescription drug abuse is rejected based on the Chi-square tests of independence. The Chi-
square analysis testing for a relationship between school enrollment and the use of pain relievers
was significant with a Chi-square value of 98.557 and a P-value of .000. The relationship between
school enrollment and the use of stimulants was also significant with a Chi-square value of 103.90
45

and a P-value of .000. Significance was also seen in the relationship between school enrollment
and tranquilizer use with a Chi-square value of 132.00 and a P-value of .000. For the relationship
between school enrollment and the use of sedatives, the Pearson Chi-square statistics could not be
interpreted because 1 cell (25%) had expected counts less than 5. For this reason, the Continuity
Correction statistic was interpreted and was found to be significant with a value of 16.832 and a P-
value of .000. Crosstabulations for the four dependent variables indicate that individuals who are
not enrolled in school are more likely than those who are enrolled in school to use prescription
drugs (Table 11).
Another statistical test was performed to determine the strength of the relationships that
were found to be significant with the Chi-square analyses. A Phi coefficient was calculated for all
four dependent variables with school enrollment. All relationships were seen to have weak
associations with school enrollment; pain relievers (Phi = .073), stimulants (Phi = .075),
tranquilizers (Phi = .085), and sedatives (Phi = .033). These results can be found in Table 10.
Table 10Chi-square Test of Independence and Phi Test of Association for School Enrollment
X2 df P-Value PhiAnalgesics 98.557* 1 .000 .073Stimulants 103.90* 1 .000 .075Sedatives 16.832ab* 1 .000 .033
Tranquilizers 132.00* 1 .000 .085a 1 cell (25%) had expected counts less than 5.b Continuity Correction statistic reported and interpreted. * Significant at the .05 alpha level.
46

Table 11Crosstabulation for Prescription Drug Use and School Enrollment (Percentage)
School EnrollmentYes No
Pain Reliever UseYes 10.2 29.3No 89.8 70.7Total 100.0 100.0
Stimulant UseYes 3.2 14.8No 96.8 85.2Total 100.0 100.0
Sedative UseYes 0.9 3.5No 99.1 96.5Total 100.0 100.0
Tranquilizer UseYes 2.6 14.5No 97.4 85.5Total 100.0 100.0
Hypothesis 6
The sixth hypothesis tested in this study investigated the relationship between prescription
drug abuse and previous alcohol use among adolescents. The null hypothesis of no relationship
was rejected because significance was found across all four dependent variables in the Chi-square
test of independence. Previous alcohol use was found to have a significant relationship with the use
of pain relievers (x2= 128.20, p = .000), sedatives (x2= 76.377, p = .000), stimulants (x2= 537.30, p
= .000), and tranquilizers (x2= 522.00, p = .000) at the .05 alpha level. All four tests had one degree
of freedom. The crosstabulation tables for these analyses suggest that individuals who reported
previous alcohol use are more likely than individuals who do not use alcohol to use prescription
drugs. This contingency table is displayed in Table 13.
The Phi coefficient was calculated for all four dependent variables to determine the
strength of the relationships between previous alcohol use and prescription drug abuse. A moderate
association was found between prior alcohol use and the use of pain relievers (Phi = .265),
47
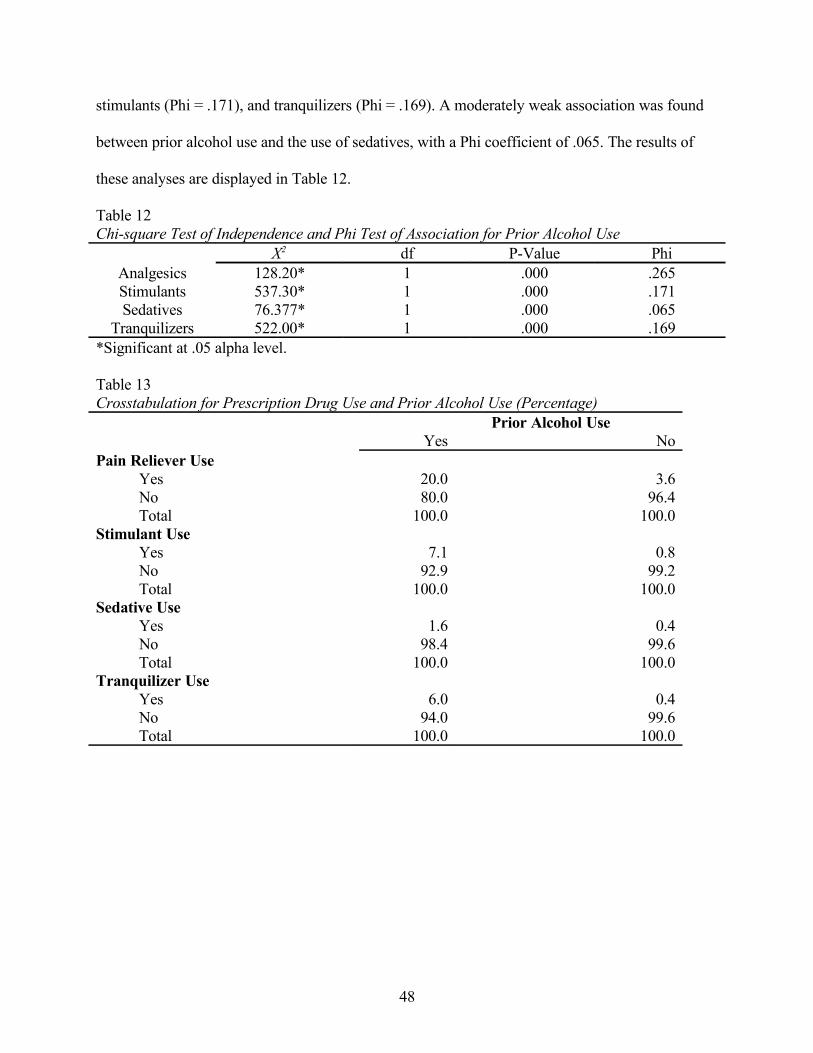
stimulants (Phi = .171), and tranquilizers (Phi = .169). A moderately weak association was found
between prior alcohol use and the use of sedatives, with a Phi coefficient of .065. The results of
these analyses are displayed in Table 12.
Table 12Chi-square Test of Independence and Phi Test of Association for Prior Alcohol Use
X2 df P-Value PhiAnalgesics 128.20* 1 .000 .265Stimulants 537.30* 1 .000 .171Sedatives 76.377* 1 .000 .065
Tranquilizers 522.00* 1 .000 .169*Significant at .05 alpha level.
Table 13Crosstabulation for Prescription Drug Use and Prior Alcohol Use (Percentage)
Prior Alcohol UseYes No
Pain Reliever UseYes 20.0 3.6No 80.0 96.4Total 100.0 100.0
Stimulant UseYes 7.1 0.8No 92.9 99.2Total 100.0 100.0
Sedative UseYes 1.6 0.4No 98.4 99.6Total 100.0 100.0
Tranquilizer UseYes 6.0 0.4No 94.0 99.6Total 100.0 100.0
48

Hypothesis 7
A Chi-square test of independence was conducted to test the hypothesis stating that there is
a relationship between the use of prescription drugs and mental health treatment among
adolescents. The null hypothesis of no relationship was rejected because significance was seen at
the .05 alpha level across all four dependent variables. The Chi-square analyses identified
significant relationships between mental health treatment and the use of pain relievers (x2= 108.50,
p = .000), stimulants (x2= 119.80, p = .000), sedatives (x2= 36.104, p = .000), and tranquilizers (x2=
99.908, p = .000). The degrees of freedom for these analyses were 1. As seen in Table 15, the
crosstabulations for this relationship suggest that individuals who report being treated for a mental
health condition are more likely to abuse prescription drugs than individuals who have not received
mental health treatment.
A test to measure the strength of the association between the dependent variables and the
independent variable was conducted. The Phi coefficient was calculated for the four dependent
variables. All four classes of drugs shared a weak relationship with mental health treatment. The
Phi coefficient for the association between mental health treatment and the use of pain relievers
was .077, the use of sedatives was .045, the use of stimulants was .081, and the use of tranquilizers
was .074 (Table 14).
Table 14Chi-square Test of Independence and Phi Test of Association for Mental Health Treatment
X2 df P-Value PhiAnalgesics 108.50* 1 .000 .077Stimulants 119.80* 1 .000 .081Sedatives 36.104* 1 .000 .045
Tranquilizers 99.908* 1 .000 .074*Significant at .05 alpha level.
49
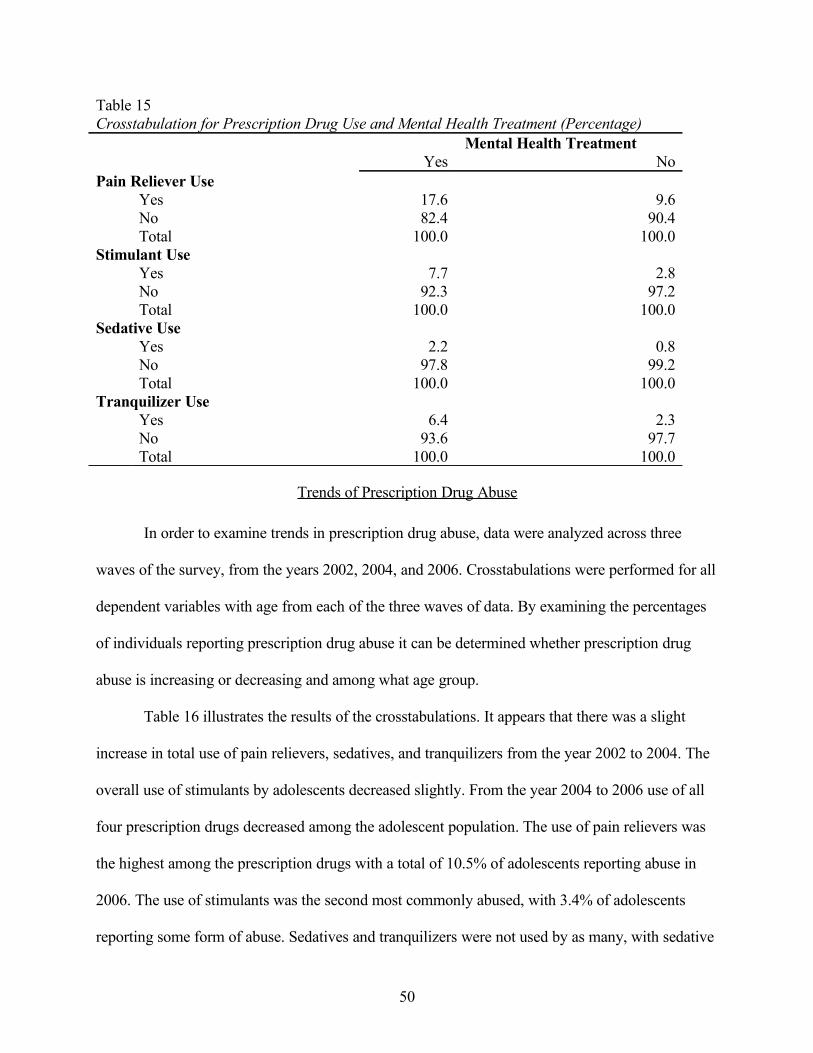
Table 15Crosstabulation for Prescription Drug Use and Mental Health Treatment (Percentage)
Mental Health TreatmentYes No
Pain Reliever UseYes 17.6 9.6No 82.4 90.4Total 100.0 100.0
Stimulant UseYes 7.7 2.8No 92.3 97.2Total 100.0 100.0
Sedative UseYes 2.2 0.8No 97.8 99.2Total 100.0 100.0
Tranquilizer UseYes 6.4 2.3No 93.6 97.7Total 100.0 100.0
Trends of Prescription Drug Abuse
In order to examine trends in prescription drug abuse, data were analyzed across three
waves of the survey, from the years 2002, 2004, and 2006. Crosstabulations were performed for all
dependent variables with age from each of the three waves of data. By examining the percentages
of individuals reporting prescription drug abuse it can be determined whether prescription drug
abuse is increasing or decreasing and among what age group.
Table 16 illustrates the results of the crosstabulations. It appears that there was a slight
increase in total use of pain relievers, sedatives, and tranquilizers from the year 2002 to 2004. The
overall use of stimulants by adolescents decreased slightly. From the year 2004 to 2006 use of all
four prescription drugs decreased among the adolescent population. The use of pain relievers was
the highest among the prescription drugs with a total of 10.5% of adolescents reporting abuse in
2006. The use of stimulants was the second most commonly abused, with 3.4% of adolescents
reporting some form of abuse. Sedatives and tranquilizers were not used by as many, with sedative
50

use reported by .09% and tranquilizer use reported by 2.8% of the population. This trend of a
decrease in use followed by a brief increase was seen among most of the categories, with a few
exceptions.
When examining the use of pain relievers, an increase was seen in use among individuals
12 years old between 2004 (3.8%) and 2006 (4.6%). This increase is inconsistent with the trend
seen for pain reliever use among the population of adolescents. In addition, the increase in the use
of tranquilizers was not identified among 14 and 15 year old respondents between 2002 and 2004.
In 2002, individuals 14 years of age reported 1.9% use and in 2004 reported 1.7% use.
Respondents 15 years old reported tranquilizer use at 3.8% in 2002 and 3.5% in 2004. Again, this
finding is inconsistent with the overall trend for the use of tranquilizers. An increase in the use of
stimulants was seen among 12-year-old individuals between 2004 (0.6%) and 2006 (1.2%). The
percentage of use among this age group nearly doubled in that 2-year period. Finally, a decrease
was seen in the use of sedatives among respondents 17 years old between 2002 (1.6%) and 2004
(1.2%). For individuals 14 years of age, sedative use remained consistent in the 6-year period at
0.9%. These findings are contradictory to the overall trend seen across the three waves of data for
adolescent prescription drug abuse.
51

Table 16Crosstabulation of Trends of Prescription Drug Abuse (Percentage)
Total Use Across All Ages2002 2004 2006
Pain Reliever UseYes 10.9 11.5 10.5No 89.1 88.5 89.5Total 100.0 100.0 100.0
Stimulant UseYes 4.4 3.9 3.4No 95.6 96.1 96.6Total 100.0 100.0 100.0
Sedative UseYes 0.9 1.0 0.9No 99.1 99.0 99.1Total 100.0 100.0 100.0
Tranquilizer UseYes 3.2 3.3 2.8No 96.8 96.7 97.2Total 100.0 100.0 100.0
Summary
Several of the hypotheses stated in Chapter 1 were supported by the previous statistical
analyses. There were only a few exceptions where the null hypothesis could not be rejected. Chi-
square analyses revealed relationships between prescription drug abuse and age, health, school
enrollment, prior alcohol use, and mental health treatment without any exceptions. The analyses
for race and gender provided results indicated significant relationships with three of the four
dependent variables.
52

CHAPTER 5
SUMMARY, CONCLUSIONS, AND IMPLICATIONS
The purpose of this study was to examine prescription drug abuse among adolescents and
identify characteristics of use, as well as patterns and trends of use. It was predicted that
prescription drug abuse among adolescents would share a significant relationship with age, gender,
race, overall health, prior alcohol use, school enrollment, and mental health treatment. The
direction and strength of these relationships were not predicted. The current researcher’s aim was
to try to identify characteristics of prescription drug users within the adolescent population.
The data used for this study were obtained from the Inter-university Consortium for
Political and Social Research (ICPSR). The Office of Applied Studies within the Substance Abuse
and Mental Health Services Administration collected the data. It was collected through the
National Survey on Drug Use and Health (NSDUH). The survey collected various pieces of
information regarding drug use, health, mental health, and demographic information. Three waves
of the survey were used for analysis in the current study. The years 2002, 2004, and 2006 were
used to distinguish characteristics of a prescription drug abuser and to identify trends of abuse.
Each sample contained a large number of respondents. The year 2002 included 17,709
respondents, the year 2004 had 18,294, and the year 2006 included 18,314 individuals.
Univariate and bivariate analyses were performed on the data. Chi-square analyses were
conducted to identify relationships between the independent and dependent variables. After
significant relationships were identified, Cramer’s V and Phi measures of association were used to
determine the strength of the relationship. Crosstabulation contingency tables were also generated
for the relationships between the independent and dependent variables to illustrate the direction of
the relationship.
53
Conclusions
Prescription drug abuse has been a rising problem in the United States over the past decade.
This research analyzed a 6-year period of data to identify trends and patterns of prescription drug
abuse from 2002 to 2006. The result that was anticipated was not seen among the adolescent
population. The expected increase in use of prescription drugs was seen between 2002 and 2004;
however, it appears that from the year 2004 to the year 2006 there was a decrease in the use of pain
relievers, stimulants, tranquilizers, and sedatives. It was also identified that there was an increase
in the use of stimulants among individuals 12 years of age. This could be a result of an increase in
the number of adolescents being diagnosed and treated for psychiatric conditions, such as
Attention-Deficit Hyperactivity Disorder. It is important to note however, that younger individuals
were still the least likely to use prescription drugs when compared to older adolescents.
It was predicted in the current study that age would share a relationship with prescription
drug abuse among the adolescent population. The findings in this research support that hypothesis,
which is consistent with the previous literature. The data demonstrated that as an individual’s age
increases so does the likelihood that the individual will abuse prescription drugs. The data also
suggested that the use of pain relievers was highest among all age groups within the adolescent
population. This finding is consistent with other research conducted on the popularity of
prescription pain relievers. These findings might suggest that as adolescents get older, they have
more opportunities to obtain and abuse prescription drugs. For example, older individuals earn
driving privileges, which gives them more freedom and privacy, and also typically have a later
curfew than younger adolescents.
Relationships between race and prescription drug abuse were also investigated in this
study. Race was found to have a significant relationship with the use of pain relievers, stimulants,
54

and tranquilizers, but not with the use of sedatives. The data suggested those individuals in the
categories White and Other are the most likely to use all four prescription drugs. Black individuals
were the least likely to abuse prescription stimulants. These findings are similar to those in
previous research, suggesting that the adolescent prescription drug abuser will most commonly be
Caucasian.
It was further predicted that gender would share a significant relationship with prescription
drug abuse among adolescents. A significant relationship was found between gender and all drugs
except for pain relievers. The data demonstrated that females are more likely to use prescription
drugs than males, with the exception of pain relievers. The distribution of use among females and
males for pain relievers is almost equal. Previous findings are supported by these data, indicating
that the use of prescription drugs is more prevalent among females. This finding could be a result
of an increase in female psychiatric patients. Females are typically diagnosed more often than
males with psychiatric disorders such as depression and anxiety and treated with psychoactive
prescription drugs like tranquilizers and sedatives. The absence of a relationship between gender
and pain relievers could be because pain relievers are the most widely abused prescription drug
among all adolescents.
It was also predicted that the health of an individual would share a relationship with
prescription drug abuse. The findings in this research should be interpreted cautiously as a result of
issues with sample size and expected counts in a Chi-square analysis. Nevertheless, it was evident
from the data that as an individual’s health declines, the use of prescription drugs increases.
Because of such a large sample size, this could be interpreted as a trend, yet the relationship still
exists. There is scarce research available which tests for a relationship between health and
prescription drug abuse among adolescents. These findings suggest that individuals in good health
55

are the least likely to abuse prescription drugs. This conclusion could be a result of the pop-a-pill
culture that was discussed in previous chapters. Society teaches people that there are medications
that can treat any ailment, so adolescents may be self-medicating a medical health issue with
prescription drugs.
It was hypothesized that school enrollment would share a significant relationship with
adolescent prescription drug abuse. A significant relationship was found to exist in this study. The
findings illustrate that individuals who are not enrolled in school are more likely to use
prescription drugs. This is consistent with general assumptions regarding the need for adolescents
to get an education and the need for positive social reinforcements. Prior research has seldom
addressed school enrollment as a contributor to prescription drug abuse; however, many studies
have investigated prescription drug abuse among middle and high school student populations so
school enrollment was a constant.
The sixth hypothesis predicted that prior alcohol use among adolescents would share a
relationship with prescription drug abuse. The hypothesis was supported by the analyses that
indicated individuals who reported previous alcohol use were more likely to abuse prescription
drugs. Numerous studies have investigated previous alcohol use as a contributor to prescription
drug abuse, and the findings of this study are consistent with the previous findings. Prior alcohol
use is a factor that influences prescription drug abuse among adolescents. It could be reasoned that
this relationship exists because alcohol is considered a gateway drug and leads to additional drug
abuse. Peer influences might also address this relationship. If adolescents feel pressure to use
alcohol and succumb to that pressure, it stands to reason that the same would also occur with
prescription drugs. The relationship between prior alcohol use and prescription drug abuse might
56

also be explained by adolescents’ attitudes towards alcohol and prescription medications as being
legal substances, therefore acceptable to use.
Finally, it was predicted that mental health treatment and prescription drug abuse among
adolescents would share a significant relationship. The data support this hypothesis across all four
dependent variables. The analyses found that individuals who reported receiving mental health
treatment were more likely to abuse prescription drugs than individuals who did not receive mental
health treatment. These findings are supportive of previous literature on mental health treatment
and the abuse of prescription drugs. The relationship between mental health treatment and
prescription drugs could be a result of the attitudes shown by mental health professionals. Several
medications are often used to try to treat mental health conditions. This could create the
misconception amongst teenagers that it is perfectly normal and acceptable to try a variety of
prescription medications until the desired effect is achieved. This result is consistent with the self-
medication theory and further reinforces the medicinal culture.
Implications for Further Research
Limitations
Although the current study consisted of a nationally representative sample, it is not without
limitations. The data used for statistical analyses in this research were self-reported information
obtained through a survey. The researcher must rely on the assumption that the information
obtained was accurate and truthful. Some of the questions within the survey were sensitive in
nature and responses may not be accurate. Another limitation of this study lies within the purpose
of this study. The purpose was only to identify characteristics of adolescent prescription drug
abusers. Motivations behind prescription drug abuse in the adolescent population cannot be
inferred with the current research. Speculations can only be made regarding the reasoning behind
57
the behavior. Future research could avoid the need for speculation by including survey questions
about motivations for use and attitudes regarding prescription drugs.
Recommendations
Future research should be conducted to examine adolescents’ attitudes towards prescription
drugs and motivations for using prescription drugs. Relationships between race and the use of
prescription drugs should also be investigated more thoroughly. In addition, the results of this
study suggest a decline in prescription drug abuse from 2004 to 2006. This decline should be
further investigated to determine the source of the decrease in prescription drug abuse. Research
should also be conducted to evaluate the efficacy of existing antidrug abuse programs for
preventing prescription drug abuse.
The problem of prescription drug abuse among adolescents could also be resolved with the
creation of additional antiprescription drug programs. These programs could include informational
seminars on the effects of abusable prescription drugs and educational information available
dealing with the identification of certain drugs. Ideally this type of program should be provided for
adolescents, adults, and parents. This type of program could be customized to deal with pharm
parties and attempt to reduce their allure.
Antidrug laws should also undergo a reform, holding parents and adults responsible if a
minor obtains the prescription drugs from the home. If information were provided to adults on
effective means of keeping harmful prescription medications away from children and these
suggestions were ignored, the adults should be responsible if the child obtains prescription
medications from the home and abuses them. This type of carelessness could easily be viewed as
another form of parental negligence. Adults and parents may be more prone to guard or dispose of
58

abusable prescription drugs if they could be held legally responsible if those drugs fell into the
hands of minors.
The combination of further research on adolescent prescription drug abuse and the
implementation of any of these policies or programs could possibly be an effective tool for
combating adolescent prescription drug abuse. Antidrug programs are already in place to warn
children about illicit drugs such as marijuana, cocaine, and heroin. The drugs that should be the
focus of concern now are the drugs that are being obtained from household medicine cabinets.
59

REFERENCES
Boyd, C.J., McCabe, S.E., Cranford, J.A., & Young, A. (2006a). Adolescents’ motivations to
abuse prescription medications. Pediatrics, 118, 2472-2480.
Boyd, C.J., McCabe, S.E., & Teter, C.J. (2006b). Medical and nonmedical use of prescription pain
medication by youth in a Detroit-area public school district. Drug and Alcohol
Dependence, 81, 37-45.
Cohen, J. (1988). Statistical power analysis for the behavioral sciences (2nd ed.). Hillsdale, NJ:
Erlbaum.
Federal Bureau of Investigation. (2004). Crime in the United States, 2004: Uniform Crime Reports.
Washington, DC: U.S. Government Printing Office.
Friedman, R.A. (2006). The changing face of teenage drug abuse – the trend toward prescription
drugs. New England Journal of Medicine, 354, 1448-1450.
Hansell, S. & White, H.R. (1991). Adolescent drug use, psychological distress, and physical
symptoms. Journal of Health and Social Behavior, 32, 288-301.
Harmon, A. (2005, November 16). Young, assured and playing pharmacist to friends. New York
Times. Retrieved on February 12, 2009, from
http://www.nytimes.com/2005/11/16/health/16patient.html
Harris, K.M., & Edlund, M.J. (2005). Self-medication of mental health problems: New evidence
from a national survey. Health Services Research, 40, 117-134.
Inciardi, J.A. (2008). The war on drugs IV: The continuing saga of the mysteries and miseries of
intoxication, addiction, crime, and public policy (4th ed.). Boston: Allyn and Bacon.
60

Leinwand, D. (2006, June 12). Prescription drugs find place in teen culture. USA Today. Retrieved
November 11, 2008, from http://www.usatoday.com/news/health/2006-06-12-teens-pharm-
drugs_x.htm
Lyman, M.D., & Potter, G.W. (2007). Drug in society: Causes, concepts, and control (5th ed.).
Cincinnati, OH: Anderson.
McCabe, S.E., Boyd, C.J., & Teter, C.J. (2005). Illicit use of opioid analgesics by high school
seniors. Journal of Substance Abuse Treatment, 28, 225-230.
McCabe, S.E., Boyd, C.J., & Teter, C.J. (2006a). Medical use, illicit use, and diversion of abusable
prescription drugs. Journal of American College Health, 54, 269-278.
McCabe, S.E., Cranford, J.A., & Boyd, C.J. (2006b). The relationship between past-year drinking
behaviors and nonmedical use of prescription drugs: Prevalence and co-occurrence in a
national sample. Drug and Alcohol Dependence, 84, 281-288.
Meadows, M. (2001). Prescription drug use and abuse. FDA Consumer Magazine, September-
October 2001. Retrieved January 21, 2009, from
http://www.fda.gov/fdac/features/2001/501_drug.html
Moeser, V. (1994). America’s first cocaine epidemic: History of cocaine use. St. Louis Journalism
Review, 23(163), 18-19.
The National Center on Addiction and Substance Abuse at Columbia University (CASA). (2005).
Under the counter: The diversion and abuse of controlled prescription drugs in the U.S.,
June 2005. New York: Author.
The National Center on Addiction and Substance Abuse (CASA). (2007). “You’ve got drugs!” IV:
Prescription drug pushers on the Internet, May 2007. New York: Author.
61
Partnership for a Drug-Free America. (2005). The Partnership Attitude Tracking Study (PATS).
Retrieved November 11, 2008, from http://www.drugfree.org/Files/Full_Teen_Report
Partnership for a Drug-Free America. (2006, May 16). Generation rx: National study confirms
abuse of prescription and over-the-counter drugs. Retrieved November 11, 2008, from
http://www.drugfree.org/
Saul, S. (2008, October 22). In sour economy, some scale back on medications. New York Times.
Retrieved November, 11, 2008, from
http://www.nytimes.com/2008/10/22/business/22drug.html
Saylor, B., Fair, M., Deike-Sims, S., Johnson, K., Ogilvie, K., & Collins, D. (2007). The use of
harmful legal products among pre-adolescent Alaskan students. International Journal of
Circumpolar Health, 66, 425-436.
U.S. Dept. of Health and Human Services, Substance Abuse and Mental Health Services
Administration, Office of Applied Studies. NATIONAL SURVEY ON DRUG USE AND
HEALTH, 2002 [Computer file]. ICPSR03903-v3. Research Triangle Park, NC: Research
Triangle Institute [producer], 2003. Ann Arbor, MI: Inter-university Consortium for
Political and Social Research [distributor], 2006-10-26. doi:10.3886/ICPSR03903
U.S. Dept. of Health and Human Services, Substance Abuse and Mental Health Services
Administration, Office of Applied Studies. NATIONAL SURVEY ON DRUG USE AND
HEALTH, 2004 [Computer file]. ICPSR04373-v1. Research Triangle Park, NC: Research
Triangle Institute [producer], 2005. Ann Arbor, MI: Inter-university Consortium for
Political and Social Research [distributor], 2006-05-12. doi:10.3886/ICPSR04373
U.S. Dept. of Health and Human Services, Substance Abuse and Mental Health Services
Administration, Office of Applied Studies. NATIONAL SURVEY ON DRUG USE AND
62
HEALTH, 2006 [Computer file]. ICPSR21240-v3. Research Triangle Park, NC: Research
Triangle Institute [producer], 2007. Ann Arbor, MI: Inter-university Consortium for
Political and Social Research [distributor], 2008-01-09. doi:10.3886/ICPSR21240
U.S. Department of Justice. (2007). Sourcebook of Criminal Justice Statistics Online. Retrieved
January 21, 2009, from http://www.ojp.usdoj.gov/bjs/
Wethal, T. (2008). Idle hands: What factors have lead adolescents into a pharm frenzy? Law
Enforcement Technology, p. 86-93. Retrieved on November 21, 2008, from
http://www.officer.com
63
VITA
MAGGIE MARIE ORENDER
Personal Information: Date of Birth: September 14, 1985
Place of Birth: Burbank, California
Marital Status: Single
Educational Information: Public Schools, Kingsport, Tennessee
East Tennessee State University, Johnson City, TN
B.S. Criminal Justice/Criminology May 2007
East Tennessee State University, Johnson City, TN
M.A. Criminal Justice/Criminology May 2009
Professional Experience: Graduate Assistant, East Tennessee State University
Department of Criminal Justice/Criminology 2007 – 2009
Honors: East Tennessee State University
Dean’s List, 2005 – 2007
Cum Laude, 2007
Outstanding Graduate Student Award, 2009
64