AN EVIDENCE-BASED APPROACH TO IMPROVING THE …
74
AN EVIDENCE-BASED APPROACH TO IMPROVING THE EFFECTIVENESS OF CONSERVATION AND SUSTAINABLE DEVELOPMENT (CSD) PROJECTS IN MADRE DE DIOS, PERU By TANIA ROMERO BAUTISTA
Transcript of AN EVIDENCE-BASED APPROACH TO IMPROVING THE …

AN EVIDENCE-BASED APPROACH TO IMPROVING THE EFFECTIVENESS OF
CONSERVATION AND SUSTAINABLE DEVELOPMENT (CSD) PROJECTS IN MADRE
DE DIOS, PERU
By
TANIA ROMERO BAUTISTA

A FIELD PRACTICUM REPORT PRESENTED TO THE GRADUATE SCHOOL OF THE
UNIVERSITY OF FLORIDA IN PARTIAL FULFILLMENT
OF THE REQUIREMENTS FOR THE DEGREE OF MASTER OF SUSTAINABLE
DEVELOPMENT PRACTICE
UNIVERSITY OF FLORIDA
2018
© 2018 Tania Romero Bautista

“To my parents, the Madre de Dios region in Peru and everyone who enthusiastically
collaborated on this research.”

4
ACKNOWLEDGMENTS
I thank the Puerto Lucerna community members, the Center for Latin American Studies,
the Master of Development Practice Program, the Tropical and Conservation Development
Program, Alliance for Research and Conservation in the Amazon, Wild Forests and Fauna, the
Fulbright Scholarship Program, and Patrick Campbell.

5
TABLE OF CONTENTS
page
ACKNOWLEDGMENTS ...............................................................................................................4
LIST OF TABLES ...........................................................................................................................7
LIST OF FIGURES .........................................................................................................................8
INTRODUCTION .........................................................................................................................10
RESEARCH QUESTIONS AND OBJECTIVES .........................................................................13
Objective 1 (OBJ1) .................................................................................................................13 Research Question 1 (RQ1): ............................................................................................13
Research Question 2 (RQ2):............................................................................................13 Objective 2 (OBJ2) .................................................................................................................13
Research Question 3 (RQ3) .............................................................................................13
Objective 3 (OBJ3): ................................................................................................................13 Research Question 4 (RQ4) .............................................................................................14
Research Question 5 (RQ5) .............................................................................................14
METHODS ....................................................................................................................................17
Objective 1 (OBJ1) .................................................................................................................17
Objective 2 (OBJ2) .................................................................................................................17
Analysis of the Peruvian Agency for International Cooperation (APCI) Project
Database .......................................................................................................................18 Objective 3 (OBJ3): ................................................................................................................20
Case Study in the Puerto Lucerna Community ...............................................................21 Study site ..................................................................................................................21
Host organization and collaborators .........................................................................23 Lucerna socioeconomic questionnaire .....................................................................24
Workshops in the Puerto Lucerna community .........................................................24 Ignorance condition scenario workshop ...................................................................24 Values survey ...........................................................................................................26 Knowledge condition scenario workshop ................................................................27
Discrete choice experiment ......................................................................................27
ANALYSIS AND RESULTS ........................................................................................................31
OBJECTIVE 1: .......................................................................................................................31
RESEARCH QUESTION 1: ...........................................................................................31 RESEARCH QUESTION 2 ............................................................................................32
OBJECTIVE 2 ........................................................................................................................33 RESEARCH QUESTION 3 ............................................................................................33
Examination of structure of APCI project database reporting system .....................35

6
CSD Project Typology .............................................................................................37
Effectiveness Scoring of CSD projects ....................................................................38
OBJECTIVE 3 ........................................................................................................................38 RESEARCH QUESTION 4: ...........................................................................................38
Value survey .............................................................................................................39 Discrete Choice Experiment (DCE) .........................................................................39
RESEARCH QUESTION 5. ...........................................................................................44
DISCUSSION ................................................................................................................................47
CONCLUSION ..............................................................................................................................48
APPENDICES
COMMUNITY QUESTIONNAIRE (SPANISH VERSION) ...............................................49 IGNORANCE (NON-EA) CONDITION SCENARIO WORKSHOP ..................................59 VALUE SURVEY (SPANISH VERSION) ...........................................................................63 PHOTOS OF PUERTO LUCERNA COMMUNITY ............................................................70
LIST OF REFERENCES ...............................................................................................................73

7
LIST OF TABLES
Table page
1. Example attributes of set of project choices A and B in discrete choice experiment ...............29
2. Hypotheses formulated for the discrete choice experiment the Puerto Lucerna community ....30
3. CSD Project Typology ...............................................................................................................37
4. Top 3 rated values from Value Survey in Puerto Lucerna community ....................................39
5. Participant project choices in Discrete Choice Experiment .......................................................40
6. Rate of selection per attribute category and quality combination .............................................40
7. Correlation of attributes of choice ............................................................................................42
8. Profile of Puerto Lucerna community .......................................................................................44

8
LIST OF FIGURES
Figure page
1. Role of EA in Project development and evaluation ...................................................................12
2. Field Practicum Conceptual Framework ..................................................................................15
3. Field Practicum Contextual Framework ....................................................................................16
4. Diagram of methods for OBJ.3: Determine to what extent the mechanisms for measuring
effectiveness influence the development decisions of local communities .........................21
5: Satellite image of the Lucerna community, Las Piedras District, 2017 ....................................23
6. Roadmap of institutional infrastructure for measuring effectiveness in CSD projects ............35
7: Gaps in infrastructure for Measuring the Effectiveness of CSD Projects in Peru (with
weaknesses and gaps highlighted with broken chains) ......................................................36
8. Ignorance condition versus Knowledge condition in the Lucerna community, 2017 ...............41
9. Perceptions of Economic Activity in Puerto Lucerna Community ...........................................45
10. Community Perceptions of Effectiveness Rating of Government ...........................................45
11. Community members Occupations ..........................................................................................46
12. Me arriving to the Puerto Lucerna community ........................................................................70
13. The president of agriculture in Puerto Lucerna and me participating in a icebreaker game ...70
14. Community members from Puerto Lucerna participating in the Discrete Choice
Experiment (DCE) .............................................................................................................71
15. Community members presenting their ideas during the Ignorance Condition Scenario
Workshop ...........................................................................................................................71
16. All the participants from the Puerto Lucerna community in the Knowledge Condition
Scenario Workshop ............................................................................................................72
17. Me writing a formal invitation to the community members for the Knowledge Condition
Scenario Workshop ............................................................................................................72

9
Abstract of Field Practicum Report Presented to the Graduate School
of the University of Florida in Partial Fulfillment of the
Requirements for the Degree of Master of Sustainable Development Practice
AN EVIDENCE-BASED APPROACH TO IMPROVING THE EFFECTIVENESS OF
CONSERVATION AND SUSTAINABLE DEVELOPMENT (CSD) PROJECTS IN MADRE
DE DIOS, PERU
By
Tania Romero Bautista
April 2018
Chair: Angélica Almeyda Zambrano
Member: Stephen Perz
Member: Robert Walker
Major: Liberal Arts and Science
Peru is one of the Latin American countries with fastest economic growth during the past
ten years. However, Peruvians living in rural areas, such as the Andes and Amazonia, have not
benefitted as significantly from this growth. The Madre de Dios region in the Southern Peruvian
Amazon is the “Capital of Peru’s Biodiversity” and the home of several indigenous groups,
including people living in voluntary isolation. Despite its cultural and environmental importance,
this region faces serious problems such as poverty and deforestation. The various entities
working to address these problems, however, have struggled to identify the most effective
approach for making progress. This difficulty is compounded by the fact that, in many cases, the
data that would be necessary to make these determinations is inadequate or lacking entirely. For
this reason, the need for a more evidence-intensive approach to addressing these problems has
increased. Effective Altruism (EA) as a framework elaborates on evidence and the need to
identify the relevant measures of value. This research aims, first, to investigate what
“effectiveness” means in the Conservation and Sustainable Development (CSD) context, and
second, how this value may be measured and tracked through the course of a CSD project within
the Peruvian context.

10
INTRODUCTION
World leaders are increasingly recognizing the urgency and importance of conservation
and development issues. With more attention being given to these subjects, and more issues to be
addressed, there are higher levels of scrutiny on how governmental resources are being allocated,
requiring that those in charge be more rigorous in demonstrating their effectiveness (Pullin and
Knight, 2008). Likewise, independent donors and policy-makers are becoming more compelled
to invest in projects that have been proven effective (Ferraro and Pattanayak, 2006). Some
development practitioners have answered this need by developing a more empirical, data-driven
approach.
The use of evidence-based approaches in development and later in conservation started in
the 20 century as part of the effort of organizations, “think- tanks”, university researchers and
other stakeholders when trying to influence government decisions (Davies, Nutley, & Smith,
2000).These organizations and institutions had as a key tool the presentation of “evidence”
(Courtenay Botteril, 2017)). According to the Oxford Research Encyclopedia Evidence Based
Policy Making is a movement created specifically to rescue policy process from politics,
meaning the use of research-based evidence in policy choice (Courtenay Botteril, 2017) . An
example of an evidence-based approach that has been gaining traction in the philanthropic arena
is Effective Altruism.
Effective Altruism (EA) is a philosophy and methodology for how to use empirical
evidence and careful reasoning to achieve the most good possible (MacAskill, 2015). William
MacAskill, co-founder and President of the Centre for Effective Altruism (CEA), explains,
“Effective altruism is about answering one simple question: how can we use our resources to

11
help others the most? Rather than just doing what feels right, we use evidence and careful
analysis to find the very best causes to work on” (Effective Altruism, 2017).
The present research aims to apply the EA framework to improving the effectiveness of
Conservation and Sustainable Development (CSD) projects in Madre de Dios, Peru. In order to
compile as much information as required and to obtain sufficient evidence to satisfy the objective
proposed, I conducted a literature review of the definition of effectiveness and the metrics used
to measure effectiveness in the CSD context. The second part of this methodology included a
case study in the community of Puerto Lucerna in Madre de Dios to gather information about
their development priorities and the process by which they make development decisions. Within
the case study, I conducted two workshops designed to understand how community decision-
making changes as a function of how much information (evidence) the community is provided
with respect to the outcomes of their various options. First, I used a Value Survey in order to
gather a first perception of the values of the community members. The results from the Value
survey were part of the design of a Discrete Choice Experiment (DCE), a method well known in
the economic field to determine customer preference. I used the DCE in this study to determine
local community preferences regarding CSD projects. Finally, I used community questionnaire
to determine the demographic and socioeconomic profile of the community.
Figure 1 below illustrates how the EA framework should be used by project managers,
donors, and organizations through the various stages of a project development (i.e., after an
appropriate cause and intervention have been identified). As the figure also illustrates, the
activities encompassed by the Field Practicum component of this research focused most directly
on the application of the EA framework to the initial planning and development stages of this
process.

12
Figure 1. Role of EA in Project development and evaluation

13
RESEARCH QUESTIONS AND OBJECTIVES
The central question I set out to answer in this study was, “Are current conservation and
sustainable development (CSD) projects in Madre de Dios effective?” In order to address this
question as comprehensively as possible, the study was divided into three narrower objectives,
each encompassing one or more component research questions.
Objective 1 (OBJ1)
Determine what effectiveness means in the CSD context and how it is measured
Research Question 1 (RQ1):
What does effectiveness mean in the context of conservation and sustainable
development?
Research Question 2 (RQ2):
How do you measure effectiveness in the context of conservation and sustainable
development?
Objective 2 (OBJ2)
Conduct an assessment of the current mechanisms for measuring the effectiveness of
CSD projects in Madre de Dios, Peru
Research Question 3 (RQ3)
What is the state of current institutional and policy mechanisms for measuring the
effectiveness of CSD projects in Madre de Dios, Peru?
Objective 3 (OBJ3):
Determine to what extent the mechanisms for measuring effectiveness influence the
development decisions of local communities

14
Research Question 4 (RQ4)
How do community members weigh different economic, social, and environmental
factors when they consider alternative projects for implementation?
Research Question 5 (RQ5)
What other factors may be serving to influence how community members weigh these
economic, social, and environmental factors when they consider alternative projects for
implementation?
Figure 2 shows the conceptual framework that served as base for this study.
Consequentialist ethics are described in orange and it is the main source for Effective Altruism
(EA) as a framework. Components included like high quality evidence, depth research, and
careful reasoning are shared with the other theoretical paradigms and represented in the box in
orange and turquoise. Likewise, the EA’s ultimate goal: How to do the most good in the world is
described at the end of the sequence in orange. Conservation and development in the other sides
of the figure are represented in green and blue. Evidence-based policy plays a role as a common
framework for conservation and development. To represent this shared quality of evidence-based
policy, the color used for it is turquoise which is a combination of colors blue and green.
Consequently, the EA framework exemplifies a tool in conservation and development by having
as essential components, high quality evidence, depth research, and careful reasoning. These

15
components serve as pillars for effectiveness of CSD projects.
Figure 2. Field Practicum Conceptual Framework
Figure 3 illustrates the contextual framework of this research. At the top in the light green
box it is the field practicum itself. The broad question follows this “Are current CSD projects in
Madre de Dios effective?”. This broad question is divided into three specific objectives detailed
as OBJ1, OBJ2, and OBJ3 guiding the need for using an effectiveness framework, the same that
it is the Effective Altruism framework. Base on the objectives and the framework, I applied the
different methods (e.g. OBJ1 > Literature review). Lastly, there is described most relevant
information obtained from the use of the methods (e.g. Literature review > Definition of
effectiveness according to EA).

16
Figure 3. Field Practicum Contextual Framework

17
METHODS
In this section, I explain the methods employed for each of the three research objectives
encompassed by this study.
Objective 1 (OBJ1)
Determine what effectiveness means in the CSD context and how it is measured
To determine a definition of effectiveness and appropriate metrics for measuring
effectiveness in the CSD context, I conducted a literature review that included the following
guidelines:
1. Areas of research: Conservation, development, conservation-development, sustainable
development
2. Search sites: Journal databases, Google Scholar, University of Florida library databases,
National Peruvian reports, Peruvian government official documents
3. Common words and phrases to search: “What is effectiveness in conservation projects,”
“What is effectiveness in development projects,” “Effectiveness criteria and metrics to
measure effectiveness,” “project effectiveness and conservation,” “how to measure
effectiveness for CSD projects,” “metrics used to measure effectiveness,” and
“Evaluation of conservation and development projects”
4. Articles inclusion criteria: Relevant to topic, peer reviewed, less than five years old
articles preferable, quantitative, and qualitative articles accepted
Objective 2 (OBJ2)
Conduct an assessment of the current mechanisms for measuring the effectiveness of
CSD projects in Madre de Dios, Peru
In order to evaluate the state of policy and institutional mechanisms for measuring the
effectiveness of CSD projects in Peru and also in Madre de Dios, I conducted an analysis of one
of the mechanisms from the Peruvian government which has as one of its functions to evaluate
and auditing all the projects in Peru that are financed by international cooperation funds. This
mechanism was the Peruvian Agency for International Cooperation (APCI).

18
Analysis of the Peruvian Agency for International Cooperation (APCI) Project Database
The analysis of the Peruvian Agency for International Cooperation (APCI) project
database involved two main goals: first, to examine the structure of the APCI reporting system
and assess how effectively it is serving its purported function of reporting the project’s impact;
and second, to guide the development of a project typology to facilitate the evaluation of the
effectiveness of CSD projects in Madre de Dios.
With respect to the first purpose, I focused on two sections of data in particular–the
Marco Lógico (Logical Framework) and the Evaluación and Observación (Evaluation and
Observation) section. The Marco Lógico contained information about the project’s specific
goals, targets, and indicators, which was very important for determining how projects measure
their effectiveness and which indicators and metrics they use. The Evaluación and Observación
section contained information about the monitoring tools used to evaluate the whole project, the
duration of the monitoring process, and type of evaluation, if applicable (internal or external).
This last section was valuable for determining if projects reported this information to the APCI
and if the tools used worked or not.
Regarding the second purpose of this analysis, I first filtered the APCI project list for
Madre de Dios (consisting of 120 projects) to include only those that fit the description of
“conservation and sustainable development project,” in accordance with the scope of this
research. Due to limitations in time and resources, the project list was further filtered according
to these additional criteria:
1. Project must be reasonably visible and readily searchable (i.e., either listed on public
record or accessible by request)
2. Project must be currently active or completed since 2016
3. Project has to satisfy a standard definition of a CSD project as reflected in contemporary
literature

19
4. Project has to explicitly address a top priority Sustainable Development Goal (SDG) and
target relative to the project’s particular geographic context (Madre de Dios)
Once the APCI project list was filtered to include only the 73 projects that matched the
criteria described above, I then developed a working typology to facilitate the assessment of each
project’s effectiveness. Each project report was reviewed individually for information indicating
what specific activities the project entailed, especially that data contained in the “Marco Lógico”
and “ descripción del proyecto” sections. This information was used to classify each project
according to its primary activities (e.g., education, conservation of biodiversity, creation of
legally protected areas, etc.), and then grouped with other projects of the same general profile.
This informal classification provided with a general typology of CSD projects in Madre de Dios.
Finally, the number of projects of each type was added together to determine their relative
frequency.
The APCI project reporting template provides four distinct classification systems
according to which organizations can report the impact of their projects: Clasificacion Temática
de Ayuda al Desarrollo (DAC code); Objetivos del Millennium (Millennium Development
Goals); Áreas Prioritarias de la Política Nacional de la Cooperación Técnica Internacional
(PNCTI); and Objetivos de Desarrollo Sostenido (Sustainable Development Goals).
For the purposes of this research, I focused on data reported in the section corresponding
to the Sustainable Development Goals, or SDGs (“Objetivos de Desarrollo Sostenido”). This
section was chosen because the SDGs are the most up-to-date and widely-recognized standards
for project’s goal achievement in the conservation and sustainable development context. The
sustainable development goals are also the standards prescribed by the Organization for
Economic Cooperation and Development (OECD), which has an important role within the
Peruvian development agenda (APCI, 2017).

20
I then developed a system for estimating the effectiveness of each of the 73 CSD projects
in order to generate effectiveness profiles for each of our representative project types. First, I
used the “Preliminary Benefit-Cost Assessment of the Final OWG Outcome”–a report
commissioned by the Copenhagen Consensus Center, a think tank “that seeks to establish
priorities for advancing global welfare using methodologies based on the theory of welfare
economics, using cost–benefit analysis” (Copenhagen Consensus 2004)–to rank the various
sustainable development targets the 73 projects aimed to address (as indicated in the SDG
portion of the Marco Lógico section of their project report). I adopted the Copenhagen
Consensus report’s ranking system of Phenomenal, Almost Phenomenal, Good, Fair, Poor, and
Unknown to estimate the cost-effectiveness scores of each project.
Scores were then calculated as follows:
• # of “Phenomenal” targets addressed x 4 pts. = total
• # of “Almost Phenomenal” targets addressed x 3 pts. = total
• # of “Good” targets addressed x 2 pts. = total
• # of ‘Fair” targets addressed x 1 pts. = total
• # of “Poor” targets addressed x -1 pts. = total
• # of “Unknown” targets addressed x null multiplier (not included in final calculation)
Finally, the cumulative cost-effectiveness score was calculated by adding each of the
totals above.
Objective 3 (OBJ3):
Determine to what extent the mechanisms for measuring effectiveness influence the
development decisions of local communities
The diagram of Figure 4 shows the sequence of the methods used for OBJ 3. First, the
OBJ 3 included a case study in the community. The case study involved a Community
Questionnaire, the Ignorance Condition Scenario Workshop, and the Knowledge Condition
Scenario Workshop. The Community Questionnaire had as a main purpose to collect basic

21
demographic and socioeconomic data. The Ignorance Condition Scenario Workshop had as main
purpose to determine community priorities in the absence of specific knowledge of project
outcomes and the Knowledge Condition Scenario Workshop had as main purpose to gather
information about how community members make decisions for CSD projects when provided
with evidence.
Figure 4. Diagram of methods for OBJ.3: Determine to what extent the mechanisms for
measuring effectiveness influence the development decisions of local communities
Case Study in the Puerto Lucerna Community
Study site
As part of the efforts to compile information and evidence for the third objective of this
research, a case study was conducted in the Puerto Lucerna community in the Las Piedras district
of Madre de Dios Department in Peru.
Madre de Dios is a department of Peru in the Southern Amazon with a population of
approximately 140, 508 habitants and it occupies 6.6 percent of the Peruvian territory (Oficina de
OBJ.3: Determine to what extent the mechanisms for measuring effectiveness influence the
development decisions of local communities
Case study
Community questionnaire Ignorance Condition Scenario
Workshop
Knowledge Condition
Scenario Workshop
• Value Survey
• Discrete Choice
Experiment (DCE) Basic demographic and
socioeconomic data Community priorities in the
absence of specific knowledge
of project outcomes Gather information about
how community members
make decisions for CSD
projects when provided with
evidence

22
Gestión de la Información y Estadística, 2016). This region boasts the title of the “Capital of
Peru’s Biodiversity”. This title is due to high numbers of wildlife and cultural diversity. Some of
the biodiversity records include more than 600 species of birds, 400 species of reptiles and
amphibians, and approximately 200 species of mammals (Swenson et al., 2011. Madre de Dios is
also home to several indigenous cultures and vulnerable populations, including several that are
living in situations of voluntary isolation or initial contact (PIACI) (Swenson, Carter, Domec, &
Delgado, 2011) (Lawrence, et al., 2005), (Scullion, Vogt, Sienkiewicz, Gmur, & Trujillo, 2014).
Madre de Dios has as main activities agriculture, mining, and tourism. These activities are
distributed along its three provinces: Manu, Tahuamanu and Tambopata. These provinces are
divided into 11 districts within the region (Gobierno Regional de Madre de Dios, 2012).
Scullion, J. J., Vogt, K. A., Sienkiewicz, A., Gmur, S. J., & Trujillo, C. (2014). “Assessing the
influence of land-cover change and conflicting land-use authorizations on ecosystem
conversion on the forest frontier of Madre de Dios, Peru.” Biological Conservation, 247-
258.
Las Piedras is a district in the province of Tambopata in Madre de Dios and it has
approximately a population of 8, 904 habitants (Gobierno Regional de Madre de Dios, 2012).
Las Piedras is still also a remote, little studied area, and home to several uncontacted tribes,
including the Mashco- Piro (ARCAmazon, 2015).
The Puerto Lucerna community (see figure 5) is one of the oldest rural towns in the
region, located on the Las Piedras river about five hours by car from the region’s capital, Puerto
Maldonado. The community is connected to the Interoceanic Highway by an unpaved road,
which serves to transport products like Brazil nuts, cocoa, and plantains from the community to
the city of Puerto Maldonado. The road also serves for logging transportation from the
community and surrounding areas where this activity has been increasing in the last years.

23
Figure 5: Satellite image of the Lucerna community, Las Piedras District, 2017
Host organization and collaborators
The Alliance for Research and Conservation in the Amazon (ARCAmazon) served as the
host organization for this research and field practicum. ARCAmazon is a Peruvian non-
governmental organization created in 2014. The organization’s main activities include research,
conservation projects, and community work, which support their ultimate goal of protecting the
Las Piedras river basin and the natural resources in it (ARCAmazon, 2015).
The ARCAmazon team has been working since their foundation at the Las Piedras
Research Center (LPAC). This center, located 17km northwest of the Lucerna community (see
Fig. 5), serves as the main base for all of the organization’s activities and research projects.
LPAC also receives a regular influx of students, volunteers, and researchers who assist in
various capacities to support the organization’s efforts in the region. The support provided by

24
ARCAmazon to me for the field research included room and board at LPAC for the duration of
my field work.
While conducting research in Las Piedras, I worked under the supervision of David
Johnston, Executive Director of ARCAmazon. The center’s Head of Field Operations, Alfredo
Arbe Loli, provided additional support for varios activities within the field work within the
Lucerna community along with several of the local staff at the center.
Lucerna socioeconomic questionnaire
Upon arrival in Lucerna, I conducted visits to the members of the community to
administer individualized questionnaires to gather baseline demographic and socio-economic
data, to map how residents use land and resources, to assess the capacity of the community for
various CSD projects, and to identify any background factors that might influence the
community’s decisions regarding future investment in CSD projects (see appendix 1). The
information compiled was intended to serve to answer the research question five (RQ5) of the
research. These questionnaires were administered to all the members of the community that were
present and consented to participate in the study.
Workshops in the Puerto Lucerna community
I conducted the Ignorance Condition Scenario Workshop and Knowledge Condition
Scenario Workshop in the Puerto Lucerna community. These two workshops were designed to
understand how community decision-making changes as a function of how much information
(evidence) the community is provided with respect to the outcomes of their various options
Ignorance condition scenario workshop
This first workshop was held 10 days after I arrival and introduction to the community,
serving as an icebreaker between me and the members of the Puerto Lucerna community. It also
provided the first opportunity to publicly explain the purpose and intended outcomes of the

25
research; why Puerto Lucerna community and Madre de Dios were chose for the case study; and
most importantly, to gather the opinions and ideas from the members of the community as to
what they consider the ideal characteristics and outcomes for projects to be implemented in their
community. This last compilation of information was proposed to support the answer of research
question four (RQ4) of this research.
During the Ignorance Condition Scenario Workshop, I guided and facilitated the
workshop by providing a flexible structure for the participants to explore their thoughts and ideas
regarding conservation and sustainable development projects in their community.
The structure that I provided consisted in suggesting three different scenarios (A,B, and
C) where each scenario had the following scheme: How would you invest an imaginary amount
of money for a conservation and sustainable development project in your community if these
things were true: 1) condition in scenario A was that the project should include a conservation
component to be considered CSD project; 2) condition in scenario B was that the money invested
in the project should be spent it during three years; and 3) condition in scenario C was that the
project community should think about a way to demonstrate their project is being effective. The
sixteen members of the community which participated in this first workshop expressed their
ideas and thoughts about how to approach the general questions and conditions in each scenario.
I provided markers and posters flip sheet papers, so the community members could present their
ideas to each other during the workshop.
I proposed these three different conditions to encourage the members of the community
to think more about project’s impacts and what values and outcomes are important for them as
part of projects to be implemented in their community. After all the groups formed during the
workshop expressed their opinions and proposal in sheet papers and discussed with the entire

26
workshop group, I distributed a Values Survey to all the members of the community in the
workshop, so they could provide more elaborated feedback about what are the most important
values for them when thinking about projects outcomes for their community. The purpose of
gathering the information from the Value Survey was to track the community members values
divided in three different areas (economic, social, and environmental) for projects to be
implemented in their community.
Values survey
At the end of the Ignorance Condition Scenario Workshop, I provided to the members of
the community with a three-page survey (hereafter referred to as Values Survey) consisting of 11
potential values per each category (economic, social, and environmental) and asked the
community members to rank each outcome according to their preferences (5 to indicate that the
outcome is most important to their decision, 1 to indicate that it is least important to their
decision) for a hypothetical development project to be implemented in their community
(Appendix 3). The community members were encouraged to make any additional notes they felt
may be important to justify their ratings.
The values selected for this survey were adapted from the targets of the Preliminary
Benefit-Cost Assessment of the Final Open Working Group (OWG) on Sustainable
Development Goals (SDGs) Outcome document. These targets were ranked as the most effective
for the Sustainable Development Goals (SDGs) by applying a cost benefit assessment. This
document was extracted from the Copenhagen Consensus report.
The Copenhagen Consensus Center is a think tank which main activities involve
research and publications of proposed solutions for the biggest world problems. Their
information comes from an interdisciplinary effort of scientists, researchers, recognized

27
organizations and Novel Laureates so it can be used by policy makers and philanthropists
(Copenhagen Consensus Center, 2018).
Knowledge condition scenario workshop
This second workshop engaged participants in an exercise designed to mimic a situation
in which local decision-makers were fully informed about the specific economic, social, and
environmental impacts of hypothetical development projects. It was therefore designated as the
“knowledge condition scenario”. The purposes of this workshop implied gathering information
about how members of the Puerto Lucerna community make decisions about the values
(economic, social, and environmental outcomes) and which projects they prefer when provided
with these data. It was also meant to serve as a point of comparison with the ignorance scenario,
so as to show the potential impact of certain improvements to the mechanisms of measuring
effectiveness of CSD projects. Both purposes were intended to compile information and
evidence to answer research question four (RQ4).
Discrete choice experiment
A Discrete Choice Experiment (DCE) is a type of stated preference method used to
identify and evaluate the relative importance of different aspects of decision making for
participants or stakeholders related to specific outcomes (Johnson et al., 2013). While there are
different types of stated preferences methods, discrete choice experiments (DCE) and conjoint
analysis were the most common used within the economics and marketing fields.
In order to design a Discrete Choice Experiment (DCE), there are different considerations
to make depending on the complexity of the study and the scrutiny of the analysis that the
researcher intended to do (statistical, descriptive, etc.) For the purpose of this study, I considered
two important components: Choice setting and attribute selection.

28
The choice setting of a discrete choice experiment followed these three main
requirements:
1. The set of alternatives should be collectively exhaustive. This means that the set
designed includes all possible alternatives, so the participant has to necessarily choose an
alternative from the set.
2. The alternatives in the set should be mutually exclusive. This means that if a participant
chooses an alternative then it means not choosing any other alternative.
3. The number of alternatives in a set should be finite. This is a characteristic that
differentiates DCE from other forms of regression analysis.
For the attribute selection, a consideration applied was that the attributes used for the
combination of choice sets should be the most critical from the participant, so this infers that this
information had to be obtained from a preview survey or qualitative study before the experiment
is conducted.
Based on this last consideration of the attribute selection, I used the answers collected
from the Values Survey to design different combinations of set of choices (projects A and B) for
the community members to choose which choice of projects A or B they will prefer and what
attributes (economic, social, and environmental values) seem to be more important for them
when making their choices.
I included project A and project B as the two discrete options available for all the
members of the Puerto Lucerna community. The same that were mutually exclusive, so the
community members can only choose one of the choices from each set.
These attributes corresponded to a combination of 16 different sets. These sets of choices
(project A and project B) resulted from combining the three top values that the community
members ranked in the Value Survey and creating different combinations of choices, the same
that had two different parts, the category of attribute (economic, social, and environmental) and
the quality of the attributes (Good, moderate, and bad). The quality of attributes was also

29
represented in the project choice codes as 123, 231, 321, etc. where 1 is good, 2 is moderate, and
3 is bad.
Nonetheless, since I used three top values (now called attributes) for setting up the
choices, each content attribute was coded as X, Y, and Z, which corresponded to X= first ranked
attribute, Y= Second ranked attribute, and Z= third ranked attribute by each category (economic,
social, l and Environmental) (See Table 1).
For example, in Table 1, the set of attributes indicates that choice project A has as code
choice 123 (good economic attribute, moderate social attribute, and bad environmental attribute).
Table 1. Example attributes of set of project choices A and B in discrete choice experiment
Task 2
Project A Project B
123 231
Cada año un miembro de la comunidad
asegura todas las hectáreas de su terreno a
través titulación y certificado de posesión
Cada año un miembro de la comunidad pierde
una hectárea de su terreno y recibe
compensación por ello al precio del mercado
Mejoramiento de la carretera, desagüe y agua
potable en un 10% cada año
Mejoramiento de la carretera, desagüe y agua
potable en un 1% cada año
Cada 3 años 50% de la propiedad e
infraestructura de la comunidad se pierde a
consecuencia de desastres naturales
Cada 3 años solo 10% de la propiedad e
infraestructura se pierde a consecuencia de
desastres naturales
In continuation of the discrete choice experiment design, I formulated three hypotheses to
test as part of the experiment. These hypotheses were based in the combinations of the choices
set (tasks) and potential relationship between the categories and qualities differences related to
community member decision making. These hypotheses are described in the table belong (See
Table 2).

30
Table 2. Hypotheses formulated for the discrete choice experiment the Puerto Lucerna
community
Variable Hypotheses Explanation Test Control for
Attribute
category
E>S>G (i.e.,
123>132>21
3>132>312>
321)
All other things being equal, an
attribute with an E value
(economic) will be weighed
more heavily than an attribute
with a S value (social), which
will be weighed more heavily
than an attribute with a G value
(environmental).
Comparison of two graphs: (1) a
baseline graph in which selection is
perfectly positively correlated with
these expected values; and (2) a graph
showing the actual correlation of these
values, controlling for attribute
content.
Attribute
content (all
attributes
come from
the same set,
X, Y, or Z)
Quality-
category
pairing
Content
matters
(content
dependence)
There exists at least one scenario
(task) in which the effect of
manipulating attribute content
will overwhelm the effect of
manipulating the balance of
attribute quality.
All of our trials were supplied with
options from the same set, i.e., only X
or Y or Z, so we did not test this
hypothesis directly. However, we can
compare different trials in which the
category-quality pairs were identical,
e.g., a 123 vs. 321 trials from set x
compared to a 123 vs. 321 trials from
set Y.
Attribute
category
Quality-
category
pairing
Content
doesn't
matter
(content
independenc
e)
There does not exist at least one
scenario (task) in which the
effect of manipulating attribute
content will overwhelm the
effect of manipulating the
balance of attribute quality.
Comparison of two graphs: (1) a graph
showing expected correlations when
selection is perfectly positively
correlated with these expected values;
and (2) a graph showing the actual
correlation of these values, controlling
for attribute content.

31
ANALYSIS AND RESULTS
OBJECTIVE 1:
Determine what effectiveness means in the CSD context and how it is measured
RESEARCH QUESTION 1:
What does effectiveness mean in the context of conservation and sustainable
development?
Through a review of the current literature that included a total of 23 sources of scientific
articles and official reports, I found that there was no single, standard definition of
“effectiveness” in relation to conservation and sustainable development projects. Instead, I found
a variety of alternative definitions representing different theoretical frameworks. These
definitions were mainly related to impact and goal achievement of the projects analyzed and
evaluated. Some of these frameworks included “evidence-based approach” “an integrated
framework for Sustainable Development Goals,” and “Systematic appraisal of evidence”, “Forest
Conservation and Development Framework” (Pullin and Knight; 2008, Shutherland et al., 2004;
Scullion et al.,2014; Ferraro and Hanauer, 2014; Adams and Sandbrook, 2012; Ferraro and
Pattanayak, 2006)
In many cases, the implementers of CSD projects (namely, CSD organizations and local
government agencies) seemed to give minimal thought to the deeper theoretical basis for their
projects, but instead relied on such considerations as the current priorities or expectations of the
local population, which they served; the conditions from funding agencies or individual donors;
and the collective experience of the staff within these organizations (Ferraro and Hanauer, 2014;
Adams and Sandbrook, 2012; Ferraro and Pattanayak, 2006, Pullin and Knight; 2008).
The Effective Altruism (EA) prescribes different criteria which aims to address the need
of having a standard definition of effectiveness and including an evidence-based approach as part

32
of its core structure. According to EA, effectiveness is not just about being successful in
producing an intended or desired result (which is the standard definition of effective), but also
about choosing the right, or best, goals to pursue. Furthermore, within EA, effectiveness is 1) an
effective intervention (2) that addresses a high priority cause (Effective Altruism, 2017).
RESEARCH QUESTION 2
How do you measure effectiveness in the context of conservation and sustainable
development?
There have been different strategies to measure projects effectiveness. These measures
and metrics were linked to the frameworks described in RQ1 as part of the findings for definition
of effectiveness. These included: Systematic reviews, Web based- databases, Place-based
conservation development policies, Land use systems, Cost effectiveness approaches, Synopsis
of evidence, Impact evaluation (Pullin and Knight; 2008, Shutherland et al., 2004; Scullion et
al.,2014; Ferraro and Hanauer, 2014; Adams and Sandbrook, 2012; Ferraro and Pattanayak,
2006).
Within the Effective Altruism framework, the definition of effectiveness involves two
levels of analysis (prioritization of causes and evaluation of interventions), so the practice of
measuring effectiveness also involves two levels of evaluation: evaluation of causes by the
Importance Tractability and Neglectedness (ITN) criteria and the evaluation of interventions by
cost-benefit and cost-effectiveness methods.
EA prescribes using either a traditional cost-benefit or cost-effectiveness analysis,
commonly used in economics and finance. In a cost-benefit analysis, the benefits of a potential
action are summed, and then the costs associated with taking that action are subtracted, leaving
you with either a net gain or a net loss. Cost-effectiveness analysis, on the other hand, estimates
the ratio between the cost and the impact of the intervention (e.g., years of healthy life gained, or

33
additional years spent in school). While cost-benefit analysis measures both cost and benefit in
monetary terms, cost-effectiveness analysis assigns a monetary value to the measure of effect
achieved by the intervention, typically some non-monetary value (Effective Altruism, 2017).
The last part of the EA criteria for measuring project effectiveness describes that projects
aiming to be effective should procure to compile relevant data or evidence that can help present
and future intervention and investments.
OBJECTIVE 2
Conduct an assessment of the current mechanisms for measuring the effectiveness of
CSD projects in Madre de Dios, Peru
RESEARCH QUESTION 3
What is the state of current institutional and policy mechanisms for measuring the
effectiveness of CSD projects in Madre de Dios, Peru?
The literature review and the analysis of APCI showed that these mechanisms were not
operating in an effective way according to the EA definition of effectiveness and the ITN
criteria.
In order to expand more in a description of the main institutions and actors involved in
measuring effectiveness of CSD projects in Madre de Dios, I used the information found to
create a roadmap of the main institutions involved in measuring and monitoring effectiveness of
CSD projects in Peru.
Figure 6 shows a roadmap of the main institutions in charge of different functions that
relates to measuring and monitoring effectiveness of CSD projects in Peru. These organizations
included (from top to down): The United Nations Development Programme which is dedicated
to establishing international agreements and facilitate world efforts such as the Sustainable
Development Goals (SDGs), the Peruvian Government which is in charge to pursue the

34
prosperity of the country as a whole while promoting more efficient and sustainable solutions for
all the issues that Peru is facing, the Ministry of Environment (MINAM) and the Ministry of
Development and Inclusion (MIDIS) that represent the two national entities after the Peruvian
government which functions are to work in initiatives and policies in favor of causes within
different areas that correspond with their goals (e.g. Poverty, climate change).
The following institutions in the figure corresponded to the National Center for Strategic
Planning (CEPLAN) and the Peruvian Agency for International Cooperation (APCI). These two
institutions are key for analyzing the state of the mechanisms for measuring and monitoring
effectiveness of CSD projects in Peru because they serve two valuable functions, the strategic
planning process which determine the strategies and actions that Peru will take to achieve
national goals as SDGs and prosperity. As part of APCI’s functions, this entity oversees
evaluating and auditing all the projects in Peru that have received international cooperation funds
impact and the efficacy of how these projects have been using the resources invested from
international cooperation. Other institution that it is part of this institutional infrastructure is the
National Institute for Statistics and Information (INEI), this institution has the function of
compile much of the qualitative and quantitative socio economic and demographic data from
different categories through an extensive database, these data usually comes from national
household surveys and specific studies. Finally, attached to APCI, other important actors within
this infrastructure are donors, international cooperation, nonprofits and local organizations.
These actors are going to play an important role on this infrastructure because CSD projects
development, monitoring and evaluation processes are a combination of negotiations between the
state institutions and these actor’s expectations.

35
Figure 6. Roadmap of institutional infrastructure for measuring effectiveness in CSD projects
Examination of structure of APCI project database reporting system
The infrastructure that presently supports actions toward meeting these goals and targets
falls short of certain criteria which some experts will believe are essential (see Figure 7).
Examples of these criteria are listed below:
• Cost-effectiveness
• Availability of evidence
• Neglectedness
• Tractability
Specifically, there are weaknesses in areas such as cause prioritization and Auditing
(APCI project data base). Nonetheless, a number of independent organizations and think tanks
have taken up the responsibilities of closing these gaps in some cases.
One of these organizations is represented by the Copenhagen Consensus, which has taken
responsibility for prioritizing the SDGs according to the criteria of cost-effectiveness and in
more incipient way since 2009, the Agencia Peruana de Cooperacion Internacional (APCI) has
been serving as part of its functions as auditor, helping to hold the recipients of international
funding accountable for demonstrating their impact and effectiveness relative to certain
standards (MDGs, SDGs, etc.) (APCI, 2017).

36
Figure 7: Gaps in infrastructure for Measuring the Effectiveness of CSD Projects in Peru (with
weaknesses and gaps highlighted with broken chains)

37
CSD Project Typology
Table 3 presents the typology that was developed for the 73 CSD projects extracted from the APCI project database and their
relative frequency (represented in %).
Table 3. CSD Project Typology
Typology
Conservation/
management of
Natural
Resources)
Conservati
on of
Indigenou
s
Communit
ies
Developm
ent of
sustainabl
e
economies
Strengthening
capacities for
adaptation to
climate change
Sustaina
ble
Agricult
ure
Educati
on
Touri
sm
REDD
projects
Fish
farms /
manage
ment
Brazil
nuts
Food
securi
ty
Hydrolog
ical
resources
and
water
quality
Energy
policy
Handic
rafts
Reforest
ation
48 25 23 10 7 7 6 6 3 2 1 1 1 1 1
66% 34% 32% 14% 10% 10% 8% 8% 4% 3% 1% 1% 1% 1% 1%
As illustrated in Table 3, 48 of the 73 total CSD projects (66%) in Madre de Dios were conservation and/or management of
natural resources projects, 25 were Conservation of Indigenous Communities projects (34%), 23 were Development of Sustainable
Economies projects (32%), 10 were Strengthening capacities for adaptation to climate change projects (14%), 7 were Sustainable
Agriculture(10%), 7 were Education projects (10%), 6 were Tourism projects (8%), and 6 were REDD projects (8%) as well. The
remaining 7 project types represented (4%) or less of total projects implemented in Madre de Dios.

38
Effectiveness Scoring of CSD projects
Of the 73 projects evaluated for effectiveness, the four that obtained the highest scores
for effectiveness were Project #63 “Church and society preferential option for the poor”, project
#85 “Popular leaders’ network capacity development for dialogue and proposal”, project #124
“Organizational consolidation against hydrocarbon activities in Madre de Dios Peru”, and project
#122 “Supera Peru promotion of the certified export of the super foods of quinoa and castaña”.
These four projects earned scores of 6, 5, 4, 4, respectively, while the remaining projects earned
scores of 2 or lower. The organizations that implemented these projects were a local church
(projects 63 and 85), an indigenous local federation (project 124), and the local tourism and
commerce agency (project 122).
OBJECTIVE 3
Determine to what extent the institutional and policy mechanisms for measuring
effectiveness influence the development decisions of local communities
In order to compile the information for this objective, I conducted two workshops with
the community, the Ignorance Condition Scenario Workshop and the Knowledge Scenario
Workshop. The first one had a total of 16 participants and a values survey was provided to all of
the participants at the end of this workshop. During the second workshop, only 8 people
participated and the whole workshop was framed as part of the Discrete Choice Experiment
methodology.
RESEARCH QUESTION 4:
How do community members weigh these different social, economic, and environmental
factors when they consider alternative projects for implementation?
To find the information to answer this question, the activities and evidence were found
from two sources, the value survey which served to rank the top three values of community

39
members in Puerto Lucerna within the three areas (economic, social, and environmental) and the
number of choices made by community members during the second workshop.
Value survey
The value survey had as three top values ranked by member of the community in each
area (economic, social, and environmental) as it is described in table 4.
Table 4. Top 3 rated values from Value Survey in Puerto Lucerna community
Discrete Choice Experiment (DCE)
From the 45 tasks (15 tasks consisting of three variations each) generated for this
experiment, I selected at random six tasks for analysis. The seven participants were first divided
into two groups two and one of three. Each group was then given at random one of the six tasks
and provided several minutes to discuss which option (A or B) they preferred. At the end of the
allotted time, each group delivered their consensus to the rest of the participants along with the
rationale for their selection. Afterwards, all participants were asked to vote which option they
preferred, and totals were recorded on a master tally sheet (Table 3). This procedure was
repeated for each group in two separate rounds (two rounds x three tasks = six tasks), such that,
by the end, every participant’s preferences were recorded for each of the six tasks examined.
Areas Top 1 Top 2 Top 3
Economic Efecto en la seguridad de
derechos de territorio y
propiedad de terreno
Fecundidad del proyecto, ej., conduce a
mayores / más grandes beneficios
económicos en el largo plazo (ej., a
través de avances en profesiones, etc.)
Efecto en la
calidad / acceso
de servicios
básicos
Social Efectos en infraestructura
física y servicios públicos,
incluyendo carreteras,
desagüe, transporte, etc.
Efecto en disponibilidad y/o cantidad
de capacitación / oportunidades de
educación para la población
Efectos en los
niveles de
delincuencia
local, incluyendo
discriminación
Environmental Efecto en la protección de
la comunidad en contra de
desastres naturales
Efecto en la flora y fauna local,
especialmente especies en peligro de
extinción y las amenazadas
Efecto en la
calidad del aire,
agua y suelo local

40
Table 5. Participant project choices in Discrete Choice Experiment
Task Attributes Combinations
Project alternatives
A B
2y E1-S2-G3 vs. E2-S3-G1 0 7
2x E1-S2-G3 vs. E2-S3-G1 5 2
3y E1-S2-G3 vs. E2-S1-G3 1 6
4z E1-S2-G3 vs. E3-S1-G2 0 7
12z E2-S3-G1 vs. E3-S2-G1 7 0
14y E2-S1-G3 vs. E3-S2-G1 0 7
The results of the DCE were then analyzed to determine the influence that each attribute
exerted on the final choice. This value was measured by calculating the ratio (% correlation)
between the number of times the attribute was represented in a choice and the number of times
the alternative in which it occurred was selected (Table 7).
The resulting values were then further analyzed to determine how strength of influence
correlates with attribute category (E, S, or G) and attribute quality (1, 2 or 3) exclusively, i.e.,
without consideration to attribute content (x, y, or z). This analysis revealed the strongest
correlations (+4) between attributes containing good and moderate quality environmental
outcomes (i.e., G1 and G2) (Table 6).
Table 6. Rate of selection per attribute category and quality combination
positiv
e E
with
100%
correla
tion
positiv
e E
with
0%
correla
tion
negati
ve E
with
100%
correla
tion
negati
ve E
with
0%
correla
tion
E
bala
nce
positiv
e S
with
100%
correla
tion
positiv
e S
with
0%
correla
tion
negati
ve S
with
100%
correla
tion
negati
ve S
with
0%
correla
tion
S
bala
nce
positiv
e G
with
100%
correla
tion
positiv
e G
with
0%
correla
tion
negati
ve G
with
100%
correla
tion
negati
ve G
with
0%
correla
tion
G
bala
nce
1 2 2 0 -3 1 2 2 0 -3 2 0 0 2 4
The results of this experiment were then compared with the results of the (Ignorance
Condition Scenario).
Figure 8 shows that the members of the Puerto Lucerna community expressed in the
Ignorance Condition Scenario chart, to have more preference for the economic values (50%) of

41
CSD projects to be implemented in their community than the social and environmental values
(see Figure 8 A). However, in the Knowledge Condition Scenario chart (see Figure 8 B), the
members of the Puerto Lucerna community expressed to have more preference for the
environmental values (80%) more than the economic and social values. Furthermore, these
differentiated results from both charts will imply that members of the Puerto Lucerna community
can make different decisions when provided with more evidence (data).
Figure. 8. Ignorance condition versus Knowledge condition in the Lucerna community, 2017
A
B

42
Table 7. Correlation of attributes of choice
Knowledge Condition (Influence by attribute)
Rank Attribute Attribute
Category Quality
Attribute
code
Choice
code
# of times
represented
in a task
# of
trials
# of times
represented
in choice
# of times
represented
in a winning
choice
Correlation
1
Cada año un miembro de
la comunidad pierde una
hectárea de su terreno y
recibe compensación por
ello al precio del mercado
E 2 E2x 2xB 1 7 7 7 100%
1
Mejoramiento de la
carretera, desagüe y agua
potable en un 1% cada
año
S 3 S3x 2xB 1 7 7 7 100%
1
Cada 3 años solo 10% de
la propiedad e
infraestructura se pierde a
consecuencia de desastres
naturales
G 1 G1x 2xB 1 7 7 7 100%
1
La seguridad ciudadana y
disminución de
delincuencia mejora en un
40% cada 3 años
S 1 S1z 4zB 1 7 7 7 100%
1
La calidad del aire, el
agua y el suelo mejora en
un 10% cada 3 años
G 2 G2z 4zB 1 7 7 7 100%
1
La calidad y acceso de
servicios básicos
incrementa en un 10%
E 2 E2z 12zA 1 7 7 7 100%
1
Los niveles de
delincuencia local y
discriminación
incrementan en un 30%
cada año
S 3 S3z 12zA 1 7 7 7 100%

43
9
Cada año un miembro de
la comunidad asegura
todas las hectáreas de su
terreno a través titulación
y certificado de posesión
E 1 E1x 2xA 1 7 7 0 0%
9
Mejoramiento de la
carretera, desagüe y agua
potable en un 10% cada
año
S 2 S2x 2xA 1 7 7 0 0%
9
Cada 3 años 50% de la
propiedad e
infraestructura de la
comunidad se pierde a
consecuencia de desastres
naturales
G 3 G3x 2xA 1 7 7 0 0%
9
La calidad y acceso de
servicios básicos
incrementa en un 50%
E 1 E1z 4zA 1 7 7 0 0%
9
La calidad y acceso a
servicios básicos empeora
en un 30% cada 3 años
G 3 G3z 4zA 1 7 7 0 0%
9
La seguridad ciudadana y
disminución de
delincuencia mejora en un
10% cada 3 años
S 2 S2z 4zA,
12zB 2 14 14 0 0%
1
La economía local crece
en 5% cada 3 años y
beneficia diferentes áreas
y actividades en la
comunidad
E 3 E3y 14yB 1 7 7 7 100%

44
RESEARCH QUESTION 5.
What factors may be serving to influence how community members weigh these different
values when they consider alternative projects for implementation?
The profile of the Puerto Lucerna community has as main characteristics the following
descriptions:
Table 8. Profile of Puerto Lucerna community
➢ 2:1 ratio of men to women
➢ Average ages are 25-45 years
➢ Economy based on agriculture (62%) and
local commerce (25%)
➢ Main crops are cocoa (77%), plantains
(12%), and citrus (5%)
➢ Speak Quechua (43%), Spanish (51%),
and Ashaninka (3%)
➢ Migrate from Cusco (35%), VRAEN
(25%), Ayacucho (12%), Puerto
Maldonado (7%)
Figure 9 shows that more than 50% of the community members in Puerto Lucerna
considered agriculture as the main activity. Other activities with representative percentages
included small businesses and fishing and hunting.

45
Figure 9. Perceptions of Economic Activity in Puerto Lucerna Community
Figure 10 illustrates the perceptions of the community members about the effectivity of
different levels of government. According to the results, the local government will be the most
effective with 2 points of 4. This result would suggest that the community members considered
the government performance as regular given the punctuation assigned.
Figure 10. Community Perceptions of Effectiveness Rating of Government
The numbers showed in figure 11 represented the percentage of community members
which are working in the areas described. Similarly, to figure 1, more than 60 percent of the

46
community members confirmed that they were farmers, 12 percent were students and 10 percent
were house wife.
Figure 11. Community members Occupations
.

47
DISCUSSION
The literature review conducted to determine a definition of effectiveness showed that
there was not a single definition accepted and used within the CSD context. However, there were
a variety of frameworks that have been used mainly related to impact project and goal
achievement. Consequently, the effectiveness framework used for this study aims to fill out this
need and also help to not only concentrate effort in impact project and goal achievement usually
pertinent to interventions but also invest in more rigorous evidence-based approaches to identify
high priority causes in which invest resources.
Nonetheless, Effective Altruism (EA) as a framework is not meant to exclude other ways
to measure and monitoring effectiveness of CSD projects in Peru and Madre de Dios. EA as a
framework that it is based on evidence, it is constantly in change and improvement. The main
challenge that arise from the EA framework applicability is that it tries to combine both,
adequate and high-quality data driven institutional and policy mechanisms while also procuring
to invest in the most effective intervention in the ground. Much of the core conceptualizations of
EA relies on doing the most good possible, meaning using the scarce resources existed in a
wisely way. Nonetheless, difficulties such as lack of data, more consolidated information from
past initiatives and frameworks, and deficiencies in governance are frequently identified as major
obstacles to overcome.

48
CONCLUSION
The conservation and sustainable development field is not currently set up to support the
Effective Altruism (EA)-style assessments of effectiveness. While the conservation and
sustainable development fields have some pieces of the infrastructure and mechanisms needed to
accomplish the task of being effective according to the EA prescription, there are still holes that
need to be filled in before following the EA procedure from start (cause prioritization) to finish
(evaluation of interventions). Furthermore, there is no single, standard definition of effectiveness
recognized by the entire CSD community and the metrics for measuring and monitoring
effectiveness in the CSD context do not follow a standard or unified process. At the same time,
there are gaps within the institutional infrastructure for measuring and monitoring effectiveness
in CSD projects in Peru. Likewise, the mechanisms for measuring and monitoring effectiveness
do not have strong influence on how local communities like Puerto Lucerna make development
decisions. Nonetheless, providing community members with more information influence how
they make their development decisions.
The challenges encountered during the field work included the limited time to try out the
methods and to collect more data, and the apprehension of some members of the community to
answer questions for the participatory mapping because of an overlapping legal conflict they
were facing with a private company during the time of the field work. Therefore, the planned
schedule for some activities need to be modified like the first meeting with the community which
got cancelled.
Also, the data compiled from the Discrete Choice Experiment was not enough to apply
more statistical analysis. Furthermore, I was only able to make a descriptive analysis and
generate a conclusion only based on a subjective analysis and strong assumptions.

49
APPENDIX A
COMMUNITY QUESTIONNAIRE (SPANISH VERSION)
ESTABLECIENDO PRIORIDADES Y MIDIENDO EL IMPACTO DE
PROYECTOS DE CONSERVACIÓN Y DESARROLLO SOSTENIBLE (CDS)
Mi nombre es Tania Romero Bautista. Soy una investigadora local y una
estudiante de postgrado de la Universidad de Florida. El objetivo de mi investigación es
estudiar las prioridades e impacto de proyectos de desarrollo sostenible en la comunidad
de Lucerna. Esta encuesta busca explorar las características socioeconómicas de
posibilidades de proyectos en el área y las opiniones de los comuneros respecto al
impacto de estos proyectos. Su contribución nos ayudará a evaluar el potencial del
impacto de estos proyectos y hacer recomendaciones informadas a la comunidad de
Lucerna y ARCAmazon sobre posibles proyectos de conservación y desarrollo sostenible
en el futuro. Si tiene alguna pregunta acerca de esta investigación, por favor contactarme
al celular 982308305 o al correo [email protected].
I. INFORMACIÓN DEMOGRÁFICA
1.1. Nombre (opcional) _________________________________________
1.2. Número de casa: ______________________________
1.3. Fecha: ___________________________
1.4. Comunidad: Lucerna
1.5. Edad del entrevistado(a): _______________________________
1.6. Número total de miembros de la familia ___________
1.7. Sexo
a) Femenino b) Masculino
1.8. Relación con el jefe de familia

50
a) jefe de familia b) Esposo(a) c) Hijo(a) d) Yerno/nuera e) Nieto(a)
f) Padre g) Hermano/hermana h) Abuelo(a) i) Otros (especificar) ____
1.9. Estado civil
a) Soltero(a) b) Casado(a) c) Divorciado(a) d) Viudo(a) e) Separado(a)
1.10. ¿Qué nivel de educación tiene el miembro de familia?
a) No termino primaria b) Termino primaria c) Termino secundaria
d) Terminó la Universidad u otra institución superior e) No se sabe
1.11. ¿Cuáles es su ocupacion?
a) Agricultor b) Cria de gallinas y otras aves de corral c) Maderero d) Castañero
e) Artesano f) Profesor g) Enfermero / médico h) Otro (por favor
especificar ______________)
1.12. ¿Para quién(es) trabaja Usted?
a) Es su propio negocio b) Negocio de familia c) Pequeña empresa (menos de 10
trabajadores)
d) Mediana o empresa grande (más de 10 trabajadores) e) El gobierno f) No
aplica
1.13. ¿Usted habla, entiende, y/o escribe en un lenguaje diferente del español?
a) Si (indicar que lenguaje) ____________________________ b) No
1.14. ¿Por cuánto tiempo ha vivido en la comunidad? _______ Años
1.15. ¿Ha usted vivido en otro lugar / comunidad / departamento por más de tres
meses?
a) Si (por favor especificar donde) ____________________________ b) No
1.16. ¿Por qué se mudó a Lucerna?

51
En busca de trabajo
Para empezar un nuevo trabajo
Para escapar de un desastre natural
Para escapar de un problema familiar
Otro (por favor especificar) ________________________
II. INFORMACIÓN SOCIOECONÓMICA
2.1. ¿Cuál es la principal fuente de ingresos en tu familia? (leer los valores de
importancia al entrevistado: 1 importante, 2 menos importante, 3 el menos importante, 0
no es importante)
2.2. ¿Cuál es el ingreso anual promedio de su hogar? ______________________
2.3. ¿Como se considera?
Importancia
Salario
Agricultura
Madera
Turismo/ ecoturismo
Comercio local
Trabajo con el
gobierno
Castanha
Mineria
Otro (especificar): __

52
Muy pobre
Pobre
Clase media
Con mucho dinero
Millonario
2.4. ¿Cuál es el estado de sus ingresos, comparado con hace 5 años atrás?
a) Mejor b). El mismo c). Peor
2.5. ¿Cuál es la razón de esto?
III. USO DE LA TIERRA Y AGRICULTURA
3.1. ¿Usted o algún miembro de su familia hacen agricultura?
a) Si b) No
3.2. ¿Cuántas hectáreas tiene su chacra? ________ ha
3.3. ¿Cuáles son los cultivos principales en su chacra? ¿Cuántas ha por cultivo?
3.4. ¿Usted produce algún producto para subsistencia? Por favor indique el valor
de esta producción por año.
Producto
Valor (Soles)
IV. EDUCACIÓN
4.1. ¿Usted tiene hijos?
a) Si (cuantos) _________ b) No
4.2. ¿Sus hijos van a la escuela/ colegio?
a) Si b) No (indique cuantos no van a la escuela/ cuantos años tienen) _____

53
4.3. ¿Por qué algunos de sus hijos no van a la escuela / colegio?
V. INFRAESTRUCTURA GENERAL
5.1. ¿Cómo evaluaría los siguientes servicios en Lucerna? (Excelente, Normal,
Pobre, No se sabe)
Exc Bueno Normal Pobre No se sabe
a. Poder judicial 4 3 2 1 8 ___
b. Puesto de Salud 4 3 2 1 8 ___
c. Escuela 4 3 2 1 8 ___
d. Emergency medical service 4 3 2 1 8 ___
e. Servicio de transporte 4 3 2 1 8 ___
f. Servicio de basura 4 3 2 1 8 ___
g. Carretera/ calles 4 3 2 1 8 ___
h. Iluminacion publica 4 3 2 1 8 ___
i. Comunicaciones 4 3 2 1 8 ___
j. Agua potable 4 3 2 1 8 ___
k. Desagüe 4 3 2 1 8 ___
l. ___________________ 4 3 2 1 8 ___
m. __________________ 4 3 2 1 8 ___
5.2. ¿Cuáles son los problemas, si hay alguno, en su comunidad?
Si No No se sabe
a. La condición de las casas 1 0 8 ___
b. Vandalismo 1 0 8 ___
c. Drogas 1 0 8 ___
d. Alcoholismo 1 0 8 ___

54
e. Basura en las calles 1 0 8 ___
f. Jóvenes embarazadas 1 0 8 ___
g. Otro (por favor indicar_______) 1 0 8 ___
5.3. A continuación, hay algunos servicios en los que normalmente el estado
invierte. ¿En su opinión cuál cree que son las áreas en las que se debería invertir más?
Si No No se sabe
a. Para mejorar Poder judicial 1 0 8 ___
b. Para mejorar Puesto de Salud 1 0 8 ___
c. Para mejorar Escuela 1 0 8 ___
d. Para Mejorar desagüe 1 0 8 ___
e. Para mejorar Servicio de transporte 1 0 8 ___
f. Para mejorar Servicio de basura 1 0 8 ___
g. Para mejorar Carretera/ calles 1 0 8 ___
h. Para mejorar Iluminacion publica 1 0 8 ___
i. Para mejorar Comunicaciones 1 0 8 ___
j. Para mejorar Agua potable 1 0 8 ___
k. Para mejorar Desagüe 1 0 8 ___
n. Otro (Indicar ________________) 1 0 8 ___
VI. GOBERNANZA LOCAL
6.1. ¿Cómo mediria la efectividad de cada uno de los siguientes para satisfacer las
necesidades de la comunidad de Lucerna?
Exc Bueno Normal Pobre No se sabe
a. Presidente de la comunidad 4 3 2 1 8 ___
b. Gobierno Municipal 4 3 2 1 8 ___

55
c. Gobierno Regional 4 3 2 1 8 ___
6.2. En los últimos 12 meses, ¿Cómo mediria su experiencia trabajando con los
siguientes niveles de gobierno?
Exc Bueno Normal Pobre
a. Presidente de la comunidad 4 3 2 1 8 ___
b. Gobierno Municipal 4 3 2 1 8 ___
c. Gobierno Regional 4 3 2 1 8 ___
VII. CAPACIDAD PARA PROYECTOS CSD
7.1. ¿Cuáles son las principales actividades económicas en su comunidad?
(Estimar el porcentaje por favor)
>75% 50-75% 25-50% <25% No se sabe
a. Agricultura 4 3 2 1 8 ___
b. Mineria 4 3 2 1 8 ___
c. Pesca / caza 4 3 2 1 8 ___
d. Madera 4 3 2 1 8 ___
e. Transporte 4 3 2 1 8 ___
f. Restaurante 4 3 2 1 8 ___
g. Pequenho negocio 4 3 2 1 8 ___
h. Otro (especificar: _____) 4 3 2 1 8 ___
7.2. ¿Cuáles son las 3 más grandes prioridades de desarrollo para tu comunidad?
Por favor proveer una breve explicación de las siguientes respuestas.
_________________________

56
7.3. ¿En general, cómo describirías el nivel de efectividad de las presentes formas
de uso de terreno en su comunidad?
Muy efectivo
Mayormenete efectivo
Normal
Mayormente no efectivo
No se sabe
7.4. ¿En su opinion, que se ha hecho para mejorar la efectividad del uso de terreno
en su comunidad?
7.5. ¿Para cuáles de los siguientes ejemplos de proyectos Usted cree que su
comunidad tiene la capacidad para implementar?
Muy bueno Normal Pobre No sabe
Conservación/manejo de 4 3 2 1 8 ___
recursos naturales
Conservación de comunidades 4 3 2 1 8 ____
/ Protección de territorio ancestral
Desarrollo de economía sostenible 4 3 2 1 8 ____
basado en recursos naturales
Reforzando capacidades 4 3 2 1 8 ____
para la adaptación al cambio climático
Agricultura 4 3 2 1 8 ____
Educación 4 3 2 1 8 ____
Ecoturismo 4 3 2 1 8 ____
REDD+ 4 3 2 1 8 ____
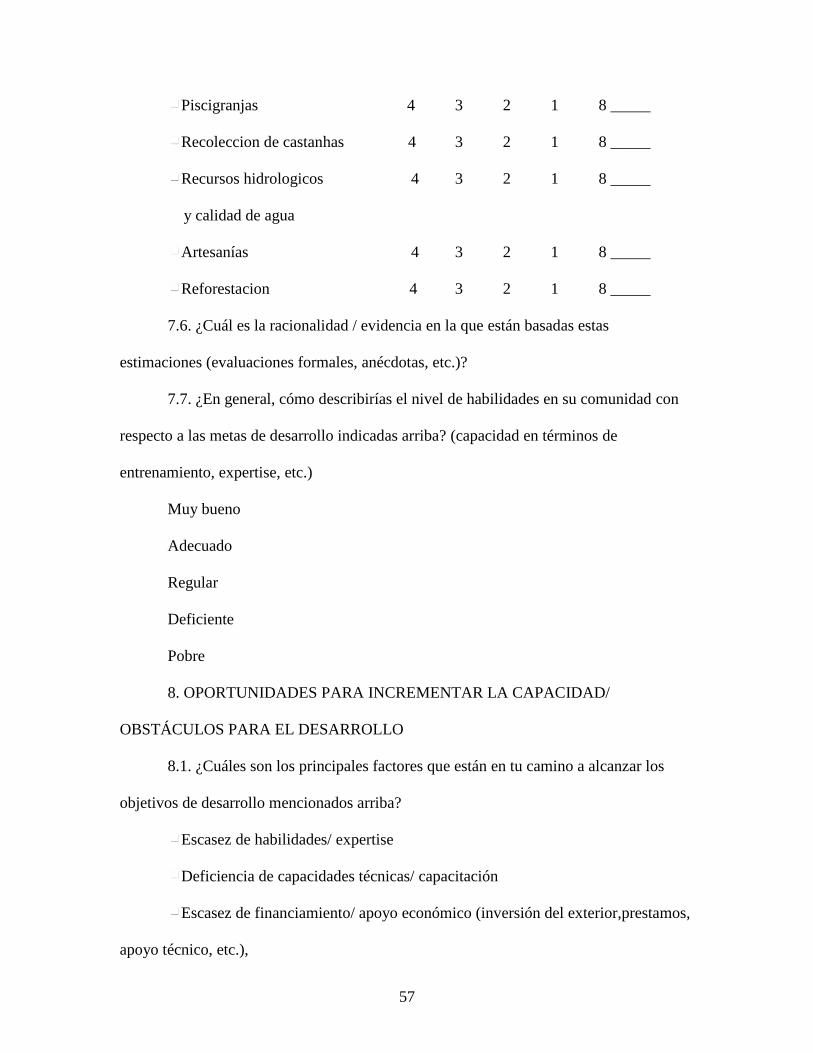
57
Piscigranjas 4 3 2 1 8 _____
Recoleccion de castanhas 4 3 2 1 8 _____
Recursos hidrologicos 4 3 2 1 8 _____
y calidad de agua
Artesanías 4 3 2 1 8 _____
Reforestacion 4 3 2 1 8 _____
7.6. ¿Cuál es la racionalidad / evidencia en la que están basadas estas
estimaciones (evaluaciones formales, anécdotas, etc.)?
7.7. ¿En general, cómo describirías el nivel de habilidades en su comunidad con
respecto a las metas de desarrollo indicadas arriba? (capacidad en términos de
entrenamiento, expertise, etc.)
Muy bueno
Adecuado
Regular
Deficiente
Pobre
8. OPORTUNIDADES PARA INCREMENTAR LA CAPACIDAD/
OBSTÁCULOS PARA EL DESARROLLO
8.1. ¿Cuáles son los principales factores que están en tu camino a alcanzar los
objetivos de desarrollo mencionados arriba?
Escasez de habilidades/ expertise
Deficiencia de capacidades técnicas/ capacitación
Escasez de financiamiento/ apoyo económico (inversión del exterior,prestamos,
apoyo técnico, etc.),

58
Deficiencias en infraestructura (carretera, transporte fluvial, etc.)
Deficiencia en gobernanza
Deficiencias en derechos de territorio
Other: ______________________________

59
APPENDIX B
IGNORANCE (NON-EA) CONDITION SCENARIO WORKSHOP
Duration of activities: 1 hour
Schedule:
● Introduction / explanation of activities and icebreaker game (5 minutes)
● Scenarios / group discussion (20-25 minutes)
● Group presentations (5 minutes per group / 15 minutes)
● Values Survey (15 minutes)
● Conclusion of activities (5 minutes)
Instructions
Break into 3 groups of roughly equal numbers. Distribute the 3 alternative
scenarios (A, B, and C) amongst the 3 groups. For 20-25 minutes, groups should discuss
their scenario and come to a collective decision, citing in as much detail as possible the
reasons/justification for their decision. After everyone has completed this activity, a
representative from each group should present the group’s decision to the focus group
along with their supporting justification.
Each group will be given 5 minutes to present their decision and justification for a
total of 15 minutes. After presentations, groups will reconvene and given 15 minutes to
complete a short Values Survey corresponding to the Scenario they were assigned (A, B,
or C). Each participant will be given her/his own survey to complete. Surveys should be
completed individually, without discussing or consulting with other participants.
Conclude activities.
Disclaimer: The following scenarios are completely fictitious and should not be
taken to suggest any intention on the part of the primary investigator (Tania Romero

60
Bautista), nor any other party that may be implicated in the current research, to provide
assistance of any kind to the Lucerna community.
Scenario A: An international development aid organization has approached your
community with an offer to provide $X to invest in community development project(s),
on the sole condition that the project also serve to generate some value for the
environment (preservation of habitat or biodiversity, carbon sequestration, contribute to
sustainable use of natural resources, etc.). How would you choose to invest this money?
→ This is the baseline, most open-ended scenario.
Scenario B: An international development aid organization has approached your
community with an offer to provide $X to invest in community development project(s),
on the sole condition that the project also serve to generate some value for the
environment (preservation of habitat or biodiversity, carbon sequestration, contribute to
sustainable use of natural resources, etc.) and the money should be invested within a 3-
year time period. How would you choose to invest this money?
Scenario C: An international development aid organization has approached your
community with an offer to provide $X to invest in community development project(s),
on the sole condition that the project also serve to generate some value for the
environment (preservation of habitat or biodiversity, carbon sequestration, contribute to
sustainable use of natural resources, etc.), the money should be invested within a 3 year
time period, and the community should establish a way to prove effectiveness of the
project after the first year to receive money for the following years. How would you
choose to invest this money?
→ Example strategies:
● Invest everything in one project

61
● Divide money between multiple projects
● Invest in pilot program, or multiple pilot programs, then invest everything
in most successful project
● Invest in pilot program, or multiple pilot programs, then allocate the
money into multiple projects according to their relative success
● Split money equally between all community members to be used at their
discretion out of bounds? ←
15-20 minutes to discuss their strategy. 5-10 minutes to present decision to group
(including justification for decision, i.e., considerations that informed their decision).
Repeat for each scenario includes for up to 1 hr. → could treat this as “actual behavior”
and do a Revealed Preference analysis.
At the end of this focus group, community values surveys are handed to the
participants, so they can rank the values they care most in the categories of economic,
environmental, and social. The values were based on the United Nations’ final list of
proposed sustainable development goal indicators which were adapted to the context of
Lucerna community and to a more everyday language for better understanding. This
information serves as the basis for Focus group 3.
Focus Group 3: Evidence Condition Scenario
Duration of Activities: 1 hour
Schedule
Introduction / explanation of activity and game (10 minutes)
Scenarios / group discussion (20- 25 minutes in total)
Group presentations (2 minutes per group / 12 minutes)
Conclusion of activities (5 minutes)

62
Methodology
Choice Modeling using Conjoint Analysis / Discrete Choice Experiment (DCE)
Instructions
The activity starts with a game using map of Peru and asking the participant to
introduce her/himself according to the region where she/he was born and marking the
location on the map. After this, break the whole group into small groups of two people.
For 10 minutes, each small group should discuss and analyze the two discrete choices for
CSD projects that they were provided and make a decision based on the attributes of each
project per set (A and B).
The set of projects includes project A and project B which have specific
combinations of attributes in the social, environmental, and economic areas. These
attributes correspond to a combination of 16 different sets that were the result of
combining the three top values that people in the first focus group ranked in the value
survey.
After everyone has completed their activity, a representative from each group
should present the group’s decision to the focus group along with their supporting
justification (allow 2 minutes per group for a total of 12 minutes for presentations). This
activity is recorded by asking the participants for confirmation before the focus group
starts. Conclude the activity with a general discussion and final comments from the
community members.

63
APPENDIX C
VALUE SURVEY (SPANISH VERSION)
Encuesta de Valores Economicos
Escenario #: ______
Instrucciones: Por cada factor / atributo siguiente, por favor indicar que tan importante
sería para un proyecto de desarrollo ficticio a implementar usando la escala de 1- 5, donde 5
significa muy importante y 1 significa no es importante. Después de esto, usando una escala de 1
a 10 y sin usar el mismo número dos veces, proveer un ranking general de cada factor / atributo
sobre su importancia relativa a las otras (1 indica el más importante, 10 indica el menos
importante).
Factor/Atributo Importancia (1-5) Ranking
General
Costo inicial del proyecto,
incluyendo la inversión inicial en capital
(herramientas, equipos, etc.), expansión de
infraestructura, y capacitación de
trabajadores
Costo de mantenimiento del
proyecto, incluyendo herramientas físicas y
equipos, locales, mantener a los trabajadores
capacitados, etc.)

64
Costo-efectividad del proyecto
(valor agregado por dólar gastado / retornos
de inversión)
Viabilidad del proyecto dada la
capacidad existente de la comunidad, en
ambas maneras, infraestructura y
habilidades de los trabajadores
Viabilidad y sostenibilidad
económica del proyecto a largo plazo (i.e.,
resiliencia a fluctuaciones en mercados,
etc.)
Equidad (distribución justa) de
beneficios económicos entre varios
subgrupos en la comunidad (ej., mujeres,
adultos mayores, pobres, deshabilitados,
etc.)
El tiempo hasta que el proyecto
pueda dar retornos / rendimientos
económicos
Fecundidad del proyecto, i.e.,
conducencia a mayores / más grandes

65
beneficios económicos en el largo plazo (ej.,
a través de avances en profesiones, etc.)
Número de trabajos creados bien
pagados
Efecto en la calidad / acceso de
servicios básicos
Efecto en la seguridad de derechos
de territorio y propiedad de terreno
Otro (por favor especificar)
Encuesta de Valores Sociales
Escenario #: ______
Instrucciones: Por cada factor / atributo siguiente, por favor indicar que tan importante
sería para un proyecto de desarrollo ficticio a implementar usando la escala de 1- 5, donde 5
significa muy importante y 1 significa no es importante. Después de esto, usando una escala de 1
a 10 y sin usar el mismo número dos veces, proveer un ranking general de cada factor / atributo
sobre su importancia relativa a las otras (1 indica el más importante, 10 indica el menos
importante).

66
Factor/Atributo Importancia
(1-5)
Ranking
general
Efecto directo en la salud de la población local,
incluyendo trabajadores
Efecto en la cobertura de servicios de salud básicos,
incluyendo seguro
Efecto en disponibilidad y/o cantidad de capacitación
/ oportunidades de educación para la población
Efectos en tamaño / composición de la comunidad a
través de inmigraciones/ emigraciones de varios subgrupos
(edad, genero, etc.)
Cambio en las oportunidades profesionales para
mujeres, discapacitados, y otras personas con discapacidad,
incluyendo en instituciones publicas
Ética del proyecto (conformidad con las normas
sociales locales)
Efectos en la cultura local / formas tradicionales de
vivir

67
Efectos en los niveles de delincuencia local,
incluyendo discriminación
Efectos en infraestructura física y servicios públicos,
incluyendo carreteras, desagüe, transporte, etc.
Cuanto tiempo hasta que el proyecto genera
beneficios sociales
Otro (por favor especificar)
Escenario #: ______
Instrucciones: Por cada factor / atributo siguiente, por favor indicar que tan importante
sería para un proyecto de desarrollo ficticio a implementar usando la escala de 1- 5, donde 5
significa muy importante y 1 significa no es importante. Después de esto, usando una escala de 1
a 10 y sin usar el mismo número dos veces, proveer un ranking general de cada factor / atributo
sobre su importancia relativa a las otras (1 indica el más importante, 10 indica el menos
importante).
Factor/Atributo Importancia (1-5) Ranking
general
Cantidad de basura producida por el proyecto /
deterioro de áreas naturales cercanas

68
Cantidad de basura producida por el
proyecto / deterioro de áreas naturales remotas
(ej., bosque alrededor, ríos, etc.)
Efecto en la funcionalidad de ecosistemas
incluyendo la provisión de servicios de los
ecosistemas
Efecto en la calidad del aire, agua y suelo
local
Efecto en la flora y fauna local,
especialmente especies en peligro de extinción y
las amenazadas
Sostenibilidad del proyecto en el largo
plazo en referencia a consume o uso de recursos
naturales
Cuanto tiempo hasta que el proyecto
genere beneficios ambientales
Efecto en la protección de la comunidad
en contra de desastres naturales

69
Efectos en la habilidad de la comunidad
para adaptarse a los impactos adversos del
cambio climático
Otro (por favor especificar)

70
APPENDIX D
PHOTOS OF PUERTO LUCERNA COMMUNITY
Figure 12. Me arriving to the Puerto Lucerna community
Figure 13. The president of agriculture in Puerto Lucerna and me participating in a
icebreaker game

71
Figure 14. Community members from Puerto Lucerna participating in the Discrete
Choice Experiment (DCE)
Figure 15. Community members presenting their ideas during the Ignorance
Condition Scenario Workshop

72
Figure 16. All the participants from the Puerto Lucerna community in the Knowledge
Condition Scenario Workshop
Figure 17. Me writing a formal invitation to the community members for the Knowledge
Condition Scenario Workshop

73
LIST OF REFERENCES
APCI. (2017). APCI Participates in USAID Forum on Emerging Partnerships for Development.
Lima: Agencia Peruana de Cooperacion International.
APCI, A. P. (2017). Alianzas Multiactor de Cooperacion Internacional para el Desarrollo
Sostenible. Lima: Agencia Peruana de Cooperacion Internacional. Retrieved from
http://www.apci.gob.pe/Novedades/Marco%20Conceptual%20Alianzas%20Multiactor31
032017.pdf
ARCAmazon, A. (2015). "Alliance for Conservation and Research and Conservation in the
Amazon". Retrieved from http://conservetheamazon.org/arcamazon/#mission
Benavides, M., Campana, S., Cueva, S., Leon, J., & Wagenman, A. (2016). "Measuring the
Sustainable Development Agenda in Peru". Lima: GRADE.
Courtenay Botteril, L. (2017, April). Oxford Research Encyclopedia. Retrieved from Oxford
University Press:
http://politics.oxfordre.com/view/10.1093/acrefore/9780190228637.001.0001/acrefore-
9780190228637-e-177
Davies, H. T., Nutley, S. M., & Smith, P. C. (2000). What Works: Evidence Based Policy and
Practice in Public Services. Porland: The Policy Press.
Effective Altruism, E. (2017, September 15). Effective Altruism. Retrieved from Effective
Altruism: https://www.effectivealtruism.org/
Gobierno Regional de Madre de Dios, G. R. (2012). Programa Regional de Poblacion de la
Region de Madre de Dios 2013- 2017. Puerto Maldonado: Equipo Tecnico
Multisectorial.
Grace, K. (2014). “Cause Prioritisation: Shallow Overview.” . United Kingdom: Givewell.
Lawrence, A., Philips, o. L., Reategui Ismodes, A., Lopez, M., Rose, S., Wood, D., & Farfan, A.
J. (2005). Local val/ues for harvested forest plants in Madre de Dios, Peru: towards a
more contextualised interpretation of quantitative ethnobotanical data. Biodiversity and
Conservation, 45-79.
MacAskill, W. (2015). "Doing Good Better: How Effective Altruism Can Help You Make a
Difference". New York: Avery.
OECD. (2017, September 20). OECD Better policies for better life. Retrieved from Financinf for
Sustainable Development: http://www.oecd.org/dac/financing-sustainable-development/
Oficina de Gestión de la Información y Estadística, O. d. (2016). Carpeta Georeferencial Region
Madre de Dios Peru. Lima: Congreso de la Republica del Peru.

74
Scullion, J. J., Vogt, K. A., Sienkiewicz, A., Gmur, S., & Trujillo, C. (2014). “Assessing the
influence of land-cover change and conflicting land-use authorizations on ecosystem
conversion on the forest frontier of Madre de Dios, Peru.”. Biological Conservation, 247-
258.
Swenson, J. J., Carter, C. E., Domec, J.-C., & Delgado, C. I. (2011). Gold Mining in the
Peruvian Amazon: Global Prices, Deforestation, and Mercury Imports. PLOS one.
UNDP, P. U. (2017, September 19). United Nations Development Programme. Retrieved from
Sustainable Development Goals:
http://www.undp.org/content/undp/en/home/sustainable-development-goals.html
United Nations, U. N. (2015). "The Millennium Development Goals Report". New York: United
Nations.