An evaluation of wind energy potential at Kati Bandar, Pakistan
6
An evaluation of wind energy potential at Kati Bandar, Pakistan Irfan Ullah a, *, Qamar-uz-Zaman Chaudhry b , Andrew J. Chipperfield c a Department of Mechanical Engineering, NWFP University of Engineering & Technology, Peshawar, Pakistan b Pakistan Meteorological Department, Sector H-8/2, Islamabad, Pakistan c Computational Engineering and Design Group, School of Engineering Sciences, University of Southampton, Highfield, Southampton SO17 1BJ, UK Contents 1. Introduction ..................................................................................................... 856 2. Kati Bandar wind potential evaluation ................................................................................ 857 2.1. Wind speed characterization .................................................................................. 857 2.2. Wind power characterization .................................................................................. 859 3. Discussion ...................................................................................................... 859 4. Conclusions ..................................................................................................... 861 References ...................................................................................................... 861 1. Introduction The energy supply per capita is a common indicator of the state of development of a country. Pakistan, a developing country of 170 million people, has an energy supply per capita of 0.38 tons of oil equivalent (TOE) per year compared to the world average of 1.64 TOE [1]. Moreover, the energy supply has been more or less static for the last several years. Similarly, the yearly per capita electricity consumption in Pakistan is 424 kWh, compared to world average of 2603 kWh [2] and there is a large gap between demand and supply. About 68% of Pakistan’s people live in rural areas comprising some 125,000 villages, 37% of which are still without electricity. The poorer sections of the society are especially hit by lack of access to electricity. The World Bank estimates that about 48% of poor households (as compared to 24% of other households) do not have access to electricity in Pakistan. Provision of even a minimal quantity of electricity to these people can bring a huge improvement in their quality of life. Pakistan has a currently installed capacity of 19,566 MW of electricity generation, of which about 33% is hydroelectricity, 64% is from fossil fuels and the rest from nuclear energy [1]. Hydroelectricity is much cheaper as well as less polluting; however, its share in the total generation has been decreasing steadily, from 70% of total in the 1960s to the current 33%. Not only has this trend caused a huge increase in electricity prices, but it has also produced higher air pollution. It is estimated that carbon dioxide emissions by the power producing sector have increased almost 15-fold over a twenty-year period. The large gap between demand and supply of electricity, increasing cost of imported fossil fuels and worsening air pollution demand an urgent search for energy sources that are cost-effective, reliable and environment-friendly. There has been a lot of recent interest worldwide in developing renewable energy sources. The technology for exploiting wind energy, in particular, has matured Renewable and Sustainable Energy Reviews 14 (2010) 856–861 ARTICLE INFO Article history: Received 30 July 2009 Accepted 16 October 2009 Keywords: Wind energy Wind resource evaluation Pakistan wind sites ABSTRACT As a developing nation of energy-starved people, Pakistan urgently needs new sources of affordable, clean energy. Wind energy is potentially attractive because of its low environmental impact and sustainability. This work aims to investigate the wind power production potential of sites in south- eastern Pakistan. Wind speed data measured over a one-year period at a typical site on the south-east coast of Pakistan are presented. Frequency distributions of wind speed and wind power densities at three heights, seasonal variations of speed, and estimates of power likely to be produced by commercial turbines are included. The site investigated is found to be a class 4 wind power site with annual average wind speed of 7.16 m/s and power density of 414 W/m 2 at 50 m height. The site is, therefore, likely to be suitable for wind farms as well as small, stand-alone systems. ß 2009 Elsevier Ltd. All rights reserved. * Corresponding author. Tel.: +92 91 9218212; fax: +92 91 9216663. E-mail address: [email protected] (I. Ullah). Contents lists available at ScienceDirect Renewable and Sustainable Energy Reviews journal homepage: www.elsevier.com/locate/rser 1364-0321/$ – see front matter ß 2009 Elsevier Ltd. All rights reserved. doi:10.1016/j.rser.2009.10.014
-
Upload
irfan-ullah -
Category
Documents
-
view
215 -
download
2
Transcript of An evaluation of wind energy potential at Kati Bandar, Pakistan
Renewable and Sustainable Energy Reviews 14 (2010) 856–861
An evaluation of wind energy potential at Kati Bandar, Pakistan
Irfan Ullah a,*, Qamar-uz-Zaman Chaudhry b, Andrew J. Chipperfield c
a Department of Mechanical Engineering, NWFP University of Engineering & Technology, Peshawar, Pakistanb Pakistan Meteorological Department, Sector H-8/2, Islamabad, Pakistanc Computational Engineering and Design Group, School of Engineering Sciences, University of Southampton, Highfield, Southampton SO17 1BJ, UK
Contents
1. Introduction . . . . . . . . . . . . . . . . . . . . . . . . . . . . . . . . . . . . . . . . . . . . . . . . . . . . . . . . . . . . . . . . . . . . . . . . . . . . . . . . . . . . . . . . . . . . . . . . . . . . . 856
2. Kati Bandar wind potential evaluation . . . . . . . . . . . . . . . . . . . . . . . . . . . . . . . . . . . . . . . . . . . . . . . . . . . . . . . . . . . . . . . . . . . . . . . . . . . . . . . . 857
2.1. Wind speed characterization . . . . . . . . . . . . . . . . . . . . . . . . . . . . . . . . . . . . . . . . . . . . . . . . . . . . . . . . . . . . . . . . . . . . . . . . . . . . . . . . . . 857
2.2. Wind power characterization . . . . . . . . . . . . . . . . . . . . . . . . . . . . . . . . . . . . . . . . . . . . . . . . . . . . . . . . . . . . . . . . . . . . . . . . . . . . . . . . . . 859
3. Discussion . . . . . . . . . . . . . . . . . . . . . . . . . . . . . . . . . . . . . . . . . . . . . . . . . . . . . . . . . . . . . . . . . . . . . . . . . . . . . . . . . . . . . . . . . . . . . . . . . . . . . . 859
4. Conclusions . . . . . . . . . . . . . . . . . . . . . . . . . . . . . . . . . . . . . . . . . . . . . . . . . . . . . . . . . . . . . . . . . . . . . . . . . . . . . . . . . . . . . . . . . . . . . . . . . . . . . 861
References . . . . . . . . . . . . . . . . . . . . . . . . . . . . . . . . . . . . . . . . . . . . . . . . . . . . . . . . . . . . . . . . . . . . . . . . . . . . . . . . . . . . . . . . . . . . . . . . . . . . . . 861
A R T I C L E I N F O
Article history:
Received 30 July 2009
Accepted 16 October 2009
Keywords:
Wind energy
Wind resource evaluation
Pakistan wind sites
A B S T R A C T
As a developing nation of energy-starved people, Pakistan urgently needs new sources of affordable,
clean energy. Wind energy is potentially attractive because of its low environmental impact and
sustainability. This work aims to investigate the wind power production potential of sites in south-
eastern Pakistan. Wind speed data measured over a one-year period at a typical site on the south-east
coast of Pakistan are presented. Frequency distributions of wind speed and wind power densities at three
heights, seasonal variations of speed, and estimates of power likely to be produced by commercial
turbines are included. The site investigated is found to be a class 4 wind power site with annual average
wind speed of 7.16 m/s and power density of 414 W/m2 at 50 m height. The site is, therefore, likely to be
suitable for wind farms as well as small, stand-alone systems.
� 2009 Elsevier Ltd. All rights reserved.
Contents lists available at ScienceDirect
Renewable and Sustainable Energy Reviews
journa l homepage: www.e lsev ier .com/ locate / rser
1. Introduction
The energy supply per capita is a common indicator of the stateof development of a country. Pakistan, a developing country of 170million people, has an energy supply per capita of 0.38 tons of oilequivalent (TOE) per year compared to the world average of1.64 TOE [1]. Moreover, the energy supply has been more or lessstatic for the last several years. Similarly, the yearly per capitaelectricity consumption in Pakistan is 424 kWh, compared toworld average of 2603 kWh [2] and there is a large gap betweendemand and supply. About 68% of Pakistan’s people live in ruralareas comprising some 125,000 villages, 37% of which are stillwithout electricity. The poorer sections of the society are especiallyhit by lack of access to electricity. The World Bank estimates thatabout 48% of poor households (as compared to 24% of other
* Corresponding author. Tel.: +92 91 9218212; fax: +92 91 9216663.
E-mail address: [email protected] (I. Ullah).
1364-0321/$ – see front matter � 2009 Elsevier Ltd. All rights reserved.
doi:10.1016/j.rser.2009.10.014
households) do not have access to electricity in Pakistan. Provisionof even a minimal quantity of electricity to these people can bring ahuge improvement in their quality of life.
Pakistan has a currently installed capacity of 19,566 MW ofelectricity generation, of which about 33% is hydroelectricity, 64%is from fossil fuels and the rest from nuclear energy [1].Hydroelectricity is much cheaper as well as less polluting;however, its share in the total generation has been decreasingsteadily, from 70% of total in the 1960s to the current 33%. Not onlyhas this trend caused a huge increase in electricity prices, but it hasalso produced higher air pollution. It is estimated that carbondioxide emissions by the power producing sector have increasedalmost 15-fold over a twenty-year period.
The large gap between demand and supply of electricity,increasing cost of imported fossil fuels and worsening air pollutiondemand an urgent search for energy sources that are cost-effective,reliable and environment-friendly. There has been a lot of recentinterest worldwide in developing renewable energy sources. Thetechnology for exploiting wind energy, in particular, has matured

Fig. 1. Frequency distribution of wind speed at Kati Bandar over the year.
I. Ullah et al. / Renewable and Sustainable Energy Reviews 14 (2010) 856–861 857
to the point that electricity produced from wind turbines nowcompetes in cost with that produced from conventional sources,especially when the cost of environmental damage is factored in.Due to its wide availability and low environmental impact, windenergy is the fastest growing energy resource today. The world-wide capacity of wind power generation reached 121,188 MW atthe end of 2008, with a growth rate of 29% per year [3]. Pakistan,however, is yet to appear on the world wind energy map.
Wind energy is thus a potentially attractive source of renewableenergy whose availability needs to be investigated. To that end,Pakistan Meteorological Department has collected wind data incoastal areas of Pakistan, some 1100 km over latitude 24–278N,longitude 62–698E approximately, including sites up to 100 kminland from the coast. Forty-one wind measuring stations were setup at the various sites considered to be potentially windy areasthat also possess other desirable qualities of a wind powerproduction site. Triangular hollow type towers were erected ateach location as far away as possible from local obstructions,taking care to select a site that is representative of the location ingeneral. Two digital wind speed calibrated sensors (model# 40cNRG Systems) were installed at 10 m and 30 m height. Onetemperature sensor (model# 110s NRG Systems) and one winddirection sensor (model# 200p NRG Systems) were also installed at10 m and 30 m height. Zero error values (uniquely determined foreach sensor) were provided by the manufacturer. The data loggersampled values every half a second, and recorded one-minuteaverage and ten-minute extremes of wind speed, one-minuteaverage of wind direction and five-minute average of temperature.This paper presents the data collected at Kati Bandar, a smallvillage east of Karachi on the coast of Sindh.
Assessments of wind energy potential have been undertaken inseveral countries in the region as reported in recent literature [4–6]. Reviews of renewable energy technology prospects in Pakistan[7] and the development of wind energy in Pakistan in particular
Fig. 2. Cumulative frequency distribution of w
[8] have been published, but this is the first report assessing windenergy potential in Pakistan using measured wind speed data.
In the next sections, the wind speed data are analysed, theavailable power in wind is calculated and estimates of electricalpower potentially generated by some commercial turbines arepresented. This is followed by a discussion of the results andconclusions.
2. Kati Bandar wind potential evaluation
Wind speed data are summarized in a number of ways in theliterature, including averages and variances, frequency histograms,and theoretical frequency distributions fitted to the data. Rayleighand Weibull distributions are considered to be the most suitablefor representing wind speed variations. In addition to yearlystatistics, monthly and diurnal variations in wind speed are also ofinterest. The wind power potential of a site depends both on windspeeds and the proportion of time for which these speeds areavailable. In addition, the air density, the height of the turbinetower, and the design of turbine affect the power produced. All ofthese aspects are considered in the following sections.
2.1. Wind speed characterization
The variation of wind speed with height is given by the log law:
UðzÞUr¼ lnðz=z0Þ
lnðzr=z0Þ(1)
where U(z) is the wind speed at height z, Ur is the reference windspeed at reference height zr, and z0 is the surface roughness length,which characterizes the roughness of the terrain. Values of surfaceroughness length for various types of terrain are given in theliterature, e.g., [9]. In this research, z0 was calculated from Eq. (1)using the measured speeds at 10 m and 30 m height. Eq. (1) was
ind speed at Kati Bandar over the year.

I. Ullah et al. / Renewable and Sustainable Energy Reviews 14 (2010) 856–861858
then used to estimate wind speeds at 50 m height, sincecommercial wind turbines commonly have a hub height of 50 mor more.
A histogram of the percentage frequency of wind speed for theyear is shown in Fig. 1 and the cumulative frequency distribution,which shows the percentage of time the wind speed exceeds acertain value is drawn in Fig. 2. It can be noted that, for example,the wind speed at 50 m height is greater than 4 m/s for 85% of thetime in the year. The 4 m/s limit is important since this is the cut-inspeed of many commercial turbines. The cut-out speed is generally20–25 m/s and such speeds are rare at this site.
Fig. 3. Weibull distributions of wind speeds for d
The Weibull probability density function, which is mostcommonly used to characterize wind speed distribution, is given by
pðUÞ ¼ k
c
� �U
c
� �k�1
exp � U
c
� �k" #
(2)
where c is a scale factor (in units of speed) and k is a shape factor.Higher values of k indicate sharper peaked curves while lower k
means more flat or more evenly distributed speeds. A value of 2 fork reduces the Weibull distribution to the Rayleigh distribution,another commonly used function for wind speeds. To fit the
ifferent heights at Kati Bandar over the year.
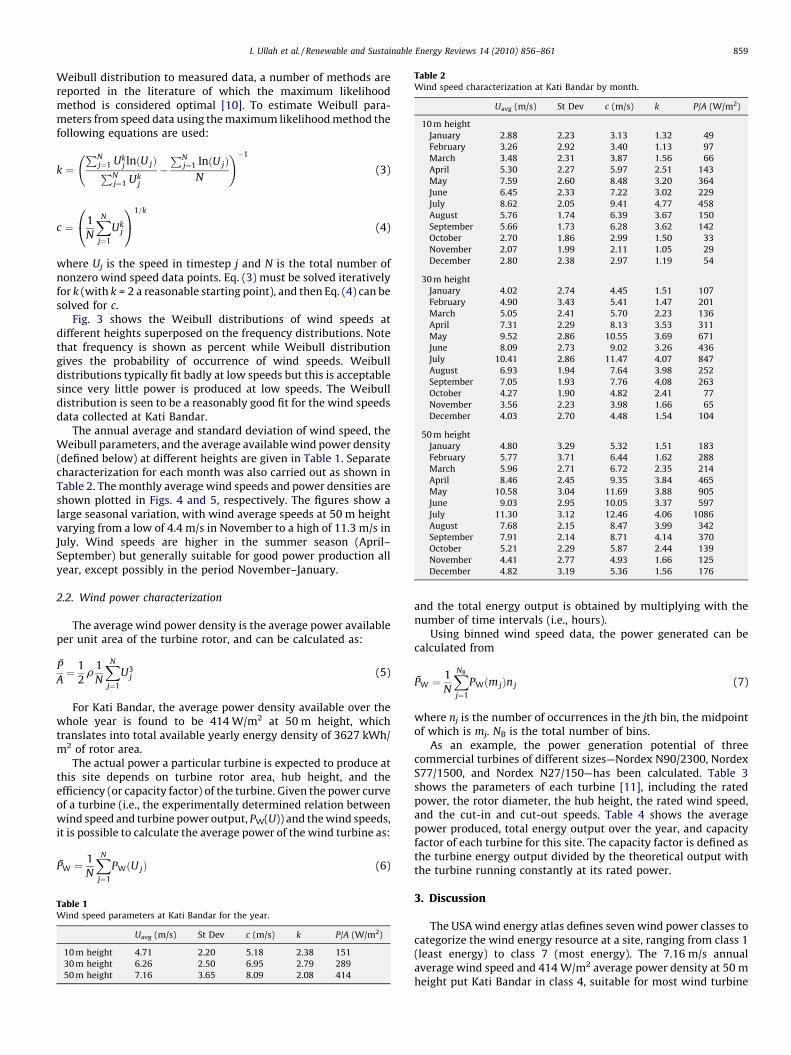
Table 2Wind speed characterization at Kati Bandar by month.
Uavg (m/s) St Dev c (m/s) k P/A (W/m2)
10 m height
January 2.88 2.23 3.13 1.32 49
February 3.26 2.92 3.40 1.13 97
March 3.48 2.31 3.87 1.56 66
April 5.30 2.27 5.97 2.51 143
May 7.59 2.60 8.48 3.20 364
June 6.45 2.33 7.22 3.02 229
July 8.62 2.05 9.41 4.77 458
August 5.76 1.74 6.39 3.67 150
September 5.66 1.73 6.28 3.62 142
October 2.70 1.86 2.99 1.50 33
November 2.07 1.99 2.11 1.05 29
December 2.80 2.38 2.97 1.19 54
30 m height
January 4.02 2.74 4.45 1.51 107
February 4.90 3.43 5.41 1.47 201
March 5.05 2.41 5.70 2.23 136
April 7.31 2.29 8.13 3.53 311
May 9.52 2.86 10.55 3.69 671
June 8.09 2.73 9.02 3.26 436
July 10.41 2.86 11.47 4.07 847
August 6.93 1.94 7.64 3.98 252
September 7.05 1.93 7.76 4.08 263
October 4.27 1.90 4.82 2.41 77
November 3.56 2.23 3.98 1.66 65
December 4.03 2.70 4.48 1.54 104
50 m height
January 4.80 3.29 5.32 1.51 183
February 5.77 3.71 6.44 1.62 288
March 5.96 2.71 6.72 2.35 214
April 8.46 2.45 9.35 3.84 465
May 10.58 3.04 11.69 3.88 905
June 9.03 2.95 10.05 3.37 597
July 11.30 3.12 12.46 4.06 1086
August 7.68 2.15 8.47 3.99 342
September 7.91 2.14 8.71 4.14 370
October 5.21 2.29 5.87 2.44 139
November 4.41 2.77 4.93 1.66 125
December 4.82 3.19 5.36 1.56 176
I. Ullah et al. / Renewable and Sustainable Energy Reviews 14 (2010) 856–861 859
Weibull distribution to measured data, a number of methods arereported in the literature of which the maximum likelihoodmethod is considered optimal [10]. To estimate Weibull para-meters from speed data using the maximum likelihood method thefollowing equations are used:
k ¼PN
j¼1 Ukj lnðU jÞPN
j¼1 Ukj
�PN
j¼1 lnðU jÞN
!�1
(3)
c ¼ 1
N
XN
j¼1
Ukj
0@
1A1=k
(4)
where Uj is the speed in timestep j and N is the total number ofnonzero wind speed data points. Eq. (3) must be solved iterativelyfor k (with k = 2 a reasonable starting point), and then Eq. (4) can besolved for c.
Fig. 3 shows the Weibull distributions of wind speeds atdifferent heights superposed on the frequency distributions. Notethat frequency is shown as percent while Weibull distributiongives the probability of occurrence of wind speeds. Weibulldistributions typically fit badly at low speeds but this is acceptablesince very little power is produced at low speeds. The Weibulldistribution is seen to be a reasonably good fit for the wind speedsdata collected at Kati Bandar.
The annual average and standard deviation of wind speed, theWeibull parameters, and the average available wind power density(defined below) at different heights are given in Table 1. Separatecharacterization for each month was also carried out as shown inTable 2. The monthly average wind speeds and power densities areshown plotted in Figs. 4 and 5, respectively. The figures show alarge seasonal variation, with wind average speeds at 50 m heightvarying from a low of 4.4 m/s in November to a high of 11.3 m/s inJuly. Wind speeds are higher in the summer season (April–September) but generally suitable for good power production allyear, except possibly in the period November–January.
2.2. Wind power characterization
The average wind power density is the average power availableper unit area of the turbine rotor, and can be calculated as:
P̄
A¼ 1
2r
1
N
XN
j¼1
U3j (5)
For Kati Bandar, the average power density available over thewhole year is found to be 414 W/m2 at 50 m height, whichtranslates into total available yearly energy density of 3627 kWh/m2 of rotor area.
The actual power a particular turbine is expected to produce atthis site depends on turbine rotor area, hub height, and theefficiency (or capacity factor) of the turbine. Given the power curveof a turbine (i.e., the experimentally determined relation betweenwind speed and turbine power output, PW(U)) and the wind speeds,it is possible to calculate the average power of the wind turbine as:
P̄W ¼1
N
XN
j¼1
PWðU jÞ (6)
Table 1Wind speed parameters at Kati Bandar for the year.
Uavg (m/s) St Dev c (m/s) k P/A (W/m2)
10 m height 4.71 2.20 5.18 2.38 151
30 m height 6.26 2.50 6.95 2.79 289
50 m height 7.16 3.65 8.09 2.08 414
and the total energy output is obtained by multiplying with thenumber of time intervals (i.e., hours).
Using binned wind speed data, the power generated can becalculated from
P̄W ¼1
N
XNB
j¼1
PWðm jÞn j (7)
where nj is the number of occurrences in the jth bin, the midpointof which is mj. NB is the total number of bins.
As an example, the power generation potential of threecommercial turbines of different sizes—Nordex N90/2300, NordexS77/1500, and Nordex N27/150—has been calculated. Table 3shows the parameters of each turbine [11], including the ratedpower, the rotor diameter, the hub height, the rated wind speed,and the cut-in and cut-out speeds. Table 4 shows the averagepower produced, total energy output over the year, and capacityfactor of each turbine for this site. The capacity factor is defined asthe turbine energy output divided by the theoretical output withthe turbine running constantly at its rated power.
3. Discussion
The USA wind energy atlas defines seven wind power classes tocategorize the wind energy resource at a site, ranging from class 1(least energy) to class 7 (most energy). The 7.16 m/s annualaverage wind speed and 414 W/m2 average power density at 50 mheight put Kati Bandar in class 4, suitable for most wind turbine
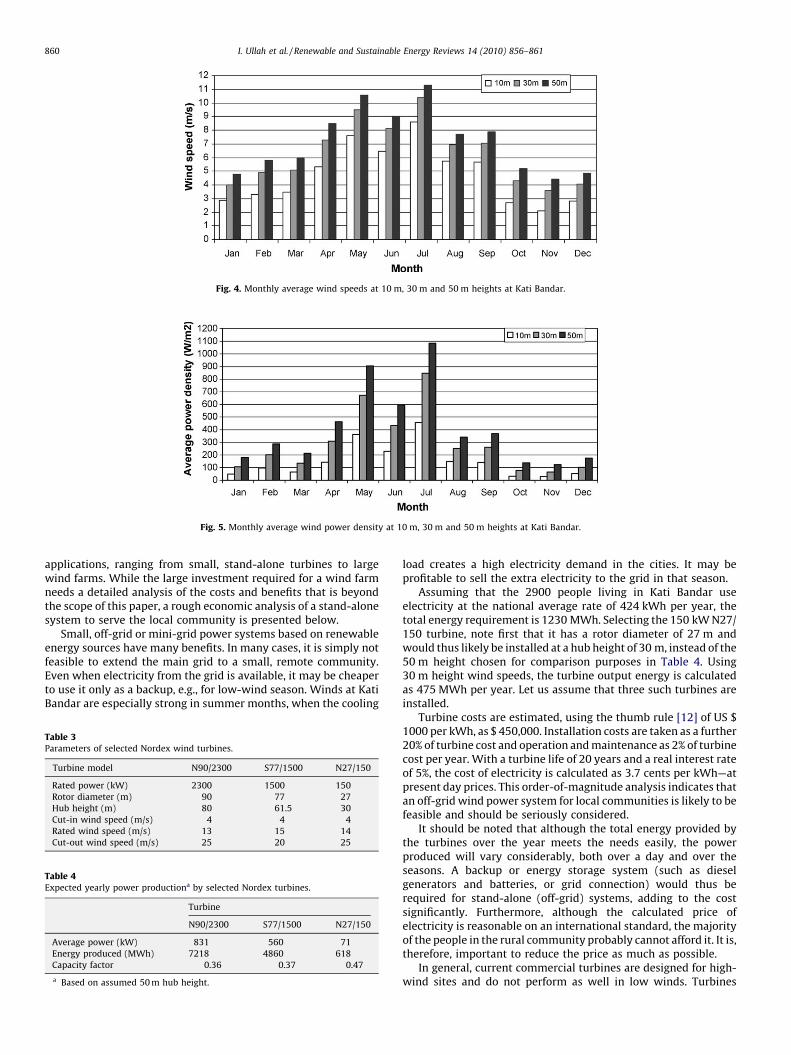
Fig. 4. Monthly average wind speeds at 10 m, 30 m and 50 m heights at Kati Bandar.
Fig. 5. Monthly average wind power density at 10 m, 30 m and 50 m heights at Kati Bandar.
I. Ullah et al. / Renewable and Sustainable Energy Reviews 14 (2010) 856–861860
applications, ranging from small, stand-alone turbines to largewind farms. While the large investment required for a wind farmneeds a detailed analysis of the costs and benefits that is beyondthe scope of this paper, a rough economic analysis of a stand-alonesystem to serve the local community is presented below.
Small, off-grid or mini-grid power systems based on renewableenergy sources have many benefits. In many cases, it is simply notfeasible to extend the main grid to a small, remote community.Even when electricity from the grid is available, it may be cheaperto use it only as a backup, e.g., for low-wind season. Winds at KatiBandar are especially strong in summer months, when the cooling
Table 3Parameters of selected Nordex wind turbines.
Turbine model N90/2300 S77/1500 N27/150
Rated power (kW) 2300 1500 150
Rotor diameter (m) 90 77 27
Hub height (m) 80 61.5 30
Cut-in wind speed (m/s) 4 4 4
Rated wind speed (m/s) 13 15 14
Cut-out wind speed (m/s) 25 20 25
Table 4Expected yearly power productiona by selected Nordex turbines.
Turbine
N90/2300 S77/1500 N27/150
Average power (kW) 831 560 71
Energy produced (MWh) 7218 4860 618
Capacity factor 0.36 0.37 0.47
a Based on assumed 50 m hub height.
load creates a high electricity demand in the cities. It may beprofitable to sell the extra electricity to the grid in that season.
Assuming that the 2900 people living in Kati Bandar useelectricity at the national average rate of 424 kWh per year, thetotal energy requirement is 1230 MWh. Selecting the 150 kW N27/150 turbine, note first that it has a rotor diameter of 27 m andwould thus likely be installed at a hub height of 30 m, instead of the50 m height chosen for comparison purposes in Table 4. Using30 m height wind speeds, the turbine output energy is calculatedas 475 MWh per year. Let us assume that three such turbines areinstalled.
Turbine costs are estimated, using the thumb rule [12] of US $1000 per kWh, as $ 450,000. Installation costs are taken as a further20% of turbine cost and operation and maintenance as 2% of turbinecost per year. With a turbine life of 20 years and a real interest rateof 5%, the cost of electricity is calculated as 3.7 cents per kWh—atpresent day prices. This order-of-magnitude analysis indicates thatan off-grid wind power system for local communities is likely to befeasible and should be seriously considered.
It should be noted that although the total energy provided bythe turbines over the year meets the needs easily, the powerproduced will vary considerably, both over a day and over theseasons. A backup or energy storage system (such as dieselgenerators and batteries, or grid connection) would thus berequired for stand-alone (off-grid) systems, adding to the costsignificantly. Furthermore, although the calculated price ofelectricity is reasonable on an international standard, the majorityof the people in the rural community probably cannot afford it. It is,therefore, important to reduce the price as much as possible.
In general, current commercial turbines are designed for high-wind sites and do not perform as well in low winds. Turbines
I. Ullah et al. / Renewable and Sustainable Energy Reviews 14 (2010) 856–861 861
designed to take advantage of local wind regimes will capturemore energy, thus lowering the cost. Manufacturing the turbineslocally could also bring down the costs substantially.
4. Conclusions
As a developing nation of energy-starved people, Pakistanurgently needs new sources of affordable, clean energy. Providingeven a minimal amount of electricity to roughly half the poorhouseholds currently without access would bring a hugeimprovement in the quality of life. Wind energy is an attractiveoption because of its low impact on environment, sustainability,and reasonable costs. An evaluation of the wind resource availableat Kati Bandar on the coast of Sindh shows that it is a class 4 windpower site, indicating its suitability for both large and small windpower projects. However, the price of electricity produced, thoughprobably reasonable by international standards, may be unafford-able for poor, rural communities. To lower the costs, it would benecessary to adapt turbine designs to local conditions and tomanufacture them locally.
References
[1] Ministry of Finance, Government of Pakistan. Economic Survey of Pakistan2007–08. http://www.finance.gov.pk/finance_economic_survey.aspx.
[2] International Energy Agency. IEA Energy Statistics. www.iea.org.[3] World Wind Energy Report 2008. www.wwindea.org.[4] Rehman S. Wind energy resources assessment for Yanbo, Saudi Arabia. Energy
Conversion and Management 2004;45:2019–32.[5] Lu L, Yang H, Burnett J. Investigation on wind power potential on Hong Kong
islands—an analysis of wind power and wind turbine characteristics. Renew-able Energy 2002;27:1–12.
[6] Vogiatzis N, Kotti K, Spanomitsios S, Stoukides M. Analysis of wind potentialand characteristics in North Aegean, Greece. Renewable Energy 2004;29:1193–208.
[7] Chaudhry MA, Raza R, Hayat SA. Renewable energy technologies in Pakistan:prospects and challenges. Renewable and Sustainable Energy Reviews2009;13:1657–62.
[8] Mirza UK, Ahmad N, Majeed T, Harijan K. Wind energy development inPakistan. Renewable and Sustainable Energy Reviews 2007;11(9):2179–90.
[9] Manwell JF, McGowan JG, Rogers AL. Wind energy explained. New York: JohnWiley; 2002.
[10] Seguro JV, Lambert TW. Modern estimation of the parameters of the weibullwind speed distribution for wind energy analysis. Journal of Wind Engineeringand Industrial Aerodynamics 2000;85:75–84.
[11] Nordex AG. Product Brochures. http://www.nordex-online.com.[12] Danish Wind Energy Association. Wind Energy Guided Tour. www.windpower.
org/en/tour.