an evaluation of the use of self-consolidating concrete
174
_______________________ Research Report No. 1 AN EVALUATION OF THE USE OF SELF-CONSOLIDATING CONCRETE (SCC) FOR DRILLED SHAFT APPLICATIONS Submitted to S&ME Inc. Mt. Pleasant, South Carolina Prepared by Joseph D. Bailey Anton K. Schindler Dan A. Brown OCTOBER 2005
Transcript of an evaluation of the use of self-consolidating concrete
_______________________
Research Report No. 1
AN EVALUATION OF THE USE OF
SELF-CONSOLIDATING CONCRETE (SCC) FOR
DRILLED SHAFT APPLICATIONS
Submitted to
S&ME Inc. Mt. Pleasant, South Carolina
Prepared by
Joseph D. Bailey Anton K. Schindler
Dan A. Brown
OCTOBER 2005

Research Report
Highway Research Center Project 4-20793
An Evaluation of the Use of Self-Consolidating Concrete (SCC) for
Drilled Shaft Applications
Prepared by:
Joseph D. Bailey
Anton K. Schindler
Dan A. Brown
Highway Research Center
and
Department of Civil Engineering
at
Auburn University
October 2005

i
DISCLAIMERS
The contents of this report reflect the views of the authors, who are responsible for the facts and
the accuracy of the data presented herein. The contents do not necessarily reflect the official
views or policies of Auburn University or the Federal Highway Administration. This report does
not constitute a standard, specification, or regulation.
NOT INTENDED FOR CONSTRUCTION, BIDDING, OR PERMIT PURPOSES
Anton K. Schindler, Ph.D.
Dan A. Brown, Ph.D., P.E.
Research Supervisors
ACKNOWLEDGEMENTS
The authors would like to express their gratitude to the Innovative Bridge Research and
Construction (IBRC) Program administered by the by the Federal Highway Administration for
providing funding for this project. The partnership with S&ME, Inc. is also appreciated. The
authors would like to acknowledge the various contributions of the following individuals:
Chris Dumas FHWA, Geotechnical Engineer, Baltimore, MD
Myint Lwin FHWA, Office of Bridge Technology, Washington, DC
Jeff Sizemore South Carolina DOT
Randy Cannon South Carolina DOT
Aaron Goldberg S&ME, Inc., Mt. Pleasant, SC
Eric Adams S&ME, Inc., Mt. Pleasant, SC
Charles Bell Twin City Concrete, Sherman Industries, Auburn, AL
Ron Weber Ready-Mix Concrete, Myrtle Beach, SC
Lee Frederick Winyah Concrete (APAC), South Carolina
Rickey Swancey Degussa Admixtures, Alabama
Richard Morrow Degussa Admixtures, Southeastern Region
Brandon Bailey Degussa Admixtures, North Carolina
Russell Hill Boral Material Technologies, Inc, Texas

ii
ABSTRACT
In drilled shaft construction, the recent development of sophisticated techniques for integrity and
load testing has lead to the ability to asses the quality of drilled shaft foundations in terms of
integrity and load carrying capabilities after they have been cast. Although this ability has lead to
better assessment of drilled shaft foundations, it has also given insight to problems that are
associated with materials and construction practices that has lead to defects or less than optimal
performance for drilled shaft foundations.
This study examines the more common problems associated with drilled shaft
foundations to emphasize the importance of constructability in design and workability in the
construction materials. The majority of these problems consist of the failure to adequately
consider one or more of the following issues:
• Workability of concrete for the duration of the pour
• Compatibility of the highly congested rebar cages and concrete being placed
• Bleeding and segregation
The main purpose of this study is to evaluate the use of self-consolidating concrete
(SCC) as a viable material to overcome these issues due to its high flowability, passing ability,
resistance to segregation, and reduced bleeding. A laboratory study will examine the difference
between ordinary drilled shaft concrete and self-consolidating concrete (SCC) for both fresh and
hardened properties. The fresh properties include filling ability, passing ability, segregation
resistance, workability over time, bleeding characteristics, and controlled setting, while the
hardened properties include the comparison of the compressive strength, elastic modulus, drying
shrinkage, and permeability.
The laboratory results for both the ordinary drilled shaft concrete (ODSC) and SCC
mixtures were evaluated and compared. The results show that SCC can be used to address
many of the problems associated with drilled shaft construction because of the inherent
workability, passing ability, resistance to segregation, and reduced bleeding of this type of
concrete. Furthermore, the data suggest that the use of SCC in drilled shaft applications can
provide similar or improved hardened concrete properties, which includes the compressive
strength, elastic modulus, drying shrinkage, and permeability. However, some potential concerns
for this material in drilled shaft applications include the general and overall lack of experience and
research, lack of standardized tests, lack of well-defined mixture proportioning, and larger
changes in workability compared to ODSC mixtures.

iii
TABLE OF CONTENTS
LIST OF TABLES ........................................................................................................................... vi
LIST OF FIGURES...........................................................................................................................vii
CHAPTER 1: INTRODUCTION ........................................................................................................ 1
1.1 Background ........................................................................................................................ 1
1.2 Research Objectives ........................................................................................................... 2
1.3 Report Scope and Outline ................................................................................................... 2
CHAPTER 2: LITERATURE REVIEW ON SELF-CONSOLIDATING CONCRETE ........................... 4
2.1 Introduction ......................................................................................................................... 4
2.2 SCC Testing Procedures .................................................................................................... 5
2.2.1 Slump Flow Test ........................................................................................................ 5
2.2.2 L- Box Test ................................................................................................................ 9
2.2.3 J-Ring Test ............................................................................................................. 10
2.2.4 Segregation Column Test ....................................................................................... 11
2.3 Fresh Concrete Properties................................................................................................. 12
2.3.1 Rheology ................................................................................................................. 13
2.3.2 Filling Ability ............................................................................................................. 14
2.3.3 Passing Ability.......................................................................................................... 15
2.3.4 Segregation Resistance ........................................................................................... 17
2.4 Hardened Concrete Properties........................................................................................... 19
2.4.1 Compressive Strength ............................................................................................. 20
2.4.2 Modulus of Elasticity ................................................................................................ 22
2.4.3 Drying Shrinkage ..................................................................................................... 24
2.4.4 Permeability ............................................................................................................ 28
2.5 Summary and Conclusions ................................................................................................ 31
CHAPTER 3: EXPERIENCES WITH DRILLED SHAFT CONCRETE ............................................. 33
3.1 Introduction ………………………. ...................................................................................... 33
3.2 Workability of Drilled Shaft Concrete.................................................................................. 34
3.3 Compatibility between Congested Rebar Cages and Concrete ......................................... 50
3.4 Segregation and Bleeding ................................................................................................. 55
3.5 Summary and Conclusions ............................................................................................... 59

iv
CHAPTER 4: LABORATORY TESTING PROGRAM AND MATERIALS ....................................... 61
4.1 Introduction ....................................................................................................................... 61
4.2 Requirements for ODSC and SCC Mixtures ...................................................................... 61
4.3 Laboratory Testing Program ............................................................................................. 62
4.3.1 Phase I – Effect of Type and Dosage of HRWRA ..................................................... 63
4.3.2 Phase II – Effect of Retarder Dosage ....................................................................... 65
4.3.3 Phase III – Appropriate SCC Mixing Procedure ........................................................ 67
4.3.4 Phase IV – Selection of SCC Properties .................................................................. 70
4.3.5 Phase V – Methods to Modify the Viscosity of SCC Mixtures ................................... 75
4.4 Raw Materials ................................................................................................................... 79
4.4.1 Cementitious Materials ............................................................................................ 79
4.4.2 Aggregates .............................................................................................................. 84
4.4.3 Chemical Admixtures ............................................................................................... 88
CHAPTER 5: LABORATORY EQUIPMENT, SPECIMENS, AND PROCEDURES ......................... 90
5.1 Introduction ....................................................................................................................... 90
5.2 Batching and Mixing Procedure ........................................................................................ 90
5.3 Fresh Property Testing ..................................................................................................... 92
5.3.1 Slump Test .............................................................................................................. 93
5.3.2 Slump Flow Test ..................................................................................................... 93
5.3.3 J-Ring Test ............................................................................................................. 95
5.3.4 L-Box Test .............................................................................................................. 97
5.3.5 Segregation Column Test ....................................................................................... 98
5.3.6 Bleeding Test ......................................................................................................... 100
5.3.7 Unit Weight and Air Content .................................................................................. 101
5.3.8 Making and Curing Specimens ............................................................................. 101
5.3.9 Time of Set ........................................................................................................... 101
5.4 Hardened Concrete Properties ........................................................................................ 102
5.4.1 Compressive Strength ........................................................................................... 102
5.4.2 Modulus of Elasticity ............................................................................................. 102
5.4.3 Drying Shrinkage ................................................................................................... 103
5.4.4 Permeability .......................................................................................................... 104
CHAPTER 6: PRESENTATION AND ANALYSIS OF RESULTS ................................................. 105
6.1 Introduction ..................................................................................................................... 105
6.2 Phase I - Selection of Type and Dosage of HWRWA ....................................................... 105
6.3 Phase II – Effect of Retarder Dosage .............................................................................. 106
6.4 Phase III - Appropriate SCC Mixing Procedure ................................................................ 109
6.5 Phase IV - Selection of SCC Properties .......................................................................... 110

v
6.5.1 Fresh Concrete Properties and Workability ............................................................. 110
6.5.2 Segregation and Bleeding Results ........................................................................ 117
6.5.3 Passing Ability: J-Ring and L-Box .......................................................................... 118
6.5.4 Compressive Strength ........................................................................................... 119
6.5.5 Modulus of Elasticity ............................................................................................. 121
6.5.6 Drying Shrinkage ................................................................................................... 124
6.5.7 Permeability .......................................................................................................... 125
6.5.8 Comparison between Laboratory and Field Conditions .......................................... 126
6.6 Phase V - Methods to Modify the Viscosity of SCC Mixtures .......................................... 135
6.6.1 Fresh Concrete Properties .................................................................................... 135
6.6.2 Hardened Concrete Properties .............................................................................. 139
6.6.3 Effect of VMA on Fresh Concrete Properties ........................................................ 149
6.7 Summary of Research Findings ..................................................................................... 151
CHAPTER 7: SUMMARY, CONCLUSIONS, AND RECOMMENDATIONS .................................. 153
7.1 Conclusions .................................................................................................................... 153
7.2 Recommendations........................................................................................................... 155
REFERENCES ............................................................................................................................. 157

vi
LIST OF TABLES
Table 2.1 Visual Stability Index (VSI) Rating .............................................................................. 8
Table 2.2 J-Ring Passing Ability Rating .................................................................................... 11
Table 2.3 Compressive Strength Results from Turcry et al.(2003) ..............................................22
Table 2.4 Mixture Proportions (Kim et al. 1998) ........................................................................ 27
Table 4.1 Concrete Mixture Proportions for Phase I .................................................................. 63
Table 4.2 Concrete Mixture Proportions for Phase II ................................................................. 65
Table 4.3 Concrete Mixture Proportions for Phase III ................................................................ 67
Table 4.4 Concrete Mixture Proportions for Phase IV ................................................................ 73
Table 4.5 Concrete Mixture Proportions for Phase V ................................................................. 77
Table 4.6 Chemical Analysis Results for the Giant Type I Cement ............................................ 80
Table 4.7 Chemical Analysis Results for the SEFA Group Class F Fly Ash ............................... 81
Table 4.8 Chemical Analysis Results for the Micron 3 Fly Ash ................................................... 82
Table 4.9 Specific Gravities for Cementitious Materials ............................................................. 82
Table 4.10 Specific Gravities and Absorption Capacities for Aggregate Sources ......................... 85
Table 5.1 Visual Stability Index (VSI) Rating ............................................................................ 95
Table 5.2 J-Ring Passing Ability Rating .................................................................................... 97
Table 6.1 Fresh Concrete Properties for Phase I .................................................................... 106
Table 6.2 Fresh Concrete Properties for Phase II ................................................................... 108
Table 6.3 Fresh Concrete Properties for Phase III .................................................................. 110
Table 6.4 Fresh Concrete Properties for ODSC Mixtures ....................................................... 112
Table 6.5 Fresh Concrete Properties for SCC Mixtures .......................................................... 113
Table 6.6 Segregation and Bleeding Results .......................................................................... 118
Table 6.7 Passing Ability Results for SCC Mixtures ................................................................ 119
Table 6.8 Fresh Concrete Properties for both Laboratory and Field Conditions ....................... 131
Table 6.9 Fresh Concrete Properties for Phase V .................................................................. 136
Table 6.10 Tabulated Results of the Effect of VMA on Fresh Concrete Properties..................... 150

vii
LIST OF FIGURES
Figure 2.1 Upright Slump Cone Method ....................................................................................... 5
Figure 2.2 Inverted Slump Cone Method ..................................................................................... 6
Figure 2.3 Visual Stability Index Rating ....................................................................................... 8
Figure 2.4 L-Box Testing Apparatus ............................................................................................ 9
Figure 2.5 J-Ring Testing Apparatus ......................................................................................... 10
Figure 2.6 Segregation Column Testing Apparatus .................................................................... 12
Figure 2.7 Bingham Fluid Model ................................................................................................ 13
Figure 2.8 Mechanism of Blocking ............................................................................................. 16
Figure 2.9 Blocking Ratios versus Reinforcement Spacing for Different Size Aggregate ............. 17
Figure 2.10 Average Compressive Strengths of SCC and Conventional Bridge Concretes
with w/c of 0.40 ......................................................................................................... 21
Figure 2.11 Elastic Modulus versus Sand-to-Aggregate Ratio ..................................................... 24
Figure 2.12 Aggregate Content versus Water-to-Cement Ratio ................................................... 25
Figure 2.13 Shrinkage Modification Factor for Different Sand-to-Aggregate Ratios ...................... 25
Figure 2.14 Shrinkage versus Cement Content ............................................................................ 26
Figure 2.15 Drying Shrinkage versus Age (Kim et al. 1998) ......................................................... 27
Figure 2.16 SCC versus Normal Concrete ................................................................................... 28
Figure 2.17 Drying Shrinkage versus Sand-to-Aggregate Ratio..................................................... 28
Figure 2.18 Coefficient of Permeability versus Capillary Porosity ................................................ 29
Figure 2.19 Coefficient of Permeability versus Water-to-Cement Ratio ........................................ 30
Figure 2.20 RCPT Values of SCC and Normal Concrete ............................................................. 30
Figure 3.1 Drilled Shaft Mixture with a Slump of Approximately 6.5 Inches ................................. 35
Figure 3.2 Drilled Shaft Mixture with a Slump of 8-9 Inches ........................................................ 35
Figure 3.3 Illustration of Tremie Placement ................................................................................ 37
Figure 3.4 Illustration of Entrapped Debris due to the Eruption of Fresh Concrete
through Stiff Concrete ............................................................................................... 38
Figure 3.5 Illustration of Entrapped Debris Seams due to Extraction of the Tremie...................... 39
Figure 3.6 Example 1 of Shaft Defects due to the Loss of Workability ........................................ 40
Figure 3.7 Example 2 of Shaft Defects due to the Loss of Workability ........................................ 40
Figure 3.8 Example 3 of Shaft Defects due to the Loss of Workability ........................................ 41
Figure 3.9 Example 4 of Shaft Defects due to the Loss of Workability ........................................ 41
Figure 3.10 Example 5 of Shaft Defects due to the Loss of Workability ......................................... 42
Figure 3.11 Illustration of a Cased Hole ....................................................................................... 43

viii
Figure 3.12 Necking and Arching due to the Extraction of the Casing when Workablility is
Lost .......................................................................................................................... 44
Figure 3.13 Shaft Defects due to the Extraction of the Casing ..................................................... 45
Figure 3.14 Slump Loss versus Time Relationship ...................................................................... 46
Figure 3.15 Slump Loss at 70°F for Two Different Brands of Type I Cement ................................ 46
Figure 3.16 Shaft Defects due to the Loss of Workability (left), After Removal of Surface
Flaws for Repairs ..................................................................................................... 47
Figure 3.17 Shaft Defects due to the Loss of Workability from Construction Delays ...................... 48
Figure 3.18 Screening of the Concrete due to Heavily Reinforced Rebar Cages .......................... 51
Figure 3.19 Elevation Difference between the Inside and Outside of a Rebar Cage due to
Screening of the Concrete Flow ................................................................................ 52
Figure 3.20 Shaft Defects due to the Screening of the Concrete Flow .......................................... 52
Figure 3.21 Oval Shaped Column with Figure 8 Rebar Cage ....................................................... 54
Figure 3.22 Shaft Defect due to Double Reinforcement Cages ..................................................... 54
Figure 3.23 Illustration of Bleeding in Freshly Placed Concrete .................................................... 56
Figure 3.24 Example 1 of Bleed Channels and Surface Streaks due to Bleed Water
Traveling along the Casing ....................................................................................... 57
Figure 3.25 Example 2 of Bleed Channels and Surface Streaks due to Bleed Water
Traveling along the Casing ....................................................................................... 57
Figure 3.26 Shaft Defect due to Bleed Water Traveling along the Casing ..................................... 59
Figure 4.1 Flow Chart for Phase I ............................................................................................. 64
Figure 4.2 Flow Chart for Phase II ............................................................................................. 66
Figure 4.3 Flow Chart for Phase III ........................................................................................... 69
Figure 4.4 Flow Chart for Phase IV ........................................................................................... 71
Figure 4.5 Example of Identification System for Ordinary Drilled Shaft Concrete ....................... 70
Figure 4.6 Example of Identification System for SCC Mixtures .................................................. 74
Figure 4.7 Example of Identification System for Phase V .......................................................... 76
Figure 4.8 Flow Chart for Phase V ............................................................................................ 78
Figure 4.9 Particle Size Analyzer .............................................................................................. 82
Figure 4.10 Laser Particle Size Analyzer Results ........................................................................ 83
Figure 4.11 Raw Material being Delivered from South Carolina ................................................... 84
Figure 4.12 No. 67 Coarse Aggregate Gradation for South Carolina Material .............................. 85
Figure 4.13 No. 789 Coarse Aggregate Gradation for South Carolina Material ............................ 86
Figure 4.14 Fine Aggregate Gradation for South Carolina Material .............................................. 86
Figure 4.15 No. 67 Coarse Aggregate Gradation for Alabama Material ....................................... 87
Figure 4.16 No. 89 Coarse Aggregate Gradation for Alabama Material ....................................... 87
Figure 4.17 Fine Aggregate Gradation for Alabama Material ....................................................... 88

ix
Figure 5.1 New Indoor Mixing Facility ........................................................................................ 91
Figure 5.2 12 ft3 Concrete Mixer used for this Research ............................................................ 92
Figure 5.3 Testing Equipment for Slump Flow Test .................................................................... 93
Figure 5.4 Visual Stability Index Rating ..................................................................................... 95
Figure 5.5 Testing Equipment for J-Ring Test ............................................................................ 96
Figure 5.6 L-Box Dimensions .................................................................................................... 97
Figure 5.7 Testing Equipment for L-Box Test ............................................................................. 98
Figure 5.8 Testing Equipment for Segregation Column Test ...................................................... 99
Figure 5.9 Concrete Specimen with Compressometer Attached ............................................... 103
Figure 5.10 Model 164 Test Set and Proove’ It Cells ................................................................. 104
Figure 6.1 Slump Flow vs. Concrete Age for Phase I ............................................................... 107
Figure 6.2 Slump Flow vs. Concrete Age for Phase II .............................................................. 108
Figure 6.3 Penetration Resistance vs. Concrete Age for Phase II ............................................ 109
Figure 6.4 Slump Flow vs. Concrete Age for Phase III ............................................................. 111
Figure 6.5 Workability of ODSC Mixture (approximately 8.25 inches) ....................................... 114
Figure 6.6 Workability of SCC Mixture (approximately 20 inch slump flow) ............................... 114
Figure 6.7 Slump vs. Concrete Age ......................................................................................... 115
Figure 6.8 Slump Flow vs. Concrete Age ................................................................................. 116
Figure 6.9 Slump vs. Concrete Age for all Concrete Mixtures .................................................. 116
Figure 6.10 Penetration Resistance vs. Concrete Age ............................................................... 117
Figure 6.11 Compressive Strength vs. Concrete Age for Phase IV ............................................ 120
Figure 6.12 Modulus of Elasticity vs. Concrete Age for Phase IV ............................................... 122
Figure 6.13 Predicted vs. Measured Elastic Modulus according to ACI 318 (2002) -
(Phase IV)............................................................................................................... 123
Figure 6.14 Predicted vs. Measured Elastic Modulus According to ACI 363 (2002) -
(Phase IV)............................................................................................................... 123
Figure 6.15 Drying Shrinkage vs. Concrete Age ........................................................................ 124
Figure 6.16 91-Day Permeability Results ................................................................................... 126
Figure 6.17 365-Day Permeability Results ................................................................................. 127
Figure 6.18 Attaining Raw Materials from Stock Piles ................................................................ 128
Figure 6.19 Unloading Raw Materials onto Conveyer Belt ......................................................... 128
Figure 6.20 Raw Materials being Delivered to Hopper via Conveyer Belt ................................... 129
Figure 6.21 Raw Materials being Mixed by Ready Mix Truck ..................................................... 129
Figure 6.22 Slump Flow vs. Mixing Time under Laboratory and Field Conditions ....................... 131
Figure 6.23 Temperature Profile Obtained from I-Button ............................................................ 132
Figure 6.24 Penetration Resistance vs. Concrete Age under Laboratory and Field
Conditions .............................................................................................................. 133

x
Figure 6.25 Compressive Strength vs. Concrete Age under Laboratory and Field
Conditions............................................................................................................... 134
Figure 6.26 Modulus of Elasticity vs. Concrete Age under Laboratory and Field
Conditions............................................................................................................... 134
Figure 6.27 Compressive Strength vs. Concrete Age for VMA Mixtures...................................... 140
Figure 6.28 Modulus of Elasticity vs. Concrete Age for VMA Mixtures ........................................ 140
Figure 6.29 Compressive Strength vs. Concrete Age for Fly Ash Mixtures.................................. 141
Figure 6.30 Modulus of Elasticity vs. Concrete Age for Fly Ash Mixtures..................................... 141
Figure 6.31 Compressive Strength vs. Concrete Age for Silica Fume Mixtures ........................... 142
Figure 6.32 Modulus of Elasticity vs. Concrete Age for Silica Fume Mixtures .............................. 142
Figure 6.33 Compressive Strength vs. Concrete Age for GGBFS Mixtures ................................. 143
Figure 6.34 Modulus of Elasticity vs. Concrete Age for GGBFS Mixtures ................................... 143
Figure 6.35 Compressive Strength vs. Concrete Age for Micron 3 Mixtures ................................ 144
Figure 6.36 Modulus of Elasticity vs. Concrete Age for Micron 3 Mixtures .................................. 144
Figure 6.37 Compressive Strength vs. Concrete Age for Limestone Mixtures ............................. 145
Figure 6.38 Modulus of Elasticity vs. Concrete Age for Limestone Mixtures ................................ 145
Figure 6.39 Predicted vs. Measured Elastic Modulus According to ACI 318 (2002) -
(Phase V) ............................................................................................................... 148
Figure 6.40 Predicted vs. Measured Elastic Modulus According to ACI 363 (2002) -
(Phase V) ............................................................................................................... 148
Figure 6.41 Graphical Results of the Effect of VMA on Fresh Concrete Properties ..................... 150

1
Chapter 1
INTRODUCTION
1.1 BACKGROUND
In recent years, drilled shaft concrete mixtures are facing increasing demands for fluidity. One of
the primary reasons for this increased need for fluidity is the utilization of larger diameter shafts,
deeper shafts, and congested rebar cages. The use of larger diameter shafts that are designed
for large bending moments and seismic conditions require high amounts of reinforcement to be
placed within the shaft. Consequently, the rebar cages have become progressively more
congested and resistive to concrete flow. The addition of numerous access tubes for integrity
testing has also lead to increased congestion in the rebar cages. These heavily congested rebar
cages have lead to increased blockage due to the contact within the aggregates when the
concrete is forced through the rebar cage. Even when a concrete mixture has sufficient
workability, blockage could occur due to the bridging of the coarse aggregate at the vicinity of the
reinforcement bars. In addition, tremie placement of drilled shaft concrete may require prolonged
periods for concrete placement, which may result in a loss of concrete workability before the shaft
is completed. It has been observed by experienced engineers that this loss of workability has
lead to structural defects due to the entrapment of debris within the shaft. These large diameter
and deep shafts also call for large amounts of concrete to be placed. Case studies have shown
that with these massive concrete pours large amounts of bleed water can be generated and
begins to rise up in the column. The rising bleed water can result in larger interfacial transition
zones, loss of bond between the reinforcement and concrete, surface streaking, and vertical
bleed channels in the interior of the shaft.
Many state DOT specifications have not kept appropriate workability considerations as a
special aspect of drilled shaft concrete to meet these increasing demands for fluidity. For this
reason, other viable materials such as self-consolidating concrete (SCC) could be possible
solutions for this increased need for fluidity. Although the use of SCC has been largely
implemented in the precast/prestressed industry, the potential benefits in drilled shaft construction
are enormous. SCC has the potential to address many of the problems associated with drilled
shaft construction because of the inherent workability, passing ability, resistance to segregation,
and reduced bleeding of this type of concrete. The general requirements for SCC mixtures are as
follows:

2
• Reduced volume of coarse aggregate: as the size and amount of coarse aggregate plays
an important role on the passing ability of the concrete mixture.
• Increased volume of paste: the friction between the aggregate controls the spreading and
the filling ability of the concrete.
• Increased volume of very fine material: this ensures sufficient workability while reducing
the risk of segregation and bleeding.
• High dosage of high-range water reducing admixtures: these provide the necessary
fluidity.
• Viscosity modifying admixture (VMA): these admixtures can potentially reduce bleeding
and coarse aggregate segregation.
SCC has not currently been used for drilled shaft construction in North America. Some of the
potential impediments include the general and overall lack of experience and research with these
concrete mixtures for drilled shaft construction. As a result, extensive research must be
conducted to generate interest in the construction community and to develop DOT acceptance of
the use of SCC in drilled shaft construction, especially when inspection is difficult.
1.2 OBJECTIVES
The primary objectives of this research are to evaluate the use of SCC in drilled shaft
construction, identify appropriate testing techniques and characteristics for this specific
application, and potential problems or concerns with the use of SCC in drilled shaft construction.
A laboratory testing program as well as a later full-scale field study will examine the difference
between ordinary drilled shaft concrete and SCC for both fresh and hardened properties. The
fresh properties include filling ability, passing ability, segregation resistance, workability over time,
bleeding characteristics, and controlled setting, while the hardened properties include the
comparison of the compressive strength, elastic modulus, drying shrinkage, and permeability. It
is anticipated that this research will lead to additional interest in this topic from state and national
transportation agencies. While there is considerable research being directed toward SCC as a
material, this research will be primarily focused upon the application of this technology to the
drilled shaft industry.
1.3 REPORT SCOPE AND OUTLINE
This research project was subject to a literature review of published material related to SCC.
Chapter 2 of this thesis contains information regarding the factors that influence both the fresh
and hardened concrete properties of SCC. These fresh properties primarily consist of the filling
ability, passing ability, and segregation resistance, while the hardened concrete properties

3
include compressive strength, modulus of elasticity, drying shrinkage, and permeability. Chapter
3 will address several aspects of design and construction that are essential for high-quality drilled
shaft concrete and problems that are encountered in drilled shaft construction that leads to poor
quality drilled shaft foundations. Selected examples of more common problems associated with
drilled shaft concrete are cited in this chapter so that these problems can be understood.
Chapters 4 and 5 present the laboratory testing program, raw materials, and testing
procedures for both fresh and hardened concrete properties utilized for this research project.
Chapter 6 provides an in-depth discussion and analysis of the laboratory testing program as well
as providing for a comparison between ordinary drilled shaft concrete and SCC for fresh and
hardened concrete properties.
Finally, Chapter 7 offers conclusions and recommendations based on the results and
analysis provided in Chapter 6.

4
Chapter 2
LITERATURE REVIEW ON SELF-CONSOLIDATING CONCRETE
A review of literature pertaining to relevant research topics associated with self-consolidating
concrete (SCC) is presented in this chapter. The topics covered include a background of SCC,
SCC testing procedures, fresh concrete properties of SCC, and hardened concrete properties of
SCC.
2.1 INTRODUCTION
In the early 1980s, durability issues related to concrete structures were a major concern and topic
of interest in Japan. The gradual reduction in high-quality construction practice and concrete
placement by unskilled labor resulted in deficient concrete structures (Okamura and Ouchi 1999).
In an effort to produce durable concrete structures independent of the quality of construction
practice, Professor Hajime Okamura at the University of Tokyo developed self-consolidating
concrete that would be able to consolidate under its own weight without the need for external
vibration.
Self-consolidating concrete is able to fill formwork, encapsulate reinforcement bars, and
consolidate under its own weight. At the same time it is cohesive enough to maintain its
homogeneity without segregation or bleeding. This makes SCC useful in applications where
placing concrete is difficult, such as heavily-reinforced concrete structures or where formwork is
complex. Rilem Report 23 from Technical Committee 174-SCC (Skarendahl 2000) suggests that
three main functional requirements of SCC are as follows:
1. Filling Ability: The ability of the concrete to completely fill formwork and encapsulate
reinforcement without the use of external vibration.
2. Passing Ability: The ability of the concrete to pass through restrictive sections of
formwork and tightly spaced reinforcement bars without blockage due to interlocking of
aggregate.
3. Segregation Resistance: The ability of the concrete to keep particles in a homogenous
suspension throughout mixing, transportation, and placement.
The objective with the development of SCC is to overcome problems associated with
conventional concrete that include improper consolidation, inability to pass and encapsulate
reinforcement bars, and the incapability to adequately fill formwork. However, the acceptance
and application of SCC in North America requires an orderly and conscious approach because

5
suppliers, contractors, engineers, and architects are concerned with different aspects of the
concrete’s performance (Khayat and Daczko 2003). In addition, this approach is imperative
because SCC is being developed by multiple agencies with different approaches, and there is a
lack of standardized tests to assess the quality of SCC. This has led well-known organizations,
such as ASTM and RILEM, to address this issue and develop standardized testing procedures.
As standardized tests and well-defined mixture proportioning become available, the
familiarity and use among suppliers, contractors, engineers, and architects will increase with
confidence allowing the user to quantify the benefits of SCC. Some of these benefits include
reduced labor cost, superior finish, reduced need for surface patching, no vibration, and reduction
in noise pollution.
2.2 SCC TESTING PROCEDURES
The Filling Ability, Passing Ability, and Segregation Resistance of a SCC mixture must be
evaluated through appropriate test methods to determine its quality. These properties are not
independent from each other, but interrelated in some aspect. For example, the deformation
capacity or filling ability is in part related to the viscosity, where the viscosity is strongly related to
the segregation resistance. For that reason, some of the tests developed for SCC evaluate one
or more of the fresh properties. Numerous tests have been developed for the evaluation of the
fresh properties of SCC; however, a review of test methods that are relevant to this research and
drilled shaft applications is presented in this section. The tests covered include the slump flow
test, L-Box, J-Ring, and segregation column. The information presented in this section is offered
only as a guide until standardized tests are developed for SCC testing.
2.2.1 Slump Flow Test
The assessment of SCC to flow involves the evaluation of the filling ability or deformation
capacity. The slump flow test is one of the most common and popular test to evaluate the
deformation capacity of SCC because the procedure and apparatus are relatively simple (Takada
and Tangtermsirikul 2000). The slump flow test is used to assess the filling ability of SCC in the
absence of obstructions. The rate of deformability can be assessed by determining the T50 time
while the segregation resistance can to a certain degree be visually inspected. The T50 time
corresponds to the time that it takes for the concrete to flow 20 inches during the slump flow test.
The slump flow test consists of filling an ordinary slump cone with SCC without any
rodding. The cone is then lifted and the mean diameter is measured after the concrete has
ceased flowing. The apparatus for the slump flow test can be seen in Figure 2.1. The PCI (2003)
states that it can be argued that because the slump flow test only assesses the free flow,
unrestricted by boundaries, it is not representative of what happens in concrete construction.

6
However, the slump flow test is useful in evaluating the consistency of SCC as delivered to the
job site, and it gives some indication of segregation resistance by visual observation (PCI 2003).
Figure 2.1: Upright Slump Cone Method (PCI 2003)
The slump flow test can be performed in the upright or inverted position, and the method utilized
should be used consistently without switching from one to the other. The upright and inverted
methods can be seen in Figures 2.1 and 2.2, respectively. The inverted method allows the slump
cone to be easily filled by pouring the sample into a larger opening, which reduces the amount of
spillage. Furthermore, the inverted method does not require a person to stand on the slump flow
table because the weight of the concrete holds the cone downward onto the table. Ramsburg
(2003) reports that it is possible that only one technician can conduct the slump flow by either
method, though most users state that two technicians are needed for the upright position.
However, one may argue that the two methods will produce different slump flow values. A recent
study conducted by Oldcastle Inc. evaluated the difference in slump flow values between the two
methods using three different mix designs with three different levels of performance (Ramsburg
2003). The three different levels of performance were slump flows less than 25 inches, slump
flows over 25 inches, and slump flows over 25 inches with noted segregation and bleeding. The
results indicate that there is only a minimal difference in the slump flow between the two methods.

7
Figure 2.2: Inverted Slump Cone Method (PCI 2003)
As previously reported, the T50 time corresponds to the time that it takes for the concrete to flow
20 inches during the slump flow test. The T50 time is often used to evaluate the viscosity or rate
of deformability of SCC. However, Takada and Tangtermsirikul (2000) reported that the T50 time
is not a direct measure of the viscosity of the mix independent of the slump flow value. For
instance, a larger slump flow value will produce a lower T50 time when the viscosity of the mix is
constant. The T50 time can be used to evaluate the difference in viscosity of mixtures only when
the slump flow value is constant (Takada and Tangtermsirikul 2000). Additionally, the T50 time
can be used as an indication of production uniformity of a given SCC mixture. The PCI (2003)
states that the T50 time should not be used as a factor to reject a batch of SCC, but rather as a
quality control test. However, recent provisions provided by the FDOT state that the T50 time
should be between 2 and 7 seconds for acceptance purposes (Mujtaba 2004).
Ramsburg (2003) reports that the T50 times are somewhat arbitrary due to the difficulty of
starting and stopping a clock while conducting the slump flow test. This issue is more of a
concern as the T50 times become lower, where the possible intervals are less than 1.5 seconds.
Furthermore, the tests conducted by Oldcastle Inc. show an increase in T50 times when
performing the inverted slump flow test (Ramsburg 2003). It was further determined that as the
slump values increased, the difference in T50 times were found to be less obvious between the
two methods. Moreover, the inverted method could possibly improve the accuracy of the T50
times when the intervals are only a few seconds; thus, a small difference in viscosity could be
more noticeable with the inverted method (Ramsburg 2003).
One of the most critical requirements for SCC is that it must not segregate during or after
placement. The slump flow test provides an indication of the segregation resistance by visual
observation. Therefore, the visual stability index (VSI) was developed to determine the ability of a

8
SCC mixture to resist segregation. The VSI procedure is to assign a numerical rating from 0 to 3,
in increments of 0.5, based on the homogeneity of the mixture after the slump flow test has been
conducted. To differentiate the textural properties of SCC, it should be ranked according to Table
2.1 and Figure 2.3.
Table 2.1: Visual Stability Index (VSI) Rating (Khayat et al. 2004)
Rating Criteria
0 No evidence of segregation in slump flow patty, mixer drum,
or wheelbarrow
1 No mortar halo in slump flow patty, but some slight bleeding on
surface of concrete in mixer drum and/or wheelbarrow
2
Slight mortar halo (<10mm) in slump flow patty and noticeable
layer of mortar on surface of testing concrete in mixer drum and
wheelbarrow
3
Clearly segregating by evidence of large mortar halo (>10mm)
and thick layer of mortar and/or bleed water on surface of testing
concrete in mixer drum or wheelbarrow
Figure 2.3: Visual Stability Index Rating (Degussa Construction Chemicals 2004)

9
The basis for the VSI is that when the segregation resistance is not sufficient, the coarse
aggregate will tend to stay in the center of the slump flow patty and mortar at the SCC border
(Takada and Tangtermsirikul 2000, and PCI 2003). In the case of minor segregation, a border of
mortar without coarse aggregate can occur at the edge of the slump flow patty (PCI 2003). Since
the slump flow patty has no significant depth through which settlement of aggregate can occur,
the visual inspection of SCC in the wheelbarrow or mixer should be part of the process in
determining the VSI rating (PCI 2003). In fact, Bonen and Shah (2004) state that visual
evaluation of segregation from the slump flow patty is an inadequate measure for predicting
segregation resistance in the static state. Khayat et al. (2004) reports that the VSI rating of the
slump flow patty is considered part of the dynamic stability given the fact the concrete can exhibit
some non-uniform texture following some mixing and transport; whereas, the VSI can be
considered as a static stability index when it is observed in the wheelbarrow or mixer following
some period of rest time.
2.2.2 L- Box Test
The L-Box is used to assess the passing ability of a SCC mixture. This test is suitable for
laboratory and perhaps for site purposes (PCI 2003). The apparatus consist of a rectangular-
section box in shape of an “L” with a vertical and horizontal section separated by a removable
gate as shown in Figure 2.4. The L-Box is equipped with reinforcement bars separated by narrow
openings that are designed to evaluate the passing ability of a SCC mixture. The reinforcement
bars can be different diameters and spaced at different intervals (PCI 2003). The PCI (2003)
suggests that three times the maximum aggregate size may be appropriate for the reinforcement
spacing.
Figure 2.4: L-Box Testing Apparatus (PCI 2003)

10
The L-Box test is conducted by filling the vertical section of the L-Box with SCC, and then the
removable gate is lifted to allow the SCC to flow into the horizontal section (PCI 2003). After the
flow has ceased, the height of the SCC at the end of the horizontal section (H2) and the remaining
SCC in the vertical section (H1) is measured and expressed as a blocking ratio. This blocking
ratio (H2/H1) is an indication of the passing ability of a SCC mixture. The closer the blocking ratio
is to 1, the better the passing ability of the SCC mixture. Petersson (2000) reports that according
to Swedish experience, a blocking ratio of 0.80- 0.85 is an acceptable range of values.
2.2.3 J-Ring Test
The J-Ring test is used to determine the passing ability of a SCC mixture. This test is suitable for
laboratory and perhaps for site purposes (PCI 2003). The equipment consists of an open steel
circular ring, drilled vertically to accept sections of reinforcement bars as shown in Figure 2.5.
The rods can be different diameters and spaced at different intervals (PCI 2003). The PCI (2003)
suggests that three times the maximum size aggregate may be appropriate for the reinforcement
spacing. The spacing of the rods at different intervals will impose a more or less severe test of
the passing ability depending on the application.
Figure 2.5: J-Ring Testing Apparatus (ASTM J-Ring Draft 2004)
The J-Ring test is used in conjunction with the slump flow test. The combination of the two tests
will allow the assessment of the passing ability of the SCC mix design. This test is performed in
the same manner as the slump flow test with the addition of the J-Ring. The difference between
the slump flow and the J-Ring flow is compared, and then a passing ability rating is assigned
according to Table 2.2. The larger the difference between the slump flow and the J-Ring flow

11
indicates less passing ability. Recent provisions provided by the FDOT state that the difference
between the slump flow and the J-Ring flow should be no more than 2 inches (Mujtaba 2004).
Table 2.2: J-Ring Passing Ability Rating (ASTM J-Ring Draft 2004)
Difference between
Slump Flow
and J-Ring Flow
Passing Ability
Rating Remarks
0 = X = 1 inch 0 No visible blocking
1 < X = 2 inches 1 Minimal to noticeable blocking
X > 2 inches 2 Noticeable to extreme blocking
2.2.4 Segregation Column Test
The segregation column test is used to determine the stability and segregation resistance of a
SCC mixture. This test can be used for both laboratory and perhaps site purposes (ASTM
Segregation Column Draft 2004). The equipment consists of an 8-inch diameter by 26-inch tall
schedule 40 PVC pipe. The PVC pipe is separated into 4 equal sections each measuring 6.5-
inches in height. A collector plate measuring 20-in. x 20-in. is used to collect the concrete from
the different sections of the column. The segregation column and the collector plate can be seen
in Figure 2.6.
The segregation column test is conducted by placing a sample of concrete in the cylinder
mold in one lift without any means of mechanical vibration. After the concrete is allowed to sit for
15 minutes, the concrete column is separated into four equal sections using the collector plate.
The concrete from the top and bottom section is wet-washed through a No. 4 sieve leaving the
coarse aggregate on the sieve. The mass of aggregate from these sections of the column is
obtained, and a segregation index is determined using Equation 2.1.
MB
TB
CACACA
SI)( −
= Equation 2.1
In Equation 2.1, SI is the segregation index, CAT is the mass of coarse aggregate in the top
section, CAB is the mass of coarse aggregate in the bottom section, and CABM is the mass coarse
aggregate per section of the column according to Equation 2.2.
[ ]MMBM CACACA ∗∗= 0052.0007.0 Equation 2.2
In Equation 2.2, CAM is the mass of coarse aggregate in 1 yd3 of concrete.

12
Figure 2.6: Segregation Column Testing Apparatus (ASTM Segregation Column Draft 2004)
2.3 FRESH CONCRETE PROPERTIES
SCC is characterized by its filling ability, passing ability, and segregation resistance. SCC has to
have a low yield stress value to ensure high flowability, small aggregate particles to prevent

13
blockage, and adequate viscosity to prevent segregation. Thus, these characteristics must be
discussed in further detail to allow the user to develop a well-designed SCC mixture.
2.3.1 Rheology
Before discussing the various ways to modify SCC characteristics, it is helpful to discuss a few
basic principles of rheology. Rheology can be described as the study of deformation and flow of
matter under stress (Mindess et al. 2003). Understanding and knowledge of rheology behavior
has been essential in the development of self-consolidating concrete and influences the
performance of the fresh concrete properties. The rheology of concrete, paste, or mortar may be
characterized by its yield stress and plastic viscosity. The rheology of fresh concrete, including
self-consolidating concrete, is most often defined by the Bingham Fluid Model using Equation 2.3
(Mindess et al. 2003).
γµττ *+= o Equation 2.3
In Equation 2.3, τ is the shear stress in psi, τo is the yield stress in psi, µ is the plastic viscosity in
psi . seconds, and γ is the shear strain in 1/seconds. Figure 2.7 shows that the Bingham Fluid
Model requires a yield stress to obtain a strain that is followed by increasing shear stress with
increasing shear strain (Khayat and Tangtermsirikul 2000). Khayat and Tangtermsirikul (2000)
report that the target rheological properties for SCC are a low yield stress value together with an
adequate plastic viscosity.
Figure 2.7: Bingham Fluid Model
A number of rheometers, e.g. BML viscometer and BTRHEOM rheometer, have been developed
to measure the true rheological properties of fresh concrete. Rheometers provide two
parameters, namely the initial yield stress value and the plastic viscosity, to characterize the fresh
properties. These rheometers are useful in evaluating what the effects of different materials,
such as cements, fillers, aggregates, mineral admixtures, and chemical admixtures have on the

14
yield stress and plastic viscosity. According to Emborg (1999), rheometers are considered to be
the most accurate way to describe the real behavior of fresh concrete. However, rheometers are
based on different principles, and the results from different rheometers can not be easily
compared. While it is likely that the use of rheology tests and rheometers will increase in the
future, rheometers are expensive to purchase and existing tests are primarily used for initial
mixture proportioning, testing, and research efforts.
2.3.2 Filling Ability
Self-consolidating concrete must be able to fill formwork and encapsulate reinforcement without
the use of external vibration. The high deformation capacity of SCC is related to the yield stress;
thus, the yield stress must be reduced in order to ensure that SCC can flow around obstacles and
achieve good filling ability. The deformation capacity can be increased by the reduction of
interparticle friction between the solid particles, which include the paste, coarse aggregate, and
fine aggregate (Khayat and Tangtermsirikul 2000). The interparticle friction between the paste
particles requires the dispersion of fine material by superplasticizers. Khayat and Tangtermsirikul
(2000) state that unlike water that reduces both the yield stress and viscosity, superplasticizers
reduce the yield stress and cause a limited decrease in viscosity. As a result, the addition of
superplasticizers can provide highly flowable concrete without a significant reduction in
cohesiveness. In order to reduce interparticle friction due to aggregate-aggregate contact,
Khayat and Tangtermsirikul (2000) recommend that the interparticle distance between the
aggregate be increased. This is achieved by reducing the total aggregate content and increasing
the paste content. Thus, the following actions should be taken to achieve adequate filling ability
(Khayat and Tangtermsirikul 2000):
1. Increase the deformability of the paste
• Balanced water-to-cementitious materials ratio (Balanced so that adequate
deformability and deformation velocity can be achieved)
• Superplasticizers
2. Reduced interparticle friction
• Low coarse aggregate volume
• Higher paste contents
Although different superplasticizers are available in the market today, almost all new and
innovative superplasticizers are polycarboxylate based mixtures (Bonen and Shah 2004). It must
be noted that the following discussion is based on the work of Bury and Christensen (2003).
These polycarboxylate based superplasticizers are characterized by their strong dispersing
action, controlled slump retention, enhanced concrete stability, enhanced pumping ability, and
enhanced finishing ability. These superplasticizers function by imparting a negative charge on
the cement particles that cause them to repel from one another. Traditional superplasticizers also
function in this manner, but the new polycarboxylate based superplasticizers have side chains

15
with varying lengths that aid in keeping the cement particles apart allowing water to surround
more surface area of the cement particle (steric hindrance).
The effectiveness of superplasticizers last only as long as there is sufficient molecules
available to cover the surface area of the cement particles. Therefore, it is likely that with time
and prolonged mixing the effectiveness of the superplasticizers will become inadequate and the
workability of the mix will be lost. Repeated addition of superplasticizers may be beneficial from
the standpoint of workability; however, it may increase bleeding, segregation, and change the
amount of entrained air (Neville 1996). Neville (1996) goes on to suggest that the workability
regained from the re-dosage may decrease at a faster rate. Therefore, the re-dosage should be
applied immediately prior to placement according to the recommendations of the admixture
supplier.
Bonen and Shah (2004) state that the use of fine material, such as silica fume, will
increase the yield stress because of greater water absorbance. Thus, it would be expected that
the superplasticizer dosage should be increased to obtain the same slump flow. Ferraris et al.
(2001) reported that with a constant amount of water and cementitious material, the addition of
8% and 12% silica fume increased the superplasticizer dosage by 30% and 50% over the control
mix. In fact, it is usually reported that if the volume concentration of solids is held constant, the
addition of a fine material will decrease the workability (Ferraris et al. 2001). The most common
reason for this reduction in workability is due to increased surface area of the fine material, which
will increase the superplasticizer demand for the same water content. However, it is reported in
some cases that the addition of fine material can decrease the water demand. Ferraris et al.
(2001) states that the reduction of water demand for fine material, especially fly ash, is due to
spherical particles that easily move past each other reducing the interparticle friction.
The aggregate shape also influences the filling ability to a certain degree. It is reported
that flat and elongated particles will lead to a decrease in the workability (Hodgson 2003). This is
due to the fact that angular aggregate will have more mechanical interlocking and will need more
work to overcome interparticle friction. For example, Petersson (1999) states that when crushed
sand is used, the fluidity is decreased for the same amount of superplasticizer. Conversely,
rounded aggregates will act like “ball bearings” allowing the particles to easily move past each
other, which will increase the workability for a constant paste and water content. It is generally
considered that rounded and smaller aggregate particles will increase the filling ability of
concrete.
2.3.3 Passing Ability
The level of passing ability of SCC is a function of the stability, coarse aggregate content, coarse
aggregate size, and reinforcement spacing. SCC with excellent deformability but with insufficient
cohesiveness will lead to local aggregate segregation between the paste and coarse aggregate at
the vicinity of the reinforcement that could lead to severe blockage (Khayat et al. 2004). This will
not only lead to decreased passing ability, but it will also lead to an increase in the concentration

16
of coarse aggregate at the reinforcement. The passing ability is also affected when the coarse
aggregate size is large and/or the coarse aggregate content is high. This mechanism of blocking
can be explained by the two dimensional model shown in Figure 2.8 (Khayat and Tangtermsirikul
2000). Figure 2.8 illustrates that the aggregate particles around an opening must change their
path of travel to properly pass through the reinforcement. As a result, aggregate particles may
collide at the reinforcement opening. This aggregate interaction may cause the aggregate to form
a stable arch at the vicinity of the reinforcement opening (Khayat and Tangtermsirikul 2000).
Therefore, to achieve suitable passing ability the following steps should be considered (Khayat
and Tangtermsirikul 2000):
1. Enhance the cohesiveness to reduce segregation of aggregate
• Low water-to-cementitious materials ratio
• Viscosity modifying admixture
2. Compatible clear spacing and aggregate characteristics
• Low coarse aggregate contents
• Smaller maximum aggregate size
Figure 2.8: Mechanism of Blocking (Khayat and Tangtermsirikul 2000)
Khayat et al. (2004) conducted studies on the passing ability by evaluating the dynamic stability
of SCC using the L-Box and J-Ring apparatus. It was reported that SCC mixtures prepared with
843 lb/yd3 of cement with relatively low viscosity exhibited greater passing ability than SCC
mixtures prepared with 650 lb/yd3 of cement. Khayat et al. (2004) reported that the concrete
mixtures prepared with 650 lb/yd3 contained more coarse aggregate that increased the risk of
collision and interaction among solid particles, which lead to a reduced ability to flow between the
reinforcement bars. The greater tendency of aggregate blockage resulted in lower passing ability
in both the J-Ring and L-Box tests. Studies conducted by Kim et al. (1998) also indicate that the
passing ability was increased with decreasing coarse aggregate content. The results further
indicate that SCC mixtures prepared with volume ratios of coarse aggregate-to-concrete of 0.27
and 0.31 demonstrated a higher passing ability than volume ratios of 0.35 and 0.39 at a constant
water-to-binder ratio.
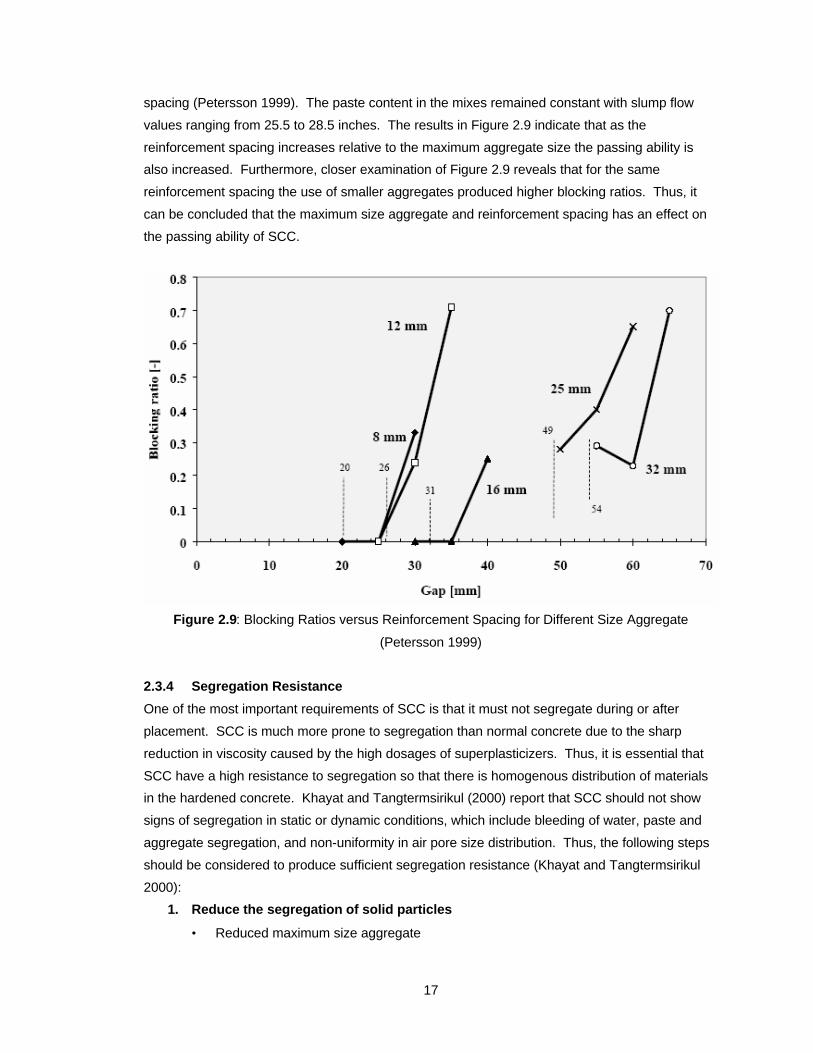
Studies conducted at the Swedish Cement and Concrete Institute investigated the
blocking in the L-Box apparatus using different maximum size aggregates and reinforcement
17
spacing (Petersson 1999). The paste content in the mixes remained constant with slump flow
values ranging from 25.5 to 28.5 inches. The results in Figure 2.9 indicate that as the
reinforcement spacing increases relative to the maximum aggregate size the passing ability is
also increased. Furthermore, closer examination of Figure 2.9 reveals that for the same
reinforcement spacing the use of smaller aggregates produced higher blocking ratios. Thus, it
can be concluded that the maximum size aggregate and reinforcement spacing has an effect on
the passing ability of SCC.
Figure 2.9: Blocking Ratios versus Reinforcement Spacing for Different Size Aggregate
(Petersson 1999)
2.3.4 Segregation Resistance
One of the most important requirements of SCC is that it must not segregate during or after
placement. SCC is much more prone to segregation than normal concrete due to the sharp
reduction in viscosity caused by the high dosages of superplasticizers. Thus, it is essential that
SCC have a high resistance to segregation so that there is homogenous distribution of materials
in the hardened concrete. Khayat and Tangtermsirikul (2000) report that SCC should not show
signs of segregation in static or dynamic conditions, which include bleeding of water, paste and
aggregate segregation, and non-uniformity in air pore size distribution. Thus, the following steps
should be considered to produce sufficient segregation resistance (Khayat and Tangtermsirikul
2000):
1. Reduce the segregation of solid particles
• Reduced maximum size aggregate

18
• Low water-to-cementitious materials ratio
• Viscosity modifying admixture
2. Minimize bleeding due to free water
• Low water content
• Low water-to-cementitious materials ratio
• Powders with high surface area
• Viscosity modifying admixture
Segregation of aggregate is related to a number of variables that consist of the particle size,
particle specific gravity, and the proportions of the mixture. Bonen and Shah (2004) report that
the use of larger coarse aggregates will settle much faster than smaller coarse aggregates when
the density and viscosity of the suspension is held constant. Additionally, gradation is also an
important factor in determining the proper coarse aggregate, especially where reinforcement is
highly congested and/or the formwork has small dimensions. Hodgson (2003) reports that a gap-
graded coarse aggregate promotes a greater degree of segregation than well-graded coarse
aggregate. Thus, the coarse aggregate chosen for SCC is typically round in shape, well-graded,
and smaller in maximum size than that used for conventional concrete.
Another method to increase the segregation resistance besides reduction in aggregate
size is to increase the cohesiveness of the mixture. This is typically done by one of the three
methods listed below. All three methods use superplasticizers to increase the fluidity of the
mixture, but the difference between them is the method used to prevent the segregation
(Hodgson 2003).
1. Powder method
2. Viscosity modifying admixture method, “VMA” method
3. Combination method
The powder method utilizes an increase in the volume of fines and low water content to reduce
the amount of free water. Free water is defined as water that is not adhered to the solid particles
and move independently from the solids in a mixture. Furthermore, Khayat and Tangtermsirikul
(2000) state that it is essential to reduce the amount of free water in the mixture because an
increase in free water content will decrease the viscosity of a SCC mixture. The most common
methods for reducing the amount of free water is to use powder materials with a high surface
area, use a low water-to-binder ratio, or both. For example, for a constant water content, the
addition of high surface area material can absorb a greater amount of free water compared to
cement particles. Thus, the plastic viscosity of the mix is increased due to greater water
absorbance. Furthermore, the reduction of the water-to-binder ratio will increase the phase-to-
phase cohesion that will increase the segregation resistance. Khayat et al. (1999) states that fine
powder includes cement and supplementary cementitious material that is combined to enhance
grain-size distribution, packing density, and reduced interparticle friction to lower the water
demand for a necessary viscosity.

19
The VMA method utilizes lower cement contents, a superplasticizer, and a viscosity
modifying admixture (VMA). The addition of a VMA may increase the viscosity of a mix to the
extent that the water-to-cementitious ratio need not be increased (Bonen and Shah 2004). VMAs
can provide adequate stability, reduce bleeding, and segregation resistance over a wider range of
fluidity.
There are two basic types of VMAs that are available in the market, and each VMA is
based on the mechanism in which they function (Degussa Construction Chemicals 2004):
1. Thickening Type VMA- This VMA functions by thickening the concrete, making it
cohesive without significantly affecting the fluidity. By increasing the viscosity of the
mixture, the VMA makes the mixture more stable and less prone to segregation
(Degussa Construction Chemicals 2004). These are typically polyethylene glycol (PEG)
based VMAs.
2. Binding Type VMA- This VMA functions by binding the water within the concrete
mixture. This VMA not only increases the viscosity of the mixture, but it also reduces
bleeding. The binding type VMA is more potent in modifying the viscosity of the mixture
than the thickening type (Degussa Construction Chemicals 2004). Welan Gum is an
example of this type of VMA.
Bury and Christensen (2003) state that the use of a VMA also increases the number of
applications for SCC because more mixtures can be proportioned for a wider range of
applications. For example, a VMA can be used with mixtures made with gap-graded materials.
In fact, Berke et al. (2003) suggests that when poorly graded material and low powder contents
are used, the use of a VMA can prove invaluable. In addition, because moisture contents in fine
aggregate can change throughout daily operation, the use of a VMA has been proven to be very
valuable in overcoming deficiencies due to uncontrolled moisture (Bury and Christensen 2003).
The combination approach utilizes a VMA with limited water content. The VMA in this
method primarily is used to reduce the variability of the SCC that can arise from uncontrolled
moisture and placement conditions. The VMA also controls bleeding and renders the concrete
more robust, while the low water content provides the necessary viscosity (Khayat et al. 1999).
2.4 HARDENED CONCRETE PROPERTIES
The hardened properties of concrete are often the most valued by design and quality control
engineers. It has become evident that SCC can have a large variation in mechanical properties
due to the different formulations used. Despite these variations, literature has shown that the
mechanical properties of well-designed SCC are comparable or better than the corresponding
properties of conventional concrete (Bonen and Shah 2004). Although many mechanical
properties can be evaluated and compared, only the mechanical properties that are relevant to
this research will be discussed in this section.

20
2.4.1 Compressive Strength
The property that is most often specified for concrete design and quality control is the
compressive strength. The testing of the compressive strength is relatively easy to perform in the
laboratory, and the compressive strength is universally accepted as a general index of concrete
strength. There are many determining factors that influence the compressive strength of
concrete; however, the compressive strength is best described by the water-to-cementitious ratio
and the porosity relationship.
When fully compacted, the concrete strength is taken to be inversely proportional to the
water-to-cementitious ratio (Neville 1996). However, at water-to-cementitious ratios less than 0.38
the maximum possible hydration of the cement is less than 100%. The porosity relationship can
be considered one of the most important factors in cement based material because it affects both
the cement paste matrix and the interfacial transition zone (ITZ) (Neville 1996). Powers and
Brownyard determined that the compressive strength is related to the gel-to-space ratio (Mindess
et al. 2003). The gel-to-space ratio is defined as the ratio of the gel volume over the summation
of the volume of the gel, capillary pores, and air voids. Bonen and Shah (2004) report that the
compressive strength of SCC is also best approximated by the porosity content. They further
suggest that similar to the Powers and Brownyard formulation, the compressive strength of SCC
is defined in terms of the binder-to-space ratio, rather than the gel-to-space ratio. The binder-to-
space ratio is defined as the binder volume over the summation of the volume of the binder,
capillary pores, and air voids. The binder volume is the sum of the gel volume, filler volume, and
the solid volume of the superplasticizers and VMA.
In most cases, high contents of fine material are placed within SCC to increase
segregation resistance. This addition of fine material can be capable of producing a denser
microstructure that will decrease both the porosity of the cement paste matrix and interfacial
transition zone of SCC. A study conducted at the Swedish Cement and Concrete Research
Center investigated the microstructure in SCC and conventional bridge concretes using image
analyzing and light microscopy techniques (Tragardh 1999). It was concluded that the porosity of
the bulk paste and the ITZ was significantly higher in the conventional concrete compared to SCC
with the same water-to-cementitious ratio (Tragardh 1999). It must be noted that although the
SCC and conventional concrete had the same water-to-cementitious ratio, the SCC incorporated
high amounts of fine inert limestone filler that produced a low water-to-binder ratio. The
incorporation of fine material in the SCC allowed particles to pack more efficiently around the
aggregates; therefore, leading to a decrease in porosity around the ITZ. Tragardh (1999) further
concluded that pores were more evenly distributed between the ITZ and bulk paste, and the
effect of microbleeding, which leads to an increase of the local water-to-cementitious ratio at the
interfacial zone, was found to be much less in SCC. It was further determined that the
compressive strength for SCC was higher than the conventional concrete at the same water-to-
cementitious ratio due to this improvement in the microstructure (Tragardh 1999). The results
from the compressive strength test can be seen in Figure 2.10. This investigation determined
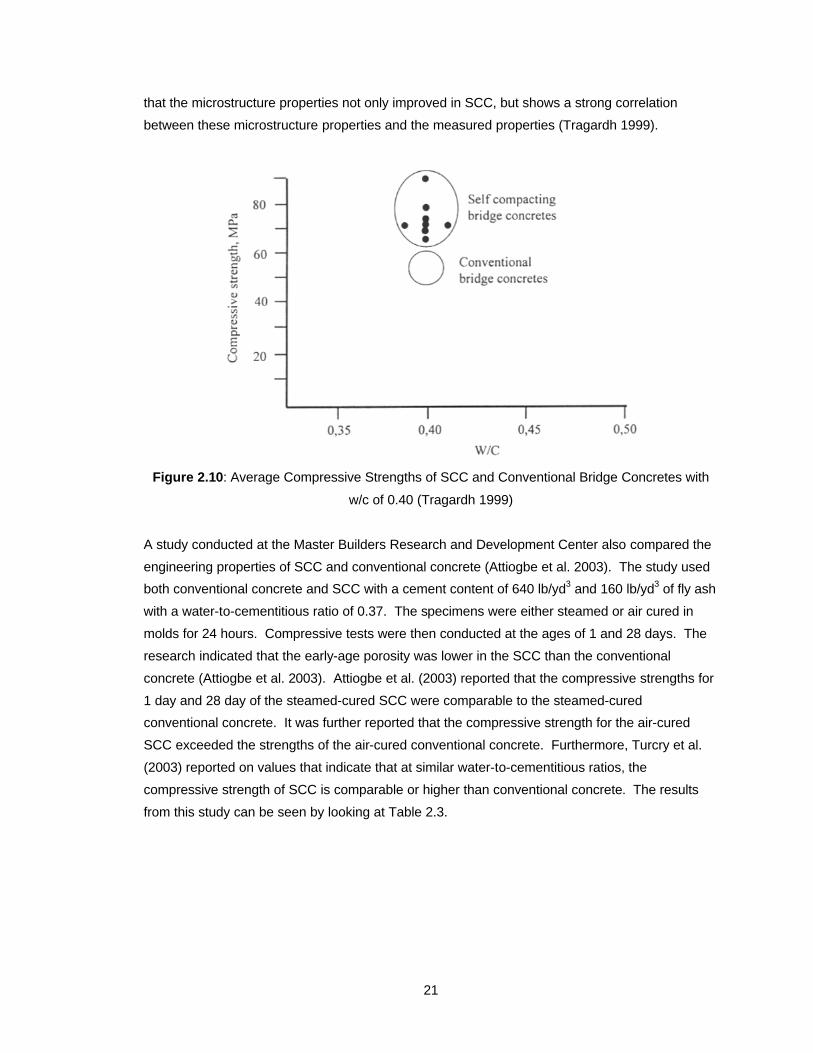
21
that the microstructure properties not only improved in SCC, but shows a strong correlation
between these microstructure properties and the measured properties (Tragardh 1999).
Figure 2.10: Average Compressive Strengths of SCC and Conventional Bridge Concretes with
w/c of 0.40 (Tragardh 1999)
A study conducted at the Master Builders Research and Development Center also compared the
engineering properties of SCC and conventional concrete (Attiogbe et al. 2003). The study used
both conventional concrete and SCC with a cement content of 640 lb/yd3 and 160 lb/yd3 of fly ash
with a water-to-cementitious ratio of 0.37. The specimens were either steamed or air cured in
molds for 24 hours. Compressive tests were then conducted at the ages of 1 and 28 days. The
research indicated that the early-age porosity was lower in the SCC than the conventional
concrete (Attiogbe et al. 2003). Attiogbe et al. (2003) reported that the compressive strengths for
1 day and 28 day of the steamed-cured SCC were comparable to the steamed-cured
conventional concrete. It was further reported that the compressive strength for the air-cured
SCC exceeded the strengths of the air-cured conventional concrete. Furthermore, Turcry et al.
(2003) reported on values that indicate that at similar water-to-cementitious ratios, the
compressive strength of SCC is comparable or higher than conventional concrete. The results
from this study can be seen by looking at Table 2.3.

22
Table 2.3: Compressive Strength Results from Turcry et al. (2003)
SCC 1 OC 1 SCC 2 OC 2
Gravel (lb/yd3) 1331 1803 1424 1912
Sand (lb/yd3) 1449 1314 1364 1348
Cement (lb/yd3) 590 607 590 665
Limestone Filler (lb/yd3) 253 0 421 0
Water (lb/yd3) 315 286 269 295
Water/Cement Ratio 0.53 0.47 0.46 0.44
Water/Powder Ratio 0.37 0.47 0.27 0.44
Sand/Aggregate Ratio (by mass) 0.52 0.41 0.48 0.41
Compressive Strength (psi) 6960 7400 8700 7251
Modulus of Elasticity (1 x 10⁶ psi) 4.35 5.50 5.20 5.20 OC = Ordinary Concrete
2.4.2 Modulus of Elasticity
For structural design, the modulus of elasticity of concrete increases approximately with the
square root of its strength. According to the ACI 318 (2002), the modulus of elasticity of concrete
can be best approximated by Equation 2.4.
'33 51c
.cc fwE = Equation 2.4
In Equation 2.4, Ec is the modulus of elasticity in psi, wc is the unit weight in lb/ft3, and fc' is the
compressive strength in psi. It is suggested that this formulation is valid for density ranging from
90 to 155 pcf and compressive strengths up to 6000 psi. The ACI Committee 363 (2002) “State-
of-the-Art- Report on High Strength Concrete” also found that the equation used by ACI 318
(2002) was valid only up to compressive strengths up to 6000 psi. According to the ACI
Committee 363 (2002) “State-of-the-Art- Report on High Strength Concrete”, high strength
concrete has compressive strengths ranging from 6,000 to 12,000 psi. By comparing stress-
strain curves for normal and high strength concrete, high strength concrete has a more linear and
steeper slope in the ascending portion of the curve as well as a higher strain at the maximum
stress (Jones 2004). Therefore, the ACI Committee 363 (2002) recommends the following
equation for estimating the modulus of elasticity for high strength concrete, which is valid for
compressive strengths ranging from 3,000 to 12,000 psi. In Equation 2.5, Ec is the modulus of
elasticity in psi and fc' is the compressive strength in psi.
000,000,1'000,40 += cc fE Equation 2.5
23
In contrast to the compressive strength, the modulus of elasticity of concrete is significantly
affected by the modulus and volume fraction of the aggregate (Bonen and Shah 2004). Bonen
and Shah (2004) report that as the volume fraction of aggregate is increased, the modulus of
elasticity is increased. This is an important factor for SCC since the aggregate volume fraction is
typically lower compared to conventional concrete. It is then expected that the elastic modulus of
SCC would be lower than conventional concrete with the same strength (Bonen and Shah 2004).
In addition to the limited aggregate volume fraction, SCC typically incorporates a higher sand-to-
aggregate ratio to increase its segregation resistance and passing ability. Therefore, a closer
examination must be presented to determine how the sand-to-aggregate ratio and aggregate
volume fraction influence the modulus of elasticity.
Su et al. (2002) investigated the effect of the sand-to-aggregate ratio on the elastic
modulus of SCC. Their study consisted of varying the sand-to-aggregate ratio of SCC from 0.30
to 0.55 while maintaining a constant aggregate volume fraction of 0.6 and a water-to-cementitious
ratio of 0.39. By maintaining a constant water-to-cementitious ratio and aggregate volume
fraction, only the varying sand-to-aggregate ratio should influence the elastic modulus. Su et al.
(2002) also invested how the elastic modulus of the fine and coarse aggregate influence the
modulus of elasticity. The results from this study can be seen by looking at Figure 2.11. Su et al.
(2002) reported that when the elastic modulus of the fine aggregate was 2 times that of the
coarse aggregate, the elastic modulus of concrete increased from 4.05 x 10⁶ psi to 4.3 x 10⁶ psi
when the sand-to-aggregate ratio increased from 30% to 47.5%. It is further reported that when
the elastic modulus of the fine aggregate was half of the coarse aggregate, the elastic modulus
decreased from 3.26 x 10⁶ psi to 3.05 x 10⁶ psi when the sand-to-aggregate ratio increased from
30% to 47.5%. Su et al. (2002) concluded that when the elastic modulus of the fine and coarse
aggregate are not much different and the total volume fraction of aggregate is constant, the
elastic modulus of SCC is not significantly affected by the sand-to-aggregate ratio (Su et al.
2002).
Turcry et al. (2003) further compared the elastic modulus of SCC to conventional
concrete using two SCC mixtures and two conventional concrete mixtures. Turcry et al. (2003)
maintained a sand-to-aggregate ratio of 0.41 for the conventional concrete and sand-to-
aggregate ratios of 0.52 and 0.48 for the SCC mixtures. Table 2.3 indicates that the conventional
concrete had a higher aggregate fraction as well as a lower sand-to-aggregate ratio. Turcry et al.
(2003) concluded that due to the higher paste volume for SCC, the elastic modulus for SCC was
lower than conventional concrete at the same compressive strengths. On the other hand,
Attiogbe et al. (2003) reported that the modulus of elasticity for the SCC mixtures corresponded
well with the conventional concrete when the strength was held constant. The study conducted
by Attiogbe et al. (2003) used the same water-to-cementitious ratio of 0.37 with sand-to-
aggregate ratios by mass of 0.44 for conventional concrete and 0.53 for the SCC mixtures. The
concrete mixtures contained cement and fly ash of 650 lb/ft3 and 160 lb/yd3, respectively.

24
Therefore, both the conventional concrete and SCC has comparable aggregate volume fractions
with varying sand-to-aggregate ratios (Table 2.3).
Figure 2.11: Elastic Modulus versus Sand-to-Aggregate Ratio (Su et al. 2002)
2.4.3 Drying Shrinkage
Shrinkage is a term that represents the strain caused by the loss of water from hardened
concrete (Mindess et al. 2003). Shrinkage of concrete is a function of the paste properties, and
the response of the paste to moisture loss is modified by several parameters. However, the most
important parameter is exerted by the aggregate, which will restrain the shrinkage (Neville 1996).
Equation 2.6 states that the ratio of shrinkage of concrete, Sc, to the shrinkage of neat cement,
Sp, depends on the aggregate content, a, and the experimental values of n range from 1.2 to 1.7
(Neville 1996).
npc aSS )1( −= Equation 2.6
Since SCC incorporates high paste volumes and reduced aggregate content, Equation 2.6
reveals that SCC is prone to an increase in drying shrinkage compared to conventional concrete.
Neville (1996) suggest that for a constant water-to-cementitious ratio, the reduction in aggregate
content will cause an increase in drying shrinkage. This relationship between water-to-
cementitious ratio and aggregate content can be seen in Figure 2.12.
Neville (1996) reports that the size and gradation of aggregate per se does not influence
the magnitude of shrinkage, but the use of larger aggregate permits a leaner mix that results in
lower shrinkage. On the other hand, the ACI Committee 209 (2002) suggests that the gradation
of the aggregate may have an effect on the drying shrinkage. According to ACI Committee 209

25
(2002), for different sand-to-aggregate ratios the shrinkage should be modified according to
Equations 2.7 and 2.8. In Equation 2.7 and 2.8, ? is the sand-to-aggregate ratio. It can be seen
from Equations 2.7 and 2.8 and Figure 2.13 that as the sand-to-aggregate ratio is increased,
which indicates more fine aggregate, the shrinkage will also increase.
ψ014.030.0 +=Shrinkage %50<ψ Equation 2.7
ψ002.09.0 +=Shrinkage %50≥ψ Equation 2.8
Figure 2.12: Aggregate Content versus Water-to-Cement Ratio (Neville 1996)
Figure 2.13: Shrinkage Modification Factor for Different Sand-to-Aggregate Ratios
(ACI Committee 209 2002)
0.2
0.4
0.6
0.8
1
1.2
0.35 0.4 0.45 0.5 0.55 0.6 0.65
Sand-to-Aggregate Ratio
Sh
rin
kag
e M
od
ifac
tio
n F
acto
r

26
Neville (1996) goes on to report that at constant water contents, the shrinkage is decreased with
increasing cement content. In the same manner, at constant cement contents, the shrinkage is
decreased with decreasing water content. This is due to the fact that as the water-to-
cementitious ratio is decreased it is able to better resist shrinkage; therefore, the drying shrinkage
is decreased as shown in Figure 2.14. Since SCC typically has a lower water-to-cementitious
ratio compared to conventional concrete, it may be possible that the increase in shrinkage caused
by the reduction in aggregate content or increase in sand-to-aggregate ratio can, to a certain
degree, be compensated by the reduction of the water-to-cementitious ratio.
Figure 2.14: Shrinkage versus Cement Content (Neville 1996)
Kim et al. (1998) studied the drying shrinkage of SCC and conventional concrete made with fly
ash in which the paste fraction and volume ratio of coarse aggregate-to-concrete varied. The
basic mixture proportions and experimental results are shown in Table 2.4 and Figure 2.15. Kim
et al. (1998) concludes that the experimental results show the effects of the water weight and
volume ratio of coarse aggregate-to-concrete on drying shrinkage. It was determined that with
increasing unit water weight and decreasing volume ratio of coarse aggregate-to-concrete, the
drying shrinkage was increased (Kim et al. 1998). The reported results from this experiment
indicate that the drying shrinkage for SCC was 30% to 50% greater than conventional concrete.
Kim et al. (1998) concludes that the higher drying shrinkage for the SCC mixtures is due to the
higher paste volumes, higher water contents, and less coarse aggregate. Additionally, Rols et al.
(1999) reported that for their research the drying shrinkage values for SCC were 50% higher than
conventional concrete containing the same amount of cement. It was determined that the
increase in drying shrinkage was due to the increase in the paste fraction and decrease in coarse
aggregate.
In contrast, experiments performed by Raghavan et al. (2003) indicate that for their
research the conventional concrete specimens exhibited more drying shrinkage than the SCC

27
specimens. The materials used for SCC were the same as conventional concrete with material
proportions for SCC consisting of a lower water-to-binder ratio and a higher sand-to-aggregate
ratio. In addition, the water weight for the conventional concrete and the SCC was the same in all
cases. A summary of the results from this study can be seen in Figure 2.16. The results indicate
that the drying shrinkage of SCC was 25% less than conventional concrete. It is suggested that
this reduction in shrinkage can be attributed to the effect of paste volume and decreased water-
to-binder ratio. Raghavan et al. (2003) reports that for the same water content and decreased
water-to-binder ratio, the drying shrinkage is reduced in SCC.
Table 2.4: Mixture Proportions (Kim et al. 1998)
Total W/C Sand/Aggregate
Mix ID Water Cement Fly Ash Fine Coarse Aggregate Ratio Ratio
lb/yd3 lb/yd3 lb/yd3 lb/yd3 lb/yd3 ft3 (By Volume)
SF 1-1 328 657 281 1371 1235 16.1 0.35 0.53SF 1-2 311 623 267 1317 1381 16.7 0.35 0.49SF 1-3 295 590 253 1245 1545 17.2 0.35 0.45SF 1-4 278 556 238 1142 1739 17.8 0.35 0.40
SF 2 320 505 337 1311 1380 16.6 0.38 0.49
NC 2 295 674 0 1305 1744 18.8 0.44 0.43NC 3 295 843 0 1141 1739 17.8 0.35 0.40
Aggregate
Self-Consolidating Concrete
Ordinary Concrete
Binder
Figure 2.15: Drying Shrinkage versus Age (Kim et al. 1998)
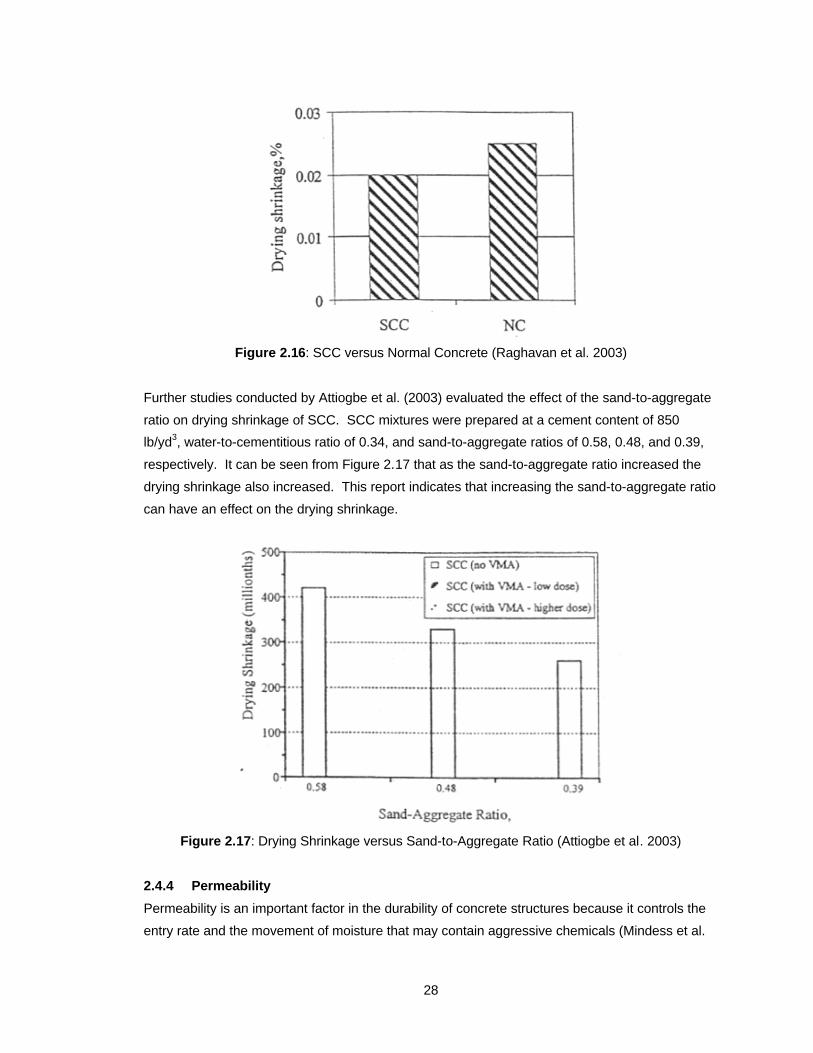
28
Figure 2.16: SCC versus Normal Concrete (Raghavan et al. 2003)
Further studies conducted by Attiogbe et al. (2003) evaluated the effect of the sand-to-aggregate
ratio on drying shrinkage of SCC. SCC mixtures were prepared at a cement content of 850
lb/yd3, water-to-cementitious ratio of 0.34, and sand-to-aggregate ratios of 0.58, 0.48, and 0.39,
respectively. It can be seen from Figure 2.17 that as the sand-to-aggregate ratio increased the
drying shrinkage also increased. This report indicates that increasing the sand-to-aggregate ratio
can have an effect on the drying shrinkage.
Figure 2.17: Drying Shrinkage versus Sand-to-Aggregate Ratio (Attiogbe et al. 2003)
2.4.4 Permeability
Permeability is an important factor in the durability of concrete structures because it controls the
entry rate and the movement of moisture that may contain aggressive chemicals (Mindess et al.

29
2003). The permeability of concrete is related to the pore system within the bulk of the hardened
cement paste and the zone near the interface between the cement paste and the aggregate
(Neville 1996). Thus, the permeability of concrete is not just a simple function of the porosity, but
depends on the size, shape, distribution, and continuity of the pores within the paste (Neville
1996). Neville (1996) suggests that the permeability of hardened cement paste is controlled by
its capillary porosity as shown in Figure 2.18. Furthermore, Figure 2.19 shows that the capillary
volume increases rapidly for water-to-cementitious ratios greater than 0.42.
Figure 2.18: Coefficient of Permeability versus Capillary Porosity (Neville 1996)
The permeability of concrete is also influenced by the properties of the cementitious materials
and presence of aggregate. The interfacial transition zone, which has a different microstructure
than the bulk paste as well as a locus of microcracking, can make up one-third to one-half of the
total volume of the hardened cement paste (Neville 1996). As a result, the interfacial transition
zone can be expected to contribute to the permeability of concrete. However, it is argued that if
the aggregate has low permeability, its presence reduces the effective area that flow may take
place and the effective flow path becomes longer so that the permeability of concrete may be
reduced (Neville 1996). Thus, the effect of the interfacial transition zone on the permeability still
remains uncertain. Nevertheless, SCC typically incorporates high amounts of fine material and
low water-to-binder ratios, which may lead to a denser microstructure within the bulk paste as
well as the interfacial transition zone. Thus, it would be expected that SCC has a lower
permeability compared to conventional concrete.

30
Figure 2.19: Coefficient of Permeability versus Water-to-Cement Ratio (Neville 1996)
Research conducted by Raghavan et al. (2003) reported on rapid chloride penetration tests
(RCPT) values of SCC ranging from 1100-1500 coulombs and an average of 4000 coulombs for
conventional concrete. Figure 2.20 shows the results from this study. Raghavan et al. (2003)
concludes that the reduction in permeability is due to the high filler material and lower water-to-
binder ratio for the SCC mixtures. This allowed the SCC to develop a denser microstructure than
the conventional concrete with higher water-to-cementitious ratios. Studies conducted by
Attiogbe et al. (2003) also indicate that the porosity of SCC was found to be lower than
conventional concrete, indicating the potential for better long-term durability for SCC compared to
conventional concrete. Thus, it can be determined that even at the same water-to-cementitious
ratios, SCC mixtures can produce a denser microstructure than conventional concrete due to
better particle packing.
Figure 2.20: RCPT Values of SCC and Normal Concrete (Raghavan et al. 2003)

31
2.5 SUMMARY AND CONCLUSIONS
Self-consolidating concrete should be able to to fill formwork, encapsulate reinforcement bars,
and consolidate under its own weight. At the same time it is cohesive enough to maintain its
homogeneity without segregation or bleeding. RILEM Report 23 from Technical Committee 174-
SCC (Skarendahl 2000) suggests that three main functional requirements of SCC are as follows:
a. Filling Ability: The ability of the concrete to completely fill formwork and encapsulate
reinforcement without the use of external vibration.
b. Passing Ability: The ability of the concrete to pass through restrictive sections of
formwork and tightly spaced reinforcement bars without blockage due to interlocking of
aggregate.
c. Segregation Resistance: The ability of the concrete to keep particles in a homogenous
suspension throughout mixing, transportation, and placement.
The slump flow test is one of the most common and popular test to evaluate the deformation
capacity of SCC because the procedure and apparatus is relatively simple. One of the most
critical requirements for SCC is that it must not segregate during or after placement. The VSI
rating of the slump flow patty is considered part of the dynamic stability given the fact the
concrete can exhibit some non-uniform texture following some mixing and transport; whereas, the
VSI can be considered as a static stability index when it is observed in the wheelbarrow or mixer
following some period of rest. The L-Box and J-Ring is used to assess the passing ability of a
SCC mixture. The segregation column test is used to determine the stability and segregation
resistance of a SCC mixture.
The following actions should be taken to achieve adequate filling ability (Khayat and
Tangtermsirikul 2000):
• Increase the deformability of the paste.
o Balanced water/powder ratio (Balanced so that adequate deformability and
deformation velocity can be achieved)
o Superplasticizers
• Reduced interparticle friction.
o Low coarse aggregate volume
o Higher paste content
To achieve suitable passing ability the following steps should be considered (Khayat and
Tangtermsirikul 2000):
• Enhance the cohesiveness to reduce segregation of aggregate.
o Low coarse aggregate volume
o Viscosity modifying admixture
• Compatible clear spacing and aggregate characteristics.
o Low coarse aggregate content
o Small maximum aggregate size

32
The following steps should be considered to produce sufficient segregation resistance
(Khayat and Tangtermsirikul 2000):
• Reduce the segregation of solid particles.
o Reduced maximum size aggregate
o Low water/powder ratio
o Viscosity modifying admixture
• Minimize bleeding due to free water
o Low water content
o Low water/powder ratio
o Powders with high surface area
o Viscosity modifying admixture
The modulus of elasticity of concrete is affected by the modulus and volume fraction of the
aggregate. When the elastic modulus of the fine and coarse aggregate are not much different
and the total volume fraction of aggregate is constant, the elastic modulus of SCC is not
significantly affected by the sand-to-aggregate ratio. Shrinkage of concrete is a function of the
paste properties, and the most important parameter is exerted by the aggregate, which will
restrain the shrinkage. Even at the same water-to-cementitious ratios, SCC mixtures can
produce a denser microstructure than conventional concrete due to better particle packing
resulting in lower permeability values.

33
Chapter 3
EXPERIENCES WITH DRILLED SHAFT CONCRETE
A review of literature relevant to experiences with drilled shaft concrete is presented in this
chapter. This chapter will address several aspects of design and construction that are essential
for high-quality drilled shaft concrete and problems that are encountered in drilled shaft
construction that may lead to poor quality drilled shaft foundations. Selected examples of more
common problems associated with drilled shaft concrete are cited in this chapter so that the
mechanisms that cause these problems can be understood. The literature presented in the
FHWA Drilled Shaft Manual, “Construction Procedures and Design Methods” (O’Neill and Reese
1999) is considered to be the current state of practice for drilled shaft design and construction.
Therefore, it is recommended that the FHWA Drilled Shaft Manual, “Construction Procedures and
Design Methods” (O’Neill and Reese 1999) be reference material for the reader not familiar with
drilled shaft concrete, construction procedures, and design. It must be noted that the problems
associated with drilled shaft concrete and cited examples in this chapter are not based on the
author’s experience. Rather they are based on observations and experience of other
experienced engineers.
3.1 INTRODUCTION
Recently developed techniques in integrity and load testing have given engineers and contractors
the ability to assess the quality of drilled shaft foundations after they have been cast. These
techniques have also provided insight to problems that are associated with materials and
construction practices that have lead to defects or less than optimal performance in drilled shaft
foundations. Some of the most common issues that comprise the quality of drilled shaft
foundations due to drilled shaft concrete come from the failure to consider one or more of the
following:
1. Retained workability of the concrete mixture for the duration of the pour
2. Blockage of the coarse aggregate due to congested rebar cages
3. Segregation and bleeding of the drilled shaft concrete

34
3.2 WORKABILITY OF DRILLED SHAFT CONCRETE
A number of terms are commonly used to describe a different aspect of concrete behavior:
consistency, flowability, pumpability, and compactability (Mindess et al. 2003). Workability is
often used to represent all the terms mentioned above; however, these terms are often subjective
and mean different things to different people. Therefore, a more precise definition should be
given to describe this property of a concrete mixture. Mindess et al. (2003) states that workability
is described in terms of the amount of mechanical work or energy required to achieve full
compaction of a concrete mixture without segregation. Other definitions provided by ASTM and
ACI suggest that workability can be defined as the effort required to manipulate the fresh
concrete without the loss of homogeneity (ASTM) or the ease in which concrete can be mixed,
placed, consolidated, and finished (ACI) (Neville 1996). In drilled shaft construction, full
compaction or consolidation of a concrete mixture must be achieved without the use of external
energy. For drilled shaft concrete, O’Neill and Reese (1999) describe the workability in terms of
the ability of a concrete mixture to readily flow through the tremie, flow laterally through rebar
cage, and impose a high lateral stress against the sides of the borehole wall without the use of
external vibration. As a result, high workability is one of the most important characteristics for
drilled shaft concrete.
There have been many methods developed over the years to determine the workability of
concrete mixture: slump test, compaction test, flow test, and Vebe test. However, the slump test,
ASTM C 143 (1998), is the oldest and most widely used test for determining the workability of a
concrete mixture for drilled shaft construction (O’Neill and Reese 1999). Although some
organizations such as the California Department of Transportation (Caltrans) use ASTM C 360
(1998) “Standard Test Method for Ball Penetration in Freshly Mixed Hydraulic Cement Concrete”
in lieu of the slump test. ASTM C 360 (1998) correlates the depth of penetration of 30 ± 0.1 lb
cylinder with a hemispherical shaped bottom with results of ASTM C 143 (1998). It should be
noted that these tests do not measure the true workability of concrete mixture, but rather is a
measure of consistency. However, a concrete mixture with the same consistency may vary in
workability. Nevertheless, these tests are very useful in detecting variations in a concrete
mixture, and it gives an indication of how a drilled shaft concrete mixture will perform.
FHWA recommendations for drilled shaft concrete state that a slump of 6 inches or
higher should be used for the dry method, and 8 inches when the wet or casing method is used
(O’Neill and Reese 1999). The FHWA guidelines go on to advise that good drilled shaft concrete
should have an appearance of collapsible concrete that will fall freely when the slump cone is
removed (O’Neill and Reese 1999). Brown (2004) suggests that experienced workers often
describe quality drilled shaft concrete as having a creamy paste rather than a boney texture.
Figure 3.1 shows a drilled shaft concrete mixture that is on the lower end of allowable slump
values that may be suitable for dry-hole construction. Figure 3.2 shows a drill shaft concrete
mixture that may be suitable for both dry and wet-hole construction.
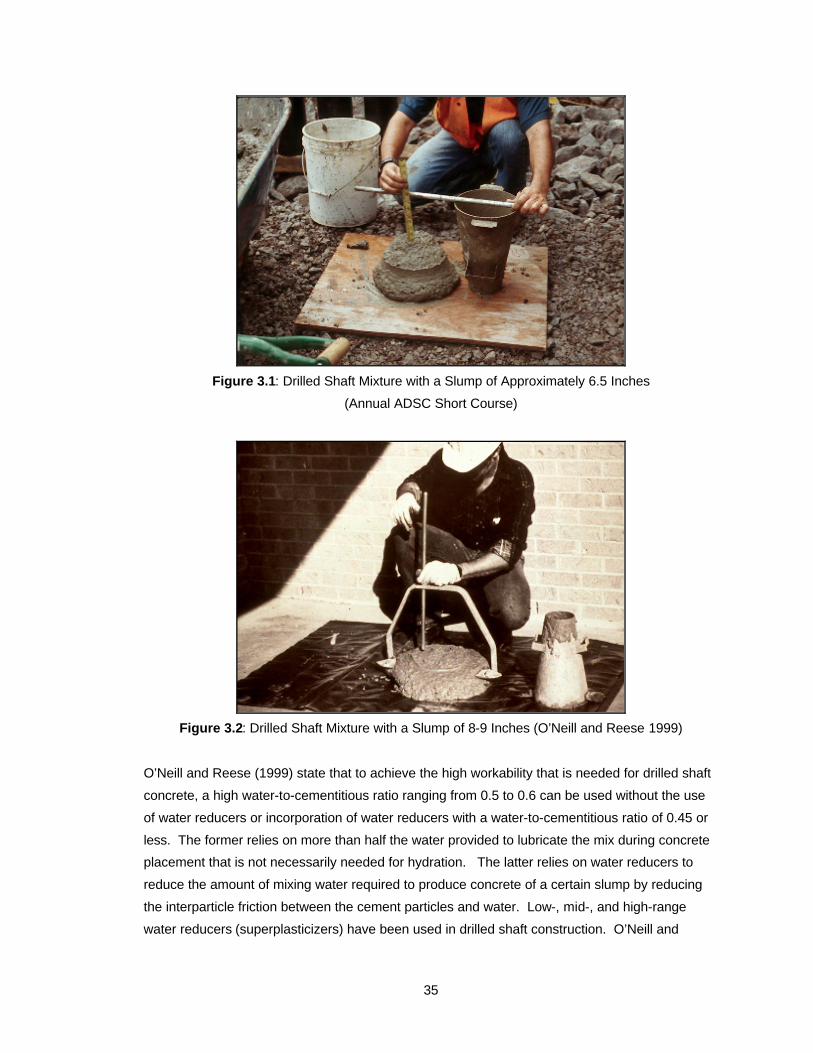
35
Figure 3.1: Drilled Shaft Mixture with a Slump of Approximately 6.5 Inches
(Annual ADSC Short Course)
Figure 3.2: Drilled Shaft Mixture with a Slump of 8-9 Inches (O’Neill and Reese 1999)
O’Neill and Reese (1999) state that to achieve the high workability that is needed for drilled shaft
concrete, a high water-to-cementitious ratio ranging from 0.5 to 0.6 can be used without the use
of water reducers or incorporation of water reducers with a water-to-cementitious ratio of 0.45 or
less. The former relies on more than half the water provided to lubricate the mix during concrete
placement that is not necessarily needed for hydration. The latter relies on water reducers to
reduce the amount of mixing water required to produce concrete of a certain slump by reducing
the interparticle friction between the cement particles and water. Low-, mid-, and high-range
water reducers (superplasticizers) have been used in drilled shaft construction. O’Neill and

36
Reese (1999) suggest that with high-range water reducers, water-to-cementitious ratio as low as
0.3 can be used while maintaining a high slump.
Another important aspect of drilled shaft concrete in terms of workability is the
consideration of the aggregate type and gradation. In general, rounded aggregate is typically
preferred over crushed aggregate due to the increased workability for a given water content.
Rounded aggregates will act like “ball bearings” while crushed aggregates will have more
mechanical interlock and require more work to overcome internal friction (Mindess et al. 2003).
The FHWA guidelines recommend that a well-graded coarse aggregate with a maximum size
aggregate of ¾ in. be used (O’Neill and Reese 1999). The main reasons for these
recommendations are to minimize the amount of paste in the mix, provide a concrete mixture that
can readily flow through the rebar cage without any bridging of the aggregate at the vicinity of the
reinforcement, and to prevent segregation of the concrete mixture (O’Neill and Reese 1999, and
Brown 2004).
When tremie placement or temporary casing is utilized it is not only important to have
sufficient workability initially, but it is also critical to maintain the workability for the duration of the
pour. Controlled setting of the concrete mixture is necessary to allow for any construction delays
in concreting, and to allow the temporary casing to be removed after concreting is completed. In
general, set-retarding admixtures are used to control the setting that is necessary to complete the
construction sequence. Set-retarding admixtures can be classified into 5 major categories
(Mindess et al. 2003):
• Lignosulfonic acids and their salts
• Hydroxycarboxylic acids and their salts
• Sugars and their derivatives
• Phosphates and organic phosphate salts
• Salts and amphoteric metals such as lead, zinc, and tin
Set-retarding admixtures slow down the rate of early hydration of C3S by extending the length of
the induction stage which extends the setting times as determined by ASTM C 403 (1998)
(Mindess et al. 2003). Mindess et al. (2003) states that organic retarders are able to absorb into
the nuclei of the calcium hydroxide and inhibit their growth; however, once the acceleration stage
of the hydration process begins the hydration proceeds as normal. Mindess et al. (2003) goes on
to report that when inorganic retarding admixtures are utilized, they can form a coating around the
C3S particles that can severely reduce the rate of reaction. The extended length of the induction
stage will depend on the effectiveness of the retarder and the amount added. Furthermore,
replacement of cement by less reactive supplementary cementitious materials, such as fly ash,
can also increase the time in which the concrete will remain workable.
Recent results from integrity and load testing have shown that inadequate workability or
loss of workability during the duration of concrete placement can lead to defects that are

37
unfavorable for drilled shaft foundations. When drilled shaft concrete has insufficient workability
the following problems can arise:
PROBLEM NO. 1- When tremie placing concrete as shown in Figure 3.3, the concrete should
readily flow through the tremie, rebar cage, and displace the drilling slurry upward in one uniform
horizontal layer. However, if workability is not maintained for the duration of the pour there is a
probability that debris can become entrapped causing structural defects within the shaft as shown
in Figure 3.4. The debris can come from suspended particles in drilling slurry, sloughed soil, and
laitance settling onto the top of the rising column of concrete. This debris can become entrapped
when the concrete has sufficient workability when delivered to the job site, but over time loses its
workability within the shaft. In this case, while the oldest concrete is riding on top of the rising
column of concrete its beginning to have insufficient workability that may potentially lead to a
difference in head between the outside of the rebar cage and the inside of the rebar cage. The
fresh concrete being placed in the shaft will tend to erupt through this stiff concrete and trap
debris that is on the outside of the rebar cage leading to structural defects. Furthermore, the loss
of workability may also result in plugging of the tremie pipe because the oldest concrete has
become too stiff to allow the fresh concrete to readily flow out of the tremie pipe. The contractor
may make aggressive attempts to clear the tremie pipe and unintentionally or purposely extract
the tremie resulting in debris seams to become entrapped or cause contamination of the concrete
as shown in Figure 3.5. These construction issues are illustrated in Figures 3.4-3.10.
Figure 3.3: Illustration of Tremie Placement (O’Neill and Reese 1999)

38
A) Fresh concrete with sufficient workability B) Interruption in concrete supply allows
being placed within the shaft. concrete to loss its workability in the shaft.
C) After concrete placement resumes, the D) Completed shaft may contain large
fresh concrete that is introduced erupts pockets of entrapped debris and voids.
through the stiff concrete and entraps debris
on the outside of the rebar cage.
Figure 3.4: Illustration of Entrapped Debris due to the Eruption of Fresh Concrete through Stiff
Concrete
Geomaterial
Drilling Slurry
Rebar Cage
Tremie Pipe
Concrete
Debris
Water Table
Geomaterial
Drilling Slurry
Rebar Cage
Tremie Pipe
Concrete
Debris
Water Table
Geomaterial
Drilling Slurry
Rebar Cage
Concrete
Tremie Pipe
Debris
Water Table
Geomaterial
Drilling Slurry
Rebar Cage
Concrete
Tremie Pipe
Debris
Water Table
Geomaterial
Drilling Slurry
Rebar Cage
Concrete
Tremie Pipe
Entrapped Debris
Water Table
Geomaterial
Drilling Slurry
Rebar Cage
Concrete
Tremie Pipe
Entrapped Debris
Water Table
Entrapped Debris
Geomaterial
Rebar Cage
Concrete
Voids
Water Table
Entrapped Debris
Geomaterial
Rebar Cage
Concrete
Voids
Water Table

39
A) Fresh concrete with sufficient B) Interruption in concrete supply allows
workability being placed within concrete to loss its workability in the
the shaft. shaft. As concrete placement resumes,
the tremie becomes plugged.
C) The contractor accidentally or D) Completed shaft may contain debris
purposely extracts the tremie to seams due to the extraction of the tremie.
restart the flow again.
Figure 3.5: Illustration of Entrapped Debris Seams due to Extraction of the Tremie
Geomaterial
Drilling Slurry
Rebar Cage
Concrete
Tremie Pipe
Debris
Extracting Tremie
Water Table
Geomaterial
Drilling Slurry
Rebar Cage
Concrete
Tremie Pipe
Debris
Extracting Tremie
Water Table
Geomaterial
Rebar Cage
Concrete
Entrapped Debris
Water Table
Geomaterial
Rebar Cage
Concrete
Entrapped Debris
Geomaterial
Rebar Cage
Concrete
Entrapped Debris
Water Table
Geomaterial
Drilling Slurry
Rebar Cage
Tremie Pipe
Concrete
Debris
Water Table
Geomaterial
Drilling Slurry
Rebar Cage
Tremie Pipe
Concrete
Debris
Water Table
Geomaterial
Drilling Slurry
Rebar Cage
Concrete
Tremie Pipe
Debris
Water Table
Geomaterial
Drilling Slurry
Rebar Cage
Concrete
Tremie Pipe
Debris
Geomaterial
Drilling Slurry
Rebar Cage
Concrete
Tremie Pipe
Debris
Water Table

40
Figure 3.6: Example 1 of Shaft Defects due to the Loss of Workability
(photograph courtesy of Dr. Dan Brown)
Figure 3.7: Example 2 of Shaft Defects due to the Loss of Workability (TxDOT)

41
Figure 3.8: Example 3 of Shaft Defects due to the Loss of Workability (TxDOT)
Figure 3.9: Example 4 of Shaft Defects due to the Loss of Workability (Caltrans)

42
Figure 3.10: Example 5 of Shaft Defects due to the Loss of Workability (TxDOT)
PROBLEM NO. 2- When concrete is placed into a cased hole as shown in Figure 3.11, there is a
need for the concrete to maintain its workability throughout the duration of the pour. This
maintained workability is essential because when the casing is removed the concrete must be
able to flow laterally to displace any water that is present outside the casing, and produce a high
lateral stress on the soil or rock so that there is adequate bond between the concrete and
surrounding bearing stratum. Furthermore, if the concrete workability is lost before the casing is
pulled, the casing may be very difficult to remove or in some cases not be able to be removed at
all. If the casing is able to be removed, the concrete can tend to arch and be lifted with the casing
causing a neck to be formed. Figure 3.13 shows an example when the concrete workability was
lost before the casing was extracted. As a result, the concrete on the outside of the rebar cage
was lifted along with casing leaving the rebar cage exposed. Even if no necking occurs, a stiff
column of concrete has essentially been “slipped formed” into an oversized hole. As a result, the
concrete can impose little or no lateral stress on surrounding soil or rock, and it can be expected
that adequate bond between the concrete and bearing stratum will not be present. In addition,
the presence of heavily congested rebar cages may also make matters worse because the
concrete can be restricted by the cage after the casing is removed. The mechanism that may
lead to poor defects when the casing is pulled is schematically shown in Figure 3.12.

43
Figure 3.11: Illustration of a Cased Hole (FDOT)
One can infer from the discussion and illustrations above that the loss of concrete workability can
have detrimental effects on drilled shaft foundations. Therefore, careful attention must be
exercised by contractors and engineers to ensure that concrete workability be maintained. To
ensure that proper workability and slump retention is achieved, O’Neill and Reese (1999)
recommend that trial mixes should be conducted with the cementitious materials, aggregates,
and additives that will be used for a particular application. They further state that a trial mix study
for drilled shaft concrete should consist of constructing a graph of slump loss versus time after
batching as shown in Figure 3.14. Figure 3.14 illustrates a slump loss relationship in which the
slump loss diminishes slowly and exceeds 4 inches after 4 hours. Figure 3.14 also demonstrates
an undesirable slump loss wherein the initial workability is sufficient, but slump loss occurs rapidly
after batching.

44
A) Concrete being placed using B) Concrete placement is complete, but due
casing method. to long periods of placement or construction
delays the concrete has lost its workability.
The casing is extremely difficult to remove
which causes arching and necking to occur.
C) As casing is being extracted, loose D) The completed shaft may have pockets of
material may slough into the neck and entrapped debris and loss of bond between
entrap debris. the bearing stratum and concrete.
Figure 3.12: Necking and Arching due to the Extraction of the Casing when Workablility is Lost
Cohesive Geomaterial
Rebar Cage
Concrete
Casing
Caving Soil
Free Fall Placement
Cohesive Geomaterial
Rebar Cage
Concrete
Casing
Caving Soil
Free Fall Placement
Cohesive Geomaterial
Rebar Cage
Concrete
Casing
Caving Soil
Extracting Casing
Necking andArching
Cohesive Geomaterial
Rebar Cage
Concrete
Casing
Caving Soil
Extracting Casing
Necking andArching
Necking and Arching
Cohesive Geomaterial
Rebar Cage
Concrete
Casing
Caving Soil
Extracting Casing
Necking and Arching
Cohesive Geomaterial
Rebar Cage
Concrete
Casing
Caving Soil
Extracting Casing
Loss of bond between geomaterialand concrete
Cohesive Geomaterial
Rebar Cage
Concrete
Necking andArching
Caving Soil
Loss of bond between geomaterialand concrete
Cohesive Geomaterial
Rebar Cage
Concrete
Necking andArching
Caving Soil

45
Figure 3.13: Shaft Defects due to the Extraction of the Casing (Annual ADSC Short Course)
When constructing the slump loss graph, contractors and engineers should exercise care to make
certain that the conditions that existed for the trial mixes continue to exist during construction. If
any conditions change, such as cementitious materials, aggregate source, or ambient
temperature, new trial mixes should be conducted to ensure the proper slump loss is achieved
(O’Neill and Reese 1999). For example, the use of different cementitious materials, whether it be
using the same type of cement from a different company or change in cement type all together,
may increase or decrease the rate of slump loss depending on the fineness and chemical
composition. Figure 3.15 shows that for constant mixture proportions, a change in cement brand
can increase or decrease the rate of slump loss over time. Reconstruction of the slump loss
graph versus time is particularly important when the laboratory temperatures do not reflect field
temperatures, which strictly speaking the concrete temperature itself is the most important. If the
field temperatures are higher than laboratory temperatures, the slump loss graph is misleading
since slump loss is accelerated in hot weather conditions. O’Neill and Reese (1999) report that an
increase in 18 deg. F will increase the rate of slump loss by a factor of approximately 2.

46
Figure 3.14: Slump Loss versus Time Relationship (O’Neill and Reese 1999)
Figure 3.15: Slump Loss at 70oF for Two Different Brands of Type I Cement
(Mindess et al. 2003)
O’Neill and Reese (1999) determined that 4 inches after 4 hours would be appropriate because
ordinarily this is the maximum amount of time that is required for concrete placement. However,
drilled shafts today are being constructed with larger diameters at deeper depths that require long
periods of time for concrete placement. Long periods for concrete placement may also be
required where the construction site is difficult to access or unforeseen construction delays occur.
Unfortunately, many state DOT’s still use this specification that routinely calls for a slump of 4
inches be maintained after 4 hours. For that reason, Brown (2004) suggests that based on his
experience and observations that this recommendation is not adequate for many conditions. For
example, if contractual documents require a contractor to maintain 4 inches of slump after 4

47
hours, but the drilled shaft requires 6 hours for concrete placement, the requirement of 4 inches
after 4 hours will be insufficient for that application. Although the contractor may have supplied a
mixture that maintained 4 inches of slump after 4 hours, by the time concrete placement is
complete the workability of the concrete mixture has diminished greatly below 4 inches, which
may produce undesirable results. Brown (2004) proposes that the concrete mixture maintain a
high workability, a slump loss of no more than 2 inches, for the duration of the concrete
placement no matter what that period may be. In that case, not only will the concrete maintain
high workability for the duration of the concrete placement, it will also prevent two very dissimilar
fluids from interacting.
Case Study 1 (after Brown 2004)
In this example, drilled shafts were used to support individual columns for a bridge over a
lake in the southwest United States. The upper portions of the shafts were formed by using
removable casing that was extended through the lake. It can be seen from Figure 3.16 that the
rebar cage had reasonably large openings that typically measured 8 inches between the
transverse and longitudinal reinforcement. In this instance the rebar cage was not restrictive to
concrete flow. The concrete was placed using a gravity-fed tremie. Each shaft required 5 to 6
concrete trucks with each shaft taking 4 to 6 hours to complete the concrete pour.
Figure 3.16: Shaft Defects due to the Loss of Workability (left), After Removal of
Surface Flaws for Repairs (photograph courtesy of Dr. Dan Brown)
After the removal of the forms, the shaft appeared to have weak pockets of cemented materials.
The cemented material seemed to be mortar-like with no presence of coarse aggregate within the
pockets. The pockets were easily chipped away using a hammer revealing large voids within the
shaft. Figure 3.16 illustrates these weak pockets before they were chipped away for repairs (left),
and the voids that were present after the mortar-like material was removed (right). After close
examination of the shafts it was determined that the concrete did not maintain sufficient
workability for the duration of the pour during the hot summer months. As the concrete moved up

48
in the shaft, the tremie would be lifted from the bottom of the shaft, but always maintained at least
7 feet below the surface of the concrete. However, the previously placed concrete began to lose
its workability and became stiff within the shaft. The fresh concrete placed in the shaft through
the tremie pipe that was below the surface of this stiff concrete erupted through the stiff concrete
rather than lifting the concrete in one uniform layer. When this occurred, the debris that had been
riding on top of the column of concrete became entrapped on the outside of the rebar cage
causing the surface flaws.
Case Study 2 (after O’Neill and Reese 1999)
In this example, concrete was being placed by a gravity-fed tremie with the concrete
being delivered to the tremie by means of pumping. Figure 3.17 reveals that rebar cage had
relatively large openings that were not particularly resistive to concrete flow. While concrete
placement was taking place there was an interruption in the concrete supply. The interruption in
concrete delivery allowed the previously placed concrete to become stiff within the shaft. When
the concrete placement resumed the fresh concrete that was introduced below this now stiff
concrete erupted through the stiff concrete. As a result, the debris that was riding on top of the
rising column of concrete became entrapped on the outside of the rebar cage. As the entrapped
debris was removed for repair, large voids within the shaft were revealed as shown in Figure
3.17.
Figure 3.17: Shaft Defects due to the Loss of Workability from Construction Delays
(O’Neill and Reese 1999)
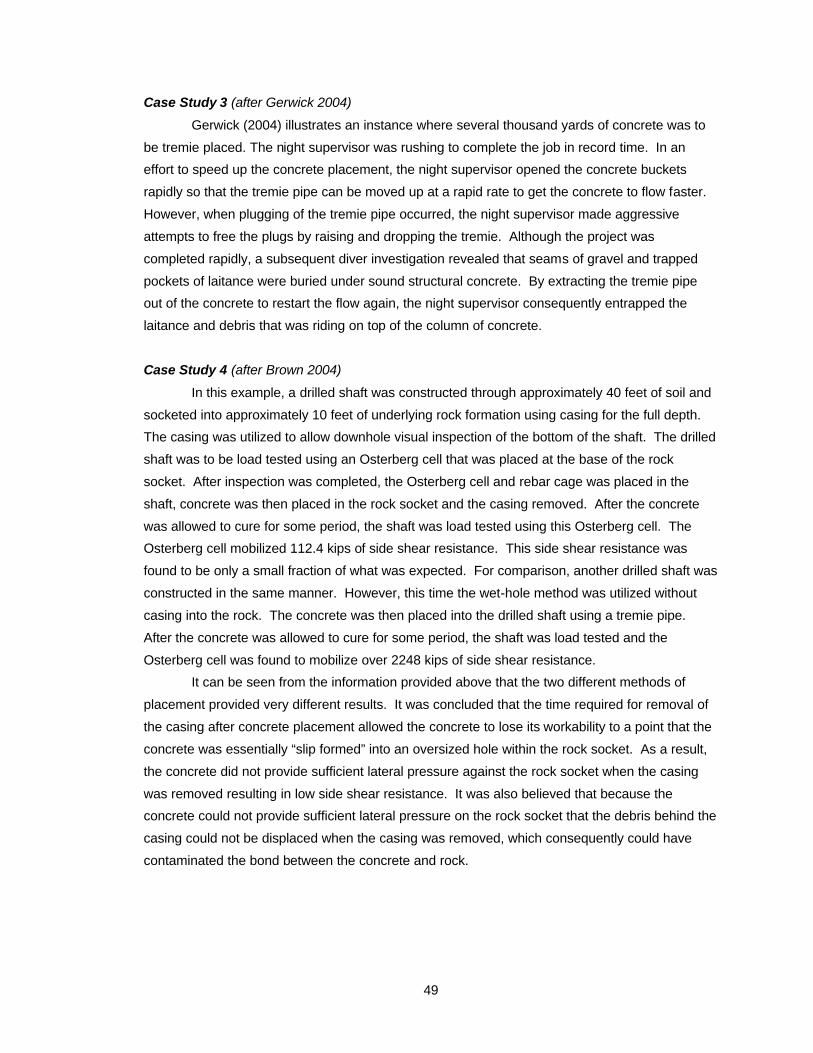
49
Case Study 3 (after Gerwick 2004)
Gerwick (2004) illustrates an instance where several thousand yards of concrete was to
be tremie placed. The night supervisor was rushing to complete the job in record time. In an
effort to speed up the concrete placement, the night supervisor opened the concrete buckets
rapidly so that the tremie pipe can be moved up at a rapid rate to get the concrete to flow faster.
However, when plugging of the tremie pipe occurred, the night supervisor made aggressive
attempts to free the plugs by raising and dropping the tremie. Although the project was
completed rapidly, a subsequent diver investigation revealed that seams of gravel and trapped
pockets of laitance were buried under sound structural concrete. By extracting the tremie pipe
out of the concrete to restart the flow again, the night supervisor consequently entrapped the
laitance and debris that was riding on top of the column of concrete.
Case Study 4 (after Brown 2004)
In this example, a drilled shaft was constructed through approximately 40 feet of soil and
socketed into approximately 10 feet of underlying rock formation using casing for the full depth.
The casing was utilized to allow downhole visual inspection of the bottom of the shaft. The drilled
shaft was to be load tested using an Osterberg cell that was placed at the base of the rock
socket. After inspection was completed, the Osterberg cell and rebar cage was placed in the
shaft, concrete was then placed in the rock socket and the casing removed. After the concrete
was allowed to cure for some period, the shaft was load tested using this Osterberg cell. The
Osterberg cell mobilized 112.4 kips of side shear resistance. This side shear resistance was
found to be only a small fraction of what was expected. For comparison, another drilled shaft was
constructed in the same manner. However, this time the wet-hole method was utilized without
casing into the rock. The concrete was then placed into the drilled shaft using a tremie pipe.
After the concrete was allowed to cure for some period, the shaft was load tested and the
Osterberg cell was found to mobilize over 2248 kips of side shear resistance.
It can be seen from the information provided above that the two different methods of
placement provided very different results. It was concluded that the time required for removal of
the casing after concrete placement allowed the concrete to lose its workability to a point that the
concrete was essentially “slip formed” into an oversized hole within the rock socket. As a result,
the concrete did not provide sufficient lateral pressure against the rock socket when the casing
was removed resulting in low side shear resistance. It was also believed that because the
concrete could not provide sufficient lateral pressure on the rock socket that the debris behind the
casing could not be displaced when the casing was removed, which consequently could have
contaminated the bond between the concrete and rock.

50
3.3 COMPATIBILITY BETWEEN CONGESTED REBAR CAGES AND CONCRETE
Improved equipment and appropriate construction techniques have allowed contractors to
construct very large diameter drilled shafts at great depths. These large diameter shafts have
advantages for structures that experience large lateral and overturning loads that are produced
by seismic loads, vessel impacts, and wind. Single large drilled shafts produce smaller footprints
than piled footings, a benefit in terms of constructability when working in congested construction
sites or nearby existing structures (Brown 2004). As a result, designers and engineers have
increasingly designed and specified large diameter shafts. The use of larger diameter shafts that
are designed for large bending moments require high amounts of reinforcement bars to be placed
within the shaft. Consequently, the rebar cages have become progressively more congested and
resistive to concrete flow. The addition of numerous assess tubes for integrity testing has also
lead to increased congestion in the rebar cages. Although these large diameter shafts have
numerous advantages; problems from resistive rebar cages can occur in the following ways:
PROBLEM NO. 1- When closely spaced reinforcement bars are utilized, there is an increased
probability that debris will be entrapped in the annular space outside the rebar cage. The debris
is entrapped when the lateral flow of the concrete is significantly impeded, which Gerwick (2004)
describes as screening of the concrete, resulting in an elevation difference between the inside
and outside of the rebar cage. As a result, any debris that is accumulated on top of the rising
column of concrete has a natural tendency to slough off into the annular space outside the rebar
cage. As additional fresh concrete is placed into the shaft, the fresh concrete will eventually flow
laterally through rebar cage entrapping the debris as shown in Figure 3.18. Figure 3.19 illustrates
the elevation difference due to screening of the concrete flow, while Figure 3.20 shows shaft
defects that can occur when the concrete flow is impeded by heavily congested rebar cages.
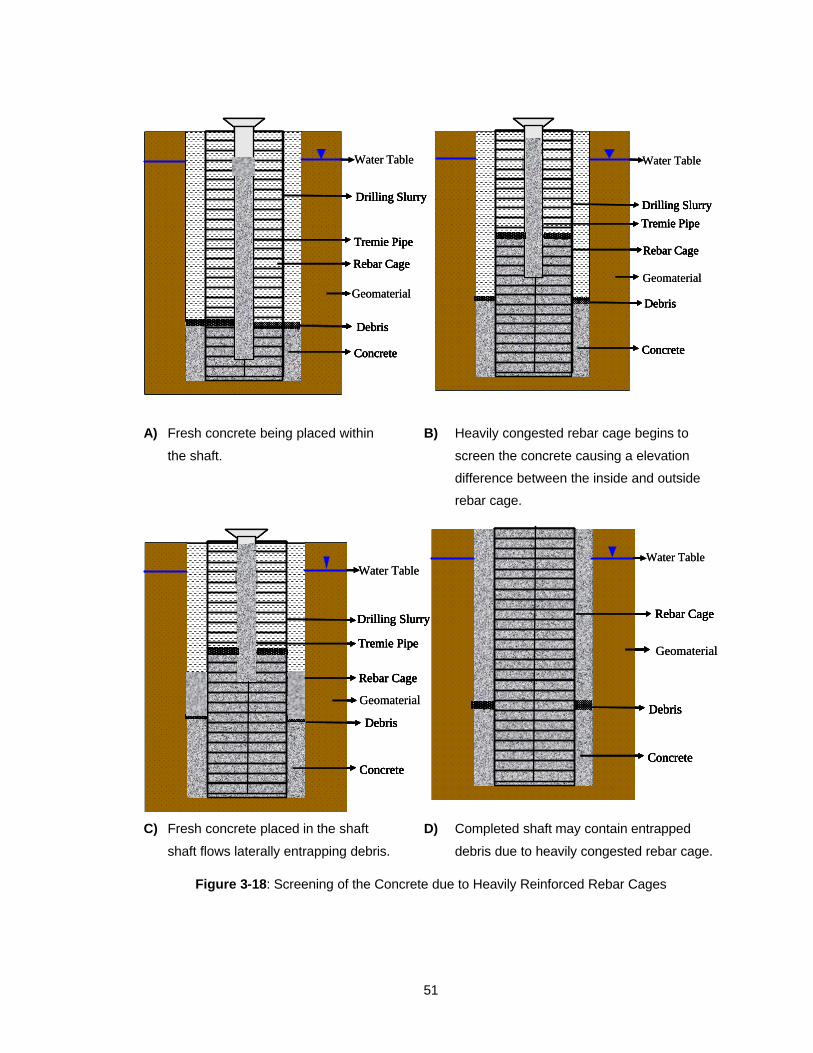
51
A) Fresh concrete being placed within B) Heavily congested rebar cage begins to
the shaft. screen the concrete causing a elevation
difference between the inside and outside
rebar cage.
C) Fresh concrete placed in the shaft D) Completed shaft may contain entrapped
shaft flows laterally entrapping debris. debris due to heavily congested rebar cage.
Figure 3-18: Screening of the Concrete due to Heavily Reinforced Rebar Cages
Drilling Slurry
Rebar Cage
Tremie Pipe
Concrete
Debris
Geomaterial
Drilling Slurry
Rebar Cage
Tremie Pipe
Concrete
Debris
Water Table
Drilling Slurry
Rebar Cage
Tremie Pipe
Concrete
Debris
Geomaterial
Drilling Slurry
Rebar Cage
Tremie Pipe
Concrete
Debris
Water Table
Geomaterial
Drilling Slurry
Rebar Cage
Tremie Pipe
Concrete
Debris
Drilling Slurry
Rebar Cage
Tremie Pipe
Concrete
Debris
Water Table
Geomaterial
Drilling Slurry
Rebar Cage
Tremie Pipe
Concrete
Debris
Drilling Slurry
Rebar Cage
Tremie Pipe
Concrete
Debris
Water Table
Geomaterial
Drilling Slurry
Rebar Cage
Tremie Pipe
Concrete
Debris
Drilling Slurry
Rebar Cage
Tremie Pipe
Concrete
Debris
Water Table
Geomaterial
Drilling Slurry
Rebar Cage
Tremie Pipe
Concrete
Debris
Drilling Slurry
Rebar Cage
Tremie Pipe
Concrete
Debris
Water Table
Rebar Cage
Concrete
Debris
Geomaterial
Rebar Cage
Concrete
Debris
Water Table
Rebar Cage
Concrete
Debris
Geomaterial
Rebar Cage
Concrete
Debris
Water Table

52
Figure 3.19: Elevation Difference between the Inside and Outside of a Rebar Cage due to
Screening of the Concrete Flow (photograph courtesy of Dr. Dan Brown)
Figure 3.20: Shaft Defects due to the Screening of the Concrete Flow
(photograph courtesy of Dr. Dan Brown)
PROBLEM NO. 2 – Even if tremie placement with clean slurry or placement by freefall is utilized;
the concrete flow can become impeded to such an extent that large voids form outside the rebar
cage. This can occur when the reinforcement bars are so closely spaced that there is interlocking
and bridging of the aggregate at the vicinity of the rebar cage. Interlocking and bridging of the

53
aggregate may be increased when crushed stones are utilized or when the aggregate size is too
large for the reinforcement spacing. In other cases, the flow may become impeded to a
standpoint that the lateral stress imposed by the concrete on the bearing stratum is diminished.
The rebar cages for drilled shaft foundations consist of longitudinal bars that are
distributed evenly around the outside and transverse (ties or spirals) reinforcement that is placed
around the longitudinal bars. The FHWA guidelines recommend that the clear spacing between
bars be at least 5 times the maximum size aggregate (O’Neill and Reese 1999). Gerwick (2004)
proposes that the largest possible bars be used, and spaced 3 to 4 times the maximum size
aggregate. Brown (2004) expresses the fact that he has routinely seen these recommendations
violated in practice. Brown (2004) goes on to suggest that these recommendations are
sometimes disregarded where seismic loads are significant. When seismic conditions exist,
designers may use tight spiral confinement with a small pitch. The FHWA guidelines would
advise the use of pea sized gravel in such circumstances (O’Neill and Reese 1999). The use of
pea-sized gravel gives the mixture enhanced workability over crushed aggregate and decreases
the probability of bridging of the aggregate at the vicinity of the rebar cage. Brown (2004)
suggests it is common practice that agencies allow the use of pea gravel, but does not
specifically require the use of pea gravel in contractual documents. Since pea gravel mixtures
are more expensive on a material basis, in many cases contracts may be allotted to contractors
that may utilize a less expensive mix that uses crushed stones. The result of such practice is that
a concrete mixture may be chosen based on the lowest cost, rather than the one that is most
appropriate for the conditions. Designers should consider the consequences of tight
reinforcement spacing and emphasize the workability in construction material so that
constructability problems are minimized.
Case Study 5 (after Brown 2004)
Single 13-foot diameter shafts were to be used to support oval shaped columns for a
bridge in the western United States. The shafts were to be socketed through overlaying alluvial
sandy soil into sandstone. The contractor cased through the overlaying sandy soil with temporary
casing. In order for the rebar cage in the shaft to match the shape of the column, designers used
two rebar cages in which the two reinforcement cages overlap each other in a form of a fat figure
8 as shown in Figure 3.21. In this application, the concrete mixture had to flow through two rebar
cages that were heavily congested due the transverse reinforcement, which was rather restrictive
to concrete flow. Subsequent integrity testing indicated large anomalies around the perimeter of
several shafts. Access shafts were constructed along side the drilled shafts where the anomalies
were thought to be present. The examination of the shafts revealed that large pockets of sand
were entrapped where the two rebar cages overlapped. After removal of the sand pockets, large
voids remained in the outer perimeter of the shaft as shown in Figure 3.22. Coring samples
indicated that sound concrete with consistent compressive strengths within the center of the

54
shaft, but unsound concrete with erratic compressive strengths was found to be around the
perimeter of the shafts.
Rebar Cage
Rebar Cage
Figure 3.21: Oval Shaped Column with Figure 8 Rebar Cage (not to scale)
Figure 3.22: Shaft Defect due to Double Reinforcement Cages
(photograph courtesy of Dr. Dan Brown)
Case Study 6 (after Brown 2004)
In this example, test shafts were constructed for a new bridge in the eastern United
States. The test shafts were 8 feet in diameter and up to 160 feet deep with a rebar cage that
consisted of heavy longitudinal reinforcement and spiral reinforcement at a 3.5 inch pitch. The
concrete mixture incorporated the use of crushed stone with a maximum size aggregate of ½ inch

55
and a slump of 8 inches. As the concrete was being tremie placed, measurement and
observations were made on the concrete behavior (Camp et al. 2002). The measurements taken
indicated that a head difference between the inside and outside of the rebar cage of at least 4.5
feet. Although small aggregate and a high slump concrete mixture were used in this project,
observation from the concrete behavior showed there was still a potential for debris to become
entrapped in annular space outside the rebar cage. Therefore, designers and engineers should
be cautious in such circumstances to ensure that the probability of entrapped debris is reduced,
which may include the use of rounded pea gravel.
3.4 SEGREGATION AND BLEEDING
In Section 3.2 it was stated that drilled shaft concrete should have excellent workability so that it
can readily flow through the tremie, rebar cage, and the annular space between the rebar cage
and borehole wall. In addition to having high workability, drilled shaft concrete should exhibit
sufficient cohesiveness to prevent segregation of the concrete mixture. Segregation can be
described as the separation of the constituents of a heterogeneous mixture so that the mixture is
no longer uniform (Neville 1996). The main factors that contribute to the segregation of concrete
mixture are listed below: (Mindess et al. 2003)
• Larger maximum particle size over 1 inch and proportions of larger particles
• High specific gravity of the coarse aggregate compared to that of the fine aggregate
• A decreased amount in fines (sand or cement)
• Changes in the particle shape away from well-rounded particles to crushed stones
• Mixes that are too wet or dry
In the case of drilled shaft concrete, the probability of segregation is increased due to the fact that
dropping concrete from considerable heights by free fall or tremie placement, changes in direction
of flow, discharging against obstacles, and considerable amount of handling all encourage
segregation (Neville 1996). In drilled shaft construction, segregation by handling may if the
concrete must be delivered to a remote location without the continuous mixing of the concrete
mixture for the entire time. Furthermore, any delay in concrete delivery during tremie placement
can result in segregation within the concrete column inside the tremie, which can lead to plugging
of the tremie and inclusions of non-uniform concrete within the shaft (Brown 2004). Since these
circumstances mentioned above frequently arise in drilled shaft construction, it is pertinent that
designers ensure that a highly cohesive mixture with proper gradation of aggregate is used. The
use of smaller-rounded aggregate and a highly cohesive mixture will help to prevent
sedimentation of aggregate particles in a concrete mixture (Neville 1996, and Mindess et al.
2003).
Bleeding is commonly regarded as a special form of segregation. It is defined as the
upward movement of mixing water to the surface of freshly placed concrete (Neville 1996).

56
Bleeding can be caused by the settlement of aggregate particles, and the inability of the concrete
to hold the mixing water. Since water has the lowest specific gravity, it segregates from the
concrete mixture by rising to the surface of the freshly placed concrete (Mindess et al. 2003).
Although some bleeding is unavoidable and normal for good concrete, a significant amount of
bleeding can result in inferior concrete. This is true especially for tall elements such as columns
and drilled shaft foundations. As the bleed water moves upward to the surface of the shaft, the
water-to-cementitious materials ratio in the lower portion of the shaft is decreased, but the bleed
water trapped in the upper portion of the shaft causes an increase in the water-to-cementitious
ratio, which may result in a reduction in strength (Neville 1996).
The rising bleed water can also become trapped on the underside of coarse aggregate
and reinforcement; thus, resulting in larger interfacial transition zones and loss of bond between
the reinforcement and concrete as shown in Figure 3.23. Furthermore, bleed water can travel
upwards along the surface of casings forming a channel due to imperfections in the casing.
Neville (1996) reports that a preferred channel is formed resulting in surface streaking and distinct
localized channels as shown in Figures 3.24 and 3.25. In Figures 3.24 and 3.25, drilled shafts
were cast through a lake in the underlying soil using removable casing. After the removable
casing was removed, it was observed that bleed channels and surface streaks were formed along
the outer perimeter of the shaft due to bleed water. In other cases, vertical bleed channels are
formed in the interior of the shaft. These vertical bleed channels commonly form along the
longitudinal reinforcement resulting in loss of bond between the reinforcement and concrete.
Figure 3.23: Illustration of Bleeding in Freshly Placed Concrete (Mindess et al. 2003)

57
Figure 3.24: Example 1 of Bleed Channels and Surface Streaks due to Bleed Water Traveling
along the Casing (photograph courtesy of Dr. Dan Brown)
Figure 3.25: Example 2 of Bleed Channels and Surface Streaks due to Bleed Water
Traveling along the Casing (photograph courtesy of Dr. Dan Brown)

58
This high generation of bleed water can lead to increased porosity, reduced strength, increased
permeability, reduced durability, and plastic shrinkage cracks. Therefore, it is necessary to
control or limit the amount of bleed water generated. This is especially true for large shafts at
deep depths, where temporary casing is utilized, and when the wet-hole method is used in low-
permeable soils. In such cases, the generated bleed can not escape laterally as in highly
permeable soils. As a result, bleed water will escape vertically through bleed channels. Under
these circumstances, the use of high water-to-cementitious ratio concrete mixtures with high
water contents may lead to low cohesive concrete mixtures that promote both segregation and
bleeding. In order to reduce the amount of bleeding Mindess et al. (2003) and Neville (1996)
suggest that the following steps be taken to reduce the amount of bleed water generated:
• Increase the cement fineness or by using other finely divided supplementary
cementitious materials,
• Through air entrainment, which is very effective,
• By reducing the water content or water-to-cementitious ratio, and
• Presence of an adequate proportion of very fine aggregate particles, especially less
than the #100 sieve.
Case Study 7
In this example, drilled shafts were used to support columns over a bridge in the
southwest United States. The drilled shafts were cast through the lake into the underlying soil
that consisted of sedimentary rock using approximately 60 feet of removable casing. Each shaft
was approximately 6 feet in diameter and 80 feet deep. After the removable forms were
removed, inspectors noticed bleed channels and surface streaks had formed along the outer
perimeter of the shaft.
The use of removable casing and considering the fact that the shaft was placed into
sedimentary rock forced the bleed water to travel vertically creating bleed channels and surface
streaks as shown in Figure 3.26. It can be determined from looking at Figure 3.26 that the
creation of bleed channels may result in a reduction in durability and increased permeability.
Careful attention must be exercised to ensure that bleeding is reduced by incorporating actions
previously stated.

59
Figure 3.26: Shaft Defect due to Bleed Water Traveling along the Casing (TxDOT)
3.5 SUMMARY AND CONCLUSIONS
Recently developed techniques in integrity and load testing have provided engineers and
contractors with insight to problems that are associated with materials and construction practices
that have lead to defects or less than optimal performance in drilled shaft foundations. Some of
the most common issues that comprise the quality of drilled shaft foundations due to drilled shaft
concrete come from the failure to consider one or more of the following:
1. Retained workability of the concrete mixture for the duration of the pour
2. Blockage of the coarse aggregate due to congested rebar cages
3. Segregation and bleeding of the drilled shaft concrete
In drilled shaft construction, full compaction or consolidation of a concrete mixture must be
achieved without the use of external energy. Workability is one of the most important
characteristics for drilled shaft concrete. Another important aspect of drilled shaft concrete in
terms of workability is the consideration of the aggregate type and gradation. When tremie
placement or casing is utilized it is not only important to have sufficient workability initially, but it is
also critical to maintain the workability for the duration of the pour. If workability is not maintained
for the duration of the pour, there is a chance that debris can become entrapped causing
structural defects within the shaft. To ensure that proper workability and slump retention is
achieved, trial mixes should be conducted with the cementitious materials, aggregates, and
additives that will be used for a particular application.
When closely spaced reinforcement bars are utilized the lateral flow of the concrete is
significantly impeded resulting in an elevation difference and interlocking and bridging of the

60
aggregate at the vicinity of the rebar cage. Debris accumulated on top of the rising column of
concrete has a possibility of becoming entrapped on the outside of the rebar cage. Drilled shaft
concrete should exhibit sufficient cohesiveness to prevent segregation of the concrete mixture.
Rising bleed water can become trapped on the underside of coarse aggregate and reinforcement;
thus, resulting in larger interfacial transition zones and loss of bond between the reinforcement
and concrete. Bleed water can travel upwards along the surface of casings forming a preferred
channel resulting in surface streaking and distinct localized channels resulting in loss of bond
between the reinforcement and concrete.

61
Chapter 4
LABORATORY TESTING PROGRAM AND MATERIALS
4.1 INTRODUCTION
The objective of this research project is to evaluate the use of self-consolidating concrete as a
viable material to be used in drilled shaft construction. The laboratory testing program developed
will examine the difference between ordinary drilled shaft concrete (ODSC) and self-consolidating
concrete (SCC) for both fresh and hardened properties. The fresh properties include filling ability,
passing ability, segregation resistance, workability over time, bleeding characteristics, and
setting. The hardened properties include the comparison of the compressive strength, elastic
modulus, permeability, and drying shrinkage. Based on the results of the laboratory testing
program, mixture proportions will be recommended for further evaluation during the construction
of full-scale shafts in South Carolina.
4.2 REQUIREMENTS FOR ODSC AND SCC MIXTURES
According to SCDOT Standard Specifications for Highway Construction (2000), concrete for
drilled shaft construction should be Class 4000 DS. The specification for Class 4000 DS states
that the concrete mixture shall meet the following criteria:
• Minimum Cement per cubic yard = 625 lbs.
• Slump = 7-9 inches
• Maximum water-to-cementitious ratio = 0.43
• 28-Day minimum compressive strength = 4000 psi
• Air entrainment = Not required.
• Nominal coarse aggregate size = ¾ inch
• No. 67 aggregate gradation = Required.
Since a proposed field study will be conducted in South Carolina, all ordinary drilled shaft
concrete (ODSC) mixtures prepared in the laboratory shall also conform to the above criteria.
However, due to the nature of this research the SCC mixtures will not conform to the above
criteria set forth by the SCDOT with the exception of the required 28-day minimum compressive
strength of 4,000 psi. Instead, the quality control limits for the SCC mixtures were based on past
research and careful consideration of the drilled shaft construction issues discussed in Chapter 3.

62
Yao and Gerwick (2004) report that slump flow value requirements for drilled shafts
applications typically range from 14 to 18 inches. In order to provide a concrete mixture with an
increase in workability compared to the typical requirements provided above, it was determined
that no SCC mixture should exhibit a slump flow less than 18 inches at placement. Research
conducted at Auburn University by Hodgson (2003) indicates that when SCC is used in drilled
shaft applications, a slump flow of approximately 24 inches can provide sufficient workability while
showing limited signs of segregation. Based upon this literature, it was concluded that a slump
flow of 18 inches would provide an increase in workability compared to ODSC and displace the
drilling slurry upward in one uniform horizontal layer. It was further determined that the upper
slump flow value should be limited to 24 inches in order to prevent severe segregation, and slump
flow values over 24 inches would not be needed to provide the necessary workability. Moreover,
a VSI rating of 1 or less was established in order to limit possible segregation of the concrete
mixture during or after placement. It must be noted that mixture proportions for the base line
SCC mixture utilized in Phases I-IV (3:41-48-FA) were based on recommendations provided by
Su et al. (2001) “A Simple Design Method for Self-Compacting Concrete”.
All concrete mixtures prepared in the laboratory shall meet the ACI 318 (2002), “Building
Code Requirements for Reinforced Concrete”, recommendations that specifies that the concrete
mixtures should be proportioned to provide an average compressive strength (f’cr) which is higher
than the required strength (f’c). When adequate data are not available to establish a standard
deviation it is recommended that the specified compressive strength (f’c), when ranging from
3,000 to 5,000 psi, be increased by 1,200 psi. Therefore, all concrete mixtures should have a
critical average compressive strength (f’cr) of no less than 5,200 psi at 28-days to be considered
acceptable.
4.3 LABORATORY TESTING PROGRAM
A laboratory testing program was developed to investigate the use of self-consolidating concrete
as a viable material to be used in drilled shaft construction. This research was separated into five
separate phases to evaluate or compare an aspect of the concrete’s performance. In this
research project the following five phases were evaluated:
• Effect of Type and Dosage of HRWRA
• Effect of Retarder Dosage
• Appropriate SCC Mixing Procedure
• Selection of SCC Properties
• Methods to Modify the Viscosity of SCC Mixtures

63
4.3.1 Phase I – Effect of Type and Dosage of HRWRA
In view of the fact that the recommended concrete mixture will eventually be used for a full-scale
field study, it is essential to assess the effect of continuous mixing imposed by a ready mix truck
during transportation. Experience has indicated the slump or slump flow will decrease with
continuous mixing. Therefore, the primary objective of Phase I was to determine the type and
approximate dosage of high-range water reducing admixture (HRWR) required to produce the
necessary slump flow characteristics following some period of mixing time.
Preliminary investigations indicated that the approximate transportation time from the
batch plant located in Marion, South Carolina to the proposed field site located 1.25 miles
southeast of Nichols, South Carolina would be approximately 30 minutes. Upon arrival at the
field site, the slump flow should be within the quality control limits of 18 to 24 inches with a VSI
rating of 1 or less. Batch sizes of two cubic feet with the mixture proportions shown in Table 4.1
were utilized for this phase of the research. A slump flow test was performed on each concrete
mixture directly after the completion of the mixing procedure, which would represent the slump
flow at the batch plant. The concrete mixture would subsequently be mixed for an additional 30
minutes to simulate the transportation time. Afterwards, the slump flow test was performed once
more, which represented the slump flow at the job site. Figure 4.1 shows the flow chart used for
Phase I of this research project.
Table 4.1: Concrete Mixture Proportions for Phase I
Item
Coarse Aggregate (No. 67) (lb/yd3)
Coarse Aggregate (No. 789) (lb/yd3)
Fine Aggregate (lb/yd3)
Water (lb/yd3)
Type I Cement (lb/yd3)
Class F Fly Ash (lb/yd3)
Target Air (%)
High-Range Water Reducer (PCE) (oz/cwt)
Retarder (oz/cwt)
Viscosity Modifying Admixture (oz/cwt)
306
500
250
SCC Mixture
1082
394
1366
2
2
8
8 to 12

64
PHASE I
Effect of Type and Dosage of High Range Water Reducer
2.0 Cubic Feet Batch Size
8 oz/cwt Glenium 3030 NS 8 oz/cwt Glenium 3000 NS 10 oz/cwt Glenium 3030 NS 12 oz/cwt Glenium 3030 NS
Fresh Properties
Slump Flow
Plant
Job Site
Figure 4.1: Flow chart for Phase I

65
4.3.2 Phase II –Effect of Retarder Dosage
When tremie placement or temporary casing is utilized for drilled shaft foundations it is not only
important to have sufficient workability initially, but it is also critical to maintain the workability for
the duration of the pour. Controlled setting of the concrete mixture is necessary to allow for any
construction delays in concreting, and to allow the temporary casing to be removed after
concreting is completed. In most cases, retarding admixtures are used to provide the controlled
setting that is necessary to complete the construction sequence.
The primary objective of Phase II was to determine the effect of retarding admixtures on
the retained workability over some duration of time. Batch sizes of two cubic feet with the mixture
proportions shown in Table 4.2 were used for this phase of the research project. Therefore, only
the effect of the delayed hydration due to the retarder dosage was examined in the phase. Slump
flow tests were performed over time as well as setting tests for each batch. Figure 4.2 shows the
flow chart used for this phase of the research project.
Table 4.2: Concrete Mixture Proportions for Phase II
Item
Coarse Aggregate (No. 67) (lb/yd3)
Coarse Aggregate (No. 789) (lb/yd3)
Fine Aggregate (lb/yd3)
Water (lb/yd3)
Type I Cement (lb/yd3)
Class F Fly Ash (lb/yd3)
Target Air (%)
Retarder (oz/cwt)
High-Range Water Reducer (PCE) (oz/cwt)
Viscosity Modifying Admixture (oz/cwt)
SCC Mixture
1082
394
250
2
1366
306
500
10
2
0 to 8

66
Figure 4.2: Flow chart for Phase II
PHASE II
Effect of Retarding Admixture
2.0 Cubic Feet Batch Size
0 oz/cwt Retarder 4 oz/cwt Retarder 8 oz/cwt Retarder
Fresh Properties
Slump Flow
Plant
Job Site
Retention
Time of Set

67
4.3.3 Phase III –Appropriate SCC Mixing Procedure
The purpose of Phase III was to determine an appropriate SCC mixing procedure to be used
throughout the remaining research project as well as the field study. It should be noted that the
standardized mixing procedure provided by ASTM C 192 (1998) is not appropriate for SCC. Two
suggestions were provided by either chemical admixture representatives or ready mix concrete
suppliers as to when the HRWR admixture should be added. One suggestion indicated that
adding the HRWR admixture before the addition of the cementitious materials may improve the
effectiveness of the HRWR admixture. The other suggestion preferred that the HRWR admixture
be added after the addition of the cementitious materials so that a “water slump” can be obtained.
The purpose of this water slump is to give an indication of the concrete’s consistency due to the
net mixing water alone. Furthermore, the water slump can be an indicator to determine if the
moisture corrections performed on the aggregate was correct. Thus, two mixing procedures were
developed to determine the effect of timing of HRWR admixture addition. Batch sizes of two
cubic feet with the mixture proportions shown in Table 4.3 were mixed according to the mixing
procedures listed below. In addition, slump flow tests were performed over time to determine the
effect of the mixing process on the slump flow retention. Figure 4.3 shows the flow chart used for
this phase of the project.
Table 4.3: Concrete Mixture Proportions for Phase III
Item
Coarse Aggregate (No. 67) (lb/yd3)
Coarse Aggregate (No. 789) (lb/yd3)
Fine Aggregate (lb/yd3)
Water (lb/yd3)
Type I Cement (lb/yd3)
Class F Fly Ash (lb/yd3)
Target Air (%)
Retarder (oz/cwt)
Viscosity Modifying Admixture (oz/cwt)
2
2
8
SCC Mixture
1082
394
1366
306
500
250
Mixing Procedure 1 – Early Addition of HRWRA
1. Add 50% of mixing water into the concrete mixer.
2. Add coarse and fine aggregates.
3. Add any retarding admixtures onto aggregates.
4. Mix for 1 minute.

68
5. Add the rest of the mixing water.
6. Add HRWR while concrete is mixing.
7. Mix for 2 minutes.
8. Stop the mixer and add cementitious materials.
9. Add any VMA while concrete is mixing.
10. Run the mixer for 3 minutes.
11. Rest for 3 minutes.
12. Run the mixer for an additional 2 minutes.
13. Stop the mixer and take a slump or slump flow reading. This represents testing at the
batch plant.
14. Run the mixer for 50 minutes. This accounts for transportation time that will be required.
15. Stop the mixer and take a slump or slump flow reading. This represents the testing at the
job site.
16. Proceed to make all fresh and hardened specimens for testing.
Mixing Procedure 2 – Delayed Addition of HRWRA
1. Add 80% of the mixing water into the mixer.
2. Place the coarse and fine aggregate into the mixer.
3. Add any retarding admixtures onto aggregates.
4. Mix for 1 minute.
5. Stop the mixer and add cementitious materials.
6. Add the rest of the mixing water.
7. Add any VMA while the concrete is mixing.
8. Mix concrete for 2 minutes.
9. Stop the mixer and take a water slump reading.
10. Add any water reducing admixtures.
11. Run the mixer for 3 minutes.
12. Rest for 3 minutes.
13. Run the mixer for an additional 2 minutes.
14. Stop the mixer and take a slump or slump flow reading. This represents testing at the
batch plant.
15. Run the mixer for an additional 50 minutes. This accounts for the transportation time that
will be required.
16. Stop the mixer and take a slump or slump flow reading. This represents testing at the job
site.
17. Proceed to make all fresh and hardened concrete specimens for testing.

69
PHASE III
Effect of Timing of High Range Water Addition
2.0 Cubic Feet Batch Size
Mixing Procedure 1 Mixing Procedure 2
Fresh Properties
Slump Flow
Plant
Job Site
Retention
Figure 4.3: Flow chart for Phase III

70
4.3.4 Phase IV – Selection of SCC Properties
Phase IV can be considered the most important component and primary focus of this research
project. It was determined that the most influential parameters that would affect the fresh and
hardened properties of self-consolidating concrete compared to ordinary drilled shaft concrete
were the sand-to-aggregate ratio, water-to-cementitious materials ratio, and the use of various
type of supplementary cementitious materials. As a result, these were the factors selected to be
varied for the SCC mixtures within this phase of the research. This phase of the research project
will not only examine different aspects of self-consolidating concrete (SCC) using various
mixtures, but will also compare the fresh and hardened concrete properties of SCC and ordinary
drilled shaft concrete (ODSC). Figure 4.4 shows the flow chart used for this phase of the project.
There were a total of nine different concrete batches prepared for Phase IV. All of these
mixtures were made from materials obtained from South Carolina that will most likely be used
during the field project. Two of the concrete mixtures were of ODSC, while the other seven were
various SCC mixtures. Table 4.4 presents the mixture proportions and dosages of chemical
mixtures used for each concrete mixture. One important point that needs to be considered is that
the two ordinary drilled shaft concrete mixtures were not designed by the researcher or the
research advisors, rather these concrete mixtures were provided by a ready mix concrete supplier
in South Carolina. It was expressed that these concrete mixtures met all requirements for wet-
hole construction in South Carolina and are routinely accepted by the South Carolina Department
of Transportation (SCDOT) for drilled shaft construction. The use of the two ordinary drilled shaft
mixtures will not only provide a means of evaluating the differences between ordinary drilled shaft
concrete and self-consolidating concrete for both fresh and hardened properties, but also assist in
the decision of which SCC mixture will be suitable for further evaluation during the construction of
full-scale shafts in South Carolina.
A specific identification system for this phase was developed to clearly distinguish each
mixture and assist in logging of the test results. The identification system for the ordinary drilled
shaft concrete consisted of the mix number followed by ODSC as shown in Figure 4.5.
1:ODSC
Mix Number Ordinary Drilled Shaft Concrete
1:ODSC
Mix Number Ordinary Drilled Shaft Concrete
Figure 4.5: Example of Identification System for Ordinary Drilled Shaft Concrete

71
PHASE IV
Ordinary Drilled Shaft Concrete Self-Consolidating Concrete
Effect of Sand-to-Aggregate Ratio Effect of Water-to-Cementitious Ratio
Sand-to-Aggregate Ratio = 0.48 Water-to-Cement Ratio = 0.41 Sand-to-Aggregate Ratio = 0.44 Water-to-Cement Ratio = 0.36
Sand-to-Aggregate Ratio = 0.40
Fresh Properties Fresh Properties
Slump Slump Flow Batch Plant Batch Plant Job Site Job Site Retention Retention Bleeding Passing Ability Setting Segregation
Bleeding Setting
Figure 4.4: Flow Chart for Phase IV (continued on next page)

72
Hardened Properties Hardened Properties Strength Development Strength Development Modulus of Elasticity Modulus of Elasticity Drying Shrinkage Drying Shrinkage Permeability Permeability Comparison Ordinary Drilled Shaft Concrete Self-Consolidating Concrete
Figure 4.4: Flow Chart for Phase IV

73
Table 4.4: Concrete Mixture Proportions for Phase IV
Item 1:ODCS 2:ODCS 3:41-48-FA 4:41-44-FA 5:41-40-FA 6:36-40-FA 7:36-40-SG 8:36-40-SF 9:36-44-FA
Coarse Aggregate (No. 67) (lb/yd3) 1458 1778 1082 1191 1304 1300 1326 1286 1208
Coarse Aggregate (No. 789) (lb/yd3) 320 0 394 434 460 463 478 470 442
Fine Aggregate (lb/yd3) 1181 1181 1366 1285 1190 1175 1195 1164 1289
Water (lb/yd3) 289 289 306 293 284 270 270 270 270
Type I Cement (lb/yd3) 560 560 500 477 465 500 450 442 500
Class F Fly Ash (lb/yd3) 140 140 250 238 230 250 0 248 250
GGBF Slag (lb/yd3) 0 0 0 0 0 0 300 0 0
Silica Fume (lb/yd3) 0 0 0 0 0 0 0 60 0
Target Air (%) 2 2 2 2 2 2 2 2 2
Mid-Range Water Reducer (NP) (oz/cwt) 8 8 0 0 0 0 0 0 0
Mid-Range Water Reducer (PCE) (oz/cwt) 0 0 0 0 0 4 4 4 4
High-Range Water Reducer (PCE) (oz/cwt) 0 0 10 10 10 10 12 12.5 10
Retarder (oz/cwt) 4 4 8 8 8 8 12 12 10
Viscosity Modifying Admixture (oz/cwt) 0 0 2 2 2 2 0 0 2
Water-to-Cementitious Materials Ratio 0.41 0.41 0.41 0.41 0.41 0.36 0.36 0.36 0.36
Sand-to-Aggregate Ratio 0.40 0.40 0.48 0.44 0.40 0.40 0.40 0.40 0.44
Aggregate Volume Fraction (% By Volume) 67 67 64 65 66 66 67 66 66
Paste Volume Fraction (% By Volume) 14 14 16 15 15 16 15 16 16
Ordinary DSC Self-Consolidating Concrete Mixtures
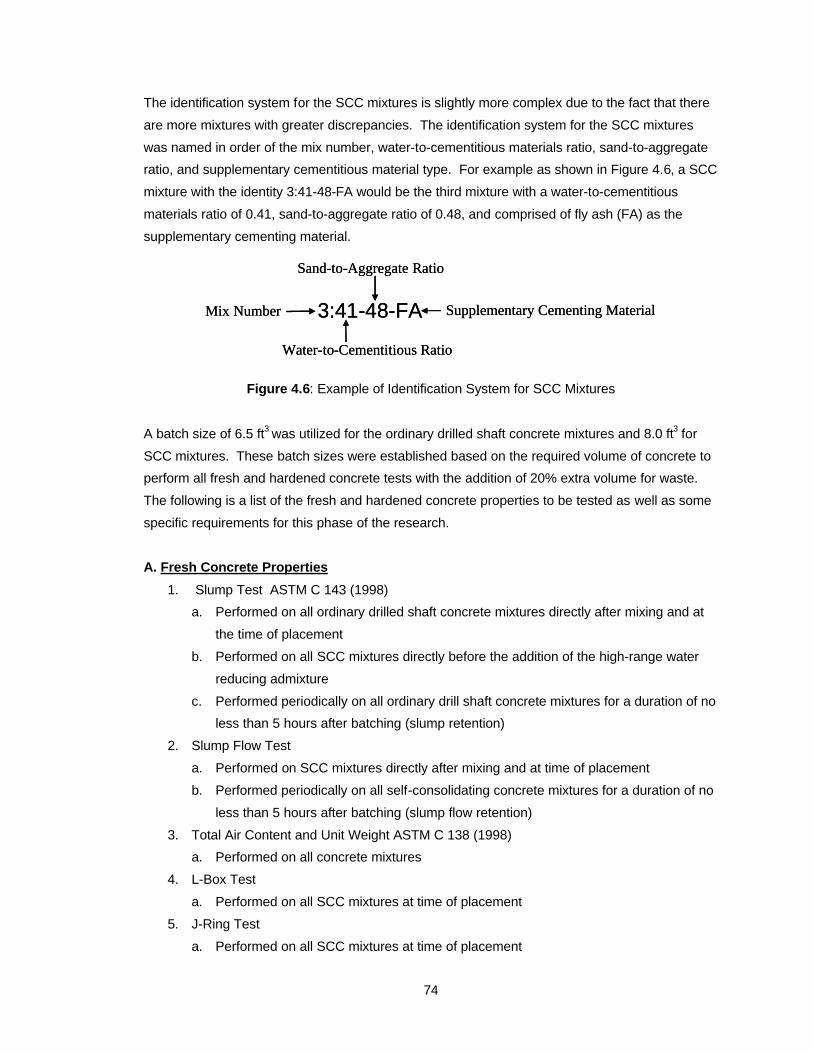
74
The identification system for the SCC mixtures is slightly more complex due to the fact that there
are more mixtures with greater discrepancies. The identification system for the SCC mixtures
was named in order of the mix number, water-to-cementitious materials ratio, sand-to-aggregate
ratio, and supplementary cementitious material type. For example as shown in Figure 4.6, a SCC
mixture with the identity 3:41-48-FA would be the third mixture with a water-to-cementitious
materials ratio of 0.41, sand-to-aggregate ratio of 0.48, and comprised of fly ash (FA) as the
supplementary cementing material.
3:41-48-FAMix Number
Water-to-Cementitious Ratio
Sand-to-Aggregate Ratio
Supplementary Cementing Material3:41-48-FAMix Number
Water-to-Cementitious Ratio
Sand-to-Aggregate Ratio
Supplementary Cementing Material
Figure 4.6: Example of Identification System for SCC Mixtures
A batch size of 6.5 ft3 was utilized for the ordinary drilled shaft concrete mixtures and 8.0 ft3 for
SCC mixtures. These batch sizes were established based on the required volume of concrete to
perform all fresh and hardened concrete tests with the addition of 20% extra volume for waste.
The following is a list of the fresh and hardened concrete properties to be tested as well as some
specific requirements for this phase of the research.
A. Fresh Concrete Properties
1. Slump Test ASTM C 143 (1998)
a. Performed on all ordinary drilled shaft concrete mixtures directly after mixing and at
the time of placement
b. Performed on all SCC mixtures directly before the addition of the high-range water
reducing admixture
c. Performed periodically on all ordinary drill shaft concrete mixtures for a duration of no
less than 5 hours after batching (slump retention)
2. Slump Flow Test
a. Performed on SCC mixtures directly after mixing and at time of placement
b. Performed periodically on all self-consolidating concrete mixtures for a duration of no
less than 5 hours after batching (slump flow retention)
3. Total Air Content and Unit Weight ASTM C 138 (1998)
a. Performed on all concrete mixtures
4. L-Box Test
a. Performed on all SCC mixtures at time of placement
5. J-Ring Test
a. Performed on all SCC mixtures at time of placement

75
6. Segregation Column
a. Performed on all SCC mixtures at time of placement
7. Bleeding Test ASTM C 232 (1998)
a. Performed on all concrete mixtures
b. Performed until bleeding of the concrete mixtures has seized
8. Setting by Penetration Resistance ASTM C 403 (1998)
a. Performed on all concrete mixtures
b. 6 x 6 inch cylindrical specimens of mortar obtained by wet sieving
B. Hardened Concrete Properties
1. Compressive Strength ASTM C 39 (1998) and Elastic Modulus ASTM C 469 (1998)
a. 6 x 12 inch cylindrical specimens
b. Test 3 cylinders at ages of 3, 7, 14, 28, and 56 days
2. Drying Shrinkage ASTM C 157 (1998)
a. 3 concrete prisms 3 x 3 x 12 inch
b. Test at ages 1, 2, 3, 7, 14, 28, 56, 91, 180, and 365 days after curing
3. Permeability ASTM C 1202 (1998)
a. 4 x 8 inch cylindrical specimens
b. Test 3 specimens at ages of 91 and 365 days
C. Requirements
1. The slump of the ordinary drilled shaft concrete mixtures, at the time of placement, shall
be 8 ± 1 inches.
2. The slump flow of the SCC mixtures, at the time of placement, shall be 21 ± 3 inches.
3. A 28-day required compressive strength (fcr’) of 5,200 psi is needed.
4. No segregation of the concrete mixtures may occur at time of placement. The visual
stability index (VSI) of the SCC mixtures, at the time of placement, shall be 1.0 or less.
4.3.5 Phase V – Methods to Modify the Viscosity of SCC Mixtures
Phase V will examine the various methods to modify the viscosity of a SCC mixture. There were
21 different concrete batches prepared for Phase V. Each batch was designed to evaluate a
distinct method of modifying the viscosity as identified during the literature review of this research
project. These methods included one or more of the following: reduction in water-to-cementitious
materials ratio, change in type of supplementary cementing material, and/or VMA dosage. The
sand-to-aggregate was held constant at 0.40 for all concrete batches; therefore, only the effect of
the different viscosity modifiers will be examined. It was determined that a sand-to-aggregate
ratio of 0.40 would be the worst-case scenario for not only increasing the viscosity of a concrete
mixture, but also increasing the stability of the mixture at higher slump flows. Table 4.5 presents

76
the appropriate mixture proportions and approximate dosages of chemical mixtures used for each
concrete mixture.
The identification system for the SCC mixtures was named in order of the mix number,
material source, water-to-cementitious materials ratio, and viscosity modifying method. For
example, a SCC mixture with the identity 6:AL-36-33 FA would be the sixth mixture with the
materials being from a local source in Alabama, water-to-cementitious materials ratio of 0.36,
and comprised of 33% fly ash as the viscosity modifying method.
3:AL-36-33 FAMix Number
Water-to-Cementitious Ratio
Material Source
Viscosity Modifier 3:AL-36-33 FAMix Number
Water-to-Cementitious Ratio
Material Source
Viscosity Modifier
Figure 4.7: Example of Identification System for Phase V
A batch size of 3 ft3 was established based on the required volume of concrete to perform all
fresh and hardened concrete tests with the addition of 20% extra volume for waste for all SCC
mixtures. The following is a list of the fresh and hardened concrete properties to be tested as
well as some specific requirements for this phase of the research. Figure 4.8 illustrates the flow
chart used for this phase of the project.
A. Fresh Concrete Properties
1. Slump Flow Test
a. Performed on SCC mixtures directly after mixing and at time of placement
2. Total Air Content and Unit Weight ASTM C 138 (1998)
B. Hardened Concrete Properties
1. Compressive Strength ASTM C 39 (1998) and Elastic Modulus ASTM C 469 (1998)
a. 6 x 12 inch cylindrical specimens
b. Test 3 cylinders at ages of 7, 28, and 56 days
C. Requirements
1. The slump flow of the SCC mixtures, at the time of placement, shall be 21 ± 3 inches.
2. A 28-day required compressive strength (fcr’) of 5,200 psi is needed.
3. No segregation of the concrete mixtures may occur at time of placement. The visual
stability index (VSI) of the SCC mixtures, at the time of placement, shall be 1.0 or less.

77
Table 4.5: Concrete Mixture Proportions for Phase V
ITEM
Self-Consolidating Concrete Mixtures
Coa
rse
Agg
rega
te (N
o. 6
7) (l
b/yd
3 )
Coa
rse
Agg
rega
te (N
o. 8
9) (l
b/yd
3 )
Fin
e A
ggre
gate
(lb/
yd3 )
Wat
er (l
b/yd
3 )
Typ
e I C
emen
t (lb
/yd3 )
Cla
ss F
Fly
Ash
(lb/
yd3 )
GG
BF
Sla
g (lb
/yd
3 )
Silic
a F
ume
(lb/y
d3 )
Mic
ron
3 (lb
/yd
3 )
Lim
e st
one
(lb/y
d3 )
Tar
get A
ir (%
)
Mid
-Ran
ge W
ater
Red
ucer
(PC
E)
(oz/
cwt)
Hig
h-R
ange
Wat
er R
educ
er (P
CE
) (o
z/cw
t)
Ret
arde
r (o
z/cw
t)
Vis
cosi
ty M
odify
ing
Adm
ixtu
re
(oz/
cwt)
Wat
er-to
-Cem
entit
ious
Mat
eria
ls
Rat
io
San
d-to
-Agg
rega
te R
atio
Agg
rega
te V
olum
e Fra
ctio
n (%
By
Vol
ume)
Pas
te V
olum
e Fra
ctio
n (%
By
Vol
ume)Self-Consolidating
Concrete Mixtures
1:AL-41-0 VMA 1300 463 1188 284 465 230 0 0 0 0 2 0 10 8 0 0.41 0.40 66 15
2:Al-41-2 VMA 1300 463 1188 284 465 230 0 0 0 0 2 0 10 8 2 0.41 0.40 66 15
3:AL-41-10 VMA 1300 463 1188 284 465 230 0 0 0 0 2 0 10 8 10 0.41 0.40 66 15
4:AL-41-18 VMA 1300 463 1188 284 465 230 0 0 0 0 2 0 10 8 18 0.41 0.40 66 15
5:AL-36-33•2FA 1283 461 1192 270 500 250 0 0 0 0 2 4 10 8 2 0.36 0.40 66 16
6:AL-36-33 FA 1264 450 1148 284 529 260 0 0 0 0 2 0 10 8 0 0.36 0.40 64 17
7:AL-36-40 FA 1246 450 1150 284 473 315 0 0 0 0 2 0 10 8 0 0.36 0.40 64 17
8:AL-36-50 FA 1220 450 1150 284 394 395 0 0 0 0 2 0 10 8 0 0.36 0.40 63 18
9:AL-36-6 SF 1225 470 1158 284 497 245 0 47 0 0 2 0 12 8 0 0.36 0.40 64 17
10:AL-36-8 SF 1235 460 1155 284 486 239 0 63 0 0 2 0 13 8 0 0.36 0.40 64 17
11:AL-36-10 SF 1232 460 1155 284 475 234 0 79 0 0 2 0 13 8 0 0.36 0.40 64 17
12:AL-36-15 SF 1228 450 1160 284 449 221 0 118 0 0 2 0 15 8 0 0.36 0.40 64 17
13:AL-36-40 SG 1330 478 1188 270 450 0 300 0 0 0 2 0 12 8 0 0.36 0.40 67 15
14:AL-36-50 SG 1303 468 1150 284 394 0 395 0 0 0 2 0 12 8 0 0.36 0.40 66 15
14:AL-36-50 SG (LA) 1303 468 1150 284 394 0 395 0 0 0 2 20 0 8 0 0.36 0.40 66 15
15:AL-36-60 SG 1292 470 1154 284 316 0 473 0 0 0 2 0 12 8 0 0.36 0.40 66 16
16:AL-36-8 M3 1252 452 1148 284 465 260 0 0 63 0 2 0 10 8 0 0.36 0.40 64 17
17:AL-36-12 M3 1245 452 1148 284 435 260 0 0 94 0 2 0 10 8 0 0.36 0.40 64 17
18:AL-36-16 M3 1244 448 1148 284 403 260 0 0 126 0 2 0 10 8 0 0.36 0.40 64 17
19:AL-36-8 LS 1285 470 1173 270 442 248 0 0 0 60 2 0 10 8 0 0.36 0.40 66 16
20:AL-36-15 LS 1289 465 1168 270 389 248 0 0 0 112 2 0 10 8 0 0.36 0.40 66 16
21:AL-36-20 LS 1275 461 1180 270 352 248 0 0 0 150 2 0 10 8 0 0.36 0.40 66 16

78
Figure 4.8: Flow Chart for Phase V
PHASE V
Effect of Viscosity Modifier Type
3.0 Cubic Feet Batch Size
VMA Fly Ash Silica Fume Slag Micron 3 Limestone Water-to-Cementitious Ratio
Fresh Properties
Slump Flow
Plant Job Site
Hardened Properties
Strength Development
Modulus of Elasticity

79
4.4 RAW MATERIALS
Section 4.4 will present the raw materials that were used for this research program. The material
part is separated into three separate subsections. These subsections include cementitious
materials, aggregates, and chemical admixtures. Two sources of aggregates, two different
cement sources, and two different sources of fly ash were used in this research. One source of
cement, fly ash, and aggregates was imported from South Carolina, which was used for Phases I
through IV. Phase V incorporated another source of cement, fly ash, and aggregates that was
obtained from a local source located in Alabama. It is important to mention that the raw materials
from Alabama were carefully selected to match, as closely as possible, that of the imported raw
materials from South Carolina. Due to the limited amount of South Carolina material, it was not
feasible to consume the South Carolina material for Phase V since it was not the primary focus of
this research. However, closely matching the material sources allowed any valuable information
obtained from Phase V to be easily transferable to the South Carolina materials. Because of this
exercise, some mix designs were obtained from Phase V and incorporated in Phase IV using
South Carolina materials.
4.4.1 Cementitious Materials
• Type I Portland Cement: There were two different sources of cement used for this
research project. The first source of Type I cement was manufactured by Giant Cement
Company located in Harleyville, South Carolina. The Giant Type I cement was utilized
for Phases I through IV of this research project. The chemical analysis was performed by
Analytical Laboratories, Inc. Table 4.6 presents the chemical analysis results performed
on this brand of cement. Furthermore, the Giant Type I cement had a Blaine Fineness of
367 m2/kg as determined by ASTM C 204 (1998). The second source of Type I cement
was manufactured by Lafarge Cement, Inc. The Lafarge cement was exclusively utilized
for Phase V. In addition, the Lafarge Type I cement had a Blaine Fineness of 398 m2/kg
as determined by ASTM C 204 (1998).
• Class F Fly Ash: As with the cement, there were two main sources of Class F fly ash.
One source of Class F fly ash was provided by the SEFA Group in Wateree, South
Carolina. The SEFA Group fly ash was utilized for Phases I through IV. Table 4.7 shows
the results of the chemical analysis on this brand of fly ash as performed by Analytical
Laboratories, Inc. The second source of fly ash was manufactured by Boral Material
Technologies. This brand of fly ash cement was exclusively used for Phase V.
• Ground Granulated Blast Furnace Slag (GGBFS): The GGBFS used throughout this
entire research project was provided by Buzzi Unicem USA, Inc. This slag meets
specifications set forth by ASTM C 989 (1998) for a Grade 120 Ground Granulated Blast
Furnace Slag.

80
Table 4.6: Chemical Analysis Results for the Giant Type I Cement
Item % by Weight
Silicon Dioxide, SiO2 20.46
Aluminum Oxide, Al2O3 4.78
Iron Oxide, Fe2O3 3.54
Calicum Oxide, CaO 65.28
Magnesium Oxide, MgO 1.31
Sodium Oxide, Na2O 0.08
Potassium Oxide, K2O 0.1
Total Alkalies as Na2O 0.14
Titanium Dioxide, TiO2 0.37
Manganic Oxide, Mn2O3 0.04
Phosphorus Pentoxide, P2O5 0.1
Strontium Oxide, SrO 0.08
Barium Oxide, BaO 0.03
Sulfur Trioxide, SO3 2.57
Tricalcium Silicate, C3S 65.76
Tricalcium Aluminate, C3A 6.69
Dicalcium Silicate, C2S 9.03
Tetracalcium Aluminoferrite, C4AF 10.77
• Condensed Silica Fume: The silica fume used in this research project was manufactured
by Simicala, Inc. located in Mt. Meigs, Alabama.
• Limestone Filler: The limestone filler used in this research project was provided by
Sanco, Inc. at their plant in Dalton, Georgia. It is important to note that limestone filler is
an inert filler rather than cementitious material. However, it is best to introduce the
limestone filler at this point since it is part of the binder content.
• Micron 3: The Micron 3, or commonly know as ultra fine fly ash, used in this research
project was provided by Boral Material Technologies, Courtesy of Mr. Russel Hill. Table
4.8 presents the chemical analysis results for the Micron 3.

81
Table 4.7: Chemical Analysis Results for the SEFA Group Class F Fly Ash
Item % by Weight
Silicon Dioxide, SiO2 52.19
Aluminum Oxide, Al2O3 27.83
Iron Oxide, Fe2O3 9.06
Calicum Oxide, CaO 1.7
Magnesium Oxide, MgO 0.94
Sodium Oxide, Na2O 0.6
Potassium Oxide, K2O 2.58
Titanium Dioxide, TiO2 1.52
Manganese Oxide, MnO2 0.05
Phosphorus Pentoxide, P2O5 0.37
Strontium Oxide, SrO 0.14
Barium Oxide, BaO 0.19
Sulfur Trioxide, SO3 0.24
Table 4.8: Chemical Analysis Results for the Micron 3 Fly Ash
49.21
26.71
4.62
80.54
11.72
2.07
1.36
0.48
1.12
1.22
0.30
Magnesium Oxide, (MgO)
Silicon Dioxide, (SiO2)
Aluminum Oxide, (Al2O3),
Available Alkalies, (as Na2O)
Item % by Weight
Sulfur Trioxide, (SO3)
Sodium Oxide, (Na2O)
Potassium Oxide, (K2O)
Total Alkalies, (as Na2O)
Iron Oxide, (Fe2O3)
Sum of SiO2, Al2O3, Fe2O3
Calcium Oxide, (CaO),
The particle size distribution for all cementitious materials including the limestone filler was
determined by a laser particle size analyzer at the Alabama Department of Transportation as
shown in Figure 4.9. The particle size distribution results are illustrated on Figure 4.10. It is

82
important to note that all materials were tested and analyzed in a dry condition. Since the silica
fume was tested in a dry condition, the laser particle size analyzer tested the silica fume in its
condensed state rather than its individual particles. As a result, the data on Figure 4.10 indicates
that the silica fume produced one of the largest particle size distributions. However, if the silica
fume was tested in a non-condensed state the particle size distribution would be significantly
smaller. Table 4.9 presents the specific gravities for the cementitious materials and limestone
filler used throughout this research project.
Figure 4.9: Particle Size Analyzer
Table 4.9: Specific Gravities for Cementitious Materials
Raw Material Specific Gravity
Giant Type I Cement 3.15
Lafarge Type I Cement 3.15
SEFA Class F Fly Ash 2.28
Boral Class F Fly Ash 2.28
Boral Micron 3 Class F Fly Ash 2.58
GGBFS 2.93
Silica Fume 2.30
Limestone Filler 2.71

83
Figure 4.10: Laser Particle Size Analyzer Results
0
1
2
3
4
5
6
0.1 1 10 100 1000
Particle Size (µm)
Vo
lum
e (%
)
Lafarge Type 1 Giant Type 1 SEFA Class F Fly Ash Boral Class F Fly Ash
GGBFS Micron 3 Silica Fume Limestone Filler

84
4.4.2 Aggregates
As previously stated, there were two different aggregate sources used for this research project.
One source of aggregate was supplied by the Marlboro Quarry located in South Carolina. The
fine and coarse aggregate from South Carolina was placed into “super sacs” and delivered to
Auburn University by means of a transfer truck as shown in Figure 4.11. The local source of fine
and coarse aggregate was supplied by the Shorter Plant and stocked by Twin City Concrete.
Both sources of coarse and fine aggregates were selected to provide necessary aggregate
characteristics needed for this research. The nature of river gravel is important because it is
composed of particles having a round shape that will provide greater workability as compared to
crushed gravel.
Figure 4.11: Raw Material being Delivered from South Carolina
The coarse aggregate from the Marlboro Quarry consisted of a No. 67 and No. 789 gradation
while the fine aggregate classified as FA-10 sand. The coarse aggregate from the Shorter Plant
consisted of a No. 67 and No. 89 gradation. It is important to mention that this research originally
called for the use of a No. 7 gradation for the SCC mixtures; however, this gradation could not be
supplied by a quarry in South Carolina. The No. 7 aggregate was preferred, since it would
provide a SCC mixture with higher passing ability. As a result, an aggregate blend comprised of
a No.67 and No. 789 was developed. Upon arrival, the aggregates were tested to determine their
gradation, absorption capacity, and specific gravities. All aggregates were tested in accordance
to ASTM C 33 (2002). Table 4.10 presents the absorption capacities and specific gravities
(saturated surface dry). Figures 4.12 through 4.17 show the gradations of the fine and coarse
aggregates for both sources.

85
Table 4.10: Specific Gravities and Absorption Capacities for Aggregate Sources
Raw Material Absorption Capacity (%) Specific Gravity (SSD)
Fine Aggregate (SC)* 0.5 2.63
Fine Aggregate (AL)** 0.68 2.64
No. 67 River Gravel (SC)* 0.4 2.65
No. 67 River Gravel (AL)** 0.57 2.64
No. 789 River Gravel (SC)* 0.4 2.64
No. 89 River Gravel (AL)** 0.62 2.63
* SC = South Carolina Material ** AL = Alabama Material
0
10
20
30
40
50
60
70
80
90
100
0.1001.000
Sieve Size
Mas
s P
erce
nt
Pas
sin
g
ASTM C33 Upper Limit
ASTM C33 Lower Limit# 67
1" 3/4" 3/8" #4 #81/2"
Figure 4.12: No. 67 Coarse Aggregate Gradation for South Carolina Material

86
0
10
20
30
40
50
60
70
80
90
100
0.010.11
Sieve Size
Mas
s P
erce
nt
Pas
sin
g
SCDOT Upper Limit
SCDOT Lower Limit# 789
1" 1/2" #4 #163/8" 3/4" #100
Figure 4.13: No. 789 Coarse Aggregate Gradation for South Carolina Material
0
10
20
30
40
50
60
70
80
90
100
0.1001.00010.000
Sieve Size
Mas
s P
erce
nt P
assi
ng
ASTM C33 Upper Limit
ASTM C33 Lower Limit
Fine Aggregate
3/8" #4 #30 #16 #8 # 50 # 100
Figure 4.14: Fine Aggregate Gradation for South Carolina Material

87
0
10
20
30
40
50
60
70
80
90
100
0.1001.000
Sieve Size
Mas
s P
erce
nt
Pas
sin
g
ASTM C33 Upper Limit
ASTM C33 Lower Limit# 67
1" 3/4" 3/8" #4 #81/2"
Figure 4.15: No. 67 Coarse Aggregate Gradation for Alabama Material
0
10
20
30
40
50
60
70
80
90
100
0.010.11
Sieve Size
Mas
s P
erce
nt
Pas
sin
g
ASTM C33 Upper Limit
ASTM C33 Lower Limit# 89
1" 1/2" #4 #163/8" #8 #50
Figure 4.16: No. 89 Coarse Aggregate Gradation for Alabama Material

88
0
10
20
30
40
50
60
70
80
90
100
0.1001.00010.000
Sieve Size
Mas
s P
erce
nt
Pas
sin
g
ASTM C33 Upper Limit
ASTM C33 Lower Limit
Fine Aggregate
3/8" #4 #30 #16 #8 # 50 # 100
Figure 4.17: Fine Aggregate Gradation for Alabama Material
4.4.3 Chemical Admixtures
• Supplier: All chemical admixtures were provided by Degussa Admixtures, Inc., which was
formally known as Master Builders Technologies.
• Mid-Range Water Reducing Admixture (MRWRA): There were two main types of mid-
range water reducing admixtures used for this research project. The first type of MRWR
admixture was PolyHeed N, which was only used for the ordinary drilled shaft concrete
mixtures. This admixture was not selected by the researcher or the research advisors,
instead this admixture type and dosage was provided by a ready mix concrete supplier as
described early in Section 4.3.4. PolyHeed N is a chloride bearing mid-range water
reducing admixture that meets requirements set forth by ASTM C 494 (1998) for a Type
A water reducing admixture. The second type of MRWR admixture used in this research
was PolyHeed 1025. This type of MRWR admixture is based on polycarboxylate ester
(PCE) technology that meets requirements set forth by ASTM C 494 (1998) for a Type A
water reducing as well as a Type F high-range water reducing admixture.
• High-Range Water Reducing Admixture (HRWRA): The HRWR admixtures used for this
research project were Glenium 3000 NS and Glenium 3030 NS. Glenium 3000 NS was
only utilized for Phase I of the research project. Glenium 3030 NS was used for Phases I
through V. This type of HRWR admixture is a chemical admixture based on
polycarboxylate ester (PCE) technology. Glenium 3000 NS and 3030 NS meets

89
requirements set forth by ASTM C 494 (1998) for a Type F high-range water reducing
admixture.
• Retarding Admixtures: There were two main types of retarding admixtures used for this
research project. The first type of retarding admixture was Pozzolith 100 XR, which was
only used for the ordinary drilled shaft concrete mixtures. This admixture was not
selected by the researcher or the research advisors, instead this admixture type and
dosage was provided by a ready mix concrete supplier as described early in Section
4.3.4. Pozzolith 100 XR meets requirements set forth by ASTM C 494 (1998) for a Type
B retarding and Type D water reducing and retarding admixture. The second type of
retarding admixture utilized in this research was Delvo Stabilizer. Delvo Stabilizer meets
requirements set forth by ASTM C 494 (1998) for a Type B retarding and Type D water
reducing and retarding admixture.
• Viscosity Modifying Admixture (VMA): The VMA used in this research project was
Rheomac 358. Rheomac 358 is a polyethylene glycol based or “thickening type”
viscosity modifying admixture.

90
Chapter 5
LABORATORY EQUIPMENT, SPECIMENS, AND PROCEDURES
5.1 INTRODUCTION
Before discussing the laboratory equipment, specimens, and procedures, it may be beneficial to
describe in short detail the recently acquired equipment relevant to this research obtained by
Auburn University. Prior to the summer of 2003, all concrete mixing was completed outside. The
outside environment was subject to ambient conditions that produced significant temperature and
moisture variations. A new state of the art mixing facility was built inside the Harbert Engineering
Center. The new mixing facility consists of an elevated platform with easy access by stairs or
ramp, new 12 ft3 concrete mixer, drainage tank, storage area for materials, and moisture
corrections area. Furthermore, the facility eliminated the temperature and moisture variations
associated with the outside mixing facility, and it now forms one of the most important
components of the concrete research conducted at Auburn University. The new mixing facility is
shown on Figure 5.1. The addition of a new 600-kip Forney compression machine, rapid chloride
permeability cells, compressometer, and length comparator apparatus has allowed more accurate
measurements to be taken for the assessment of various fresh and hardened concrete properties
that may affect the concrete’s performance.
5.2 BATCHING AND MIXING PROCEDURE
The batching procedure for this research began by obtaining an estimated weight amount of
coarse or fine aggregate, which was then carefully placed on a plastic sheet. The fine or coarse
aggregate was thoroughly mixed using a shovel to ensure that the aggregate was of
homogeneous moisture content. The aggregate was then placed into 5 gallon buckets that were
tightly sealed with a lid and moved into the mixing room. Afterwards, moisture corrections were
conducted by obtaining small samples (300-500g) of coarse and fine aggregate, which was then
placed in a small microwavable dish. The samples were subsequently placed into a microwave
and dried to constant weight using a small digital scale. After the moisture content in the coarse
and fine aggregate was obtained, the mixing water and aggregate weights were adjusted to
account for the moisture condition of the aggregates. The weight of the coarse aggregate, fine
aggregate, cementitious material, and mixing water was then measured into 5 gallon buckets

91
using a balance. The chemical admixtures were measured and obtained using 10 and 50 cc
syringes.
Figure 5.1: New Indoor Mixing Facility
Before the mixing procedure began, the concrete mixer was prepared using a “butter batch”. The
butter batch typically consisted of placing a small amount of cement, sand, and water inside the
concrete mixer that would thoroughly coat the mixer’s wall. The purpose of this exercise was to
ensure that no cement or free water would be lost or soaked up by the concrete mixer wall. The
12 ft3 concrete mixer that was used for this project can be seen in Figure 5.2. After the
preparation of the mixer was complete, the following mixing procedure was followed. This mixing
procedure for the SCC mixtures was based on results from Phase II of the research project.
1. Add 80% of the mixing water into the mixer.
2. Place the coarse and fine aggregate into the mixer.
3. Add any retarding admixtures.
4. Mix for 1 minute.
5. Add cementitious materials.
6. Add the rest of the mixing water.
7. Add any VMA while the concrete is mixing.
8. Mix concrete for 2 minutes.
9. Stop the mixer and take a water slump reading.

92
10. Add any water reducing admixtures.
11. Run the mixer for 3 minutes.
12. Rest for 3 minutes.
13. Run the mixer for an additional 2 minutes.
14. Stop the mixer and take a slump or slump flow reading. This represents testing at the
batch plant.
15. Run the mixer for an additional 50 minutes. This accounts for the transportation time that
will be required.
16. Stop the mixer and take a slump or slump flow reading. This represents testing at the job
site.
17. Proceed to make all fresh and hardened concrete specimens for testing.
Figure 5.2: 12 ft3 Concrete Mixer used for this Research
5.3 FRESH PROPERTY TESTING
The fresh concrete properties tested for this research include the slump test, slump flow test, J-
Ring test, L-Box test, bleeding test, unit weight, air content, and time of set. It is important to
observe that the determination of the filling ability of SCC by the slump flow test, determination of
passing ability of SCC by means of the J-Ring and/or L-Box, and determination of segregation
resistance by the segregation column test has not yet been standardized by organizations such
as ASTM. As a result, it may be useful to describe these tests in more detail so that the reader
can become familiar with the equipment and methodology. It must be noted that the procedures
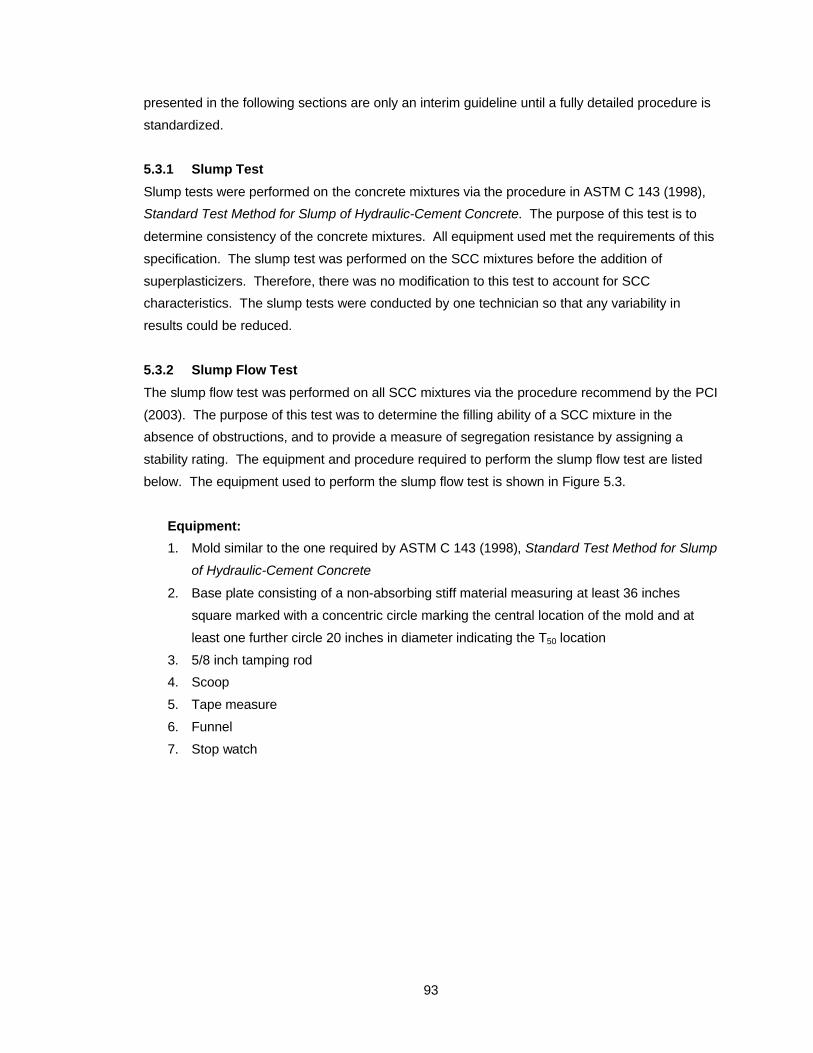
93
presented in the following sections are only an interim guideline until a fully detailed procedure is
standardized.
5.3.1 Slump Test
Slump tests were performed on the concrete mixtures via the procedure in ASTM C 143 (1998),
Standard Test Method for Slump of Hydraulic-Cement Concrete. The purpose of this test is to
determine consistency of the concrete mixtures. All equipment used met the requirements of this
specification. The slump test was performed on the SCC mixtures before the addition of
superplasticizers. Therefore, there was no modification to this test to account for SCC
characteristics. The slump tests were conducted by one technician so that any variability in
results could be reduced.
5.3.2 Slump Flow Test
The slump flow test was performed on all SCC mixtures via the procedure recommend by the PCI
(2003). The purpose of this test was to determine the filling ability of a SCC mixture in the
absence of obstructions, and to provide a measure of segregation resistance by assigning a
stability rating. The equipment and procedure required to perform the slump flow test are listed
below. The equipment used to perform the slump flow test is shown in Figure 5.3.
Equipment:
1. Mold similar to the one required by ASTM C 143 (1998), Standard Test Method for Slump
of Hydraulic-Cement Concrete
2. Base plate consisting of a non-absorbing stiff material measuring at least 36 inches
square marked with a concentric circle marking the central location of the mold and at
least one further circle 20 inches in diameter indicating the T50 location
3. 5/8 inch tamping rod
4. Scoop
5. Tape measure
6. Funnel
7. Stop watch

94
Figure 5.4: Testing Equipment for Slump Flow Test
Procedure (PCI 2003):
1. Moisten all equipment and place on a flat and rigid surface.
2. After the mixture procedure is complete, sample approximately 0.2 ft3 of SCC in
accordance with ASTM C 172 (1998).
3. Position the mold, with the base downwards, in the center of the base plate.
4. Place the SCC sample into the mold by means of a bucket and funnel. The mold
needs to be kept in position.
5. Strike off any excess SCC by means of rolling the tamping rod over the surface.
6. Remove any excess SCC around the base of the mold by means of an absorbent
sponge.
7. Lift the mold vertically a distance of 12 inches in approximately 5 seconds without
lateral movement allowing the concrete to flow out freely.
8. Simultaneously start a stop watch when the cone is lifted, and record the time
taken for the SCC to reach the 20 inch diameter circle (T50 time).
9. Measure the final diameter of the SCC in two perpendicular directions.
10. Calculate the average of the two diameters and report the result to the nearest ¼
inch.
11. After the flow has ceased, assign a stability rating to the SCC mixture according
to Table 5.1 and Figure 5.4.
The slump flow test was frequently performed in the inverted position in conjunction with the J-
Ring test. Under these circumstances, the mold was placed on the base plate with its 4 inch
diameter facing downward. Furthermore, the slump flow tests were conducted by two
technicians. The second technician timed the test while the other lifted the mold. The use of
such practice helped reduce the operator error and improve the accuracy of the T50 times.
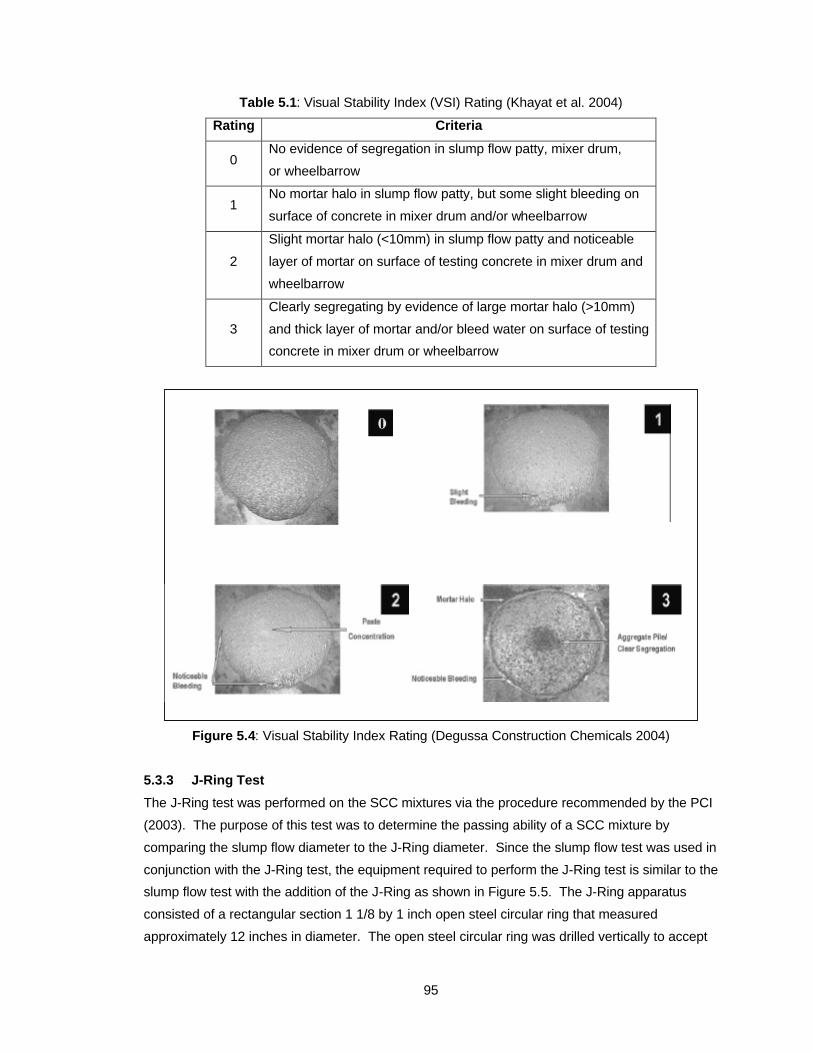
95
Table 5.1: Visual Stability Index (VSI) Rating (Khayat et al. 2004)
Rating Criteria
0 No evidence of segregation in slump flow patty, mixer drum,
or wheelbarrow
1 No mortar halo in slump flow patty, but some slight bleeding on
surface of concrete in mixer drum and/or wheelbarrow
2
Slight mortar halo (<10mm) in slump flow patty and noticeable
layer of mortar on surface of testing concrete in mixer drum and
wheelbarrow
3
Clearly segregating by evidence of large mortar halo (>10mm)
and thick layer of mortar and/or bleed water on surface of testing
concrete in mixer drum or wheelbarrow
Figure 5.4: Visual Stability Index Rating (Degussa Construction Chemicals 2004)
5.3.3 J-Ring Test
The J-Ring test was performed on the SCC mixtures via the procedure recommended by the PCI
(2003). The purpose of this test was to determine the passing ability of a SCC mixture by
comparing the slump flow diameter to the J-Ring diameter. Since the slump flow test was used in
conjunction with the J-Ring test, the equipment required to perform the J-Ring test is similar to the
slump flow test with the addition of the J-Ring as shown in Figure 5.5. The J-Ring apparatus
consisted of a rectangular section 1 1/8 by 1 inch open steel circular ring that measured
approximately 12 inches in diameter. The open steel circular ring was drilled vertically to accept

96
16-5/8 inch diameter reinforcement bars measuring 4 inches in height with a center to center
spacing of approximately 2 5/16 inches.
Procedure (PCI 2003):
1. Moisten all equipment and place on a flat and rigid surface.
2. After the mixture procedure is complete, normally sample approximately 0.2 ft3 of
SCC in accordance with ASTM C 172 (1998).
3. Position the mold, with its 4 inch diameter facing downwards, in the center of the
base plate.
4. Place the SCC sample into the mold by means of a bucket.
5. Strike off any excess SCC by means of rolling the tamping rod over the surface.
6. Remove any excess SCC around the base of the mold by means of an absorbent
sponge.
7. Lift the mold vertically a distance of 9 +/- 3 inches in 3 seconds without lateral
movement allowing the concrete to flow out freely.
8. Measure the final diameter of the SCC in two perpendicular directions.
9. Calculate the average of the two diameters and report the result to the nearest ¼
inch.
10. Conduct the slump test using the inverted method with the provided procedure in
Section 5.2.2.
11. Calculate the difference between the J-Ring diameter and the slump flow
diameter of the companion test.
12. Assign a passing ability rating according to Table 5.2.
Figure 5.5: Testing Equipment for J-Ring Test

97
Table 5.2: J-Ring Passing Ability Rating (ASTM J-Ring Draft 2004)
Difference between Slump
Flow and J-Ring Flow
Passing Ability
Rating Remarks
0 = X = 1 inch 0 No visible blocking
1 < X = 2 inches 1 Minimal to noticeable blocking
X > 2 inches 2 Noticeable to extreme blocking
5.3.4 L-Box Test
The L-Box test was performed on the SCC mixtures via the procedure recommended by the PCI
(2003). The purpose of this test was to determine the passing ability of a SCC mixture by
determining the extent of blocking by reinforcement. The equipment required to perform the L-
Box test is listed below and can be seen in Figure 5.6 and 5.7.
Equipment:
1. L-Box made of non-absorbing material with the dimensions shown in Figure 5.6
2. 5/8 inch tamping rod
3. Scoop
4. Tape measure
Figure 5.6: L-Box Dimensions (PCI 2003)

98
Figure 5.7: Testing Equipment for L-Box Test
Procedure (PCI 2003):
1. Moisten all equipment and place on flat and rigid surface.
2. After the mixture procedure is complete, sample approximately 0.5 ft3 of SCC in
accordance with ASTM C 172 (1998).
3. Ensure that the sliding gate can open freely and then close the gate.
4. Fill the vertical section of the L-Box with the SCC mixture.
5. Let the SCC mixture stand for approximately 1 minute.
6. Strike off any excess SCC by means of rolling the tamping rod over the surface.
7. Lift the gate and allow the SCC mixture to flow into the horizontal section.
8. When the flow has ceased, measure and record the “H1” and “H2” dimensions,
shown in Figure 5.7.
9. Calculate the blocking ratio, H2/H1.
5.3.5 Segregation Column Test
The segregation column test was performed on the SCC mixtures via the procedure
recommended by an ASTM Segregation Column draft (2004). The purpose of this test was to
determine the stability and segregation resistance of a SCC mixture. The equipment required to
perform the segregation column test is listed below and can be seen in Figure 5.8.

99
Figure 5.8: Testing Equipment for Segregation Column Test
Equipment:
1. Balance or scale accurate to 0.1 lb. or to within 0.3% of the test load
2. Column mold made of schedule 40 PVC pipe measuring 8 inches in diameter
and 26 inches in height and separated into 4 equal sections each measuring 6.5
inches in height
3. Collection plate made of a non-absorbent material measuring 20 inches square
containing a semi-circular cut out section in the center measuring 8.5 inches
across
4. 5/8 inch tamping rod
5. No. 4 Sieve
Procedure (ASTM Segregation Column Draft 2004):
1. Assemble and moisten all equipment, then place on flat and rigid surface.
2. After the mixture procedure is complete, sample approximately 0.8 ft3 of SCC in
accordance with ASTM C 172 (1998).
3. Immediately fill the column mold in one continuous lift allowing the concrete to
over fill the top.
4. Strike off any excess SCC by means of rolling the tamping rod over the surface.
5. Allow the SCC to set for 1 hour. This time was extended to 1 hour from the 20-
minute recommendation provided by the ASTM Segregation Column draft

100
(2004). It was expected that due to the extended set times for drilled shaft
concrete that the segregation would be more pronounced after 1 hour.
6. Place the collection plate around the mold and firmly hold the top section of mold
while removing the spring clamps.
7. Screed the SCC onto the collection plate by using a horizontal twisting motion of
the PVC pipe.
8. Place the obtained SCC from the collection plate into a No. 4 Sieve. Wet wash
the sample leaving only the coarse aggregate on the No. 4 sieve.
9. Repeat steps 7 and 8 for the bottom section of the column.
10. Calculate the segregation index using the Equation 5.1 and 5.2.
MB
TB
CACACA
SI)( −
= Equation 5.1
Where:
SI is the segregation index,
CAT is the mass of coarse aggregate in the top section (lbs),
CAB is the mass of coarse aggregate in the bottom section (lbs), and
CABM is the mass coarse aggregate (lbs) per section of the column according to
Equation 5.2.
[ ]MMBM CACACA ∗∗= 0052.0007.0 Equation 5.2
Where:
CAM is the mass of coarse aggregate (lbs) in 1 yd3 of concrete.
5.3.6 Bleeding Test
Bleeding tests were performed on all SCDOT concrete mixtures via the procedure in ASTM C
232 (1998), Standard Test Method for Bleeding of Concrete using Method A. The purpose of this
test was to determine the relative quantity of mixing water that will bleed from a freshly mixed
concrete sample. All equipment used met the requirements of this specification. After placement
of the concrete mixture into the ½ cubic foot container, the accumulated bleed water was drawn
off the surface until cessation of bleeding. The accumulated bleed water was placed into a 100-
mL graduate and recorded after each transfer. The total amount of bleed water was recorded
and expressed as a percentage of the net mixing water contained in the test specimen. This
procedure was followed as closely as possible for all SCC mixtures with the following
modifications. These modifications were necessary to account for SCC characteristics.
1. The SCC mixtures were placed in the container in one continuous lift without any
rodding.
2. The tapping of the sides 10 to15 times with the approximate mallet was not
conducted for the SCC mixtures.

101
5.3.7 Unit Weight and Air Content
The unit weight and air content was determined for all concrete mixtures via the procedure in
ASTM C 138 (1998), Standard Test Method for Unit Weight, Yield, and Air Content. The purpose
of this test was to determine the weight per cubic foot and air content of freshly mixed concrete.
All equipment used met the requirements of this specification. This procedure was followed as
closely as possible for all SCC mixtures with the following modifications. These modifications
were necessary to account for SCC characteristics.
1. The SCC mixtures were placed in the measure in one continuous lift without any
rodding.
2. The tapping of the sides 10 to15 times with the approximate mallet was reduced
to no more than 5 soft taps by hand or mallet for all SCC mixtures. The purpose
of this exercise was to help alleviate any large entrapped air pockets that
remained along the cylinder walls while providing little or no consolidation effort.
5.3.8 Making and Curing Specimens
The making and curing of concrete specimens were performed according to ASTM C 192 (1998),
Standard Practice for Making and Curing Concrete Test Specimens in the Laboratory. After
strike off, all specimens were capped with a tightly sealed lid. The cylinders remained in the
mixing room for a period of 24 hours or until 2 times the initial set was achieved due to extended
setting times of the drilled shaft concrete mixture. Cylinders were then relocated from the mixing
room, stripped of their molds, and placed in a moist curing room. The conditions of the moist
cure room were held constant at a temperature of 73o F and relative humidity of 100%. The
cylinders remained in the curing room until testing. This procedure was followed as closely as
possible for all SCC mixtures with the following modifications. These modifications were
necessary to account for SCC characteristics.
1. The SCC mixtures were placed into the cylinder molds in one continuous lift
without any rodding.
2. The tapping of the sides 10 to 15 times with the approximate mallet was reduced
to no more than 5 soft taps by hand or mallet for all SCC mixtures. The purpose
of this exercise was to help alleviate any large entrapped air pockets that
remained along the cylinder walls while providing little or no consolidation effort.
5.3.9 Time of Set
Setting tests were performed on all SCDOT concrete mixtures via the procedure in ASTM C 403
(1998), Standard Test Method for Time of Setting of Concrete Mixtures by Penetration
Resistance. The purpose of this test was to determine the time of setting for freshly mixed
concrete mixture by means of penetration resistance. All equipment used met the requirements
of this specification. Each mortar sample was obtained by vibrating a portion of the concrete
mixture over a No. 4 sieve, and then placing the mortar into the metal can. The specimens were

102
kept sealed by a tightly placed lid to prevent the occurrence of evaporation. Prior to the removal
of the bleed water, a wedge was inserted under the container to facilitate the collection of bleed
water. The lid was then removed for bleed water draw off and testing. The testing consisted of
making no less than six penetrations until at least one penetration resistance reading equaled or
exceeded 4,000 psi. The specimens were maintained at mixing room temperature for the entire
period until final set was achieved. There were no necessary modifications to this test to account
for SCC characteristics.
5.4 HARDENED CONCRETE PROPERTIES
5.4.1 Compressive Strength
The compressive strength of the 6 x 12 inch cylindrical concrete specimens was tested in
accordance with ASTM C 39 (1998), Standard Test Method for Compressive Strength of
Cylindrical Concrete Specimens. The equipment used in the laboratory to determine the
compressive strength of the specimens met all requirements set forth by this standard. The
specimens were tested using unbonded caps that consisted of a steel retaining ring and
neoprene pads. The unbonded caps meet all requirements described by ASTM C 1231 (1998),
Standard Practice for use of Unbonded Caps in Determination of Compressive Strength of
Hardened Concrete Specimens. The load rate utilized for the 6 x 12 inch specimens was 35
psi/sec., which corresponds to a value of 60,000 lbs/min. Each specimen was loaded in a 600 kip
Forney compression machine until failure occurred.
5.4.2 Modulus of Elasticity
The modulus of elasticity of the 6 x 12 inch cylindrical concrete specimens was tested in
accordance with ASTM C 469 (1998), Standard Test Method for Static Modulus of Elasticity and
Poisson’s Ratio Strength of Concrete in Compression. The purpose of this test was to determine
the chord modulus of 6 x 12 inch specimens. The equipment used in the laboratory to determine
the elastic modulus of the concrete specimens met all requirements set forth by this standard.
The specimens were tested using unbonded caps that consisted of a steel retaining ring and
neoprene pads. The unbonded caps meet all requirements described by ASTM C 1231 (1998),
Standard Practice for use of Unbonded Caps in Determination of Compressive Strength of
Hardened Concrete Specimens. A Humboldt compressometer equipped with a digital dial gauge
was used to determine the elastic modulus of the concrete specimen. The researcher ensured
that the compressometer was positioned evenly from the top, bottom, and sides. The concrete
specimen was subsequently placed in the 600 kip Forney compression machine and tested as
shown in Figure 5.9. The load rate utilized for the 6 x 12 inch concrete specimens was 35
psi/sec., which corresponds to a value of 60,000 lbs/min. Each specimen was first loaded to 40%
of the ultimate strength without recording any data. The purpose of this exercise was to ensure

103
that all equipment was properly seated and working correctly. The load was re-applied while
recording the appropriate data. After the data was recorded, the modulus of elasticity was
determined according to Equation 5.3.
( )( )00005.02
12
−−
=ε
SSE Equation 5.3
Where:
E = Chord modulus of elasticity, psi,
S2 = Stress corresponding to 40% of the ultimate load, psi,
S1 = Stress corresponding to a longitudinal strain of 50 millionths, psi,
ε2 = longitudinal strain produce by S2
Figure 5.9: Concrete Specimen with Compressometer Attached
5.4.3 Drying Shrinkage
The length change of 3 x 3 x 12 inch concrete specimens was tested in accordance with ASTM C
157 (1998), Standard Test Method for Length Change of Hardened Hydraulic-Cement Mortar and
Concrete. The purpose of this test was to determine the length change of the concrete
specimens due to drying shrinkage. The equipment used in the laboratory to determine the
length change of the concrete specimens met all requirements of this specification. The concrete
specimens were allowed to cure for 28 days in a lime-saturated bath. Afterwards, the concrete
specimens were removed and placed into air storage. The air storage room met all requirements
stated in this specification. A Humboldt length comparator equipped with a digital dial gauge was

104
used to determine the length change of the concrete specimens. The use of a digital gauge
helped reduce operator error and allowed more accurate measurements to be recorded.
5.4.4 Permeability
The permeability of 4 x 8 inch concrete specimens was tested in accordance with ASTM C 1202
(1998), Standard Test Method for Electrical Indication of Concrete’s Ability to Resist Chloride Ion
Penetration. The purpose of this test was to give an indication of the concrete’s permeability by
determining the resistance to chloride ion penetration by electrical conductance. The equipment
used in the laboratory to determine the permeability of the concrete specimens met all
requirements set forth by this standard. Proove’ It cells and a Model 164 Test Set with LED read
outs, automatic shut off, and automatic processing equipment was used to determine the
resistance of ion penetration by electrical conductance. The Model 164 Test Set and Proove’ It
cells can be seen by looking at Figure 5.10.
The concrete specimens were allowed to cure in moist curing room until time of testing.
Afterwards, the concrete specimens were removed from the moist cure room and a 2 +/- 1/8 inch
slice was cut from the 4 x 8 inch specimen using a water-cooled diamond saw. The cut
specimens were subsequently conditioned for testing according to requirements set forth by this
standard. After conditioning was completed, the specimens were removed from the vacuum
desiccator and placed into the Proove’ It cells. The use of Proove’ It cells allowed the rapid
preparation of the concrete specimens after the removal from the desiccator. Furthermore, the
Proove’ It cells did not require the use of cell sealant, which further decreased the preparation
time after removal from the desiccator. Each specimen was tested for a period of 6 hours as
required by this standard.
Figure 5.10: Model 164 Test Set and Proove’ It Cells

105
Chapter 6
PRESENTATION AND ANALYSIS OF RESULTS
6.1 INTRODUCTION
The presentation and analysis of results is presented in this chapter in the following order:
• Phase I – Selection of Type and Dosage of HRWRA
• Phase II – Effect of Retarder Dosage
• Phase III – Appropriate SCC Mixing Procedure
• Phase IV – Selection of SCC Properties
• Phase V – Methods to Modify the Viscosity of SCC Mixtures
6.2 PHASE I – SELECTION OF TYPE AND DOSAGE OF HRWRA
The appropriate type and dosage of HRWRA was selected to provide a concrete mixture that was
within the proposed quality control limits and that showed adequate fresh concrete properties
after 30 minutes of continuous mixing. Table 6.1 and Figure 6.1 presents the results obtained
from Phase I. Figure 6.1 shows that the slump flow increased as the dosage of Glenium 3030 NS
increases; this is expected since the fluidity of a concrete mixture will increase as the HRWRA
dosage increases. It can also be concluded from this figure that the Glenium 3000 NS appeared
to be more effective at the same dosage amount of Glenium 3030 NS. Although the Glenium
3000 NS was more effective than the Glenium 3030 NS at the same dosage amount, it produced
an undesirable thick-flakey film on top of cured specimens.
Table 6.1 and Figure 6.1 demonstrate that the slump flow decreased with continuous
mixing. Thus, transportation time must be taken into consideration when determining the
appropriate HRWRA dosage. The results further indicate that dosages of 8 oz/cwt of Glenium
3000 NS and 10 oz/cwt Glenium 3030 NS were within the specified range of slump flow values of
21 ± 3 inches upon completion of mixing. The dosage of 8 oz/cwt of Glenium 3000 NS produced
a concrete mixture with a VSI rating of 1.5 at a slump flow value of 23 ¾ inches, a VSI rating that
is not acceptable for this research project. On the other hand, a dosage amount of 10 oz/cwt of
Glenium 3030 NS produced a concrete mixture that had appropriate fresh concrete properties
after 30 minutes of continuous mixing. Based upon these results, it was determined that the
appropriate type of HRWRA to be used throughout this research project should be Glenium 3030
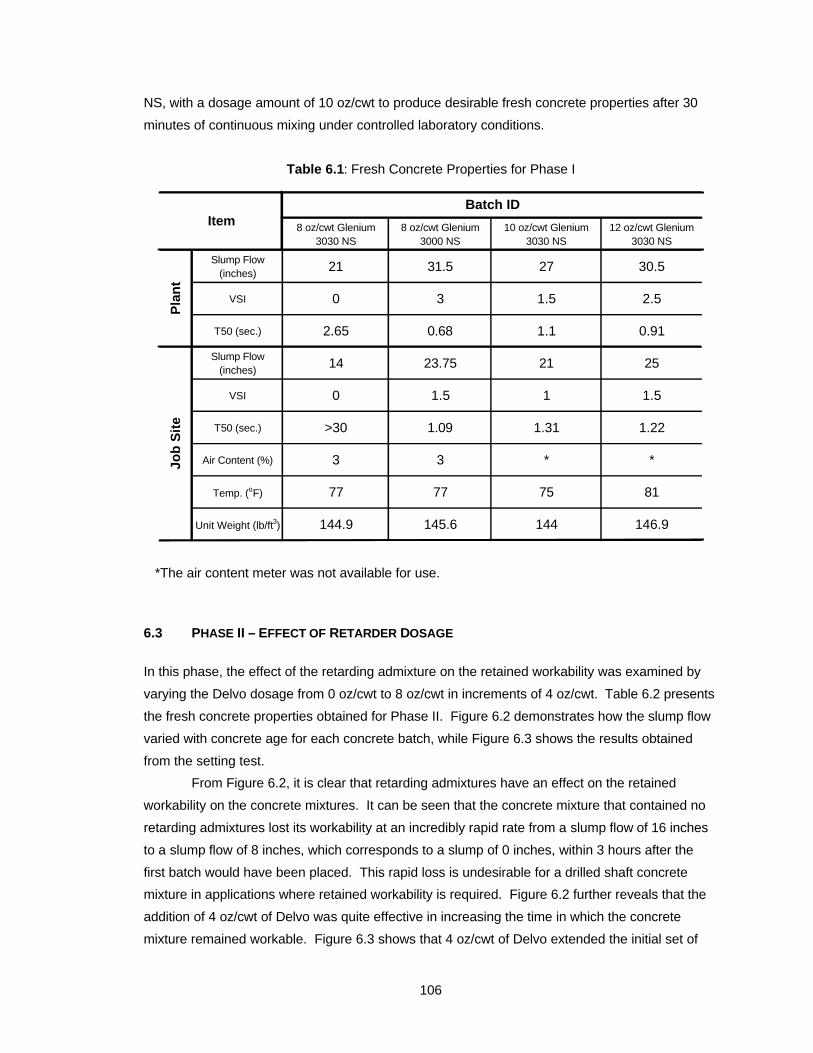
106
NS, with a dosage amount of 10 oz/cwt to produce desirable fresh concrete properties after 30
minutes of continuous mixing under controlled laboratory conditions.
Table 6.1: Fresh Concrete Properties for Phase I
8 oz/cwt Glenium 3030 NS
8 oz/cwt Glenium 3000 NS
10 oz/cwt Glenium 3030 NS
12 oz/cwt Glenium 3030 NS
Slump Flow (inches) 21 31.5 27 30.5
VSI 0 3 1.5 2.5
T50 (sec.) 2.65 0.68 1.1 0.91
Slump Flow (inches) 14 23.75 21 25
VSI 0 1.5 1 1.5
T50 (sec.) >30 1.09 1.31 1.22
Air Content (%) 3 3 * *
Temp. (oF) 77 77 75 81
Unit Weight (lb/ft3) 144.9 145.6 144 146.9
Pla
nt
Job
Sit
e
Batch IDItem
*The air content meter was not available for use.
6.3 PHASE II – EFFECT OF RETARDER DOSAGE
In this phase, the effect of the retarding admixture on the retained workability was examined by
varying the Delvo dosage from 0 oz/cwt to 8 oz/cwt in increments of 4 oz/cwt. Table 6.2 presents
the fresh concrete properties obtained for Phase II. Figure 6.2 demonstrates how the slump flow
varied with concrete age for each concrete batch, while Figure 6.3 shows the results obtained
from the setting test.
From Figure 6.2, it is clear that retarding admixtures have an effect on the retained
workability on the concrete mixtures. It can be seen that the concrete mixture that contained no
retarding admixtures lost its workability at an incredibly rapid rate from a slump flow of 16 inches
to a slump flow of 8 inches, which corresponds to a slump of 0 inches, within 3 hours after the
first batch would have been placed. This rapid loss is undesirable for a drilled shaft concrete
mixture in applications where retained workability is required. Figure 6.2 further reveals that the
addition of 4 oz/cwt of Delvo was quite effective in increasing the time in which the concrete
mixture remained workable. Figure 6.3 shows that 4 oz/cwt of Delvo extended the initial set of

107
the concrete mixture from 364 minutes to 552 minutes (~ 3 hours). This corresponded to a slump
increase from 0 inches after 3 hours to 5 inches (slump flow ˜ 9.5 in.) after 4 ¾ hours.
Figure 6.1: Slump Flow vs. Concrete Age for Phase I
By looking at Figure 6.3, the increase of Delvo dosage from 4 oz/cwt to 8 oz/cwt extended the
initial set time from 552 minutes to 783 minutes (3 hours and 50 minutes). This increase in initial
set corresponded to an increase of slump from 5 inches (slump flow ˜ 9.5 in.) to 7 inches (slump
flow ˜ 11 in.) at approximately the same concrete age. Although the retained workability was
increased, the change was less compared to the change from 0 oz/cwt to 4 oz/cwt or from 0
oz/cwt to 8 oz/cwt of Delvo.
It must be emphasized that the retained workability of concrete is not only a function of
the extended initial set, but it is also a function of other factors such as temperature effects, long-
term effectiveness of the HRWRA, and the effect of different supplementary cementitious
materials on the hydration rate. Therefore, the dosage of retarding admixture should be sufficient
to compensate for these effects and provide the extended initial necessary for the duration of the
pour so that retained workability and shaft completion can be achieved. This phase has shown
that the use of retarding admixtures can be very effective in extending the time in which the
concrete mixture will remain workable.
0
6
12
18
24
30
36
10 15 20 25 30 35 40
Concrete Age (minutes)
Slu
mp
Flow
(inc
hes)
8 oz/cwt Glenium 3030 NS
8 oz/cwt Glenium 3000 NS
10 oz/cwt Glenium 3030 NS
12 oz/cwt Glenium 3030 NS
Proposed Quality Control Limits

108
Table 6.2: Fresh Concrete Properties for Phase II
0 oz/cwt Delvo 4 oz/cwt Delvo 8 oz/cwt Delvo
Slump Flow (inches) 25 28 29
VSI 1 2 2
T50 (sec.) 1.59 0.53 0.68
Slump Flow (inches) 16 17.5 19
VSI 0 1 1
T50 (sec.) >30 >30 >30
Air Content (%) 2.7 2.8 2.8
Temp. (oF) 71 72 71
Unit Weight
(lb/ft3)144 144.6 144
Batch ID
Pla
nt
Job
Sit
e
Item
Figure 6.2: Slump Flow vs. Concrete Age for Phase II
0
6
12
18
24
30
0 60 120 180 240 300 360Concrete Age (minutes)
Slu
mp F
low
(inch
es)
p
0 oz/cwt Delvo
4 oz/cwt Delvo
8 oz/cwt Delvo
Proposed Quality Control Limits

109
0
1,000
2,000
3,000
4,000
5,000
6,000
200 300 400 500 600 700 800 900 1000
Concrete Age (minutes)
Pen
etra
tion
Res
ista
nce
(psi
) 0 oz/cw t Delvo 4 oz/cw t Delvo 8 oz/cw t Delvo
INITIAL SET
FINAL SET
Figure 6.3: Penetration Resistance vs. Concrete Age for Phase II
6.4 PHASE III - APPROPRIATE SCC MIXING PROCEDURE
In order to determine an appropriate SCC mixing procedure to be used throughout this research
project, two different mixing procedures were compared in this phase. Table 6.3 presents the
fresh concrete properties, while Figure 6.4 illustrates how the slump flow varied with concrete age
for Phase III. It can be seen from these results that addition of the HRWRA before (mixing
process 1) or after (mixing process 2) the addition of cementitious materials had no significant
affect on the short or long term concrete workability. Based on these results, it was determined
that mixing procedure 2 was the appropriate mixing procedure to be used throughout the
laboratory portion of this research project. This decision was based on several factors that
included the following:
• The determination of the water slump was relatively easy and quick to perform under
laboratory conditions.
• By obtaining a water slump any excess free water due to inaccurate moisture corrections
could be avoided.
• The water slump was an indicator of the concrete mixture’s consistency due to the mixing
water alone. Later observations found that the stability of the SCC mixtures were

110
sensitive to free water. Due to this fact, the water slump assisted in determining the
appropriate mixture proportions to be used for several SCC mixtures.
Table 6.3: Fresh Concrete Properties for Phase III
Mixing Process 1 Mixing Process 2
Wet Slump (inches) NA 4 3/4
Slump Flow (inches) 27 26
VSI 1.5 1.5
T50 (sec.) 1.23 1.44
Slump Flow (inches) 16 16.5
VSI 0 0.5
T50 (sec.) >30 >30
Air Content (%) 3.3 3.4
Temp. (oF) 73 79
Unit Weight
(lb/ft3)145.2 144.5
Item
Pla
nt
Job
Sit
e
Batch ID
6.5 PHASE IV - SELECTION OF SCC PROPERTIES
6.5.1 Fresh Concrete Properties and Workability
The fresh concrete properties for both the ordinary drilled shaft concrete (ODSC) and SCC
mixtures are presented in Tables 6.4 and 6.5. The data in Table 6.4 indicates that the ODSC
mixtures were found to be within the specified range of slump values at placement in addition to
demonstrating typical workability characteristics for wet-hole construction. As seen in Tables 6.4
and 6.5 the SCC mixtures typically contained more entrapped air than the ODSC mixtures. It is
hypothesized that the HRWR admixture Glenium 3030 NS increased the entrapped air compared
to the MRWR admixture PolyHeed N. Table 6.5 shows that no SCC mixtures possessed
appropriate workability characteristics at the batch plant location. The SCC mixtures exhibited
signs of segregation by evidence of the VSI rating at higher slump flow values. However, after 50
minutes of continuous mixing the SCC mixtures were found to be within the specified quality
control limits set forth in this research. The results further indicate that the stability of the SCC
mixtures tends to increase as the water slump was reduced, as indicated by the differences
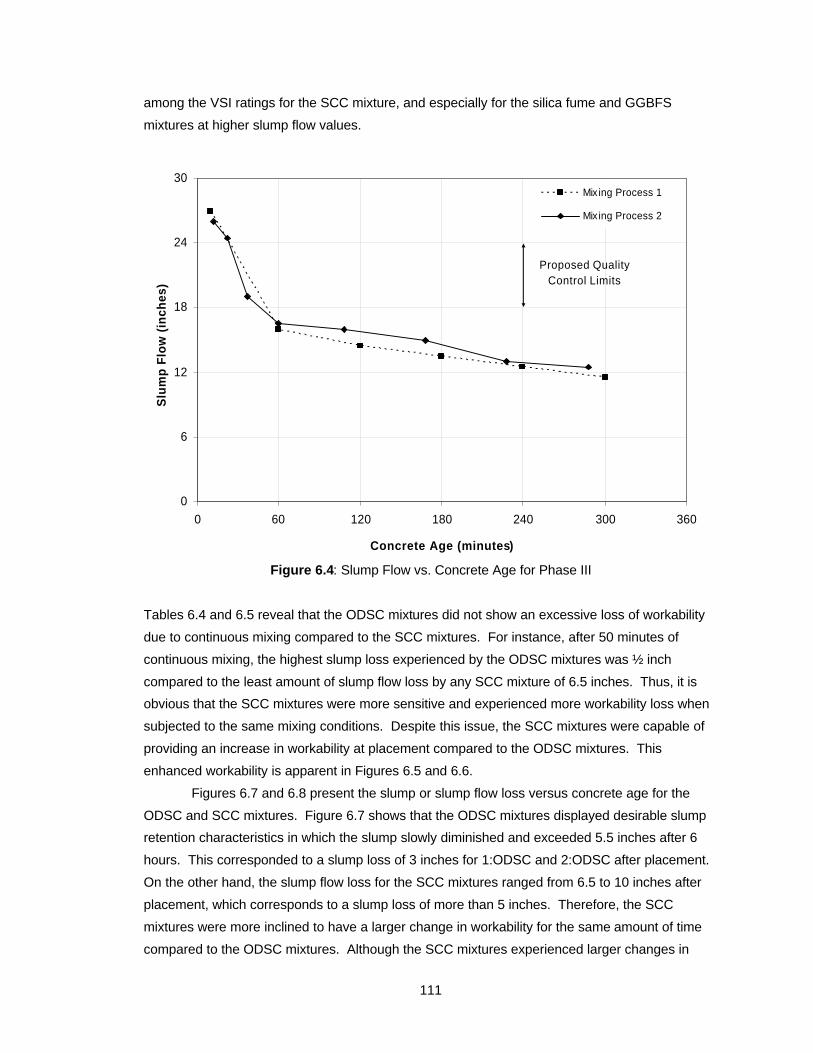
111
among the VSI ratings for the SCC mixture, and especially for the silica fume and GGBFS
mixtures at higher slump flow values.
0
6
12
18
24
30
0 60 120 180 240 300 360
Concrete Age (minutes)
Slu
mp
Flo
w (
inch
es)
Mixing Process 1
Mix ing Process 2
Proposed Quality Control Limits
Figure 6.4: Slump Flow vs. Concrete Age for Phase III
Tables 6.4 and 6.5 reveal that the ODSC mixtures did not show an excessive loss of workability
due to continuous mixing compared to the SCC mixtures. For instance, after 50 minutes of
continuous mixing, the highest slump loss experienced by the ODSC mixtures was ½ inch
compared to the least amount of slump flow loss by any SCC mixture of 6.5 inches. Thus, it is
obvious that the SCC mixtures were more sensitive and experienced more workability loss when
subjected to the same mixing conditions. Despite this issue, the SCC mixtures were capable of
providing an increase in workability at placement compared to the ODSC mixtures. This
enhanced workability is apparent in Figures 6.5 and 6.6.
Figures 6.7 and 6.8 present the slump or slump flow loss versus concrete age for the
ODSC and SCC mixtures. Figure 6.7 shows that the ODSC mixtures displayed desirable slump
retention characteristics in which the slump slowly diminished and exceeded 5.5 inches after 6
hours. This corresponded to a slump loss of 3 inches for 1:ODSC and 2:ODSC after placement.
On the other hand, the slump flow loss for the SCC mixtures ranged from 6.5 to 10 inches after
placement, which corresponds to a slump loss of more than 5 inches. Therefore, the SCC
mixtures were more inclined to have a larger change in workability for the same amount of time
compared to the ODSC mixtures. Although the SCC mixtures experienced larger changes in

112
workability, the workability of the SCC mixtures was generally similar or higher than those of the
ODSC mixtures after 5.5 to 6.5 hours as shown in Figure 6.9. It can be concluded from Figures
6.7 through 6.9 that at a concrete age of 5.5 to 6.5 hours both the ODSC and SCC mixtures
would have complied with the recommendation provided by O’Neill and Reese (1999) that states
that the drilled shaft concrete should have at least 4 inches of slump after 4 hours, but neither
mixture would have met the recommendation provided by Brown (2004) that suggests that the
drilled shaft concrete mixture should not experience a slump loss of no more than 2 inches for the
duration of the pour. This is considering the fact that the duration of the pour was over 6 hours.
Table 6.4: Fresh Concrete Properties for ODSC Mixtures
1:ODSC 2:ODSC
Slump (inches) 8.5 8.75
Air Content (%) 2.4 2
Temp. (oF) 73 73
Unit Weight
(lb/ft3)146.7 146.5
Item
Pla
nt
Job
Sit
e
ODSC Mixtures
Slump (inches) 9 9

113
Table 6.5: Fresh Concrete Properties for SCC Mixtures
3:41-48-FA 4:41-44-FA 5:41-40-FA 6:36-40-FA 7:36-40-SG 8:36-40-SF 9:36-44-FA
Slump Flow
(inches)29 30 30 30 27.5 26 28
VSI 2.5 3 3 2 2 1.5 2
T50 (sec.)
0.97 1.41 1.13 1.31 1.59 1.25 1.60
Wet Slump
(inches)4 5 6 1.5 3/4 3/4 1.0
Slump Flow
(inches)16.5 19.0 18.0 20.5 19.0 19.5 20.0
VSI 1.0 1.0 1.0 0.5 0.5 0.5 0.5
T50 (sec.)
>30 >30 >30 2.31 >30 >30 2.47
Air Content
(%)3.8 3.5 4.2 3.5 4.5 5.1 3.8
Temp. (oF)
73 71 74 77 77 79 76
Unit Weight (lb/ft3)
143.6 144.4 144.6 146.8 146 143.7 145.3
Pla
nt
Job
Sit
e
ItemSelf-Consolidating Concrete Mixtures

114
Figure 6.5: Workability of ODSC Mixture (approximately 8.25 inches)
Figure 6.6: Workability of SCC Mixture (approximately 20 inch slump flow)

115
1
3
5
7
9
11
0 60 120 180 240 300 360
Concrete Age (minutes)
Slu
mp (i
nch
es)
k
1:ODSC
2:ODSC
SCDOT Quality Control Limits
Figure 6.7: Slump vs. Concrete Age
The data on Figure 6.8 indicate that the SCC mixtures that incorporated 4 oz/cwt of the mid-range
water reducing admixture PolyHeed 1025 seem to maintain their workability better than those that
contained only the Glenium 3030 NS. The SCC mixture 6:36-40-FA seems to be an outlier
among this trend. Two primary factors are thought to have contributed to this outcome. Firstly, it
is believed that the decrease in set time for 6:36-40-FA mixture seen in Figure 6.10 may have
increased the rate of slump flow loss. Moreover, after the mixing for the 6:36-40-FA mixture was
complete, it was found that slump flow of the 6:36-40-FA mixture was very low. The mixture was
re-dosed with 3 oz/cwt of Glenium 3030 NS to achieve a slump flow 20.5 inches, and as reported
in Section 2.3.2 the workability regained from the re-dosage by HRWRA may decrease at a faster
rate.

116
0
6
12
18
24
30
0 60 120 180 240 300 360 420
Concrete Age (minutes)
Slu
mp
Flo
w (
inch
es)
3:41-48-FA 4:41-44-FA 5:41-40-FA 6:36-40-FA
7:36-40-SG 8:36-40-SF 9:36-44-FA
Proposed Quality Control Limits
Figure 6.8: Slump Flow vs. Concrete Age
0
1
2
3
4
5
6
7
8
9
300 310 320 330 340 350 360 370 380
Concrete Age (minutes)
Slu
mp
(in
ches
)
1:ODSC
2:ODSC
3:41-48-FA
4:41-44-FA
5:41-40-FA
6:36-40-FA
7:36-40-SG
8:36-40-FA
9:36-44-FA
Figure 6.9: Slump vs. Concrete Age for all Concrete Mixtures

117
0
500
1000
1500
2000
2500
3000
3500
4000
4500
600 700 800 900 1000 1100 1200 1300 1400 1500 1600 1700 1800 1900 2000 2100
Concrete Age (minutes)
Pen
etra
tio
n R
esis
tan
ce (
psi
)
1:ODSC 2:ODSC 3:41-48-FA 4:41-44-FA 5:41-40-FA 6:36-40-FA
7:36-40-SG 8:36-40-SF 9:36-44-FA
Initial Set
Final Set
Figure 6.10: Penetration Resistance vs. Concrete Age
6.5.2 Segregation and Bleeding Results
The results from the segregation column and bleeding tests are summarized in Table 6.6. The
data on Tables 6.5 and 6.6 indicate that the SCC mixtures were placed into the column mold at
the lower end of the proposed quality control limits and at a VSI rating of 1 or less. Under such
conditions the SCC mixtures were stable and exhibited minimal segregation. However, the
observed behavior of the SCC mixtures suggests that at higher values of slump flows and VSI
ratings above 1 that the SCC mixtures would demonstrate a higher degree of segregation. For
example, Table 6.5 shows that the fly ash (FA) SCC mixtures tested at the batch plant showed
signs of segregation at higher slump flow values. This segregation was evident by a thick mortar
layer on the surface of the tested concrete in the mixing drum as well as clear evidence of
segregation in the flow patty. Thus, it is reasonable to believe that if segregation column tests
were performed under these conditions, the coarse aggregate concentration in the bottom
sections would be higher, and the values of the segregation index would be increased.
Regarding the bleeding test, the ODSC mixtures demonstrated a higher degree of
bleeding compared to the SCC mixtures prepared at the same water-to-cementitious materials

118
ratio. It is thought that this higher degree of bleeding could possibly be due to the fact that the
initial set for the ODSC mixtures was extended at least 9 hours compared to the SCC mixtures as
shown in Figure 6.10. This allowed a much longer time frame in which the ODSC mixtures could
bleed. Furthermore, the SCC mixtures typically contained a higher percentage of entrapped air,
which is very effective in reducing bleeding. Lastly, the incorporation of the VMA for the SCC
mixtures may have assisted in the reduction of bleed water. However, it should be noted that the
influence of the new polyethylene glycol based VMAs on bleeding is not well known. Further
evaluation of Table 6.6 reveals that the SCC mixtures prepared at a water-to-cementitious
materials ratio of 0.36 limited the amount of bleeding.
Table 6.6: Segregation and Bleeding Results
MixtureSlump or
Slump Flow (inches)
Segregation Index (%) Bleeding (%)
1:ODSC 8.50 * 2.05
2:ODSC 8.75 * 2.343:41-48-FA 16.5 0.0379 0.334:41-44-FA 19 0.51 0.545:41-40-FA 18 0.41 0.776:36-40-FA 20.5 0.53 0**
7:36-40-SG 19 0.15 0**
8:36-40-SF 19.5 0.56 0**
9:36-44-FA 20 0.54 0**
* Not Conducted for ODSC Mixtures **Bleeding was difficult to measure. Any water present at the surface was not clear and consisted primarily of cementitious materials.
6.5.3 Passing Ability: J-Ring and L-Box
The test results of the J-Ring and those of the L-Box are summarized in Table 6.7. Regarding the
(FA) SCC mixtures, those prepared with sand-to-aggregate ratios of 0.44 and 0.48 exhibited
greater passing ability among closely spaced reinforcement using the J-Ring than those prepared
with a sand-to-aggregate ratio of 0.40. This could be because the (FA) mixtures prepared at a
sand-to-aggregate ratio of 0.40 contained a higher amount of coarse aggregate that increased
the collision and interaction among the solid particles at the vicinity of the reinforcement that
resulted in a greater tendency of blockage. The (SF) and (SG) mixtures prepared with a sand-to-
aggregate ratio of 0.40 demonstrated a passing ability similar to the fly ash (FA) mixtures
prepared with sand-to-aggregate ratios of 0.44 and 0.48. However, no other (SF) and (SG)

119
mixtures were prepared at varying sand-to-aggregate ratio. Therefore, no conclusion can be
drawn in regards to if (SF) and (SG) mixtures prepared at higher sand-to-aggregate ratios would
show greater passing ability at similar slump flows. It can be seen from Table 6.7 that all SCC
mixtures demonstrated very low passing ability using the L-Box apparatus. This is due to the fact
that the maximum size aggregate size of ¾ inch used for this research project was simply too
large for the clear spacing between the reinforcement in the L-Box apparatus. For example, the
clear spacing between the reinforcement for the L-Box as recommended by the PCI (2003) was
1.375 inches, which corresponds to less than 2 times the maximum aggregate size. This spacing
is unrealistic for most drilled shaft applications, but if very congested reinforcement cages exist
the L-Box could be used to ensure high passing ability of the SCC mixture. In case of this
research, the L-Box apparatus was found to be ineffective in determining the passing ability of
SCC mixtures designed for drilled shaft applications. As a result, the blocking ratios determined
from the L-Box should be disregarded for this research.
Table 6.7: Passing Ability Results for SCC Mixtures
L-Box
Diameter (inches) Inverted
T50 (sec) Inverted
VSI
J-Ring Flow
(inches) Inverted
Ratio of J-Ring Flow to Slump Flow
Passing Ability Rating
h2/h1
3:41-48-FA 20 1.28 1 17.5 0.88 2 0.27
4:41-44-FA 20.5 2.13 1 18 0.88 2 0.3
5:41-40-FA 20 1.91 1 16 0.8 2 0.078
6:36-40-FA 20 3.9 0.5 16 0.8 2 0.059
7:36-40-SG 20.5 5.03 1 18 0.88 2 0
8:36-40-SF 22 1.69 0.5 20.5 0.93 1 0.087
9:36-44-FA 20.5 2.25 0.5 18 0.88 2 0.036
Slump Flow J-Ring
6.5.4 Compressive Strength
The results for the compressive strength testing for the ordinary drilled shaft concrete (ODSC)
and SCC mixtures are given in Figure 6.11. Regarding the (FA) SCC mixtures, Figure 6.11
indicates that regardless of the water-to-cementitious materials ratio, it appears that the sand-to-
aggregate ratio did not influence the strength development. Figure 6.11 further reveals that the
SCC mixtures prepared at a water-to-cementitious materials ratio of 0.41 demonstrated slightly
lower compressive strengths compared to those of the ODSC mixtures. However, the average
difference among the compressive strengths is reduced as the SCC mixtures continue to hydrate.

120
The average difference between the compressive strengths are 15.5%, 12%, 10.5%, 9%, and
6.5% at ages of 3, 7, 14, 28, and 56-day, respectively. It is thought that the slightly lower
compressive strengths can be attributed to the following:
• The SCC mixtures contained 8% higher replacement percentage of cement by fly ash
compared to the ODSC mixtures. Therefore, the amount of early heat evolution is
decreased and in turn reduces the early age strength, but not the long term strength.
• Secondly, Mindess et al. (2003) reports that there is only enough calcium hydroxide in
the paste in which the Class F fly ash can react to form calcium silicates. This would
suggest higher replacement percentages of fly ash may result in unreacted ash causing a
slight reduction in compressive strengths.
Further evaluation of Figure 6.11 shows that the reduction in water-to-cementitious materials ratio
from 0.41 to 0.36 for the (FA) SCC mixtures increased the compressive strength, on average, by
1600 psi at 28-days. This is expected since it is a well known fact that the compressive strength
is increased as the water-to-cementitious materials ratio decreases. Furthermore, the use of the
silica fume or ground granulated blast furnace slag (GGBFS) was found to increase the
compressive strength compared to the (FA) SCC mixtures.
0
1000
2000
3000
4000
5000
6000
7000
8000
9000
10000
11000
12000
0 7 14 21 28 35 42 49 56
Concrete Age (Days)
Com
pres
sive
Str
engt
h (p
si)
1:ODSC 2:ODSC 3:41-48-FA 4:41-44-FA 5:41-40-FA6:36-40-FA 7:36-40-SG 8:36-40-SF 9:36-44-FA
Figure 6.11: Compressive Strength vs. Concrete Age for Phase IV

121
In addition to the continuing pozzolanic reaction between the amorphous silica in the
silica fume and the calcium hydroxide, the high fineness of the silica fume allows the particles to
pack densely between the cement particles and improves the interfacial transition zone. As a
result, the silica fume greatly reduces the void spaces within the cement paste, and the bond of
the cement paste with the aggregate is improved allowing the aggregate to better participate in
stress transfer (Neville 1996). These contributions provided by the silica fume can be capable of
generating higher compressive strength compared to the use of fly ash alone as in the case of
this research.
Unlike fly ash, high replacements of GGBFS, with values ranging from 25-65%, can be utilized
since GGBFS have cementitious properties of their own and only 10-20% of cement is needed for
activation. The hydration of GGBFS produces primarily calcium silicates and produces less
calcium hydroxide than portland cement alone in addition to showing some pozzolanic behavior
(Neville 1996). Neville (1996) reports that progressive release of alkalis by the GGBFS along the
formation calcium hydroxide by portland cement results in a continuing reaction of GGBFS over a
long period of time. Thus, there is a long term strength gain associated with the GGBFS. For
these reasons, high compressive strengths at higher replacement values of portland cement by
GGBFS can be achieved as in the case of this research.
6.5.5 Modulus of Elasticity
The modulus of elasticity was determined for all concrete mixtures in conjunction with the
compressive strength tests. Figure 6.12 presents the results obtained for the ordinary drilled
shaft concrete (ODSC) and SCC mixtures. Generally speaking, the development for the modulus
of elasticity is similar to the strength development provided in Figure 6.11. For example, the SCC
mixtures prepared at a water-to-cementitious materials ratio of 0.41 demonstrated slightly lower
elastic modulus values at early ages compared to those for the ODSC mixtures, and as the SCC
mixtures continue to hydrate the difference among these mixtures are decreased. This should be
expected since the modulus of elasticity is a function of the compressive strength. This
relationship between compressive strength and modulus of elasticity can further be seen by
examining the silica fume and GGBFS mixtures. Figure 6.12 shows that the silica fume and
GGBFS mixtures that exhibited higher compressive strengths also show higher modulus of
elasticity values compared to the fly ash (FA) SCC mixtures at the same water-to-cementitious
materials ratio. Furthermore, it appears from Figure 6.12 that the modulus of elasticity for the fly
ash SCC mixtures was not significantly affected by the varying sand-to-aggregate ratio.
In order to determine if the calculated elastic modulus for the concrete mixtures is of
typical sound concrete; the calculated modulus of elasticity in this research was compared with
the ACI 318 (2002) Building Code ( ccc fWpsiE '33)( 5.1∗= ) and the ACI Committee 363
(2002) “State-of the-Art Report on High-Strength Concrete”

122
( )000,000,1'000,40)( += cfpsiEc models (see Chapter 2). These results are presented in
Figures 6.13 and 6.14. Figure 6.13 reveals that the ACI 318 (2002) overestimated the modulus of
elasticity for both the ODSC and SCC mixtures. Furthermore, the ACI 318 (2002) was found to
increasingly overestimate the modulus of elasticity as the compressive strength increased. This
finding coincides with ACI Committee 363 (2002) that found that the equation used by the ACI
318 (2002) was only valid for compressive strengths up to 6,000 psi. On the other hand, the ACI
Committee 363 (2002) equation provided an improved and typically a conservative estimate for
the modulus of elasticity for both the ODSC and SCC mixtures as shown in Figure 6.14. It is
believed that the improved and conservative estimation for the modulus of elasticity lies in the fact
that the equation provided by the ACI Committee 363 (2002) is valid for compressive strengths
from 3,000 to 12,000 psi.
2
3
4
5
6
0 7 14 21 28 35 42 49 56Concrete Age (Days)
Mo
du
lus
of
Ela
stic
ity (
1.0
x 10
6 psi
)
1:ODSC 2:ODSC 3:41-48-FA 4:41-44-FA 5:41-40-FA
6:36-40-FA 7:36-40-SG 8:36-40-SF 9:36-44-FA
Figure 6.12: Modulus of Elasticity vs. Concrete Age for Phase IV

123
0
1
2
3
4
5
6
0 1 2 3 4 5 6Measured Elastic Modulus (1.0 X 10⁶ psi)
Pre
dict
ed E
last
ic M
odul
us (1
.0 X
10
6 p
si)
1:ODSC
2:ODSC
3:41-48-FA
4:41-44-FA
5:41-40-FA
6:36-40-FA
7:36-40-SG
8:36-40-SF
9:36-44-FA
Line of Equality
-10%Error
+10% Error
Figure 6.13: Predicted vs. Measured Elastic Modulus according to ACI 318 (2002)
(Equation for Phase IV)
0
1
2
3
4
5
6
0 1 2 3 4 5 6
Measured Elastic Modulus (1.0 X 10⁶ psi)
Pre
dict
ed E
last
ic M
odul
us (1
.0 X
10
6 psi
)
1:ODSC
2:ODSC
3:41-48-FA
4:41-44-FA
5:41-40-FA
6:36-40-FA
7:36-40-SG
8:36-40-SF
9:36-44-FA
Line of Equality
+10% Error
-10%Error
Figure 6.14: Predicted vs. Measured Elastic Modulus According to ACI 363(2002)
(Equation for Phase IV)

124
6.5.6 Drying Shrinkage
The drying shrinkage results for the ordinary drilled shaft concrete (ODSC) and SCC mixtures are
presented in Figure 6.15. The data on Figure 6.15 indicate that the water-to-cementitious
materials ratio appears to be the main factor influencing the amount of drying shrinkage. The
results show that the reduction in water-to-cementitious materials ratio from 0.41 to 0.36
decreased the specimen’s tendency to shrink. This trend should be expected since the drying
shrinkage is known to reduce as the water-to-cementitious materials ratio is decreased.
However, it appears that the mixture prepared with ground granulated blast furnace slag (SG
mixture) produced slightly higher drying shrinkage values compared to the other mixtures
prepared at a water-to-cementitious materials ratio of 0.36.
Figure 6.15: Drying Shrinkage vs. Concrete Age
Among the SCC mixtures prepared at a water-to-cementitious materials ratio of 0.41, the results
indicate the SCC mixture prepared at sand-to-aggregate ratio of 0.48 shows evidence of higher
drying shrinkage than those prepared at 0.40 and 0.44 as well as the highest drying shrinkage
overall. However, the difference in drying shrinkage values among these SCC mixtures is
actually quite minimal and operator or equipment error could very easily alter this outcome. This
data suggest that the SCC mixtures prepared at a water-to-cementitious materials ratio of 0.41
0
100
200
300
400
500
600
0 7 14 21 28 35 42 49 56 63 70 77 84 91
Concrete Age (Days)
Dry
ing S
hrin
kage
(miro
stra
in)
t
1:ODSC 2:ODSC 3:41-48-FA 4:41-44-FA 5:41-40-FA
6:36-40-FA 7:36-40-SG 8:36-40-SF 9:36-44-FA

125
exhibited drying shrinkage values similar to the ODSC mixtures. This outcome is reasonable
given the fact that the paste volume fraction and aggregate volume fraction did not significantly
vary compared to the SCC mixtures. Furthermore, Figure 6.15 indicates that the two ODSC
mixtures showed practically the same drying shrinkage characteristics throughout the test. This
indicates that use of the #789 coarse aggregate gradation for 1: ODSC had no significant effect
on the drying shrinkage values.
Unfortunately, no absolute conclusion can be made at this time concerning the effect of
the sand-to-aggregate ratio on the drying shrinkage, due to the lack of drying shrinkage data for
9:36:44-FA. It must be noted that this research will be updated as soon as additional test results
are available.
6.5.7 Permeability
Results of the rapid chloride permeability tests (RCPT) for the ordinary drilled shaft concrete
(ODSC) and SCC mixtures are given in Figures 6.16 and 6.17. The RCPT values at 91-days for
the ordinary drilled shaft concrete mixtures were 4530 and 4562 as compared to 2584, 2773, and
3067 for the SCC mixtures at the same water-to-cementitious materials ratio. This reduction in
RCPT values for the SCC mixtures can be attributed to the fact the SCC mixtures contained a
higher replacement percentage of fly ash (FA). For example, the SCC mixtures with a water-to-
cementitious materials ratio of 0.41 consisted of 33% replacement of cement by fly ash, where as
the ODSC mixtures only contained 25% replacement of cement by fly ash. Since fly ash is
notably more spherical than cement, the additional replacement of fly ash may have allowed the
particles to pack more tightly within the pore spaces creating a denser microstructure.
Figures 6.16 and 6.17 indicate that the RCPT values were found to decrease from 91 to
365-days. As the hydration process proceeds, the interconnected pores that were present at 91-
days are being filled by the continuous formation of C-S-H and the continuous growth of the
calcium hydroxide within the capillaries pores. As a result, the porosity of the paste will decrease
with time lowering the RCPT values. It is also important to notice that the trends from Figure 6.16
are also present in Figure 6.17. At 365-days the ODSC mixtures still exhibited higher RCPT
values compared to the SCC mixtures at the same water-to-cementitious materials ratio.
As discussed in Section 2.4.4, the coefficient of permeability decreases as the water-to-
cementitious materials ratio is reduced. The reduction in RCPT values for the fly ash (FA) SCC
mixtures (particularly 3:41-48-FA, 6:36-40-FA, and 9:36-44-FA) due to the decrease in water-to-
cementitious materials ratio is evident on Figure 6.16. The reduction in water-to-cementitious
materials ratio from 0.41 to 0.36 decreased the RCPT values, on average, 1500 coulombs at the
same concrete age.
It is also important to emphasize the effect of the supplementary cementitious material on
the RCPT values at a water-to-cementitious materials ratio of 0.36. Figure 6.16 indicates that the
introduction of silica fume considerably reduced the RCPT values compared to the (FA) mixtures.
This reduction in RCPT values comes from the ability of the silica fume to pack tightly between

126
pore spaces creating a very dense microstructure. However, the introduction of ground
granulated blast furnace slag (GGBFS) increased the RCPT values compared to the fly ash (FA)
SCC mixtures. The increase in RCPT values for the (SG) mixture may stem from the angular
shape of the GGBFS compared to the spherical nature of the fly ash. Due to this fact, the
particles may have not been able to pack as closely causing an increase in the interconnected
capillary pores.
0
200
400
600
800
1000
1200
1400
1:ODSC
2:ODSC
3:41-4
8-FA
4:41-4
4-FA
5:41-4
0-FA
Co
ulo
mb
s
Figure 6.16: 91-Day Permeability Results
6.5.8 Comparison between Laboratory and Field Conditions
A small-scale field study was conducted at APAC Ready Mix Concrete in Marion, South Carolina.
The primary objectives of this field study were three fold:
1. To ensure that the chemical admixture dosages determined for laboratory conditions
remain sufficient for field conditions.
2. To evaluate the effect of mixing imposed by a ready mix truck on the slump flow after 50
minutes of continuous mixing.
3. To compare the compressive strength and modulus of elasticity values obtained from the
field specimens to that of the laboratory specimens.
The two SCC mixtures selected for this field study were 3:41-48-FA and 6:36-40-FA. The SCC
mixtures were selected based upon the fact that at the time of this field study these mixtures were
considered to be the most likely utilized for the full-scale field project. The only modification to
these mixtures was that an additional 2 oz/cwt of Delvo was added to account for the effect of hot

127
weather conditions on slump retention and time of setting. No ODSC mixtures were selected to
be tested for this field study considering the fact that the ODSC mixtures used for laboratory
purposes have been routinely accepted in South Carolina. The raw materials and chemical
admixtures used for this small-scale field study were provided by the same suppliers as those
from the laboratory materials.
0
500
1000
1500
2000
2500
3000
3500
4000
4500
5000
1:ODSC
2:ODSC
3:41-4
8-FA
4:41-4
4-FA
5:41-4
0-FA
6:36-4
0-FA
7:36-4
0-SG
8:36-4
0-SF
9:36-4
4-FA
Co
ulo
mb
s
Figure 6.17: 365-Day Permeability Results
Batching and Mixing: Each SCC mixture consisted of two cubic yards of concrete that was
batched and mixed according to normal operations of the plant with the exception of the chemical
admixtures. Figures 6.18 through 6.21 contain pictures of how the raw materials were obtained
and batched at this ready mix concrete plant. The chemical admixtures were added to the SCC
mixtures after the ready mix truck exited the material hopper and wash down was performed.
This was done for two primary reasons. Firstly, the chemical admixtures needed for the SCC
mixtures were not available for automated dispensing since they were not used in everyday
operation. Secondly, the chemical admixtures were added after the wash down process was
performed in order to obtain a water slump. Generally, 3 to 5 gallons of water is typically used for
the wash down process. This extra water must be taken into account in the batching process
since the stability of the SCC mixtures was found to be sensitive to excessive free water. The

128
researcher requested that the plant operator withhold 5 gallons of batching water to account for
the wash down process.
Figure 6.18: Attaining Raw Materials from Stock Piles
Figure 6.19: Unloading Raw Materials onto Conveyer Belt

129
Figure 6.20: Raw Materials being Delivered to Hopper via Conveyer Belt
Figure 6.21: Raw Materials being Mixed by Ready Mix Truck
A water slump was taken after the batching and wash down process was completed. It was
found that obtaining a water slump under field conditions required a significant increase in time
compared to laboratory conditions. Under laboratory conditions the water slump could be
obtained no more than 5 minutes after water-to-cementitious materials contact; however, under
field conditions obtaining the water slump required no less than 30 minutes after water-to-

130
cementitious materials contact. This was primarily due to the time required to perform the wash
down process and obtaining a concrete sample for testing. Unlike laboratory conditions where
the concrete sample is very accessible and easy to obtain from the mixer, obtaining the concrete
sample from the ready mix truck required more equipment, people, time, and attentiveness to
detail due to safety precautions. Alternatives to this approach could be employed in order to
reduce the time in which the accuracy of the moisture corrections can be determined. The
following procedure could be utilized to accomplish this goal:
1. The use of wash down water could be prohibited in cases where SCC mixtures are used
in order to control unwanted water. By implementing this suggestion no water will have
to be withheld to account for the wash down process, and the time required to check the
accuracy of the moisture corrections can be reduced.
2. It may be possible to check the accuracy of the moisture corrections without having to
obtain a concrete sample. This can be accomplished by rotating the concrete mixture
toward the concrete chute and make a water slump estimate based on the observation of
the wetness or dryness of the concrete mixture. Most experienced quality control
individuals can provide a reasonable estimate of the water slump, typically within +/- 1
inch of the actual water slump.
Fresh Concrete Properties: The fresh concrete properties for the field study are presented in
Table 6.8 and Figure 6.22. The fresh concrete properties for the plant location were very similar
to those of the laboratory, suggesting that the batch sizes utilized for laboratory evaluation were
sufficient to simulate the performance of the chemical admixtures in large batches. However, the
slump flow characteristics for the job site location between the laboratory and field conditions
produced very different results. It must be noted that in Figure 6.22 the mixing time represents
the time of mixing after the first slump flow was taken. This was necessary due to the substantial
difference in times for obtaining the water slump. The data in Table 6.8 and Figure 6.22 indicate
that the slump flow loss due to continuous mixing was much less under field conditions compared
to the laboratory. The primary reason for this outcome is likely due to the rotational speed of the
mixing drum for the ready mix truck compared to laboratory mixer. The laboratory mixer was
rotated at a higher speed, providing heavy agitation of the concrete mixture. Where as, the
mixing drum for the ready mix truck was set to 4-5 rotations per minute. The larger batch size
used for the field study may have also contributed to lower slump loss for the field study.
After 50 minutes of continuous mixing, the slump flow was found to be outside the
proposed quality control limits. The SCC mixtures were allowed to rotate at an increased
rotational speed for a short duration until the slump flow was found to be within the proposed
quality control limits. The slump flow at which cylindrical specimens were made for the hardened
concrete properties was 20 inches for 3:41-48-FA and 21 inches for 6:36-40-FA.

131
Table 6.8: Fresh Concrete Properties for both Laboratory and Field Conditions
3:41-48-FA (Lab) 3:41-48-FA (Field) 6:36-40-FA (Lab) 6:36-40-FA (Field)
Slump Flow (inches) 29 30 30 28
VSI 2.5 2.5 2 2.5
T50 (sec.) 0.93 1.53 1.31 2.53
Wet Slump (inches) 4 ˜ 3 1.5 ˜ 1
Slump Flow (inches) 16.5 27.5 20.5 26
VSI 1 1.5 0.5 1.5
T50 (sec.) >30 1.62 2.31 3.5
Air Content (%) 3.8 3.1 3.46 3.1
Temp. (oF) 73 96 75 100
Job
Sit
e
Item
Self-Consolidating Concrete Mixture
Pla
nt
0
5
10
15
20
25
30
0 5 10 15 20 25 30 35 40 45 50
Mixing Time (minutes)
Slu
mp
Flow
(in
ches
)
3:41-48-FA (Lab) 3:41-48-FA (Field) 6:36-40-FA (Lab) 6:36-40-FA (Field)
Figure 6.22: Slump Flow vs. Mixing Time under Laboratory and Field Conditions

132
The concrete temperatures in the field were higher than those for the laboratory, as indicated in
Table 6.8. Prolonged exposure to high temperatures can be detrimental to the slump retention
and can significantly decrease setting times. In order to monitor the temperatures for the
concrete samples for the slump retention and setting test, an I-Button was placed beside the
samples until testing was complete. The temperature profile attained from the I-Button is
presented in Figure 6.23. The times specified on Figure 6.23 are of those in which the first SCC
mixture was made until the last setting test was complete. The SCC mixture 3:41-48-FA was
batched on 7/27/04 at 10:45 AM and 6:36-40-FA on 7/27/04 at 2:35 PM. Figure 6.23 further
reveals that the concrete samples were exposed to temperatures ranging from 76 to 113 degrees oF. The corresponding setting test results for the field specimens are presented in Figure 6.24.
From this figure it can be determined that the SCC mixture 3:41-48-FA under field conditions
experienced much faster setting times as compared to the laboratory conditions. The SCC
mixture 6:36-40-FA demonstrated similar set times under field conditions compared to laboratory
conditions. The faster set time for 3:41-48-FA may be due to longer exposure to high
temperatures compared to 6:36-40-FA that experienced high temperatures for a short duration
followed by a sharp decrease in temperature.
70
80
90
100
110
120
12:00 AM 12:00 AM 12:00 AM 12:00 AM 12:00 AM 12:00 AM 12:00 AM 12:00 AM 12:00 AM
Tem
per
atu
re (
oF
)
7/27/04 10:18AM
7/27/0412:42 PM
7/27/043:06 PM
7/27/045:30 PM
7/27/047:30 PM
7/27/049:54 PM
7/28/0412:18 AM
7/28/042:42 AM
Figure 6.23: Temperature Profile Obtained from I-Button

133
0
500
1000
1500
2000
2500
3000
3500
4000
4500
0 200 400 600 800 1000 1200
Concrete Age (minutes)
Pen
etra
tio
n R
esis
tan
ce (
psi
)
3:41-48-FA Lab 3:41-48-FA Field 6:36-40-FA Lab 6:36-40-FA Field
Initial Set
Final Set
Figure 6.24: Penetration Resistance vs. Concrete Age under Laboratory and Field Conditions
The slump retention for 3:41-48-FA was also affected by the high temperatures and faster set
times. The slump flow retention for 3:41-48-FA was determined to be 8 inches after four hours,
which corresponded to a slump of approximately 3 ½ inches. This slump was found to be much
less than the laboratory specimen at approximately the same concrete age. On the other hand,
the slump flow for 6:36-40-FA was determined to be 10 inches after 4 hours, which corresponded
to a slump of 6 inches. This slump flow was found to be slightly less than under laboratory
conditions even with similar set times. These results would suggest that even with similar set
times the rate of slump loss is increased when exposed to high temperatures. These results
further indicate the need for testing to determine the amount of additional retarder needed to
account for high temperatures to ensure that proper retained workability and set times are
achieved.
Hardened Concrete Properties: The results for the compressive strength and modulus of
elasticity for both SCC mixtures are given in Figures 6.25 and 6.26. The data collected from the
compressive strength and modulus of elasticity allowed for a comparison between field and
laboratory conditions. It was found that the field specimens exhibited slightly higher compressive
strengths compared to the laboratory specimens. It is thought that the higher compressive
strengths are due to possibly withholding extra water for the wash down process, which may have
caused a reduction in water-to-cementitious materials ratio. Nevertheless, the compressive
strength and modulus of elasticity values obtained from the field specimens corresponded well to
those obtained from the laboratory.

134
0
2000
4000
6000
8000
10000
12000
0 7 14 21 28 35 42 49 56
Concrete Age (Days)
Co
mp
ress
ive
Str
eng
th (
psi
)
3:41-48-FA (Lab) 3:41-48-FA (Field) 6:36-40-FA (Lab) 6:36-40-FA (Field)
Figure 6.25: Compressive Strength vs. Concrete Age under Laboratory and Field Conditions
0
1
2
3
4
5
6
0 7 14 21 28 35 42 49 56
Concrete Age (Days)
Mo
du
lus
of
Ela
stic
ity
(1.0
x 1
0 6 p
si)
3:41-48-FA (Lab) 3:41-48-FA (Field) 6:36-40-FA (Lab) 6:36-40-FA (Field) Figure 6.26: Modulus of Elasticity vs. Concrete Age under Laboratory and Field Conditions

135
6.6 PHASE V - METHODS TO MODIFY THE VISCOSITY OF SCC MIXTURES
6.6.1 Fresh Concrete Properties
Phase V was formulated to clarify the effects of different methods to modify the viscosity of SCC
mixtures. Among the SCC mixtures prepared with VMA as the method to modify the viscosity,
the results indicate at similar slump flow values the viscosity of the SCC mixtures was not
increased even at high dosage amounts of VMA. However, to some extent the results suggest
that the VMA may provide a slight increase in stability at higher values of slump flow with
increasing VMA dosage. This is according to the VSI ratings provided in Table 6.9 for those
mixtures at higher slump flow values. At lower slump flow values the VMA appeared to have no
profound effect on the stability of the SCC mixtures.
The results for the SCC mixtures prepared with high dosages of fly ash as the method to
modify the viscosity reveal that an increase in fly ash percentage did not correspond to an
increase in viscosity. In fact, the water slump of the SCC mixtures increased as the percentage
of fly ash was increased, which resulted in a higher degree of segregation at the batch plant
locations. This higher degree of segregation is not evident by the VSI ratings provided in Table
6.9 since 3 is the highest VSI rating, but it is an observational behavior made by the researcher.
Neither the stability nor the viscosity of these SCC mixtures seemed to be significantly affected by
the higher percentages of fly ash at lower slump values such as those that represent job site
testing.
The results in Table 6.9 show that the incorporation of the silica fume provided no
increase in viscosity by evidence of the T50 times. However, the utilization of the silica fume was
found to improve the stability of the SCC mixtures as can be seen by the decreased VSI ratings.
It is believed that this stability can be attributed to the reduction of the water slump and absorption
of free water due to the high fineness of the silica fume. Replacement percentages of silica fume
above 8% were found not to provide a considerable increase in stability at similar slump flow
values nor a considerable reduction in water slump. Thus, replacement percentages above 8%
would not be necessary and only result in increased cost. Furthermore, Table 4.5 indicates that
the required dosage of HRWRA was increased as the replacement percentage of silica fume was
increased.
The incorporation of GGBFS provided results similar to the silica fume mixtures. For
example, the GGBFS provided a reduction in the water slump and showed a higher degree of
stability at the batch plant compared to 6:AL-36-33 FA. In addition, the incorporation of the
GGBFS seems to slightly increase the T50 times compared to the silica fume and fly ash mixtures
at similar slump flow values. As with the silica fume mixtures, the required dosage of HRWRA
was increased with the incorporation of the GGBFS.

136
Table 6.9: Fresh Concrete Properties for Phase V (cont. on next page)
1:AL-41-0 VMA 2:AL-41-2 VMA 3:AL-41-10 VMA 4:AL-41-18 VMA 5:AL-36-33 (2) FA 6:AL-36-33 FA 7:AL-36-40 FA 8:AL-36-50 FA
Slump Flow (inches)
29 31 29 29 28 32 33 32
VSI 3 3 2.5 2 2 3 3 3
T50 (sec.) 1.1 0.98 0.85 0.9 0.88 0.76 0.62 1.5
Wet Slump (inches)
7 6 6 6.5 2.25 3.75 4.00 5
Slump Flow (inches)
18.0 23.0 18.0 22.0 17.5 21.0 20.0 21
VSI 0.0 1.0 0.0 1.0 0.0 0.5 0.0 0.5
T50 (sec.) >30 1.52 >30 1.4 >30 1.86 2.10 1.09
Air Content (%)
3 3.2 4 3.4 4.4 3.4 3.0 3.7
Temp. (oF) 72 73 76 72 79 74 74 75
Unit Weight (lb/ft3)
146.8 146.6 146.1 145.3 145.68 145.5 146.4 145
Item
Pla
nt
Job
Sit
e
Self-Consolidating Concrete Mixtures

137
Table 6.9: Fresh Concrete Properties for Phase V (cont. on next page)
9:AL-36-6 SF 10:AL-36-8 SF 11:AL-36-10 SF 12:AL-36-15 SF 13:AL-36-40 SG 14:AL-36-50 SG 14:AL-36-50 SG (LA) 15:AL-36-60 SG
Slump Flow (inches)
29 29.5 29 29 26 29 28 30
VSI 1.5 1.5 1.5 1.5 1.5 2.0 1.5 2
T50 (sec.) 1.16 0.76 0.94 1.16 2.29 1.50 1.56 1.12
Wet Slump (inches)
1 0.25 0.25 0 0 0.25 0.50 0.75
Slump Flow (inches)
22.0 21.5 20.75 22.0 16.0 18.0 21.0 20
VSI 0.0 0.0 0.5 0.5 0.0 1.0 0.5 0.5
T50 (sec.) 1.2 1.01 1.22 1 >30 >30 2.62 2.37
Air Content (%)
3.4 3.7 3.5 5.0 4.1 10.5 2.6 17
Temp. (oF) 75 76 74 75 83 75 76 76
Unit Weight (lb/ft3)
145.6 145.2 145.68 144.2 147.8 137.4 148.0 136.92
Item
Pla
nt
Job
Sit
e
Self-Consolidating Concrete Mixtures
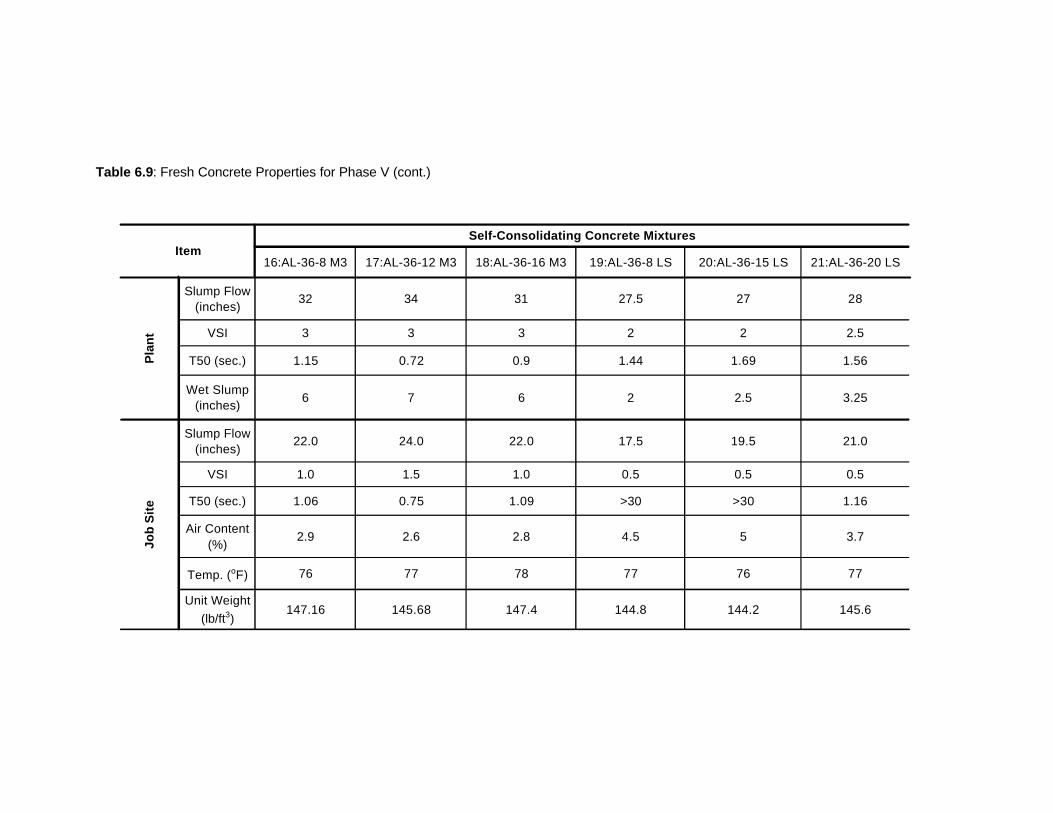
138
Table 6.9: Fresh Concrete Properties for Phase V (cont.)
16:AL-36-8 M3 17:AL-36-12 M3 18:AL-36-16 M3 19:AL-36-8 LS 20:AL-36-15 LS 21:AL-36-20 LS
Slump Flow (inches)
32 34 31 27.5 27 28
VSI 3 3 3 2 2 2.5
T50 (sec.) 1.15 0.72 0.9 1.44 1.69 1.56
Wet Slump (inches)
6 7 6 2 2.5 3.25
Slump Flow (inches)
22.0 24.0 22.0 17.5 19.5 21.0
VSI 1.0 1.5 1.0 0.5 0.5 0.5
T50 (sec.) 1.06 0.75 1.09 >30 >30 1.16
Air Content (%)
2.9 2.6 2.8 4.5 5 3.7
Temp. (oF) 76 77 78 77 76 77
Unit Weight (lb/ft3)
147.16 145.68 147.4 144.8 144.2 145.6
Item
Pla
nt
Job
Sit
e
Self-Consolidating Concrete Mixtures

139
The amount of entrapped air for the GGBFS mixtures was increased with higher replacement
percentages of GGBFS. The amount of entrapped air was 4.1% for 13:AL-36-40 SG, 10.5% for
14:AL-36-50 SG, and 17% for 15:AL-36-60 SG. These results indicate that the amount of
entrapped air nearly doubled for every 10% increase in GGBFS. An experiment was conducted
to determine if the Glenium 3030 NS was in fact the primary cause of this entrapped air. In this
experiment, mixture 14:AL-36-50 SG was remade with exactly the same mixture proportions with
the Glenium 3030 NS being replaced by PolyHeed 1025. Table 4.5 shows that the required
dosage amount of PolyHeed 1025 to achieve similar slump flow values at the batch plant was 20
oz/cwt. This high dosage amount was necessary due to the fact that the PolyHeed 1025 is a mid-
range water reducing admixture. The results of this experiment can be seen by examining
mixture 14:AL-36-50 SG (LA) in Table 6.9, where (LA) stands for low air. The results show that
when only the PolyHeed 1025 was utilized the amount of entrapped air was reduced from 10.5%
to 2.6%, respectively. Based upon these results it was determined that the Glenium 3030 NS
was the main reason for the increase in entrapped air.
These results in Table 6.9 show that the Micron 3 did not provide an increase in stability
or viscosity compared to the fly ash mixtures even at high replacement percentages. This
outcome was unexpected since the Micron 3 was considerably finer than both the cement and the
traditional fly ash. However, it is believed that this outcome is due to the fact that the Micron 3
was in replacement of the cement and not the fly ash. Since the Micron 3 is notably more
spherical than the cement it provided an increase in workability. This can be seen by observing
the increase in water slump for 16:AL-36-8 M3 compared to 6:AL-36-33 FA. Earlier results
illustrated that as the water slump was increased the stability of the mixture was decreased,
especially at higher slump flow values. The stability of the Micron 3 mixtures was reduced in
spite of the fact that the Micron 3 was finer. Furthermore, the results in Table 6.9 show that the
introduction of the limestone filler provided no considerable increase in stability, but exhibited a
reduction in water slump for a constant dosage of HRWRA. This reduction in water slump at the
batch plant is most likely due to the reduction of water content from 284 lb/yd3 for the fly ash
mixtures to 270 lb/yd3 for the limestone filler mixtures as shown in Table 4.5.
6.6.2 Hardened Concrete Properties
Compressive Strength: The hardened concrete properties determined for Phase V can be seen
by looking at Figures 6.27 through 6.38. Each SCC mixture was compared to a base line mixture
in order to determine the effect of each method to modify the viscosity on the hardened concrete
properties. SCC mixture 1:AL-41-0 VMA was determined to be the appropriate base line mixture
for all SCC mixtures prepared at a water-to-cementitious materials ratio of 0.41, while 6:AL-36-33
FA will be used as the base line mixture for all SCC mixtures prepared at a water-to-cementitious
materials ratio of 0.36.

140
0
1000
2000
3000
4000
5000
6000
7000
8000
9000
10000
0 7 14 21 28 35 42 49 56Concrete Age (Days)
Co
mp
ress
ive
Str
eng
th (p
si)
1:AL-41-0 VMA 2:AL-41-2 VMA 3:AL-41-10 VMA 4:AL-41-18 VMA
Figure 6.27: Compressive Strength vs. Concrete Age for VMA Mixtures
0
1
2
3
4
5
6
0 7 14 21 28 35 42 49 56Concrete Age (Days)
Mo
du
lus
of
Ela
stic
ity
(1.0
x 1
0 6 p
si)
1:AL-41-0 VMA 2:AL-41-2 VMA 3:AL-41-10 VMA 4:AL-41-18 VMA
Figure 6.28: Modulus of Elasticity vs. Concrete Age for VMA Mixtures

141
Figure 6.29: Compressive Strength vs. Concrete Age for Fly Ash Mixtures
Figure 6.30: Modulus of Elasticity vs. Concrete Age for Fly Ash Mixtures
0
1
2
3
4
5
6
0 7 14 21 28 35 42 49 56Concrete Age (Days)
Mo
du
lus
of
Ela
stic
ity
(1.0
x 1
0 6 p
si)
5:AL:36-33 (2) FA 6:AL-36-33 FA 7:AL-36-40 FA 8:AL-36-50 FA
0
1000
2000
3000
4000
5000
6000
7000
8000
9000
10000
11000
12000
0 7 14 21 28 35 42 49 56
Concrete Age (Days)
Co
mp
ress
ive
Str
eng
th (p
si)
5:AL-36-33 (2) FA 6:AL-36-33 FA 7:AL-36-40 FA 8:AL-36-50 FA

142
0
1000
2000
3000
4000
5000
6000
7000
8000
9000
10000
11000
12000
0 7 14 21 28 35 42 49 56Concrete Age (Days)
Co
mp
ress
ive
Str
eng
th (
psi
)
6:AL-36-33 FA 9:AL-36-6 SF 10:AL-36-8 SF 11:AL-36-10 SF 12:AL-36-15 SF Figure 6.31: Compressive Strength vs. Concrete Age for Silica Fume Mixtures
0
1
2
3
4
5
6
0 7 14 21 28 35 42 49 56
Concrete Age (Days)
Mo
du
lus
of
Ela
stic
ity
(1.0
x 1
0 6 p
si)
6:AL-36-33 FA 9:AL-36-6 SF 10:AL-36-8 SF 11:AL-36-10 SF 12:AL-36-15 SF Figure 6.32: Modulus of Elasticity vs. Concrete Age for Silica Fume Mixtures

143
0
1000
2000
3000
4000
5000
6000
7000
8000
9000
10000
11000
12000
13000
14000
0 7 14 21 28 35 42 49 56Concrete Age (Days)
Co
mp
ress
ive
Str
eng
th (
psi
)
6:AL:36-33 FA 13:AL-36-40 SG 14:AL-36-50 SG14:AL-36-50 SG (LA) 15:AL-36-60 SG
Figure 6.33: Compressive Strength vs. Concrete Age for GGBFS Mixtures
0
1
2
3
4
5
6
7
0 7 14 21 28 35 42 49 56Concrete Age (Days)
Mo
du
lus
of
Ela
stic
ity (
1.0
x 10
6 ps
i)
6:AL-36-33 FA 13:AL-36-40 SG 14:AL-36-50 SG14:AL-36-50 SG (LA) 15:AL-36-60 SG
Figure 6.34: Modulus of Elasticity vs. Concrete Age for GGBFS Mixtures

144
0
1000
2000
3000
4000
5000
6000
7000
8000
9000
10000
11000
12000
0 7 14 21 28 35 42 49 56Concrete Age (Days)
Co
mp
ress
ive
Str
eng
th (
psi
)
6:AL-36-33 FA 16:AL-36-8 M3 17:AL-36-12 M3 18:AL-36-16 M3
Figure 6.35: Compressive Strength vs. Concrete Age for Micron 3 Mixtures
0
1
2
3
4
5
6
0 7 14 21 28 35 42 49 56
Concrete Age (Days)
Mo
du
lus
of
Ela
stic
ity
(1.0
x 1
0 6 p
si)
6:AL-36-33 FA 16:AL-36-8 M3 17:AL-36-12 M3 18:AL-36-16 M3 Figure 6.36: Modulus of Elasticity vs. Concrete Age for Micron 3 Mixtures

145
Figure 6.37: Compressive Strength vs. Concrete Age for Limestone Mixtures
0
1
2
3
4
5
6
0 7 14 21 28 35 42 49 56
Concrete Age (Days)
Mo
du
lus
of
Ela
stic
ity
(1 x
10
6 psi
)
6:AL-36-33 FA 19:AL-36-8 LS 20:AL-36-15 LS 21:AL-36-20 LS Figure 6.38: Modulus of Elasticity vs. Concrete Age for Limestone Mixtures
0
1000
2000
3000
4000
5000
6000
7000
8000
9000
10000
0 7 14 21 28 35 42 49 56
Concrete Age (Days)
Co
mp
ress
ive
Str
eng
th (
psi
)
6:AL-36-33 FA 19:AL-36-8 LS 20:AL-36-15 LS 21:AL-36-20 LS

146
Figure 6.27 indicates that the base line mixture with no VMA showed higher values of
compressive strength at all ages, while the SCC mixture 2:AL-41-2 VMA and 3:AL-41-10 VMA
produced the lowest compressive strength results. However, this is most likely due to the
influence of other external factors rather than the incorporation of the VMA. The compressive
strengths for these mixtures ranged from 6,800 to 7,500 psi at 56-days.
By comparing the SCC mixtures 1:AL-41-0 VMA and 2:AL-41-2 VMA to 5:AL-36-33 (2)
FA and 6:AL-36-33 FA in Figure 6.29 it can be seen that the reduction in water-to-cementitious
materials ratio from 0.41 to 0.36 increased the compressive strengths, on average, 2,300 psi at
56-days. This is expected since it is a well known fact that the strength is increased as the water-
to-cementitious materials ratio decreases. Furthermore, the results indicate that compressive
strength decreased as the percentage of fly ash increased. This is primarily due to the fact there
is only enough calcium hydroxide in the paste in which the Class F fly ash can react to form
calcium silicates. Therefore, higher replacement percentages of fly ash may result in unreacted
ash that may cause a reduction in the compressive strength. Additionally, Figure 6.29 shows that
replacement percentages of fly ash above 50% should not be utilized due to the fact the critical
28-day compressive strength of 5,200 psi would not be achieved.
The results obtained from the compressive strength tests for both the silica fume and
GGBFS mixtures can be seen in Figures 6.31 and 6.33. Unlike Phase IV where the incorporation
of the silica fume produced a clear increase in compressive strength, the incorporation of the
silica fume for these materials did not indicate a significant increase in compressive strength at
56-days. This was unexpected since silica fume is known to typically improve the microstructure
and increase compressive strengths. Furthermore, Figure 6.31 reveals that the SCC mixture with
15% replacement of silica fume showed a decrease in compressive strength compared to the
base line mixture. This decrease in compressive strength can be possibly attributed to the fact
that the SCC mixture contained a higher percentage of entrapped air compared to the base line
mixture.
As discussed in Section 6.6.1, unusually high amounts of entrapped air of 10.5% and
17% were obtained at replacement percentages of 50% and 60% GGBFS, respectively. It was
determined that as the porosity increased the compressive strength was decreased as shown in
Figure 6.33. For example, mixtures 14:AL-36- 50 SG and 14:AL-36-50 SG (LA) was comprised
of exactly the same mixture proportions with the exception of the water reducing admixture.
According to Figure 6.33, the reduction in entrapped air from 10.5% to 2.6% corresponded to an
increase of compressive strength of at least 4,800 psi at 28 and 56-day. This is a remarkable
increase in compressive strength, and it shows the significance of the porosity-compressive
strength relationship. By examining mixtures 13:AL-36-40 SG and 14:AL-36-50 SG (LA) it
appears that as the replacement of GGBFS increased from 40% to 50%, the compressive
strength was increased by 1,400 psi and 1,800 psi at 28 and 56-days, respectively. This is
considering the fact that both mixtures contained reasonably low air contents. Moreover, the

147
utilization of GGBFS was found to increase the compressive strength compared to the base line
mixture of no less than 1,300 psi at 56-days.
Figure 6.35 indicates that the use of Micron 3 produced a decrease in compressive
strengths compared to the base line mixture. The SCC mixtures with Micron 3 demonstrated an
average compressive strength loss of 1,000 psi at 28 and 56-days. However, it is thought that
this decrease in compressive strength is not a result of the Micron 3, but is due to the fact that the
Micron 3 was in replacement of cement instead of fly ash. As the replacement percentage of
Micron 3 was increased the total percentage of fly ash within the SCC mixture increased
accordingly. As higher replacement percentages of Micron 3 was introduced into the SCC
mixtures, it is probable that the amount of unreacted fly ash was increased resulting in a
decrease in compressive strength. This is analogous to the high fly ash mixtures shown in Figure
6.29. However, all Micron 3 mixtures were well above the required critical 28-day compressive
strength of 5,200 psi despite the reduced compressive strength.
Figure 6.37 shows that the introduction of the limestone filler caused a reduction in
compressive strength compared to the base line mixture. Figure 6.37 further reveals that the
compressive strength of the SCC mixtures is lower as the percentage of limestone filler
increases. The reduction in compressive strength is a direct result of the limestone filler being
inert. The replacement of cementitious materials by limestone filler is in effect raising the water-
to-cementitious materials ratio resulting in lower compressive strengths.
Modulus of Elasticity: Figures 6.28, 6.30, 6.32, 6.34, 6.36, and 6.38 present the calculated
modulus of elasticity values obtained for all SCC mixtures for Phase V. The development for the
modulus of elasticity is similar to the strength development provided in Figures 6.27, 6.29, 6.31,
6.33, 6.35, and 6.37. Furthermore, Figures 6.27 through 6.38 indicate that higher modulus of
elasticity values were achieved for higher values of compressive strengths. In order to determine
if the calculated elastic modulus for the concrete mixtures is of typical sound concrete; the
calculated modulus of elasticity in this phase of the research was compared with the ACI 318
(2002) Building Code ( ccc fWpsiE '33)( 5.1∗= ) and the ACI Committee 363 (2002) “State-of
the-Art Report on High-Strength Concrete” ( )000,000,1'000,40)( += cfpsiEc models.
Figure 6.39 reveals that the ACI 318 (2002) overestimated the modulus of elasticity for both the
ODSC and SCC mixtures. Furthermore, the ACI 318 (2002) was found to increasingly
overestimate the modulus of elasticity as the compressive strength increased. This finding
coincides with ACI Committee 363 (2002) that found that the equation used by the ACI 318
(2002) was only valid for compressive strengths up to 6,000 psi. On the other hand, the ACI
Committee 363 (2002) equation provided an improved and typically conservative estimate for the
modulus of elasticity for both the ODSC and SCC mixtures as shown in Figure 6.40. It is believed
that the improved and conservative estimation for the modulus of elasticity lies in the fact that the

148
equation provided by the ACI Committee 363 (2002) is valid for compressive strengths from
3,000 to 12,000 psi.
0
1
2
3
4
5
6
0 1 2 3 4 5 6
Measured Elastic Modulus (1.0 x 10 6 psi)
Pre
dic
ted
Ela
stic
Mo
du
lus
(1.0
x 1
0 6 p
si)
-10% Error
+10 Error
Line of Equality
Figure 6.39: Predicted vs. Measured Elastic Modulus According to ACI 318 (2002) - (Phase V)
0
1
2
3
4
5
6
0 1 2 3 4 5 6Measured Elastic Modulus (1.0 x 10 6 psi)
Pre
dic
ted
Ela
stic
Mo
du
lus
(1.0
x 1
0 6 p
si)
+10% Error
-10% Error
Line of Equality
Figure 6.40: Predicted vs. Measured Elastic Modulus According to ACI 363 (2002) - (Phase V)

149
6.6.3 Effect of VMA on Fresh Concrete Properties
The results in Table 6.9 indicate that the polyethylene glycol VMA was found not to significantly
influence the viscosity of the SCC mixtures even at high dosage amounts. However, results may
suggest that the incorporation of the polyethylene glycol VMA provided a slight increase in
stability compared to the SCC mixtures with similar mixture proportions without VMA at higher
values of slump flow. Furthermore, this VMA could possibly be used to overcome deficiencies in
mixture constituents in everyday batch plant operations.
To study the effects of this viscosity agent on the stability of SCC mixtures when
subjected to inaccurate moisture corrections, mixing water was added to or deducted from a base
line mixture. This base line mixture was 5:AL-36-33 2.FA with the following modifications. The
first modification is the incorporation of the VMA. Each testing point consisted of one mixture that
incorporated the 2 oz/cwt of VMA and one mixture without the VMA. Secondly, the HRWR
admixture dosage was reduced from 10 oz/cwt to 8 oz/cwt for all concrete mixtures. The results
in Table 6.10 and Figure 6.41 indicate that at the water content equal to the base line mixture the
VMA appears to have minimal effect on the slump flow, stability, or viscosity. However, as
additional water was added to the base line mixture, the stability of the mixture was found to be
increased with the addition of VMA. The increase in stability can be attributed to the lower slump
flow values for the SCC mixtures with VMA at +10 and +20 lb/yd3. This decrease in slump flow
values for the SCC mixtures that incorporated VMA is most likely due to the fact the VMA is
rendering the mixture more robust as excess water is released by the HRWRA. At lower slump
flow values and lower free water contents the VMA was found to be ineffective in increasing the
stability of the SCC mixtures.
The results from the study indicate that the use of this type of VMA can decrease the
sensitivity of the SCC mixtures due to inaccurate moisture corrections. However, at lower slump
flow values the use of the polyethylene glycol VMA may not provide an increase in stability.
When low water-to-cementitious materials ratios are used and the SCC mixtures are placed at
lower slump flow values, the incorporation of this type of VMA may not be necessary. On the
other hand, if moisture variability can not be properly controlled and the SCC mixtures are placed
at higher slump flow values the use of a VMA can be beneficial.

150
Table 6.10: Tabulated Results of the Effect of VMA on Fresh Concrete Properties
Wet Slump (inches)
Unit Weight (lb/yd3)
Air Content
(%)
Temp. (oF)
Diameter (inches)
T50 (sec) VSI
+20 lb/yd3 without VMA 9 147.9 2.7 75 31 0.44 3
+20 lb/yd3 with VMA 8 146.8 4 75 28 0.9 2
+10 lb/yd3 without VMA 5 143.64 5 76 27.5 0.96 2.5
+10 lb/yd3 with VMA 5 142.2 3.5 74 26 1.38 2
+0 lb/yd3 without VMA 2 1/2 144.6 5.1 75 25.25 1.56 1.5
+0 lb/yd3 with VMA 2 145.4 3.9 75 25 1.69 1
-10 lb/yd3 without VMA 1 1/4 145.5 3.9 73 24.5 1.47 1
-10 lb/yd3 with VMA 1/4 144.9 4.2 74 23 2.35 1
-20 lb/yd3 without VMA 0 143.7 5 74 21.5 4.75 0
-20 lb/yd3 with VMA 0 145 4 76 20.5 3.97 0
Fresh Properties Slump Flow
0
5
10
15
20
25
30
35
-30 -20 -10 0 10 20 30
Unit Water Content (lb/yd3)
Slu
mp
Flo
w (i
nch
es)
VMA Used
VMA Not Used
Bas
e Li
ne M
ixtu
re
Additional Water Deducted Water
Figure 6.41: Graphical Results of the Effect of VMA on Fresh Concrete Properties

151
6.7 SUMMARY OF RESEARCH FINDINGS
• Based on the results of this research, it is concluded that the early or delayed addition of the
HRWRA has no considerable effect on the workability characteristics of the SCC mixtures.
• It was determined that obtaining a water slump before the addition of the HRWRA was
suitable for not only ensuring correct moisture corrections, but also in determining appropriate
mixture proportions for the SCC mixtures.
• It was found that obtaining a water slump under real field conditions required a considerable
increase in time compared to laboratory conditions.
• The ODSC mixtures prepared for this research were found to be within the specified range of
slump values at placement in addition to demonstrating typical workability characteristics for
wet-hole construction.
• The incorporation of the 4 oz/cwt mid-range water reducing admixture PolyHeed 1025 seems
to help maintain the workability of the SCC mixtures better than those that contained only
Glenium 3030 NS.
• The ODSC mixtures demonstrated a higher degree of bleeding compared to the SCC
mixtures prepared at the same water-to-cementitious materials ratio.
• It was concluded that the HRWRA Glenium 3030 NS was the primary cause of the increased
air content for the SCC mixtures.
• The results from this research indicate that at similar slump flow values the viscosity of the
SCC mixtures was not increased at high dosage amounts of VMA. However, the results
suggest that the VMA may provide a slight increase in stability at higher values of slump flow
with increasing VMA dosage.
• At lower slump flow values such as those representing the job site testing; the VMA appears
to have no effect on the stability of the SCC mixtures.
• The results show that the use of VMA could possibly be used to overcome deficiencies in
mixture constituents in everyday batch plant operations, which mainly consist of inaccurate
moisture corrections.
• Based on the materials and mixtures proportions used for Phase V, the incorporation of high
amounts of fly ash, Micron 3, or limestone filler as the method to modify the viscosity was
found not to increase the viscosity of the SCC mixtures by evidence of the T50 times.
• The incorporation of the silica fume provided no increase in viscosity by evidence of the T50
times. However, the utilization of the silica fume was found to improve the stability of the
mixtures.
• The incorporation of GGBFS provided a reduction in the water slump and showed a higher
degree of stability at the batch plant compared to mixtures prepared with fly ash and at the

152
same water-to-cementitious materials ratio. In addition, the incorporation of the GGBFS
seems to slightly increase the T50 times compared to the silica fume mixtures and the fly ash
mixtures at similar slump flow values.
• The SCC mixtures prepared at a water-to-cementitious materials ratio of 0.41 demonstrated
slightly lower compressive strengths compared to those of the ODSC mixtures. It is
concluded that this is a result of the higher replacement percentage of cement by fly ash for
those mixtures.
• At a constant water-to-cementitious materials ratio the use of the silica fume or ground
granulated blast furnace slag (GGBFS) can provide an increase the compressive strength.
• High replacement percentages of fly ash may result in unreacted ash that may cause a
reduction in the compressive strength.
• The introduction of the limestone filler caused a reduction in compressive strength compared
to the base line mixture. The primary reason for the reduction in compressive strength is a
direct result of the limestone filler being inert. The replacement of cementitious materials by
limestone filler is in effect raising the water-to-cementitious materials ratio resulting in lower
compressive strengths.
• The SCC mixtures prepared at the same water-to-cementitious materials ratio as the ODSC
mixtures demonstrated a reduction in RCPT values at 91 and 365-days.
• The RCPT values obtained at 91-days for the SCC and ODSC mixtures were found to
decrease with time. This is because as the hydration process proceeds, the interconnected
pores that were present at 91-days are being filled by the continuous and overall increase in
volume due to the formation of C-S-H and the continuous grow of the calcium hydroxide
within the capillaries pores, which lowered the RCPT values at 365-days.
• The introduction ground granulated blast furnace slag (GGBFS) was found to increase the
RCPT values compared to the (FA) SCC mixtures.

153
Chapter 7
SUMMARY, CONCLUSIONS, AND RECOMMENDATIONS
The laboratory testing program was executed to determine if self-consolidating concrete can be used
as a viable material for drilled shaft construction. The primary objectives of this research were to
identify appropriate testing techniques, identify characteristics for this specific application, and
potential problems or concerns with the use of SCC in drilled shaft construction. Furthermore, the
laboratory testing program examined the difference between ordinary drilled shaft concrete and SCC
for both fresh and hardened properties. The fresh properties include filling ability, passing ability,
segregation resistance, workability over time, bleeding characteristics, and controlled setting, while
the hardened properties included the comparison of the compressive strength, elastic modulus, and
drying shrinkage. It is hopeful that this research will lead to additional interest in this topic from state
and national transportation agencies so that further research in this area can be conducted. This
chapter will present the summary and conclusions drawn from this research while offering
recommendations based on the summary and conclusions.
7.1 CONCLUSIONS
The laboratory testing of the fresh and hardened properties for both the ODSC and SCC mixtures
provided insight into the use of SCC for drilled shaft applications. The results provided in Chapter 6
were thoroughly examined and conclusions were drawn from these results. The following section
presents the summary conclusions drawn from the work documented in this report:
• The use of set-retarding admixtures can significantly increase the time in which a concrete
mixture will remain workable. For drilled shaft applications, the dosage of set-retarding
admixture should be adjusted to provide an extended initial set necessary to ensure that the
workability of the concrete mixture is maintained for the duration of the pour and to allow for
any construction delays in concreting and removal of the temporary casing after concreting is
completed.
• For a given dosage of set-retarding admixture, concrete mixtures can experience faster initial
set times and increased slump loss when exposed to higher temperatures compared to the
laboratory conditions.

154
• This research shows that merely estimating the additional amount of set-retarding admixture
needed in hot weather conditions is not a sufficient measure to ensure that proper retained
workability and set times are achieved. The amount of retarding admixture should be based
on trial mixes under simulated conditions.
• Results indicate that SCC mixtures can experience an increased workability loss compared to
ODSC mixtures when subject to similar mixing conditions. The rate and amount of
workability loss depends on the initial workability conditions, degree of agitation, rotational
speed of the mixing drum, and duration of mixing.
• The SCC mixtures prepared for this research provided a considerable increase in workability
at placement compared to the ODSC mixtures. This enhanced workability may be capable of
overcoming placement difficulties associated with tremie placing concrete and congested
rebar cages.
• SCC mixtures are more inclined to have a larger change in workability for the same amount
of time compared to the ODSC mixtures.
• The Slump Flow, T50, and J-Ring tests were deemed acceptable quality control procedures
for both laboratory and field conditions for drilled shaft applications.
• It is a must that the static stability of the SCC mixture be part of the determination of the VSI
rating. This should be done by observing the SCC mixture in the wheelbarrow or mixing
drum directly after the completion of the slump flow test.
• It is concluded that the segregation column can be used to provide a quick and valuable
testing procedure for laboratory purposes to determine the probability of a SCC mixture to
segregate, especially at higher values of slump flow.
• The critical sand-to-aggregate ratio for these materials for passing ability and segregation
resistance is 0.44 or higher. The possibility of blockage and segregation may be increased at
sand-to-aggregate ratios below 0.44.
• The SCC mixtures exhibited increased stability as the water slump and water-to-cementitious
materials ratio was reduced, which is more apparent at higher values of slump flow.
• The ODSC mixtures demonstrated a higher degree of bleeding compared to the SCC
mixtures prepared at the same water-to-cementitious materials ratio.
• If the moisture variability at the batch plant can be properly controlled and since the SCC
mixtures for this research are placed at lower values of slump flow (18 to 24 inches), it is the
opinion of the author that very workable and stable SCC mixtures can be achieved without
the use of the polyethylene glycol VMA.
• It was concluded for this research that since the fine and coarse aggregates were high quality
and the aggregate volume fraction was not drastically different, the modulus of elasticity of

155
the SCC mixtures was not significantly affected by the varying sand-to-aggregate ratio, which
ranged from 0.40 to 0.48.
• The results from this research indicate that with these materials and mixture proportions, the
equation provided by ACI 318 (2002) typically overestimated the modulus of elasticity
especially at higher values of compressive strengths. Conversely, the equation provided by
the ACI Committee 363 (2002) was found to provide an improved and conservative estimate
of the modulus of elasticity.
• The water-to-cementitious materials ratio appeared to be the main factor influencing the
drying shrinkage. The results indicate that the reduction in water-to-cementitious materials
ratio decreased the concrete specimen’s tendency to shrink.
• It can be concluded that the coefficient of permeability decreases as the water-to-
cementitious materials ratio is reduced.
• It can be concluded that the introduction of silica fume can considerably reduce the
permeability of concrete.
7.2 RECOMMENDATIONS
• Due to the time-dependent effects of the HRWR admixture, it is recommended that laboratory
mixing procedures account for transportation time and the HRWR admixture be adjusted to
account for the transportation time so that SCC mixture will meet the specified quality control
limits upon arrival to the job site.
• It is recommended that field adjustments to the chemical admixtures at the job site be
avoided; rather all efforts should be made to correctly batch the chemical admixtures at the
source of mixing.
• It is highly suggested that trial mixes be conducted under simulated conditions in order to
determine the appropriate set-retarding admixture dosage and proper workability retention is
achieved.
• It is suggested that the slump flow and J-Ring test be used as quality control test for the SCC
mixtures in both the laboratory and field settings. The segregation column test can be used
for laboratory purposes.
• In order to overcome placement problems associated with ODSC mixtures it is recommended
that the SCC mixtures be placed at a slump flow ranging from 18 to 24 inches with a VSI
rating of 1 or less. It is the opinion of the author that these quality control limits will provide a
SCC mixture with sufficient flowability, workability, and stability for both dry and wet-hole
construction.

156
• The following suggestions are offered to overcome issues associated with congested rebar
cages. Firstly, the use of small well-graded rounded river gravel should be utilized in
applications where the rebar cages are congested. In regards to the SCC mixtures, it is
suggested that the use of a small well-graded rounded river gravel with a #7 gradation be
used to ensure high passing ability and reduced possibility of segregation.
• It is recommended that water-to-cementitious materials ratios of 0.36 to 0.40 be utilized for
drilled shaft applications.
• In order to help reduce the amount of bleed water generated the following suggestions are
offered:
1. Use large amounts of supplementary cementitious materials to reduce the amount of
free water
2. Air entrainment
3. By reducing the free water content or water-to-cementitious materials ratio
4. Utilizing of new polycarboxylate ester based mid and high range water reducing
admixtures
5. Presence of adequate proportions of very fine aggregate particles, which can consist of
raising the sand-to-aggregate ratio
6. The use of a binding type VMA
• If a low permeability-high durability drilled shaft concrete mixture is required in areas prone to
chemical attack, a low water-to-cementitious materials ratio and/or the incorporation of fine
material, such as silica fume, should be used to provide the necessary durability.
• It is recommended that the SCC mixture 9:36-44 FA be utilized for the field study to be
conducted in South Carolina.
• Establish a “high performance concrete criteria” for drilled shaft construction based on the
following:
1. Workability requirements
2. Shaft size
3. Congestion of the rebar cages
4. Typical aggregate size and type
5. Retained workability requirements
6. Avoidance of segregation & bleeding
157
REFERENCES
ACI Committee 209. 2002. Prediction of Creep, Shrinkage, and Temperature Effects in Concrete
Structures. In ACI Manual of Concrete Practice 2002: Part 1. 209R-1-209R-47. Farmington
Hills, Missouri: American Concrete Institute.
ACI Committee 318. 2002. Building Code Requirements for Structural Concrete. In ACI Manual of
Concrete Practice 2002: Part 4. 363R-1-363R-55. Farmington Hills, Missouri: American
Concrete Institute.
ACI Committee 363. 2002. State-of-the-Art Report on High-Strength Concrete. In ACI Manual of
Concrete Practice 2002: Part 5. 363R-1-363R-55. Farmington Hills, Missouri: American
Concrete Institute.
ASTM C 31. 1998. Standard Practice for Making and Curing Concrete Test Specimens in the Field.
Annual Book of ASTM Standards 1998 Section 04, V. 4.02: Concrete and Aggregates.
ASTM C 33. 2002. Standard Specification for Concrete Aggregates. Annual Book of ASTM Standards
2002. Section 04, V. 4.02: Concrete and Aggregates.
ASTM C 39. 1998. Standard Test Method for Compressive Strength of Cylindrical Concrete
Specimens. Annual Book of ASTM Standards 1998. Section 04, V. 4.02: Concrete and
Aggregates.
ASTM C 138. 1998. Standard Test Method for Unit Weight, Yield, and Air Content. Annual Book of
ASTM Standards 1998. Section 04, V. 4.02: Concrete and Aggregates.
ASTM C 143. 1998. Standard Test Method for Slump of Hydraulic-Cement Concrete. Annual Book of
ASTM Standards 1998. Section 04, V. 4.02: Concrete and Aggregates.
ASTM C 157. 1998. Standard Test Method for Length Change of Hardened Hydraulic-Cement Mortar
and Concrete. Annual Book of ASTM Standards 1998. Section 04, V. 4.02: Concrete and
Aggregates.
ASTM C 172. 1998. Standard Practice for Sampling Freshly Mixed Concrete. Annual Book of ASTM
Standards 1998. Section 04, V. 4.02: Concrete and Aggregates.
ASTM C 192. 1998. Standard Practice for Making and Curing Concrete Test Specimens in the
Laboratory. Annual Book of ASTM Standards 1998. Section 04, V. 4.02: Concrete and
Aggregates.
ASTM C 204. 1998. Standard Test Method for Fineness of Hydraulic Cement by Air Permeability
Apparatus. Annual Book of ASTM Standards 1998. Section 04, V. 4.02: Concrete and
Aggregates.
ASTM C 232. 1998. Standard Test Method for Bleeding of Concrete using Method A. Annual Book of
ASTM Standards 1998. Section 04, V. 4.02: Concrete and Aggregates.

158
ASTM C 360. 1998. Standard Test Method for Ball Penetration in Freshly Mixed Hydraulic Cement
Concrete. Annual Book of ASTM Standards 1998. Section 04, V. 4.02: Concrete and
Aggregates.
ASTM C 403. 1998. Standard Test Method for Time of Setting of Concrete Mixtures by Penetration
Resistance. Annual Book of ASTM Standards 1998. Section 04, V. 4.02: Concrete and
Aggregates.
ASTM C 469. 1998. Standard Test Method for Static Modulus of Elasticity and Poisson’s Ratio
Strength of Concrete in Compression. Annual Book of ASTM Standards 1998. Section 04, V.
4.02: Concrete and Aggregates.
ASTM C 494. 1998. Standard Specification for Chemical Admixtures for Concrete. Annual Book of
ASTM Standards 1998. Section 04, V. 4.02: Concrete and Aggregates.
ASTM C 618. 1998. Standard Specification for Coal Fly Ash and Raw or Calcined
Natural Pozzolan for Use in Concrete. Annual Book of ASTM Standards 1998. Section 04, V.
4.02: Concrete and Aggregates
ASTM C 989. 1998. Specification for Ground Granulated Blast Furnace Slag for Use in Concrete and
Mortars. Annual Book of ASTM Standards 1998. Section 04, V. 4.02: Concrete and
Aggregates.
ASTM C 1202. 1998. Standard Test Method for Electrical Indication of Concrete’s Ability to Resist
Chloride Ion Penetration. Annual Book of ASTM Standards 1998. Section 04, V. 4.02: Concrete
and Aggregates.
ASTM C 1231. 1998. Standard Practice for use of Unbonded Caps in Determination of Compressive
Strength of Hardened Concrete Specimens. Annual Book of ASTM Standards 1998. Section
04, V. 4.02: Concrete and Aggregates.
ASTM C XXXX/CXXX. 2004. Standard Test Method for Segregation of Hydraulic-Cement Self-
Consolidating Concrete using Column Technique. Proposed ASTM Draft submitted to ASTM
for acceptance.
ASTM C XXXX/CXXX. 2004. Standard Test Method for Passing Ability of Self-Consolidating
Concrete by J-Ring and Slump Cone. Proposed ASTM Draft submitted to ASTM for
acceptance.
Attiogbe E.K., H.T. See, and Joseph Daczko. 2003. Engineering Properties of Self-Consolidating
Concrete. In First North American Conference on the Design and Use of Self-Consolidating
Concrete 12-13 November 2002, edited by Surendra Shah, Joseph Daczko, and James
Lingscheit, 331-336. Addison, Illinois: Hanley-Wood.
Berke, N.S., C.R. Cornman, A.A. Jeknavorian, G.F. Knight, and O. Wallevik. 2003. The Effective Use
of Superplasticizers and Viscosity-Modifying Agents in Self-Consolidating Concrete. In First
North American Conference on the Design and Use of Self-Consolidating Concrete 12-13

159
November 2002, edited by Surendra Shah, Joseph Daczko, and James Lingscheit, 165-170.
Addison, Illinois: Hanley-Wood.
Bonen, David and Surendra Shah. 2004. The Effects of Formulation on the Properties of Self-
Consolidating Concrete. In Concrete Science and Engineering: A Tribute to Arnon Bentur:
Proceedings of the International RILEM Symposium held in Evanston, USA 24 March 2004,
edited by K. Kovler, J. Marchand, S. Mindess, and J. Weiss, 43-56. Cachan Cedex, France:
RILEM Publications s.a.r.l
Brown, Dan A. 2004. Zen and the Art of Drilled Shaft Construction. In Geotechnical Special
Publication 124, ASCE, Vol. 124: 19-33.
Brown, Dan A. 2004. Concrete. Presentation presented as part of the ADSC Short Course for Drilled
Shaft Foundations.
Brown, Dan A. 2004. Personal communication with first author of this report.
Bury, M.A. and B.J. Christensen. 2003. The Role of Innovative Chemical Admixtures in Producing
Self-Consolidating Concrete. In First North American Conference on the Design and Use of
Self-Consolidating Concrete 12-13 November 2002, edited by Surendra Shah, Joseph Daczko,
and James Lingscheit, 137-140. Addison, Illinois: Hanley-Wood.
California Department of Transportation (Caltrans). 2004. Manual and Forms.
http://www.dot.ca.gov
California Department of Transportation (Caltrans). 2004. Photographs taken by Caltrans (Chapter 3)
were provided by Dr. Dan Brown with permission.
http://www.dot.ca.gov
Camp, W.M, Dan A. Brown, and P.W Mayne. 2002. Construction Methods Effects on Axial Drilled
Shaft Performance. Geotechnical Special Publication 116, ASCE: 193-208.
Degussa Construction Materials. 2004. Master Builders Admixture Systems.
http://www.masterbuilders.com
Emborg, Mats. 1999. Rheology Tests for Self-Compacting Concrete-How Useful are they for the
Design of Concrete Mix for Full Scale Production? In Self-Compacting Concrete: Proceedings
of the First International RILEM Symposium held in Stockholm, Sweden 13-14 September
1999, edited by A. Skarendahl and O. Petersson, 95-105. Cachan Cedex, France: RILEM
Publications s.a.r.l
Ferraris, Chiara F., Karthik H. Obla, and Russell Hill. 2001. The Influence of Mineral Admixtures on
the Rheology of Cement Paste and Concrete. Cement and Concrete Research 31: 245-255.
Florida Department of Transportation (FDOT). 2004. Photographs taken by FDOT (Chapter 3) were
provided by Dr. Dan Brown with permission.
http://www.dot.state.fl.us
Gerwick Jr., Ben C. 2004. Placement of Tremie Concrete. Concrete International (January): 41-52.

160
Hodgson, Donald (Trey) Nelson. 2003. Laboratory and Field Investigations of Self-Consolidating
Concrete. M.S. Thesis., University of Auburn.
Jones, Krista. 2004. The Age-Dependent Stiffness Development of Concrete. M.S. Thesis., University
of Auburn.
Khayat, Kamal, C. Hu, and H. Monty. 1999. Stability of Self-Consolidating Concrete, Advantages, and
Potential Applications. In Self-Compacting Concrete: Proceedings of the First International
RILEM Symposium held in Stockholm, Sweden 13-14 September 1999, edited by A.
Skarendahl and O. Petersson, 143-152. Cachan Cedex, France: RILEM Publications s.a.r.l
Khayat, Kamal, Joseph Assaad, and Joseph Daczko. 2004. Comparison of Field-Oriented Test
Methods to Assess Dynamic Stability of Self-Consolidating Concrete. ACI Materials Journal v.
101, n. 2, (March-April): 168-172.
Khayat, Kamal and Joseph Daczko. 2003. The Holistic Approach to Self-Consolidating Concrete. In
First North American Conference on the Design and Use of Self-Consolidating Concrete 12-13
November 2002, edited by Surendra Shah, Joseph Daczko, and James Lingscheit, 9-14.
Addison, Illinois: Hanley-Wood.
Khayat, Kamal and Somnuk Tangtermsirikul. 2000. Fresh Concrete Properties. In State-of-the-Art
Report (23) of RILEM Technical Committee 174-SCC, edited by A. Skarendahl and O.
Petersson, 17-22. Cachan Cedex, France: RILEM Publications s.a.r.l.
Kim, Jin-Keun, Sang Hun Han, Yon Dong Park, and Jae Ho Noh. 1998. Materials Properties of Self-
Flowing Concrete. Journal of Materials in Civil Engineering. (July): 244-249.
Mapquest. 2005. Mapquest.com Maps, Directions and more. http://www.mapquest.com
Mindess, Sidney, J. Francis Young, and David Darwin. 2003. Concrete, 2nd edition. Upper Saddle
River, NJ: Prentice Hall.
Mujtaba, Ghulam. 2004. Supplemental Technical Special Provisions for use of Flowing Concrete and
Self-Consolidating Concrete for Manufacturing of Precast/Prestressed Concrete Products,
Florida Department of Transportation. Gainesville, Florida: State Materials Office.
Neville, A.M. 1996. Properties of Concrete, 4th edition. New York: John Wiley & Sons, Inc.
O’Neill, Michael W. and Lymon C. Reese. 1999. Drilled Shafts: Construction Procedures and Design
Methods, FHWA Report No. FHWA-IF-99-025, Vol. I, Chapters 1-8: Dallas, Texas: ADSC: The
International Association of Foundation Drilling.
Okamura, Hajime and Masahiro Ouchi. 1999. Self-Compacting Concrete. Development, Present Use
and Future. In Self-Compacting Concrete: Proceedings of the First International RILEM
Symposium held in Stockholm, Sweden 13-14 September 1999, edited by A. Skarendahl and
O. Petersson, 3-14. Cachan Cedex, France: RILEM Publications s.a.r.l
Petersson, Orjan. 1999. Workability. In Final Report of Task2: Brite-EuRam project BRPR-CT96-
0366, http://scc.ce.luth.se/public/ report/workability

161
Petersson, Orjan. 2000. L-Shape Box Test. In State-of-the-Art Report (23) of RILEM Technical
Committee 174-SCC, edited by A. Skarendahl and O. Petersson, 126-128. Cachan Cedex,
France: RILEM Publications s.a.r.l.
Precast/Prestressed Concrete Institute (PCI). 2003. Interim Guidelines for the Use of Self-
Consolidating Concrete in Precast/Prestressed Concrete Institute Member Plants, 1st edition.
Chicago Illinois: Precast/Prestressed Concrete Institute.
Raghavan, K.P., Sivarama Sarma, and D. Chattopadhyay. 2003. Creep, Shrinkage and Chloride
Permeability Properties of Self-Consolidating Concrete. In First North American Conference on
the Design and Use of Self-Consolidating Concrete 12-13 November 2002, edited by Surendra
Shah, Joseph Daczko, and James Lingscheit, 307-312. Addison, Illinois: Hanley-Wood.
Ramsburg, Paul. 2003. The SCC Test: Inverted or Upright. Concrete Producer v 21, n 7, (July): 34-
38.
Rols, Sebastien, Jean Ambroise, and Jean Pera. 1999. Effect of Different Viscosity Agents on the
Properties of Self-Leveling Concrete. Cement and Concrete Research 29: 261-266.
Sedran, T. 2000. Rheology. In Final Report of Task 3: Brite-EuRam project BRPR-CT96-0366,
http://scc.ce.luth.se/public/ report/rheology
Skarendahl, Ake. 2000. Definitions. Self-Compacting Concrete, In State-of-the-Art Report (23) of
RILEM Technical Committee 174-SCC, edited by A. Skarendahl and O. Petersson, 3-5.
Cachan Cedex, France: RILEM Publications s.a.r.l.
Sonebi, M., and P.J.M. Bartos. 1999. Hardened SCC and its Bond with Reinforcement. In Self-
Compacting Concrete: Proceedings of the First International RILEM Symposium held in
Stockholm, Sweden 13-14 September 1999, edited by A. Skarendahl and O. Petersson, 275-
289. Cachan Cedex, France: RILEM Publications s.a.r.l
SCDOT. 2000. SCDOT Standard Specifications for Highway Construction, South Carolina
Department of Transportation.
Su, J.K., S.W. Cho, C.C. Yang, and R. Huang. 2002. Effect of Sand Ratio on the Elastic Modulus of
Self-Compacting Concrete. Journal of Marine Science and Technology, V.10, N.1: 8-13.
Su, Nan, Kung-Chung Hsu, and His-Wen Chai. 2001. A Simple Mix Design Method for Self-
Compacting Concrete. Cement and Concrete Research V. 31. (December 2001): 1799-1807.
Takada, Kazunori and Somnuk Tangtermsirikul. 2000. Testing of Fresh Concrete. Self-Compacting
Concrete, In State-of-the-Art Report (23) of RILEM Technical Committee 174-SCC, edited by A.
Skarendahl and O. Petersson, 25-39. Cachan Cedex, France: RILEM Publications s.a.r.l.
Texas Department of Transportation (TxDOT). 2004. Photographs taken by TxDOT (Chapter 3) were
provided by Dr. Dan Brown with permission.
http://www.dot.state.tx.us

162
Tragargh, J. 1999. Microstructural Features and Related Properties of Self-Compacting Concrete. In
Self-Compacting Concrete: Proceedings of the First International RILEM Symposium held in
Stockholm, Sweden 13-14 September 1999, edited by A. Skarendahl and O. Petersson, 175-
186. Cachan Cedex, France: RILEM Publications s.a.r.l
Turcry, P., A. Loukili, and K. Haidar. 2003. Mechanical Properties, Plastic Shrinkage and Free
Deformation of Self-Consolidating Concrete. In First North American Conference on the Design
and Use of Self-Consolidating Concrete 12-13 November 2002, edited by Surendra Shah,
Joseph Daczko, and James Lingscheit, 301-306. Addison, Illinois: Hanley-Wood.
Yao, Sam X. and Ben C. Gerwick, Jr. 2004. Underwater Concrete: Part 2 Proper Mixture
Proportioning. Concrete International (February): 77-82.