An Evaluation of the Teacher Advancement Program (TAP) in ...
71
An Evaluation of the Teacher Advancement Program (TAP) in Chicago: Year One Impact Report Final Report April 27, 2009 Steven Glazerman Allison McKie Nancy Carey
Transcript of An Evaluation of the Teacher Advancement Program (TAP) in ...

An Evaluation of the
Teacher Advancement
Program (TAP) in Chicago:
Year One Impact Report
Final Report
April 27, 2009
Steven Glazerman Allison McKie Nancy Carey

This page has been intentionally left blank for double-sided copying.
CAPE Reference No: 2006-001-01
MPR Reference No: 6319-520
Joyce Grant No: 06-30021
Submitted to: The Joyce Foundation 70 West Madison Street, Suite 2750 Chicago, IL 60602-4317 Project Officer: John Luczak
Submitted by: Mathematica Policy Research, Inc. 600 Maryland Avenue, S.W., Suite 550 Washington, DC 20024-2512 Project Director: Steven Glazerman
An Evaluation of the
Teacher Advancement
Program (TAP) in Chicago:
Year One Impact Report
Final Report
April 27, 2009
Steven Glazerman Allison McKie Nancy Carey

This page has been intentionally left blank for double-sided copying.
A C K N O W L E D G M E N T S
his study was the product of many people’s efforts. At Chicago Public Schools, Sylvia Flowers, Ann Chan, Jessica Foster, and Bret Feranchak provided data, offered useful feedback on earlier presentations and drafts, and cooperated with the study in many
ways. Gretchen Crosby-Sims and John Luczak at the Joyce Foundation offered useful guidance. Staff at the National Institute for Excellence in Teaching and the Chicago Public Education Fund read and provided comments on a draft of the report. We are especially grateful to the teachers and principals who completed the surveys and interviews that were used in the analysis.
T
At Mathematica, Tiffany Waits and Amy Raduzycki helped manage the data collection activities. Dominic Harris and Sarah Prenovitz provided expert assistance cleaning and analyzing data. Allen Schirm carefully reviewed drafts of the report and provided helpful comments on the study design and report. The report was prepared for publication by Donna Dorsey.

This page has been intentionally left blank for double-sided copying.
C O N T E N T S
Chapter Page
EXECUTIVE SUMMARY ................................................................................... ix
I OVERVIEW ................................................................................................. 1
II METHODS AND DATA ..................................................................................... 5
A. METHODS ................................................................................................................... 5
B. DATA ........................................................................................................................... 7
C. SAMPLE CHARACTERISTICS ...................................................................................... 9
III IMPLEMENTATION ....................................................................................... 15
A. MENTORING, LEADERSHIP, AND FEEDBACK ..................................................... 15
1. Mentoring Received ..................................................................................... 15
2. Leadership Roles Held ................................................................................. 17
3. Observation and Feedback ......................................................................... 20
B. PROFESSIONAL DEVELOPMENT ............................................................................ 22
C. COMPENSATION ...................................................................................................... 22
viii
Chapter Page
Contents
IV IMPACTS ............................................................................................... 27
A. STUDENT ACHIEVEMENT ...................................................................................... 27
B. TEACHER RETENTION ........................................................................................... 30
C. STAKEHOLDER PERCEPTIONS ............................................................................... 35
V CONCLUSION ............................................................................................... 39
A. SUMMARY OF FINDINGS ......................................................................................... 39 B. CAVEATS AND LIMITATIONS ................................................................................. 40 C. NEXT STEPS ............................................................................................................. 42
REFERENCES ............................................................................................... 43 APPENDIX A: SUPPLEMENTAL TABLES ........................................................ 45

E X E C U T I V E S U M M A R Y
he Teacher Advancement Program (TAP) was developed in the late 1990s by the Milken Family Foundation as a schoolwide policy to improve schools by raising teacher quality. Under the TAP model, teachers can earn extra pay and
responsibilities through promotion to Mentor or Master Teacher and can earn annual performance bonuses based on a combination of their value added to student achievement and observed performance in the classroom. The model also includes weekly teacher cluster group meetings and regular classroom observations by a school leadership team to help teachers meet their performance goals. The idea behind the program is that performance incentives combined with tools for teachers to track performance and improve instruction should attract and retain talented teachers and help all teachers produce greater student achievement.
T
This report provides evidence on the impacts of TAP during the first year of its implementation in Chicago Public Schools (CPS). Funded in part by a federal Teacher Incentive Fund grant, CPS began implementing its version of TAP (called “Chicago TAP”) in 2007 with 10 schools and plans to continue adding 10 new TAP schools each year of the grant’s four-year implementation period. Chicago TAP is based on the national TAP model, but with some local adaptations. For instance, the compensation amounts are set locally and the Chicago TAP model includes pay for principals who meet program implementation benchmarks.
We designed a randomized experiment to estimate the impacts of Chicago TAP. Of the 16 CPS elementary schools that voluntarily applied for Chicago TAP and successfully completed the selection process, we randomly assigned 8 to a treatment group that began implementing TAP in 2007-2008 and the other 8 to a control group that delayed implementation until 2008-2009. Two high schools and two charter schools were assigned purposively by CPS and did not always have comparable data. This report presents data on the elementary schools from student test score files, a teacher survey, a set of principal interviews, and teacher administrative records for the treatment schools and the control schools. The pool of schools to randomize was small and therefore, even with randomization, it may be difficult to distinguish real differences from chance differences, so to complement the experimental analysis we created a comparison sample of 18 additional schools by matching them according to size, average teacher experience, and student demographics to the TAP schools. For context, we also report some information on the

x
Executive Summary
remaining elementary schools in CPS (approximately 400 schools). We randomly assigned the third and fourth cohorts of TAP schools in a similar fashion in March 2009, drawing another matched comparison (MC) sample, and will follow those schools as well. Future reports will discuss the high schools and charter schools, which did not participate in randomization.
To understand the first year of implementation of Chicago TAP we assessed how teacher development and compensation practices in TAP schools differ from practices normally implemented in Chicago public schools. We found that teachers in TAP schools reported receiving significantly more mentoring support than teachers in similar non-TAP (control) schools. This would reflect the fact that the TAP model includes Mentor Teachers and weekly cluster group meetings. Veteran teachers in TAP schools reported providing support to their colleagues at levels consistent with TAP program expectations. However, their control group counterparts also reported providing similar levels of mentoring and other supports, with the possible exception of TAP’s veteran teachers writing more evaluations of their fellow teachers. Teachers in TAP schools (veteran and novice) had compensation expectations in line with program policies. That is, the average expectation was $1,900 and the actual amount available in the bonus pool was an average of $2,000 per teacher.
While the introduction of TAP led to reported changes inside the school, these changes did not produce measurable impacts on student test scores as of March of the first year of the program. Student achievement growth as measured by average math and reading scores on the Illinois Standards Assessment Test (ISAT) did not differ significantly between TAP and non-TAP schools.
We did find evidence that TAP increased school retention. The impact of TAP on retention in the school was 5 points (88 versus 83 percent). The impact for teachers in nontested academic subjects was over 9 points, although we were not able to detect impacts for other teaching assignment subgroups. The program had no detectable impact on retention in the district, nor did it change the mix of teachers in terms of background characteristics: degree held, advanced certification, or teaching experience.
Teachers in TAP schools did not report significantly higher satisfaction or more positive attitudes toward their principals than did control teachers. While we did not find evidence of impact on these positive attitudes, we also did not find evidence of negative attitudes. Specifically, we did not find any evidence that TAP harmed the school climate.
Some important caveats should be noted. First, the small sample size limits the statistical power of the analysis—that is, our ability to detect an impact if one exists—as well as the generalizability of the findings. Future reports will incorporate a larger sample. Second, the first-year impacts presented here reflect both school and program startup effects and may not be representative of the steady state impacts of Chicago TAP that will emerge as the program matures and school staff become more accustomed to it. Third, the March administration of the ISAT complicates our measurement of student achievement growth; rather than the ideal of measuring growth from the beginning to the end of the school year corresponding to the first year of implementation (September 2007 to June 2008), our

xi
Executive Summary
measure spans two schools years (March 2007 to March 2008). Finally, survey nonresponse is a potential source of bias for impacts measured using survey data; nonresponse adjustment weights were used to mitigate this concern.
Future reports will present findings on the implementation and impacts of Chicago TAP over time, addressing concerns of both sample size and startup effects mentioned above. We will also perform complementary nonexperimental analyses that may aid in interpreting the findings presented in this report.

This page has been intentionally left blank for double-sided copying.

C H A P T E R I
O V E R V I E W
he Teacher Advancement Program (TAP) was developed in the late 1990s by the Milken Family Foundation (MFF) as a schoolwide policy to improve schools by raising teacher quality. Under the TAP model, teachers can earn extra pay and
responsibilities through promotion to Mentor or Master Teacher and can earn annual performance bonuses based on a combination of their value added to student achievement and observed performance in the classroom. The model also includes weekly teacher cluster group meetings and regular classroom observations by a school leadership team to help teachers meet their performance goals. The idea behind the program is that performance incentives combined with tools for teachers to track performance and improve instruction should attract and retain talented teachers and help all teachers produce greater student achievement.
T
TAP has been implemented in more than 200 schools around the country and is overseen by the National Institute for Excellence in Teaching (NIET), an organization started by MFF. The most recent expansion of TAP came via the federal Teacher Incentive Fund (TIF), which made grants to localities implementing TAP and similar programs. This report focuses on one TIF grantee, the Chicago Public Schools (CPS), which began implementing TAP in 2007 and plans to continue adding 10 new TAP schools each year of the grant’s four-year implementation period. Chicago’s version of TAP (called “Chicago TAP”) is based on the national model, but with some local adaptations. For instance, the compensation amounts are set locally and the Chicago TAP model includes pay for principals who meet program implementation benchmarks.
Existing evidence about the effects of TAP comes from four reports. The program developers have conducted studies of their own program (Schacter et al. 2002; 2004; Solmon et al. 2007) and one independent research team has conducted a study using schools in two unnamed states (Springer et al. 2008). The two studies by Schacter et al. relied on comparison groups that were small, self-selected samples. The more recent NIET report by Solmon et al. includes larger numbers of comparison schools and teachers, a total of 61 TAP and 285 non-TAP schools across six states. As with the two earlier reports, the comparison schools were chosen as a convenience sample and may not be representative of the outcomes that would have been realized in the TAP schools had they not adopted the
2
Chapter I: Overview
program. Because TAP schools are carefully selected and they typically volunteer to go through the many steps required to adopt the program, comparisons with non-selected schools could lead to biased program impact estimates.
Springer et al. are the first researchers not affiliated with the developer of TAP to provide estimates of program impacts. The authors used a panel data set of math scores including TAP and non-TAP schools from two states and found positive impacts for elementary grades, but undetectable or negative impacts at middle and high school grades. Importantly, the Springer et al. report presents evidence of selection effects, which is not surprising given the screening and self-selection that must take place for a school to adopt TAP. To become a TAP school, the faculty must vote to adopt the program, must typically raise substantial funds to finance the bonus pool, and often must be found worthy of the investment by NIET or a state or local sponsor.
To address these issues of selection bias, we designed a randomized experiment to estimate the impacts of Chicago TAP. School officials had to apply to become a TAP school, and the selection process involved an initial application, site visits by TAP and CPS staff, a faculty vote (with at least 75 percent approval), and a successful final application with responses to essay questions. Of the 16 elementary schools selected by district officials as finalists, we randomly assigned 8 to a treatment group that began implementing TAP in 2007-2008 and the other 8 to a control group that delayed implementation until 2008-2009.1 This report presents data from student test score files, a teacher survey, a set of principal interviews, and teacher administrative records for the treatment schools and the control schools. The pool of schools to randomize was small and therefore, even with randomization, it may be difficult to distinguish real differences from chance differences, so to complement the experimental analysis we created a comparison sample of 18 additional schools by matching them according to size, average teacher experience, and student demographics to the TAP schools. For context, we also report some information on the remaining elementary schools in CPS (approximately 400 schools). The research design calls for randomly assigning the third and fourth cohorts of TAP schools in a similar fashion in 2009, drawing another matched comparison (MC) sample, and following those schools as well.
This report provides evidence from this randomized experiment on the impacts of Chicago TAP in its first year for the first cohort of schools. We found that teachers in TAP schools reported receiving significantly more mentoring support than teachers in similar non-TAP (control) schools. This would reflect the fact that the TAP model includes Mentor Teachers and weekly cluster group meetings. Veteran teachers in TAP schools reported providing support to their colleagues at levels consistent with TAP program expectations.
1 All 16 schools had grades K-8, referred to in CPS as elementary schools. In addition, the district
purposively assigned 2 high schools and 2 charter schools to implement TAP—one of each beginning in 2007 and the others in 2008. We excluded high schools and charter schools from this report because random assignment was not possible and their data were not comparable. However, we will discuss charters and high schools in a future report.
3
Chapter I: Overview
However, their control group counterparts also reported providing similar levels of mentoring and other supports, with the possible exception of TAP’s veteran teachers writing more evaluations of their fellow teachers. This analysis was meant to identify whether teacher leadership roles that are explicitly built into the TAP model result in true differences from usual practice. Teachers in TAP schools (veteran and novice) had compensation expectations in line with program policies. That is, the average expectation was $1,900 and the actual amount available in the bonus pool was an average of $2,000 per teacher. The relationship between a teacher’s expected performance bonus amount and the average amount in the bonus pool may reflect teachers’ estimation of how their own performance will be judged.
An internal implementation study by CPS (Foster 2008), used stakeholder surveys and focus groups to document the degree to which staff in TAP schools understood the program, were finding it helpful, and implemented it faithfully. The study reported that teachers required time to see the “big picture” of TAP and that their understanding of the program evolved over the year, but the majority of teachers participated in the cluster activities focusing on learning new skills, such as seeing a demonstration by an expert teacher and receiving feedback from a colleague or mentor. The study also found that teachers reported TAP coaching to be more frequent than in the previous year and the professional development delivered through TAP was perceived as more effective than other forms of professional development.
While the introduction of TAP led to reported changes inside the school, these changes did not produce measurable impacts on student achievement or teacher perceptions as of the end of the first year of the program. The average scores on the Illinois Standards Assessment Test (ISAT) in math and reading for students in grades four through eight, the grades for which complete data were available, did not rise any faster in the TAP schools than in the control schools, nor did they rise faster than an alternative comparison group of schools that we formed by matching TAP with non-TAP schools on background characteristics. The teachers in TAP schools did not report significantly higher satisfaction or more positive attitudes toward their principals than did control teachers.
Using CPS administrative data on teachers, we found a positive impact of TAP on teachers’ decision to return to their schools (an impact of 5 percentage points), but no detectable impact on their decision to return to CPS. The school retention impact was over 9 points for teachers in nontested grades. We did not find any differences in the background characteristics of teachers who were retained by TAP relative to comparison schools.
The remainder of this report presents these findings in more detail. Chapter II discusses the methods and data used and describes the characteristics of students and teachers in our sample. Chapter III assesses the first year of Chicago TAP implementation by describing differences in support practices, professional development activities, and compensation expectations between TAP and control schools. In Chapter IV, we present the impacts of the first year of TAP implementation on student achievement, teacher retention, and stakeholder perceptions. Chapter V concludes by summarizing the findings, noting important caveats and limitations, and discussing next steps.

This page has been intentionally left blank for double-sided copying.

C H A P T E R I I
M E T H O D S A N D D A T A
A. METHODS
The evaluation relies on the random assignment of 16 pre-selected2 K-8 schools to either a treatment group that began implementing TAP in 2007 or to a control group that began implementing TAP in 2008, and did not implement the program during the 2007-2008 school year. We also collected data on two high schools and two charter schools, one of each of which were assigned by CPS to begin TAP implementation in 2007 and the others to begin in 2008. Because the charter and high schools were not randomly assigned, we focus the report on CPS elementary (K-8) schools.
The schools were not assigned with equal probability to treatment and control groups. Some schools were thought by the district to be more ready to implement the program. To accommodate the preference for schools of greater readiness, we had the program manager rate each prospective school as A, B, or C, with A being most ready and C being least ready. We then assigned to the treatment group the schools in group A with the highest probability (three out of four), group B with the next highest probability (three out of seven), and group C with the lowest probability (two out of five). Unless stated otherwise, all estimates in this report are weighted to reflect the unequal treatment assignment probabilities (where weights are the inverse of the assignment probabilities) so they represent the original sample. Matched comparison schools are assigned a weight of .50 where such weights are used.
To increase statistical precision, we randomized schools in such a way as to balance school size, the predominant race/ethnicity of the student population, and geographic area in which the school was located. The method is based on constrained minimization (see Glazerman et al. 2006). Specifically, we imposed constraints on the randomization that required the largest and smallest school (in terms of student enrollment) to be in the same TAP cohort (treatment or control), prevented the three schools with a student body that was not predominantly African American from being in the same cohort, and prevented either
2 The schools had been pre-selected by CPS using a series of school information sessions, initial interest
applications, and site visits to assess staff’s ability and readiness to benefit from the program.
6
Chapter II: Methods and Data
cohort from having more than one pair of schools from the same geographic area of the city.
To strengthen the study, we also collected data on a group of 18 other K-8 schools with similar characteristics as the 16 treatment and control schools selected by CPS to be in the TAP program. The matched comparison procedure was a “nearest-neighbor propensity score match, without replacement.” That means that we listed the observable factors that predict selection into the TAP finalist pool (treatment or control) and used them to predict the probability of being in that pool using a logistic regression model. The factors used in the matching were: average baseline math and reading scores, enrollment, percent limited English proficient, percent low income (free/reduced price lunch), percent African American, and percent Hispanic. The predicted probability (“propensity score”) from this model was used to rank all the schools sequentially along a number line, and each TAP school (cohort 1 or cohort 2) was matched to its nearest neighbors (the schools with lowest distance in absolute value from that school).
Once the schools were assigned to groups and the matched comparison sample was identified, we collected data on students, teachers, and schools and compared mean outcomes for the TAP schools (treatment) to each of the potential comparison groups. We focus here primarily on results from the randomized control (RC) group, but present comparisons of TAP schools to the matched comparison (MC) group in Appendix A. In general, the RC comparison is the most useful because randomization assures that unobservable school characteristics are not systematically related to (and thereby confounded with) program status. However, in the case of teacher retention outcomes, we place more weight on the MC group because teachers in RC schools would have known that their schools were to implement TAP in the following year. As a result, their retention rates might be higher or lower than they would have been in the absence of the program. Throughout this report, we use the term “control” to refer to RC schools or teachers and “comparison” to refer to all others (MC or all other CPS schools).
In addition to this matched comparison sample, we used administrative data for all (approximately 400) K-8 schools in the district, including TAP, randomized control, matched comparison, and all other schools. These data are used for context only because the entire population of schools includes many that differ from TAP schools in unobservable ways.
When presenting outcomes in this report, we typically show “regression-adjusted” means. A regression adjusted mean for a particular group (e.g. TAP schools) represents a predicted average outcome for the entire analysis sample (including non-TAP schools), if everyone had been assigned to that group (TAP). The prediction is based on a regression model—a linear model for continuous outcomes and a logistic model for dichotomous outcomes—that controls for a range of teacher or student characteristics, listed below. Regression-adjusted means have the useful property that their difference equals the impact estimate, although they do typically differ slightly from the unadjusted mean.

7
Chapter II: Methods and Data
Regression-adjusted means can be illustrated with an example. The regression-adjusted mean test score in reading was 220.6 for students in TAP schools when we used the sample that included only TAP and control schools. When we compared TAP to matched comparison schools, we obtained a regression-adjusted mean outcome in the treatment condition of 223.3 points on the reading ISAT. The discrepancy of 2.7 points simply represents the difference in the types of students who happened to be in each sample, neither of which is incorrect, and does not affect the impact estimate, which remains unbiased.
For teacher survey analyses, the regression model controlled for teacher education (having a master’s or higher degree), pathway to teaching (having alternative certification), advanced certification (National Board certification), grade assignment (teaching a tested subject in grades four through eight), experience, gender, race/ethnicity, and whether the teacher ever attended CPS as a student. For student test score analyses we controlled for family poverty (eligibility for free/reduced-price lunch), special needs (whether an individualized education plan was in place), language (whether limited English proficient), race/ethnicity, grade level, and over normal age for a grade. We accounted for the clustering of students or teachers within schools by estimating robust standard errors. In addition, we conducted numerous sensitivity tests to determine whether the results were robust to the choice of regression model or any other decisions. Those tests are described in more detail in the discussion of findings.
B. DATA
The study’s data fall into two categories: (1) data collected directly from teachers and principals in the sampled schools by Mathematica Policy Research, Inc. (MPR), and (2) administrative data provided by CPS. In the first category, MPR administered a questionnaire to teachers and interviewed school principals. In the second category, we collected student assessment data from CPS student testing records and information on teachers from CPS human resources records.
Teacher Survey. In the spring of 2008 a questionnaire was administered to all eligible teachers in the sample. We included all sampled schools’ teachers who had a program code identifying him or her as a regular classroom teacher. The questionnaire gathered data from teachers that were not available in the CPS administrative records. It included six sections focusing on (1) teachers’ educational background and professional experience, their certification status, and their current teaching assignment; (2) the types of professional development and support that teachers receive at their schools; (3) the leadership roles and responsibilities teachers have assumed in addition to their regular classroom teaching duties; (4) the compensation, or potential for compensation, that teachers receive for their performance and that of their students; (5) teachers’ attitudes and satisfaction with various aspects of their school and the opportunities provided to them; and (6) teachers’ basic demographic characteristics.
We mailed the questionnaire to teachers at their schools in mid-March, and continued collecting responses through mid-September, either as self-administered paper questionnaires returned by the teachers or through telephone interviews. Of the 765 eligible
8
Chapter II: Methods and Data
teachers, 494 completed the survey, for a final response rate of 65 percent (66 percent for treatment, 67 percent for control, and 63 percent for matched comparison teachers). Nonresponse adjustment weights were used in all analyses to account for any observable differences between respondents and nonrespondents. We computed the nonresponse adjustment weights using school characteristics such as principal’s experience level; percent of teachers with a master’s degree; years since the school last made Adequate Yearly Progress; and percentages of students who were limited English proficient, truant, low-income, African American, and Hispanic.
Administrative Teacher Data. Administrative records data on teachers’ credentials, teachers’ years of service in the district, and teaching assignment were provided to us by the CPS department of human resources. CPS provided data for the 2006-2007 through 2008-2009 school years and the study aims to request similar data in future years.
There are some tradeoffs involved with the choice of the teacher administrative data and our survey of teachers. The CPS data cover more teachers than the survey, but only has a few variables. The teacher survey has more detailed questions covering more topics, can capture more nuance, and was tailored to this study. However, the survey data set has fewer observations than the CPS administrative data set because the survey only pertains to teachers in study schools (TAP, control, and matched comparison), selected teaching assignments (classroom teachers in academic subjects), and has missing data due to nonresponse.
Principal Interviews. Both TAP and control principals were interviewed to gather data about topics relevant to the goals of TAP. The interview explored five general topics: (1) the principal’s report on the general school context (organization of classes and teacher collaboration, special policy initiatives, governance issues, and crises that may have occurred during the year); (2) teacher hiring and assignment procedures; (3) teacher evaluation and supervision; (4) teacher mobility; and (5) principal background characteristics.
Each principal received a letter in late September inviting participation in the interview. The following week each received a phone call to schedule an appointment for the 30-45 minute telephone interview. The researchers continued contacting principals through December. Of the 20 principals, 18 completed the interview and two declined to participate, for a final response rate of 90 percent. Both of the refusals were CPS elementary schools, which were the focus of this report, so the response rate for just CPS elementary was 16 of 18, or 89 percent. Since both refusals were TAP schools, the response rates were 75 percent for TAP and 100 percent for control.
Student Achievement Data. We obtained student assessment data on tests routinely collected by CPS. These data included students’ scores on state assessments in mathematics and reading for grades three through eight. In addition, we obtained data on student background information, such as race, gender, free/reduced-price lunch eligibility, enrollment status, and disability or special education status. CPS provided these data for the 2006-2007 and 2007-2008 school years and we will request future years of data through at least 2010-2011.

9
Chapter II: Methods and Data
C. SAMPLE CHARACTERISTICS
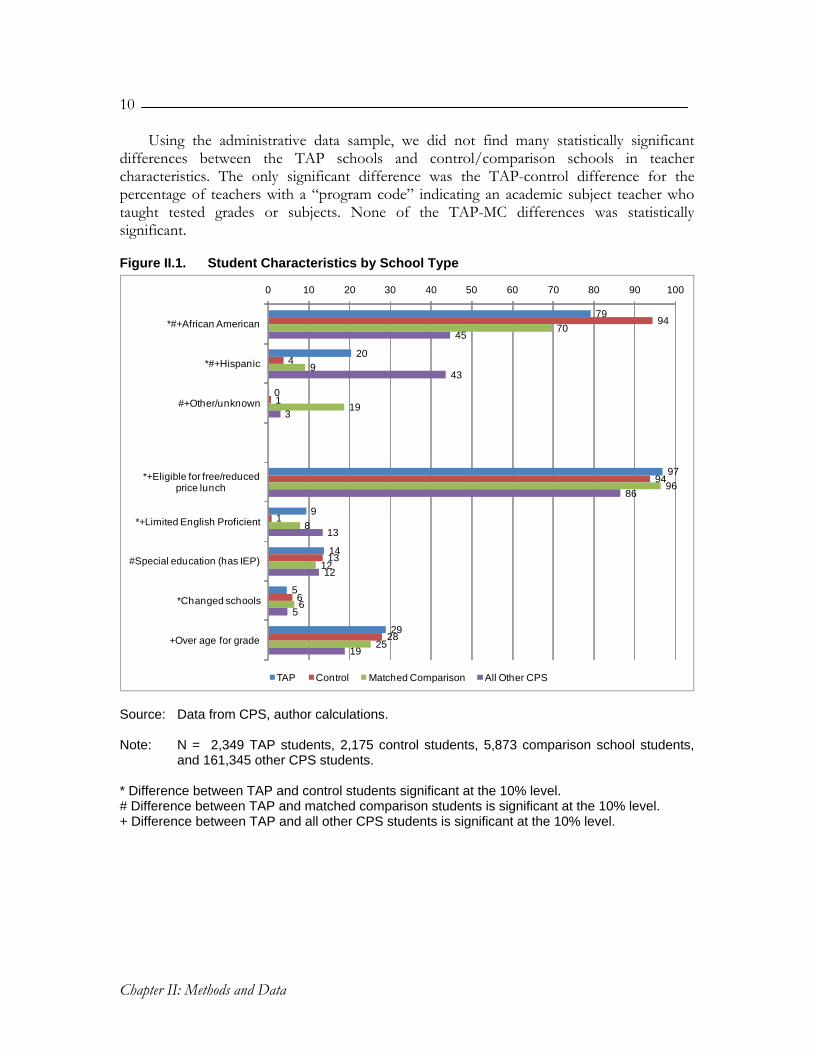
Figures II.1 through II.4 show the characteristics of the students and teachers in the study. The statistics are presented by treatment condition, with students and teachers in TAP schools compared to their counterparts in randomized control schools, matched comparison schools, and in the case of student data, all other regular K-8 schools in the district. We present tests of statistical significance of the difference of each comparison group from the TAP group, but readers should form their own opinions about the similarity in baseline characteristics of the groups being compared based on the size of the differences. A great degree of similarity in these observable student and teacher characteristics is reassuring, but not necessary for unbiased estimation of the impacts of TAP. What is required is that the groups are similar in terms of unobserved determinants of student achievement growth and teacher retention.
Figure II.1 shows the balance in terms of race/ethnicity and family income, proxied by eligibility for free or reduced price lunch. The control schools had significantly more African American and fewer Hispanic students than TAP schools. Some difference along this dimension was unavoidable even with random assignment (or any assignment rule) because there were only three schools that were not majority African-American and three cannot be divided evenly between two groups. Given the great overlap between Hispanic and limited English proficient (LEP) students, the control schools had fewer LEP students as well. The percentages of students with low family income (percent eligible for free/reduced-price lunch) was more than 90 percent in the TAP, control, and comparison groups, although the TAP-control difference (97 versus 94 percent) was statistically significant.
Baseline test scores for students in TAP schools were statistically indistinguishable from those corresponding to control or comparison schools (Figure II.2). The average ISAT scores for the study population (TAP and non-TAP) were significantly different from scores district-wide, with the levels differing by nine points for both math and reading.3 We treated the ISAT scores as being vertically scaled, which means that a one-unit change for students in grade 3 has the same interpretation as a one-unit change for students in grade 8. The standard deviations of the scores in the CPS student population were 33 points for math and 30 points for reading. Thus differences can be expressed in terms of percentages of a standard deviation, or effect size, which has meaning beyond the CPS context.
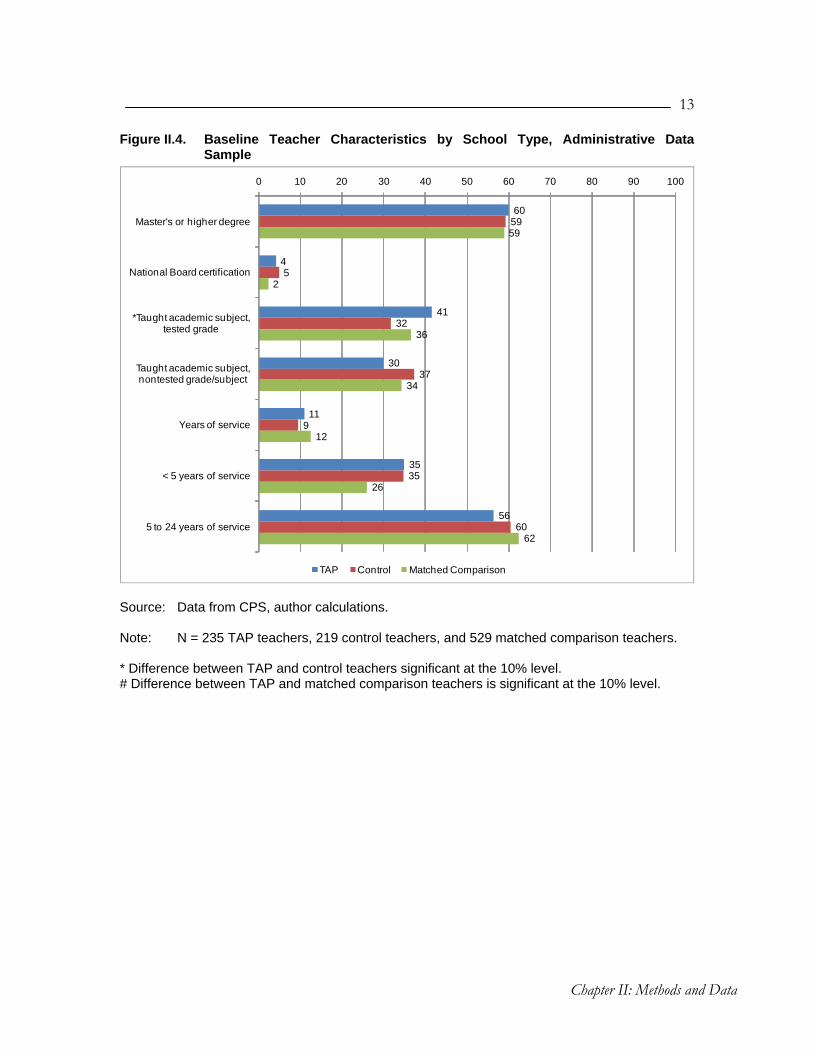
We measured teacher characteristics using two data sources mentioned above: the teacher survey and CPS administrative records. In the survey sample, none of the TAP-control differences in teacher characteristics (shown in Figure II.3) was statistically significant. None but the teacher gender difference between TAP and matched comparison schools was significant. MC schools had 17 percent male teachers compared to 8 percent for TAP schools.
3 The extent to which the study population (TAP and control schools) differ from schools district-wide
simply reflects the selection process for the Chicago TAP program. That selection process was purposive, not intending to be statistically representative of the entire district.
10
Chapter II: Methods and Data
Using the administrative data sample, we did not find many statistically significant differences between the TAP schools and control/comparison schools in teacher characteristics. The only significant difference was the TAP-control difference for the percentage of teachers with a “program code” indicating an academic subject teacher who taught tested grades or subjects. None of the TAP-MC differences was statistically significant.
Figure II.1. Student Characteristics by School Type
79
20
0
97
9
14
5
29
94
4
1
94
1
13
6
28
70
9
19
96
8
12
6
25
45
43
3
86
13
12
5
19
0 10 20 30 40 50 60 70 80 90 100
*#+African American
*#+Hispanic
#+Other/unknown
*+Eligible for free/reduced price lunch
*+Limited English Proficient
#Special education (has IEP)
*Changed schools
+Over age for grade
TAP Control Matched Comparison All Other CPS
Source: Data from CPS, author calculations. Note: N = 2,349 TAP students, 2,175 control students, 5,873 comparison school students,
and 161,345 other CPS students. * Difference between TAP and control students significant at the 10% level. # Difference between TAP and matched comparison students is significant at the 10% level. + Difference between TAP and all other CPS students is significant at the 10% level.

11
Chapter II: Methods and Data
Figure II.2. Average Baseline Student Test Scores by School Type
207
220
205
217
210
224
216
229
0 50 100 150 200 250
+ISAT 2007 Reading
+ISAT 2007 Math
TAP Control Matched Comparison All Other CPS
Source: Data from CPS, author calculations Note: N = 1,746 TAP students, 1,755 control students, 4,412 comparison school students,
and 111,345 students in other CPS schools. * Difference between TAP and Control students significant at the 10% level. # Difference between TAP and Matched Comparison students is significant at the 10% level. + Difference between TAP and All Other CPS students is significant at the 10% level.

12
Chapter II: Methods and Data
Figure II.3. Baseline Teacher Characteristics by School Type, Survey Sample
Source: MPR 2008 CPS Teacher Survey. Note: N = 114 TAP teachers, 101 control teachers, and 236 matched comparison teachers. * Difference between TAP and control teachers is significant at the 10% level. # Difference between TAP and matched comparison teachers is significant at the 10% level.
13
Chapter II: Methods and Data
Figure II.4. Baseline Teacher Characteristics by School Type, Administrative Data Sample
60
4
41
30
11
35
56
59
5
32
37
9
35
60
59
2
36
34
12
26
62
0 10 20 30 40 50 60 70 80 90 100
Master's or higher degree
National Board certification
*Taught academic subject, tested grade
Taught academic subject, nontested grade/subject
Years of service
< 5 years of service
5 to 24 years of service
TAP Control Matched Comparison
Source: Data from CPS, author calculations. Note: N = 235 TAP teachers, 219 control teachers, and 529 matched comparison teachers. * Difference between TAP and control teachers significant at the 10% level. # Difference between TAP and matched comparison teachers is significant at the 10% level.

This page has been intentionally left blank for double-sided copying.
C H A P T E R I I I
I M P L E M E N T A T I O N
o understand the first year of implementation of Chicago TAP we compared how teacher development and compensation practices in TAP schools differ from practices normally implemented in Chicago public schools. Specifically, we describe
how prevalent mentoring, teacher-leader roles, observation of teacher practice and feedback, professional development, and performance-based compensation were among teachers in treatment (TAP) and control schools. Using specific practices as outcomes, we present regression-adjusted means for the treatment and control schools. The control school means enable us to characterize the counterfactual condition—that is, the experiences that would have occurred in the absence of TAP. We performed t-tests to assess the extent to which practices in TAP schools differed significantly from practices that occurred in non-TAP schools. Similar findings were obtained when we used a matched comparison sample of schools. Those results are presented in Appendix A.
T
A. MENTORING, LEADERSHIP, AND FEEDBACK
Overall, we found that mentoring, leadership, and feedback occurred in both TAP and non-TAP schools, but TAP schools tended to have more planned time for these activities. Compared to control teachers, treatment teachers reported spending more scheduled time receiving guidance from an advisor. Veteran teachers in treatment schools had more release time for mentoring activities than veteran teachers in control schools, but we found few other statistically significant differences between the two groups in the leadership they provided. Treatment teachers spent more formal, scheduled time being observed and receiving feedback. There were no significant differences in informal contact or observation.
1. Mentoring Received
TAP incorporates mentoring into the regular school day through ongoing classroom support provided by Master Teachers, known as Lead Teachers in Chicago, and Mentor Teachers. Teachers meet weekly in small “cluster” groups led by Lead or Mentor Teachers to collaborate on improving their instruction and increasing student achievement. Mentor Teachers are also assigned to specific traditional classroom teachers to assist them in their professional development (NIET 2008).

16
Chapter III: Implementation
According to teachers, mentoring was prevalent in both TAP and non-TAP schools (see Table III.1). Nearly 100 percent of treatment teachers and 98 percent of control teachers reported having at least one advisor from whom they received professional advice and direct assistance in their teaching duties during the 2007-2008 school year. However, we found several meaningful differences suggesting that teachers in TAP schools received significantly more mentoring support than teachers in non-TAP schools.
Table III.1. Mentoring Received
Outcome TAP
Meana Control Meana Difference
Standard Error
Received Professional Advice and Assistance in Teaching Duties from an Advisor (percentage)
99.8 97.8 2.0*** 0.59
Had an Advisor Who Was a… (percentage)
Mentor 73.6 14.2 59.3*** 6.21 Literacy coach 45.0 40.9 4.1 17.67 Math coach 8.2 5.7 2.4 4.25 Lead teacher 77.6 9.4 68.2*** 4.57 Principal 63.8 31.9 31.9*** 8.80 Assistant or vice principal 30.9 18.3 12.6 11.11
Had a Main Advisor Who Was a... (percentage)
Full-time teacher 62.1 29.8 32.3*** 7.51 Person who works in your school only 79.6 57.6 21.9*** 6.61 Person who works in more than one school 1.9 2.5 -0.5 1.82 Teacher with release time 42.4 13.4 29.0*** 7.47 Person with no classroom teaching 44.4 46.3 -1.8 15.34 Principal or school administrator 6.0 8.8 -2.8 4.04 School-based specialist 20.9 24.0 -3.2 10.54
Time Spent with Main Advisor
Frequency of scheduled meetings (number per week) 1.4 0.8 0.6*** 0.17 Duration of each scheduled meeting (minutes) 62.8 42.0 20.8*** 5.90 Duration of informal contact (minutes per week) 75.1 80.8 -5.7 28.40 Total scheduled and informal contact time (minutes per week)
162.0 127.1 34.9 34.96
During Most Recent Full Week, Scheduled Time Main Advisor Spent… (minutes)
Observing your teaching 29.6 8.2 21.4*** 3.75 Meeting with you one-to-one 31.6 19.0 12.6** 5.27 Meeting with you together with other teachers 55.4 33.7 21.8*** 5.59 Modeling a lesson 22.8 8.6 14.2*** 4.37 Co-teaching a lesson 9.5 3.2 6.3* 3.14
Received Useful Feedback from Main Advisor (percentage)
92.7 72.1 20.6*** 4.21
Note: N = 202 to 214 teachers per outcome. a Means are regression-adjusted. * TAP-control difference is statistically significant at the 10% level. ** TAP-control difference is statistically significant at the 5% level. *** TAP-control difference is statistically significant at the 1% level.

17
Chapter III: Implementation
There were significant differences in the type of individuals from whom teachers receive advice and assistance. Compared to control teachers, treatment teachers were more likely to receive guidance from an individual they characterized as a mentor (74 percent versus 14 percent), a lead teacher (78 percent versus 9 percent), or a principal (64 percent versus 32 percent). Eighty percent of treatment teachers indicated that their main advisor worked only in their school compared to 58 percent of control teachers. Having a mentor in the building, which is the aim of the TAP model, may provide more opportunities for assistance on demand than would itinerant mentors. The main advisors of treatment teachers were also significantly more likely to be full-time teachers (62 percent versus 30 percent) and to receive release time from classroom teaching in order to perform their mentoring duties (42 percent versus 13 percent). These findings are consistent with the TAP program model, in which Mentor and Lead Teachers are given release time to work with traditional classroom teachers in their schools.
Teachers in TAP schools reported more frequent and longer scheduled meetings and activities with their main advisor. On average, treatment teachers had 1.4 scheduled meetings per week with their main advisor compared to 0.8 scheduled meetings per week for control teachers, with the average meeting for treatment teachers lasting 21 minutes longer (63 minutes versus 42 minutes). Both one-on-one and small group meetings with their main advisors were of greater duration for treatment teachers than control teachers during the most recent full week of teaching. Compared to control teachers, treatment teachers also spent more scheduled time in the most recent full week being observed teaching by their main advisor (30 minutes versus 8 minutes), having their main advisor model a lesson (23 minutes versus 9 minutes), and co-teaching a lesson with their main advisor (10 minutes versus 3 minutes). We did not find statistically significant impacts of TAP on minutes of informal contact or on total time spent with the main advisor each week.
TAP also increased the likelihood of teachers receiving feedback they deemed useful. Ninety-three percent of treatment teachers reported receiving useful feedback from a main advisor, compared to 72 percent of control teachers.
2. Leadership Roles Held
TAP offers teachers opportunities to take on leadership responsibilities and earn extra pay through multiple career paths. Teachers can become Mentor or Lead Teachers who serve on the TAP leadership team responsible for the overall implementation of TAP, analyze student data, and develop academic achievement plans. In addition, Mentor and Lead Teachers support the professional development of traditional classroom teachers, known as Career Teachers. Responsibilities of these teacher-leaders include leading cluster groups, observing and evaluating Career Teachers, team teaching with colleagues, and modeling lessons. Mentor Teachers provide day-to-day mentoring and coaching to Career Teachers. Sharing leadership and authority with the principal, additional responsibilities of Lead Teachers include overseeing the professional development of both Mentor and Career Teachers (NIET 2008).

18
Chapter III: Implementation
The Chicago TAP model calls for providing Mentor and Lead Teachers with release time from classroom teaching in order to fulfill their leadership responsibilities. TAP schools are expected to provide Mentor Teachers with one to five hours of student-free time per week outside of cluster meetings. The model recommends that Lead Teachers teach two hours per day and devote the remainder of their work day to Lead Teacher responsibilities.
Measuring the impact of Lead and Mentor Teachers is complicated by the fact that these positions have no clear analogue in non-TAP schools. Therefore, our approach was to measure for each school the amount of leadership and mentoring provided by teachers who could plausibly have played similar roles as Lead and Mentor Teachers. We focused on veteran teachers, whom we defined as having at least five years of experience as a head classroom teacher. This experience cutoff roughly approximates the minimum experience levels required to become Mentor or Lead teachers for the first year of implementation. Chicago TAP requirements for these teacher-leader roles included a minimum of four years of teaching experience for Mentor Teachers; Lead Teachers had to have at least six years of successful teaching, with at least four years as a classroom teacher (NIET 2008). If one Mentor Teacher is assigned to each group of 8 Career Teachers and one Lead Teacher is assigned to each group of 15 Career Teachers, then one might expect about 17 percent of all teachers to be providing leadership services in a TAP school. When we restrict the sample to veteran teachers, we expect the percentage to be higher. The goal of the analysis is to estimate that percentage for TAP and non-TAP schools.
As shown in Table III.2, veteran teachers in both TAP and non-TAP schools provided “formal mentoring services” to teachers in their schools that covered a range of topics. Though a higher percentage of veteran treatment teachers than veteran control teachers reported serving as mentors (40 percent versus 25 percent), the difference was not statistically significant. We found no statistically significant differences in the topics covered by veteran teachers in their mentoring activities.
We did, however, find a few significant differences in the time spent and the specific activities conducted as a mentor.4 Veteran teachers in TAP schools were significantly more likely than their control group counterparts to receive release time from their regular professional duties to perform their mentoring. Thirty-one percent of veteran TAP teachers received release time compared to four percent of veteran control teachers, with TAP teachers averaging nearly 3 more hours per week of release time (3.2 hours versus 0.2 hours). In addition, veteran TAP teachers reported spending about one hour more outside of their specified contract hours mentoring (2.4 hours versus 1.0 hours). TAP also affected the number of teachers mentored, with veteran TAP teachers mentoring about three teachers on
4 Readers should note that we conduct a large number of hypothesis tests, each of which has a probability
of falsely rejecting the null hypothesis of no difference (denoted as the significance level, usually 5 percent). When conducting large numbers of hypothesis tests, it is likely that at least some relationships will appear “statistically significant” purely by chance. For example, at a 5 percent significance level, 1 in 20 independent test results will appear statistically significant even if there is no underlying relationship. Therefore, isolated significant results are suggestive, but not conclusive evidence of a relationship.
19
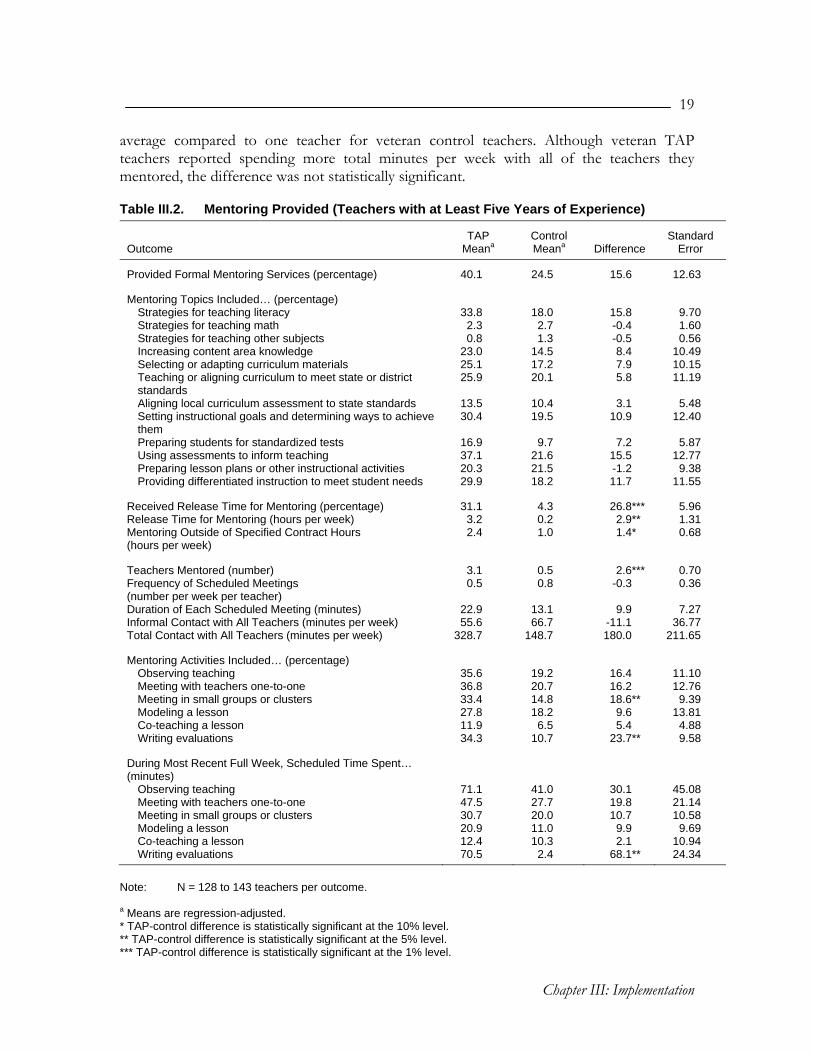
Chapter III: Implementation
average compared to one teacher for veteran control teachers. Although veteran TAP teachers reported spending more total minutes per week with all of the teachers they mentored, the difference was not statistically significant.
Table III.2. Mentoring Provided (Teachers with at Least Five Years of Experience)
Outcome TAP
Meana Control Meana Difference
Standard Error
Provided Formal Mentoring Services (percentage) 40.1 24.5 15.6 12.63
Mentoring Topics Included… (percentage)
Strategies for teaching literacy 33.8 18.0 15.8 9.70 Strategies for teaching math 2.3 2.7 -0.4 1.60 Strategies for teaching other subjects 0.8 1.3 -0.5 0.56 Increasing content area knowledge 23.0 14.5 8.4 10.49 Selecting or adapting curriculum materials 25.1 17.2 7.9 10.15 Teaching or aligning curriculum to meet state or district standards
25.9 20.1 5.8 11.19
Aligning local curriculum assessment to state standards 13.5 10.4 3.1 5.48 Setting instructional goals and determining ways to achieve them
30.4 19.5 10.9 12.40
Preparing students for standardized tests 16.9 9.7 7.2 5.87 Using assessments to inform teaching 37.1 21.6 15.5 12.77 Preparing lesson plans or other instructional activities 20.3 21.5 -1.2 9.38 Providing differentiated instruction to meet student needs 29.9 18.2 11.7 11.55
Received Release Time for Mentoring (percentage) 31.1 4.3 26.8*** 5.96 Release Time for Mentoring (hours per week) 3.2 0.2 2.9** 1.31 Mentoring Outside of Specified Contract Hours (hours per week)
2.4 1.0 1.4* 0.68
Teachers Mentored (number) 3.1 0.5 2.6*** 0.70 Frequency of Scheduled Meetings (number per week per teacher)
0.5 0.8 -0.3 0.36
Duration of Each Scheduled Meeting (minutes) 22.9 13.1 9.9 7.27 Informal Contact with All Teachers (minutes per week) 55.6 66.7 -11.1 36.77 Total Contact with All Teachers (minutes per week) 328.7 148.7 180.0 211.65
Mentoring Activities Included… (percentage)
Observing teaching 35.6 19.2 16.4 11.10 Meeting with teachers one-to-one 36.8 20.7 16.2 12.76 Meeting in small groups or clusters 33.4 14.8 18.6** 9.39 Modeling a lesson 27.8 18.2 9.6 13.81 Co-teaching a lesson 11.9 6.5 5.4 4.88 Writing evaluations 34.3 10.7 23.7** 9.58
During Most Recent Full Week, Scheduled Time Spent… (minutes)
Observing teaching 71.1 41.0 30.1 45.08 Meeting with teachers one-to-one 47.5 27.7 19.8 21.14 Meeting in small groups or clusters 30.7 20.0 10.7 10.58 Modeling a lesson 20.9 11.0 9.9 9.69 Co-teaching a lesson 12.4 10.3 2.1 10.94 Writing evaluations 70.5 2.4 68.1** 24.34
Note: N = 128 to 143 teachers per outcome. a Means are regression-adjusted. * TAP-control difference is statistically significant at the 10% level. ** TAP-control difference is statistically significant at the 5% level. *** TAP-control difference is statistically significant at the 1% level.
20
Chapter III: Implementation
Regarding mentoring activities, TAP teachers were significantly more likely to write evaluations. Veteran TAP teachers spent, on average, more than one hour of scheduled time writing evaluations during their most recent week of teaching compared to two minutes spent by veteran control teachers. We also found that veteran TAP teachers were more likely to meet with teachers in small groups (33 percent versus 15 percent), but the difference in scheduled time spent in small group meetings was not statistically significant. We did not find significant differences between TAP and non-TAP schools in the likelihood of veteran teachers observing other teachers, meeting with teachers one-on-one, modeling a lesson, or co-teaching a lesson as part of their mentoring responsibilities.
We found few significant differences between TAP and non-TAP schools in the percentage of veteran teachers having leadership roles or responsibilities other than mentoring (see Table III.3). Overall, about half of both veteran TAP teachers and veteran control teachers reported having such leadership tasks. Compared to veteran control teachers, veteran TAP teachers were more likely to provide professional development activities (28 percent versus 16 percent), but were less likely to serve as a grade-level lead teacher (4 percent versus 17 percent) or to serve on a school-wide committee or task force (3 percent versus 7 percent). We found that veteran TAP teachers were more likely than control teachers to receive a pay increase in association with their non-mentoring leadership roles and responsibilities, though few teachers in either group reported receiving such a pay raise.
3. Observation and Feedback
As part of establishing instructionally focused accountability, the Chicago TAP model calls for observations of teachers conducted by the TAP leadership team, which consists of the principal, Lead Teachers, and Mentor Teachers. During the first year of implementation, the program model allows for practice observations during the first semester and prescribes at least two official observations during the second semester, with the official observations to be used in determining performance-based compensation (Chicago Board of Education and Chicago Teachers Union 2007; NIET 2008).
We found that TAP led to more frequent observations by teachers in leadership roles than occurred in control schools (see Table III.4). During the 2007-2008 school year, teachers in treatment schools were observed, on average, more than three times by a mentor, coach, or lead teacher, compared to about two observations by such teacher-leaders among teachers in control schools. However, the frequency of observations by school administrators was similar in the two groups.

21
Chapter III: Implementation
Table III.3. Other Leadership Roles and Responsibilities (Teachers with at Least Five Years of Experience)
Outcome TAP
Meana Control Meana Difference
Standard Error
Had Other Leadership Roles or Responsibilities Beyond Mentoring (percentage)
48.7 51.0 -2.3 7.13
Other Leadership Roles Included… (percentage)
Being a grade-level lead teacher 4.4 17.0 -12.6*** 4.79 Being on a school improvement team 10.4 12.9 -2.5 6.25 Being on a school-wide committee/task force 3.4 7.0 -3.6* 2.04
Other Leadership Responsibilities Included… (percentage)
Developing curriculum 4.2 4.3 -0.1 1.86 Reviewing/selecting curriculum 5.1 5.9 -0.8 2.38 Providing input on improving facilities/tech 3.2 5.4 -2.2 1.93 Providing professional development activities 28.0 15.9 12.1*** 4.30 Developing standards 3.4 2.9 0.5 1.29
Associated with These Other Leadership Roles and Responsibilities, Received… (percentage)
Credit toward certification 0.7 1.6 -0.9 1.02 Pay increase 1.7 0.4 1.3* 0.67
Note: N = 142 to 145 teachers per outcome. a Means are regression-adjusted. * TAP-control difference is statistically significant at the 10% level. ** TAP-control difference is statistically significant at the 5% level. *** TAP-control difference is statistically significant at the 1% level.
Table III.4. Observation and Feedback
Outcome TAP
Meana Control Meana Difference
Standard Error
Frequency of Observation (number in 2007-2008) Observation by principal or assistant principal 2.5 2.6 0.0 0.29 Observation by mentor, coach, or lead teacher 3.3 1.9 1.5*** 0.42
Frequency of Feedback (number in 2007-2008)
Feedback as part of a formal evaluation 2.7 1.8 0.9** 0.31 Feedback outside of a formal evaluation 2.8 2.6 0.2 0.31 Feedback on lesson plans 1.9 1.8 0.2 0.34
Note: N = 203 to 206 teachers per outcome. a Means are regression-adjusted. * TAP-control difference is statistically significant at the 10% level. ** TAP-control difference is statistically significant at the 5% level. *** TAP-control difference is statistically significant at the 1% level.
22
Chapter III: Implementation
Teachers in TAP schools also reported receiving more frequent feedback as part of a formal evaluation. TAP teachers averaged about one more occurrence of formal evaluation feedback than control teachers (2.7 occurrences versus 1.8 occurrences).5 We found no significant differences in the frequency of receiving feedback outside of evaluations or of feedback specifically pertaining to lesson plans.
B. PROFESSIONAL DEVELOPMENT
TAP aims to provide ongoing applied professional growth to teachers through school-based professional development during the school day. Through weekly cluster meetings as well as other interactions among Lead and Mentor Teachers and Career Teachers, the program seeks to provide opportunities to collaborate on improving the quality of their instruction and to learn new research-based instructional strategies for increasing academic achievement.
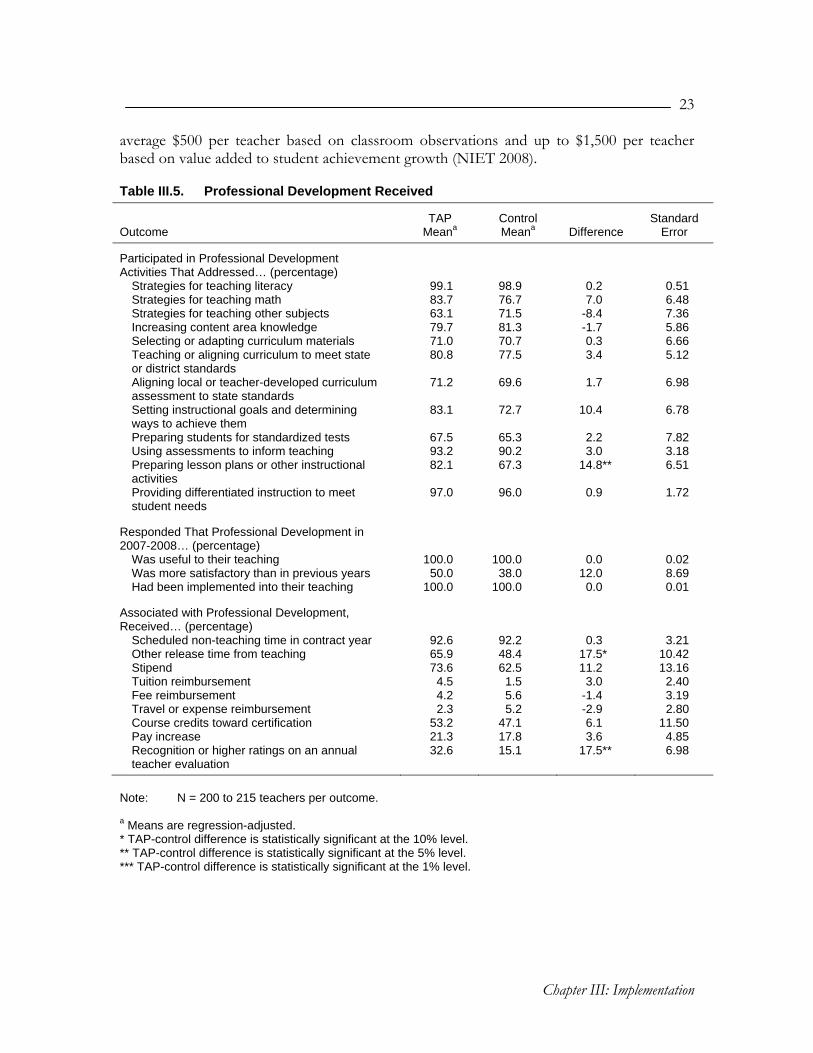
We found few significant differences in professional development received by treatment and control teachers (see Table III.5). The majority of both groups of teachers participated in professional development activities addressing a range of topics. The only statistically significant difference in topic areas covered occurred for preparing lesson plans or other instructional activities: 82 percent of TAP teachers received professional development on this topic compared to 67 percent of control teachers.
Nearly all teachers in both groups characterized their professional development activities as useful and folded what they learned into their teaching. Though a higher percentage of treatment than control teachers reported being more satisfied with professional development in the 2007-2008 school year than in previous years (50 percent versus 38 percent), the difference was not statistically significant. We did not find a pattern of significant differences between TAP and non-TAP schools in the extent to which teachers received compensation or benefits in association with professional development activities.
C. COMPENSATION
The TAP model can affect teacher pay through two routes: (1) multiple career paths (bonuses for serving as Mentor or Lead Teacher) and (2) performance-based compensation (bonuses for scoring high marks on classroom observations and/or classroom- and school-level value added). Chicago TAP Lead and Mentor Teachers receive an additional $15,000 and $7,000, respectively, as compensation for assuming more responsibility. Performance-based compensation provides bonuses to teachers who demonstrate their skills through classroom evaluations and who increase their students’ academic achievement growth over the course of the year. In the first year of implementation, 25 percent of the performance award was to be based on teacher performance as assessed through classroom observations and 75 percent on school-wide student achievement growth. Payments were expected to
5 Responses were top-coded at five occurrences during the school year.
23
Chapter III: Implementation
average $500 per teacher based on classroom observations and up to $1,500 per teacher based on value added to student achievement growth (NIET 2008).
Table III.5. Professional Development Received
Outcome TAP
Meana Control Meana Difference
Standard Error
Participated in Professional Development Activities That Addressed… (percentage)
Strategies for teaching literacy 99.1 98.9 0.2 0.51 Strategies for teaching math 83.7 76.7 7.0 6.48 Strategies for teaching other subjects 63.1 71.5 -8.4 7.36 Increasing content area knowledge 79.7 81.3 -1.7 5.86 Selecting or adapting curriculum materials 71.0 70.7 0.3 6.66 Teaching or aligning curriculum to meet state or district standards
80.8 77.5 3.4 5.12
Aligning local or teacher-developed curriculum assessment to state standards
71.2 69.6 1.7 6.98
Setting instructional goals and determining ways to achieve them
83.1 72.7 10.4 6.78
Preparing students for standardized tests 67.5 65.3 2.2 7.82 Using assessments to inform teaching 93.2 90.2 3.0 3.18 Preparing lesson plans or other instructional activities
82.1 67.3 14.8** 6.51
Providing differentiated instruction to meet student needs
97.0 96.0 0.9 1.72
Responded That Professional Development in 2007-2008… (percentage)
Was useful to their teaching 100.0 100.0 0.0 0.02 Was more satisfactory than in previous years 50.0 38.0 12.0 8.69 Had been implemented into their teaching 100.0 100.0 0.0 0.01
Associated with Professional Development, Received… (percentage)
Scheduled non-teaching time in contract year 92.6 92.2 0.3 3.21 Other release time from teaching 65.9 48.4 17.5* 10.42 Stipend 73.6 62.5 11.2 13.16 Tuition reimbursement 4.5 1.5 3.0 2.40 Fee reimbursement 4.2 5.6 -1.4 3.19 Travel or expense reimbursement 2.3 5.2 -2.9 2.80 Course credits toward certification 53.2 47.1 6.1 11.50 Pay increase 21.3 17.8 3.6 4.85 Recognition or higher ratings on an annual teacher evaluation
32.6 15.1 17.5** 6.98
Note: N = 200 to 215 teachers per outcome. a Means are regression-adjusted. * TAP-control difference is statistically significant at the 10% level. ** TAP-control difference is statistically significant at the 5% level. *** TAP-control difference is statistically significant at the 1% level.

24
Chapter III: Implementation
At the time of the administration of the teacher survey, TAP teachers had not yet received performance bonuses from the program. We describe below teacher expectations about compensation. In a future report, we will examine how the expectations of teachers in TAP schools compared to the compensation they actually received.
Consistent with TAP’s emphasis on multiple career paths, TAP teachers were significantly more likely than control teachers to expect additional compensation for leadership (see Table III.6). Thirty-four percent of TAP teachers expected to receive additional pay for leadership roles and responsibilities compared to 11 percent of control teachers.
We also found significant differences regarding nonleadership pay, with the largest differences occurring for areas stressed by TAP. A minimum requirement for a teacher incentive to work effectively is that teachers be aware that they are eligible to receive pay conditional on their performance. More than 9 in 10 TAP teachers reported being eligible for additional compensation based on instructional performance or student achievement, compared to one in 10 control teachers. Expectations of actually receiving such compensation differed as well: 43 percent of TAP teachers expected to receive additional compensation for instructional performance or student achievement growth compared to four percent of control teachers. Differences in eligibility for and expectations of compensation for other nonleadership reasons were smaller in magnitude and were not statistically significant.
The amount of nonleadership compensation expected differed significantly between TAP and non-TAP schools as well. On average, TAP teachers expected to receive $1,885 as additional compensation for nonleadership reasons, compared to $515 in additional pay expected by control teachers.

25
Chapter III: Implementation
Table III.6. Compensation
Teacher-Reported Outcome TAP
Meana Control Meana Difference
Standard Error
Academic-Year Base Salary ($) 55,869 54,264 1,605 1,522.48
Base Salary Included Leadership Compensation (percentage)
5.0 3.6 1.4 2.07
Expected Additional Compensation for Leadership (percentage)
34.3 10.5 23.8*** 3.98
Eligible for Additional Nonleadership Compensation (percentage)
99.1 70.3 28.8*** 6.22
Eligible for Additional Nonleadership Compensation Based on… (percentage)
Instructional performance 76.6 13.0 63.6*** 7.41 Student achievement growth 81.1 10.3 70.8*** 9.28 Instructional performance or student achievement growth
94.8 9.9 84.9*** 4.97
Subject matter taught 16.5 8.3 8.1 6.93 Student population taught 8.1 3.1 5.1 3.19 Professional development 36.4 33.0 3.3 9.82 University courses 21.9 19.5 2.4 6.99
Expected or Had Received Additional Nonleadership Compensation (percentage)
94.1 56.8 37.3*** 9.83
Expected or Had Received Additional Nonleadership Compensation Based on… (percentage)
Instructional performance 36.3 3.4 32.8*** 4.72 Student achievement growth 30.6 3.3 27.3*** 3.78 Instructional performance or student achievement growth
43.4 3.9 39.5*** 4.08
Subject matter taught 7.6 1.0 6.6 4.84 Student population taught 0.2 0.0 0.2 0.40 Professional development 20.6 11.1 9.5 5.93 University courses 6.7 2.4 4.3 2.89
Expected Amount of Additional Nonleadership Compensation ($)
1,885 515 1,370 *** 358.74
Expected Additional Compensation from an Outside Job (percentage)
18.4 11.5 6.9 5.61
Note: N = 157 to 206 teachers per outcome. a Means are regression-adjusted. * TAP-control difference is statistically significant at the 10% level. ** TAP-control difference is statistically significant at the 5% level. *** TAP-control difference is statistically significant at the 1% level.

This page has been intentionally left blank for double-sided copying.
C H A P T E R I V
I M P A C T S
e examined several outcomes to assess the impact of Chicago TAP during the first year of implementation. According to CPS, Chicago TAP was designed to support and develop high quality teaching, which in turn would boost student learning
(Chicago TAP 2009). Consequently, student test scores are the main outcomes of interest for the study. By rewarding performance and providing professional development and leadership opportunities as well as creating a sense of a career ladder, TAP is also hypothesized to help schools retain their best teachers, so we also examined the teacher retention rates of TAP and non-TAP schools. Finally, we examined the perceptions of key stakeholders, namely teachers and principals, about the school environment and their own satisfaction. One motivation for examining school environment is to identify any potentially negative consequences that might arise in the context of a program like TAP, in which there is differential pay on a basis other than experience and degrees earned.
W
A. STUDENT ACHIEVEMENT
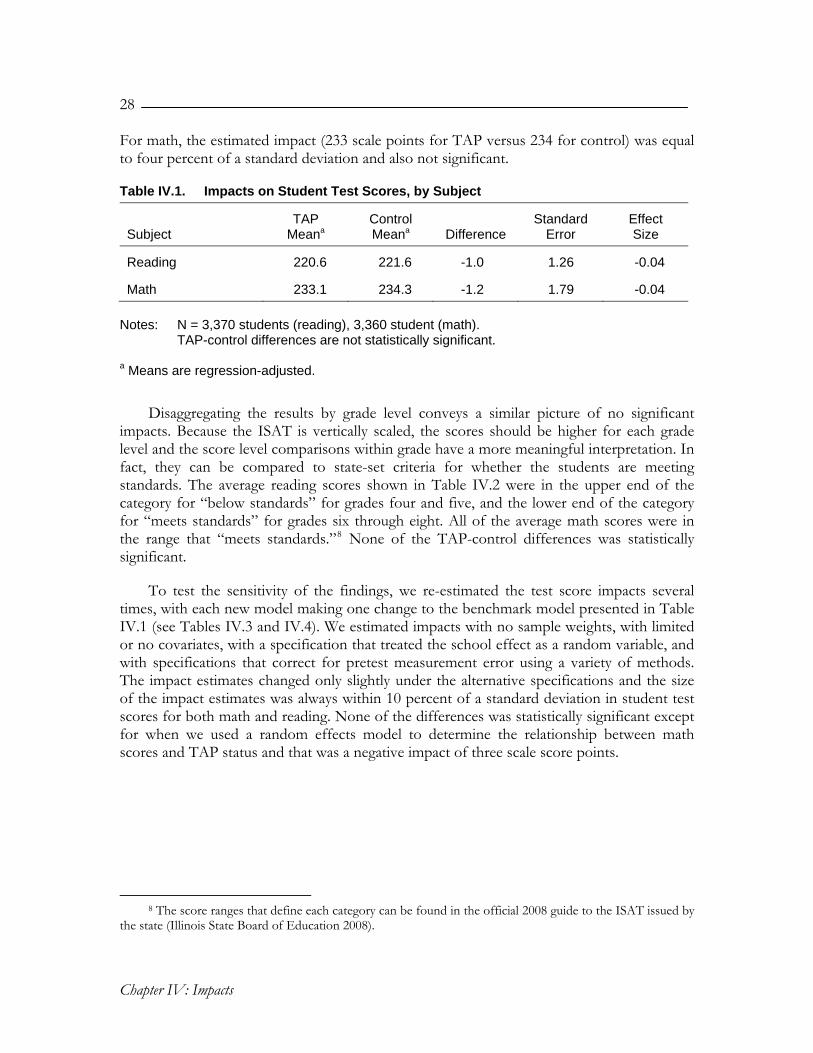
The differences in math and reading test scores between TAP and control school students were not statistically significant. In other words, we did not find evidence that TAP had an impact on test scores.6 Table IV.1 shows the regression-adjusted math and reading scores on the ISAT for both groups after controlling for baseline test scores and student background characteristics. The regression-adjusted results represent the estimated mean scores in spring 2008 from a growth model, using test scores from spring 2007 as the baseline. The estimated score for students assigned to a TAP school was 221 points on the reading test versus 222 points for assignment to a control school. The one-point difference was equivalent to four percent of a standard deviation and was not statistically significant.7
6 Because of the way we define “impact,” this also means that the “value added” by TAP schools was not
detectably higher or lower than the value added by control schools. 7 Standard deviations used to calculate effect sizes are derived from the distribution of the full sample for
each outcome.
28
Chapter IV: Impacts
For math, the estimated impact (233 scale points for TAP versus 234 for control) was equal to four percent of a standard deviation and also not significant.
Table IV.1. Impacts on Student Test Scores, by Subject
Subject TAP
Meana Control Meana Difference
Standard Error
Effect Size
Reading 220.6 221.6 -1.0 1.26 -0.04
Math 233.1 234.3 -1.2 1.79 -0.04 Notes: N = 3,370 students (reading), 3,360 student (math). TAP-control differences are not statistically significant.
a Means are regression-adjusted.
Disaggregating the results by grade level conveys a similar picture of no significant impacts. Because the ISAT is vertically scaled, the scores should be higher for each grade level and the score level comparisons within grade have a more meaningful interpretation. In fact, they can be compared to state-set criteria for whether the students are meeting standards. The average reading scores shown in Table IV.2 were in the upper end of the category for “below standards” for grades four and five, and the lower end of the category for “meets standards” for grades six through eight. All of the average math scores were in the range that “meets standards.”8 None of the TAP-control differences was statistically significant.
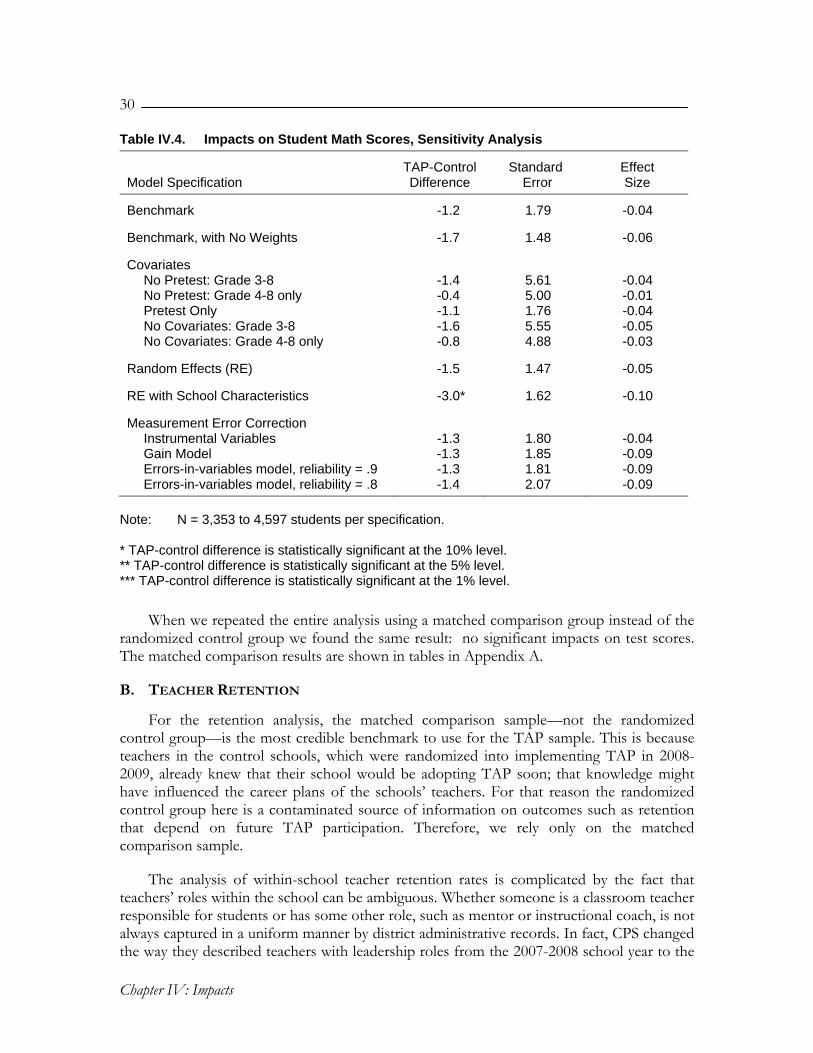
To test the sensitivity of the findings, we re-estimated the test score impacts several times, with each new model making one change to the benchmark model presented in Table IV.1 (see Tables IV.3 and IV.4). We estimated impacts with no sample weights, with limited or no covariates, with a specification that treated the school effect as a random variable, and with specifications that correct for pretest measurement error using a variety of methods. The impact estimates changed only slightly under the alternative specifications and the size of the impact estimates was always within 10 percent of a standard deviation in student test scores for both math and reading. None of the differences was statistically significant except for when we used a random effects model to determine the relationship between math scores and TAP status and that was a negative impact of three scale score points.
8 The score ranges that define each category can be found in the official 2008 guide to the ISAT issued by
the state (Illinois State Board of Education 2008).

29
Chapter IV: Impacts
Table IV.2. Impacts on Student Test Scores, by Subject and Grade Level
Subject, Grade TAP
Meana Control Meana Difference
Standard Error
Effect Size
Reading
Grade 4 197.5 198.3 -0.8 2.64 -0.03 Grade 5 209.6 211.4 -1.8 1.34 -0.07 Grade 6 222.3 223.2 -0.9 1.49 -0.04 Grade 7 228.2 229.6 -1.3 1.26 -0.05 Grade 8 237.1 237.3 -0.1 1.14 -0.01
Math
Grade 4 207.1 210.9 -3.8 2.41 -0.18 Grade 5 216.4 222.8 -6.4 4.09 -0.26 Grade 6 235.3 232.8 2.5 2.78 0.10 Grade 7 240.7 242.0 -1.3 2.12 -0.06 Grade 8 255.5 253.8 1.7 3.36 0.08
Notes: N = 547 to 775 students per grade. TAP-control differences are not statistically significant. a Means are regression-adjusted.
Table IV.3. Impacts on Student Reading Scores, Sensitivity Analysis
Model specification TAP-Control Difference
Standard Error
Effect Size
Benchmark -1.0 1.26 -0.04
Benchmark, with No Weights -0.9 1.10 -0.03 Covariates
No pretest: grade 3-8 -1.1 4.91 -0.04 No pretest: grade 4-8 only -0.1 4.42 -0.00 Pretest only -0.7 1.18 -0.03 No covariates: grade 3-8 -2.0 4.83 -0.07 No covariates: grade 4-8 only -1.2 4.34 -0.04
Random Effects (RE) -0.8 0.99 -0.03
RE with School Characteristics -1.8 1.09 -0.07 Measurement Error Correction
Instrumental variables -1.1 1.08 -0.04 Gain model -1.2 1.10 -0.08 Errors-in-variables model, reliability = .9 -1.1 1.11 -0.08 Errors-in-variables model, reliability = .8 -1.2 1.15 -0.08
Notes: N = 3,370 to 4,592 students per specification. TAP-control differences are not statistically significant.
30
Chapter IV: Impacts
Table IV.4. Impacts on Student Math Scores, Sensitivity Analysis
Model Specification TAP-Control Difference
Standard Error
Effect Size
Benchmark -1.2 1.79 -0.04
Benchmark, with No Weights -1.7 1.48 -0.06
Covariates
No Pretest: Grade 3-8 -1.4 5.61 -0.04 No Pretest: Grade 4-8 only -0.4 5.00 -0.01 Pretest Only -1.1 1.76 -0.04 No Covariates: Grade 3-8 -1.6 5.55 -0.05 No Covariates: Grade 4-8 only -0.8 4.88 -0.03
Random Effects (RE) -1.5 1.47 -0.05
RE with School Characteristics -3.0* 1.62 -0.10
Measurement Error Correction
Instrumental Variables -1.3 1.80 -0.04 Gain Model -1.3 1.85 -0.09 Errors-in-variables model, reliability = .9 -1.3 1.81 -0.09 Errors-in-variables model, reliability = .8 -1.4 2.07 -0.09
Note: N = 3,353 to 4,597 students per specification. * TAP-control difference is statistically significant at the 10% level. ** TAP-control difference is statistically significant at the 5% level. *** TAP-control difference is statistically significant at the 1% level.
When we repeated the entire analysis using a matched comparison group instead of the randomized control group we found the same result: no significant impacts on test scores. The matched comparison results are shown in tables in Appendix A.
B. TEACHER RETENTION
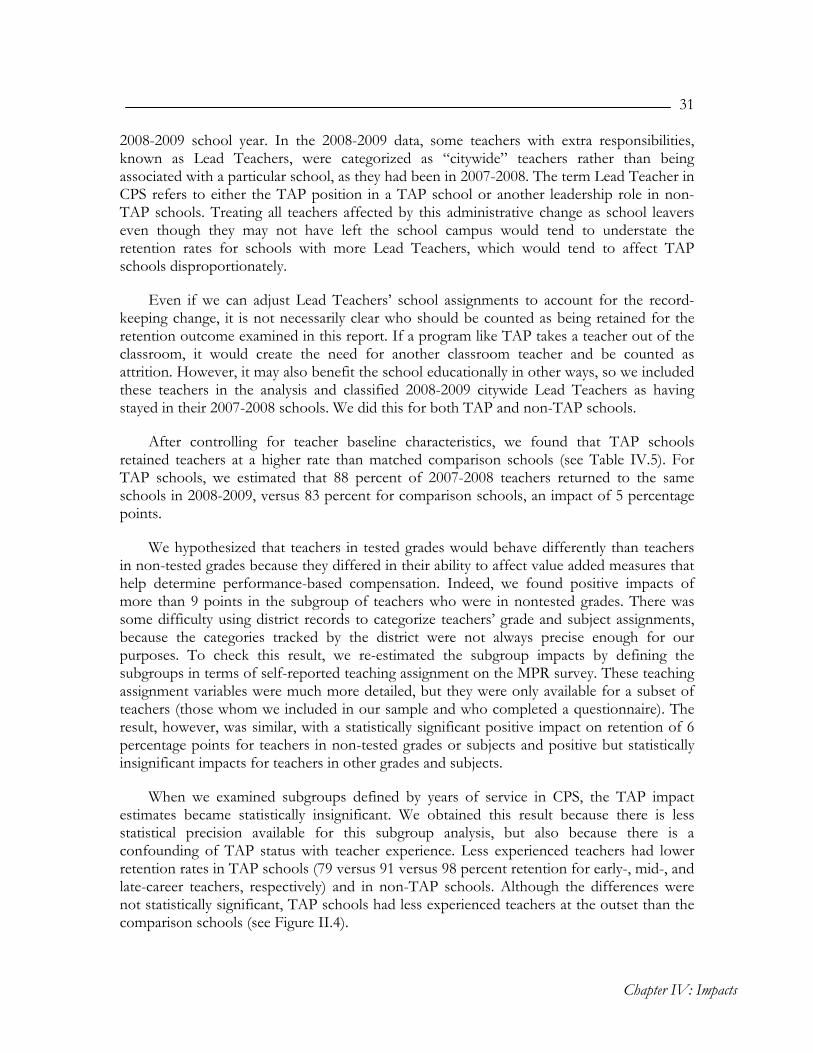
For the retention analysis, the matched comparison sample—not the randomized control group—is the most credible benchmark to use for the TAP sample. This is because teachers in the control schools, which were randomized into implementing TAP in 2008-2009, already knew that their school would be adopting TAP soon; that knowledge might have influenced the career plans of the schools’ teachers. For that reason the randomized control group here is a contaminated source of information on outcomes such as retention that depend on future TAP participation. Therefore, we rely only on the matched comparison sample.
The analysis of within-school teacher retention rates is complicated by the fact that teachers’ roles within the school can be ambiguous. Whether someone is a classroom teacher responsible for students or has some other role, such as mentor or instructional coach, is not always captured in a uniform manner by district administrative records. In fact, CPS changed the way they described teachers with leadership roles from the 2007-2008 school year to the
31
Chapter IV: Impacts
2008-2009 school year. In the 2008-2009 data, some teachers with extra responsibilities, known as Lead Teachers, were categorized as “citywide” teachers rather than being associated with a particular school, as they had been in 2007-2008. The term Lead Teacher in CPS refers to either the TAP position in a TAP school or another leadership role in non-TAP schools. Treating all teachers affected by this administrative change as school leavers even though they may not have left the school campus would tend to understate the retention rates for schools with more Lead Teachers, which would tend to affect TAP schools disproportionately.
Even if we can adjust Lead Teachers’ school assignments to account for the record-keeping change, it is not necessarily clear who should be counted as being retained for the retention outcome examined in this report. If a program like TAP takes a teacher out of the classroom, it would create the need for another classroom teacher and be counted as attrition. However, it may also benefit the school educationally in other ways, so we included these teachers in the analysis and classified 2008-2009 citywide Lead Teachers as having stayed in their 2007-2008 schools. We did this for both TAP and non-TAP schools.
After controlling for teacher baseline characteristics, we found that TAP schools retained teachers at a higher rate than matched comparison schools (see Table IV.5). For TAP schools, we estimated that 88 percent of 2007-2008 teachers returned to the same schools in 2008-2009, versus 83 percent for comparison schools, an impact of 5 percentage points.
We hypothesized that teachers in tested grades would behave differently than teachers in non-tested grades because they differed in their ability to affect value added measures that help determine performance-based compensation. Indeed, we found positive impacts of more than 9 points in the subgroup of teachers who were in nontested grades. There was some difficulty using district records to categorize teachers’ grade and subject assignments, because the categories tracked by the district were not always precise enough for our purposes. To check this result, we re-estimated the subgroup impacts by defining the subgroups in terms of self-reported teaching assignment on the MPR survey. These teaching assignment variables were much more detailed, but they were only available for a subset of teachers (those whom we included in our sample and who completed a questionnaire). The result, however, was similar, with a statistically significant positive impact on retention of 6 percentage points for teachers in non-tested grades or subjects and positive but statistically insignificant impacts for teachers in other grades and subjects.
When we examined subgroups defined by years of service in CPS, the TAP impact estimates became statistically insignificant. We obtained this result because there is less statistical precision available for this subgroup analysis, but also because there is a confounding of TAP status with teacher experience. Less experienced teachers had lower retention rates in TAP schools (79 versus 91 versus 98 percent retention for early-, mid-, and late-career teachers, respectively) and in non-TAP schools. Although the differences were not statistically significant, TAP schools had less experienced teachers at the outset than the comparison schools (see Figure II.4).

32
Chapter IV: Impacts
Table IV.5. Impacts on School Retention Rate (Percentage)
Subgroup TAP
Meana Comparison
Meana Difference Standard
Error
All Teachers 87.9 82.8 5.2** 2.53
Teaching Assignment Academic subjects, tested grades 89.3 87.7 1.6 2.59 Academic subjects, nontested grades/subjects
91.4 82.0 9.3** 4.45
Other 86.0 84.4 1.6 5.06
Years of Service
Less than 5 78.6 74.1 4.5 4.19 5 to 24 90.8 87.4 3.4 3.27 Greater than 24 97.7 93.7 4.0 6.17
Note: N = 235 TAP and 529 comparison teachers. School retention rate is defined as the
percentage of teachers in 2007-2008 who remained at the same school or became citywide Lead Teachers in 2008-2009.
a Means are regression-adjusted. * TAP-comparison difference is statistically significant at the 10% level. ** TAP-comparison difference is statistically significant at the 5% level. *** TAP-comparison difference is statistically significant at the 1% level.
We did not find statistically significant differences in retention rates when we defined retention as staying in the district. Table IV.6 shows the percentage of 2007-2008 teachers in TAP and matched comparison schools who returned to CPS in 2008-2009. We found no significant differences overall. The regression-adjusted district retention rate for TAP teachers was 97 percent and for teachers in comparison schools it was 95 percent. None of the subgroup impacts, also shown in Table IV.6, was statistically significant.
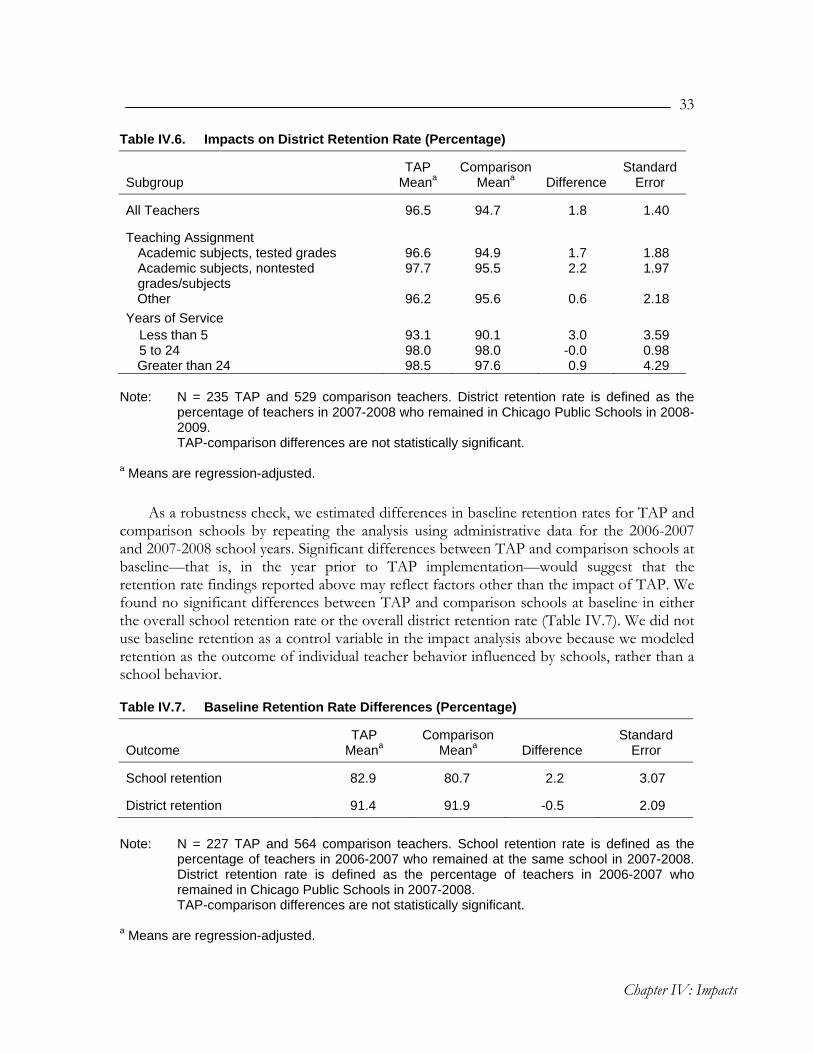
33
Chapter IV: Impacts
Table IV.6. Impacts on District Retention Rate (Percentage)
Subgroup TAP
Meana Comparison
Meana Difference Standard
Error
All Teachers 96.5 94.7 1.8 1.40
Teaching Assignment
Academic subjects, tested grades 96.6 94.9 1.7 1.88 Academic subjects, nontested grades/subjects
97.7 95.5 2.2 1.97
Other 96.2 95.6 0.6 2.18 Years of Service
Less than 5 93.1 90.1 3.0 3.59 5 to 24 98.0 98.0 -0.0 0.98 Greater than 24 98.5 97.6 0.9 4.29
Note: N = 235 TAP and 529 comparison teachers. District retention rate is defined as the
percentage of teachers in 2007-2008 who remained in Chicago Public Schools in 2008-2009.
TAP-comparison differences are not statistically significant. a Means are regression-adjusted.
As a robustness check, we estimated differences in baseline retention rates for TAP and comparison schools by repeating the analysis using administrative data for the 2006-2007 and 2007-2008 school years. Significant differences between TAP and comparison schools at baseline—that is, in the year prior to TAP implementation—would suggest that the retention rate findings reported above may reflect factors other than the impact of TAP. We found no significant differences between TAP and comparison schools at baseline in either the overall school retention rate or the overall district retention rate (Table IV.7). We did not use baseline retention as a control variable in the impact analysis above because we modeled retention as the outcome of individual teacher behavior influenced by schools, rather than a school behavior.
Table IV.7. Baseline Retention Rate Differences (Percentage)
Outcome TAP
Meana Comparison
Meana Difference Standard
Error
School retention 82.9 80.7 2.2 3.07
District retention 91.4 91.9 -0.5 2.09
Note: N = 227 TAP and 564 comparison teachers. School retention rate is defined as the
percentage of teachers in 2006-2007 who remained at the same school in 2007-2008. District retention rate is defined as the percentage of teachers in 2006-2007 who remained in Chicago Public Schools in 2007-2008.
TAP-comparison differences are not statistically significant. a Means are regression-adjusted.

34
Chapter IV: Impacts
We also examined impacts of TAP on the pattern of teacher mobility, focusing on where the movers went. Table IV.8 reports percentages of TAP and comparison teachers by their 2008-2009 destinations. The difference in the pattern of mobility was statistically significant. However, the difference largely reflects the change in categorization of TAP Lead Teachers from being linked to a particular school in the 2007-2008 administrative data to being categorized as a citywide teacher in the 2008-2009 data, a change that CPS implemented to reflect changes in how the positions were funded. In addition, the results are not regression-adjusted and may reflect differences in background characteristics that are not related to TAP.
Table IV.8. Teacher Mobility, by Destination (Percentage)
Destination in 2008-2009 TAP Mean
Comparison Mean Difference
Stayed at same school 78.5 81.3 -2.8
Moved to other TAP school 2.1 0.6 1.5
Moved to comparison school 0.0 0.2 -0.2
Moved to other CPS elementary 4.1 7.7 -3.5
Moved to other CPS high school 0.8 0.0 0.8
Reclassified as citywide teaching position 8.3 2.2 6.0
Moved to citywide nonteaching position 0.0 0.9 -0.9
Left CPS 6.2 7.1 -0.9
Note: N = 242 TAP and 536 comparison teachers. The difference in the distributions is
statistically significant using a chi-square test (p=0.000). Means are unweighted and are not regression adjusted.
Policymakers care not only about the retention rate, but the types of teachers who are
retained. To estimate impacts on the composition of teachers at TAP schools, we examined the background characteristics of 2007-2008 teachers who remained in the same schools in 2008-2009. If TAP is successful in rewarding effective teachers, then ineffective teachers would prefer to leave the school and more effective teachers would prefer to stay on longer than they would otherwise. All else equal, one would expect such an improvement in the mix of teachers to result in more effective teachers accounting for a higher proportion of the teacher workforce remaining in TAP schools than in comparison schools. Unfortunately, we do not have access to measures that describe teacher effectiveness for TAP and non-TAP schools. However, we did examine teacher background characteristics.
Table IV.9 shows for TAP and comparison school stayer characteristics related to teachers’ highest degree held, certification, and experience. We found no statistically significant differences between TAP stayers and comparison group stayers, suggesting that TAP did not affect the composition of teachers on these measures. We will estimate differences on performance measures such as teacher-value added estimates and teacher
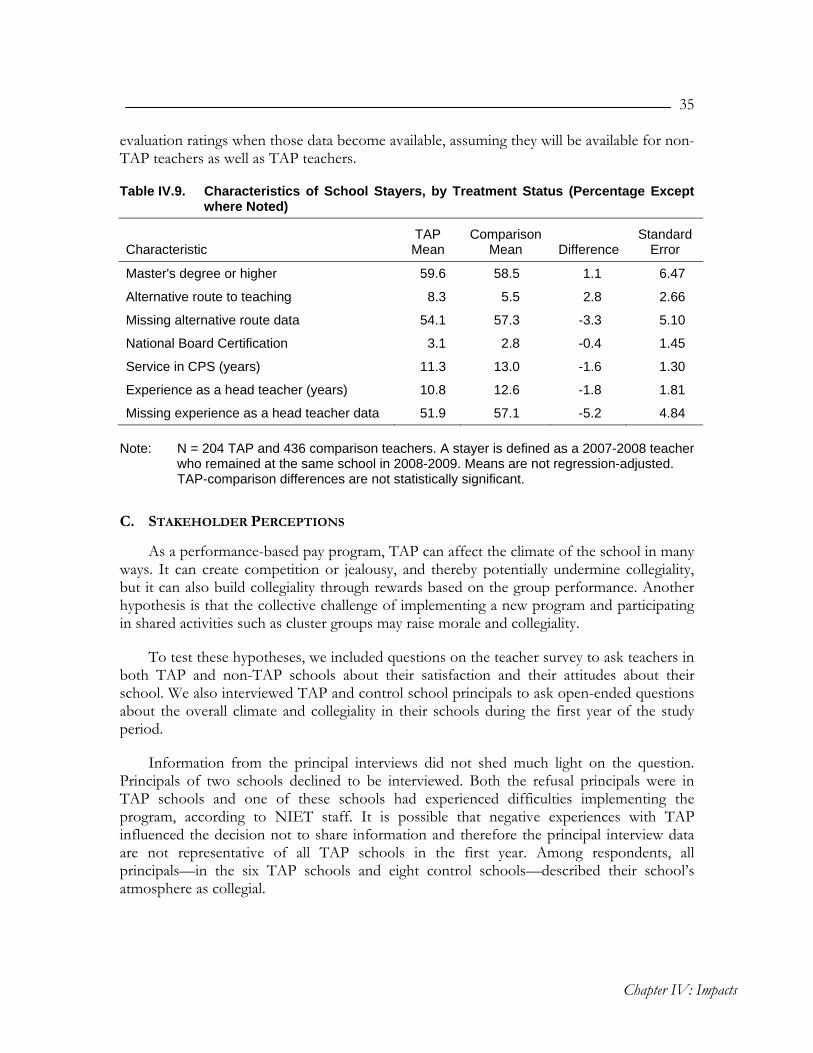
35
Chapter IV: Impacts
evaluation ratings when those data become available, assuming they will be available for non-TAP teachers as well as TAP teachers.
Table IV.9. Characteristics of School Stayers, by Treatment Status (Percentage Except where Noted)
Characteristic TAP Mean
Comparison Mean Difference
Standard Error
Master's degree or higher 59.6 58.5 1.1 6.47
Alternative route to teaching 8.3 5.5 2.8 2.66
Missing alternative route data 54.1 57.3 -3.3 5.10
National Board Certification 3.1 2.8 -0.4 1.45
Service in CPS (years) 11.3 13.0 -1.6 1.30
Experience as a head teacher (years) 10.8 12.6 -1.8 1.81
Missing experience as a head teacher data 51.9 57.1 -5.2 4.84 Note: N = 204 TAP and 436 comparison teachers. A stayer is defined as a 2007-2008 teacher
who remained at the same school in 2008-2009. Means are not regression-adjusted. TAP-comparison differences are not statistically significant.
C. STAKEHOLDER PERCEPTIONS
As a performance-based pay program, TAP can affect the climate of the school in many ways. It can create competition or jealousy, and thereby potentially undermine collegiality, but it can also build collegiality through rewards based on the group performance. Another hypothesis is that the collective challenge of implementing a new program and participating in shared activities such as cluster groups may raise morale and collegiality.
To test these hypotheses, we included questions on the teacher survey to ask teachers in both TAP and non-TAP schools about their satisfaction and their attitudes about their school. We also interviewed TAP and control school principals to ask open-ended questions about the overall climate and collegiality in their schools during the first year of the study period.
Information from the principal interviews did not shed much light on the question. Principals of two schools declined to be interviewed. Both the refusal principals were in TAP schools and one of these schools had experienced difficulties implementing the program, according to NIET staff. It is possible that negative experiences with TAP influenced the decision not to share information and therefore the principal interview data are not representative of all TAP schools in the first year. Among respondents, all principals—in the six TAP schools and eight control schools—described their school’s atmosphere as collegial.
36
Chapter IV: Impacts
TAP principals specified ways in which the program positively affected the collaborative atmosphere of their school. They cited the positive influence of elements such as Mentor and Lead Teachers and more time for teacher meetings. One principal indicated that TAP promoted collaboration by allowing Mentor and Career Teachers to share ideas, while another noted the positive influence of coaching teachers on specific areas and discussing ways to improve.
However, only two treatment principals specifically attributed changes in school climate to TAP. One principal reported that TAP “contributed a lot” to an increase in the capacity of staff to deliver instruction, noting that TAP provided an infrastructure of communication among staff and encouraged a more reflective attitude among teachers. Another principal said that there had been a change in school climate with TAP, describing the teachers as “much more tight knit.”
Three other treatment principals instead described the changes in climate as a continuation of improvements that had been occurring over the past few years. These principals did not specify the causes of the improvements, but the changes cannot be attributed exclusively to TAP since they began prior to the implementation of the program. Another treatment principal reported more focus on positive behaviors for teachers and students and noted that teachers were more open to observation and feedback, but did not indicate whether these changes occurred as a result of TAP or were part of a continuing improvement trend.
Six of the eight control principals also described improvements in school climate over time, further suggesting that factors other than TAP have contributed to improvements in school climate. Reasons cited for the improvements included filtering out teachers who did not “get it”; recognizing teams of teachers—as opposed to individuals—for achievement; and developing teams focused on parent/community involvement, professional development, and student performance. The remaining two control principals reported no change in climate.
Teacher survey responses similarly suggested that TAP did not change school climate, as high percentages of both TAP and non-TAP teachers reported collaborative, supportive environments (see Table IV.10). Ninety-nine percent of TAP teachers and 98 percent of control teachers reported being satisfied with the supportive atmosphere among faculty and collaboration with colleagues. The majority of both groups agreed with the statement that their principal worked to create a sense of community at their school (84 percent of TAP and 81 percent of control teachers). Neither of these differences was statistically significant.
When we examined other teacher attitudes, we similarly found no statistically significant differences between TAP and non-TAP schools (see Table IV.10). Positive attitudes about their principals and other aspects of teaching were prevalent among both treatment and control teachers. More than 90 percent of teachers in both groups agreed that their principal promoted parent and community involvement, was willing to make changes, and encouraged teachers to try new methods of instruction. In both treatment and control schools, more than 95 percent of teachers reported satisfaction with such aspects of teaching as classroom
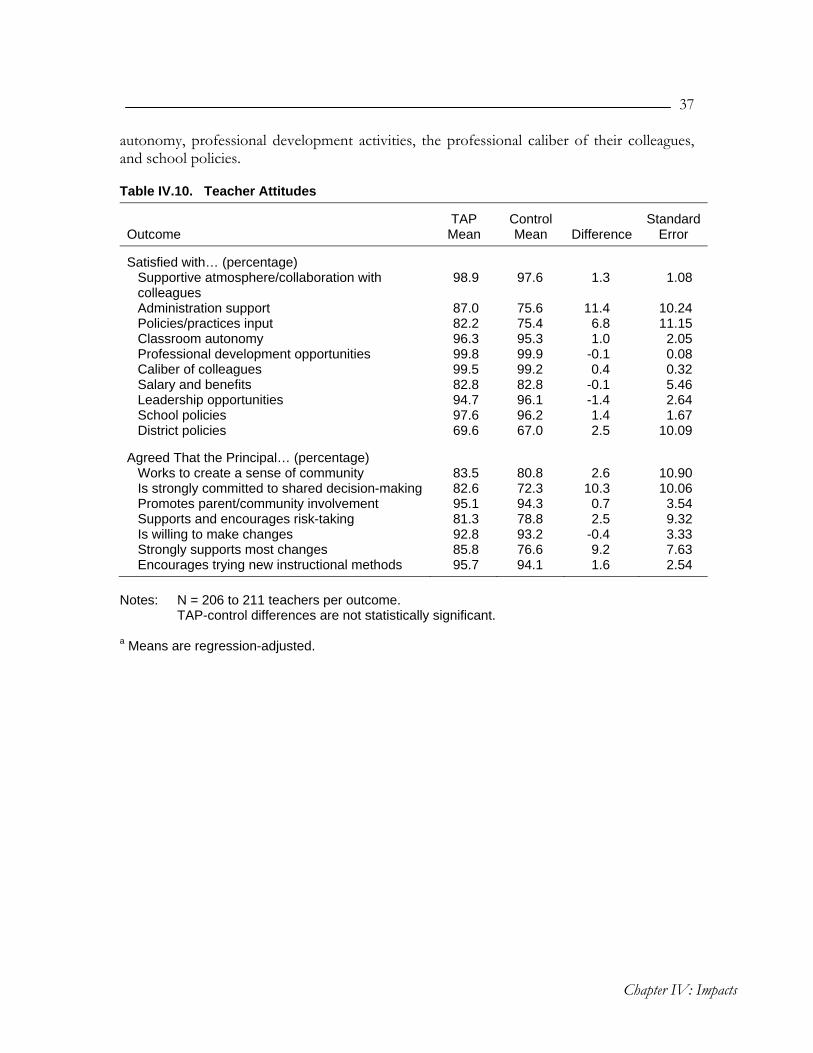
37
Chapter IV: Impacts
autonomy, professional development activities, the professional caliber of their colleagues, and school policies.
Table IV.10. Teacher Attitudes
Outcome TAP Mean
Control Mean Difference
Standard Error
Satisfied with… (percentage)
Supportive atmosphere/collaboration with colleagues
98.9 97.6 1.3 1.08
Administration support 87.0 75.6 11.4 10.24 Policies/practices input 82.2 75.4 6.8 11.15 Classroom autonomy 96.3 95.3 1.0 2.05 Professional development opportunities 99.8 99.9 -0.1 0.08 Caliber of colleagues 99.5 99.2 0.4 0.32 Salary and benefits 82.8 82.8 -0.1 5.46 Leadership opportunities 94.7 96.1 -1.4 2.64 School policies 97.6 96.2 1.4 1.67 District policies 69.6 67.0 2.5 10.09
Agreed That the Principal… (percentage)
Works to create a sense of community 83.5 80.8 2.6 10.90 Is strongly committed to shared decision-making 82.6 72.3 10.3 10.06 Promotes parent/community involvement 95.1 94.3 0.7 3.54 Supports and encourages risk-taking 81.3 78.8 2.5 9.32 Is willing to make changes 92.8 93.2 -0.4 3.33 Strongly supports most changes 85.8 76.6 9.2 7.63 Encourages trying new instructional methods 95.7 94.1 1.6 2.54
Notes: N = 206 to 211 teachers per outcome. TAP-control differences are not statistically significant. a Means are regression-adjusted.

This page has been intentionally left blank for double-sided copying.
C H A P T E R V
C O N C L U S I O N
A. SUMMARY OF FINDINGS
Our findings suggest that the introduction of Chicago TAP significantly affected teaching support received and compensation expectations in TAP schools. Teachers in TAP schools reported spending significantly more scheduled time receiving mentoring support than teachers in similar non-TAP schools. Consistent with the teacher pay paths specified in the TAP model, treatment teachers were more likely than control teachers to expect compensation for leadership roles or responsibilities, instructional performance, or student achievement growth. Few detectable differences emerged between TAP and non-TAP schools in the support provided by veteran teachers to their colleagues or in professional development activities.
As of March of the first year of implementation, these changes did not produce measurable impacts on students. Student achievement growth as measured by average math and reading ISAT scores did not differ significantly between TAP and non-TAP schools.
We did find evidence that TAP increased school retention. The impact of TAP on retention, counting citywide Lead Teachers as stayers, was 5 points (88 versus 83 percent). The impact for teachers in nontested academic subjects was over 9 points, while we were not able to detect impacts for other subgroups defined by teaching assignment. The program had no detectable impact on retention in the district, nor did it change the mix of teachers in terms of background characteristics (degree held, advanced certification, or teaching experience).
Teachers in TAP schools did not report significantly higher satisfaction or more positive attitudes toward their principals than did control teachers. While we did not find evidence of impact on these positive attitudes, we also did not find evidence of negative attitudes. Specifically, we did not find any evidence that TAP harmed the school climate.

40
Chapter V: Conclusion
B. CAVEATS AND LIMITATIONS
Evidence in this report, which covers the first year of implementation for the district and for the participating schools, should be understood in its proper context. In this section we discuss several important caveats and limitations of the design and analysis.
1. Small Sample Size
Most important, the sample size is limited because the program was designed to roll out only 10 TAP schools each year. The main concern with small numbers of schools is statistical power, or our ability to detect an impact given that one exists. The findings reported here are based on 16 randomly assigned elementary schools, the first half of our intended sample. The number of schools and students is sufficient to detect impacts on test scores of approximately 12 percent of a standard deviation or larger. As we accumulate more cohorts of schools we will report on results from a larger sample with the ability to detect smaller impacts.
Another concern with small sample sizes relates to the generalizability of the findings. The experimental design yields unbiased estimates of the impact of Chicago TAP during the first year of implementation at the 16 schools randomly assigned during the 2007 lottery. This design does not necessarily provide unbiased estimates of what the impact of Chicago TAP would be outside of the specific sample studied here; in other words, the findings are not necessarily generalizable to other schools, students, or settings. Though large samples do not automatically ensure generalizability, smaller samples tend to be less representative of broader populations of potential interest. For example, as discussed in Chapter II, the TAP selection process was not intended to produce groups of TAP schools that were statistically representative of the district; TAP, control, and matched comparison schools differed from other CPS schools on such characteristic as the percentages of students who were low income, African-American, or Hispanic. In addition, there may be distinguishing unobservable characteristics about these 16 schools that voluntarily and successfully completed the TAP selection process in its first year. Consequently, the findings may not indicate how the introduction of TAP would affect CPS schools that were not the first to complete the selection process or who otherwise differ from study schools.
2. Start up Effects
Like many teacher incentive programs, TAP may require considerable time to take hold. As implementation of Chicago TAP continues, principals, teachers, and district staff will have more time to adjust and learn. The school-based team that evaluates teachers will have more practice. The teachers will have more time to understand and change their teaching in response to the incentive system. For example, in the first year of implementation, the value added metric that is used to determine performance awards is new to the district and the schools, so teachers in the first year may not be familiar with it; Lead Teachers and Mentor Teachers were all in their first year and had not accumulated experience that might help them improve in their roles; and no teachers had received bonus payments, so the incentive effect was not as tangible as it would come to be in subsequent years after the first round of checks was received (which occurred in December 2008). At the district level, CPS staff will
41
Chapter V: Conclusion
learn over time how to select schools to participate in TAP and how to train the school’s staff, and will have opportunities to adjust program rules and refine methods for calculating teachers’ value added, for example, as they gain experience with the model.
The first-year impacts presented in this report reflect such startup effects and may not be representative of the steady state impacts of Chicago TAP that will emerge as the program matures. The startup effects could be negative, in that the early adopters (schools) have less time than later adopters to learn about the program, understand its rules, and hire staff who could best take advantage of TAP. Conversely, the startup effects could be positive in that increased attention and scrutiny could result in more resources being trained on the early adopters than would be possible under wider implementation. In future reports, we will attempt to model school and district startup effects by comparing, for example, differences in outcomes between cohort 3 and 4 schools randomly assigned in the 2009 lottery to the differences reported here between cohort 1 and 2 schools assigned in the 2007 lottery; however, even these comparisons will still reflect TAP in its early years in Chicago.
3. March Testing
The administration of the ISAT in early spring raises another caveat. In estimating the impact of Chicago TAP on student achievement during the first year of implementation, we would ideally measure student achievement at the beginning of the school year in September 2007, and again at the very end of the school year in June 2008. However, Illinois is like many states around the country that routinely administer tests well before the end of the school year. The ISAT is administered throughout the state in March of each year; the growth model used in this report predicts March 2008 test scores controlling for March 2007 test scores. Our analysis of student achievement impacts thus includes a period covering almost three months prior to the implementation of TAP in treatment schools (late March to June 2007) and excludes the last three months of the implementation year (late March to June 2008).
In future years, we will have data that might make it possible to address this problem. Meyer and Christian (2008) have proposed a model that accounts for early testing by estimating separate effects for the two periods: the “fall” period from the beginning of the school year to the March test date and the “spring” period from the March test date to the end of the school year. As Meyer and Christian note, precise estimates of the relevant fall plus spring effects can be produced if a sufficient number of students change schools between school years. In the future, October and May enrollment data can be used to estimate student achievement growth over a period that more closely tracks the treatment period.
4. Survey Nonresponse
We also acknowledge the potential bias that may be introduced to some analyses by nonresponse to the teacher survey. (The test score analysis is not affected by this issue.) As noted in Chapter II, 65 percent of eligible teachers completed the teacher survey. Random assignment ensures that there are no systematic differences between teachers in treatment and control schools prior to the implementation of TAP. Nonresponse may compromise
42
Chapter V: Conclusion
this initial equivalence of treatment and control groups if differences exist between respondents and nonrespondents. If such differences are correlated with TAP status then the impacts of TAP on teacher attitudes or other outcomes derived from the teacher survey could be biased. Using weights derived based on propensity-score methods, we adjusted for nonresponse by giving more weight in the analyses to respondents whose baseline characteristics were more similar to those of nonrespondents.
C. NEXT STEPS
This report focused on analyses of survey and administrative data to estimate the impacts of the first year of implementation of Chicago TAP, exploiting the random assignment of schools to implementation period. Complementary analyses may aid in interpreting the findings presented here. For example, with data on the performance awards received by teachers we can compare the expectations as reported in the teacher survey to actual compensation received. We can also examine relationships between implementation measures and outcomes. Such analyses do not have the same ability to produce causal evidence because schools are not randomly assigned to different levels of implementation, but they can still be informative and help generate hypotheses.
Future reports will present findings on implementation and impacts of Chicago TAP over time. We will continue data collection for the schools studied here (cohorts 1 and 2) to provide evidence on whether TAP becomes more effective over time as schools gain experience adapting to the program. In addition, we randomly assigned a second set of Chicago TAP applicants to cohorts 3 and 4 in March 2009, with cohort 3 implementing TAP in the 2009-2010 school year and cohort 4 implementing TAP in 2010-2011. Collecting data on cohorts 3 and 4 will ultimately enable us to produce more precise estimates of the impacts of the first two years of TAP implementation by increasing the sample size.
R E F E R E N C E S
Chicago Board of Education and Chicago Teachers Union. “Memorandum of Understanding Between the Chicago Board of Education and Chicago Teachers Union, Local No. 1, AFT, AFL-CIO.” Available at [http://www.cpef.org/ctap/files/ CPS_CTU_MOU.pdf]. July 2007.
Chicago TAP. “Chicago TAP: Recognizing Excellence in Academic Leadership.” Available at [http://www.cpef.org/ctap/files/Factsheet_Final.pdf]. Retrieved January 2009.
Foster, Jessica. “Year 1 Preliminary Implementation Findings from the Internal Evaluation of the Chicago TAP Program.” Chicago, IL: Chicago Public Schools, October 16, 2008.
Glazerman, Steven, Sarah Senesky, Neil Seftor, and Amy Johnson. “Design of an Impact Evaluation of Teacher Induction Programs.” Washington, DC: Mathematica Policy Research, Inc., January 2006.
Illinois State Board of Education. “Guide to the 2008 Illinois State Assessment: Reading Mathematics Science.” Available at [http://www.isbe.state.il.us/assessment/pdfs/ISAT_Interpr_Guide_2008.pdf]. 2008.
Meyer, Robert and Michael Christian. “Value-Added and Other Methods for Measuring School Performance.” National Center on Performance Incentives Working Paper 2008-17. Available at [http://www.performanceincentives.org/data/files/directory/ ConferencePapersNews/Meyer_and_Christian_2008.pdf]. February 2008.
National Institute for Excellence in Teaching. “Teacher Advancement Program Implementation Manual: Customized for Chicago Public Schools.” Available at [http://www.cpef.org/ctap/files/Implementation_Manual.pdf]. March 2008.
Schacter, John, Tamara Schiff, Yeow Meng Thum, Cheryl Fagnano, Micheline Bendotti, Lew Solmon, Kimberly Firetag, and Lowell Milken. “The Impact of the Teacher Advancement Program on Student Achievement, Teacher Attitudes, and Job Satisfaction.” Santa Monica, CA: Milken Family Foundation, November 2002.
44
References Draft
Schacter, John, Yeow Meng Thum, Daren Reifsneider, and Tamara Schiff. “The Teacher Advancement Program Report Two: Year Three Results from Arizona and Year One Results from South Carolina TAP Schools.” Santa Monica, CA: Milken Family Foundation, March 2004.
Solomon, Lewis, J. Todd White, Donna Cohen, and Deborah Woo. “The Effectiveness of the Teacher Advancement Program.” Santa Monica, CA: National Institute on Effectiveness in Teaching, April 2007.
Springer, Matthew, Dale Ballou, and Art (Xiao) Peng. “Impact of the Teacher Advancement Program on Student Test Score Gains: Findings from an Independent Appraisal.” National Center on Performance Incentives Working Paper 2008-19. Available at [http://www.performanceincentives.org/data/files/news/PapersNews/Springer_et_al_2008.pdf]. February 2008.

A P P E N D I X A
S U P P L E M E N T A L T A B L E S

This page has been intentionally left blank for double-sided copying.
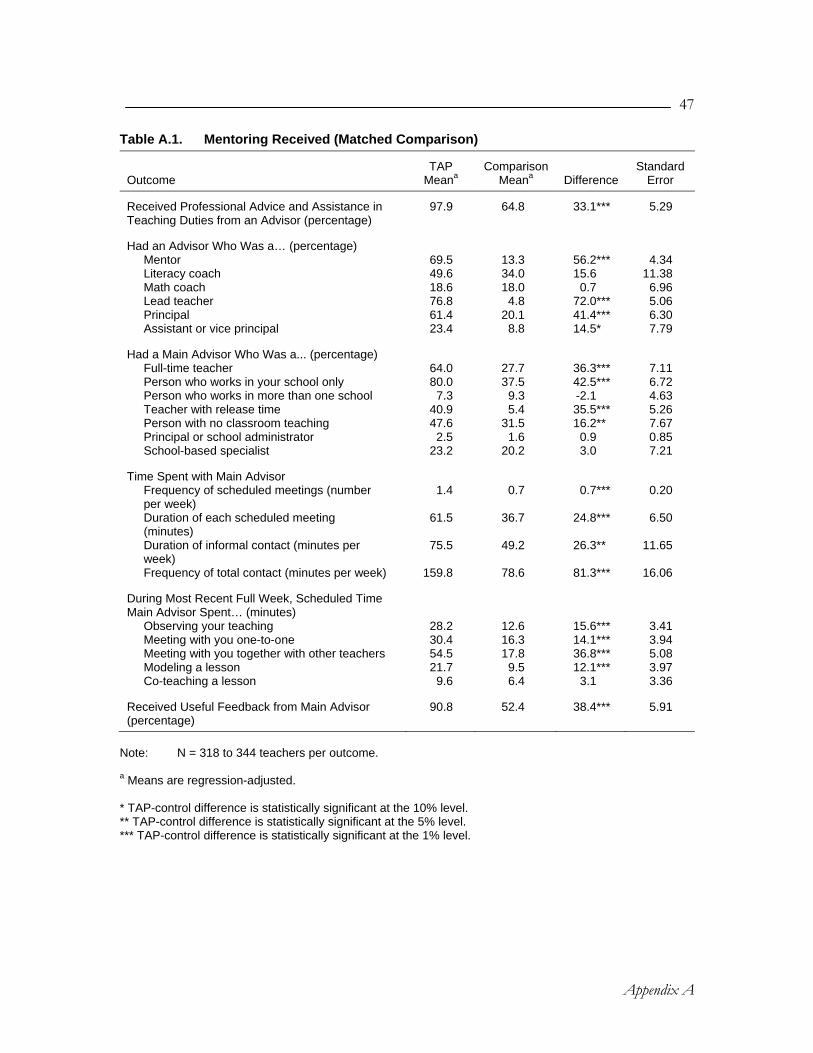
47
Appendix A
Table A.1. Mentoring Received (Matched Comparison)
Outcome TAP
Meana Comparison
Meana Difference Standard
Error
Received Professional Advice and Assistance in Teaching Duties from an Advisor (percentage)
97.9 64.8 33.1*** 5.29
Had an Advisor Who Was a… (percentage)
Mentor 69.5 13.3 56.2*** 4.34 Literacy coach 49.6 34.0 15.6 11.38 Math coach 18.6 18.0 0.7 6.96 Lead teacher 76.8 4.8 72.0*** 5.06 Principal 61.4 20.1 41.4*** 6.30 Assistant or vice principal 23.4 8.8 14.5* 7.79
Had a Main Advisor Who Was a... (percentage)
Full-time teacher 64.0 27.7 36.3*** 7.11 Person who works in your school only 80.0 37.5 42.5*** 6.72 Person who works in more than one school 7.3 9.3 -2.1 4.63 Teacher with release time 40.9 5.4 35.5*** 5.26 Person with no classroom teaching 47.6 31.5 16.2** 7.67 Principal or school administrator 2.5 1.6 0.9 0.85 School-based specialist 23.2 20.2 3.0 7.21
Time Spent with Main Advisor
Frequency of scheduled meetings (number per week)
1.4 0.7 0.7*** 0.20
Duration of each scheduled meeting (minutes)
61.5 36.7 24.8*** 6.50
Duration of informal contact (minutes per week)
75.5 49.2 26.3** 11.65
Frequency of total contact (minutes per week) 159.8 78.6 81.3*** 16.06
During Most Recent Full Week, Scheduled Time Main Advisor Spent… (minutes)
Observing your teaching 28.2 12.6 15.6*** 3.41 Meeting with you one-to-one 30.4 16.3 14.1*** 3.94 Meeting with you together with other teachers 54.5 17.8 36.8*** 5.08 Modeling a lesson 21.7 9.5 12.1*** 3.97 Co-teaching a lesson 9.6 6.4 3.1 3.36
Received Useful Feedback from Main Advisor (percentage)
90.8 52.4 38.4*** 5.91
Note: N = 318 to 344 teachers per outcome. a Means are regression-adjusted. * TAP-control difference is statistically significant at the 10% level. ** TAP-control difference is statistically significant at the 5% level. *** TAP-control difference is statistically significant at the 1% level.

48
Appendix A
Table A.2. Mentoring Provided (Teachers with at Least Five Years of Experience, Matched Comparison)
Outcome TAP
Meana Comparison
Meana Difference Standard
Error
Provided Formal Mentoring Services (percentage) 36.1 23.5 12.7* 7.06 Mentoring topics included… (percentage) Strategies for teaching literacy 32.6 17.4 15.1** 6.57 Strategies for teaching math 4.3 5.3 -1.0 2.16 Strategies for teaching other subjects 4.0 5.1 -1.1 1.58 Increasing content area knowledge 20.6 12.6 8.0 5.78 Selecting or adapting curriculum materials 23.5 15.8 7.7 6.06 Teaching or aligning curriculum to meet state or district standards
24.8 14.8 10.0 6.19
Aligning local curriculum assessment to state standards
7.9 4.7 3.3 2.21
Setting instructional goals and determining ways to achieve them
27.2 18.2 9.0 6.63
Preparing students for standardized tests 17.5 12.8 4.8 4.30 Using assessments to inform teaching 31.8 17.6 14.2** 6.98 Preparing lesson plans or other instructional activities
21.0 18.2 2.8 5.20
Providing differentiated instruction to meet student needs
28.2 15.8 12.3** 5.99
Received Release Time for Mentoring (percentage) 14.1 1.9 12.2*** 4.57 Release Time for Mentoring (hours per week) 2.8 0.7 2.0** 0.85 Mentoring Outside of Specified Contract Hours
(hours per week) 2.2 0.9 1.3*** 0.41
Teachers Mentored (number) 2.9 0.8 2.1*** 0.45
Frequency of Scheduled Meetings (number per week per teacher)
0.5 0.6 -0.1 0.19
Duration of Each Scheduled Meeting (minutes) 20.8 17.0 3.7 7.15 Informal Contact with All Teachers (minutes per week) 60.1 28.2 31.9* 17.16 Total Contact with All Teachers (minutes per week) 302.0 65.0 237.0 147.26
Mentoring Activities Included… (percentage)
Observing teaching 31.3 18.1 13.2* 6.78 Meeting with teachers one-to-one 32.2 21.3 10.9 7.59 Meeting in small groups or clusters 28.9 13.9 15.0** 6.11 Modeling a lesson 25.2 17.3 7.9 6.59 Co-teaching a lesson 7.8 3.3 4.5** 2.06 Writing evaluations 31.6 11.2 20.4*** 6.03
During Most Recent Full Week, Scheduled Time Spent… (minutes)
Observing teaching 64.9 14.5 50.5** 22.09 Meeting with teachers one-to-one 44.9 19.1 25.8** 10.10 Meeting in small groups or clusters 28.3 12.4 15.9** 6.85 Modeling a lesson 18.8 18.3 0.5 7.96 Co-teaching a lesson 14.7 14.6 0.0 9.14 Writing evaluations 61.1 6.8 54.3*** 18.10
Note: N = 228 to 249 teachers per outcome. a Means are regression-adjusted. * TAP-comparison difference is statistically significant at the 10% level. ** TAP-comparison difference is statistically significant at the 5% level. *** TAP-comparison difference is statistically significant at the 1% level.

49
Appendix A
Table A.3. Other Leadership Roles and Responsibilities (Teachers with at Least Five Years of Experience, Matched Comparison)
Outcome TAP
Meana Comparison
Meana Difference Standard
Error
Had Other Leadership Roles or Responsibilities Beyond Mentoring (percentage)
47.7 50.2 -2.4 6.59
Other Leadership Roles Included… (percentage)
Being a grade-level lead teacher 6.9 18.9 -12.0** 5.63 Being on a school improvement team 21.4 25.2 -3.8 7.71 Being on a school-wide committee/task force
12.7 14.1 -1.4 4.74
Other Leadership Responsibilities Included… (percentage)
Developing curriculum 17.4 18.5 -1.1 4.94 Reviewing/selecting curriculum 18.4 25.9 -7.4 6.15 Providing input on improving facilities/tech
12.6 20.2 -7.6 6.62
Providing professional development activities
31.2 16.6 14.6*** 4.63
Developing standards 12.6 12.3 0.4 4.23
Associated with These other Leadership Roles and Responsibilities, Received… (percentage)
Credit toward certification 2.5 5.7 -3.2** 1.38 Pay increase 2.7 0.3 2.5*** 0.69
Note: N = 247 to 251 teachers per outcome. a Means are regression-adjusted. * TAP-comparison difference is statistically significant at the 10% level. ** TAP-comparison difference is statistically significant at the 5% level. *** TAP-comparison difference is statistically significant at the 1% level.

50
Appendix A
Table A.4. Observation and Feedback (Matched Comparison)
Outcome TAP
Meana Comparison
Meana Difference Standard
Error
Frequency of Observation (number in 2007-2008)
Observation by principal or assistant principal 2.4 2.4 0.0 0.26 Observation by mentor, coach, or lead teacher 3.3 1.7 1.6*** 0.24
Frequency of Feedback (number in 2007-2008)
Feedback as part of a formal evaluation 2.6 1.8 0.8*** 0.19 Feedback outside of a formal evaluation 2.8 2.1 0.6** 0.30
Note: N = 331 to 333 teachers per outcome. a Means are regression-adjusted. * TAP-comparison difference is statistically significant at the 10% level. ** TAP-comparison difference is statistically significant at the 5% level. *** TAP-comparison difference is statistically significant at the 1% level.

51
Appendix A
Table A.5. Professional Development Received (Matched Comparison)
Outcome TAP
Meana Comparison
Meana Difference Standard
Error
Participated in Professional Development Activities that Addressed… (percentage)
Strategies for teaching literacy 100.0 100.0 -0.0 0.02 Strategies for teaching math 83.3 75.4 7.8 6.90 Strategies for teaching other subjects 63.2 55.6 7.6 7.70 Increasing content area knowledge 80.3 75.1 5.2 5.96 Selecting or adapting curriculum materials 70.4 67.7 2.7 6.21 Teaching or aligning curriculum to meet state or district standards
80.5 73.7 6.9* 3.58
Aligning local or teacher-developed curriculum assessment to state standards
70.1 56.2 14.0** 6.11
Setting instructional goals and determining ways to achieve them
82.2 75.5 6.7 5.22
Preparing students for standardized tests 66.8 66.8 0.1 4.77 Using assessments to inform teaching 91.8 85.5 6.3** 2.94 Preparing lesson plans or other instructional activities 79.3 66.4 12.9** 5.58 Providing differentiated instruction to meet student needs 91.3 88.1 3.2 3.35
Responded that Professional Development in 2007-2008… (percentage)
Was useful to their teaching 95.8 91.3 4.5 3.00 Was more satisfactory than in previous years 48.1 31.2 16.9** 6.82 Had been implemented into their teaching 93.9 90.2 3.7 2.99
Associated with Professional Development, Received… (percentage)
Scheduled non-teaching time in contract year 84.0 76.3 7.7** 3.70 Other release time from teaching 65.7 40.2 25.4*** 6.73 Stipend 71.8 64.6 7.2 7.14 Tuition reimbursement 5.5 4.2 1.4 2.35 Fee reimbursement 20.3 16.9 3.4 6.85 Travel or expense reimbursement 1.7 2.5 -0.8 0.97 Course credits toward certification 53.6 43.5 10.1 8.53 Pay increase 21.0 22.0 -1.0 5.41
Recognition or Higher Ratings on an Annual Teacher Evaluation
30.2 20.3 9.9 6.59
Note: N = 329 to 346 teachers per outcome. a Means are regression-adjusted. * TAP-comparison difference is statistically significant at the 10% level. ** TAP-comparison difference is statistically significant at the 5% level. *** TAP-comparison difference is statistically significant at the 1% level.
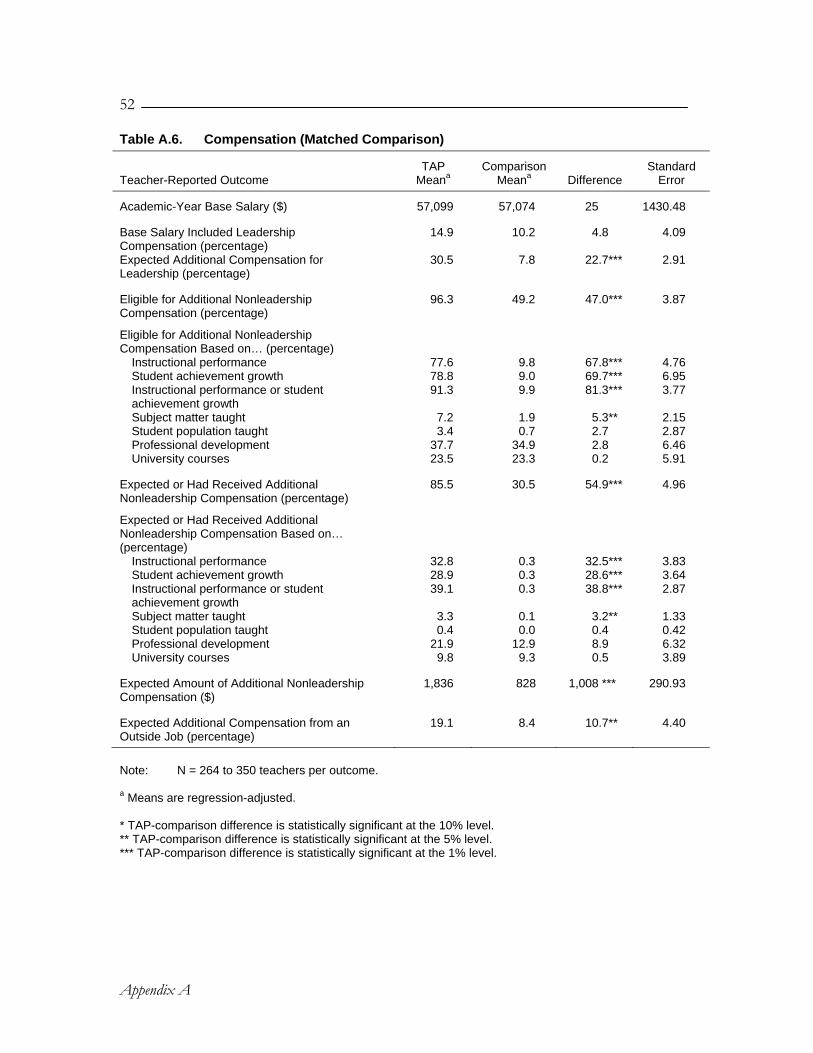
52
Appendix A
Table A.6. Compensation (Matched Comparison)
Teacher-Reported Outcome TAP
Meana Comparison
Meana Difference Standard
Error
Academic-Year Base Salary ($) 57,099 57,074 25 1430.48
Base Salary Included Leadership Compensation (percentage)
14.9 10.2 4.8 4.09
Expected Additional Compensation for Leadership (percentage)
30.5 7.8 22.7*** 2.91
Eligible for Additional Nonleadership Compensation (percentage)
96.3 49.2 47.0*** 3.87
Eligible for Additional Nonleadership Compensation Based on… (percentage)
Instructional performance 77.6 9.8 67.8*** 4.76 Student achievement growth 78.8 9.0 69.7*** 6.95 Instructional performance or student achievement growth
91.3 9.9 81.3*** 3.77
Subject matter taught 7.2 1.9 5.3** 2.15 Student population taught 3.4 0.7 2.7 2.87 Professional development 37.7 34.9 2.8 6.46 University courses 23.5 23.3 0.2 5.91
Expected or Had Received Additional Nonleadership Compensation (percentage)
85.5 30.5 54.9*** 4.96
Expected or Had Received Additional Nonleadership Compensation Based on… (percentage)
Instructional performance 32.8 0.3 32.5*** 3.83 Student achievement growth 28.9 0.3 28.6*** 3.64 Instructional performance or student achievement growth
39.1 0.3 38.8*** 2.87
Subject matter taught 3.3 0.1 3.2** 1.33 Student population taught 0.4 0.0 0.4 0.42 Professional development 21.9 12.9 8.9 6.32 University courses 9.8 9.3 0.5 3.89
Expected Amount of Additional Nonleadership Compensation ($)
1,836 828 1,008 *** 290.93
Expected Additional Compensation from an Outside Job (percentage)
19.1 8.4 10.7** 4.40
Note: N = 264 to 350 teachers per outcome. a Means are regression-adjusted. * TAP-comparison difference is statistically significant at the 10% level. ** TAP-comparison difference is statistically significant at the 5% level. *** TAP-comparison difference is statistically significant at the 1% level.
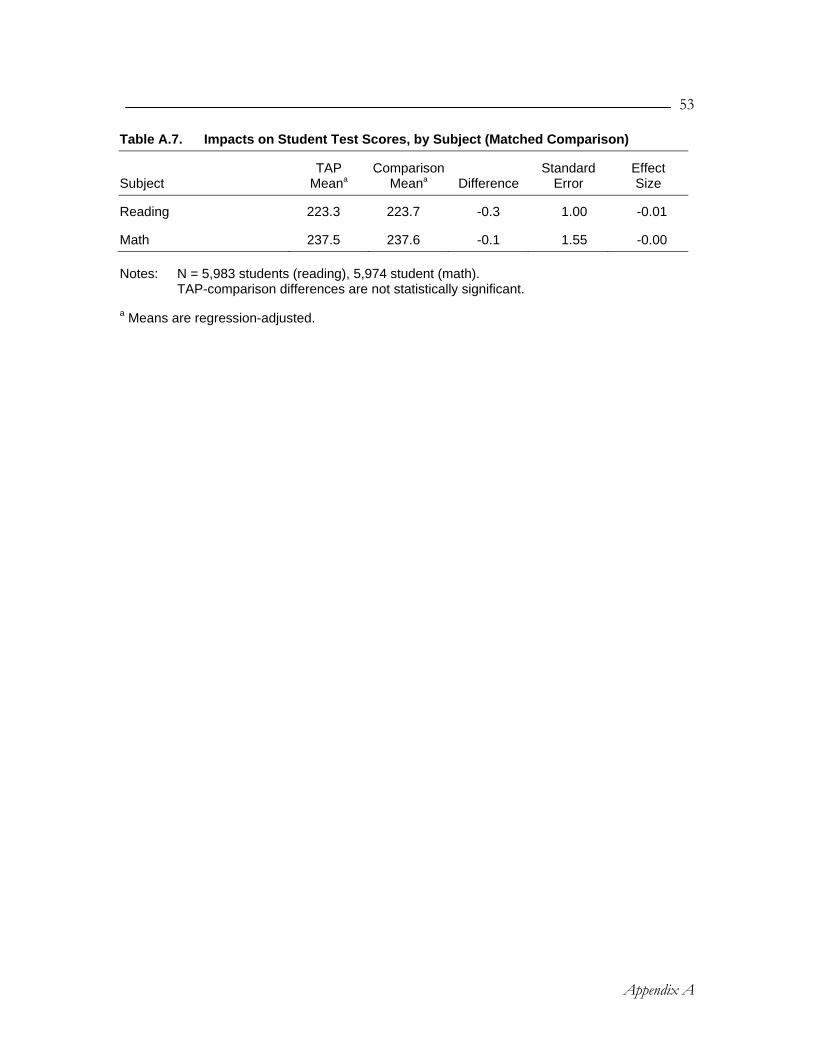
53
Appendix A
Table A.7. Impacts on Student Test Scores, by Subject (Matched Comparison)
Subject TAP
Meana Comparison
Meana Difference Standard
Error Effect Size
Reading 223.3 223.7 -0.3 1.00 -0.01
Math 237.5 237.6 -0.1 1.55 -0.00 Notes: N = 5,983 students (reading), 5,974 student (math). TAP-comparison differences are not statistically significant. a Means are regression-adjusted.
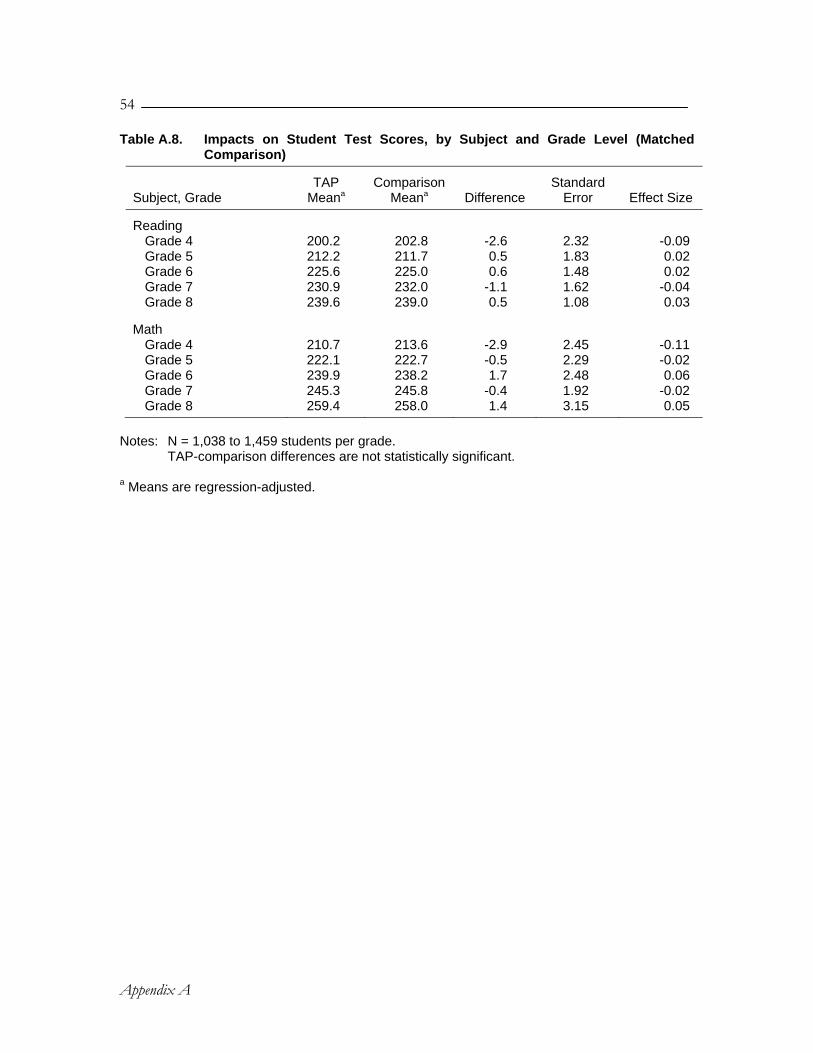
54
Appendix A
Table A.8. Impacts on Student Test Scores, by Subject and Grade Level (Matched Comparison)
Subject, Grade TAP
Meana Comparison
Meana Difference Standard
Error Effect Size
Reading Grade 4 200.2 202.8 -2.6 2.32 -0.09 Grade 5 212.2 211.7 0.5 1.83 0.02 Grade 6 225.6 225.0 0.6 1.48 0.02 Grade 7 230.9 232.0 -1.1 1.62 -0.04 Grade 8 239.6 239.0 0.5 1.08 0.03
Math Grade 4 210.7 213.6 -2.9 2.45 -0.11 Grade 5 222.1 222.7 -0.5 2.29 -0.02 Grade 6 239.9 238.2 1.7 2.48 0.06 Grade 7 245.3 245.8 -0.4 1.92 -0.02 Grade 8 259.4 258.0 1.4 3.15 0.05
Notes: N = 1,038 to 1,459 students per grade.
TAP-comparison differences are not statistically significant.
a Means are regression-adjusted.

55
Appendix A
Table A.9. Impacts on Student Reading Scores, Sensitivity Analysis (Matched Comparison)
Model Specification
TAP-Comparison Difference
Standard Error
Effect Size
Benchmark -0.3 1.00 -0.01
Benchmark, with No Weights -0.3 1.01 -0.01
Covariates
No pretest: grade 3-8 1.2 3.81 0.04 No pretest: grade 4-8 only 1.6 3.12 0.06 pretest only -1.1 0.94 -0.04 No covariates: grade 3-8 -3.4 3.87 -0.11 No covariates: grade 4-8 only -2.8 3.27 -0.10
Random Effects (RE) 0.0 1.07 0.00
RE with School Characteristics 0.3 1.09 0.01
Measurement Error Correction
Instrumental variables -0.6 0.91 -0.02 Gain model -0.8 0.96 -0.05 Errors-in-variables model, reliability = .9 -0.6 0.91 -0.04 Errors-in-variables model, reliability = .8 -0.9 1.03 -0.06
Notes: N = 5,973 to 8,249 students per specification. TAP-comparison differences are not statistically significant.

56
Appendix A
Table A.10. Impacts on Student Math Scores, Sensitivity Analysis (Matched Comparison)
Model Specification
TAP-Comparison Difference
Standard Error
Effect Size
Benchmark -0.1 1.55 -0.00
Benchmark, with No Weights -0.7 1.34 -0.02
Covariates
No pretest: grade 3-8 1.7 4.44 0.05 No pretest: grade 4-8 only 2.7 3.83 0.09 Pretest only -1.2 1.48 -0.04 No covariates: grade 3-8 -6.1 4.76 -0.18 No covariates: grade 4-8 only -5.0 4.27 -0.16
Random Effects (RE) -0.6 1.31 -0.02
RE with School Characteristics -0.2 1.34 -0.01
Measurement Error Correction
Instrumental variables -0.5 1.46 -0.01 Gain model -0.6 1.46 -0.04 Errors-in-variables model, reliability = .9 -0.5 1.46 -0.03 Errors-in-variables model, reliability = .8 -1.1 1.58 -0.06
Notes: N = 5,965 to 8,341 students per specification. TAP-comparison differences are not statistically significant.
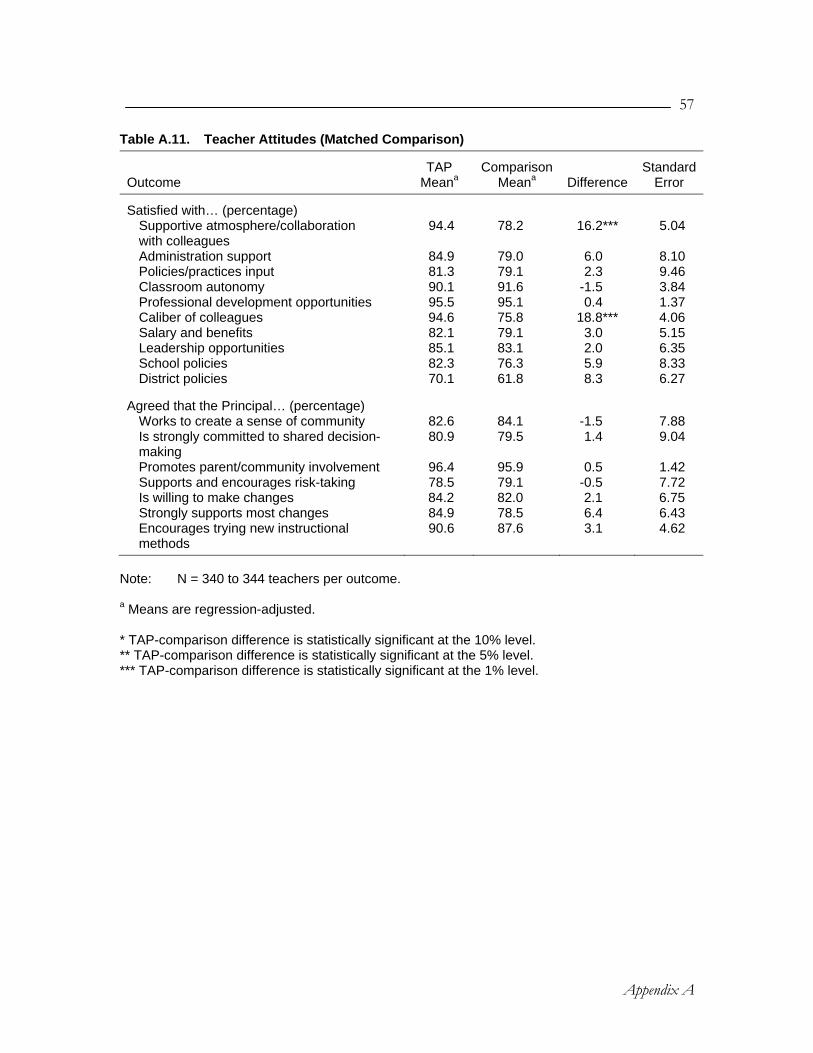
57
Appendix A
Table A.11. Teacher Attitudes (Matched Comparison)
Outcome TAP
Meana Comparison
Meana Difference Standard
Error
Satisfied with… (percentage)
Supportive atmosphere/collaboration with colleagues
94.4 78.2 16.2*** 5.04
Administration support 84.9 79.0 6.0 8.10 Policies/practices input 81.3 79.1 2.3 9.46 Classroom autonomy 90.1 91.6 -1.5 3.84 Professional development opportunities 95.5 95.1 0.4 1.37 Caliber of colleagues 94.6 75.8 18.8*** 4.06 Salary and benefits 82.1 79.1 3.0 5.15 Leadership opportunities 85.1 83.1 2.0 6.35 School policies 82.3 76.3 5.9 8.33 District policies 70.1 61.8 8.3 6.27
Agreed that the Principal… (percentage)
Works to create a sense of community 82.6 84.1 -1.5 7.88 Is strongly committed to shared decision-making
80.9 79.5 1.4 9.04
Promotes parent/community involvement 96.4 95.9 0.5 1.42 Supports and encourages risk-taking 78.5 79.1 -0.5 7.72 Is willing to make changes 84.2 82.0 2.1 6.75 Strongly supports most changes 84.9 78.5 6.4 6.43 Encourages trying new instructional methods
90.6 87.6 3.1 4.62
Note: N = 340 to 344 teachers per outcome. a Means are regression-adjusted. * TAP-comparison difference is statistically significant at the 10% level. ** TAP-comparison difference is statistically significant at the 5% level. *** TAP-comparison difference is statistically significant at the 1% level.

This page has been intentionally left blank for double-sided copying.

Improving public well-being by conducting high-quality, objective research and surveys
To Find Out More: Communication Services • Phone: (609) 799-3535 • Fax: (609) 799-0005
Princeton Office Washington Office Cambridge Office Ann Arbor Office Oakland Office P.O. Box 2393 600 Maryland Avenue, SW 955 Massachusetts Avenue 555 South Forest Avenue 505 14th Street Princeton, NJ 08453-2393 Suite 550 Suite 801 Suite 3 Suite 800 (609) 799-3535 Washington, DC 20024-2512 Cambridge, MA 02139 Ann Arbor, MI 48104-2583 Oakland, CA 94612-1475 Fax: (609) 799-0005 (202) 484-9220 (617) 491-7900 (734) 794-1120 (510) 830-3700 Fax: (202) 863-1763 Fax: (617) 491-8044 Fax: (734) 794-0241 Fax: (510) 830-3701
www.mathematica-mpr.com